
Abstract
In Bangladesh, there are roughly 31 marine passenger ships that are in operation. These ships might be a good location for solar photovoltaic (PV) plants since solar energy is the best renewable energy to replace the fossil fuel used in the ships. A “tower rounded flower-shaped solar PV” system of PV panel arrangement—just looks like a “sunflower,” is proposed in this research. To harness maximum power, solar towers are designed in such a way that they may be freely rotated on their vertical axes and that the tilt angles of their solar panels can be adjusted from 0° to 50° on their horizontal axes freely. The “tower rounded flower-shaped solar PV” architecture of the PV array atop a maritime vessel is presented in this research along with a unique method for calculating the PV system's anticipated energy production. Finally calculated the realistic CO2 emission reduction by using this approach for a sustainable future. Applying globalsolaratlas (for horizon and sun's path estimation); PVsyst 7.2, HOMER Pro, and NREL's PVWatt calculator (for solar radiation calculation); vesselfinder (for the number of vessels analysis); shiptraffic (for vessels path analysis), this research suggests that marine passenger vessels are one of the best places to construct a proposed “tower rounded flower-shaped solar PV” power plant. According to estimates, 17 passenger ships can produce roughly 1240 MW of electricity per year and may save approximately 325.56 tons of CO2 gas emissions annually to the environment per year as compared to using fossil fuel-based power plants to produce electricity.
Introduction
Growing maritime activity in port regions has had an adverse effect on the environment, air quality, and public health (Gössling et al., 2021; Morocco et al., 2019; Walker et al., 2019; Wang et al., 2019). Ocean-going ships are a substantial source of the emissions of several pollutants and greenhouse gases, including NOx, SO2, particulate matter (PM), and CO2, (Eyring et al., 2010) whose effects are felt on a worldwide scale. About 60,000 cardiac and lung cancer fatalities are attributed to shipping-related PM emissions each year, with the majority of these deaths taking place close to coasts in Europe, East Asia, and South Asia (Corbett et al., 2007; Tian et al., 2013).
At the same time, marine transportation services are expanding fast in various places. According to Figure 1, the total number of ships worldwide increased from 2605 in 1970 to 3704 in 1980; 4008 in 1990 to 5984 in 2000; and 8408 in 2010 to 11,071 in 2019 (Logistics, Division on Technology and United Nations Conference on Trade and Development, 2022). However, COVID-19 caused the amount to marginally decline in 2020. These trends pose a serious environmental problem regard to air pollution and greenhouse gas (GHG) releases (International Council on Clean Transportation (ICCT), 2007). In order to determine the sources of this pollution, researchers are now interested in tracking where these emissions take place across the whole fuel life cycle. Recent endeavors to use alternative fuels in maritime ships have also prompted concerns about the energy consumption and environmental implications of those fuels. Additionally, it has been determined that global fossil fuels are costly, in short supply, and rare (Shezan and Ping, 2017). Good news is that, by applying this research, towers rounded solar PV on marine vessels may have the potential to reduce the dependency on fossil fuels and can reduce GHG emissions into the atmosphere.
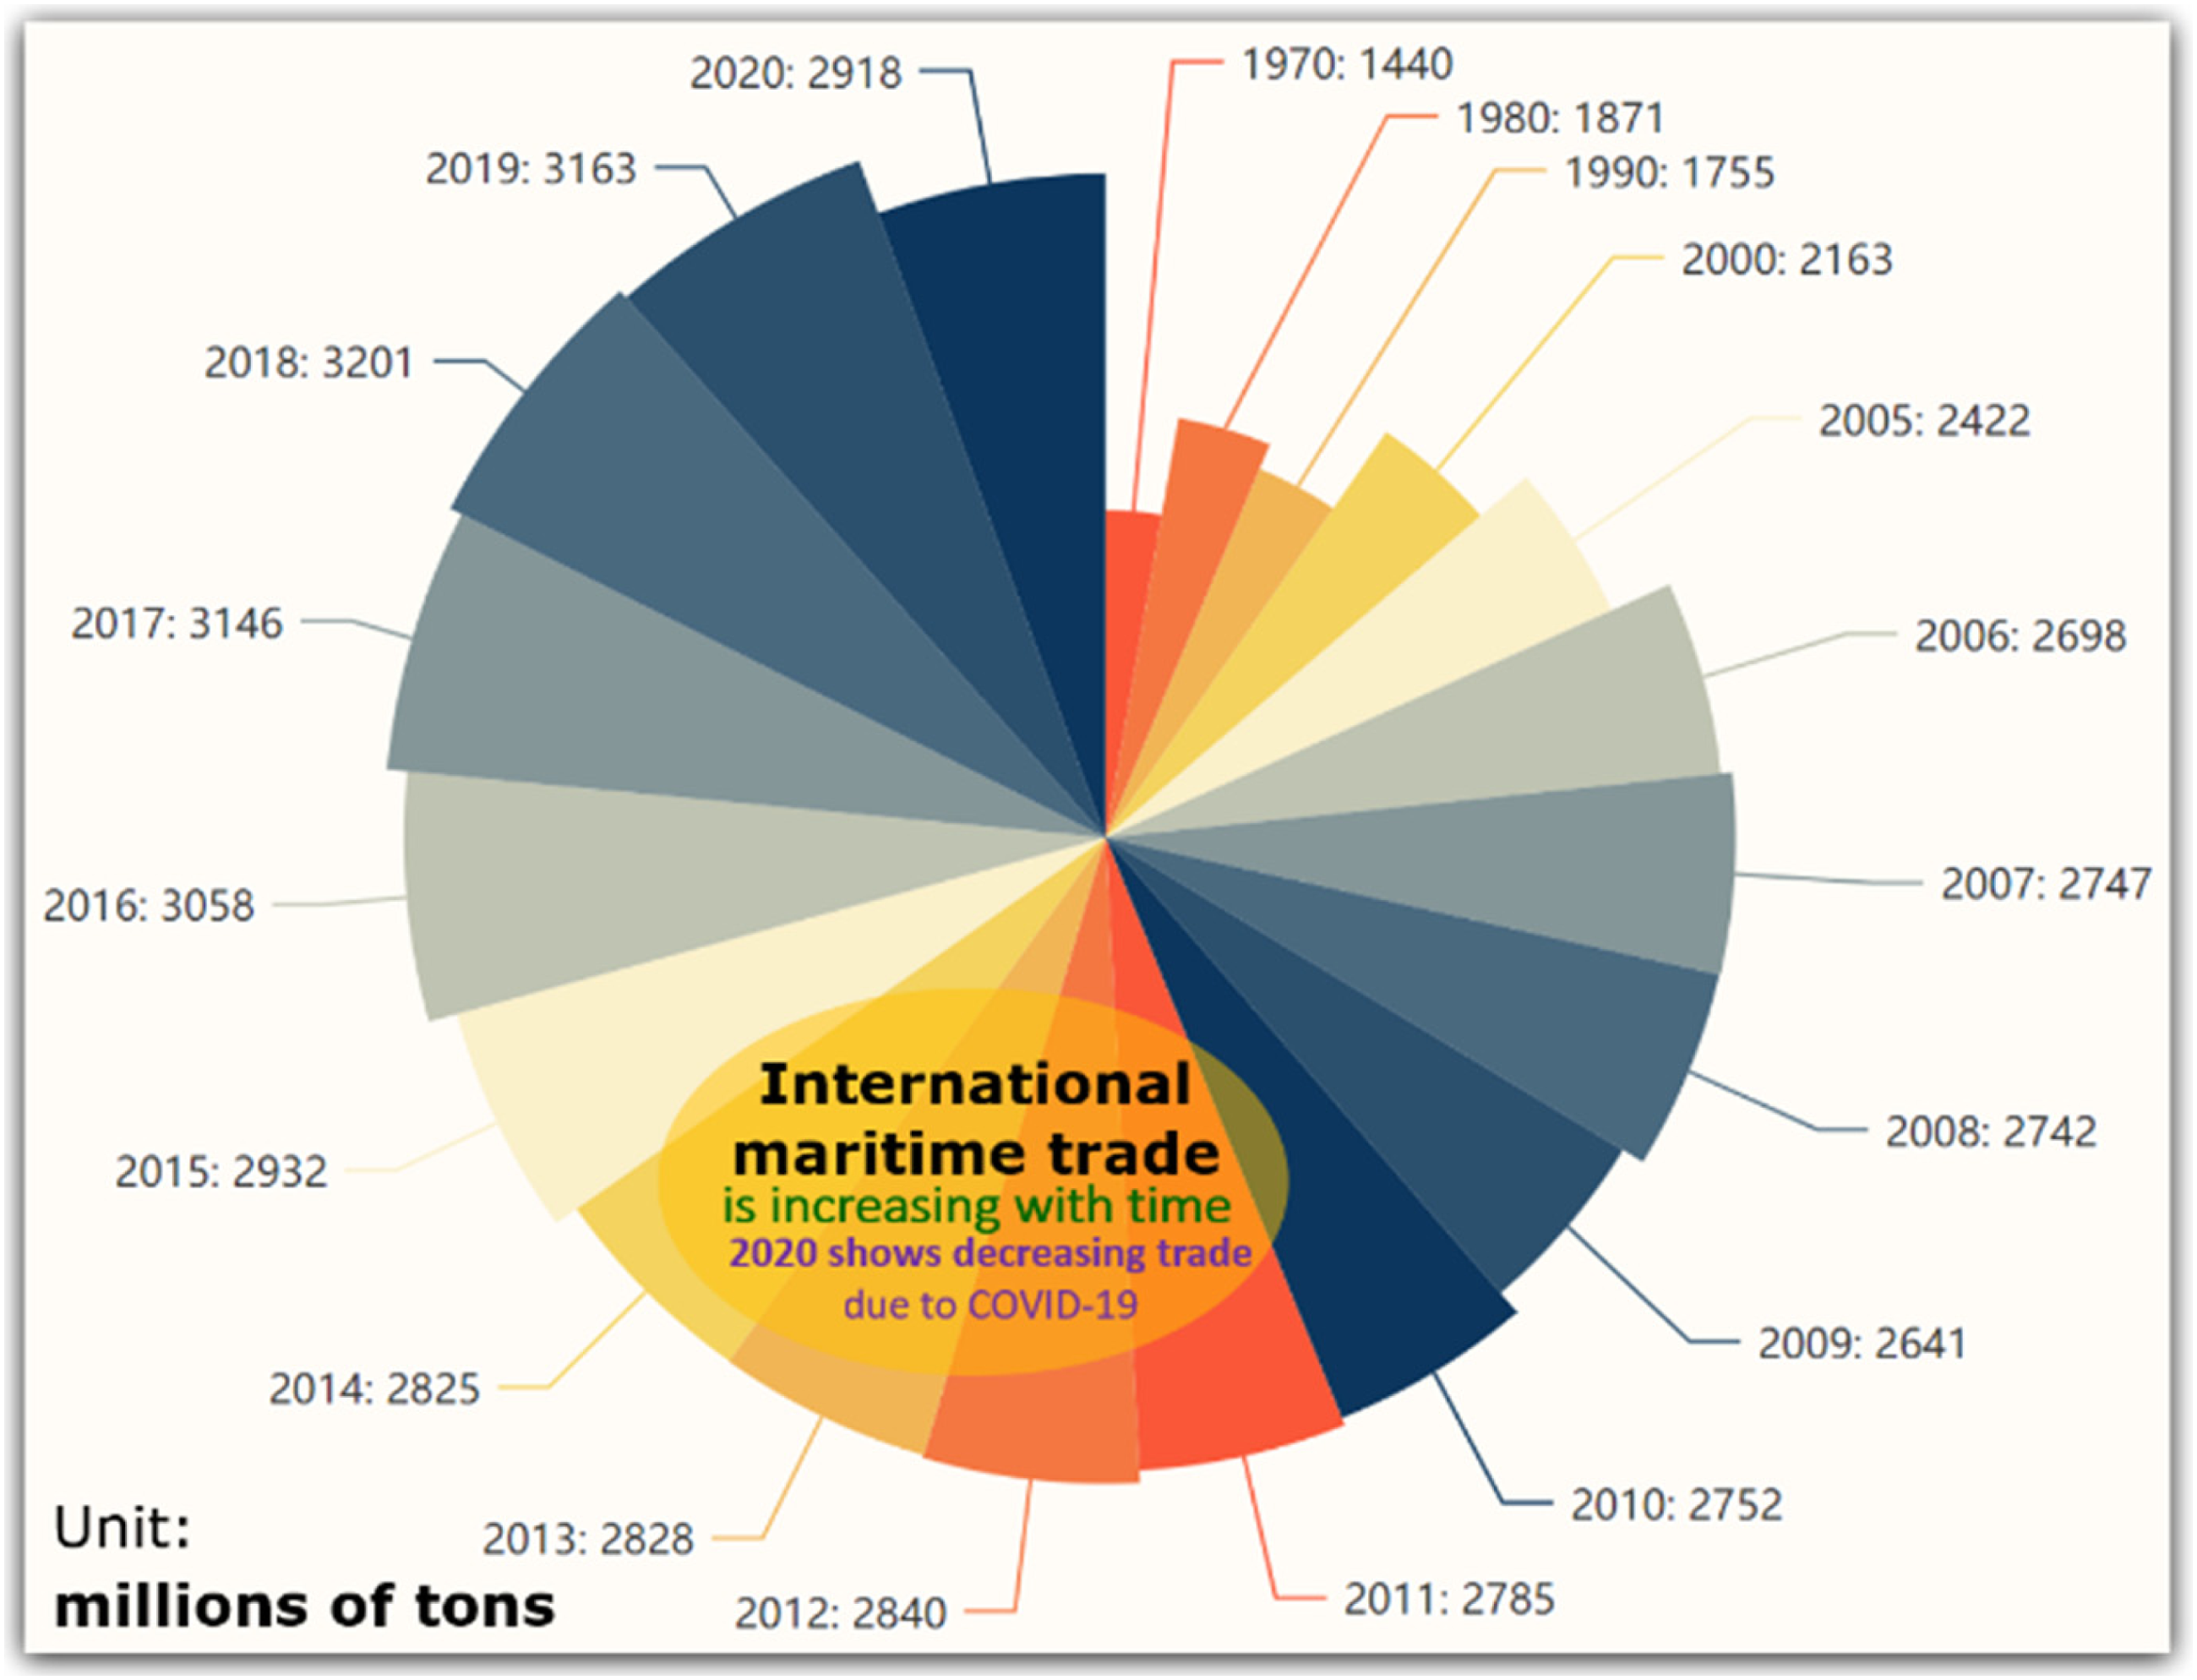
International maritime trade, 1970–2020 (millions of tons loaded). The marine trade is rising with time from 2605 million tons (mt) in 1970 to 11,071 mt in 2019 except 2020 (due to COVID-19).
In our era of advanced technology, energy is the foundation of everything and is necessary for everyone to be able to think. The rise in global population and financial development would result in a about 30% increase in energy consumption in order to achieve the Sustainable Development Goals by 2030 (Abdullah-Al-Mahbub et al., 2022).
The pattern of energy demand changes over time, with a progressive decline in the use of fossil fuels and a gradual increase in the use of renewable energy. Since the Paris COP in 2015, CO2 emissions have risen every year with the exception of 2020 because of COVID-19 (Bp Energy Outlook 2022, 2022). The transition to a low-carbon renewable energy system is transforming the global energy markets as well, leading to a higher level of diversity in the energy mix.
Renewable energy sources are those that are genuinely infinite, that is, never run out and that can be generated from natural sources like solar, wind, flowing water, ocean tides, ocean waves, earth's internal heat, biomass, and biofuels. As a result, several countries are utilizing renewable energy sources to some extent to satisfy their energy needs (Zafar et al., 2018).
In general, heavy fuel oil (HFO), diesel oil, and low sulfur fuel oil (LSFO) are the three fuel kinds that marine vessels utilize to operate (Fritt-Rasmussen et al., 2018; Sørheim et al., 2020). Today, heavy fuel oil is the most widely utilized fuel type. It is a cheap, very viscous liquid with compounds that may be carcinogenic and a high sulfur concentration. Air pollutants, including as sulfur oxides (SOX), nitrogen oxides (NOx), and particulate matter (PM), as well as greenhouse gases, notably carbon dioxide (CO2), are emitted when these fuels are used in large marine diesel engines.
These emissions have an adverse effect on the environment through eutrophication, which results from nutrient enrichment that promotes algal growth and may cause oxygen depletion, and acidification, which results from the deposition of acidic substances and harms marine ecosystems. As well as having an impact on climate change, they also affect the health concerns posed by marine aquatic creatures.
Solar energy is an endless supply of pure, environmentally friendly energy that does not affect either plants or animals (Jakhongir Turakul Ugli, 2019). The sun provides earth's energy of about 99.99% (89 PW), while the earth produces only 0.1% for own (Abas et al., 2015; Khan et al., 2017). The sun emits around 3.8 × 10²³ kW of energy per second. Only around 60% (1.081014 kW) of this volume interacts with the earth's surface; the other 40% is reflected back into space. Four times as much energy as the world presently consumes could be produced if just 0.1% of this energy could be turned with a 10% efficiency (World Energy Council 2013, 2013). Estimates suggest that the sun may release 450 EJ of energy, which is equivalent to 7500 times more energy than is currently needed on the planet (Dinçer, 2011).
Solar PV kept up its record-breaking run in 2021 by installing 175 GW of new capacity, increasing its total installed capacity to about 942 GW. By the end of 2021, 3146 GW of renewable alternative energy was generated globally, according to REN21 (2022). Without hydropower, the overall global renewable energy capacity in 2021 was 1945 GW, a 273 GW increase over the 1672 GW generation capacity in 2020. The largest share of the global total, or around 48.28%, was made up of solar power, which had a capacity of 942 GW. With an installed capacity of 845 GW, wind contributed 43.31%. 143 GW of biopower, 14.5 GW of geothermal, 6 GW of CSP, and 0.5 GW of ocean electricity were accounted for by other renewable sources (REN21, 2022) as shown in Figure 2.
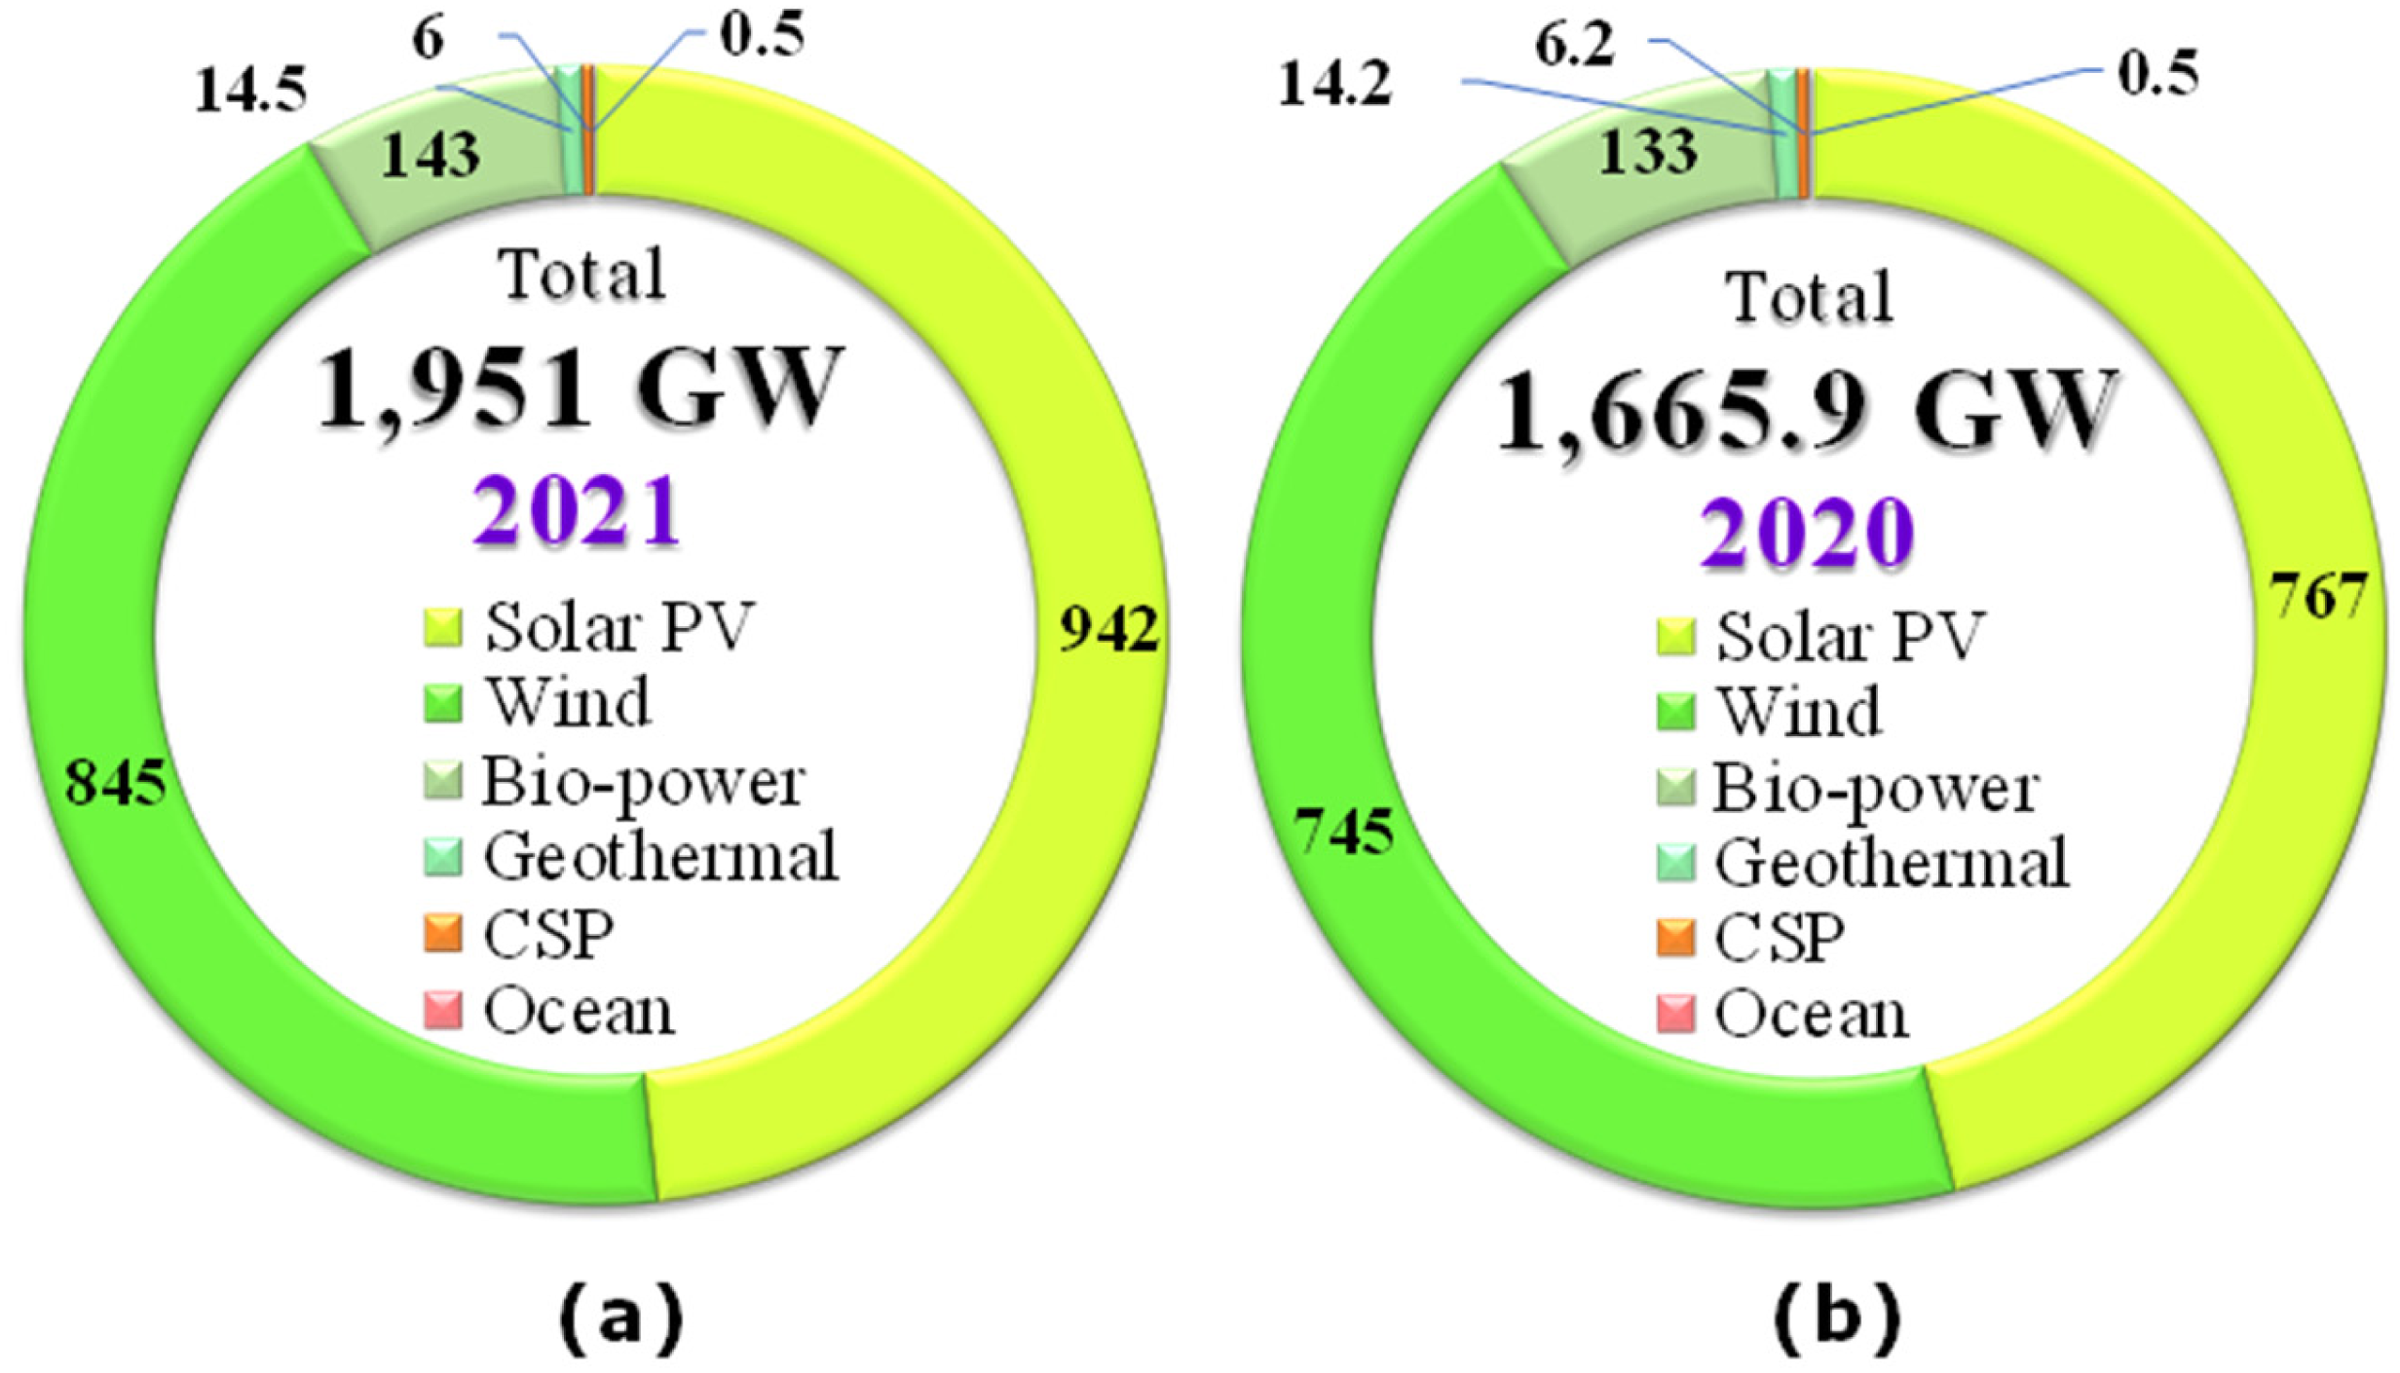
Global RE generation capacity in 2020–2021. The doughnut (a) displays the capacity for renewable energy in 2021, when 1951 GW of electricity were generated and the doughnut (b) displays the capacity for renewable energy in 2020, when 1666 GW of power were produced.
Solar electricity is one of the alternative energy sources that is becoming more and more popular. Due to the fact that it is natural and renewable, it causes significantly less pollution than other nonrenewable resources. It will change the marine industry and may create a more efficient and sustainable system for marine vessels. Solar panel systems use a collection of solar cells that when combine and install on marine vessels, may produce enough electricity to run vessel's electrical appliances.
PV systems are regarded as nonlinear systems because of the fluctuating weather and unexpected shade. Despite the widespread usage of solar PV systems, their performance is dependent on the weather, irradiance, temperature, the impact of shadows, and the time of day since solar irradiation changes throughout the day. Techniques called maximum power point tracking (MPPT) have been invented to tackle this problem. The MPPT system can be used to ensure that the PV array always works to deliver the highest amount of electricity production (Coelho et al., 2009; Compensation in PV Array Under Partially Shaded Conditions).
There are several MPPT methods described in the literature (Kayisli, 2023; Mohammed et al., 2022; Salam et al., 2013) that can be divided into two groups, that is, traditional MPPT procedures and advanced techniques. Incremental resistance (INR) (Mei et al., 2011), perturb and observe (P&O) (Neves et al., 2009; Salam et al., 2013; Tajuddin et al., 2015), and INC are examples of traditional MPPT approaches. These are also the most often used algorithms due to their simple design and accessible implementation. Yet, at the steady state, their duty cycle oscillates, which leads to power losses. Fuzzy logic (Elkhateb et al., 2014), neural networks (Liu et al., 2013), and evolutionary computation (Seyedmahmoudian et al., 2018) are examples of advanced techniques that can produce superior results in settings of uniform sun irradiation and partial shading.
A variety of applied MPPT control approaches are currently available (Rajesh and Carolin, 2015) These controllers are used mostly to track a certain MPP under uniform irradiation or a PV with multiple maximum power points (MMPP). Bio-inspired (BI), artificial intelligence (AI), and soft computing methods (Salam et al., 2013) are more sophisticated than traditional ones and provide better tracking results. Advanced MPPT grey wolf optimization (GWO; Aguila-Leon et al., 2023; a special type of bio-inspired methods) methods have recently drawn considerable attention due to its capacity to identify nearly optimal solutions to challenging optimization problems like multimodal objective functions. These algorithms often have an easy search strategy and great optimization effectiveness. That is why this study has suggested GWO-type MPPT approaches.
Aguila-Leon et al. (2023) propose a grey wolf optimization-based optimized MPPT as a substitute for the conventional methods where grey wolf optimizer, wolf optimizer, simulated annealing, and particle swarm optimization algorithms have been used to examine the reaction time. The incremental conductance (IC) and perturb and observe (P&O) metaheuristic algorithms are contrasted with these four metaheuristic algorithms. The comparison results demonstrate that the MPPT controller, which was enhanced by the grey wolf optimizer algorithm, performs superior to the other controllers, providing an output power that is on average 6% greater. This grey wolf optimization-based optimized MPPT is recommended in this study to use to improve PV panel efficiency.
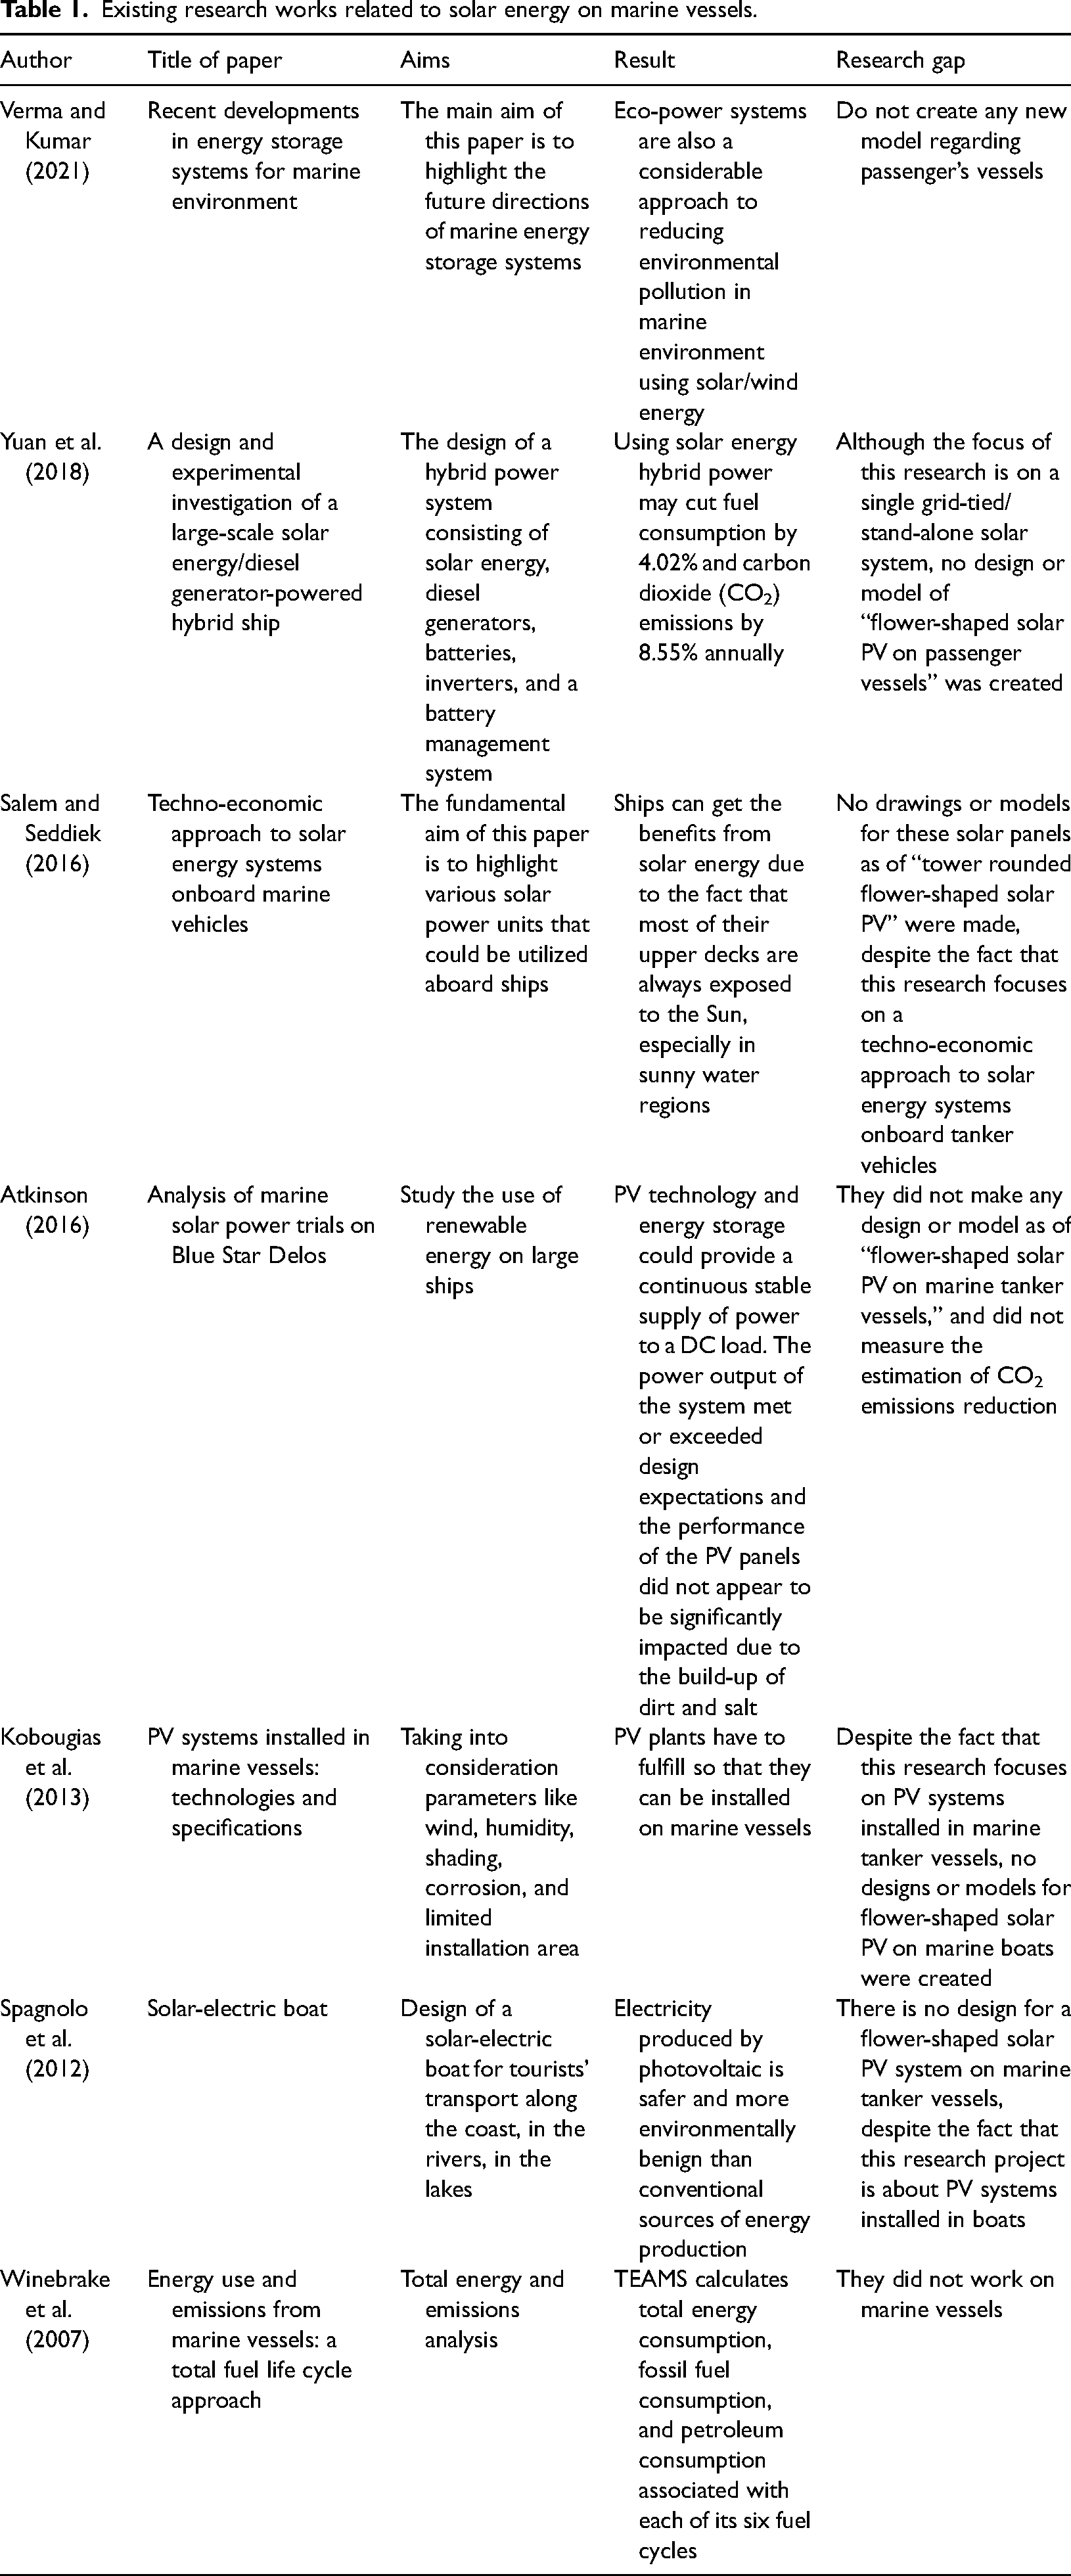
Several works have been done regarding conventional solar energy in Bangladesh, a few of them are solar home system, solar pump/irrigation systems, and solar parks (Amin et al., 2014; Chowdhury et al., 2011; Hossain et al., 2015; Islam et al., 2017; Liza and Islam, 2020; Najmul Hoque and Das, 2013; Rahman et al., 2020). However, there have been a few studies on marine vessels (Atkinson, 2016; Kapuścik et al., 2019; Kobougias et al., 2013; Nasirudin et al., 2017; Spagnolo et al., 2012; Verma and Kumar, 2021; Winebrake et al., 2007) that all looked at traditional stand-alone solar PV worldwide, but anyone does not work on design regarding “flower-shaped solar PV tower,” shown in Table 1.
Existing research works related to solar energy on marine vessels.
The components of a PV system, often known as a PV system, include a PV panel, mounting frame, solar inverter, energy storage device, and various accessories including cables and connections, distribution boards, AC disconnect switches, etc. A proposed “tower rounded flower-shaped solar PV” is a system of PV panel arrangement explained in the “Result” section. The solar tower is constructed in such a way that it may freely roll on its vertical axis. To maximize power output, solar modules are placed such that their tilt angle, or inclination angle, may be flexibly adjusted from 0° to 50° on their horizontal axis. The use of PV panels in a range of current applications has been made feasible by several technical developments in the areas of power electronics, PV panels, and microgrids.
Bay of Bengal is blessed with an enormous amount of solar radiation for its geographical position. Marine vessel's roof has limited space for rooftop solar PV installation due to space limitation and shed problems of the roof due to open air swimming pool, chimney, funnel, etc. Alternatively, “tower rounded flower-shaped solar PV” on the roof of marine vessels/ships can be an alternative place/option for building solar PV that produces a significant amount of electricity for powering the vessel's electrical equipment.
However, a different geometry (i.e. a compact design without gaps between solar modules) could be applied to utilize more area that can be used to capture more solar radiation. In reality, a lot of wind blows over the sea that, if there are no gaps between the solar modules, can shatter and blow the solar panel. For this reason, flower-shaped solar tower geometry with open spaces/gap among solar modules has chosen in the study.
This research presents a unique method for designing a “tower rounded flower-shaped solar PV” arrangement for a marine vessel's PV array and performs a realistic energy output estimate for the proposed PV system. Finally, the realistic CO2 emission reduction was computed for a sustainable future.
The novelty of the research is to (a) design and modeling of “tower rounded flower-shaped solar PV” layout of the PV array on marine vessel, (b) calculate the energy output of the planned PV system, and (c) calculate how much tons of CO2 gas emissions reduction annually to the environment when fossil fuel-based power plant for electricity is used.
Seven sections make up the remaining parts of the article. The materials and methods are described in Section 2. The results and discussion are explained in Section 3, which is further divided into the design and modeling of the solar tower on passenger ships, the design and modeling of the PV system's components and typical solar PV configuration, the design and modeling of the PV panel's direction and tilt angle, data analysis, and energy output calculation. By calculating the CO2 emission decrease, Section 4 illustrates the significance of “tower rounded flower-shaped solar PV” on maritime vessels (a sustainable energy source). Finally, the conclusion brings the essay to a close.
Materials and methods
To assess the amount of solar energy coverage in certain maritime vessels, the study used a variety of techniques and methods. The overall methodology of the research can be divided into four stages. The first stage involves the selection of study area and passenger vessels, the second stage encompasses data analysis, the third stage involves designing the PV panel orientation, and the fourth stage estimates the expected energy output with CO2 emission reduction, shown in Figure 3.
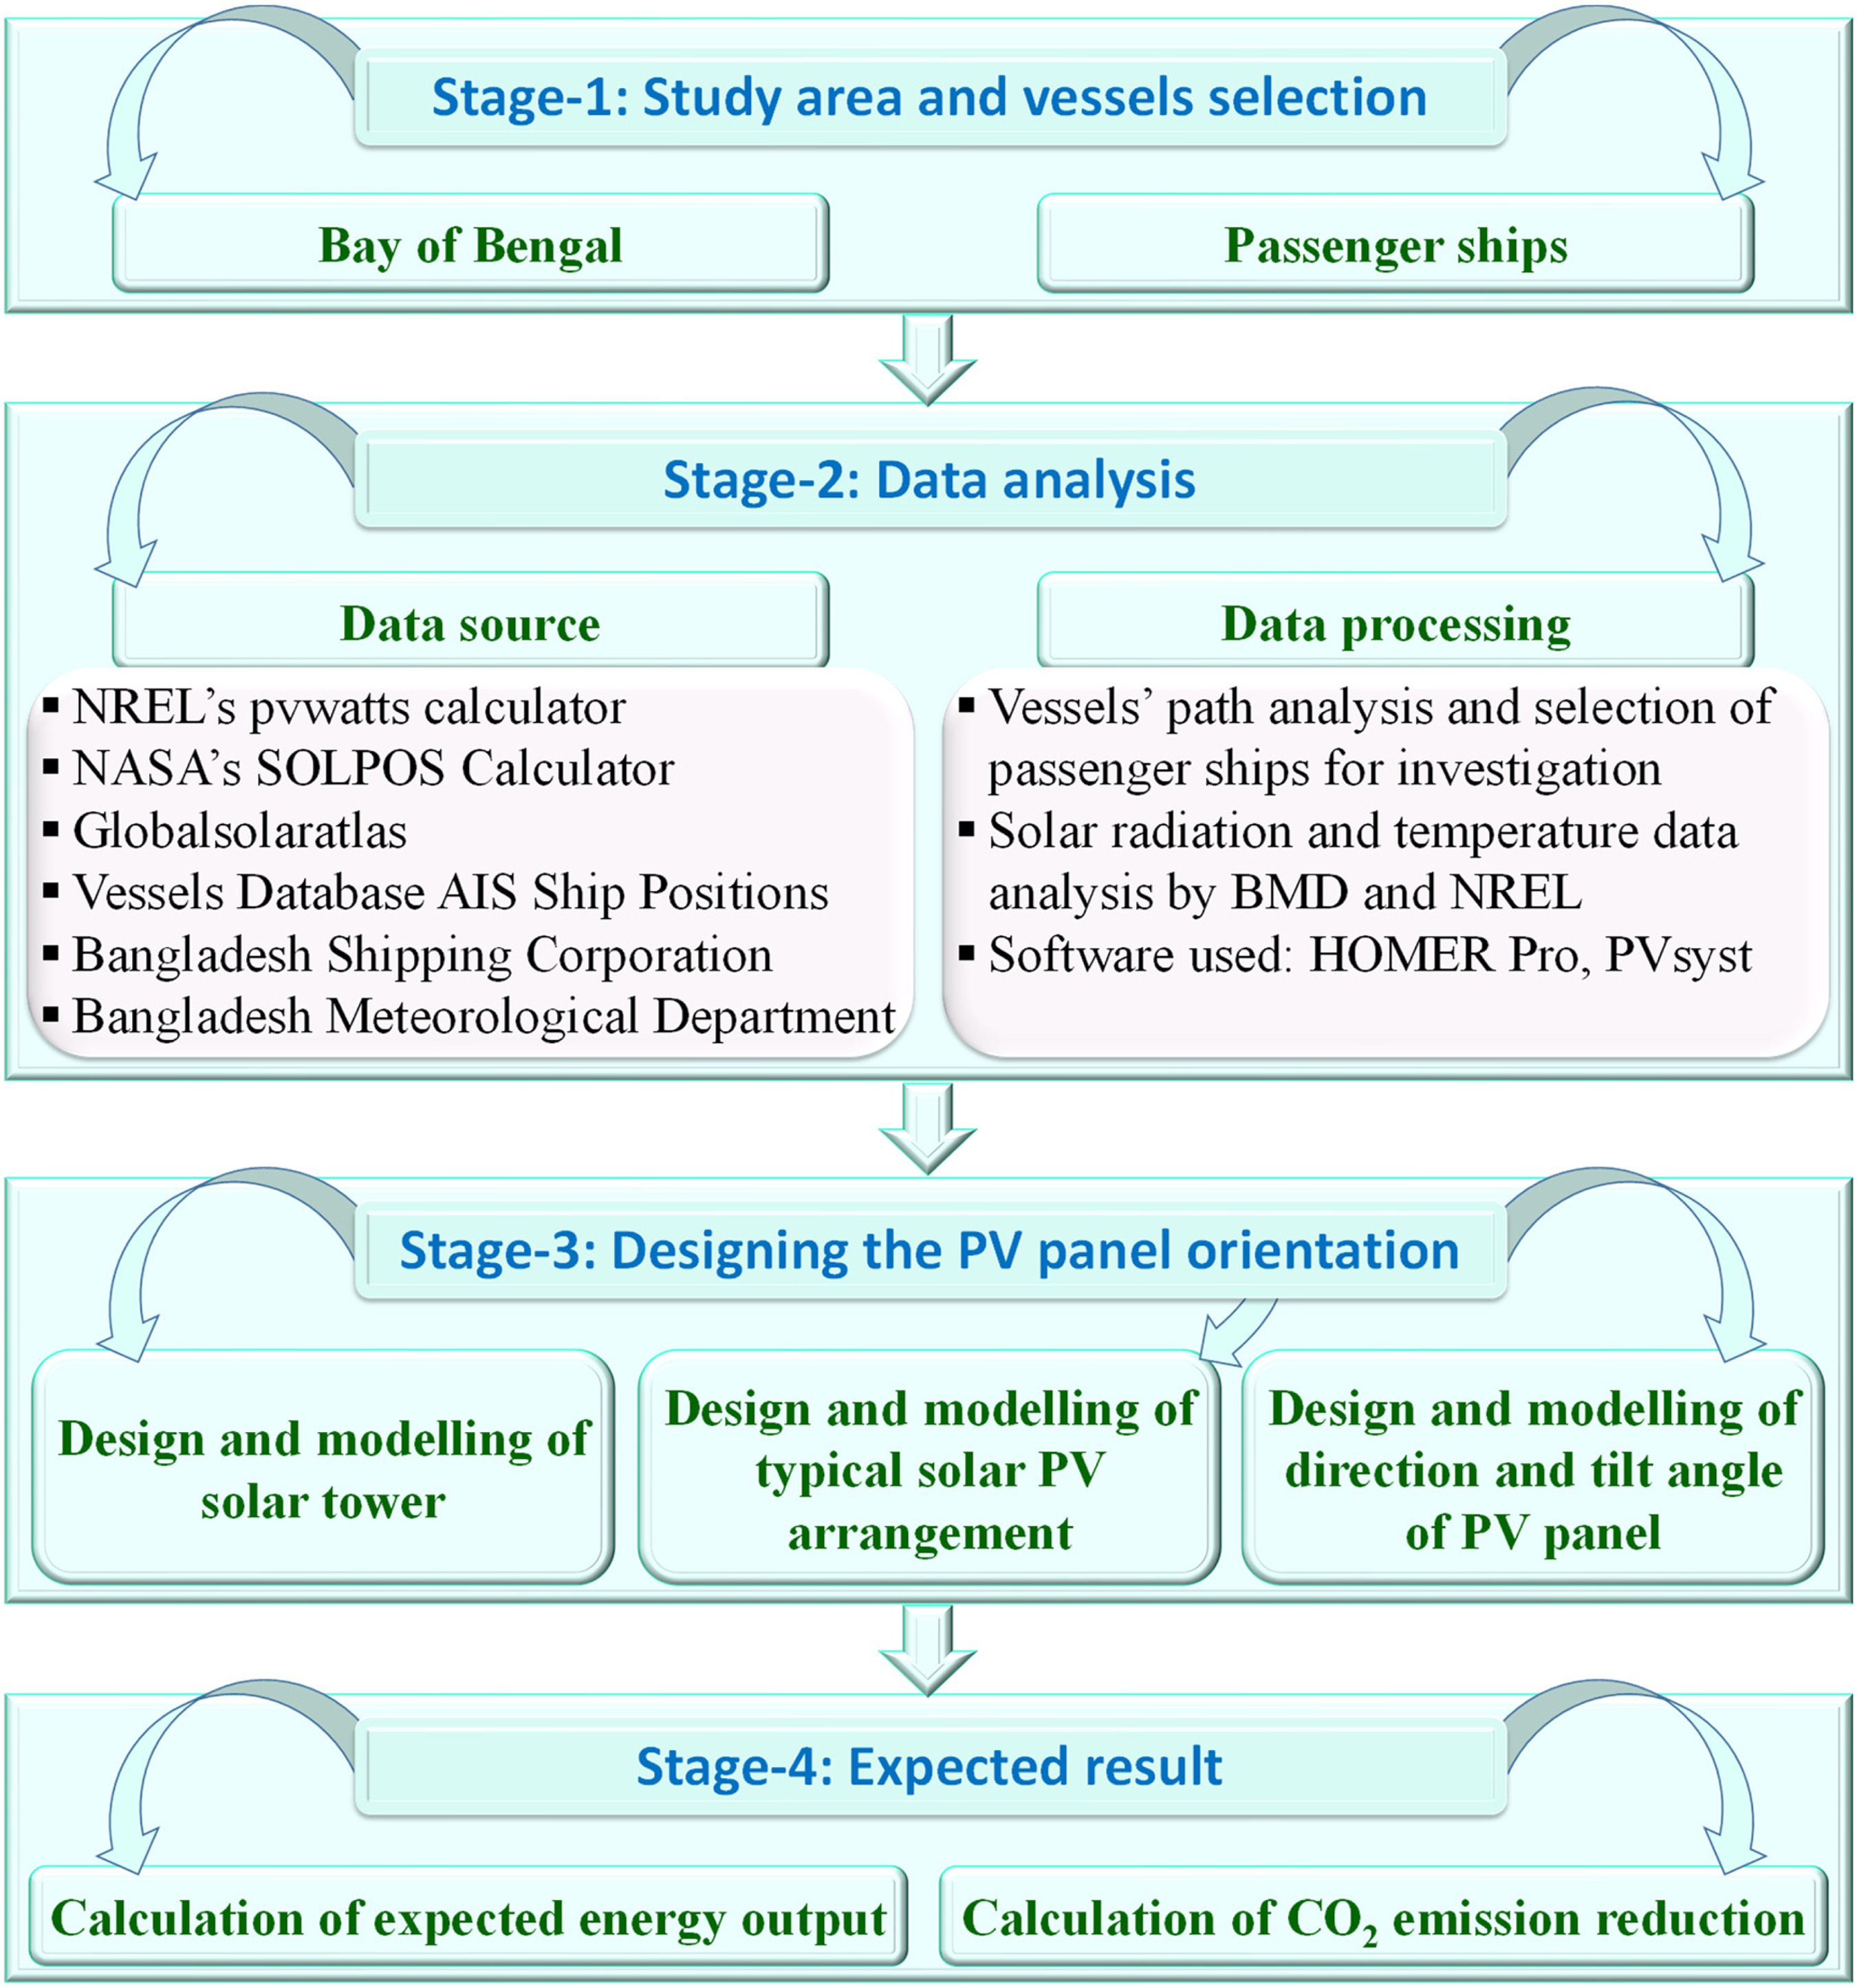
Methodology of the research.
Study area
The marine vessels or ships of Bangladesh travel over the seas, bays, and oceans, despite the lack of a designated research area. Due to the fact that all ships are owned by Bangladeshis, they mostly sail in the Bay of Bengal. That is why, the study area is selected as Bay of Bengal and a portion of Indian ocean where the marine vessels of Bangladesh sail on the sea.
The Bay of Bengal is in the northeastern region of the Indian Ocean, bounded by India to the west and northwest, Bangladesh to the north, Myanmar, and the Andaman and Nicobar Islands of India to the east. Geographically the area is located between latitudes 5°N and 22°N and longitudes 80°E and 100°E (Bay of Bengal), shown in Figure 4. There are several countries in South and Southeast Asia that depend on the Bay of Bengal. There are around 1008 Bangladeshi ships that are active in the Bay. Although other foreign ships do sail in these waters, they are not included in this research. In this research, only passenger ships are counted for analysis.
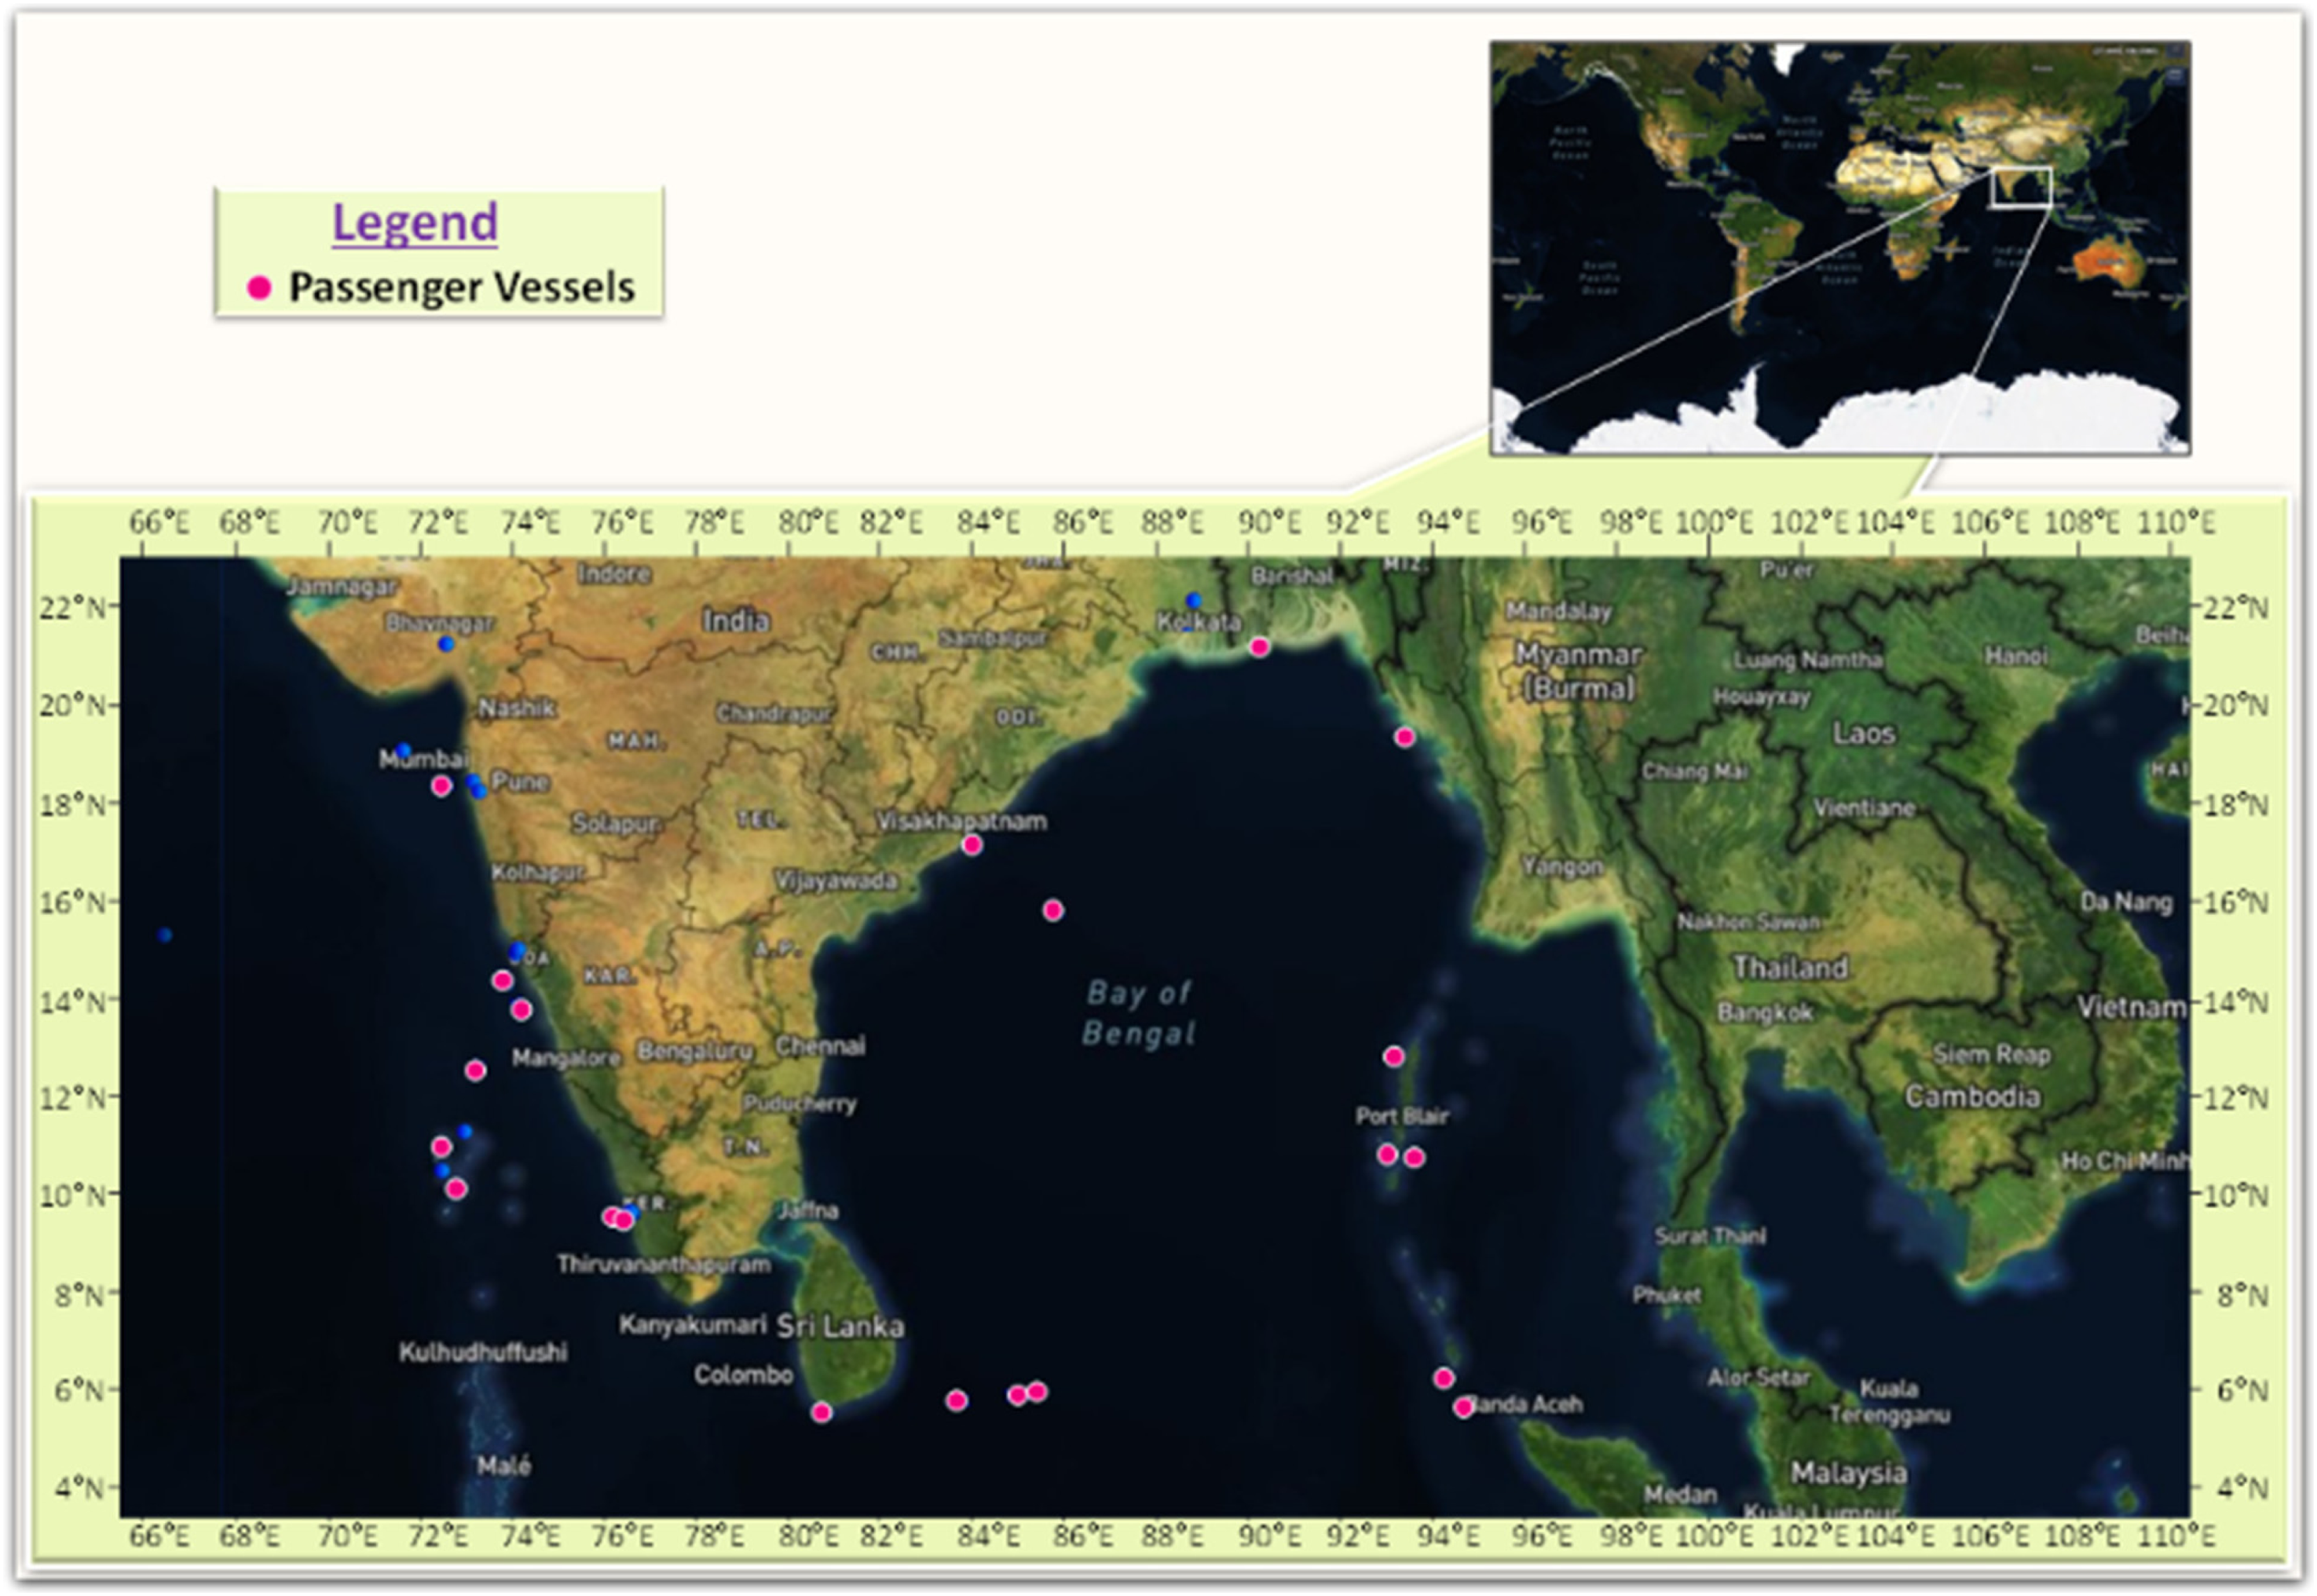
Location of the study area. The pink dot presents the passenger vessels.
Data source
While the study area is vast, and not more specific; therefore, a number of global international databases are used for data sources. Globally, there are several databases available that can be used in this research such as the NREL's pvwatts calculator (Pvwatts, 2022), NASA's SOLPOS Calculator (Midcdmz, 2022), globalsolaratlas (Globalsolaratlas, 2022), Vessels Database AIS Ship Positions (vesselfinder, 2022), Bangladesh Shipping Corporation (BSC; Bangladesh Shippinc Corporation, 2022), and the database of the Bangladesh Meteorological Department (BMD purchased data; Bangladesh Meteorological Department, 2021) which provide historical data of several years of from any quadrant of the globe defined by geographical location or longitude and latitude. Solar radiation and temperature data were gathered from the National Renewable Energy Laboratory (NREL; Pvwatts, 2022) and the BMD (Bangladesh Meteorological Department, 2021). The entire number of marine vessels are obtained from Bangladesh Shipping Corporation (BSC) (Bangladesh Shipping Corporation, 2022) in order to determine the solar number of solar module count and calculate the energy output.
Data processing
The collected solar radiation and temperature data was cross-checked by BMD and NREL using HOMER Pro and PVsyst software. First, we have collected the total number of marine vessels and divided them into three groups: tanker ships, passenger/cruise ships, and cargo ships. In this study, only passenger ships were selected for investigation.
Expected result
In this research, a very simple formula is used to calculate the energy output. This calculation might seem like a strange calculation but it is accurate because of the way the manufacturer tests the wattage (under standard test condition, STC).
Calculation of expected energy output
The predicted energy output can be calculated using any of these two formulas, which both give the same outcomes.
Formula 1:
Energy Output per module (
Energy Output per (21-moduled) PV tower (
or
Formula 2:
Energy Output per (21-moduled) PV tower:
Area of PV module (
Area of (21-moduled single) PV tower,
Solar Cell Efficiency (
Energy Output per (21-moduled) PV tower (
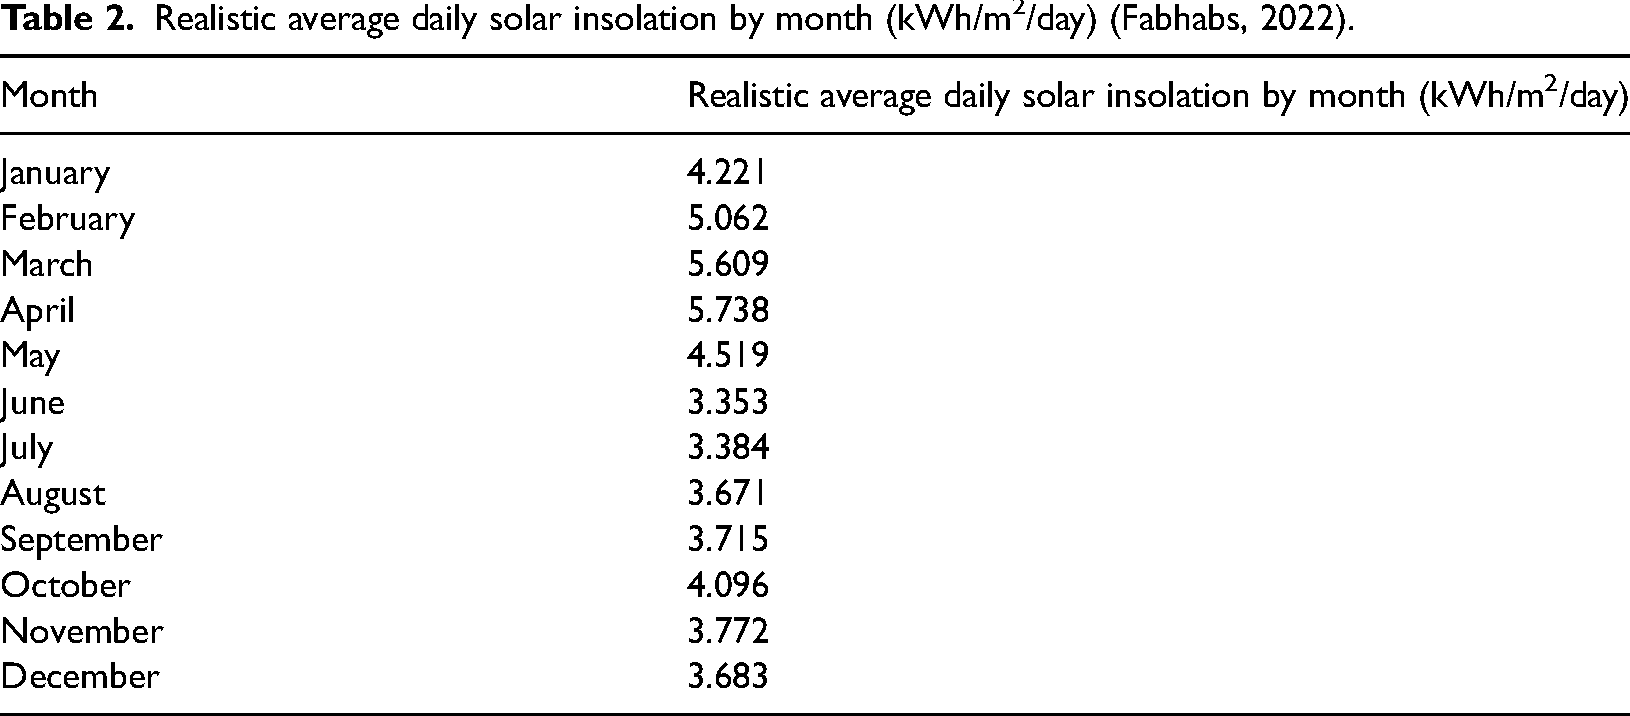
Realistic average daily solar insolation by month (kWh/m2/day) (Fabhabs, 2022).
Calculation of CO2 emission reduction

where E365 is the annual CO2 emission;
Result and discussion
Design and modeling of solar tower on passenger vessels
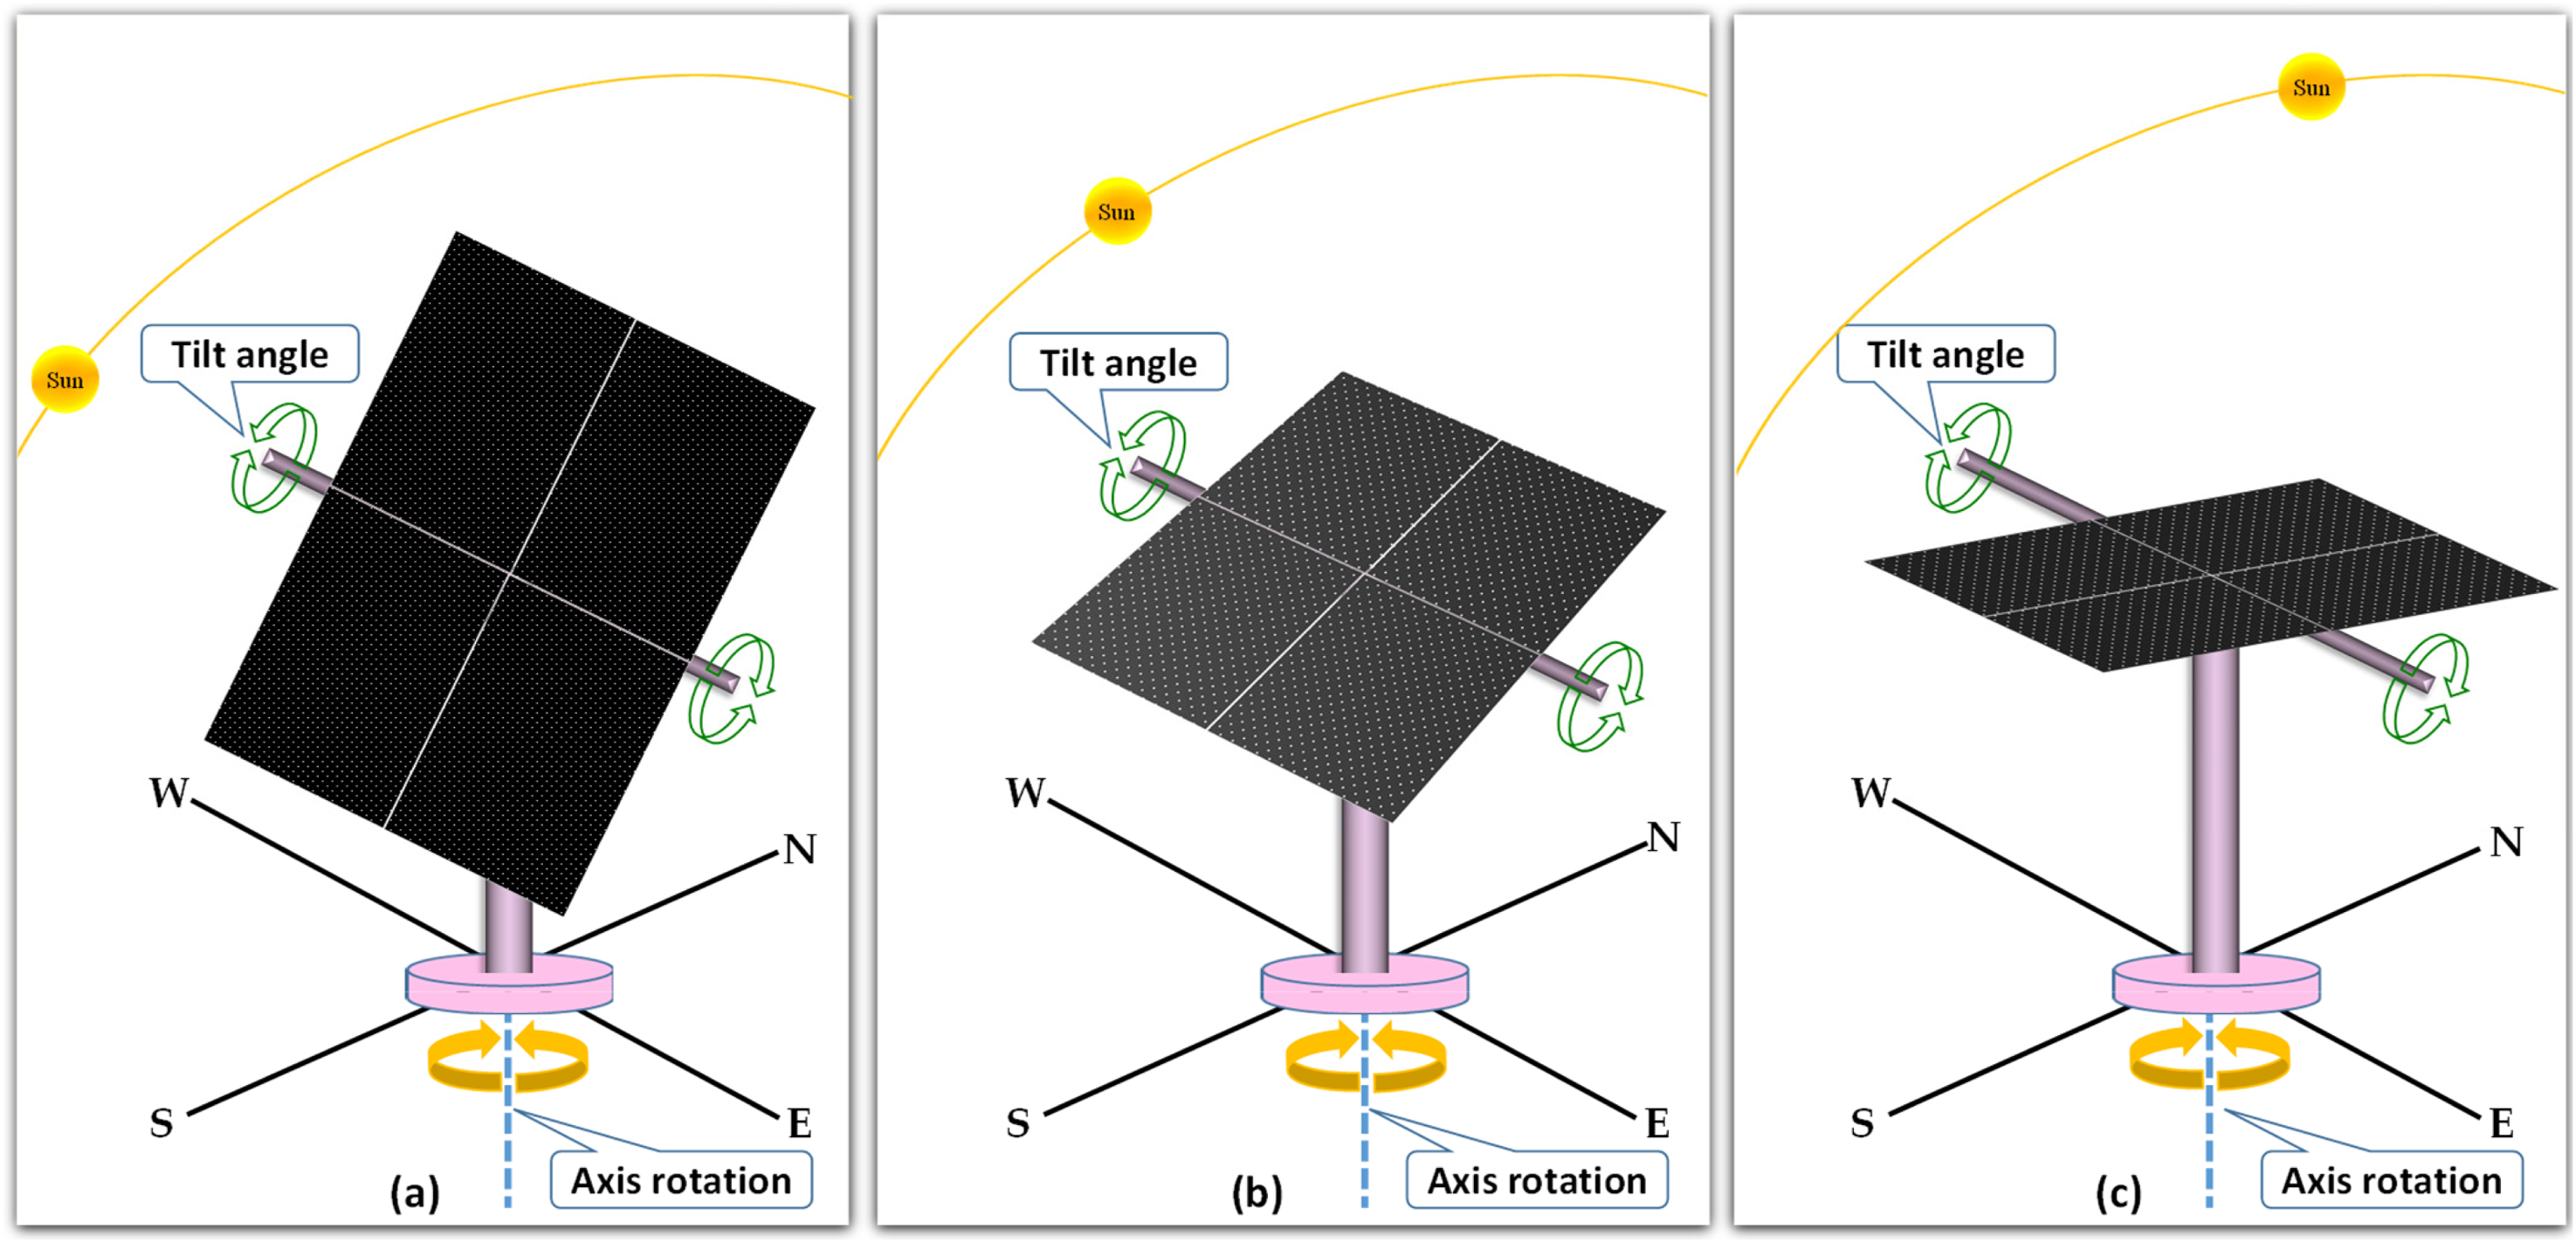
A novel creative approach “tower rounded flower-shaped solar PV” architecture is innovated to the installation of solar panels on the passenger ship. For this, a robust framework is intended to accomplish on the vessel's top floor, as depicted in Figure 5 and animation 1. The solar tower is constructed in such a way that it may freely rotate around its axis. For maximum power output, solar modules are positioned in a manner that their tilt or inclination angle can be flexibly adjusted from 0° to 360° on their horizontal axis, details are discussed in “Design and Modeling of Direction and tilt angle of PV panel” section.
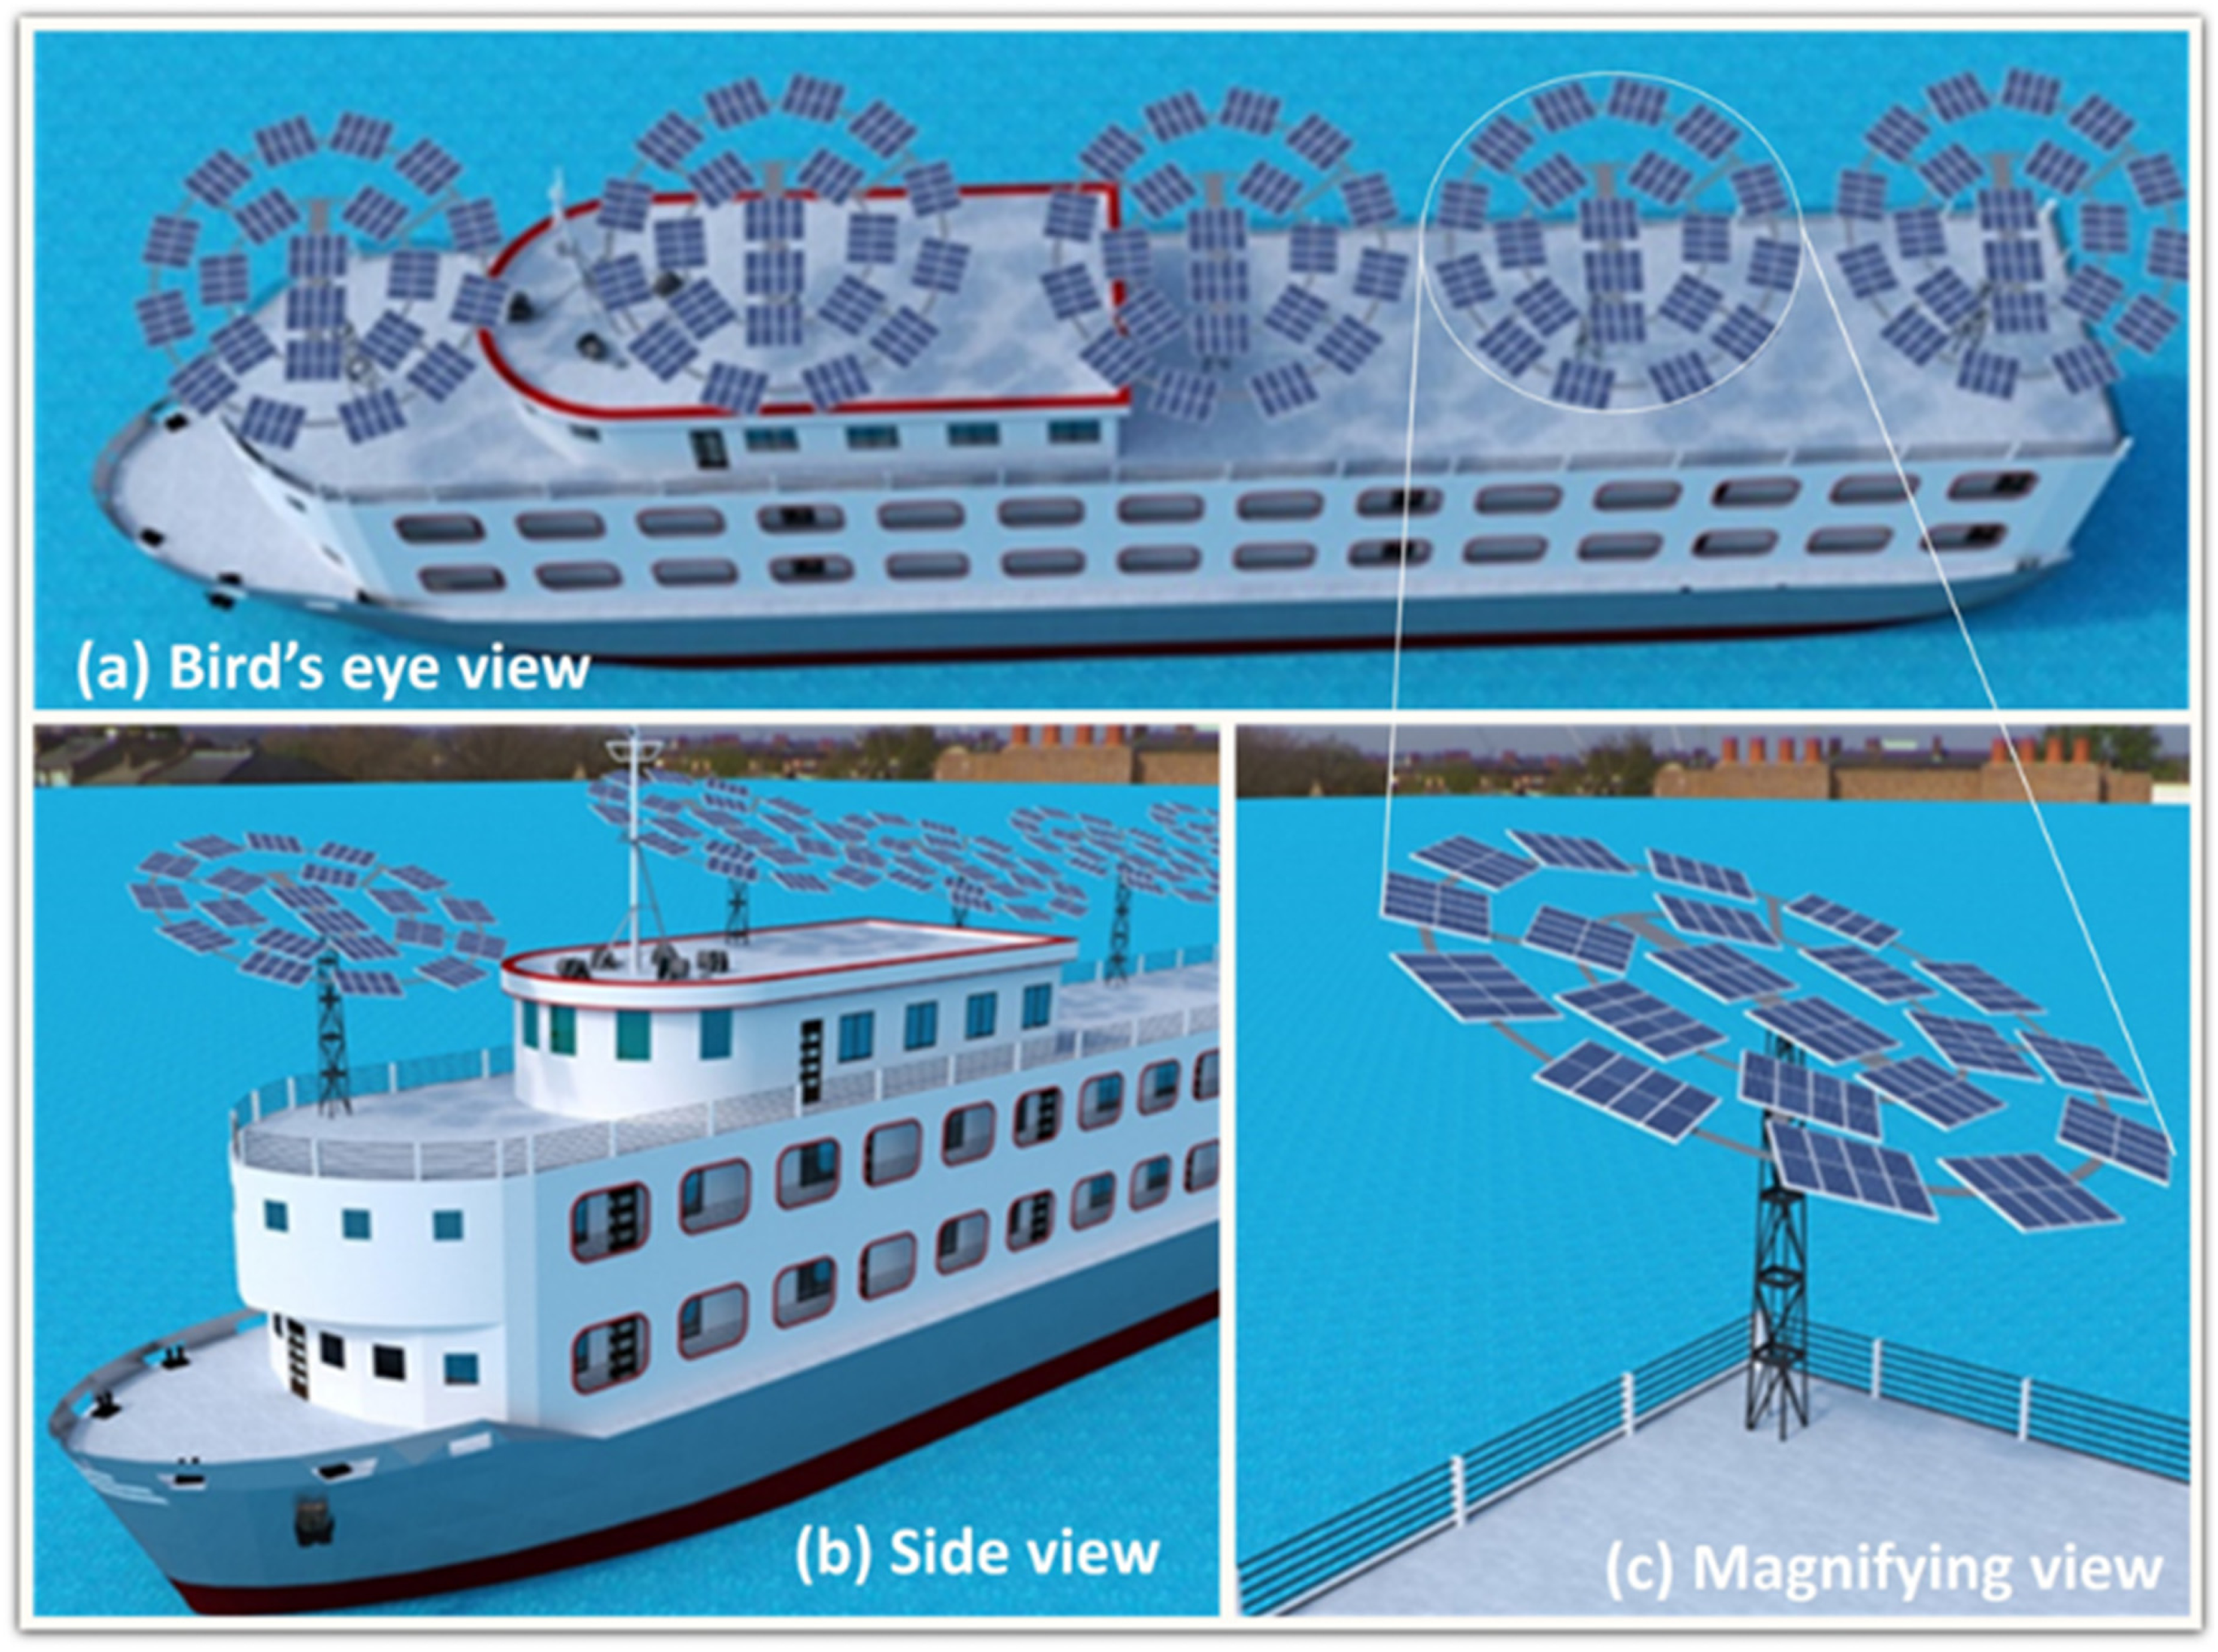
Flower-shaped solar PV tower model: (a) bird's eye view, (b) side view, and (c) magnifying view. As the earth moves in its daily and yearly motions, the solar panel will automatically move and change its tilt angle from 0° to 50° so that it faces the sun.
Due to the absence of different deck systems, including cargo lines, a crane, and a specific location for helicopter landing, this architecture may be viable to construct for the stated passenger ship. Solar panels are not supposed to be installed in the area behind the accommodations since they will be severely shadowed and exposed to the sun.
Design and modeling of components of PV system and typical solar PV arrangement
A PV system is made up of several components, each of which serves a certain purpose. The schematic diagram of a typical solar PV system and power configuration is shown in Figure 6. In general, PVs produce power and store it for later use in a network of rechargeable batteries. During sunshine hour, electricity generated by PV panel is directly send to the power loads via solar inverter (Figure 6a). During semi-cloudy weather conditions, stored energy from batteries is sent to the power loads via solar inverter (Figure 6b). During night or extreme cloudy and bad weather conditions, stored electricity from batteries is sent to the power loads (Figure 6c). If the batteries fall down or unable to send electricity—generator will supply the electricity in the ac loads.
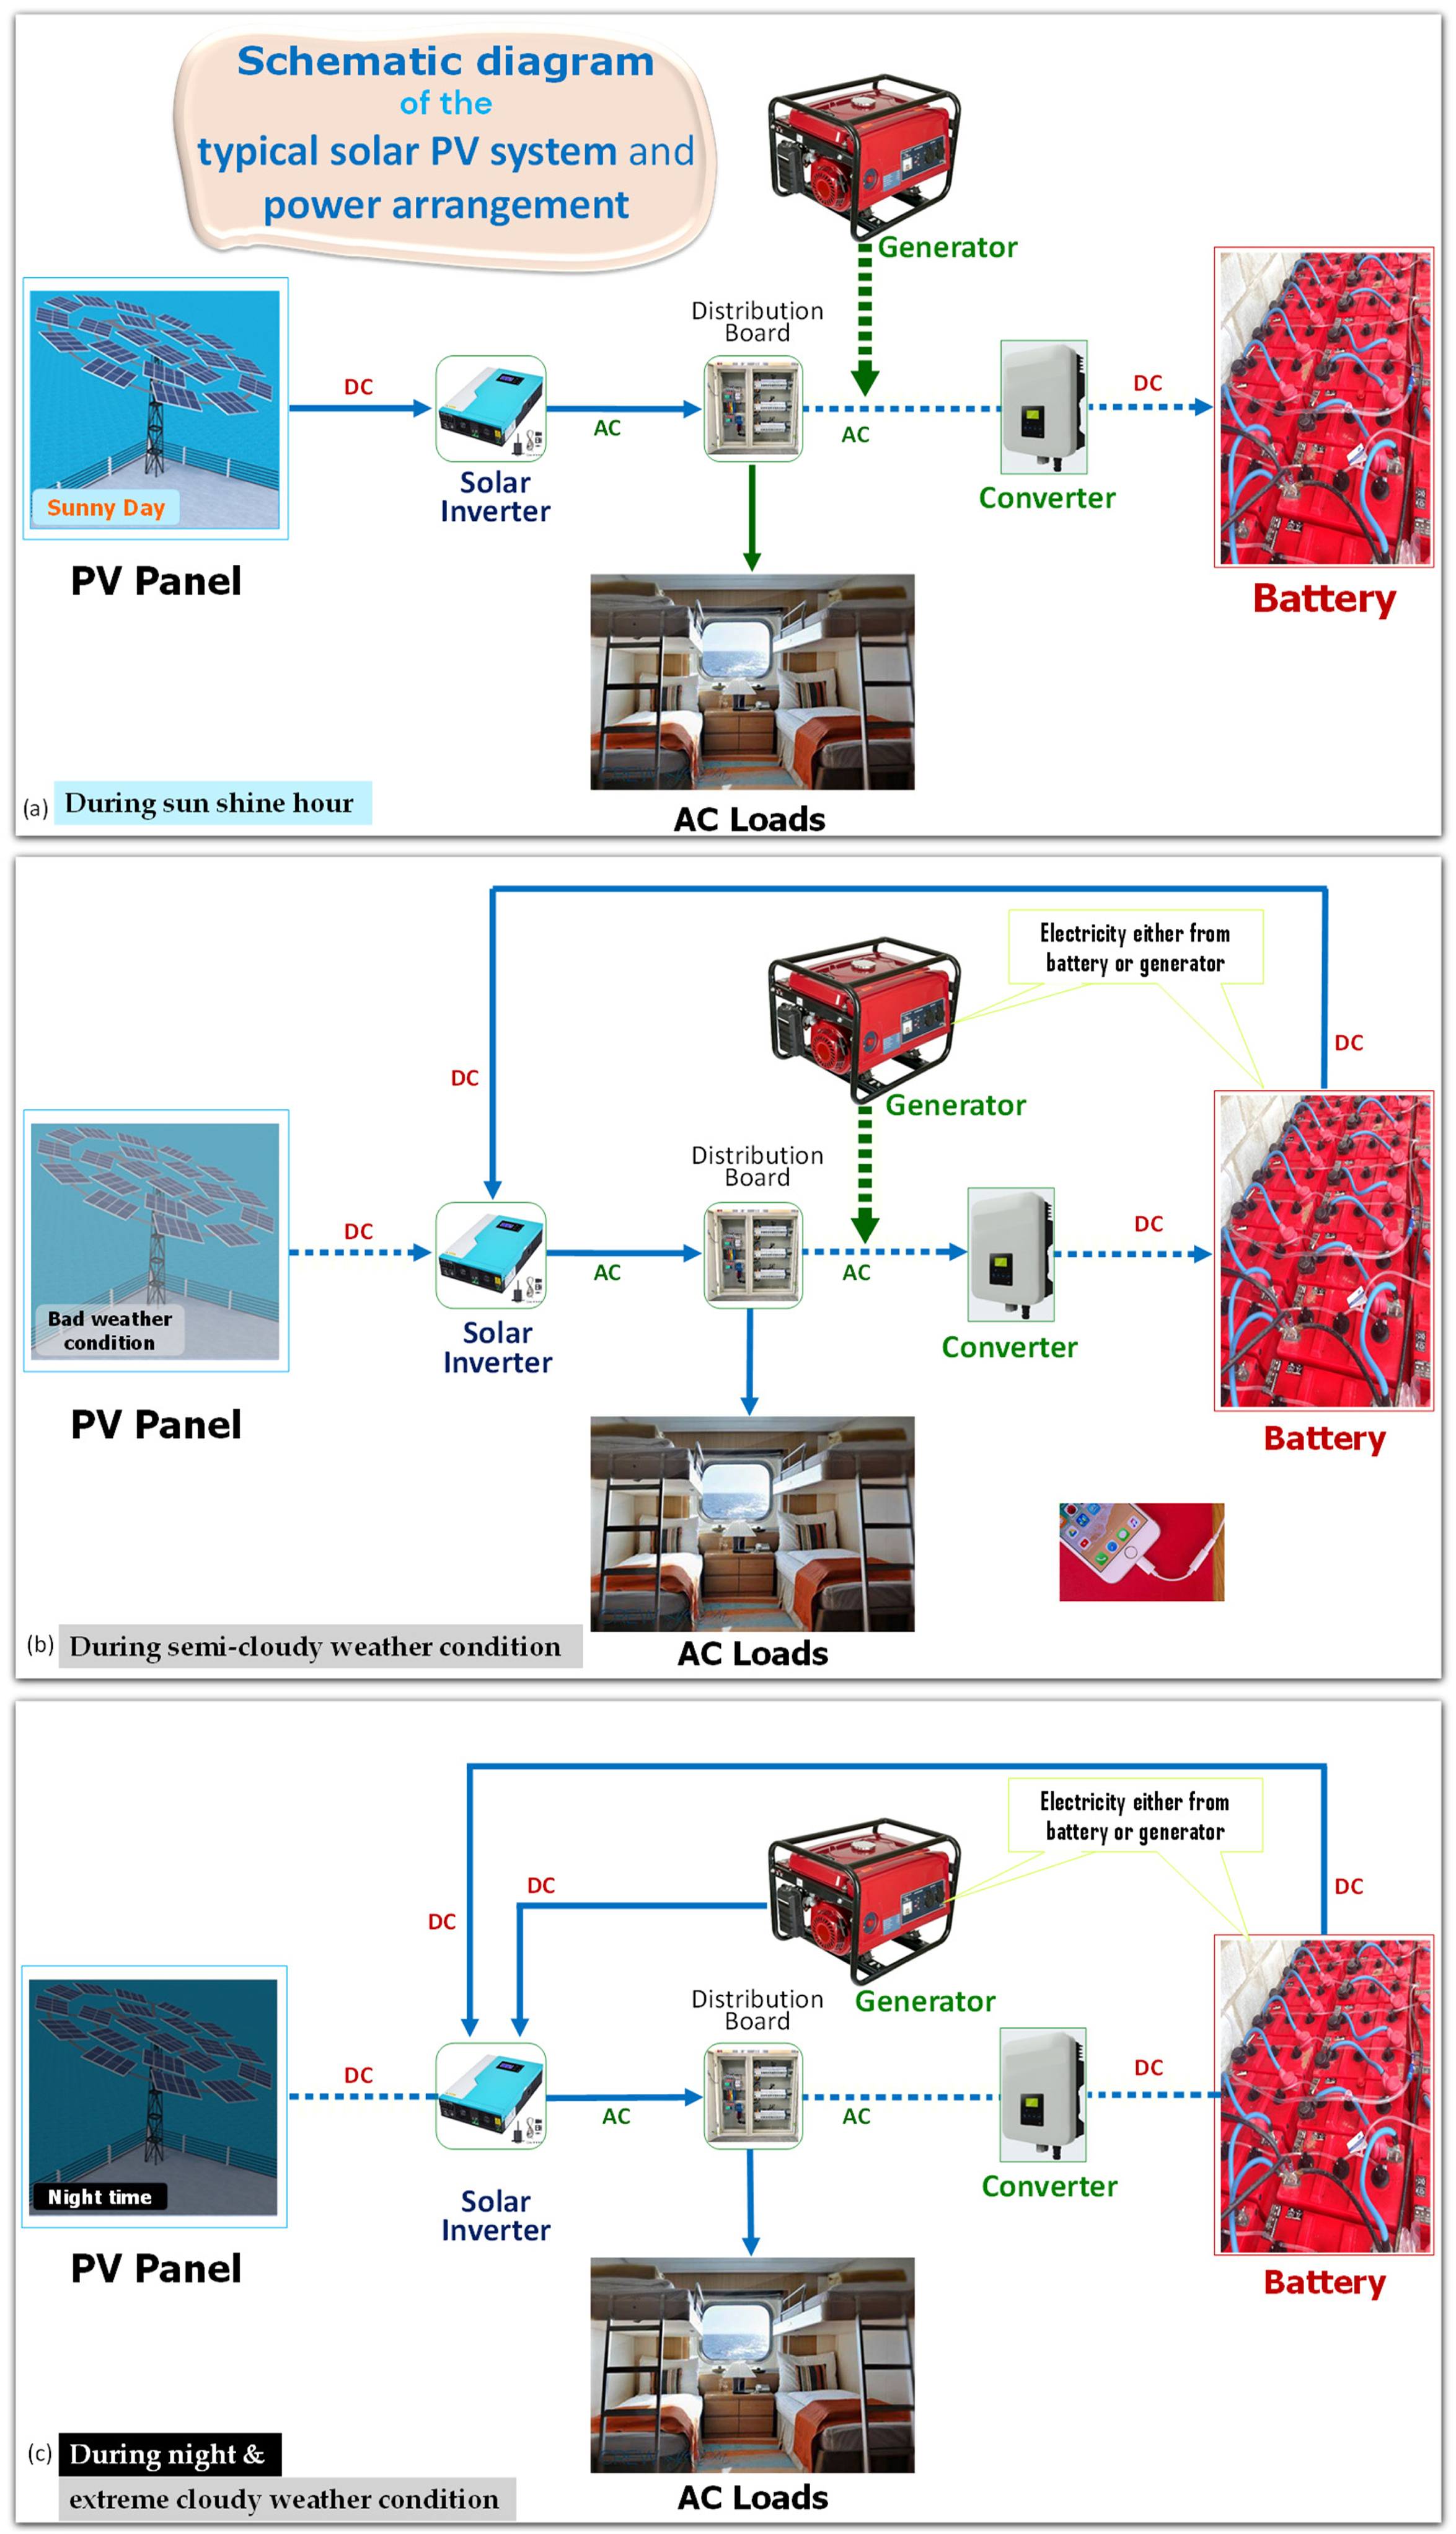
Components of solar PV system and typical solar PV arrangement: (a) during sunshine hour, (b) during semi-cloudy weather condition, and (c) during night and extreme cloudy weather condition. PV panels create energy during the day, which is then sent directly to the power loads using a solar inverter (Figure 6a). When it is partly generated in bad weather condition, a solar inverter transfers battery-stored electricity to the loads (Figure 6b). Battery-stored electricity is transferred to the power loads at night or during exceptionally cloudy and bad weather (Figure 6c).
PV panel
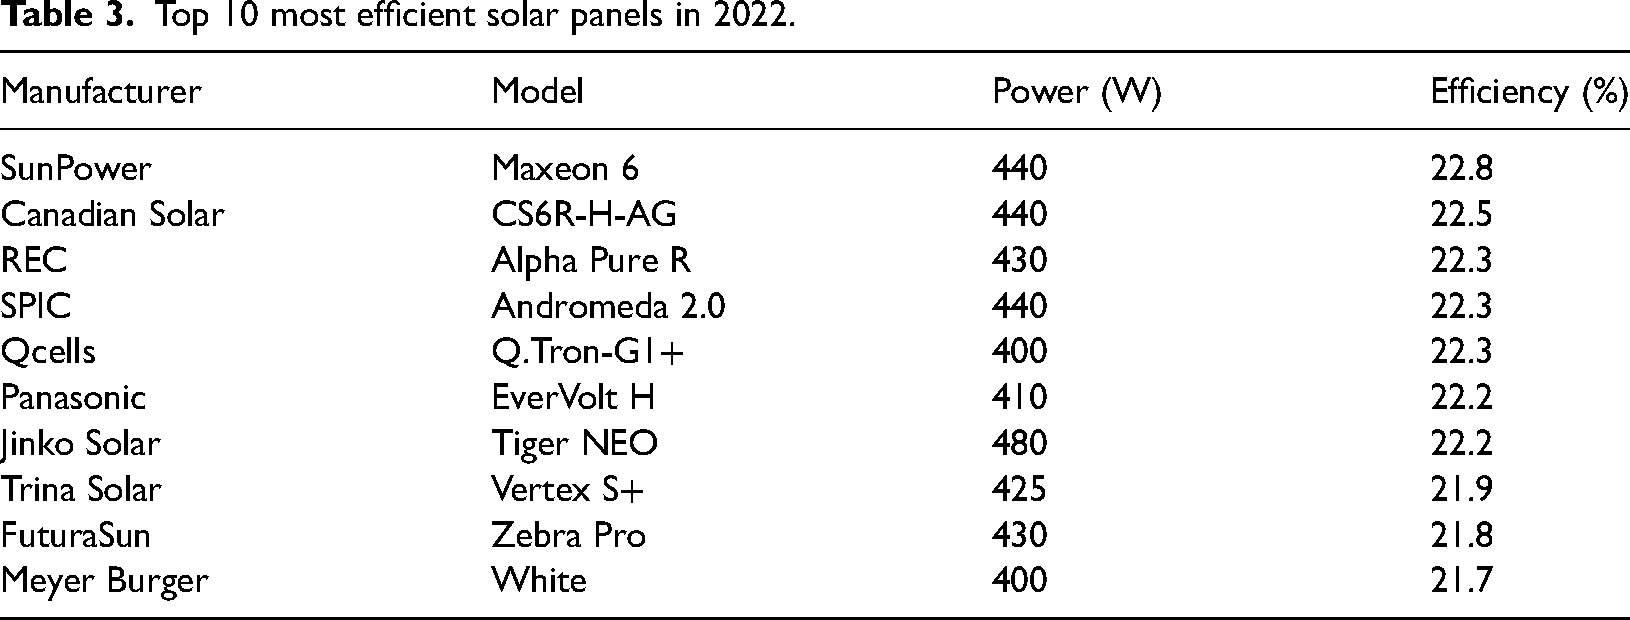
In this research, “400 W” N-type heterojunction (HJT) cell-based solar PV modules have been used for energy analysis and computation. High-performance N-type heterojunction (HJT) cell-based solar panels have increased dramatically over the past 2 years, making them more cost-effective for manufacturers. For the first time, the efficiency of the top six panels is now more than 22%. With the latest Canadian Solar, REC, SPIC, Qcells, Panasonic, Jinko Solar, Trina Solar, Future Sun, and Meyer Burger panels helping to raise panel efficiency far beyond 21%, SunPower (Maxeon) panels are still the market leader, but only just. Table 3 lists the top 10 solar panels using PV cell technology that will be most effective in 2022 (Cleanenergyreviews, 2022).
Top 10 most efficient solar panels in 2022.
Mounting frame
It will be necessary to construct a permanent mounting structure to hold up the solar panel. The top surface of the mounting frame that will support and transport the solar panel should be properly positioned and locked as it tilts and moves freely in order to receive the maximum solar radiation, shown in Figure 7.
Automatic orientation of solar panel during day to maximize solar energy output.
When solar panels are directly facing the sun, they produce the most electricity. To get the most radiance, the solar panel must be positioned at a specific tilt angle. The tilt angle of the panel varies from place to place based on the geographic location. Setting adjustable panel frames, as described in “Design and modeling of direction and tilt angle of PV panel on the Bay of Bengal” section, is encouraged. On the PV panel, an inclinometer and a Pyranometer are kept to measure the tilt angle and solar irradiance for optimum sun energy.
Solar inverters and converter
Figure 8 shows the inverter systems of traditional string types versus modern AC module types. The majority of traditional solar panels employ string inverters. Some AC module solar PV systems are more dependable than conventional solar system architecture. For instance, conventional PV systems with string inverters have a single point of failure. If the inverter in this system malfunctions, the entire system does collapse, as shown in Figure 8(a). In contrast, the PV system updated with the micro inverter-based AC module technology is much more reliable than conventional inverter-based solar system design where the entire system will not fail when the inverter in this system malfunctions, shown in Figure 8(b). That is why, micro inverter-based AC module technology have used in this research.
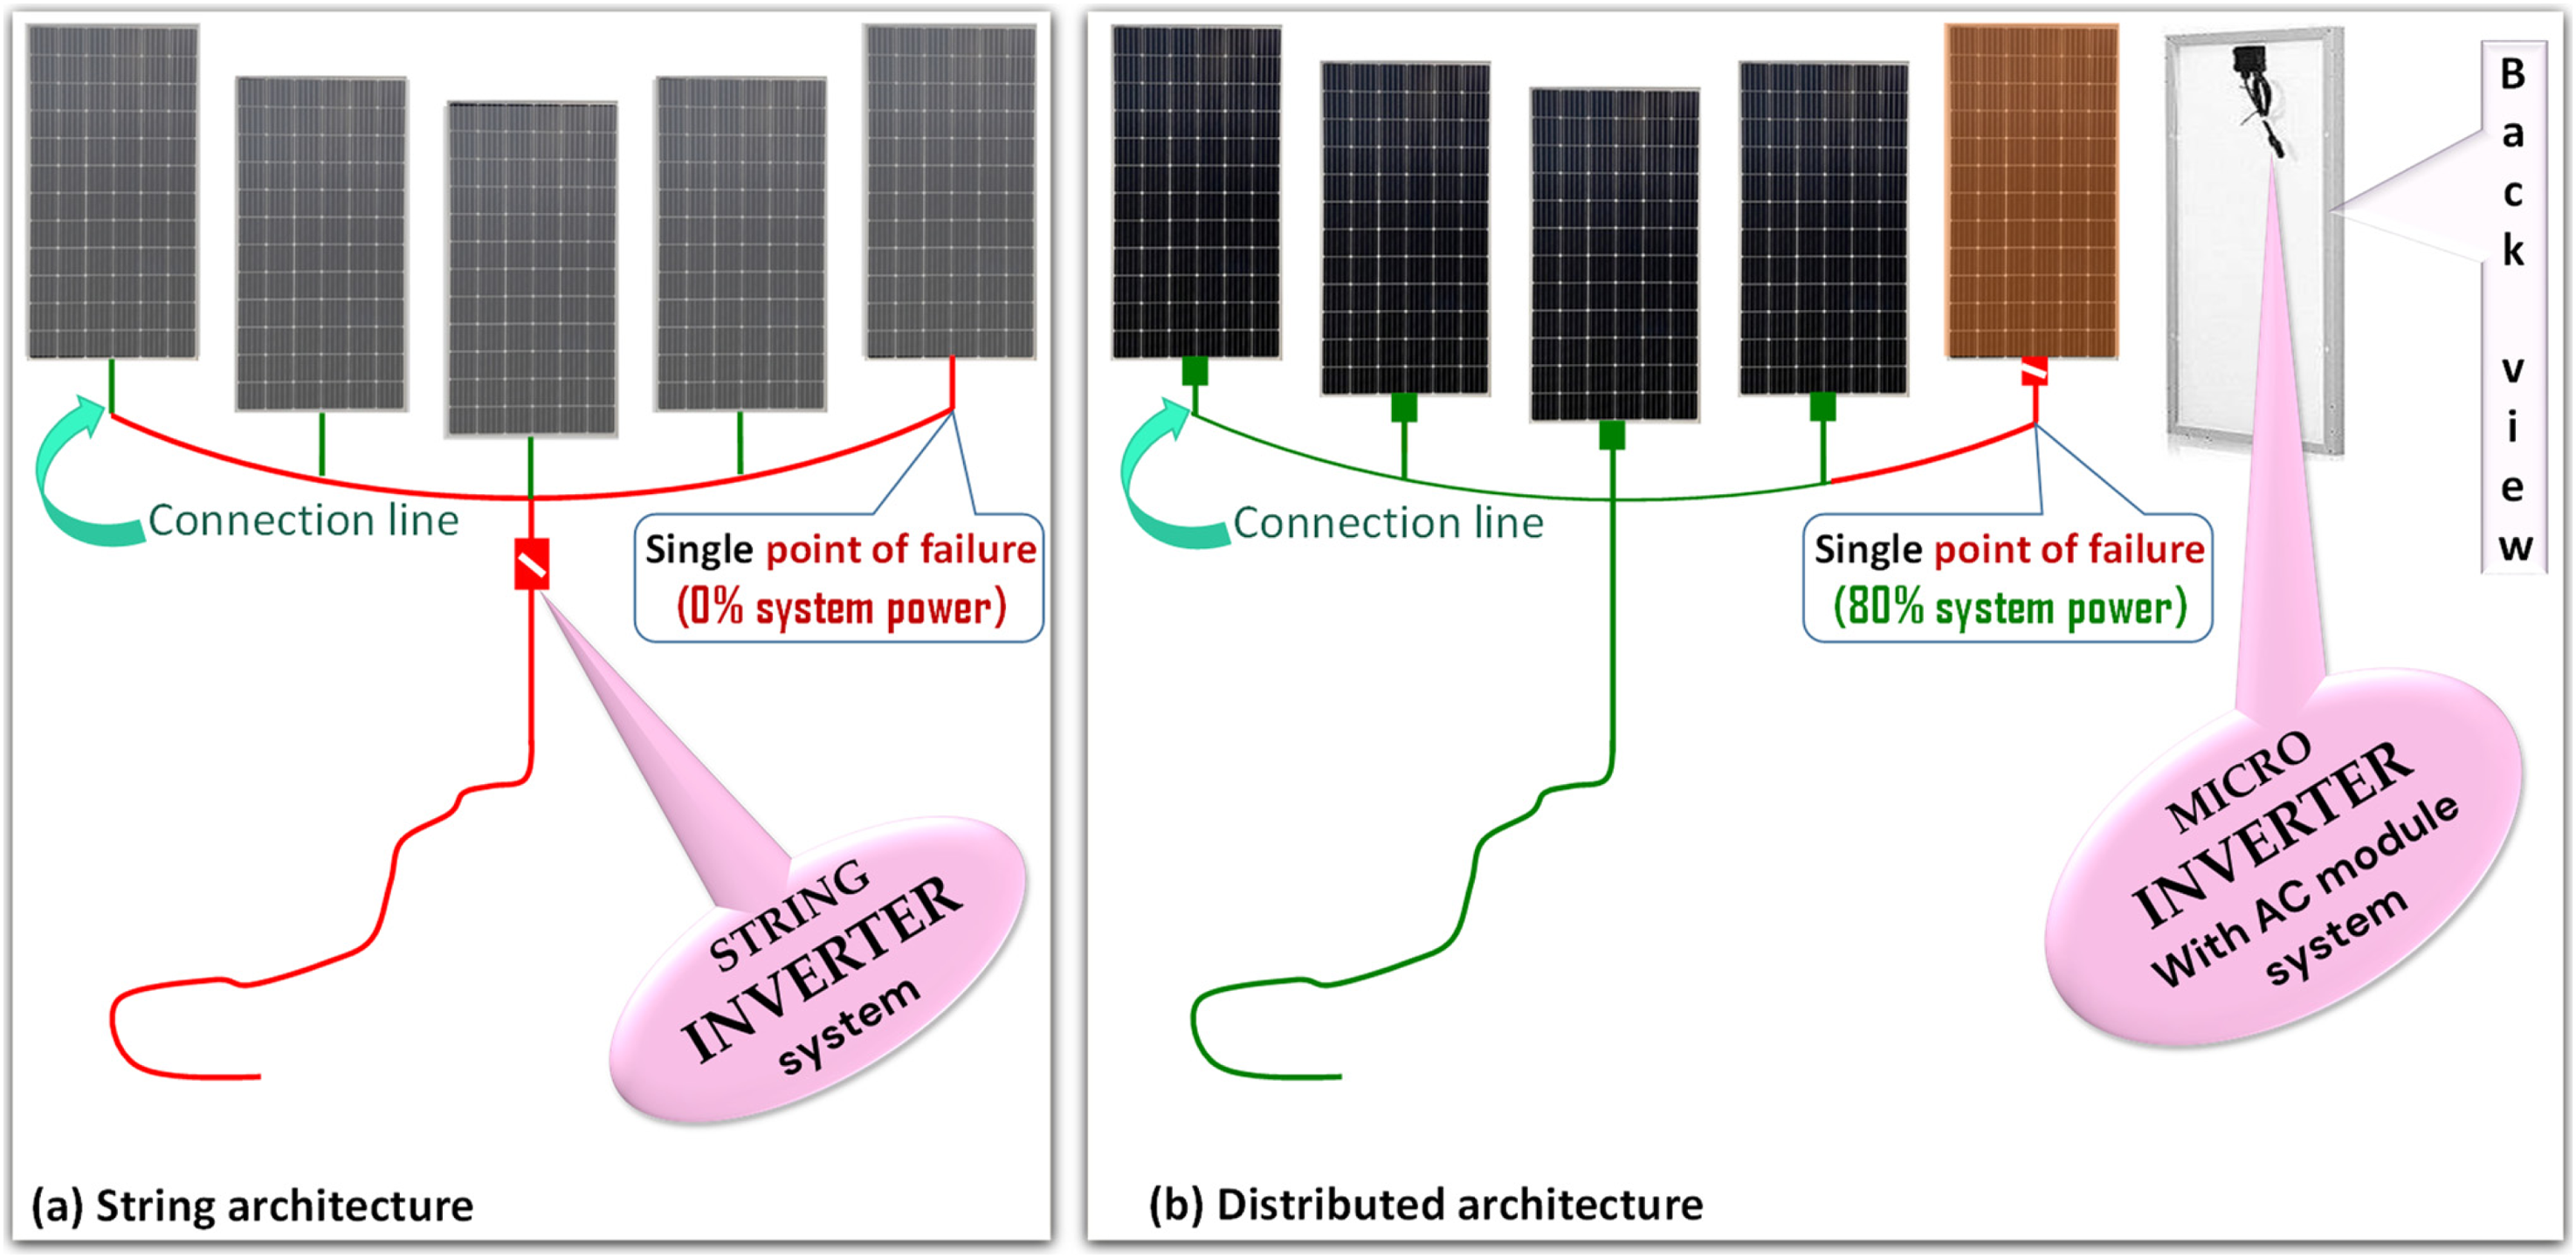
Inverter system of typical solar PV arrangement: (a) string inverter system, (b) micro inverter with AC module system.
It is necessary to take precautions to prevent overcharging and excessive battery discharge. In this research, it is recommended to use a solar charge controller with a solar inverter in order to (a) charge the battery as effectively as possible without overcharging and (b) stop the battery from nighttime back feeding into the solar panel (Grebenchikov et al., 2020). Solar charge controller prevents overcharging and excessive battery discharge.
Energy storage device/battery
The lead-acid battery with deep discharge (up to 80% of its storage capacity) is commonly used (Manimekalai et al., 2013) in residential solar system (Solarreviews, 2022) and it is the cheapest solar battery where the cost can up to 2–3 times less than lithium batteries (Solarenergyscout, 2022) that is most frequently used for residential PV applications.
In this study, 12 V 200AH rechargeable deep cycle hybrid gel batteries that can be capable of enduring temperatures between −4°F and 140°F are suggested as a solar energy storage device. Several battery banks may create by connecting several batteries in series. For example, a battery bank of 24 volts of DC may make by connecting two 12-volt batteries in series (positive to negative), and 48 volts may make by connecting four batteries in series.
This research also suggests a smart option of discharging the battery to 50% and then fully charge it again. Because, if the battery is not depleted to 0%, the battery life can be increased and vice-versa as the life of batteries is finite.
Design and modeling of direction and tilt angle of PV panel on the Bay of Bengal
When building a PV system, it is critical to carefully evaluate (a) the direction and tilt angle of the PV panel and (b) shade analysis to optimum performance.
(a) Direction and tilt angle of PV panel: Due to the location of the Bay of Bengal in the northern hemisphere, the module should face the sun and point south in the research area as the Bay of Bengal is situated in the northern hemisphere. The orientation of the module should be altered to face the other way when the ship crosses the equator and the latitude changes from zero to higher.
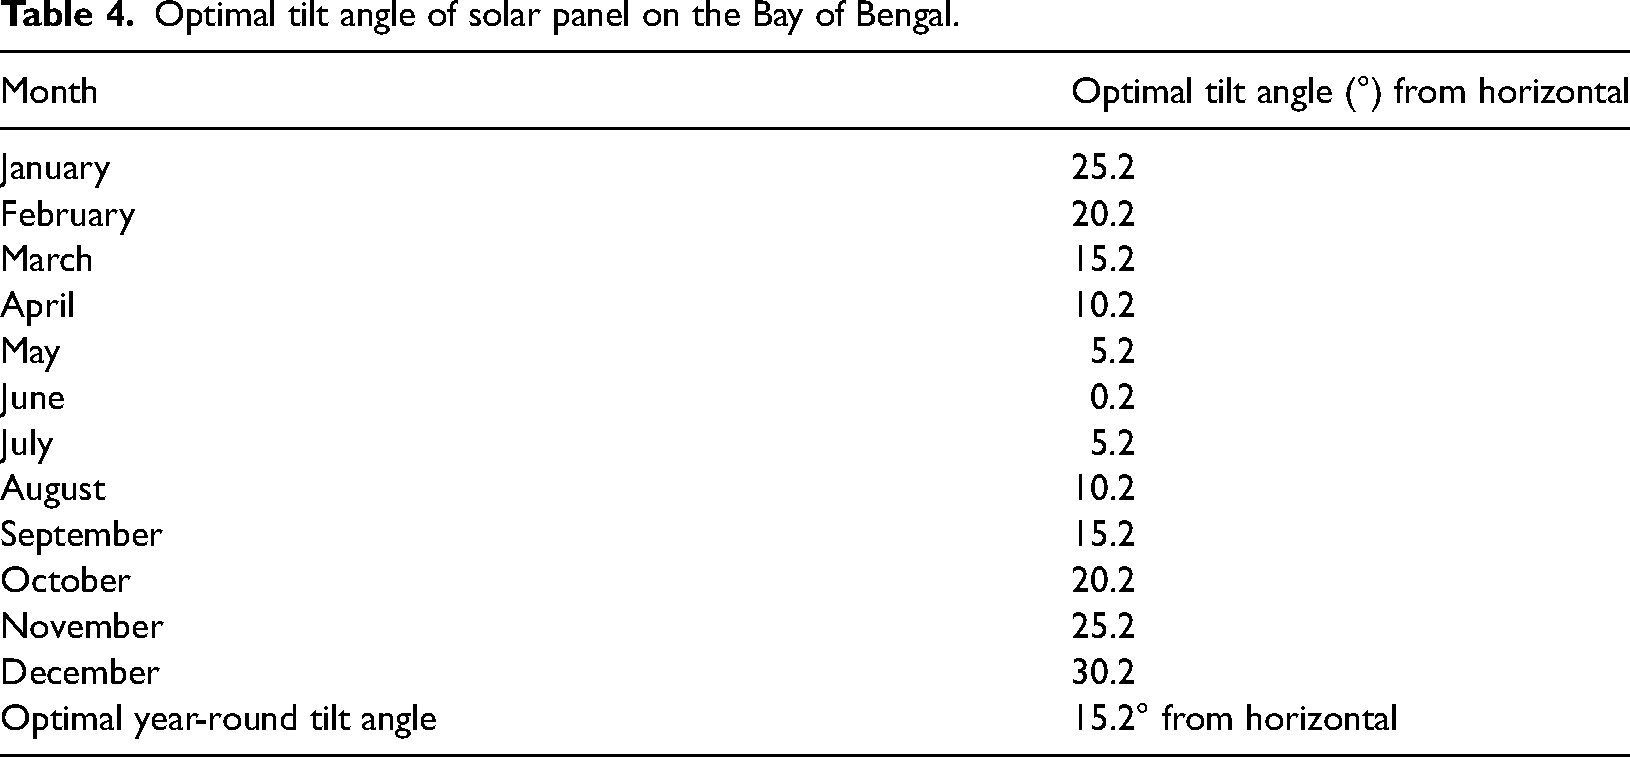
A panel must be positioned at a specific tilt angle to gain maximum radiance. The tilt angle should ideally match the latitude. In the spring, summer, fall, and winter, the ideal tilt angles are 15.2°, 0.2°, 15.2°, and 30.2° in the research area. The solar PV should be tilted 15.2° away from horizontal throughout the year (Footprinthero, 2022). The ideal tilt angle of the research area is displayed in Table 4. A GPS, an Inclinometer, and a pyranometer have to attach on the PV panel to measure the geographical position, the tilt angle, and the solar irradiance in order to harvest the most energy from the sun while our suggested solar ship moves from place to place throughout the Bay of Bengal. The solar panel will rotate automatically and faces perpendicular to the sun as the earth moves in its diurnal and annual motion, shown in Figure 9. At night, the solar panel will fix at horizontal, as shown in Figure 10. This type of solar panel is also available in the market.
(b) Shade analysis: For solar panels, shading can be problematic since it lowers their maximum output. Trees, structures, clouds, and solar panels close by are the most frequent causes of shade (Solar Choice, 2022). Only clouds are the main cause of shade analysis but others (i.e. shade from tree or building) are excluded in this research. This study suggests to use the grey wolf optimization-based optimized MPPT to improve PV panel efficiency, discussed in “Introduction” section.
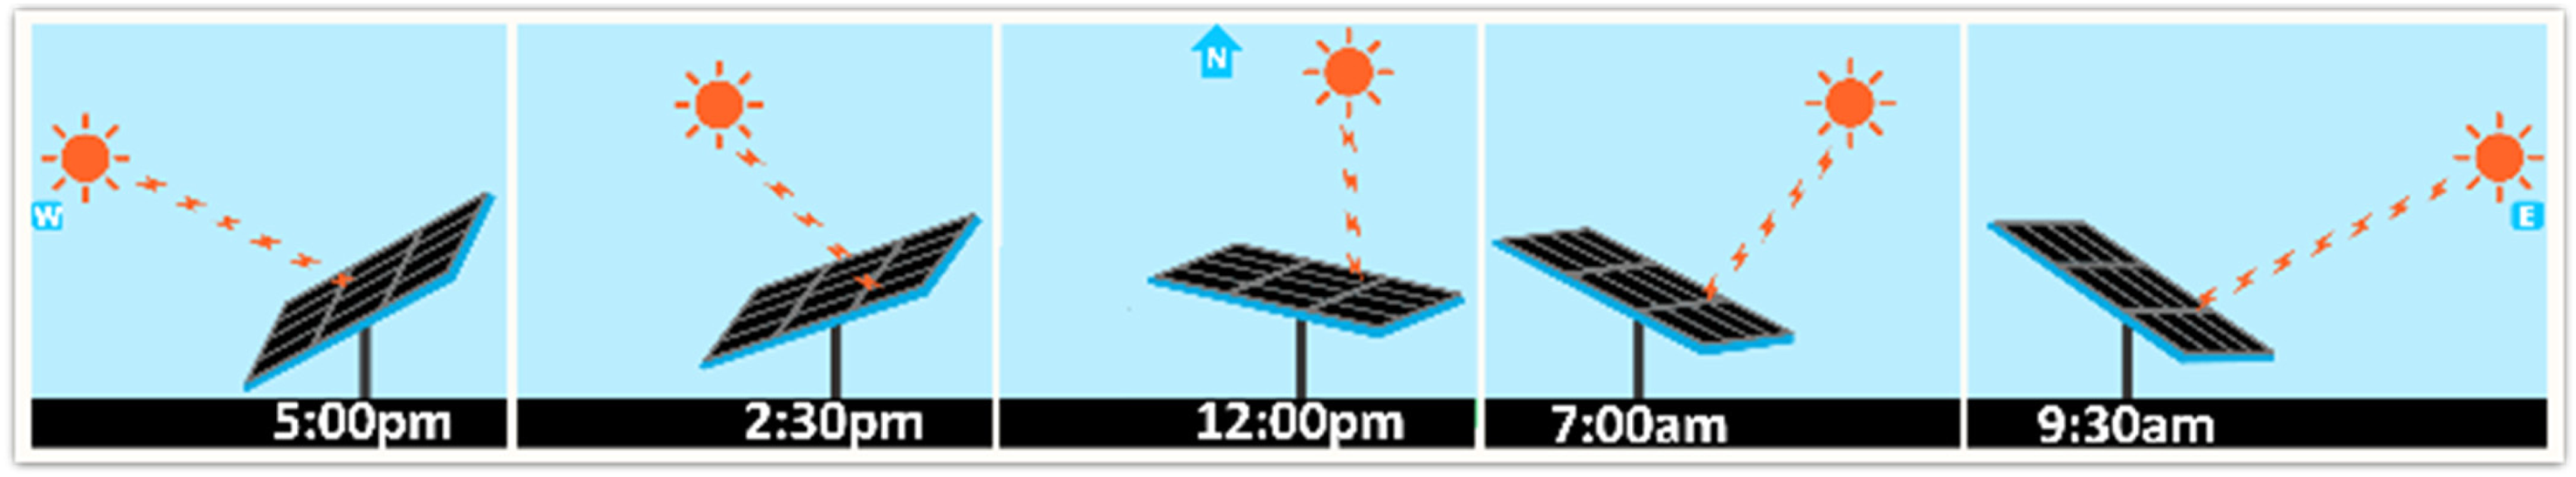
Automatic orientation of solar panel during day to maximize solar energy output.
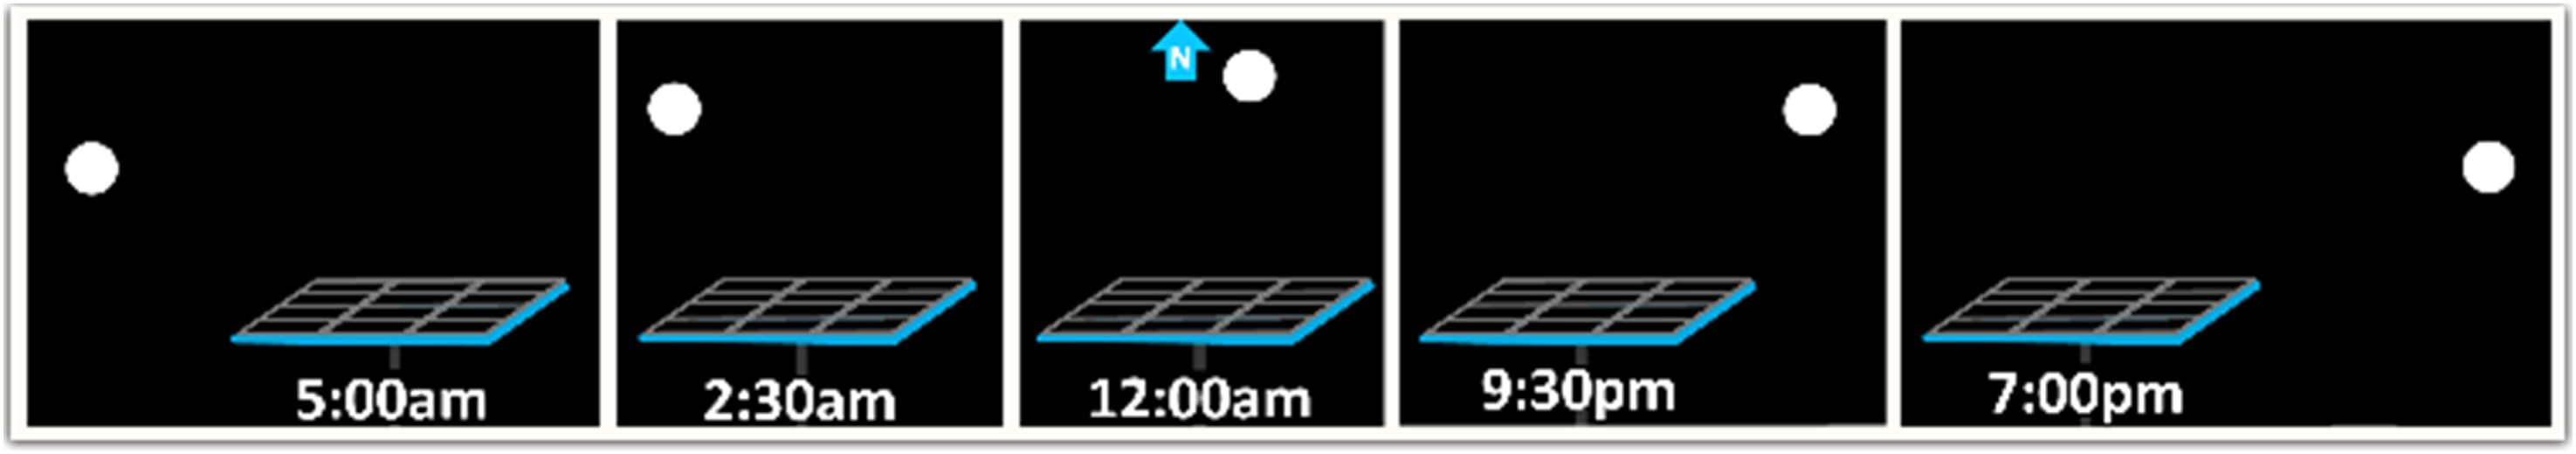
Fixed solar panel during night.
Optimal tilt angle of solar panel on the Bay of Bengal.
Data analysis and energy output calculation
Analyses of temperature, solar radiation, and solar insolation
Researchers need information on the temperature and solar insolation in order to analyze the highest power output. Monthly average temperature and monthly solar insolation of Bay of Bengal is shown in Figure 11a and b. Figure 11a illustrates the peak summer months, moderate temperatures months, and low temperatures months of Bay of Bengal. The average temperature of Bay of Bengal is 27°C (Shiptraffic, 2022). Generally, April to October months show the peak summer months; March and November show the months with moderate temperature; and January, February, and December show the months with low temperature.
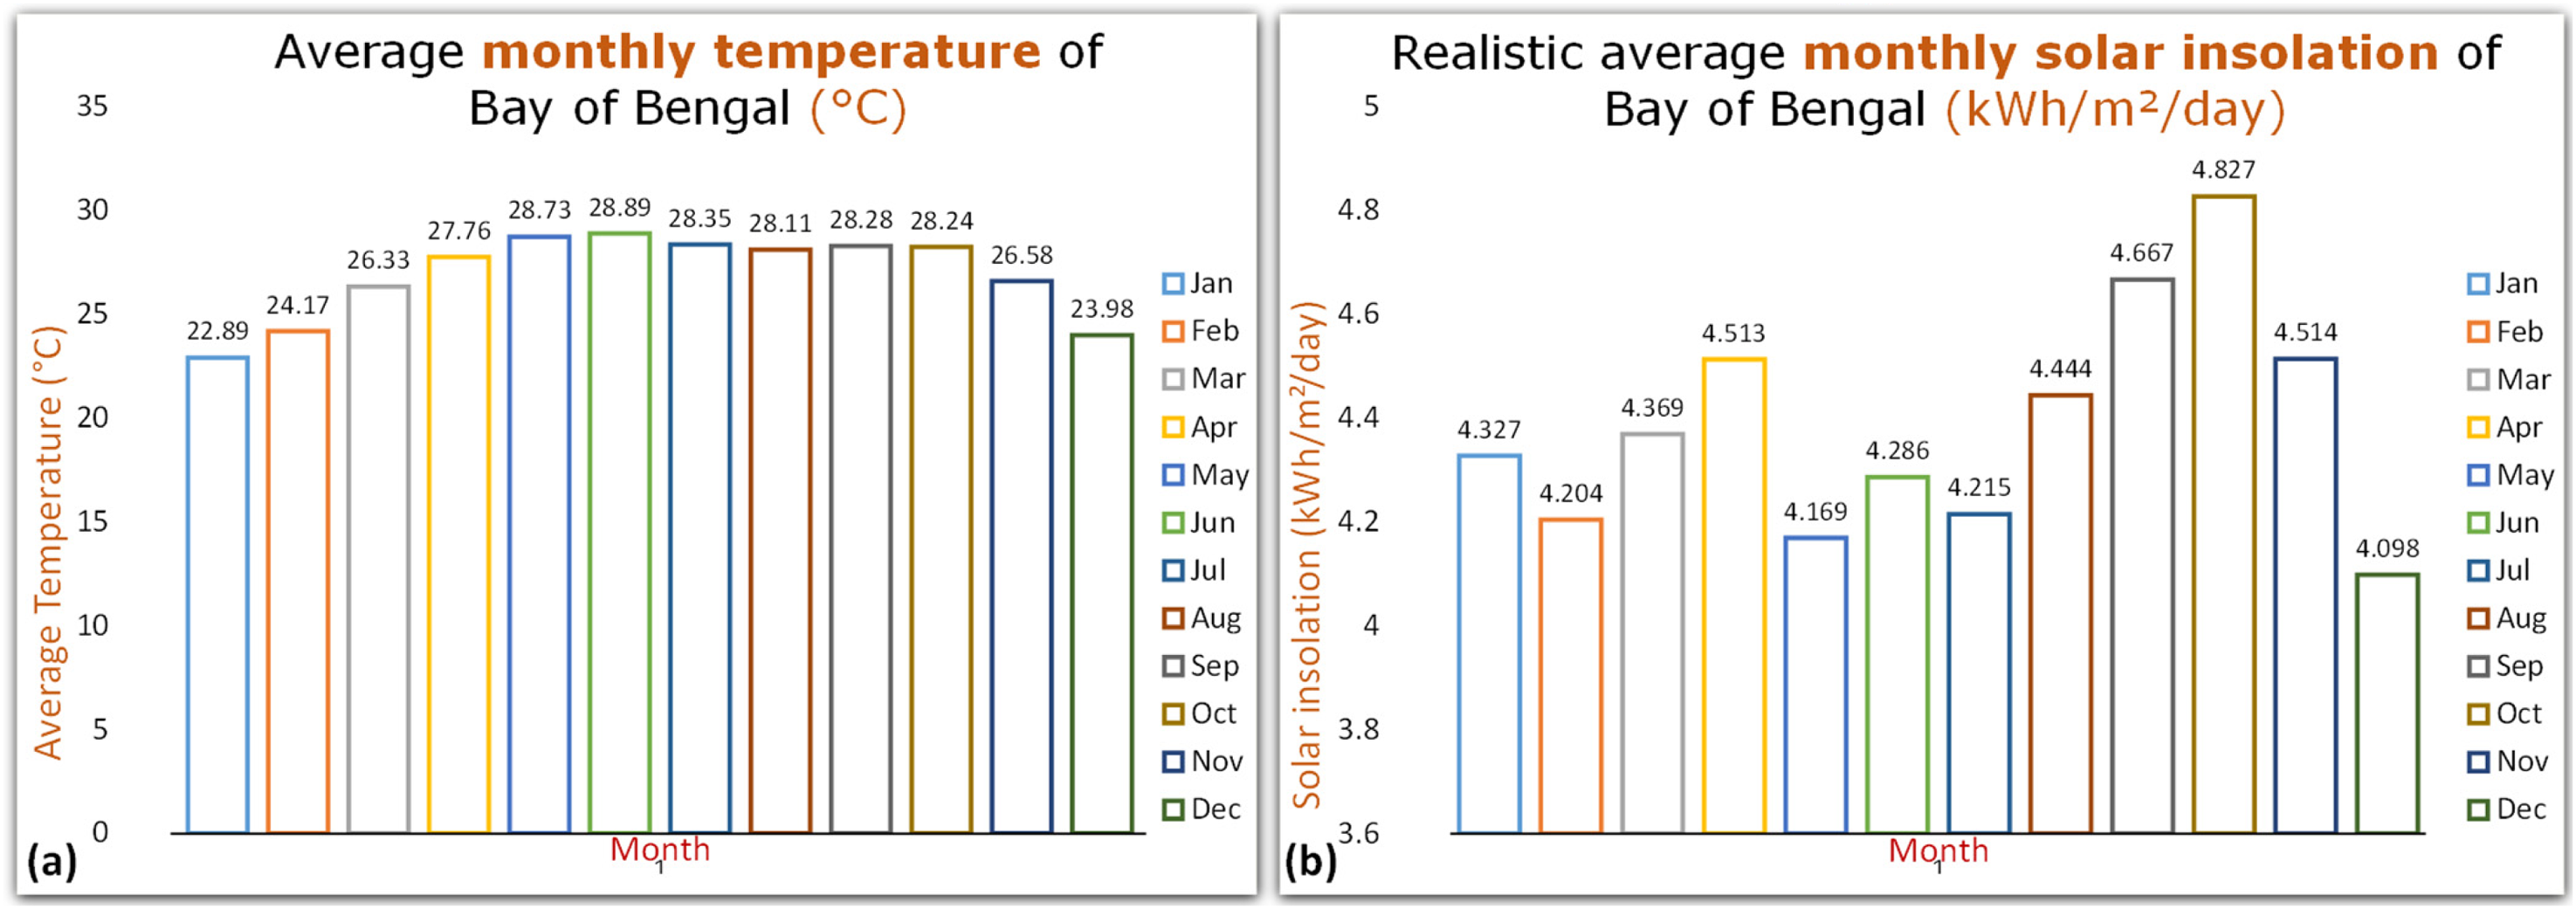
Monthly (a) average temperature and (b) average solar insolation in Bay of Bengal.
The amount of solar radiation or electromagnetic energy that enters the earth at a specific point or location is known as solar insolation. The quantity of solar energy that strikes a square meter area of the earth's surface each day is measured as solar insolation, which is expressed in kWh m2/day. From the pvwatts calculator, NREL (Pvwatts, 2022) and daily solar insolation calculator based on NASA CERES project data, we have gathered solar radiation and solar insolation data for standard solar module type.
Calculation of expected energy output
We have used two formulas for expected energy output calculation—each of which has same output.
Formula‒1:
Calculation of Daily Energy Output for 21-moduled single PV tower
According to equation (1), According to equation (2),
Energy Output per PV module 
Energy Output per (21-moduled single) PV tower 
or
Formula‒2:
Calculation of Daily Energy Output for 21-moduled single PV tower


where
According to equation (5), solar cell efficiency 
where
According to equation (6), Daily Energy Output per (21-moduled single) PV tower
where
Numerous variables, including geographic location (latitude and longitude), climate, season, altitude, and solar panel orientation, affect how much solar energy is present in a given area. The assumption that the panels are horizontal accounts for this daily energy production. The energy production will be higher, if the solar panels are installed in automatically aligned orientations.
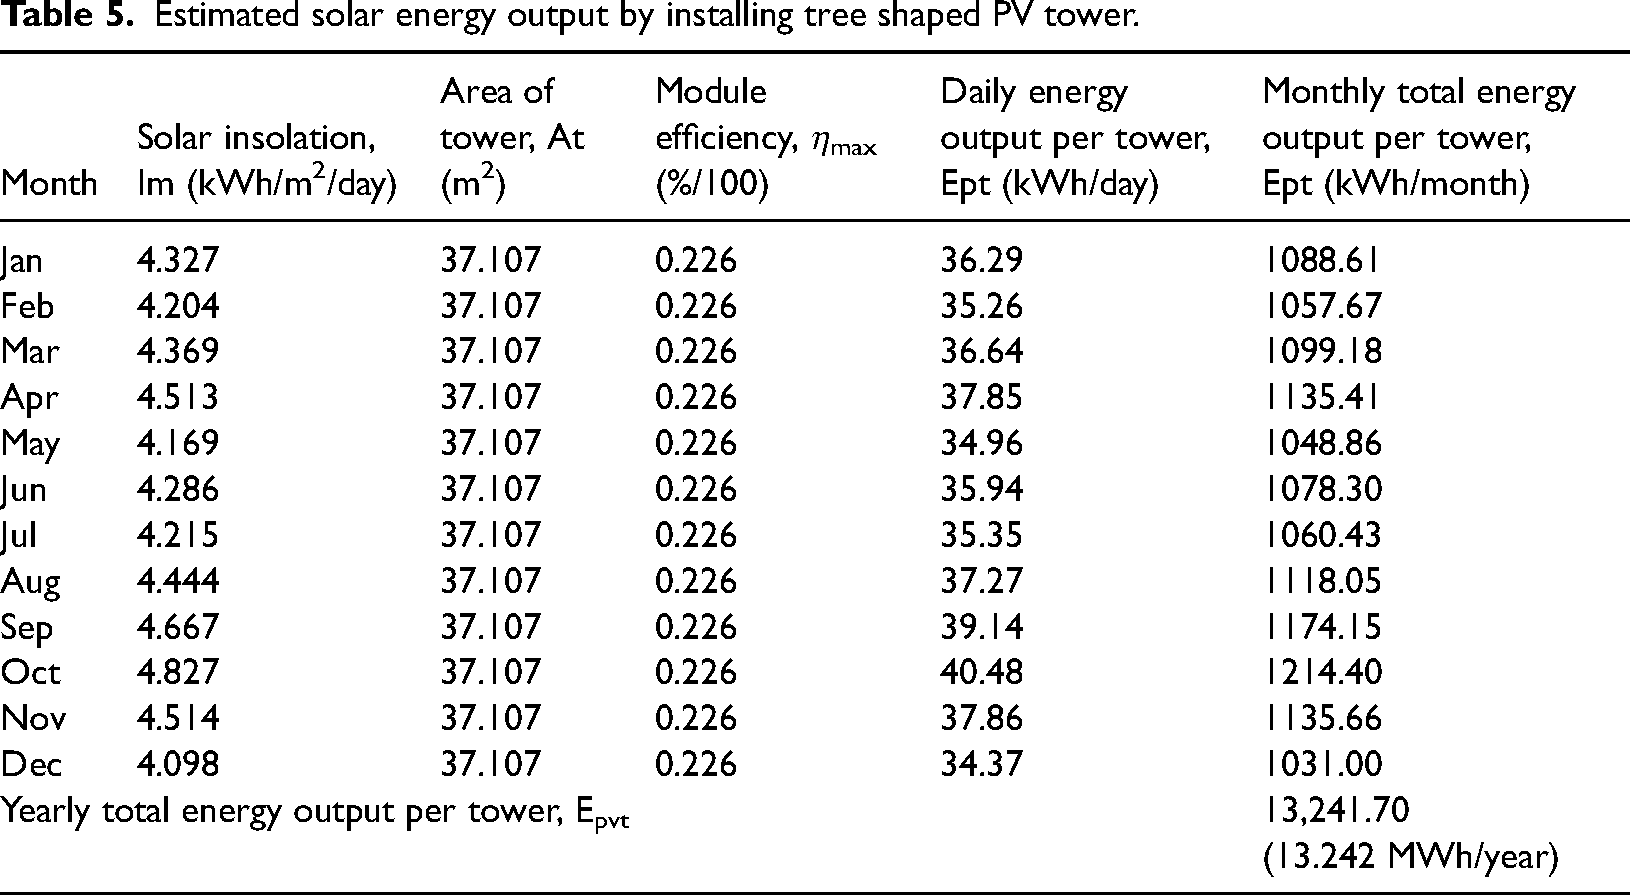
A single flower-shaped solar PV tower has an estimated area of
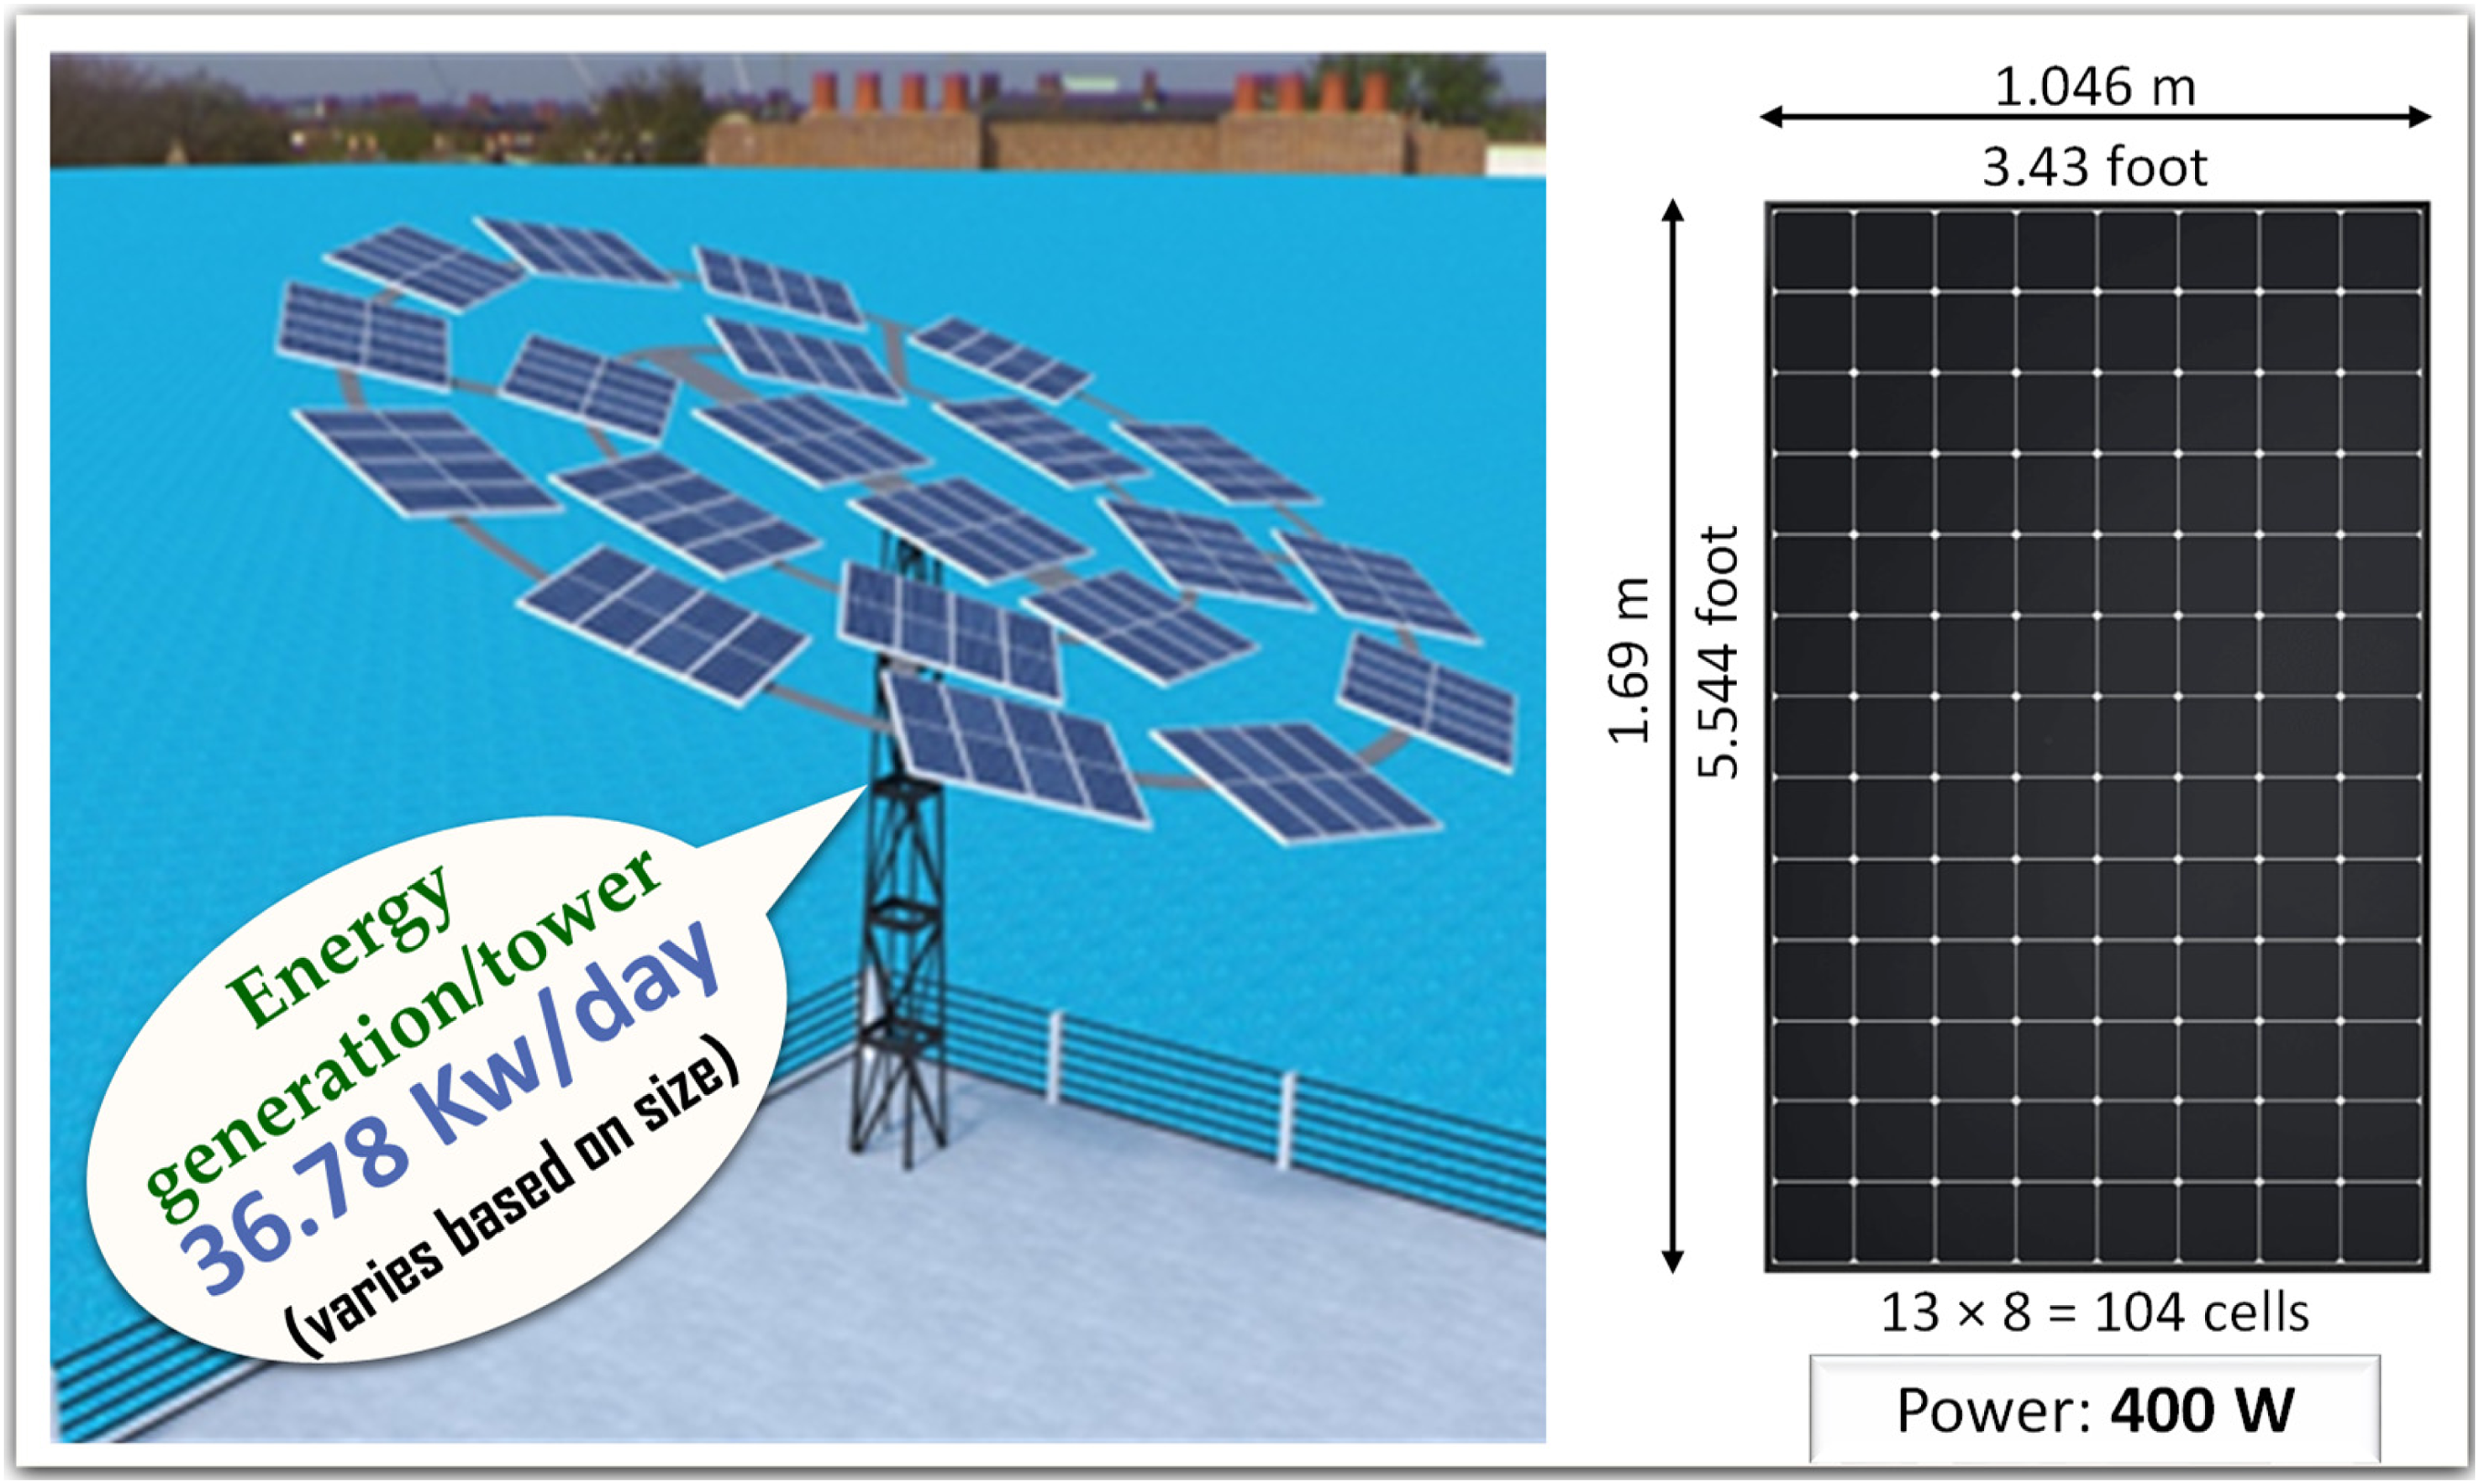
Electricity generation per PV tower.
Estimated solar energy output by installing tree shaped PV tower.
Eco-friendly energy source and sustainability
Around 75% of the world's energy comes from burning fossil fuels, which results in a large amount of greenhouse gases being released into the atmosphere, mostly CO2 and unsustainable development (Sims et al., 2003). The most popular fuels used in marine vessels today are Heavy Fuel Oil (HFO), Low Sulfate Fuel Oil (LSFO), diesel, and natural gas. Around 300 Mt of fuel is used annually by international maritime activities, and gives rise to around 3% of anthropogenic CO2 emissions, contributing about 3% of anthropogenic CO2 emissions that lead to the greenhouse effect, global warming, and eventually climate change (Fridell, 2019). These fuels also emit Sulfur and NOx emissions. Additionally, the biodiversity and other elements of marine habitats are also harmed by these gases. But constructing solar PV system on marine vessels is an eco-friendly and greener alternating solution. Because, it does not emit CO2, nitrogen oxides, sulfur oxides, and particulate matter.
Calculation of CO2 emission reduction
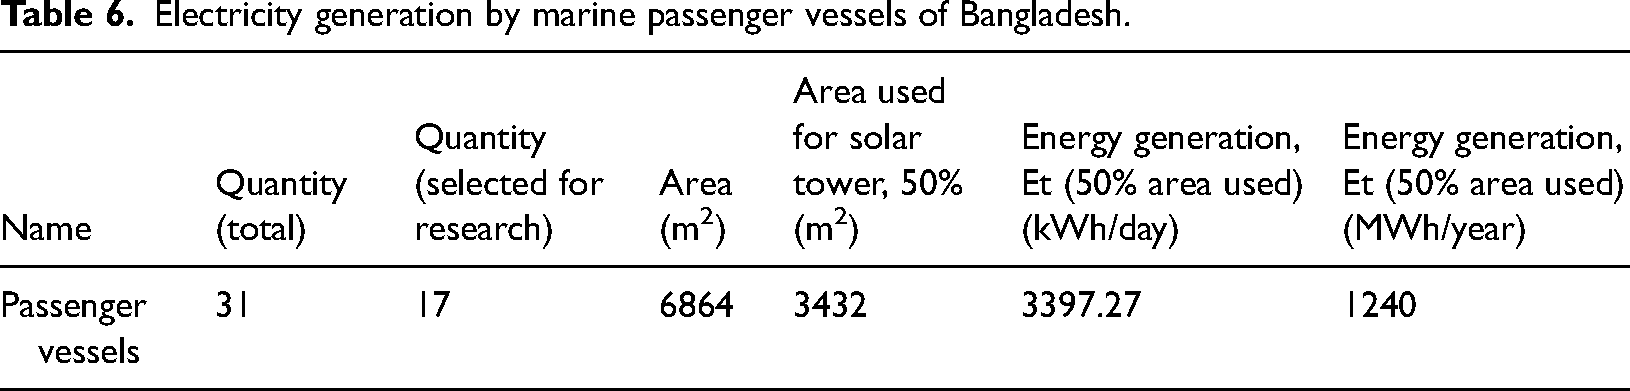
There are many passenger ships operating in the Bay of Bengal, and the ships data archive has records on 31 of them. In this study, 17 ships are chosen following the rejection of a number of vessels due to insufficient length and breadth information.
The total area calculated of all passenger vessels’ roof is 6864 m2. According to Table 5, almost 50% of the available space is allocated for the installation of solar panels, and the area is 3432 m2 from which a total of 3397.27 kWh, or 33.97 MWh, of energy will be produced each day, or 1240 MWh of electricity will be generated per year, shown in Table 6. This electricity will be used to power the vessel utilities such as light, fan, TV, Laptop, smartphone charging, etc.
Electricity generation by marine passenger vessels of Bangladesh.
A ship requires all the necessary services to maintain life on board, much like a normal metropolitan city would, and electricity is the primary source of these services. This electricity is generated by diesel Generator (2018; 1992). Burning this diesel oil is the primary source of Carbon dioxide emissions from the marine vessels.
Carbon dioxide emissions from the primary energy use of the diesel are estimated by applying the consumption of each energy source type by multiplying the IPCC's “Carbon dioxide Emissions Factors” (Our World in Data, 2022). By putting the suggested PV system on a number of Bangladesh's 17 passenger ships, around 325.56 tons of CO2 will be prevented from being released into the atmosphere each year, shown in Table 7.
CO2 emission from electricity generation by diesel oil in marine passenger vessels of Bangladesh.
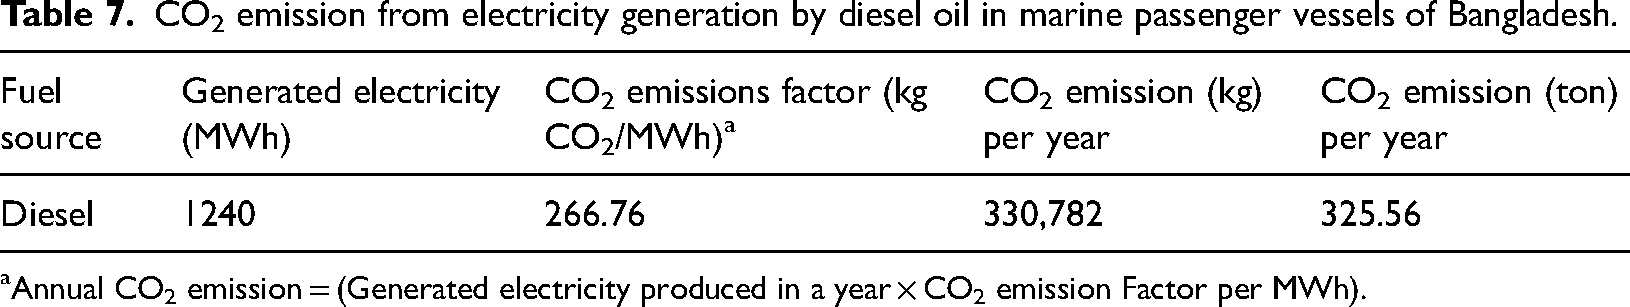
Annual CO2 emission = (Generated electricity produced in a year × CO2 emission Factor per MWh).
Challenges and benefits of solar PV on marine vessel
A solar PV on marine vessels is a PV system designed to capture solar energy and transform it into electricity to supply usable solar power for marine vessel.
Challenges of solar PV on marine vessel
Compared to those installed in land applications, installing PV systems on ship's roof involves several challenges, discussed below.
Strong ship's roof for supporting the added weight and wind loads
The week ship's roof is not suitable for supporting additional load. The roof must be strong enough to capable of supporting the added weight of the solar PV system and resist high wind loads. Although, during cyclone time, the solar panel will fold inward and lay down on the floor.
Mobile PV on sea-routes
Solar radiation received by PV modules is constantly changing, especially when the ships are traveling along different routes. Compared to PV systems on land, forecasting the irradiation profile is difficult for ships. Solar tracking devices have to use to fix the problem.
Solar tracking devices can deliver satisfactory results for the ship's PV panels and boost solar panel power output. Although, the mechanical moving parts of solar tracking systems could be negatively impacted by storms that occur at sea. To overcome this problem, the solar panel will fold inward and fall off on the floor during stormy weather and reopen during storm-free day.
Humidity and salty environment
Humidity and salt can lead to short circuits and damage to the mechanical components of the PV modules and converters. PV panels should be resistant to corrosion and sea conditions like high humidity and a salty environment. Extra glass sheet or toughened safety glass on solar cells have to use to avoid degradation from moisture infiltration and to protect solar modules. Antirust coatings or galvanizing on metal exteriors can protect for short circuits and damage to the mechanical components.
Benefits of solar PV on marine vessel
Installing PV systems on ships involves various benefits, shown in Figure 13.
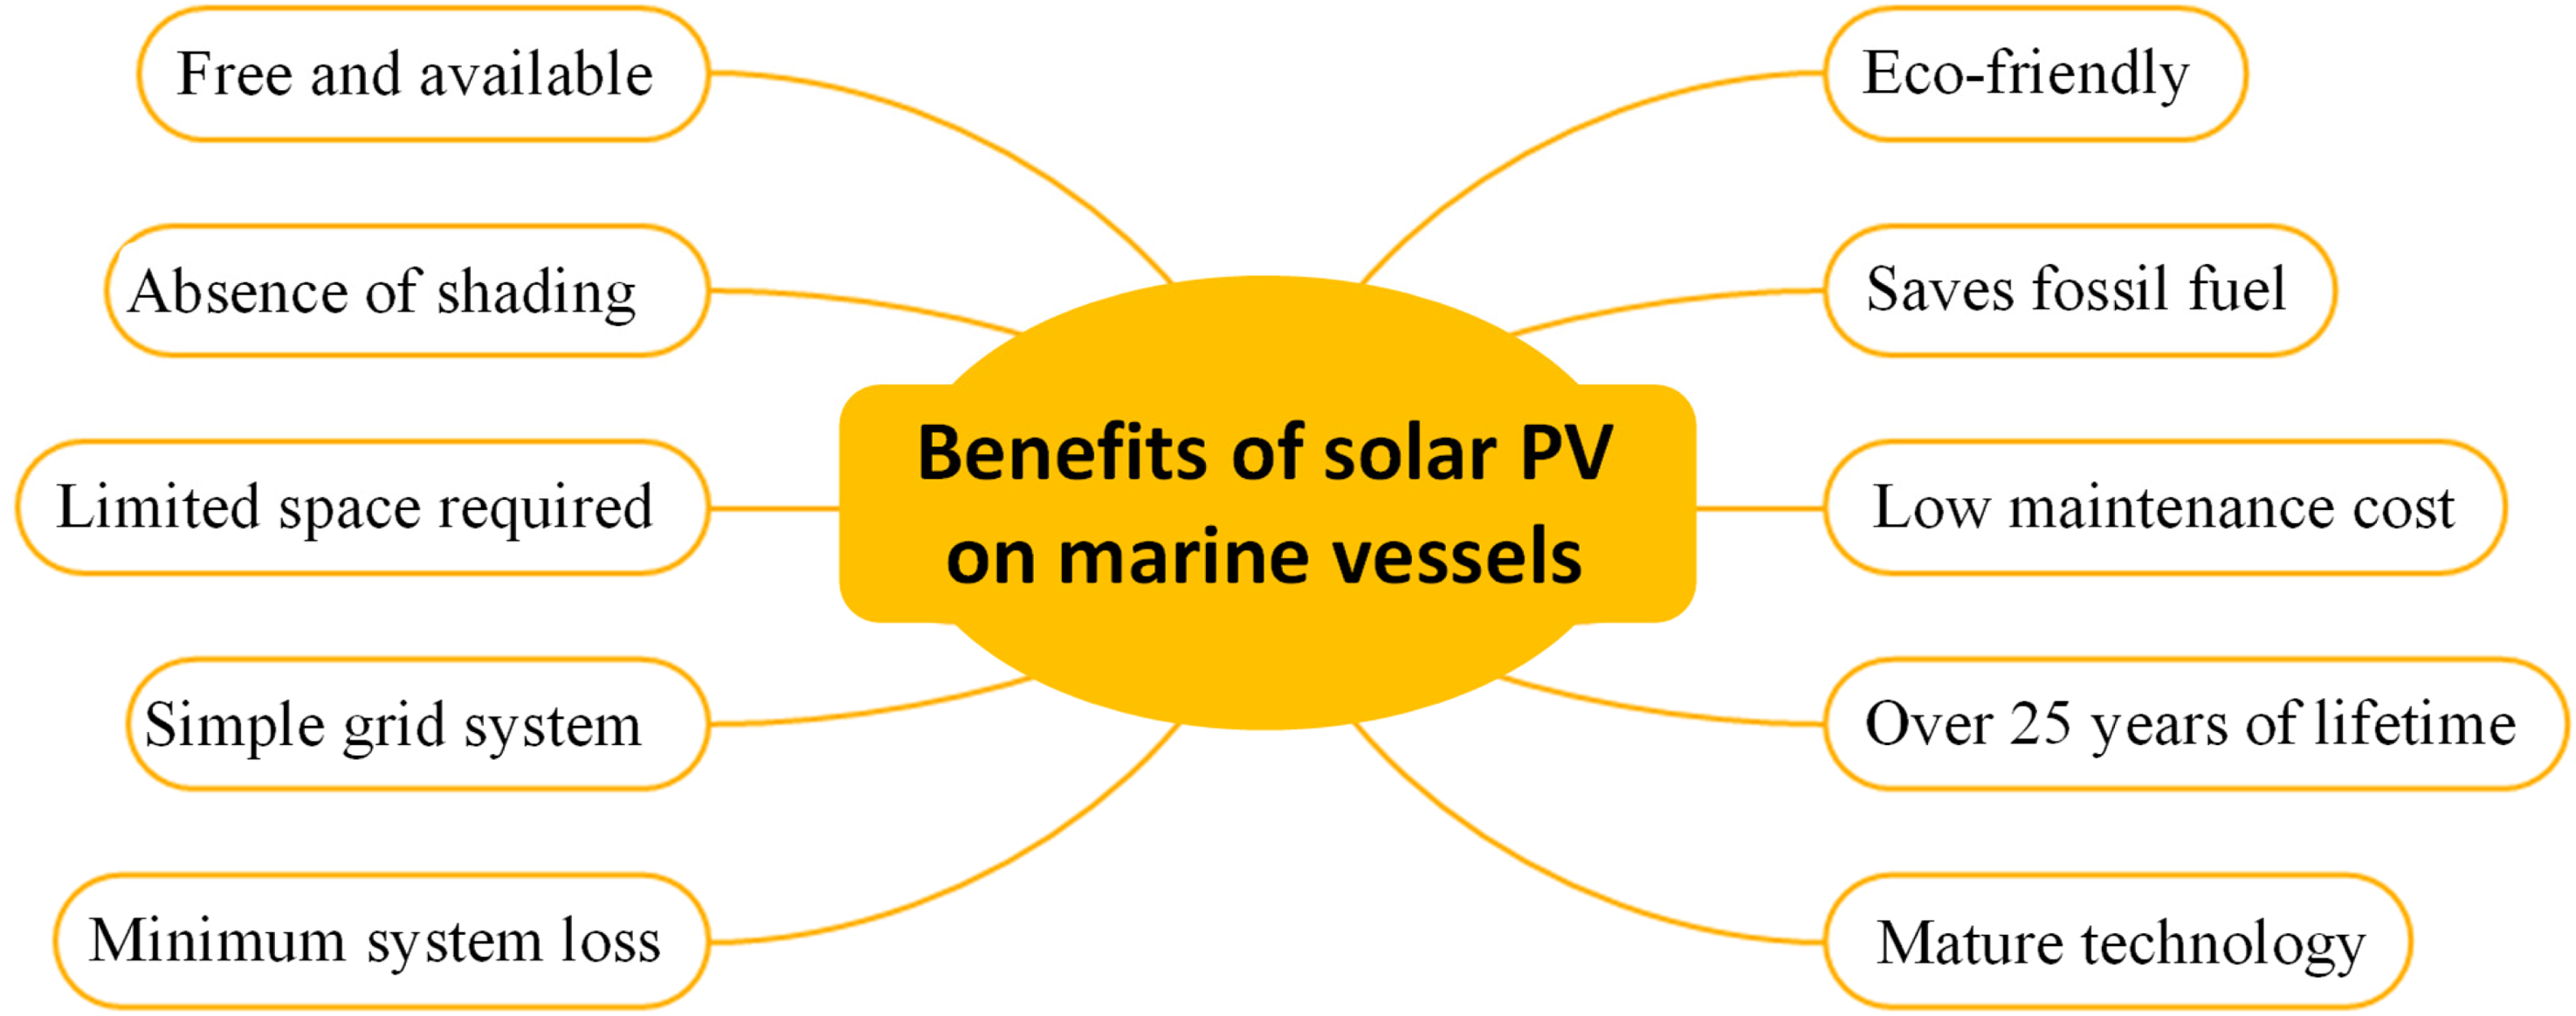
Benefits of solar PV on marine vessels.
Free and available
Solar energy is freely available. Solar PV's only requirement is the sun, which may utilize for nothing.
Absence of shading
In marine applications, there have no solar panels shading due to nearby high-rise buildings and trees, whereas shadowing can be reduced more in land PV systems.
Limited space required
Compared to PV systems installed on land, ship-mounted PV systems have limited space. It should be in a manageable location to make maintenance tasks simple.
Simple grid system
Terrestrial power systems need a complex grid, whereas ship's power system needs a simple grid system.
Low system loss
The distance between generators and consumers in a ship's electrical system is minimal, compared to a number of kilometers in a land power system. Hence system loss is low.
Mature technology
There is a widespread misperception that solar energy is less potent than the conventional energy sources we use today. This is untrue. Actually, over time, solar energy has changed. Today, it has established itself as a potent rival to conventional nonrenewable energy in terms of price and power. Solar energy will do miracles for society as long as selecting the proper panels that can provide vessel's needs for electricity. Besides, PV tower will be installed in such a way that before extreme storm conditions, it can be easily removed from PV tower and placed into a safe place.
Over 25 years of lifetime
The ability to create own electricity without having to pay for fuel is probably the most significant benefit of solar panels. Solar power is more cost-effective in the long run because it helps to save money on fuel, despite the hefty initial installation cost. Once a PV system is installed, it has operated for over 25 years.
Low maintenance cost
PV systems require low maintenance cost. After installing solar panels, the owner of ship would not need to make any additional purchases. It will make significant financial savings compared to running vessels on fuels. It will ultimately simply have to pay very low maintenance fees.
Saves fossil fuel
The first is that solar panels enable the ship to make long-term fuel savings. To use lights and other appliances aboard a ship without solar panels, it must keep the generator running. Unfortunately, it needs fossil fuels, which may be very expensive and limited, to keep generator going all day. PV system on marine vessels will reduce and supplement the need for fossil fuels (i.e. diesel, coal, or gas) powered electricity generation.
Eco-friendly
Solar PV system on marine vessels produce green, clean, and eco-friendly energy that does not emit GHGs. Also, for those who care about the environment, solar panels are the greatest choice. Solar panels on marine vessels create no carbon, thus the electricity they produce does not harm the environment. As a result, marine vessel may enjoy the best electricity while also resting easy knowing that are contributing to global environmental preservation. Sailors have the unique opportunity to observe pollution as it currently affects the entire world. Utilizing solar power could be the small part in helping to end global warming.
Conclusions
The fast depletion of fossil fuel supplies has pushed the use of solar energy technologies worldwide. A novel-inspired design “tower rounded flower-shaped solar PV” architecture is invented to the setting up of the solar panels on the passenger ship. It is planned to construct a strong framework around the ship's upper level in order to accomplish this.
In this research, we suggest a high-performance AC module-based method for installing solar panels on ships that has an efficiency of more than 22% and is based on N-type heterojunction (HJT) cells. Because the AC module-based micro inverters solar system architecture is significantly more reliable than the traditional solar system technology. In the Bay of Bengal region, solar panels must be installed with an average tilt inclination of 15.2° from horizontal. Solar panels must be positioned at the appropriate tilt angles of 15.2°, 0.2°, 15.2°, and 30.2° in the spring, summer, fall, and winter in order to capture the greatest solar irradiation.
A total of 17 ships were selected for the energy calculation and the total area calculated of all passenger vessels’ roof is 6864 m2. A total of 3432 m2 of ship's roof is being examined for the installation of solar panels, or about 50% of the total area. This will create 1240 MWh of power yearly and save around 325.56 tons of CO2 from being released into the environment.
Due to rising fuel costs, inadequate resources, and environmental concerns, it may no longer be possible for maritime vessels to generate electricity using conventional diesel oil sources. Installing flower-shaped solar PV tower on marine vessels would be the future generation's marine vessels’ electricity sources and could improve environmental sustainability.
Supplemental Material
Footnotes
Acknowledgements
The researchers would like to thank the Bangladesh Shipping Corporation (BSC), Ministry of Défense of the Government of Bangladesh, Bangladesh Meteorological Department (BMD), National Renewable Energy Laboratory (NREL), British Petroleum (BP), Renewable Energy Policy Network for the 21st Century (REN21), and vesselfinder, who cordially provided the data of Bay of Bengal.
Author contributions
M.A.-A.-M. designed, conceptualized, and drafted the original manuscript; planned the documents; involved in the literature review, software, mapping; contributed to data collection and extraction; analysis, interpretation of the analysis. M.R.A made the animation. M.A.-A.-M., A.R.M.T.I., and E.A. conducted the internal review and proofreading during the manuscript drafting stage. A.R.M.T.I. is responsible for supervision. All authors have read and agreed to the published version of the manuscript.
Declaration of conflicting interests
The author(s) declared no potential conflicts of interest with respect to the research, authorship, and/or publication of this article.
Funding
The author(s) received no financial support for the research, authorship, and/or publication of this article.
Supplemental material
Supplemental material for this article is available online.
References
Supplementary Material
Please find the following supplemental material available below.
For Open Access articles published under a Creative Commons License, all supplemental material carries the same license as the article it is associated with.
For non-Open Access articles published, all supplemental material carries a non-exclusive license, and permission requests for re-use of supplemental material or any part of supplemental material shall be sent directly to the copyright owner as specified in the copyright notice associated with the article.