
Abstract
Lacustrine shale oil has the potential to lead the development of China's oil and gas industry. By integrating scanning electron microscopy, low-temperature CO2 and N2 adsorption, high-pressure mercury intrusion, and nuclear magnetic resonance with centrifugation at different speeds, the pore system and pore fluid distribution of Da’anzhai Member lacustrine shale in the Sichuan Basin are studied. The results show that: (1) The reservoir space is mainly inorganic pores and micro-fractures. Nano-micron scale pores are commonly found and widely distributed in the Da’anzhai shale with multiple peaks of 28 nm, 200 nm, 900 nm, and 3.5 µm. The total pore volume ranges from 0.00849 to 0.02808 cm³/g, and the pores ranging from 100 nm to 1000 nm are the main contributors to total pore volume. (2) Pore fluid can be divided into movable oil, bound oil, and adsorption oil. The proportion of movable oil, bound oil, and adsorbed oil is 21.4%, 12.4%, and 66.2% in Da’anzhai shale, respectively. Movable oil mainly occurs in pores larger than 350 nm, bound oil is 30–350 nm, while adsorbed oil mainly exists in pores below 30 nm. (3) The higher the total organic carbon content and clay minerals content, the smaller the pore size, resulting in the low content of movable oil. The higher the content of brittle minerals such as quartz, the better the development of intergranular pores and microfractures, and the higher the content of movable oil. Through the grading evaluation of shale pore structure and pore fluid, it is conducive to guide the exploration and development of Da’anzhai shale oil, which has important theoretical and practical significance.
Introduction
Shale oil refers to the oil resources in the organic-rich shale strata that are free, miscible with kerogen, or adsorbed in the pores, microfracture, and thin interbeds of non-source rock in the shale strata (Hu et al., 2020; Yang and Zou 2019; Zhao et al., 2020). The achievements of the U.S. shale oil revolution indicate that shale oil is expected to become an important alternative energy source in the future (Sonnenberg and Pramudito, 2009). The lacustrine shale in China is widely distributed, including the Junggar Basin, Santanghu Basin and Qaidam Basin in Western China, Songliao Basin and Bohai Bay Basin in Eastern China, and Ordos Basin in Central China, and Sichuan Basin. The developed strata include Permian, Paleogene, and Jurassic (Kuang et al., 2012; Zou et al., 2013; Wu et al., 2016; Wu et al., 2019; Ma et al., 2020a; Ma et al., 2020b). Recently, commercial production of shale oil has been obtained in the Bohai Bay Basin, Songliao Basin, and Sichuan Basin, fully proving the huge resource potential of shale oil in China (Li et al., 2016). Shale oil in China is mainly lacustrine shale, which is characterized by lower maturity, higher density and viscosity, poor fluidity, and greater difficulty in exploitation compared with marine shale oil of North America, which has large exploration and development potential. Thus, it is of great significance to study pore system and mobility of lacustrine shale oil for exploration and development.
In recent years, some scholars have studied a lot of work on pore structure and occurrence state of pore fluid and realized that pore structure controls the accumulation and migration of shale oil and gas (Zhang et al., 2017; Ning et al., 2020). Lu et al. (2018) believed that pore size reflects the properties of shale reservoirs, based on high-pressure mercury intrusion (MICP) and fractal theory, they divided the oil shale pores into large pore-throats (>1000 nm), medium pore-throats (100–1000 nm), small pore-throats (25–100 nm) and microscopic pore-throats (<25 nm). Li et al. (2018) used nuclear magnetic resonance (NMR) T1–T2 technology to divide shale oil into free oil and adsorbed oil, and they recognized that the fluid types present in different pore spaces are obviously different. Ross and Bustin (2009) proposed that microfractures are the main seepage channels for shale oil, but the micropores related to organic matter and clay minerals have a strong adsorption effect on shale oil, which is not conducive to shale oil flow. Zhang et al. (2017) concluded that microfractures are the main storage space and migration channel of Chang 7 shale oil. High total organic carbon content (TOC) and brittle mineral content are conducive to the formation and preservation of pores and fractures in shale and control the flow of shale oil. Ning et al. (2017) clarified the pore types, characteristics, and controlling factors of lacustrine shale and classified the pores according to pore size. On this basis, shale pore structure directly controls the fluidity of shale oil was proposed (Ning et al., 2020). Thus, it can be seen that shale pore structure directly controls the fluidity of shale oil (Ning et al., 2020). Although previous studies have classified pores with different pore sizes, they have not considered the flow characteristics of fluid in the pores, and the classification criteria cannot be used to guide the establishment of the seepage mechanism of shale oil in the pore-fracture system. In addition, relevant studies show that shale is dense and heterogeneous, and pore connectivity is strongly affected by sample size (Fu et al., 2019b), which influences the fluidity of shale oil. At present, shale oil exploitation mainly applies large-scale hydraulic pressure technology to increase production. Therefore, the study of pore fluid fluidity using samples of different scales is more helpful to improve the recovery of shale oil.
In this study, based on argon ion polishing scanning electron microscopy (SEM), low-temperature N2 and CO2 adsorption, MICP, the pore structure characteristics of Da’anzhai lacustrine shale were determined. Subsequently, high-speed centrifugation experiments and gradual drying experiments based on NMR of plug samples and crushed samples were carried out to test the fluidity of shale oil and clarify the occurrence characteristics of shale oil in various pores.
Geological setting
The Sichuan Basin is located in western China and is an important petroliferous basin in China. Affected by the late Indosinian movement during Late Triassic, the Sichuan Basin is dominated by freshwater lacustrine environment during the deposition of Ziliujing Formation (He et al., 2020; Xu et al., 2017). The Ziliujing Formation is divided into Zhenzhuchong Member, Dongyuemiao Member, Maanshan Member, and Da’anzhai Member from bottom to top (Figure 1). Among these members, the lacustrine environment of Da’anzhai Member is characterized by the largest distribution and the deepest depth in the Sichuan Basin triggered by several lacustrine transgressions (He et al., 2020; Xu et al., 2017). Its lithology is mainly black shell limestone, shell mudstone, and black mud shale interbedded. Da’anzhai shale is regarded as the most potential exploration and development target of lacustrine shale oil in Sichuan Basin (He et al., 2020; Xu et al., 2017).
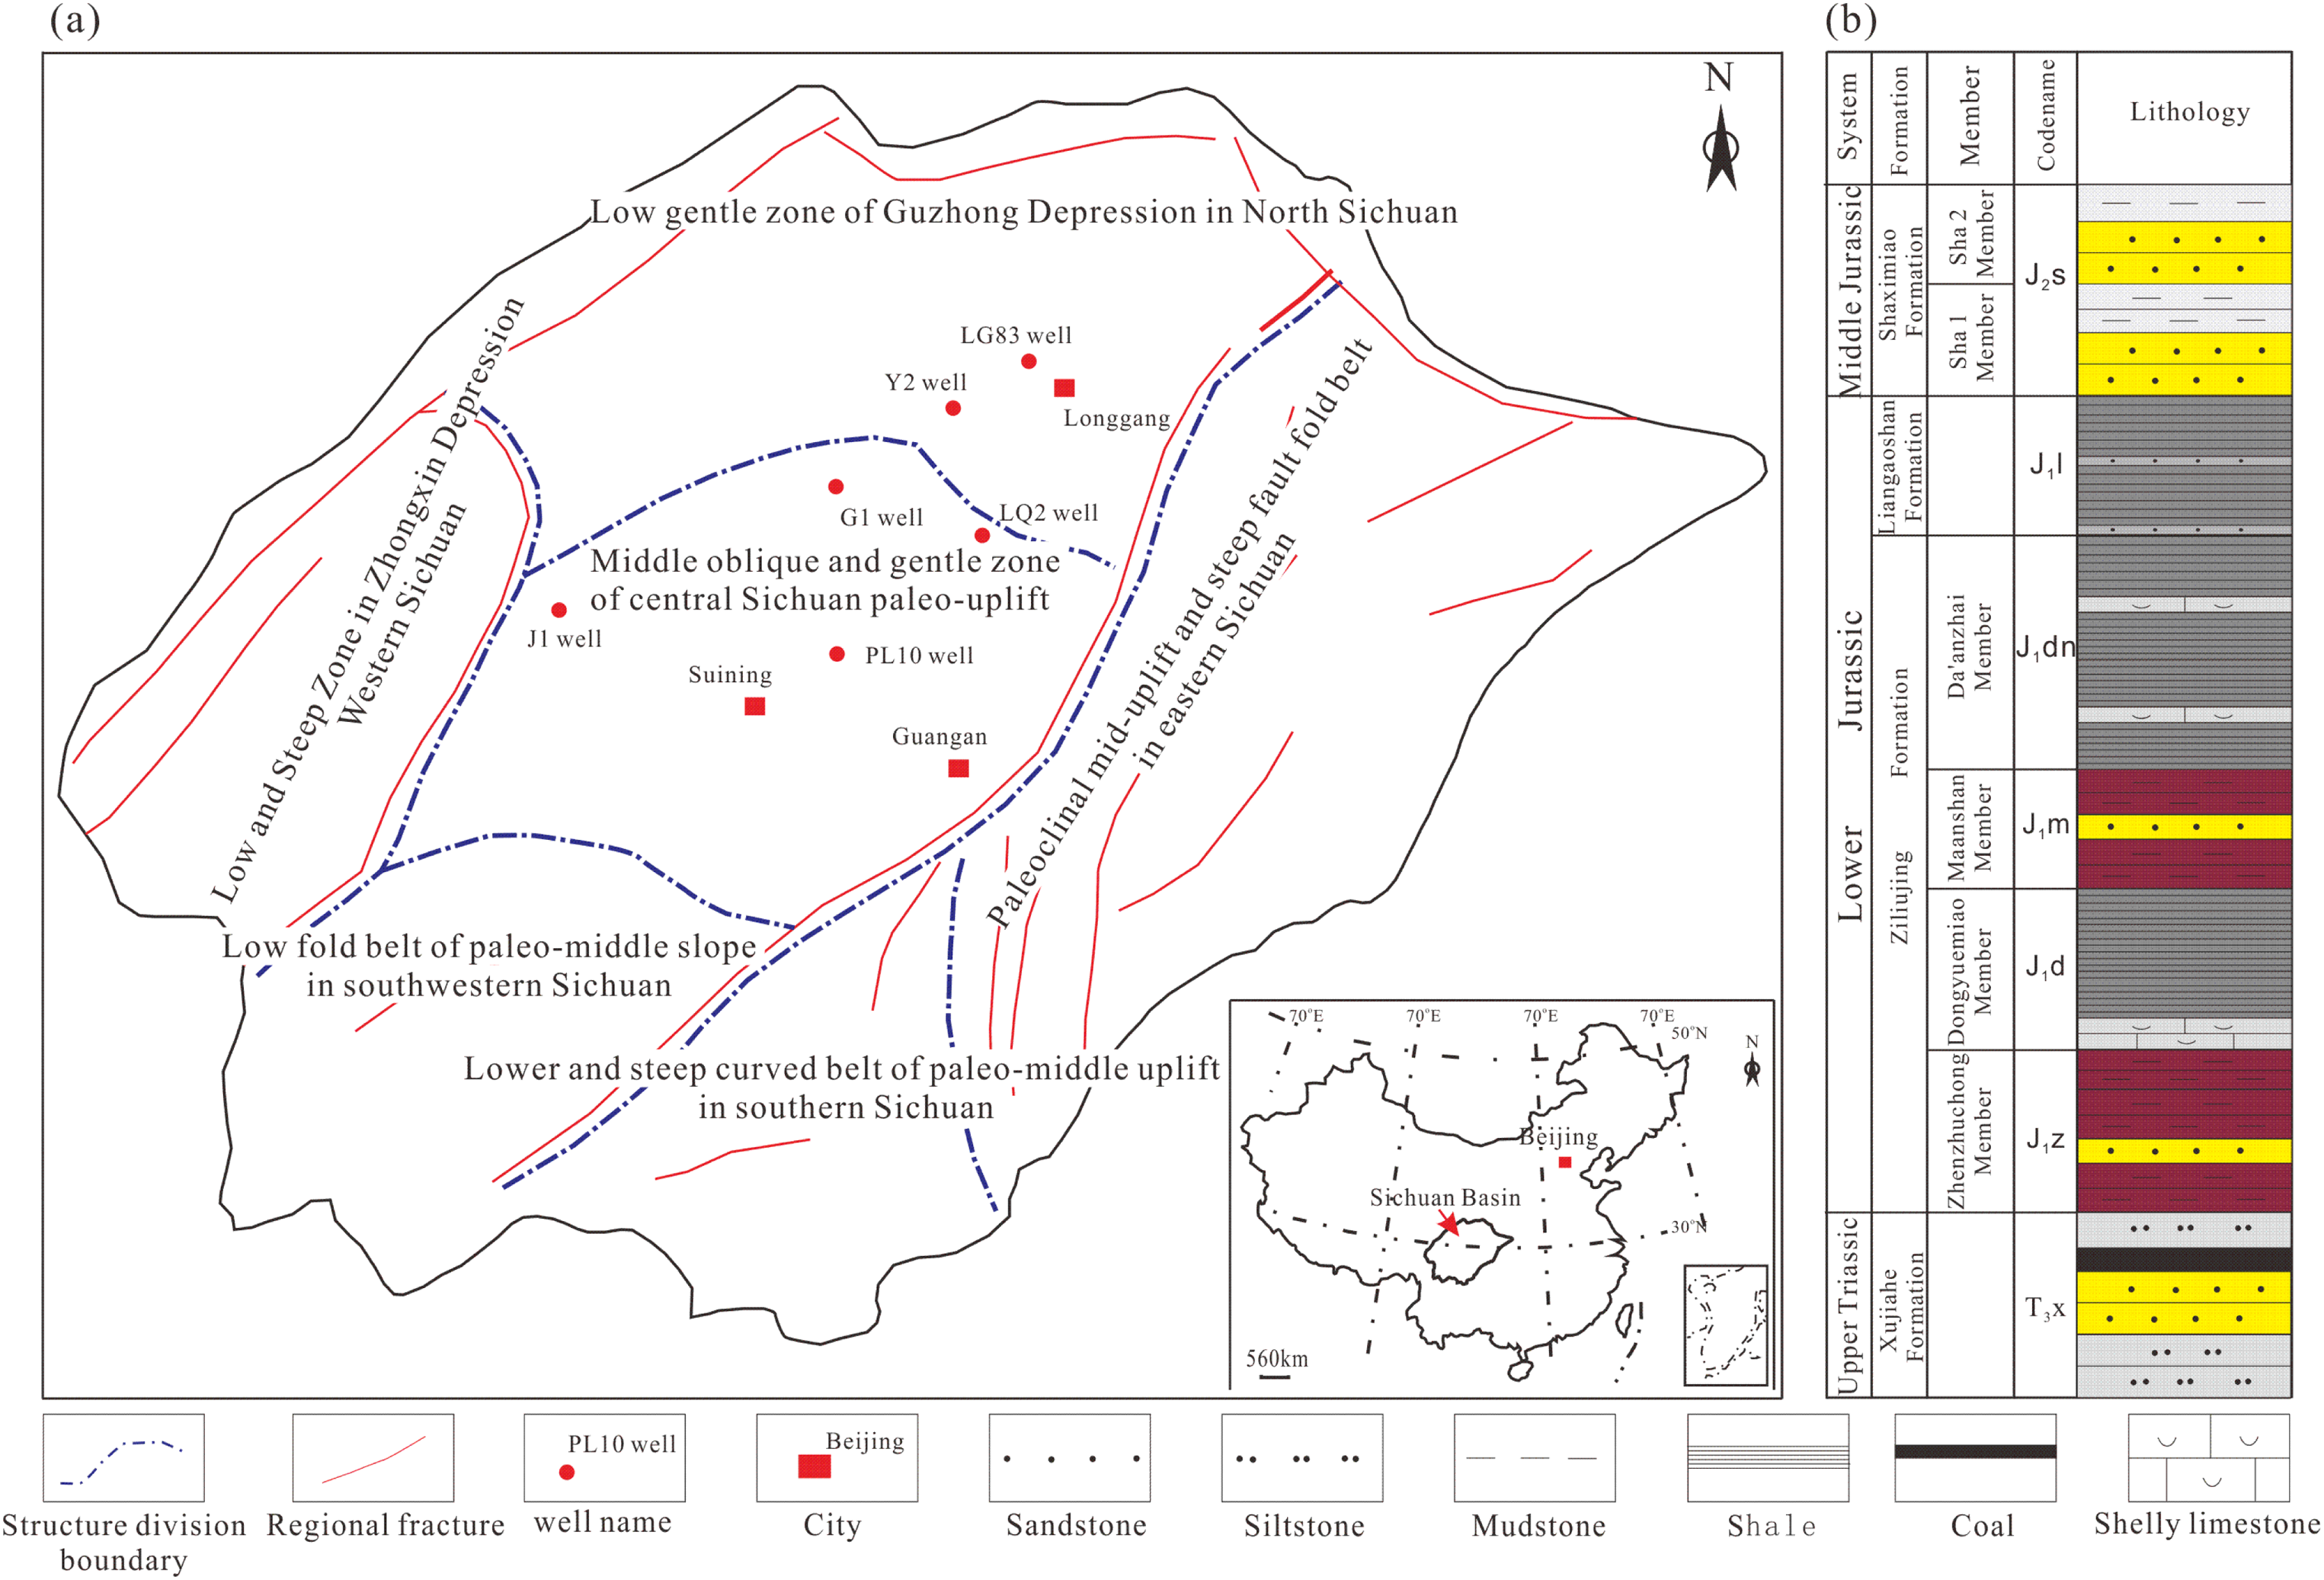
Geological background map and stratigraphic histogram of the study area.
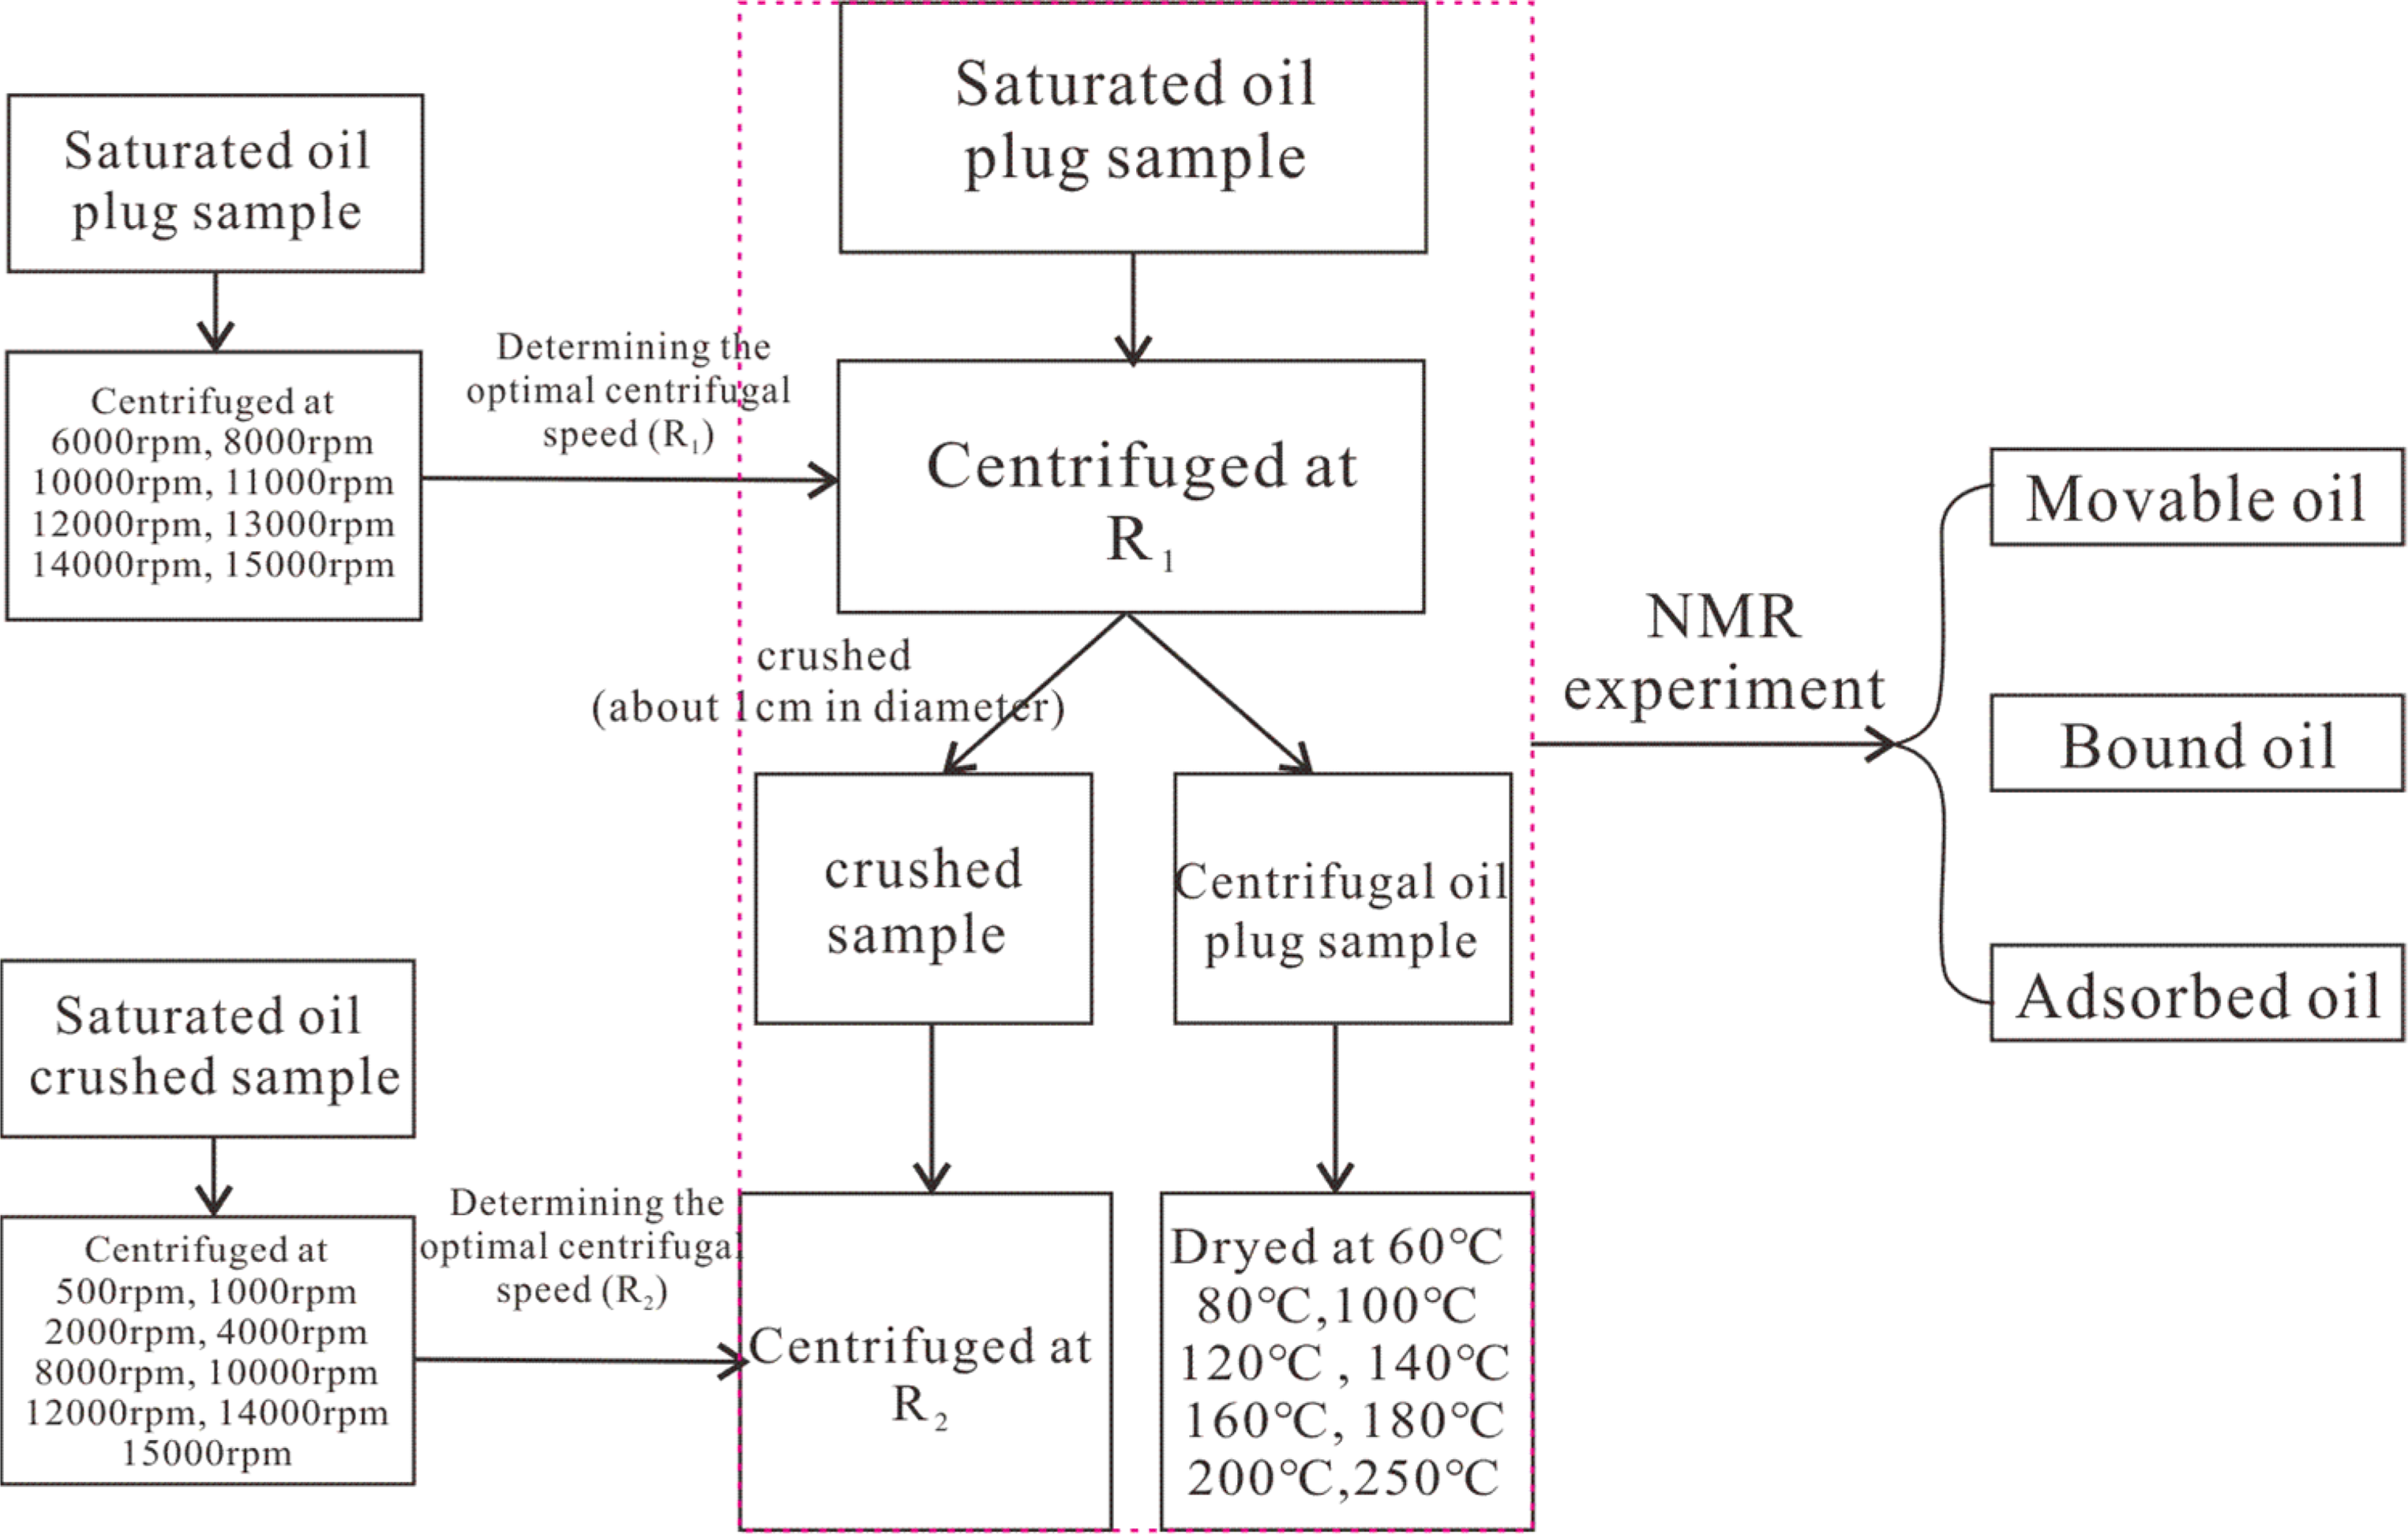
Experimental test flow.
Sample and methods
Sample information
Eight core lacustrine shale samples from the Jurassic Da’anzhai Member in Sichuan Basin, SW China were collected for analyses of pore structure and pore fluid behavior (Figure 1). Their well name, depth, and sample number are listed in Table 1. The samples in this study were all subjected to TOC, X-ray diffraction (XRD), argon ion polishing SEM, CO2 adsorption, N2 adsorption, MICP, NMR and centrifugal experiments. Among them, SEM, CO2 and N2 adsorption, MICP were used to obtain the pore structure characteristics, and NMR under different treatment conditions was used to characterize the pore fluid behavior.
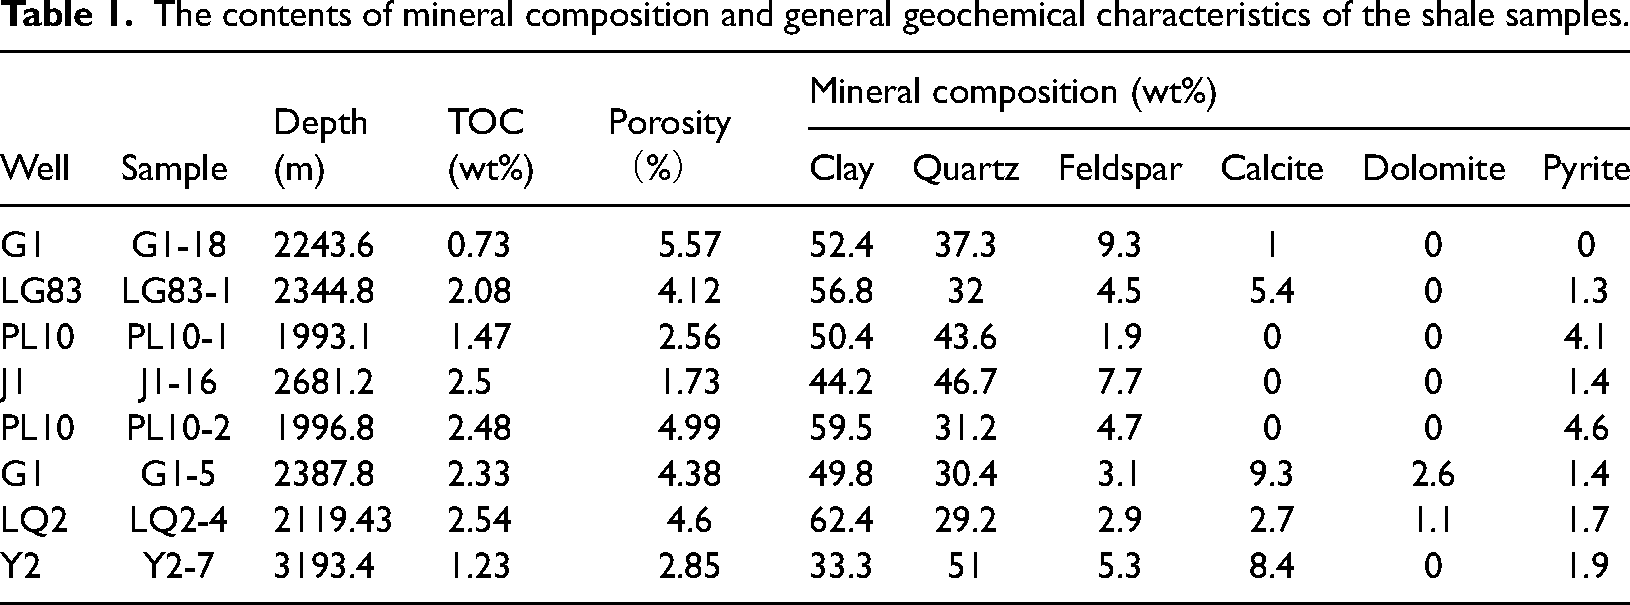
The contents of mineral composition and general geochemical characteristics of the shale samples.
Experimental methods
TOC and mineral composition
The samples were crushed to <100 mesh and weighed 3 g. Then the samples were reacted with acid for 24 h to remove carbonate components and dried at 100°C for 24 h prepared for TOC test. TOC contents were measured using a Var10EL-III Elemental Analyzer.
Mineral composition analysis was carried out using shale powder less than 200 mesh. Mineral composition content was obtained using the Rigaku XRD Rigaku Ultima IV made in Japan.
Scanning electron microscopy
The argon ion polishing SEM was conducted with FEI Quanta 650 FEG scanning electron microscope made in American. Firstly, the samples were made into a cube of 20 mm×20 mm×10 mm, and then mechanically polished with sandpaper ranging from 600 to 4000 mesh. Argon ion polishing was performed to obtain a smoother surface to improve the observation efficiency of nanopores. Finally, the polishing samples were sprayed with gold for a short time to increase the conductivity of the sample and improve the resolution of the scanning electron microscope image observation.
Low-temperature N2 and CO2 adsorption
CO2 and N2 adsorption were measured using a micromeritics ASAP 2460 gas adsorber made by American Mike company. The shale samples were crushed into grains of 60–80 mesh size (180–250 µm) firstly, dried in an oven at 110°C for more than 24 h, and then degassed under high vacuum (<10 mmHg) for 12 h at 110°C in the apparatus to remove residual moisture. The N2 bath temperature was set to be −196°C (77.15 K) and CO2 adsorption experiments were carried out at 0°C with high-purity CO2. Finally, since Density Function Theory model (DFT) can obtain more information about shale pores than BJH model (Chen et al., 2021b), the N2 adsorption data collected on crushed samples were interpreted using the DFT model for mesopore surface areas and volumes. And CO2 adsorption data collected on crushed samples were interpreted using DFT model for surface area and pore volume (PV) of micropores.
High-pressure mercury intrusion
Eight samples were prepared into 10–35 mesh size, and then dried in an oven at 60°C for more than 48 h to remove possible moisture in the samples (Testamanti and Rezaee, 2017), and then the samples were cooled to room temperature of about 25°C. MICP measurements were performed on eight shale samples using a micromeritics AutoPore IV, with automatic pressure mercury with a pressure up to 60,000 psi (414 MPa) from Micromeritics Instrument Corporation.
NMR and centrifuge experiment
Process the sample into a standard cylinder with a diameter of 2.5 cm and a length of about 3 cm, and then dry it at 110°C for 24 h to remove residual water in the sample. After 12 h of vacuum degassing, pressurize and saturate the dodecane. The saturation pressure is 25 MPa and the saturation time is two days. After saturation, the sample was taken out, and the NMR T2 spectrum was tested after standing in the saturated fluid for 12 h. The NMR experiment was completed with the NMR nanopore analyzer NMRC12–010V, which was designed and produced by Suzhou Niumag Company. The experiment temperature was kept at 30°C. The test parameters were as follows: TE was 0.055 ms, NECH was 12,000, NS was 64 times, TW was 4000 ms, and the saturated medium is dodecane. And the centrifuge experiment was performed using the LG-25M ultra-high-speed centrifuge produced by Sichuan Shuke Instrument Company, with a maximum speed of 21,000 rpm.
Firstly, the NMR transverse relaxation time (T2) spectral response characteristics of eight plug samples in a saturated dodecane state were detected to obtain the NMR T2 spectral peak distributions of different samples in a saturated oil state. Selected four samples and saturated the crushed samples with dodecane (about 1 cm in diameter), then centrifuged the plug samples and the crushed samples at different speeds from 500 rpm to 15,000 rpm, and the centrifugation time for each experiment was 30 min, the NMR T2 spectrum characteristics of the samples under different centrifugal conditions were tested. When the peak shape and NMR signal did not change, the fluid reduced in the plug sample was considered to be movable oil, and the centrifugal speed at this time was recorded as R1. The reduced fluid in the crushed sample was considered to be movable oil and bound oil, the speed was denoted as R2.
Secondly, after the centrifugal experiment, plug samples were dried at a temperature of 60°C, 80°C, 100°C, 120°C, 140°C, 160°C, 180°C, 200°C, and 250°C and then subjected to the NMR T2 spectrum (drying time is 24 h). As the drying temperature increased, the amount of sample NMR signal continues to decrease and stabilize after a certain temperature. The fluid lost during the drying process includes bound oil and adsorbed oil.
Thirdly, the horizontal plug samples of the samples were saturated with dodecane under the same conditions and centrifuged at R1 speed, then the samples were broken into particles with a diameter of about 1 cm and centrifuged at R2 speed. The centrifugation time was also 30 min, each process had been subjected to test, and then obtained the bound oil content.
All the samples were weighed and the NMR test parameters were the same to obtain the content of the fluid under different states in the same sample. According to the above steps, the following equation can be obtained to calculate the content of shale oil of different occurrence types in all samples:


Results
TOC content and mineral composition
The TOC of all samples has a large gap, ranging from 0.73 wt% to 2.54 wt %, with an average of 1.92 wt% (Table 1). According to previous studies, the organic matter type of Da’anzhai shale is mainly type II, and the organic macerals are mainly sapropelite, the vitrinite reflectance (Ro) is 0.8%–1.4%, which indicates it has high oil-generating ability (Xu et al., 2017).
X-ray diffraction results show that the lacustrine shale in the Da’anzhai Member of the Sichuan Basin is dominated by clay minerals, with an average of 52.35% (ranging from 33.3% to 62.4%), followed by quartz, which is distributed at 29.2%–51%, with an average of 36.43% (Table 1). The remaining minerals are mainly feldspar, calcite, dolomite, and pyrite.
Pore morphology
On the microscopic scale, different scholars have classified shale pores according to various factors such as pore size, genesis, wettability, and occurrence structure (Loucks et al., 2012; Lu et al., 2018; Loucks and Reed, 2014). Loucks et al. (2012) has divided shale pores into organic pores (OMP), intergranular pores (Inter P) and intraparticle pores (Intra P) according to the development location and morphology of shale pores. Based on the systematic classification scheme of the scholars, they are simply divided into organic pores, inorganic pores, and microfractures.
Generally, OMPs are considered to be an important space for shale oil storage. SEM images show that organic matter in Da’anzhai Member shale mainly exists in two forms. One is depositional organic matter (kerogen), which is clumpy or has a specific structure (Figure 3(a)). The other type is migrant organic matter, which is formed by the migration of original OM into the mineral inter P during hydrocarbon generation. Therefore, it has no specific shape, and autogenic minerals can also be seen in migratory organic matter. The development degree of OMP in Da’anzhai shale is quite different. The OMP includes bubble-like organic pores developed in migrated organic matter ranging between 50 nm and 800 nm (Figure 3(b)), isolated irregular OMP (Figure 3(c)) and deformed organic pores sporadically developed in depositional organic matter (Figure 3(d)). In addition, the lacustrine shale also develops framboidal pyrite similar to marine shale, and the intercrystalline pores of pyrite are filled by OM with a large number of OMP (Figure 3(e)). Samples G1–5 and LG83–1 have a slightly higher degree of OMP development, while bubble-like OMP is relatively more developed. The OMP of samples G1–18 and PL10–2 are mainly isolated, and the other samples are less developed.
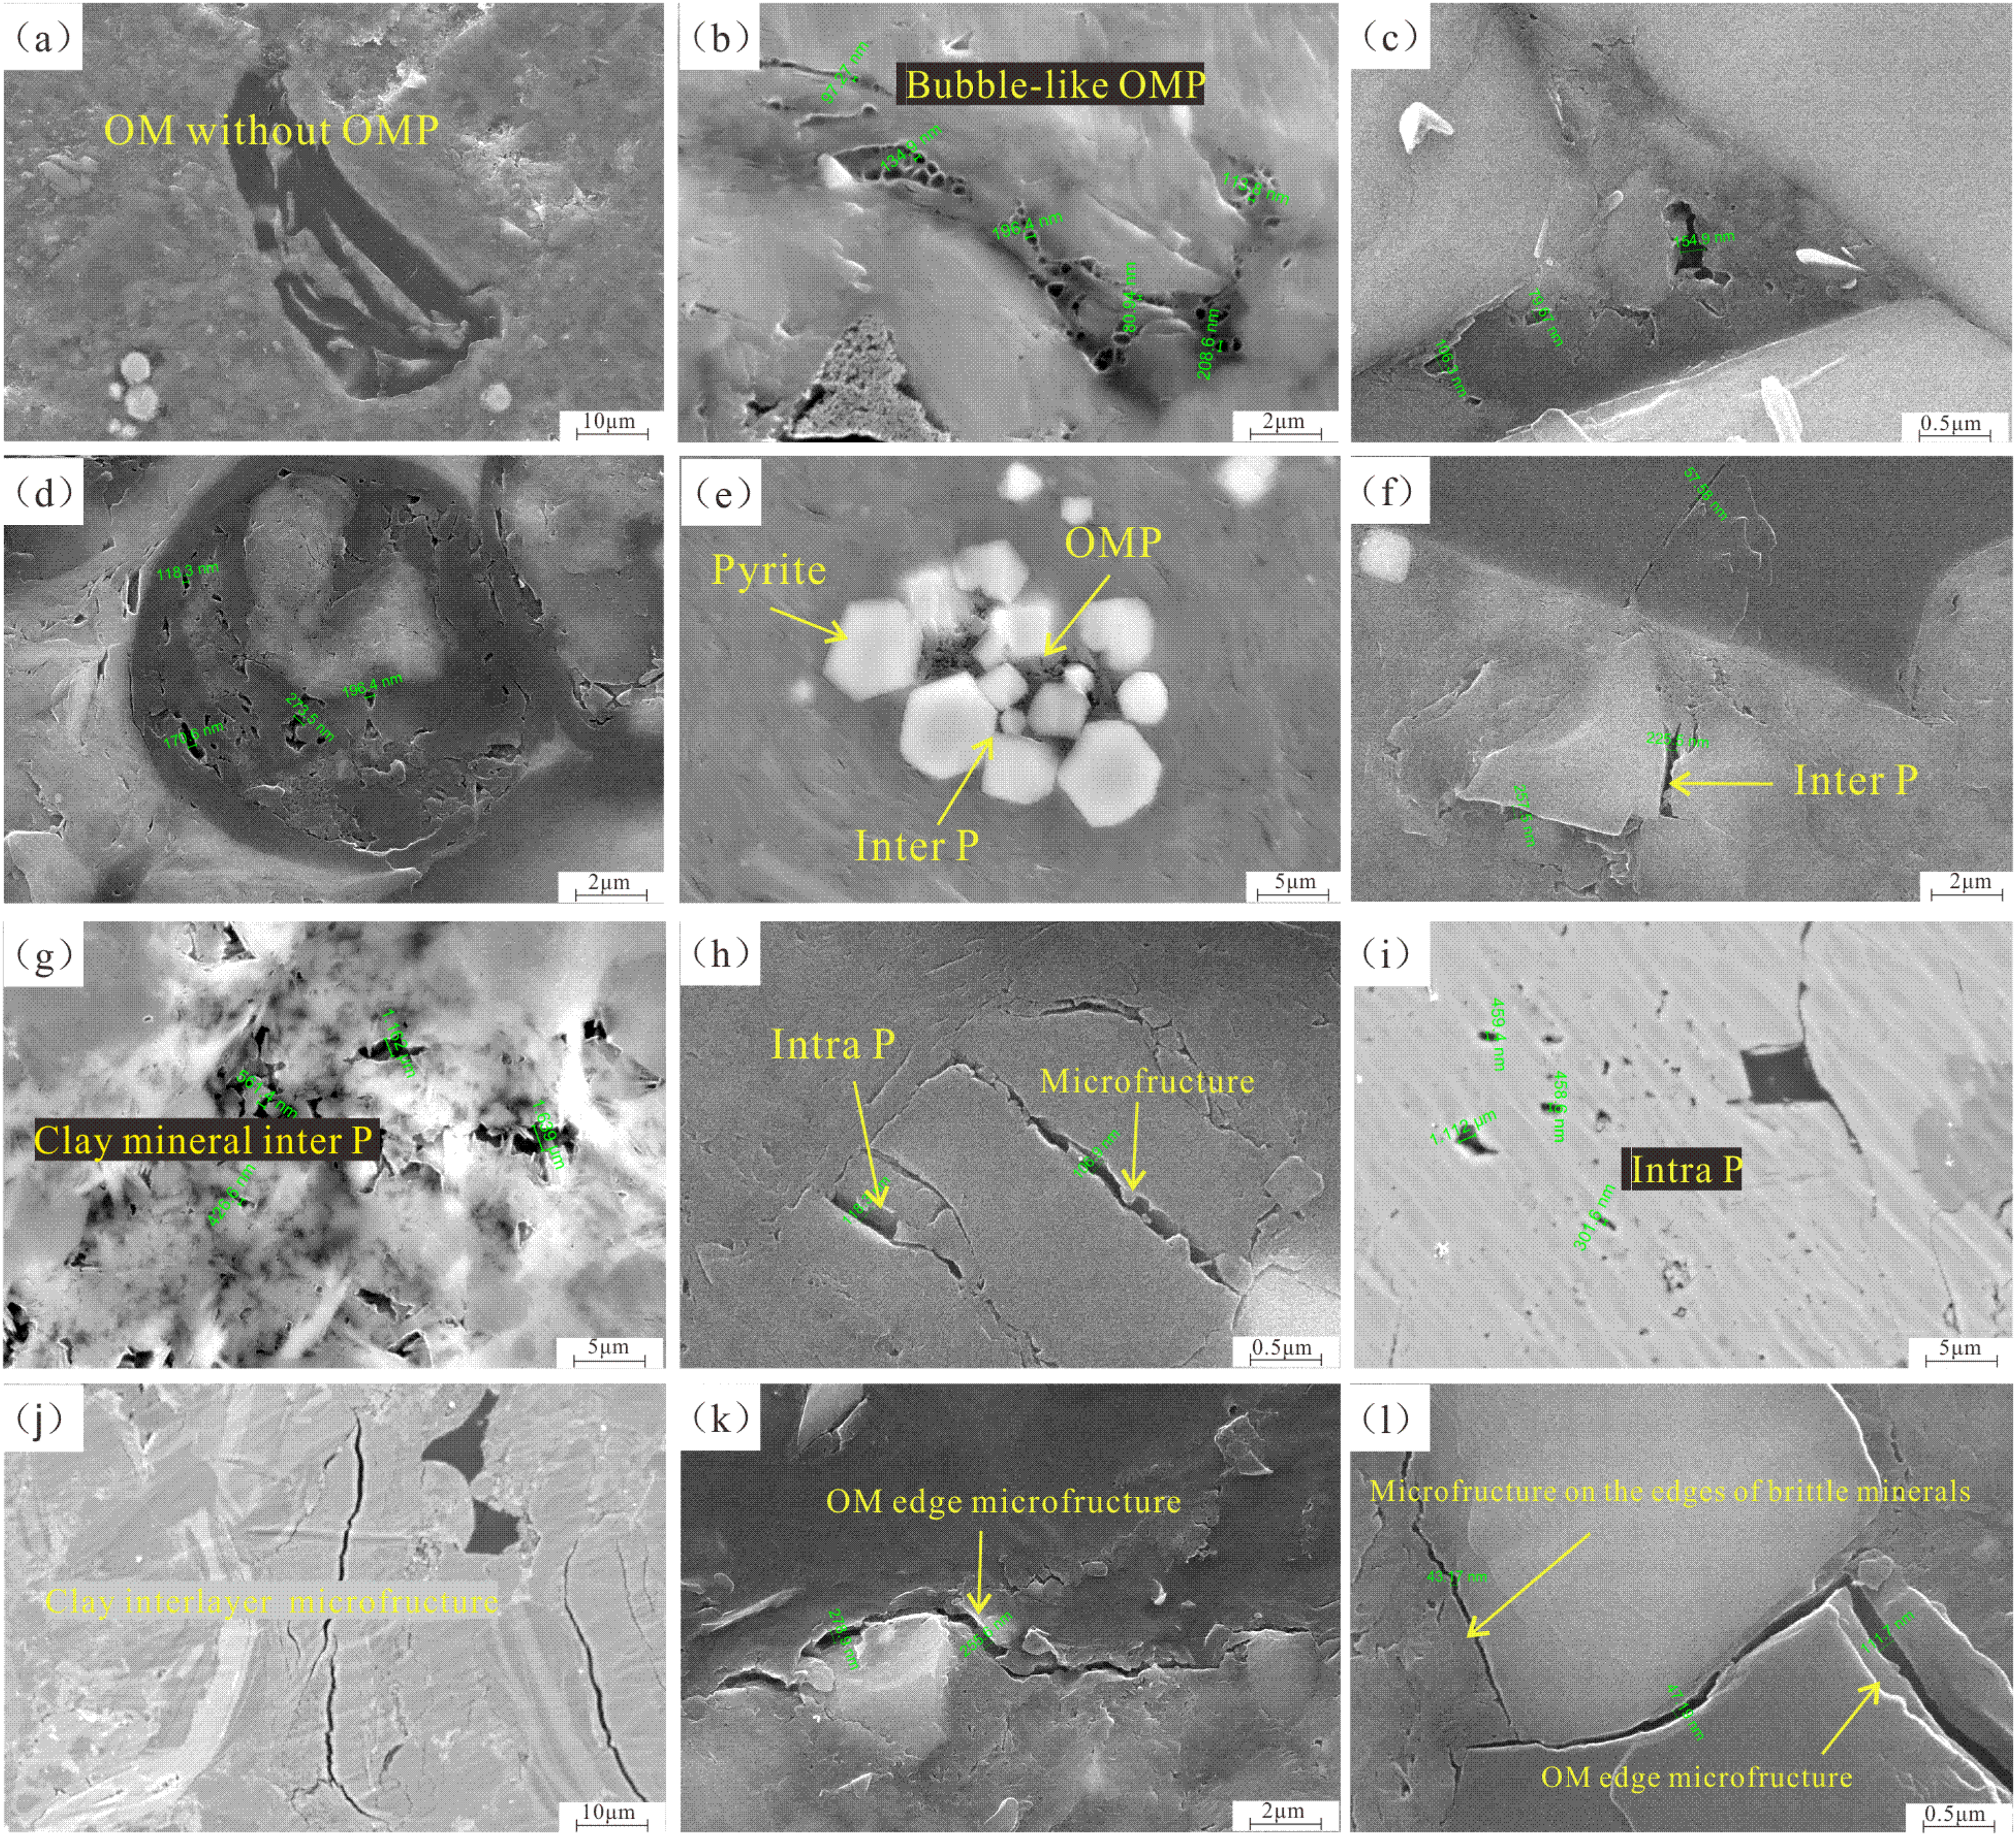
Pore characteristics of shale reservoir in Da’anzhai member under scanning electron microscopy (SEM).
Inorganic pores mainly include Inter P (Figure 3(f)–(g)), Intra P (Figure 3(h)–(i)) and intercrystalline pores (Figure 3(e)). The Inter P includes the pores formed by the accumulation of brittle minerals and contraction of clay minerals, which are polygonal or slender slit. The clay mineral pores are the main inorganic pores in Da’anzhai shale. Intra P is common in most samples, which are irregular, oval or square in shape. The pore size is generally larger, ranging between 200 and 1000 nm.
Microfractures are currently considered to be the main seepage channel for shale oil. The degree and type of microfractures have a positive effect on shale oil production (Zhang et al., 2017). According to their occurrence, it can be divided into microfractures between OM and minerals or in organic matter (OM-related microfractures, Figure 3(k)–(l)), and microfractures in inorganic minerals (mineral-related microfractures, Figure 3(h) and (j)). The former are mostly caused by the expansion and contraction of OM in the process of hydrocarbon generation. The latter is mainly caused by compaction or mineral conversion (Fu et al., 2019a). The microfractures of samples J1–16, PL10–1, LG83–1 and Y2–7 are highly developed, especially those existing among brittle minerals. OM-related microfractures are connected with brittle mineral-related microfractures in PL10–1 and J1–16 samples, which may be very beneficial to shale oil migration.
Pore characterization based on N2, CO2 adsorption, and MICP
Figure 4(a) shows the CO2 adsorption curves of eight organic shale samples. As the relative pressure increases, the quantity adsorbed exhibits great changes, ranging from 0.41 to 0.85 cm3/g. During the experiment, the amount of adsorption increases sharply, indicating that the micropores have extremely strong adsorption capacity, and infer that the oil molecules are adsorbed in the micropores. The micropore size distributions obtained by the DFT model show three or four peak values, from 0.5–0.72 nm, 0.72–1 nm, 1–1.5 nm, and 1.5–2 nm, respectively, which indicate more complex microporous characteristics in the Da’anzhai shale. And micropore volumes for the different samples are mainly contributed by pores with diameters of 1–2 nm (Figure 4(b)).
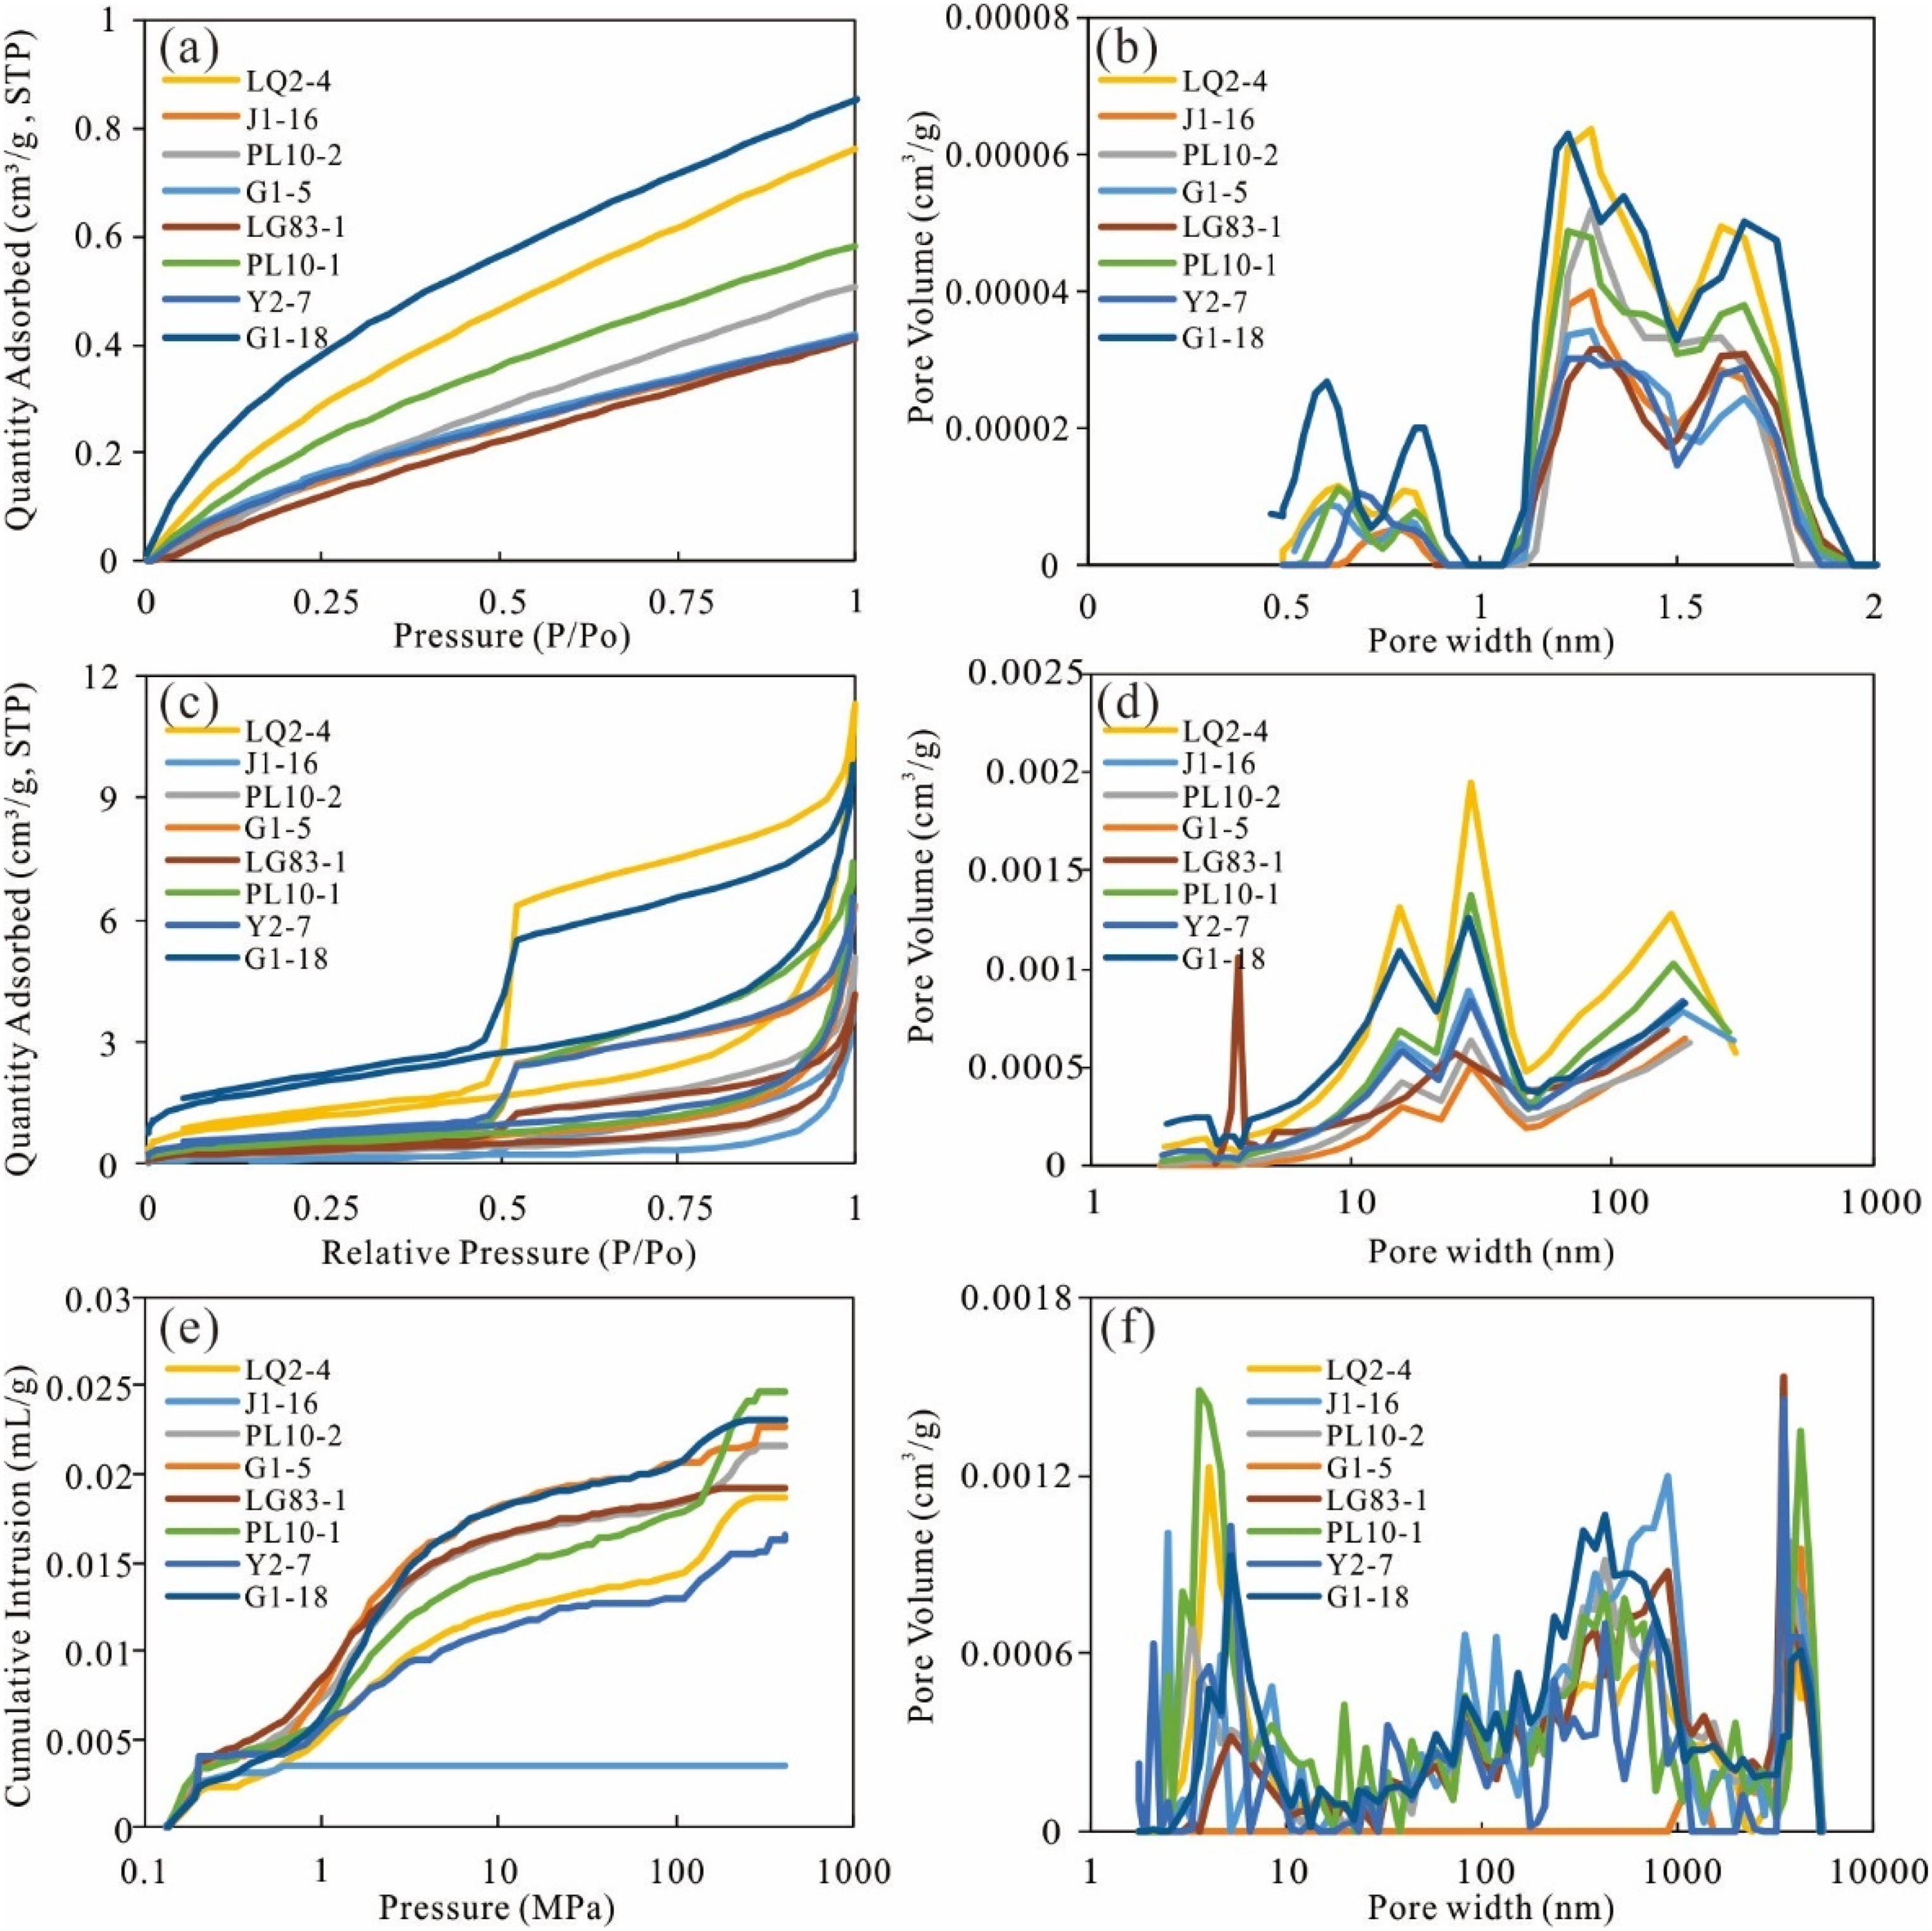
(a) CO2 adsorption isotherms. (b) Pore-size distributions from CO2 adsorption. (c) N2 adsorption-desorption isotherms. (d) Pore-size distributions from N2 adsorption. (e) Apparent cumulative intrusion curves. (f) Pore-size distributions from high-pressure mercury intrusion (MICP).
Figure 4(c) shows the low-temperature N2 adsorption–desorption curves for eight samples. The N2 adsorption isotherms are ascribed to Types II (Thommes et al., 2015), characterized by a reversed S-shape, and the gas exists in the form of multilayer adsorption in the mesopores. The adsorption–desorption curves of all samples exhibit distinct hysteresis loops in the relative pressure range of 0.45–0.95. According to the IUPAC classification, they appear as H2(a) and H4 types (only J1–16), indicating that the pore shapes are inkbottle and slit-like pores. Figure 4(d) shows that all samples have similar PV distributions with three peak values from 10–21 nm, 21–46 nm, and 46–200 nm, respectively, except sample LG83-1, which has three significant characteristic scopes ranging from 3–4.6 nm, 16–43.72 nm, and 95–200 nm, and 3–4.6 nm pores dominate.
The mercury intrusion curves acquired from the MICP on the eight Da’anzhai lacustrine shale samples are presented in Figure 4(e). Except for sample J1–16, the mercury injection curves of all samples have similar characteristics, but the maximum mercury injection amount is different, reflecting the different development degrees of mesopores and macropores. Sample PL10–1 shows the largest mercury intrusion volume of 0.025 ml/g, and the minimum mercury intrusion amount of J1–16 is 0.003 ml/g. According to the pore size distribution (PSD) curve obtained by MICP, it is suggested that each sample has multi-scale pores. Pores below 50 nm may suffer some damage due to high pressure. The result shows that all samples have similar PSDs with two peak values from 100–1000 nm and 1000–10,000 nm, respectively, except sample J1–16 (Figure 4(f)), which has only one peak at 1000–10,000 nm that may be caused by high TOC content and low clay mineral content.
NMR results under different treatment conditions
There is a positive correlation between T2 value and shale pore size, the larger the T2 value, the larger the pore size (Yao et al., 2010). When T2 value is greater than 10 ms, the NMR T2 spectrum represents the characteristics of macropores and microfracture in the sample (Li et al., 2017; Tan et al., 2015). We selected four typical samples (G1–18, LG83–1, PL10–1 and J1–16) to measure the NMR T2 spectra of different states at different centrifugation speeds and different drying temperatures.
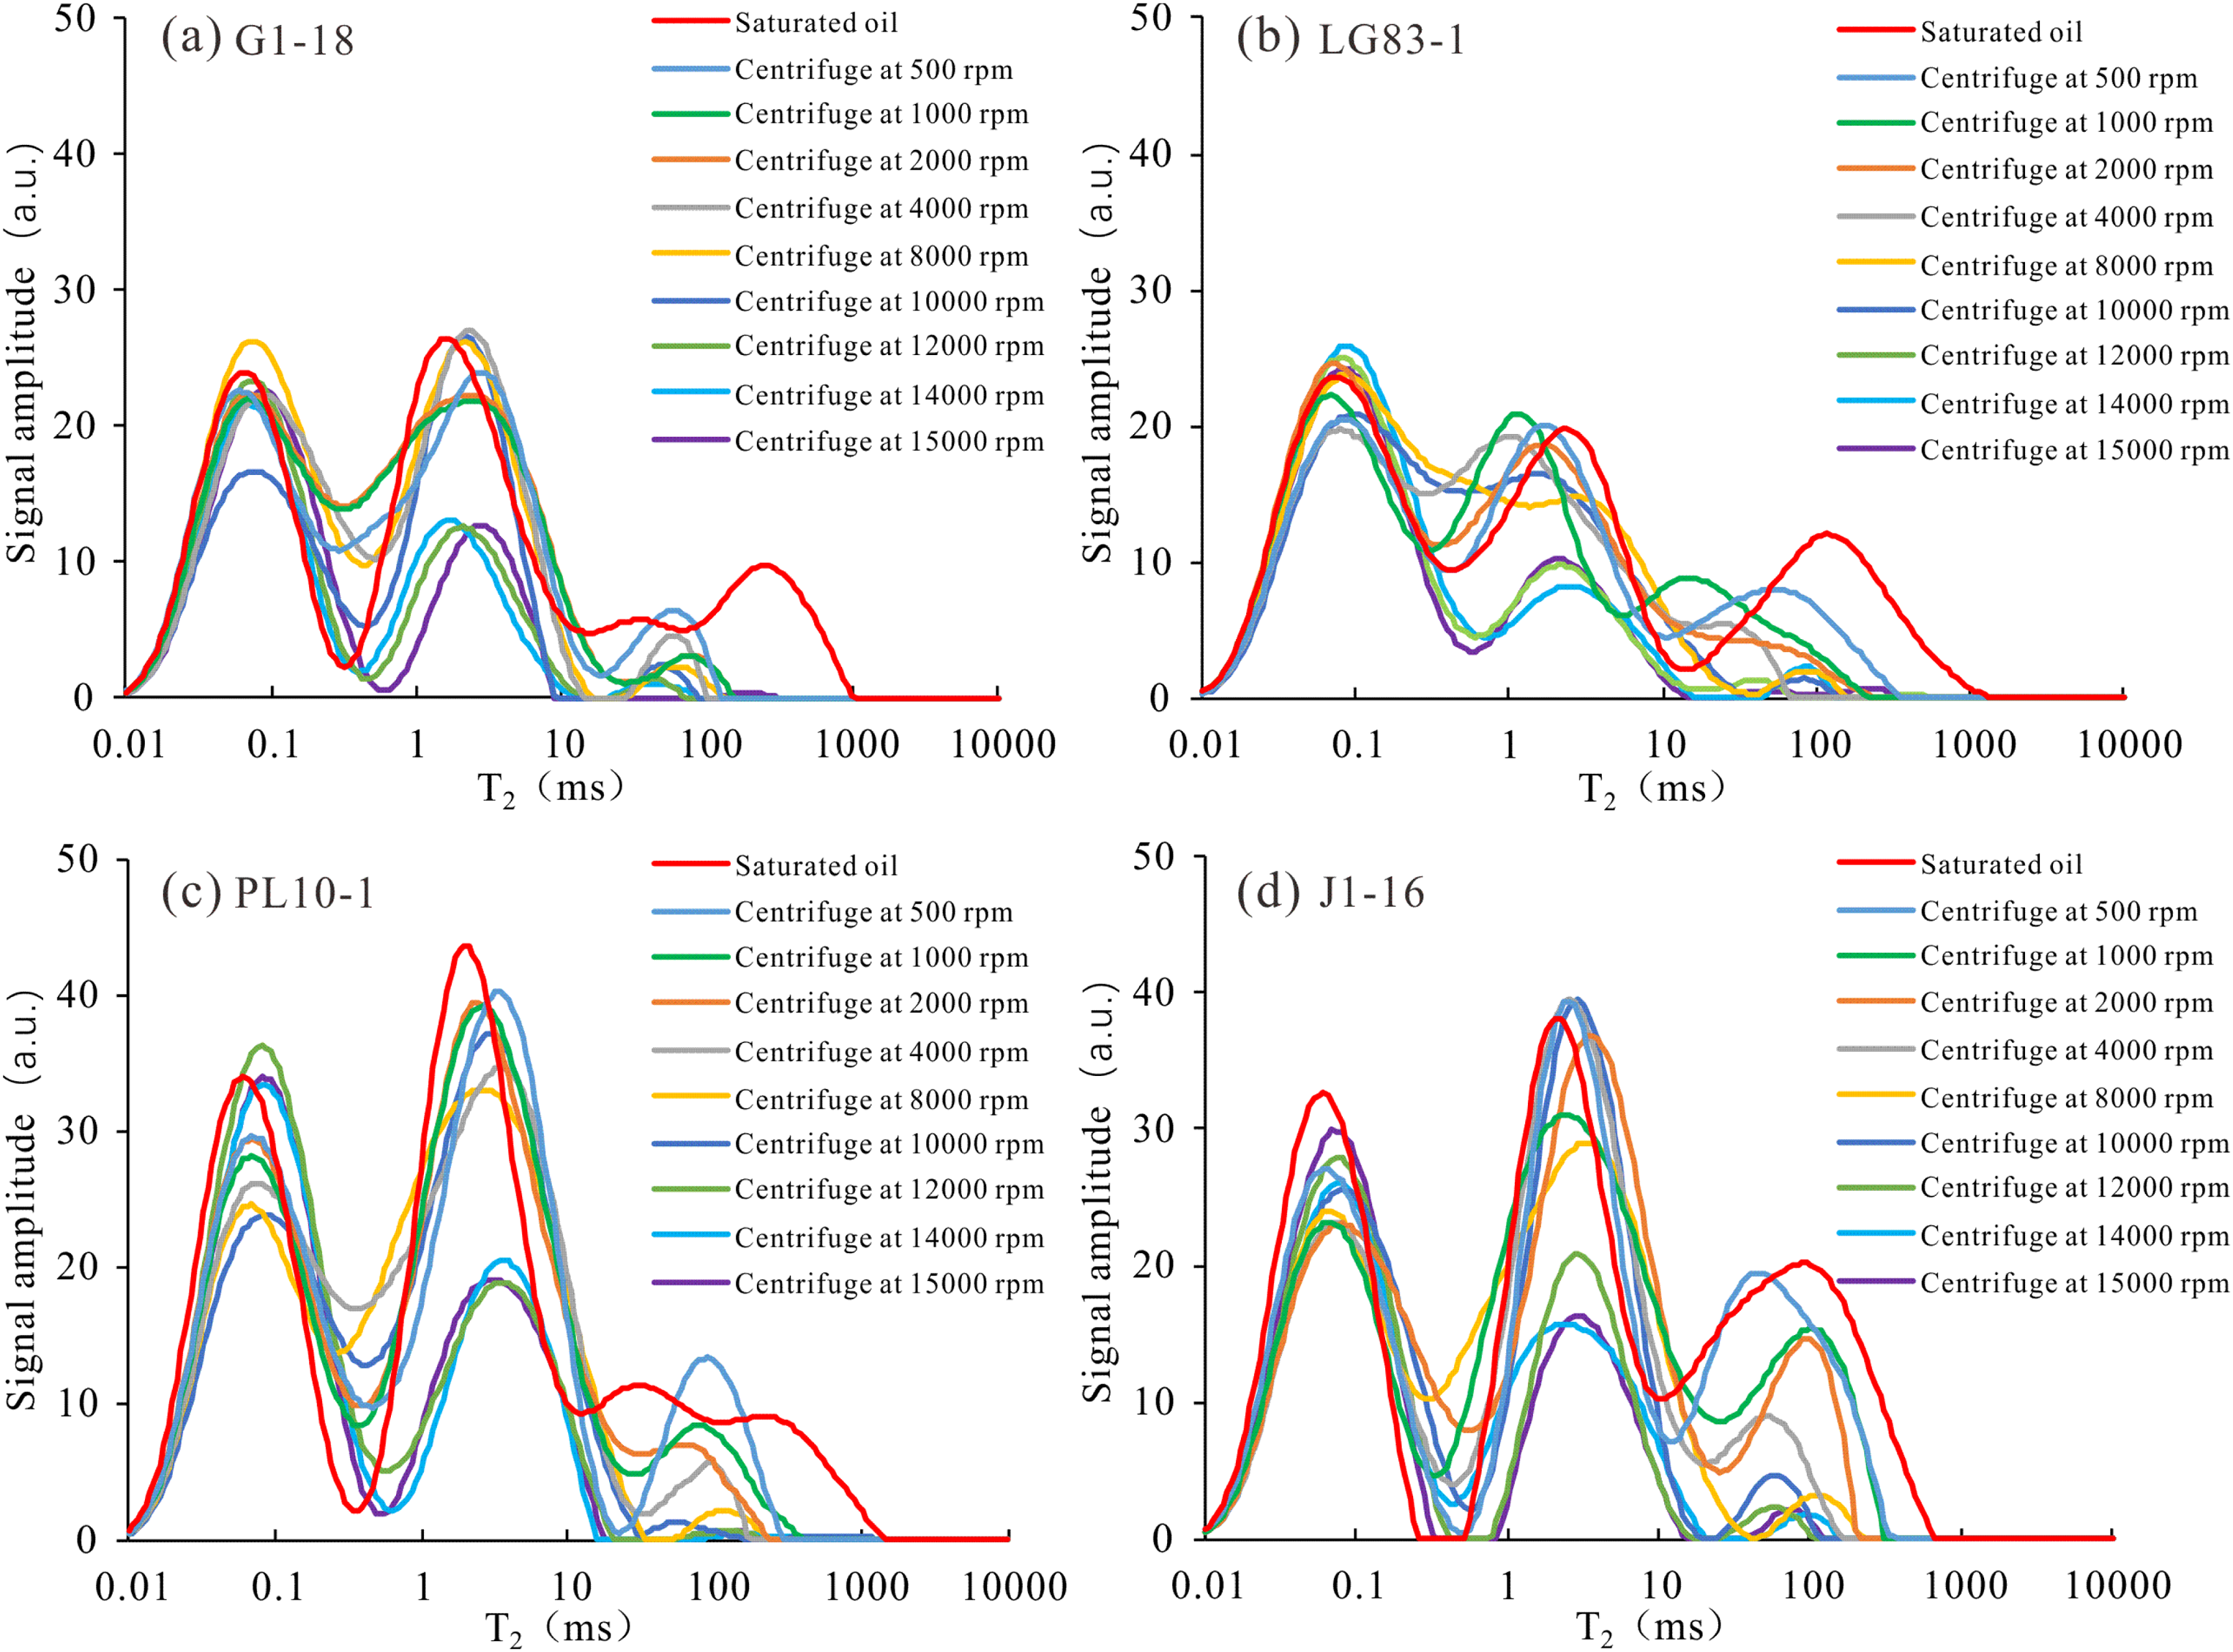
Figure 5 shows the NMR results of the plug samples in saturated oil state and centrifuged at different speeds. The T2 spectra of samples G1–18 and PL10–1 in saturated oil state showed pseudo-triple-modal distribution with peak values of 0.1 ms, 1–10 ms, and larger than 100 ms, respectively, suggesting highly developed macropores and microfractures. This view has been confirmed by SEM images (Figure 3(h) and (j)). The T2 spectrum of sample LG83–1 in saturated oil state presents a bimodal distribution, with the peak values ranging from 0.5 ms to 10 ms and larger 100 ms, respectively. The peak area of 0.5–10 ms is dominant, accounting for more than 85% of the total T2 spectrum area, suggesting that micropores are the main storage space of these shales, but there are also a few macropores and microfractures. In addition, the J1–16 sample exhibits the characteristics of a four-peak distribution, and the peak area larger than 10 ms accounts for about 50% of the entire T2 spectrum, suggesting that macropores and microfractures are the main pore space. Strong pore heterogeneity has also been observed in SEM images.
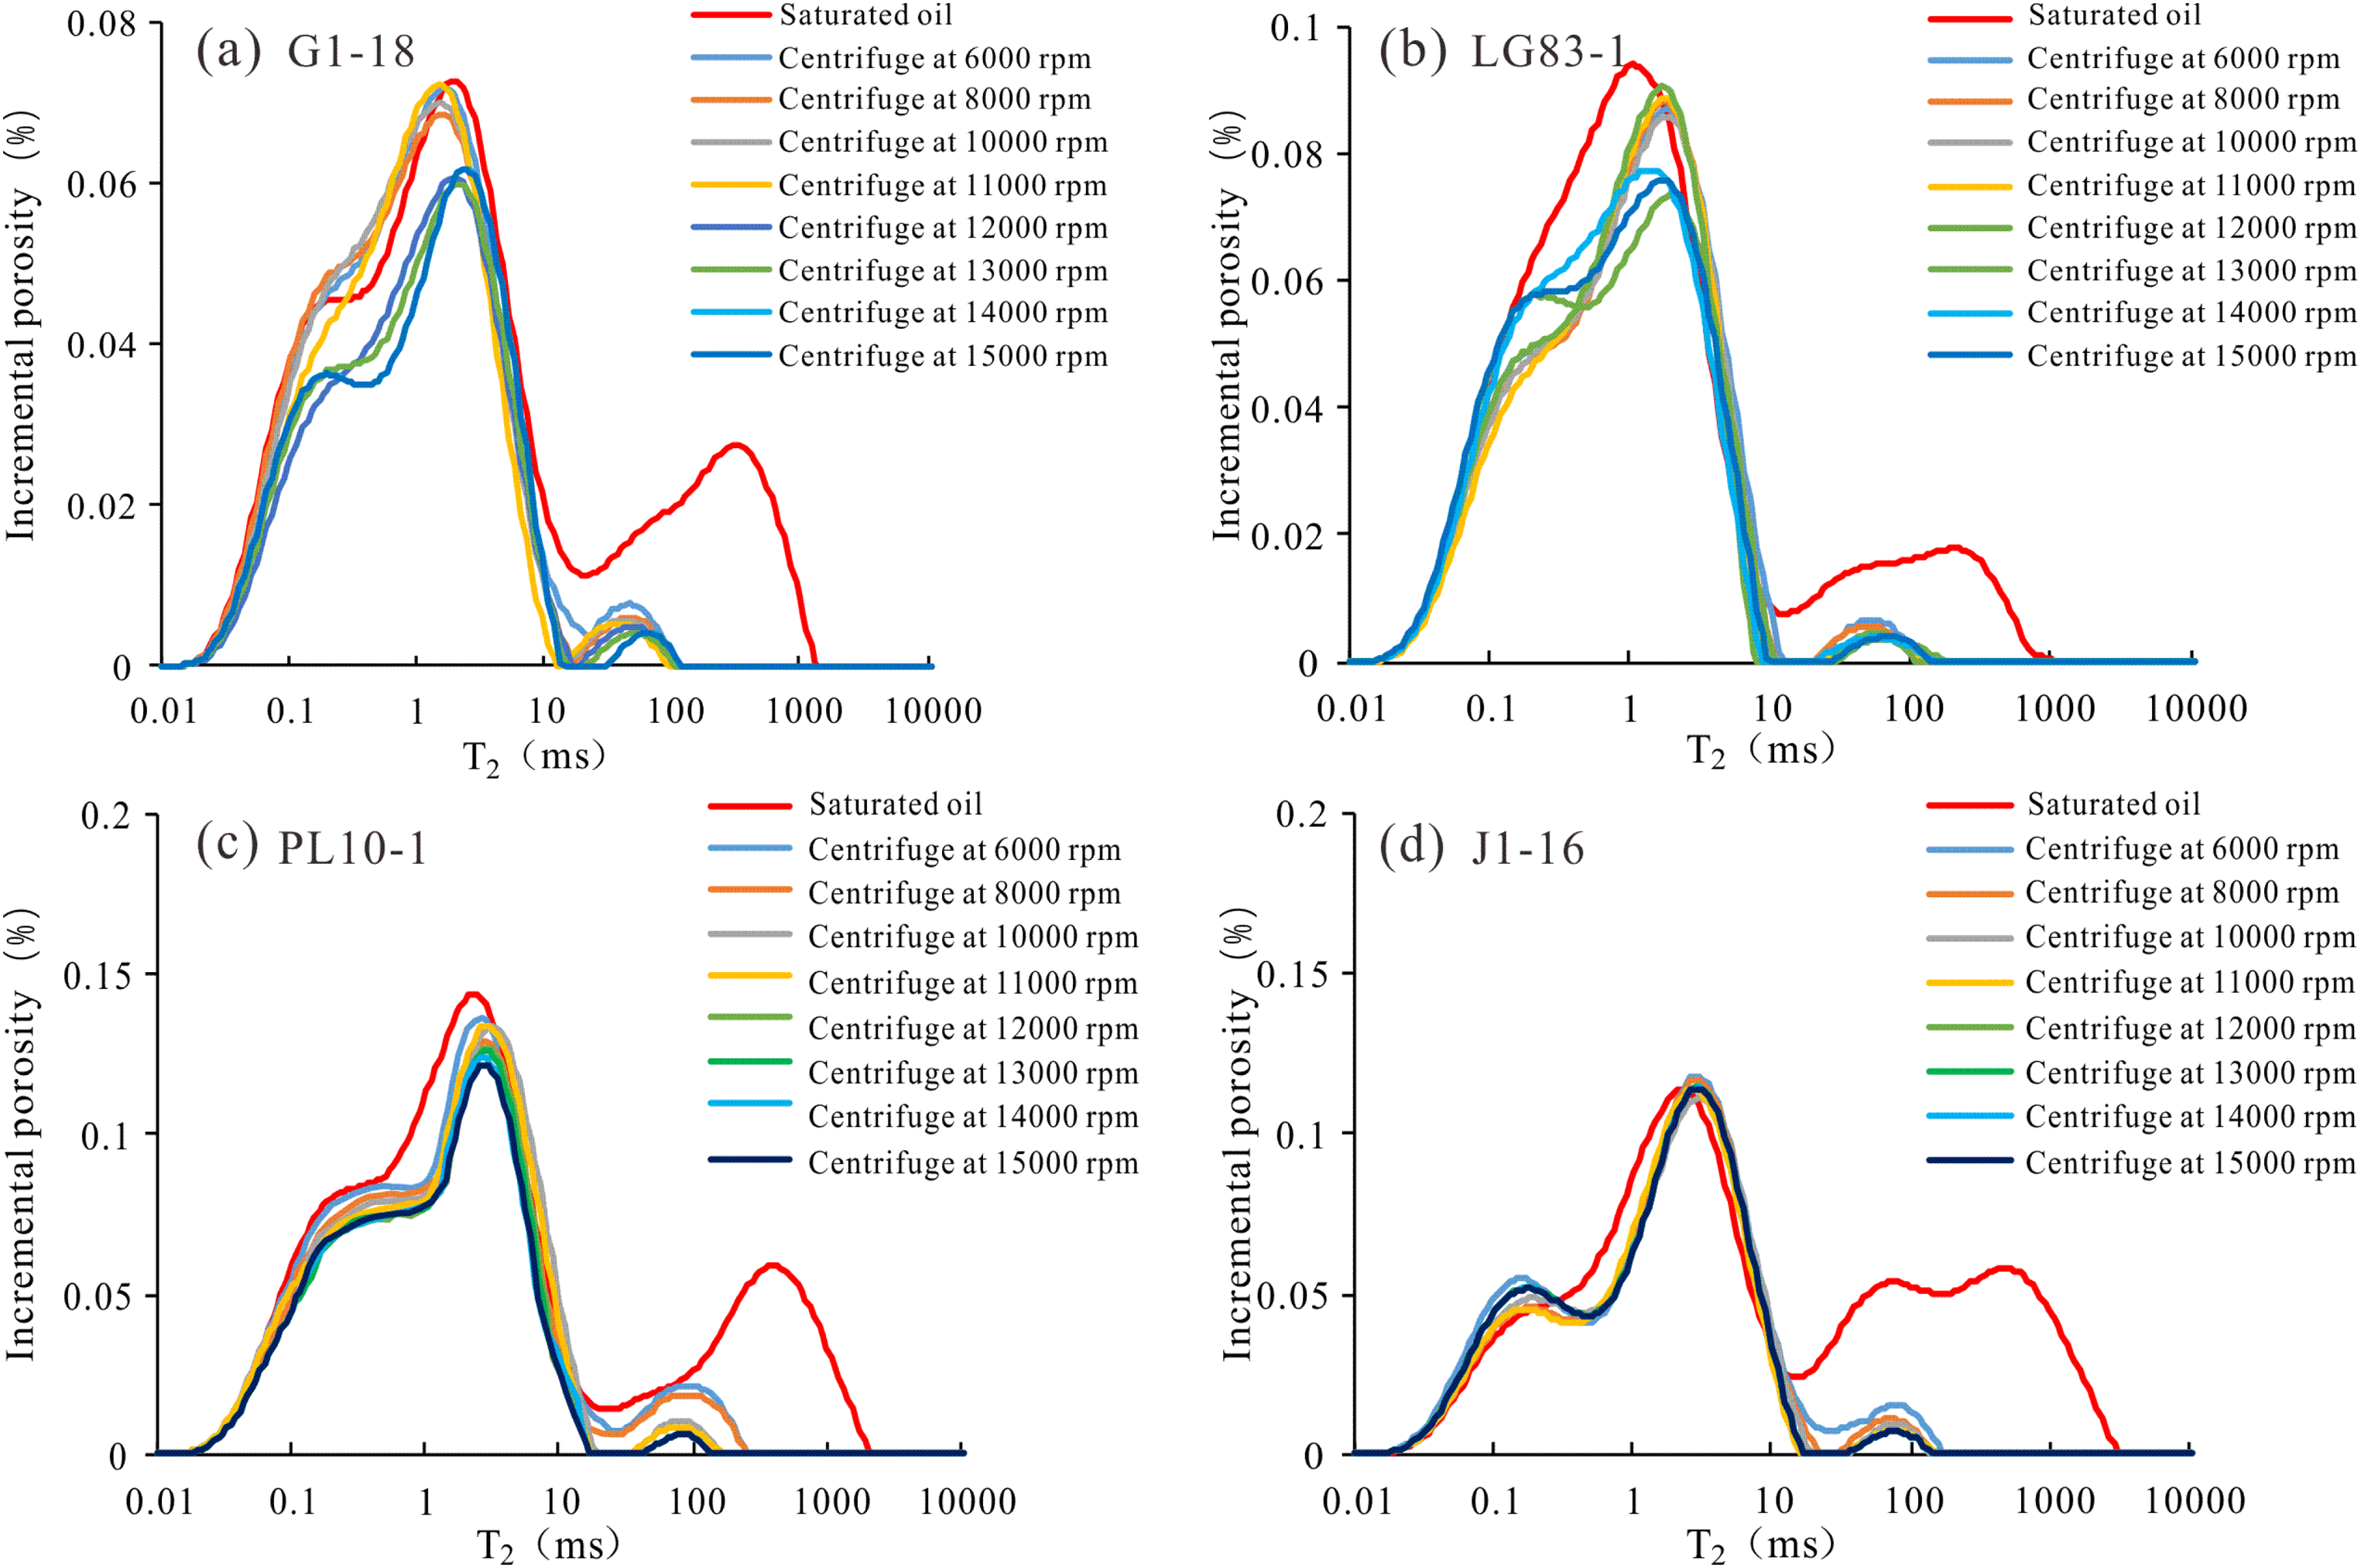
Nuclear magnetic resonance (NMR) T2 spectrum characteristics of plug sample at different centrifugal speeds and saturated oil. With the increase in centrifugation speed, the NMR T2 spectrum area of each sample decreased continuously, and the peak with T2 time greater than 10 ms decreased the most.
During the centrifugation process, the area of the third peak is significantly reduced, while the T2 value corresponding to the second peak moves in an increasing direction, indicating that oil in the macropores and microfractures of shale is preferentially discharged with the increase of centrifugation force, the oil in the micropores flows into the macropores and microfractures. When the centrifugation speed reaches 10,000 rpm, the NMR porosity of PL10–1 and J1–16 decreases the most (2.79% and 2.77%, respectively), the NMR porosity of G1–18 decreases by 1.87%, and LG83–1 decreases the least (0.9%). The results of SEM images and saturated oil NMR T2 spectrum show that the brittle mineral fractures of PL10–1 and J1–16 are highly developed, and shale oil has a strong flow capacity. Clay microfractures are developed of G1–18, which may not be conducive to shale oil flow. The microfracture development of sample LG83–1 is low, and shale oil is difficult to migrate in micropores. After the centrifugal speed reaches 12,000 rpm, the NMR porosity basically does not change (Figure 7).
For drying process, Figure 6 shows that when the drying temperature reaches 80°C, the oil content in the samples gradually decreases, especially when the temperature reaches 160°C, the NMR porosity exhibits the most significant decline, with an average of 3%. When the temperature exceeds 180°C, the porosity of NMR has little change (Figure 7). During the drying temperature from 60°C to 120°C, the third residual peak of T2 spectrum after centrifugation disappears completely, the second peak decreases, and the first peak does not change. When the temperature exceeds 120°C, the second peak basically disappears, and the first peak begins to decline, and T2 spectrum shows the unimodal distribution. The change in NMR T2 spectrum during the drying process at different temperatures also suggests that the oil in the macropores is preferentially discharged from the pores.
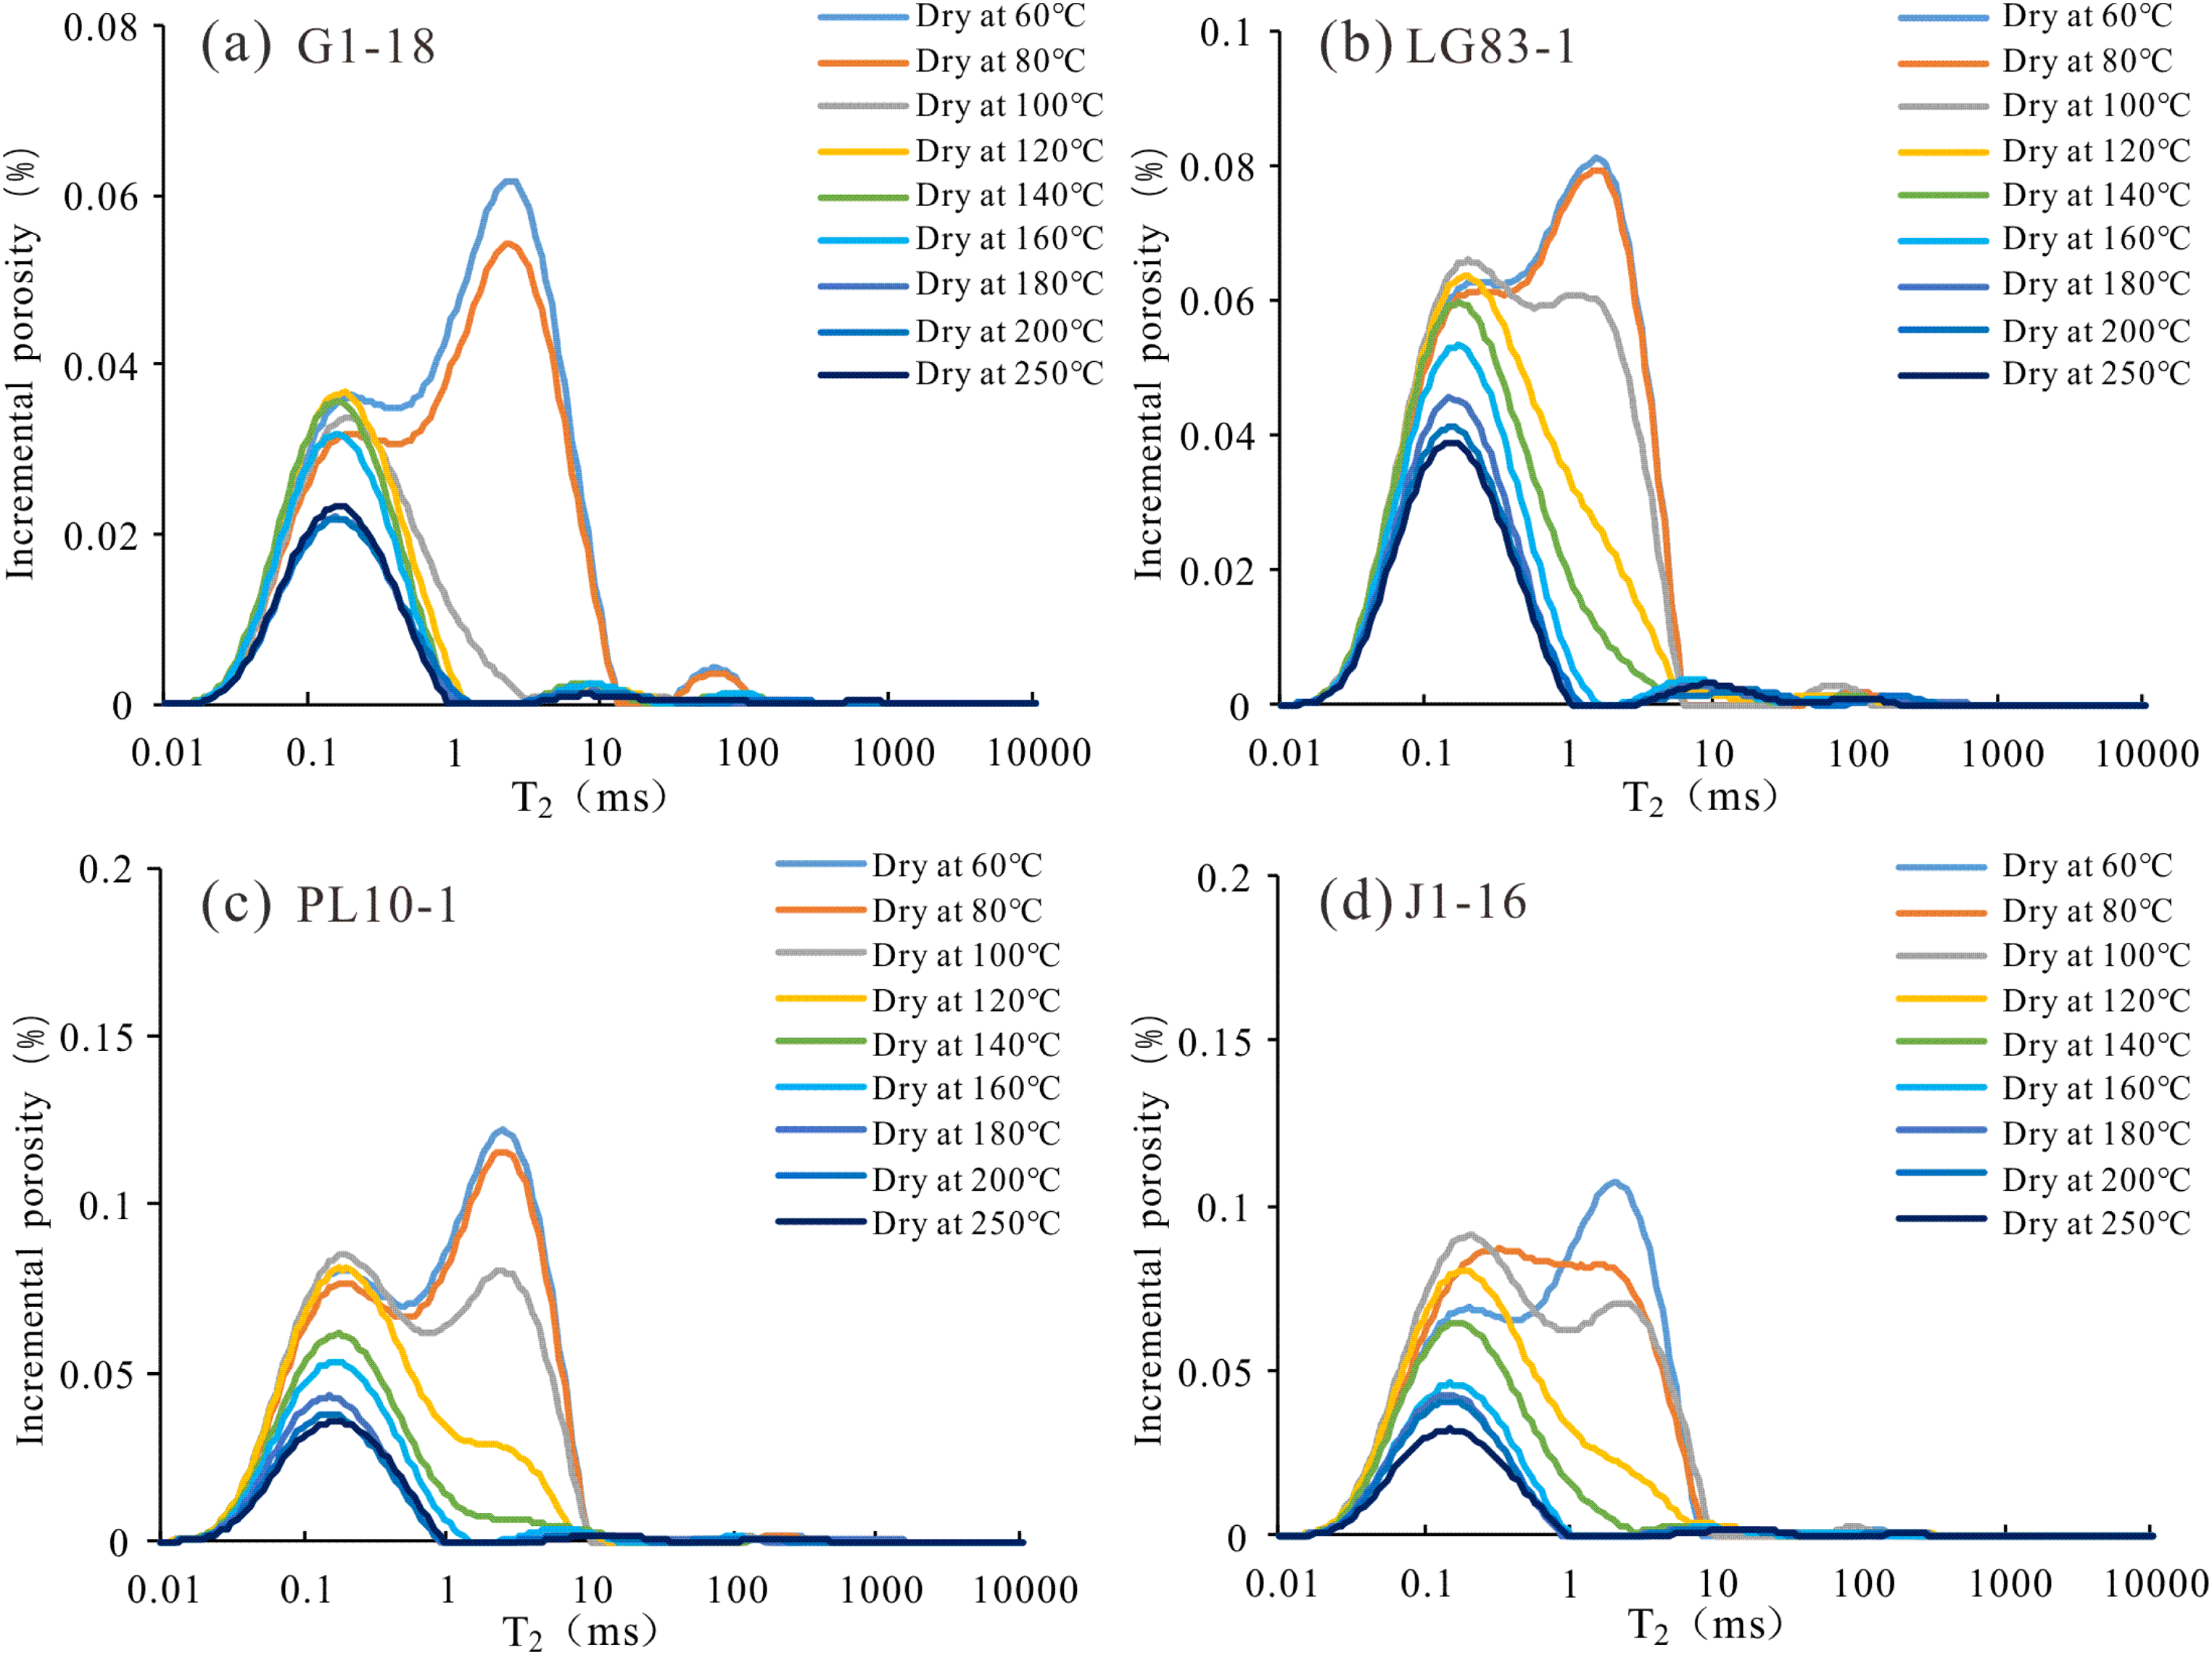
Nuclear magnetic resonance (NMR) T2 spectrum characteristics of plug samples at different drying temperatures after centrifugation. With the increase in temperature, the NMR T2 spectrum area of each sample decreases continuously, which shows that the peak area with T2 value larger than 1 ms decreases first.
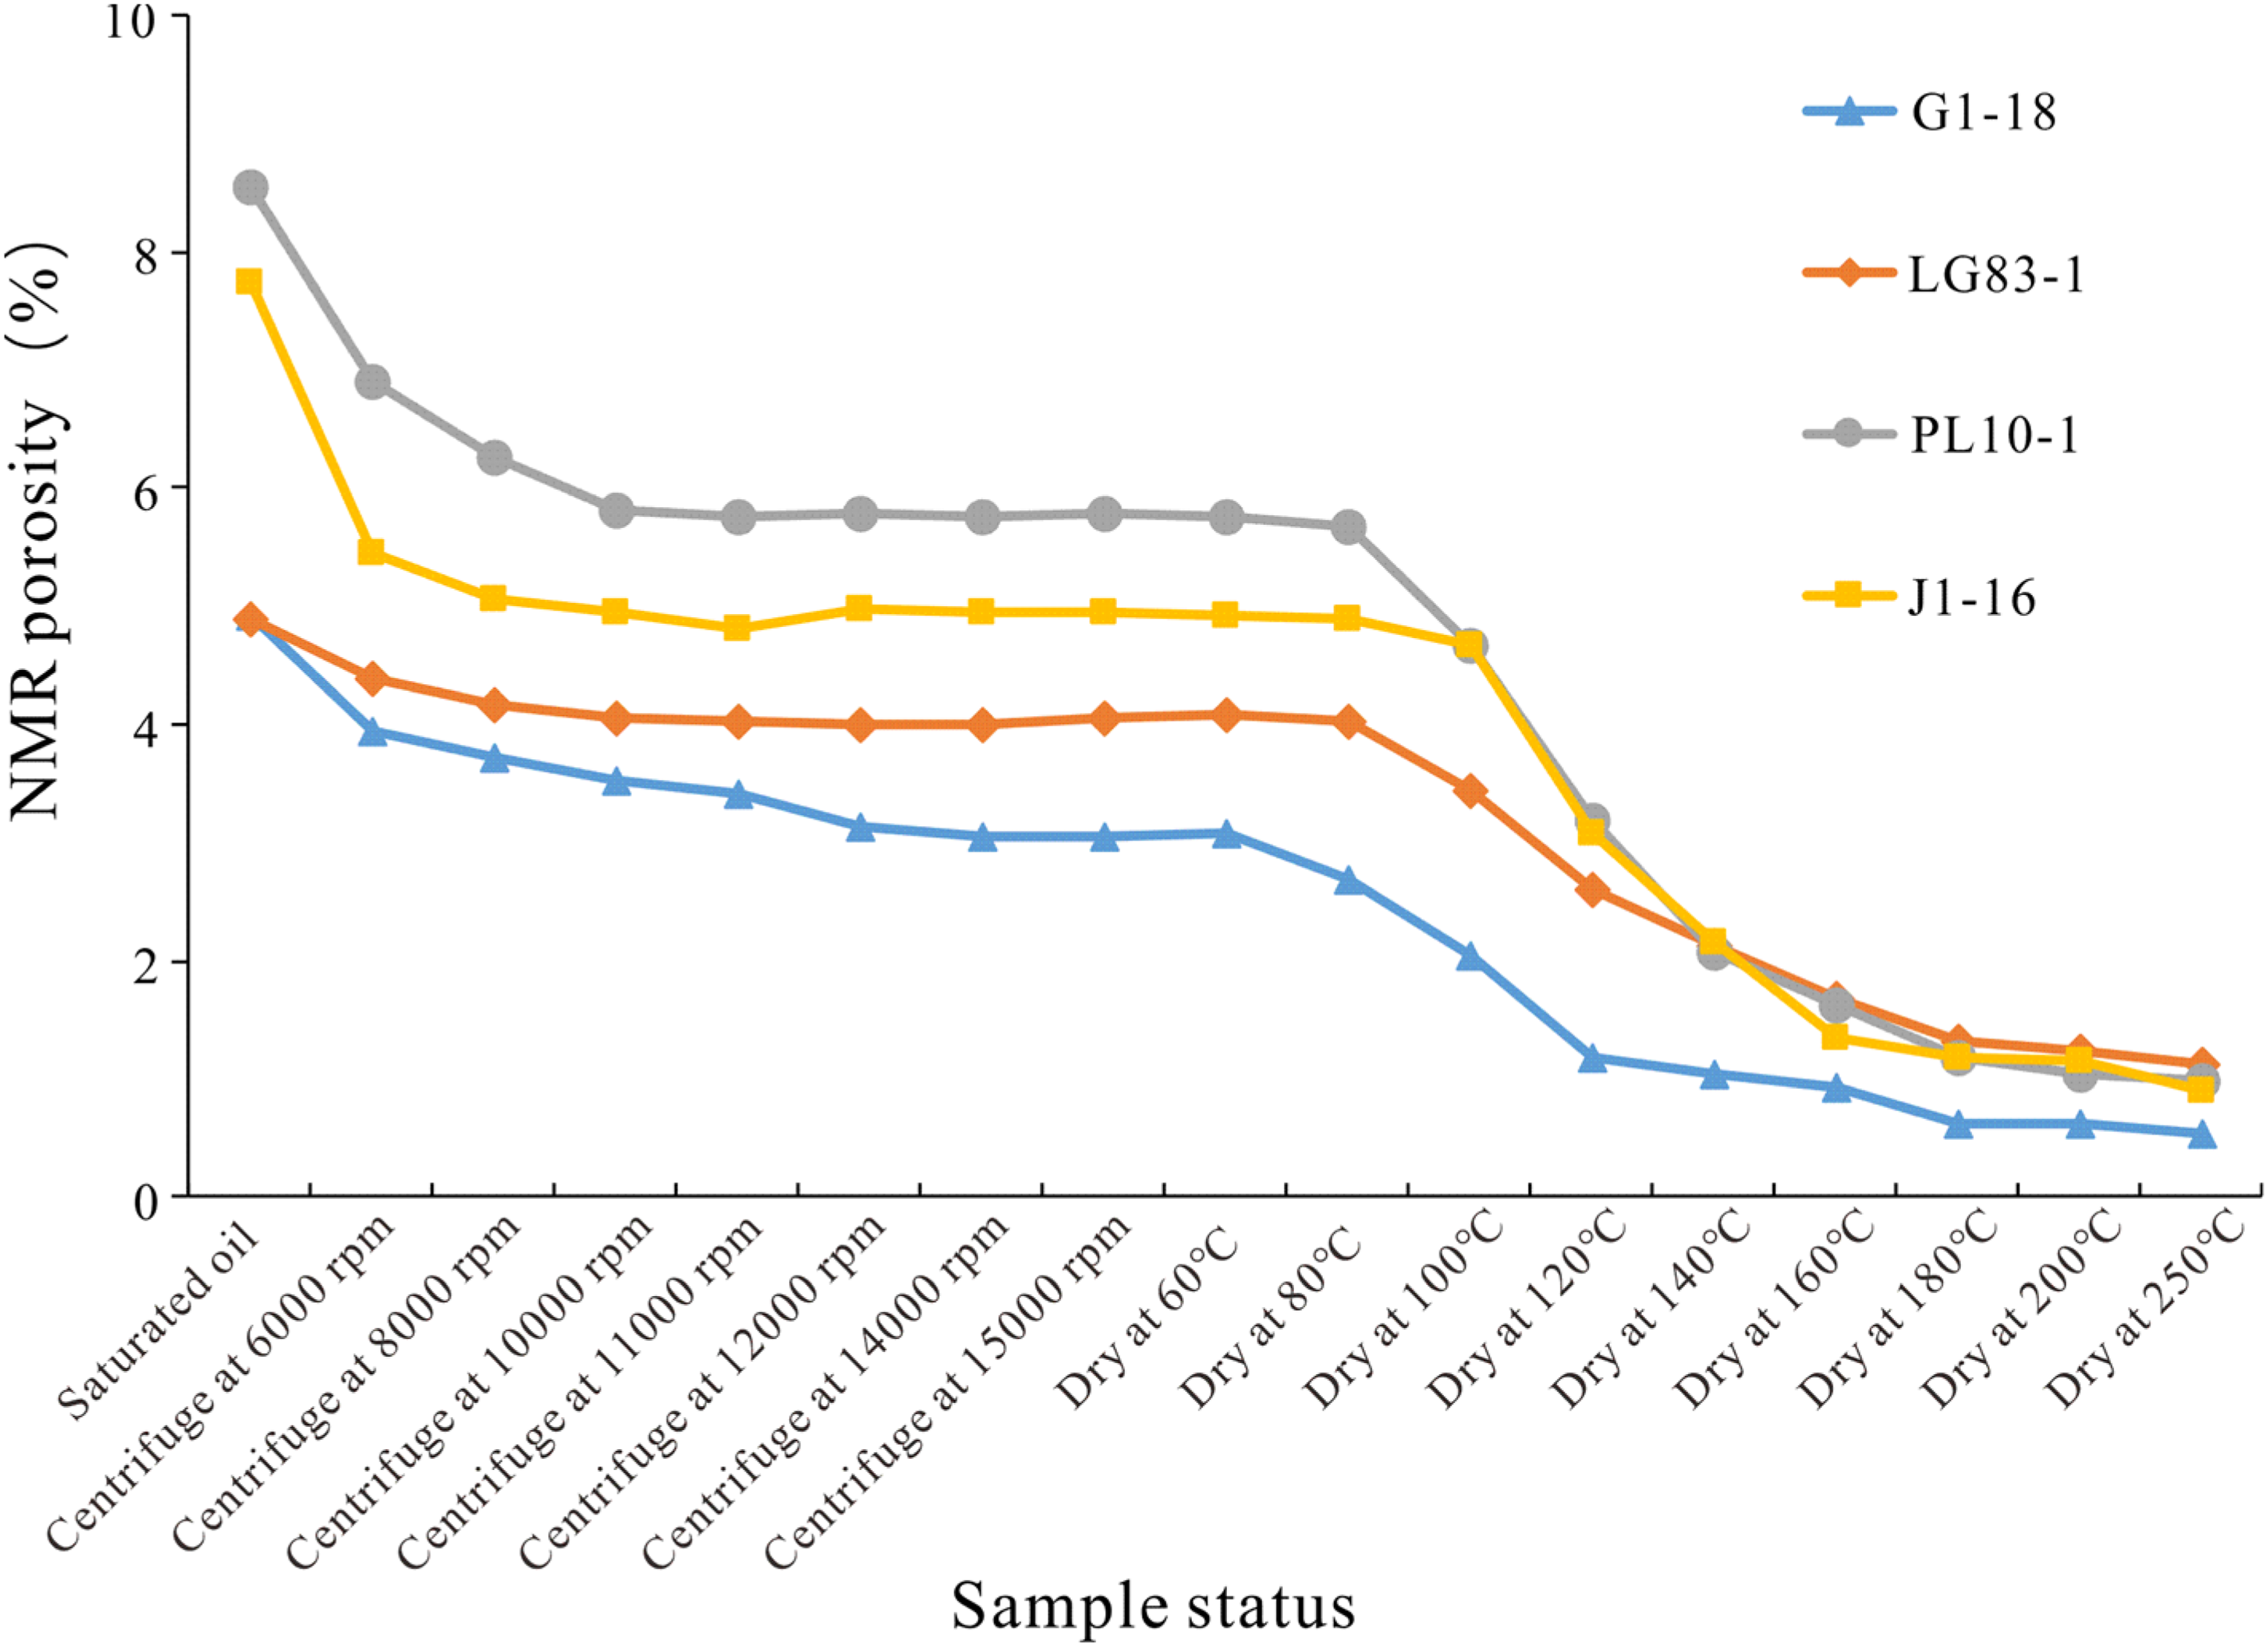
Nuclear magnetic resonance (NMR) porosity changes of plug samples at different centrifugal speeds and drying temperatures. During centrifugation, the NMR porosity decreased continuously with the loss of movable oil. After the centrifugal speed reaches 12,000rpm, the movable oil basically disappears. During the drying process, the sample loses both bound oil and adsorbed oil.
The development of shale oil requires artificial fracture, and the pore connectivity is seriously affected by the size. Therefore, it is of great significance to analyze the mobility of crushed samples when evaluating the recovery degree of shale oil. As shown in Figure 8, the NMR response of crushed samples after centrifugation at different speeds shows a characteristic of three peaks. During the centrifugation process, the third peak (T2>10 ms) in the NMR T2 spectrum disappears basically, reflecting that fluids in macropores with large T2 values are still preferentially discharged, and then the signal of the second peak (1 ms >T2>10 ms) decreases greatly. In addition, the amplitude of the first peak (T2<1 ms) increases slightly during the centrifugal process of crushed samples, which may be the redistribution of oil in small pores. Some scholars also understand that during the centrifugal process, fluid in the pore center is easy to be discharged, while fluid at the pore edge is retained, which leads to the increase in T2 value in the part of the first peak (Li et al., 2019b). These results also indicate that the complexity of pore structure influences the fluidity of oil (Li et al., 2019b).
Nuclear magnetic resonance (NMR) T2 spectrum characteristics of crushed sample at different centrifugal speeds.
Discussion
Microscopic pore structure characteristics
Full-scale pore size is very important to study the occurrence and migration of shale oil in pores. According to the IUPAC classification scheme, shale pores are divided into micropores (diameter < 2 nm), mesopores (diameter between 2 and 50 nm) and macropores (diameter > 50 nm). MICP can accurately represent the PSD of the mesopores, while the mesopores can be obtained by N2 adsorption, and micropores can be acquired effectively by CO2 adsorption. The total PSD of shale samples can be acquired by integrating these three methods (Li et al., 2019a; Wang et al., 2019).
Figure 9 shows that the PV distributions of Da’anzhai shale in Sichuan Basin have certain differences, representing multiple peaks of 28 nm, 200 nm, 900 nm, and 3.5 µm. The total PV ranges from 0.00849 to 0.02808 cm³/g, with an average of 0.02034 cm³/g. Except for J1–16, they are mainly contributed by pores between 100 nm and 1000 nm, with an average of 0.01 cm³/g, which accounts for 45% of the total PV. Followed by pores >1000 nm, which accounts for 23%. J1–16 pore size is mainly distributed in more than 1000 nm, accounting for 42% of the total PV, followed by 10–100 nm, accounting for 33%.
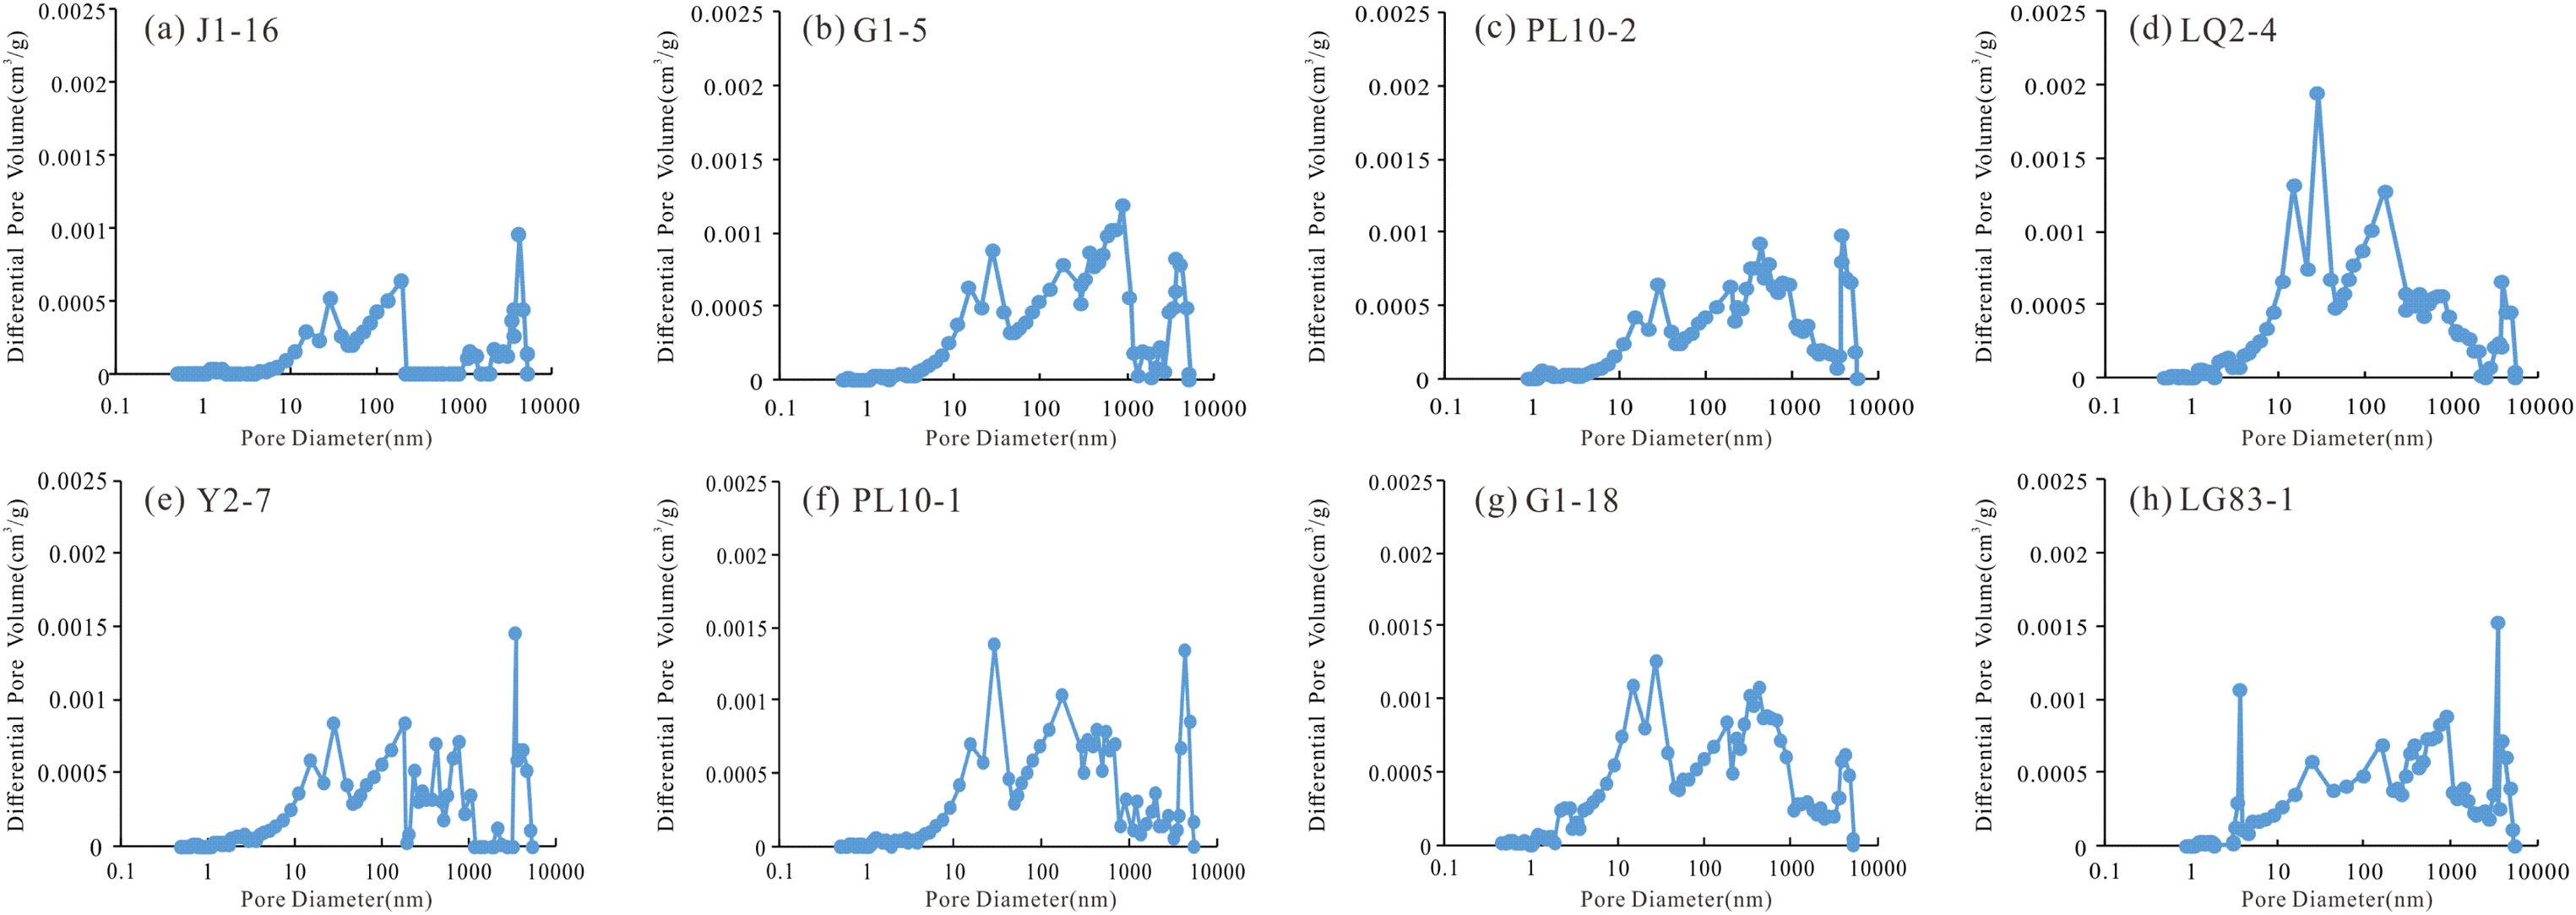
Full-scale pore size distributions of each samples.
The full-scale PSD curves of all samples show that the Da’anzhai shale has a high degree of macropore and microfracture development, which can also be observed through SEM that large-scale microfractures are developed in all samples (Figure 3(h), (j)–(l)). The PSD shown by the full-scale PSD curve is possibly different from that of the SEM images because the sample used in the SEM is too small to reflect the full-scale PSD. Besides, SEM observation mainly focuses on the size of OMP. However, the studied shale samples contain a large number of clay minerals (Table 1), and the intercrystalline pores of clay minerals are relatively small, which cannot be effectively identified by SEM.
Fluid type division
According to the experimental procedure described in subsection “NMR and centrifuge Experiment” and the changes in NMR T2 spectra of samples in different states in subsection “NMR results under different treatment conditions,” we can see that the NMR porosity of the saturated oil plug samples no longer decrease after centrifugation at 12,000 rpm (Figures 5(a) and 7). Therefore, the proportion of movable oil can be obtained by the difference between the NMR signal of the plug sample at 12,000 rpm and that of the saturated oil. Similarly, the proportion of bound oil can be obtained by crushing the centrifuged plug sample into a crushed sample (about 1 cm in diameter), and then centrifuging the crushed sample again at 12,000 rpm. Since adsorbed oil is adsorbed on pores and organic matter surfaces by intermolecular forces, adsorbed oil cannot be converted into bound or movable oil after changing pore connectivity. Therefore, after centrifugation of crushed samples, the remaining part is immovable adsorbed oil. Figure 7 shows that after drying at 180°C, the fluid NMR signal in the sample basically disappeared, and the residual NMR signal mainly comes from the matrix in the sample (mainly organic matter). The matrix NMR signal contributes less to the total sample signal compared to the fluid NMR signal. The determination of the occurrence state of shale oil can be simplified as plug sample centrifugation and crushed sample centrifugation. The method for estimating the T2 cutoff value (T2c1 and T2c2) is shown in Figure 10, and the specific steps refer to previous studies (Zhou et al., 2016; Testamanti and Rezaee, 2017). The T2c1 and T2c2 values of all samples are recorded in Table 2.
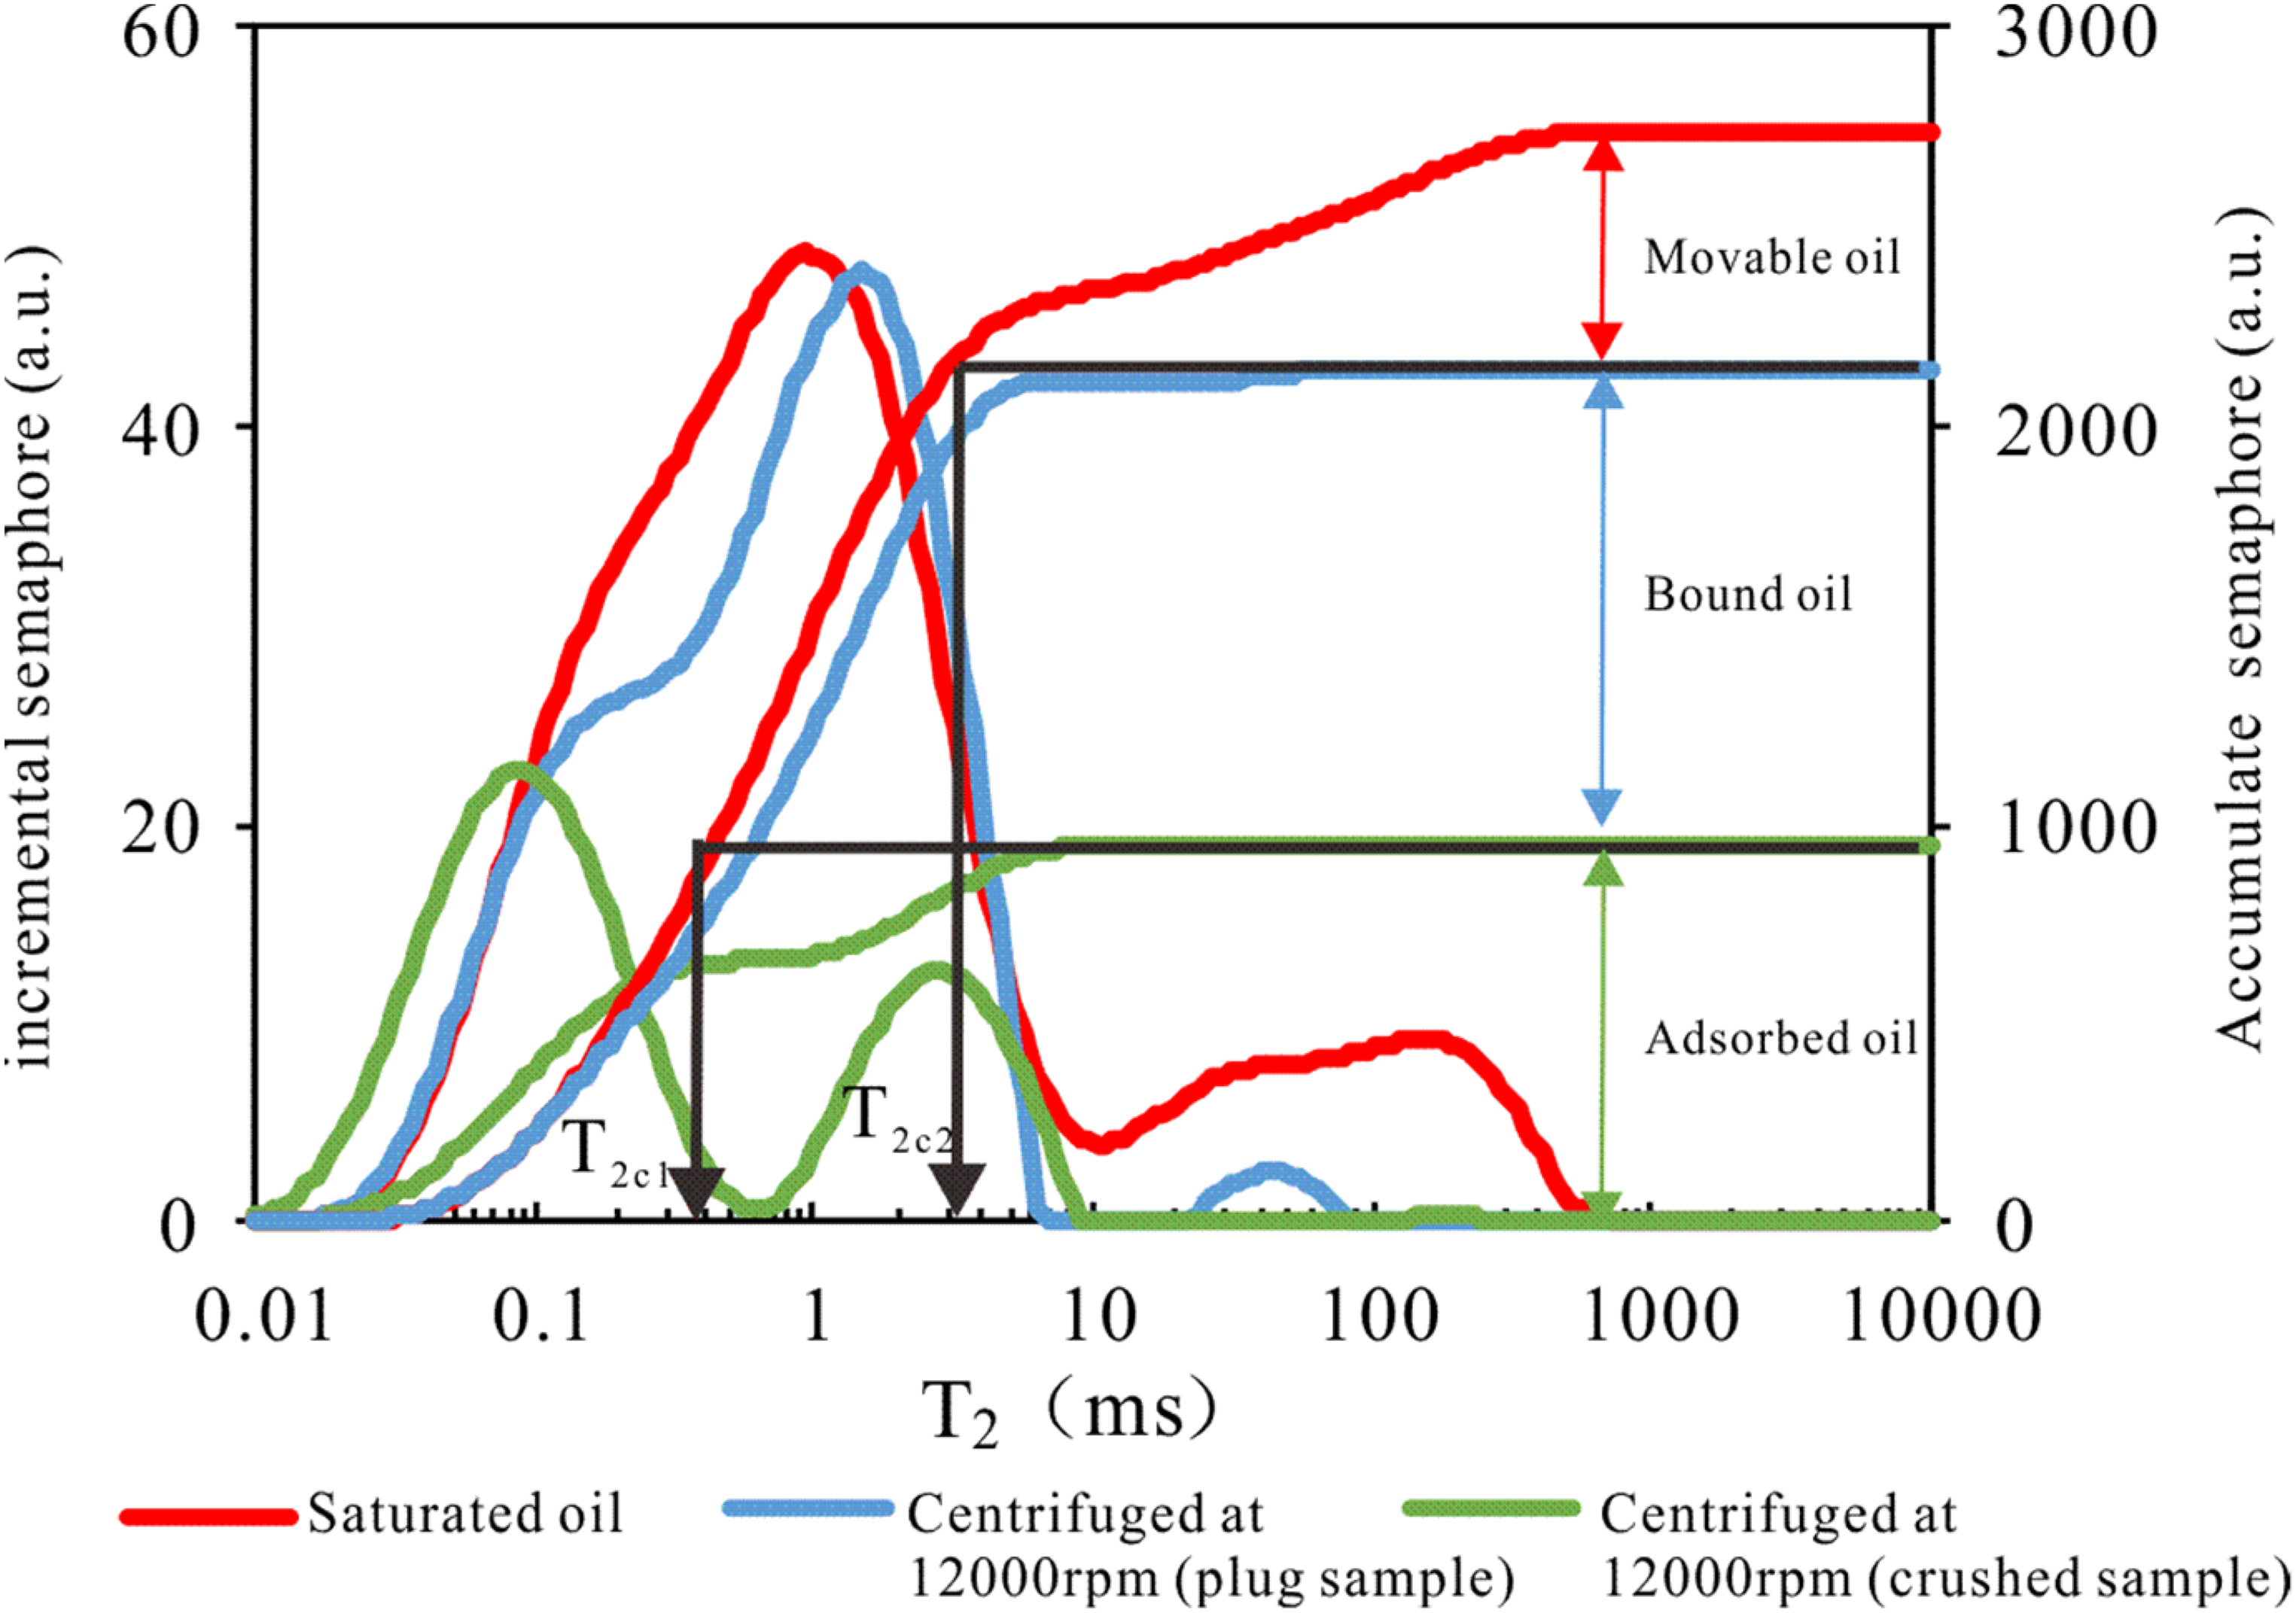
T2 spectra and T2 cutoffs from the nuclear magnetic resonance (NMR) relaxation of shales.
Fluid content of samples in different states of occurrence.
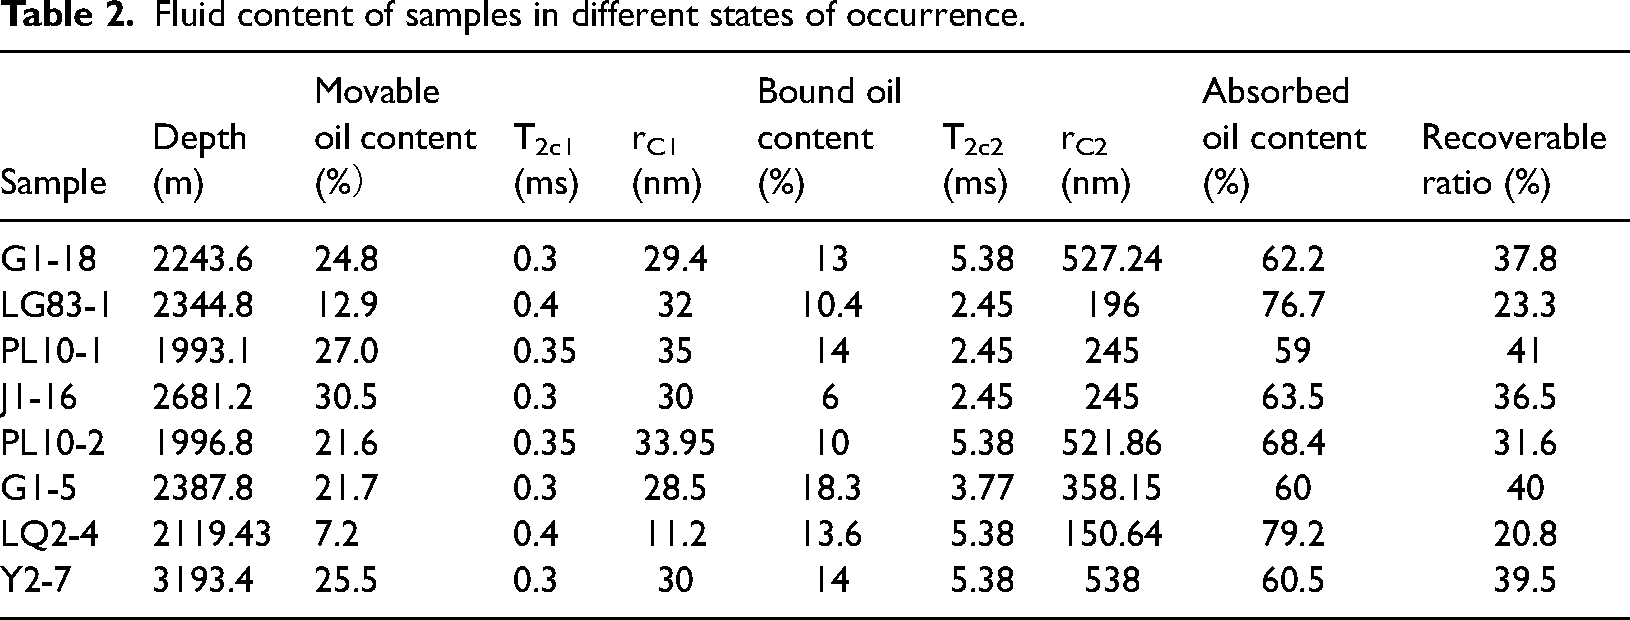
According to Equations (1), (2) and (3), the oil contents in different occurrence states of all samples can be calculated (Table 2). The movable oil content of Da’anzhai shale is generally low, ranging from 7.2% to 30.5%, with an average of 21.4%. The content of bound oil ranges from 6% to 18.3%, with an average of 12.4%. The adsorbed oil content is high, ranging from 59% to 79.2%, with an average of 66.2%, suggesting that it may be difficult to exploit shale oil in Da’anzhai shale. In this study, it is presumed that with the enhancement of hydraulic fracturing effect, a denser fracture network can be formed in shale reservoirs. These complex fracture networks can effectively communicate pores and shorten the migration path of shale oil. Therefore, bound oil can theoretically be developed efficiently. Moreover, both movable oil and bound oil can be effectively exploited, and the recoverable ratio is the content of movable and bound oil. The maximum recoverable ratio of shale in Da’anzhai shale of Sichuan Basin is 41%, with an average of 33.8% theoretically.
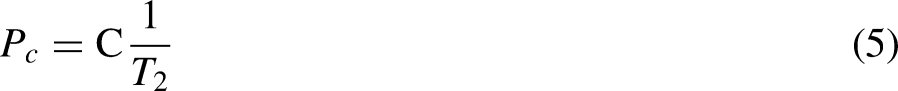
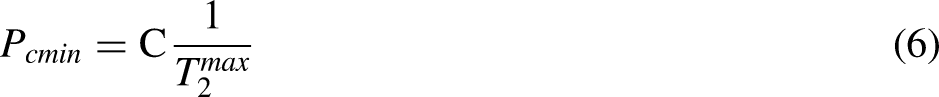
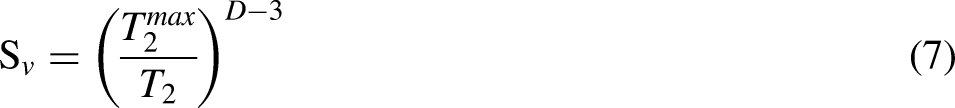
Chen et al. (2021b) showed that NMR could reveal the full-scale PSD of shale. Based on equation (2), the surface relaxation rate of each sample could be obtained by comparing NMR T2 spectrum with the full-scale PSD curve, and then the T2 value could be converted into pore size. Using this method, rC1 and rC2, which represent the corresponding pore sizes of T2c1 and T2c2, respectively, were obtained (Table 2). According to the calculation, The T2c1 values of all samples were almost 0.216 ms, while the T2c2 values varied, ranging from 2.45 to 5.38 ms, with an average of 4.08 ms. Except for the sample LQ2–4, which has a low rC1 value of only 11.2 nm, the rC1 values of the other samples are distributed between 29.4 and 35 nm, with an average of about 30 nm. The rC2 value of each sample varies greatly, ranging from 150.64 to 538 nm, with an average of about 350 nm, which may be caused by the difference in pore structure.
Fluid distribution control factors
Shale reservoir macro-characteristics include geochemical characteristics and mineral composition (Ning et al., 2020). A large number of studies have shown that reservoir material composition affects the occurrence of shale oil and controls shale oil flow (Li et al., 2018; Zhang et al., 2017; Ning et al., 2017; Ning et al., 2020). Organic matter has a strong adsorption capacity for shale oil, so there is a significant positive correlation between TOC and adsorbed oil (Figure 11(c)). Moreover, organic matter is the material basis for hydrocarbon generation, and the total amount of movable oil in samples with high organic matter content should be larger, but TOC is negatively correlated with the contents of movable oil and bound oil (Figure 11(a)–(b)), indicating that shale reservoirs with high TOC content have higher relative adsorbed oil content. Similarly, a large number of clay minerals adsorb oil, thus increasing the flow difficulty of shale oil. Therefore, there is a negative correlation between clay minerals and the content of movable oil and bound oil, especially the negative correlation between clay minerals and the content of movable oil and the positive correlation between clay minerals and the content of adsorbed oil (Figure 11(d)–(f)). On the other hand, the existence of brittle minerals such as quartz is conducive to the flow of oil shale. Through SEM, the brittle minerals offer a wide range of inorganic pore and microfracture (Figure 3(f), (h), (k), (l)). The reservoir space not only stores a large number of shale oil but also is the dominant seepage channel for shale oil flow. Therefore, the quartz content has an obvious positive correlation with movable oil, an obvious negative correlation with the adsorbed oil content, but no obvious correlation with bound oil (Figure 11(g)–(i)). It also indicates that high-quality lacustrine shale reservoirs in Sichuan Basin have similar but not identical characteristics with Longmaxi Formation marine shale reservoirs. High brittle minerals and low clay mineral content are favorable to the development of high-quality shale reservoirs, but for lacustrine shale reservoirs, high TOC content may increase the difficulty of shale oil development.
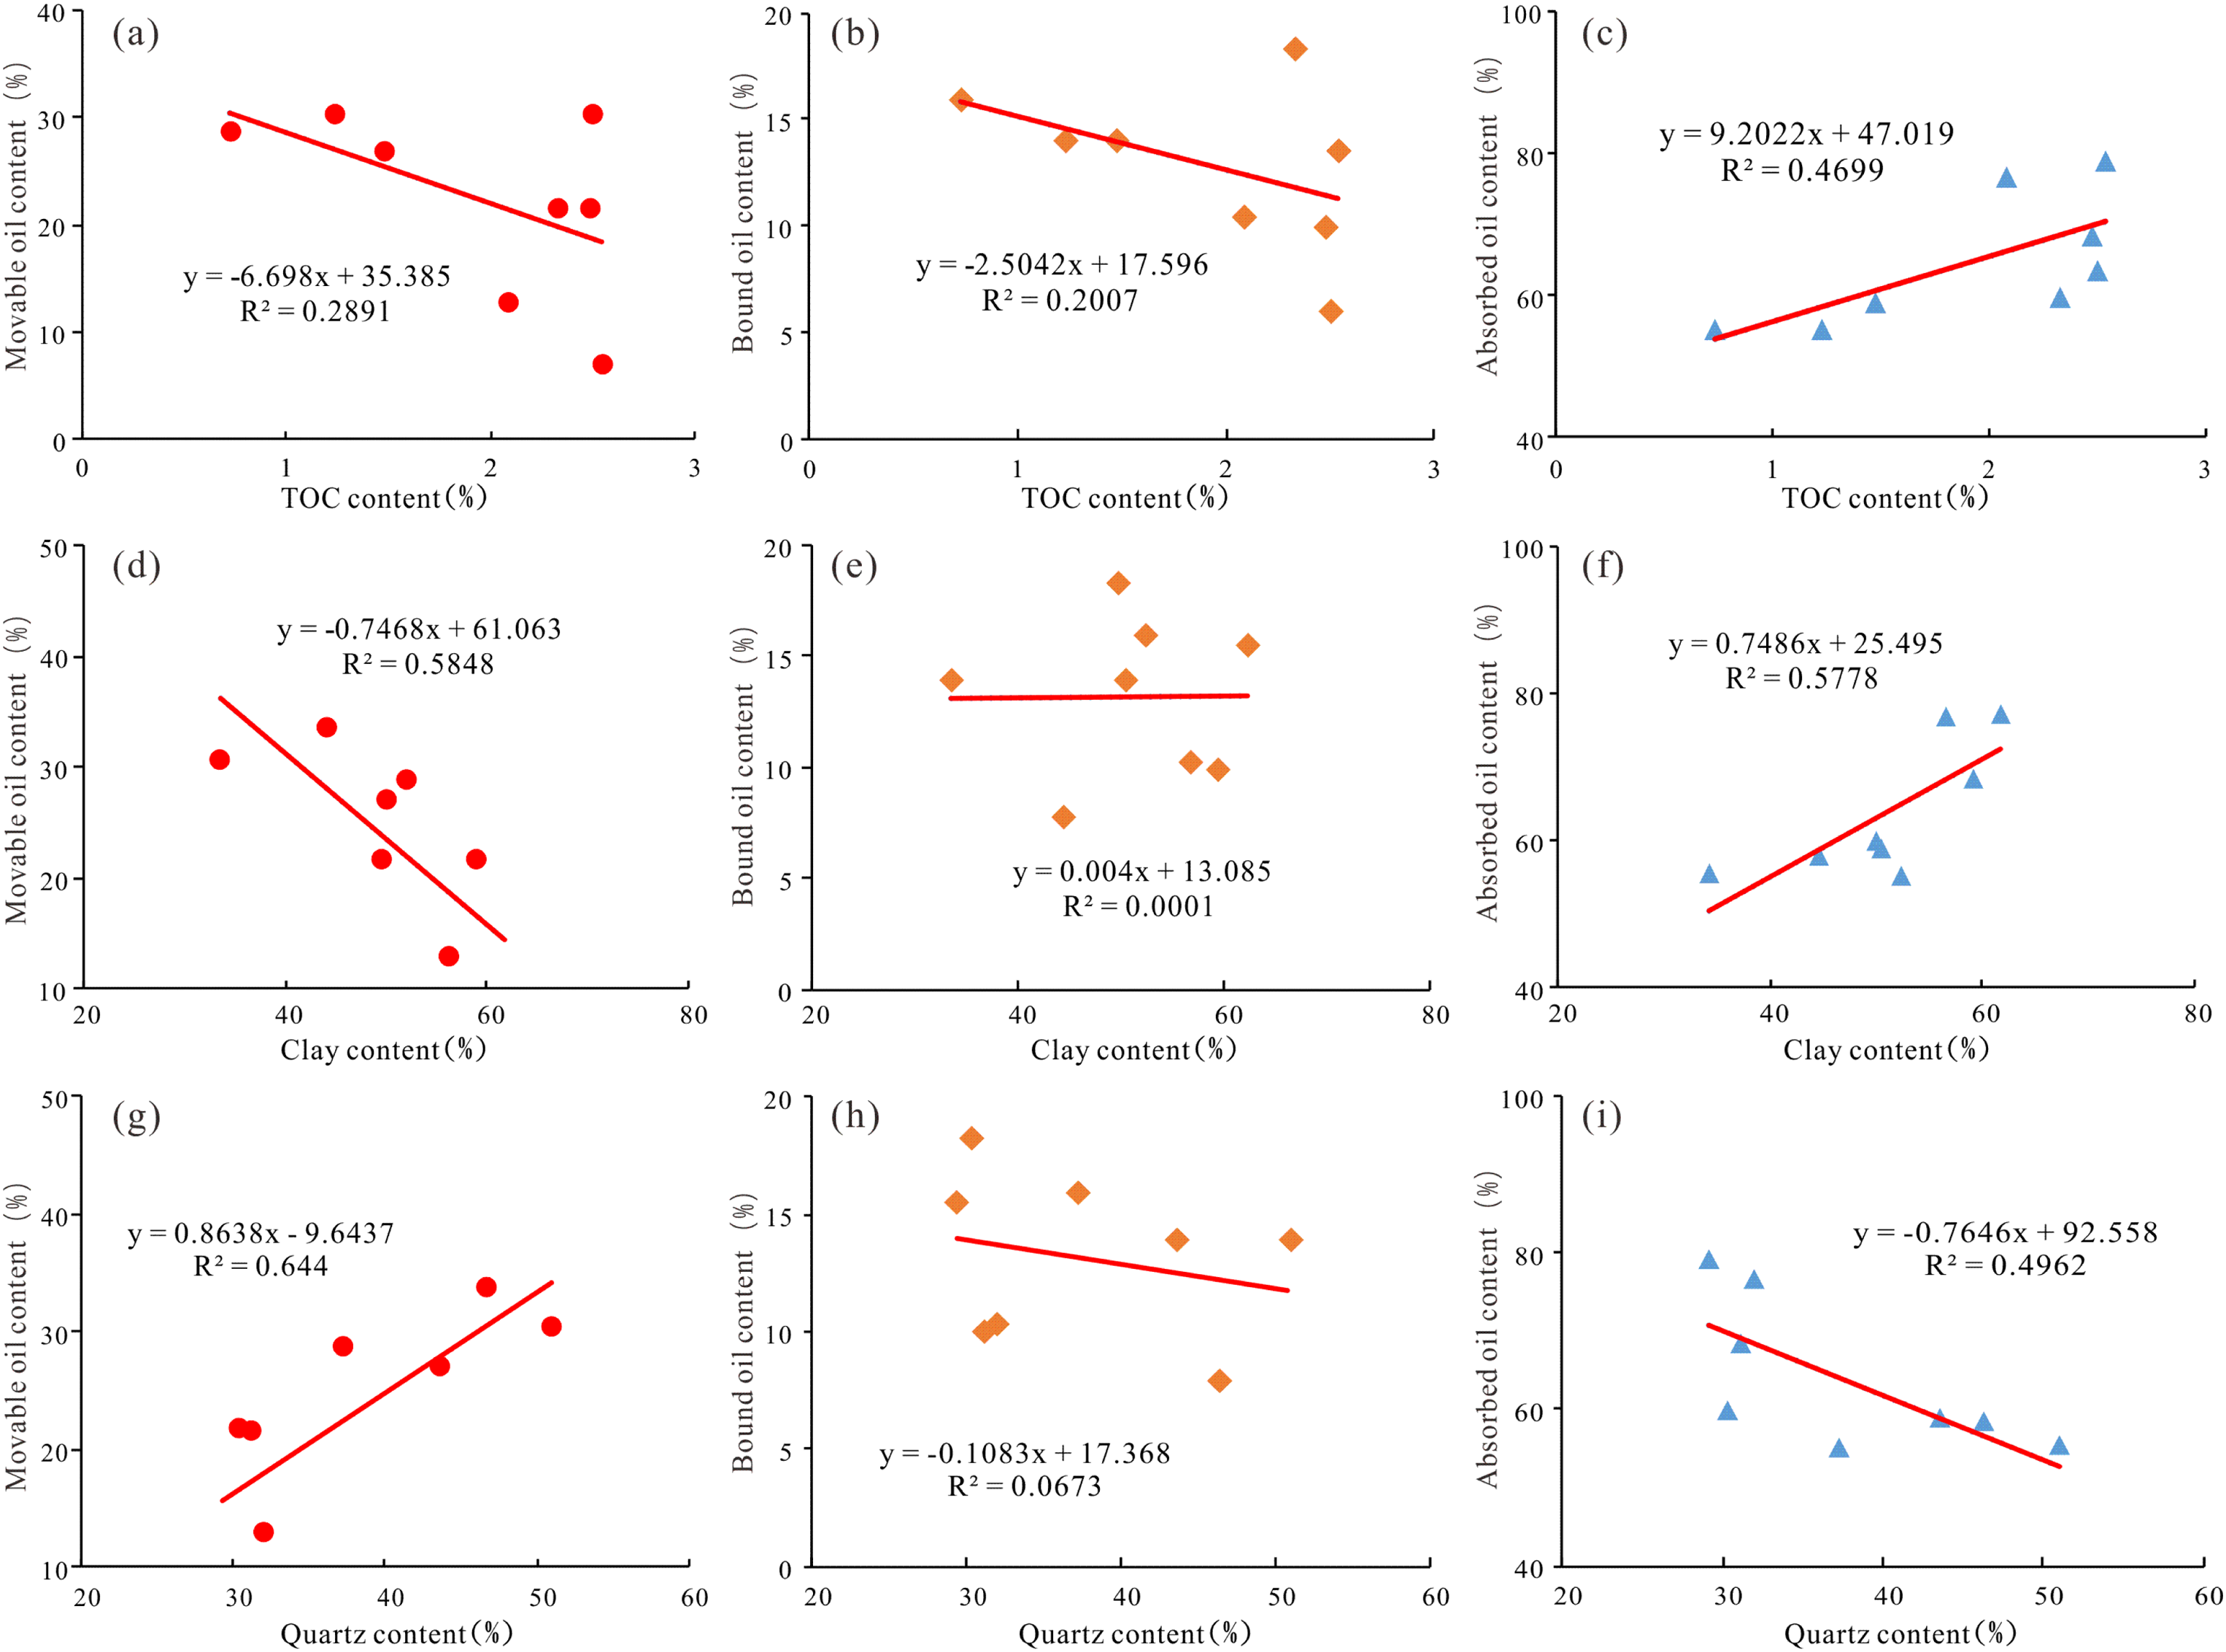
The correlation between Toc, Clay, Quartz, and Fluids in different occurrence states.
Fractal theory was first used in the field of materials science to describe irregular and geometrically disordered objects. Classical Euclidean geometry uses integer dimensions 1, 2 and 3 to depict ordered objects such as curves, surfaces, and cubes, respectively. But many disordered and irregular objects do not follow Euclidean's description. Because they use scale-dependent measures of length, area, and volume. Such objects are called fractals and are described by a non-integral dimension called fractal dimension (Yu and Cheng, 2002). Fractal theory is often used to characterize the pore structure and surface irregularities of porous materials and evaluate the pore heterogeneity of shale. In order to study the relationship between pore structure and fluid occurrence, this study classified shale pores based on NMR T2 spectrum characteristics of eight saturated oil shales. The calculation formula of NMR fractal dimension is as follows (Zhang et al., 2020):
The mathematical model of NMR fractal theory is as follows:

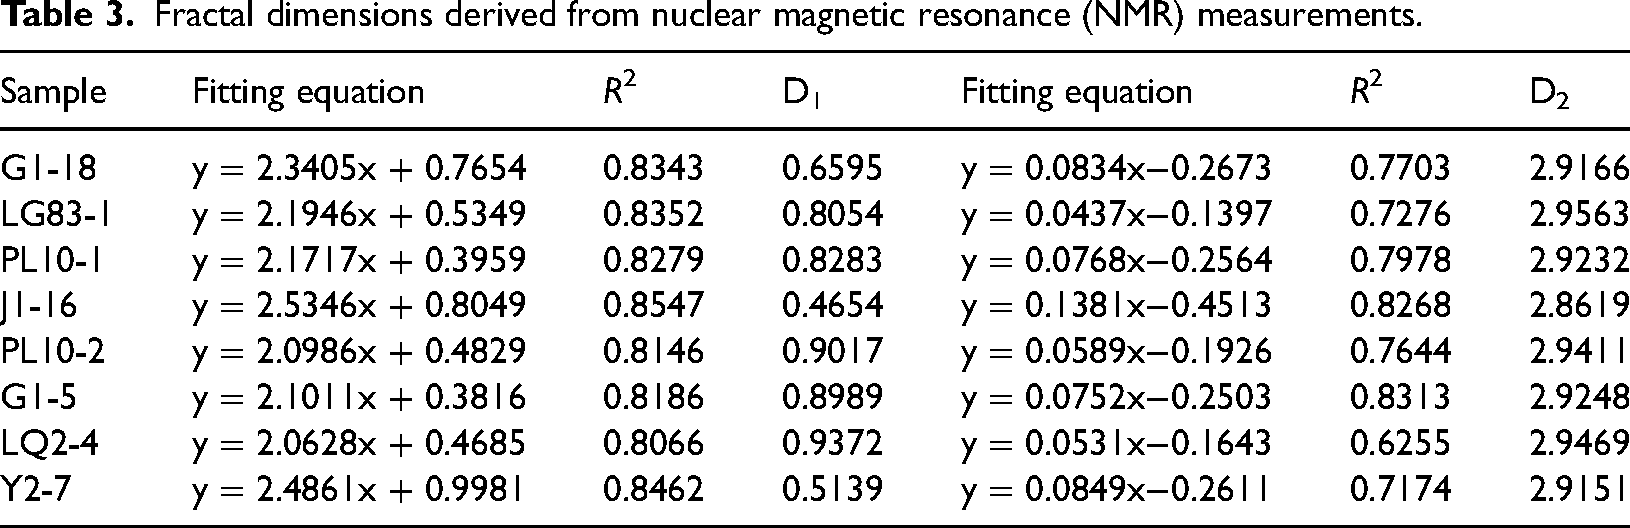
Fractal theory indicates that the elements of the same fractal dimension usually have some self-similarity, so the pores within a certain scale range have similar properties. Fractal dimension can be used as an important basis for pore clustering analysis. According to the fractal theory (Equation (8)), the double logarithmic coordinates of SV-T2 are drawn as shown in Figure 12. Figure 12 shows Da’anzhai shale can be divided into two types of pores according to the fractal dimension. The fractal dimension, fractal trend line fitting formula and correlation coefficient of each type of pore are recorded in Table 3. For Da’anzhai shale, D1 is the fractal dimension of small pores, with values ranging from 0.6595 to 0.9372, while D2 represents the fractal dimension of large pores and microfractures, with values ranging from 2.8859 to 2.9563. In addition to pore structure parameters, pore fractal characteristics and fractal dimension can quantitatively characterize pore complexity and heterogeneity (Chen et al., 2021a), D2 is significantly higher than D1, reflecting that the complex macropore–macropore and pore-fracture configuration relationship may promote the flow of shale oil (Chen et al., 2021a), which further supporting that the configuration of OM-related fractures and brittle mineral-related fractures may be the dominant channels for shale oil flow (Figure 3(l)).
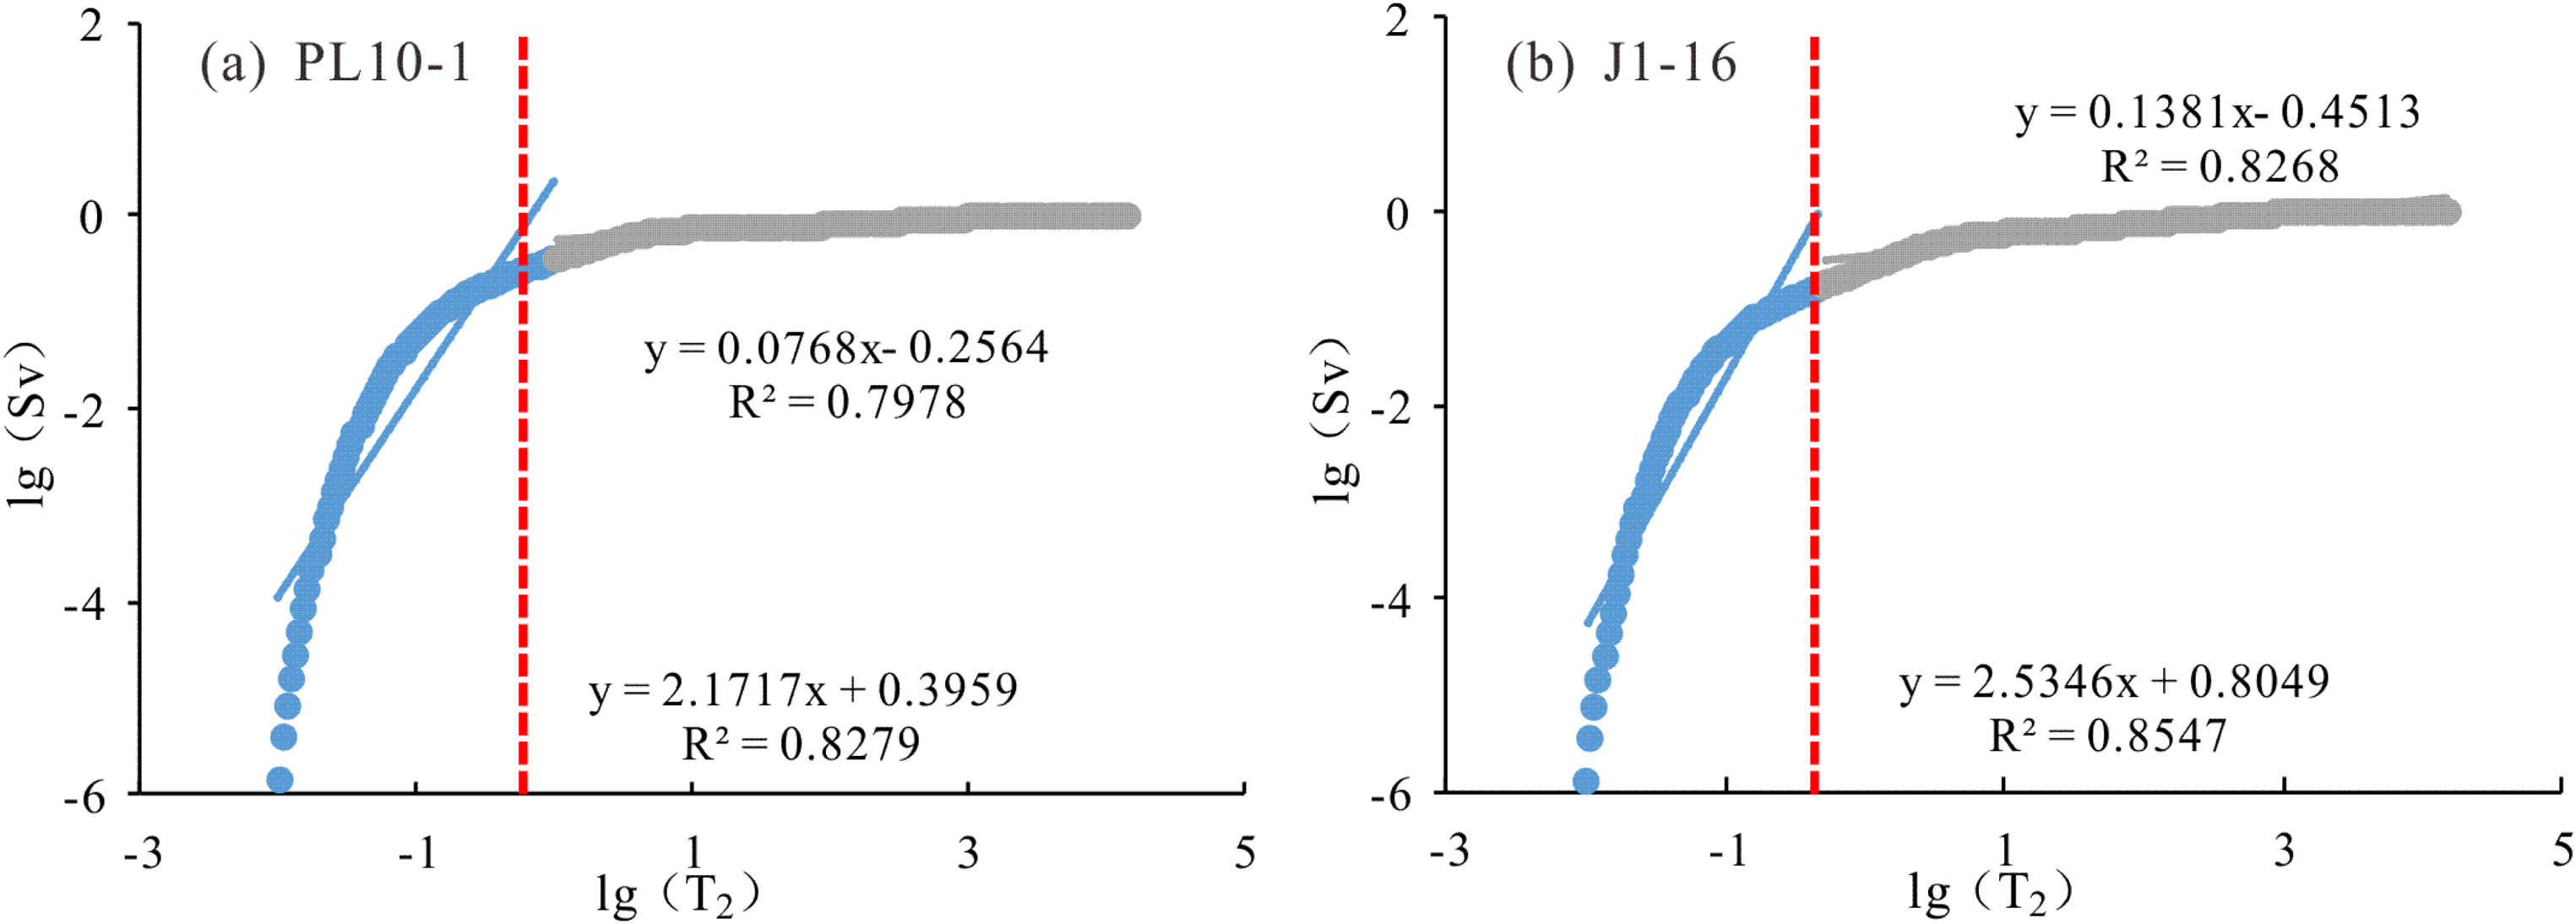
Nuclear magnetic resonance (NMR) fractal characteristics of shales. Da’anzhai shale can be divided into two types of pores according to the fractal dimension.
Fractal dimensions derived from nuclear magnetic resonance (NMR) measurements.
D1 and D2 show negative correlations with movable oil, whereas D1 and D2 show positive correlations with absorbed oil (Figure 13(a), (c), (d), (f)). These findings are in agreement with previous studies: Yang et al. (2014) believed that with the increase of fractal dimension, the shape of shale pores transforming from regular to complex, which reduced the permeability, made the pore fluid occurrence state more complex, and reduced the fluid migration capacity (Shao et al., 2017). As the complexity of the micropore surface increases, shale oil will have more adsorption space, and the content of adsorbed oil will increase significantly. In contrast, the increase in fractal dimension leads to the development of more micropores, which in turn reduces the movable oil content. In addition, D1 and D2 show a weak positive correlation with bound oil, the increase in the complexity of the pore structure will generate more bound pores (20–350 nm), thus increasing the bound oil content.
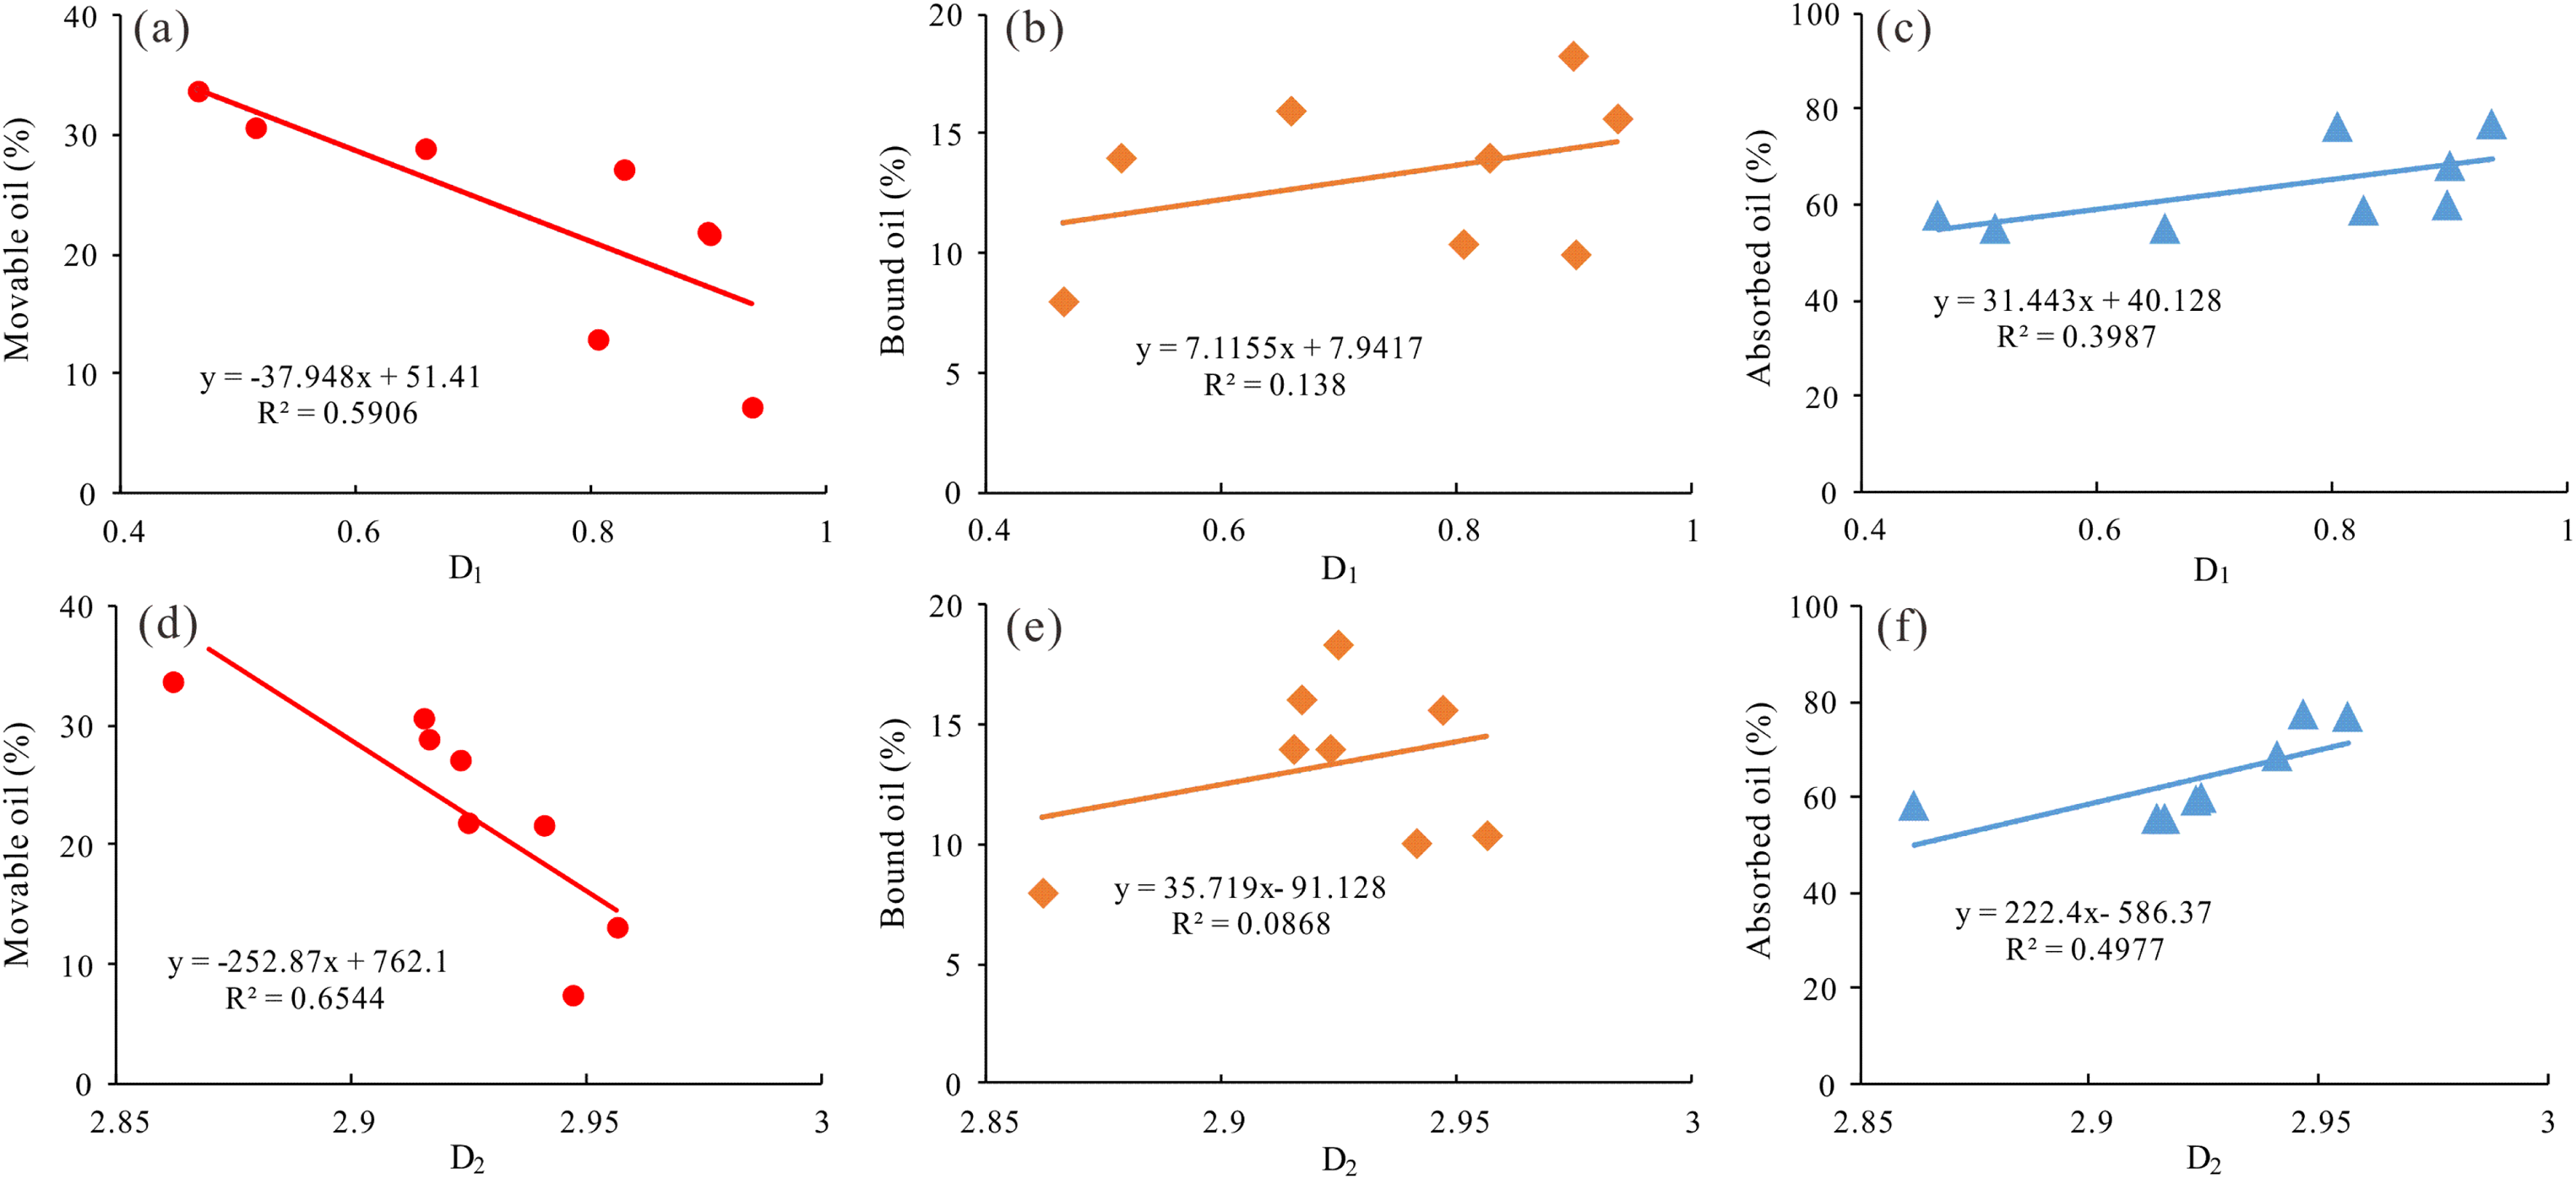
Correlation between fractal dimension and shale oil with different occurrence states.
Occurrence state model of shale oil
Pore structure affects shale oil occurrence and migration. In brittle mineral-inorganic pores with a pore size larger than 350 nm, shale oil is mainly movable oil, which exists in the form of spherical oil droplets (Figure 14(a), (c), (d)), so it can flow freely. In particular, the pore-fracture configuration type shale in which the OM-related fractures are in contact with the brittle mineral-related fractures has higher fluid flow capacity (a large number of such microfractures are observed through SEM in J1–16 and PL10–1, suggesting higher movable oil content). With the increase in burial depth, kerogen generates oil, which is transported outward through OM-related fractures, and brittle mineral-related fractures not only provide channels for oil migration but also are the main storage space for oil.
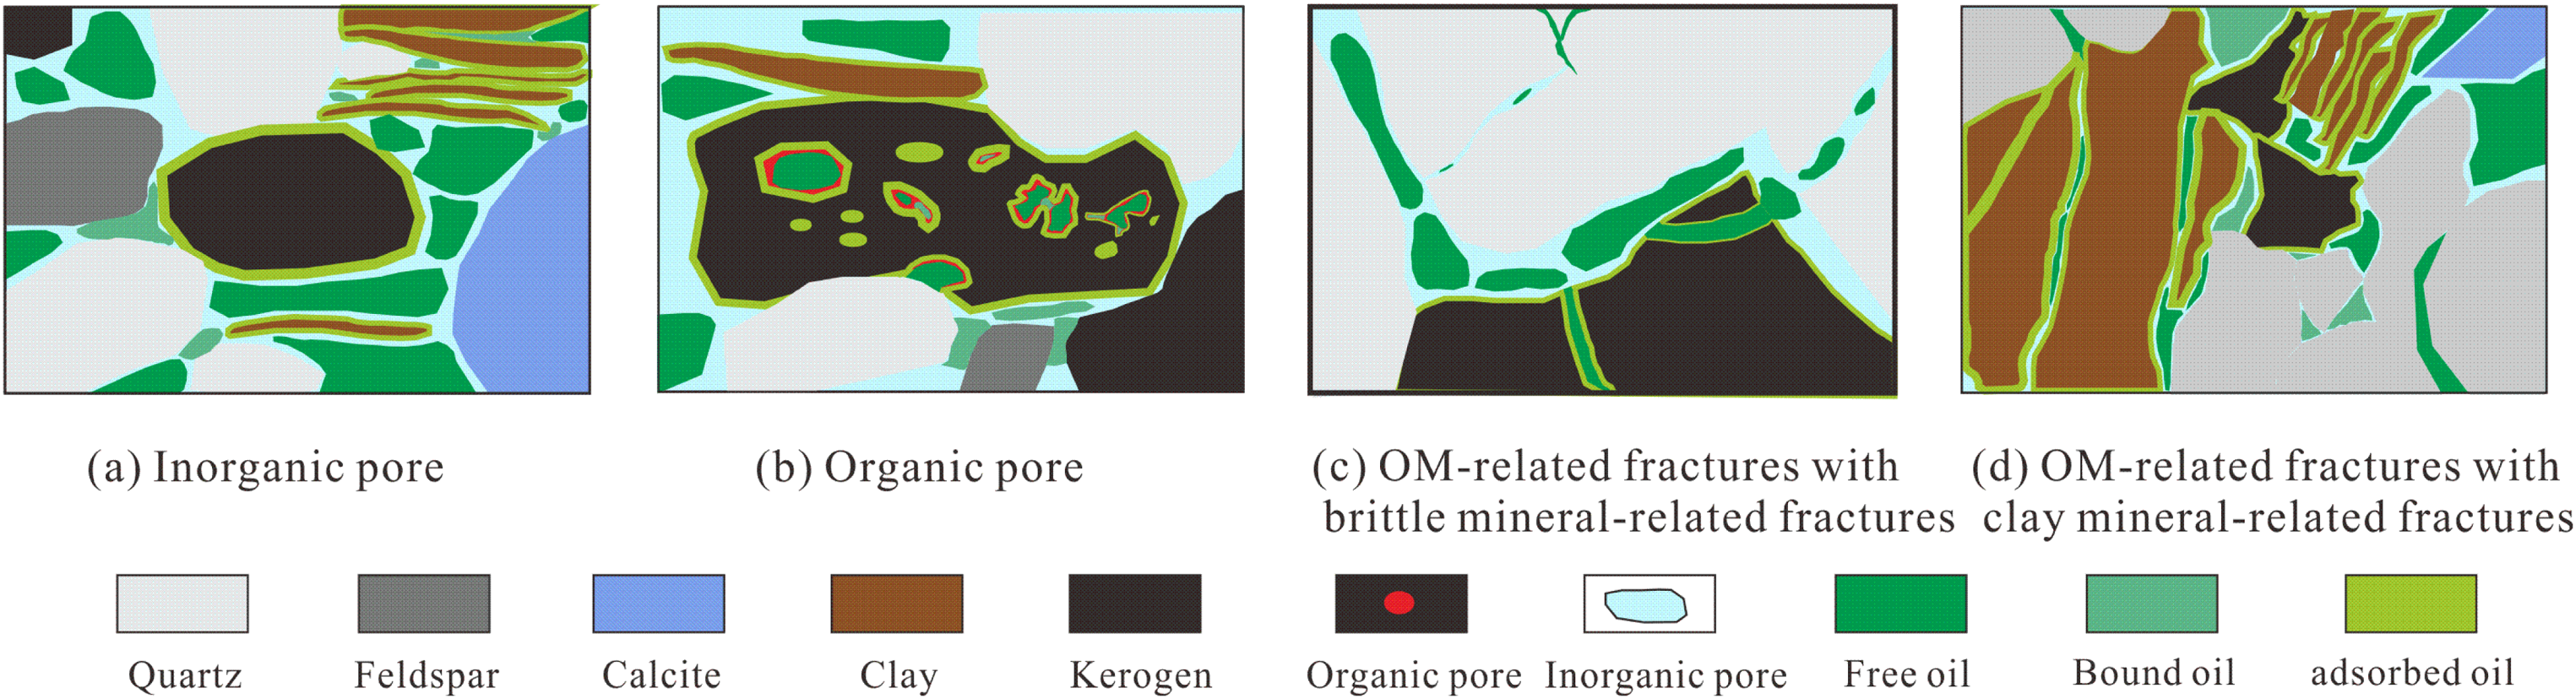
Occurrence of shale oil in pores of different shapes and sizes.
Shale oil exists in an adsorbed state in pores smaller than 30 nm. Due to the interaction of van der Waals and Coulomb forces, the adsorbed oil exists in the form of high-density “solid” on the surface of organic matter and minerals (Figure 14(b)), which has poor fluidity and cannot be recovered (Hu et al., 2021). Figure 11(b), (e) and (h) shows that there is no obvious correlation between bound oil and mineral composition, but a weak positive correlation between bound oil and fractal dimension D1 and D2 (Figure 13(b) and (e)), indicating that bound oil content is not related to pore type, but to pore size. The bound oil mainly occurs in the organic and inorganic pores of 30–350 nm (Figure 14(a)–(b)).
Conclusion
In this study, gas adsorption, MICP, and SEM were used to describe the pore structure characteristics of lacustrine shale. The occurrence and mobility of lacustrine shale oil were studied by drying and high-speed centrifugation experiment based on NMR. The main conclusions of this study are as follows:
Nano-micro scale pores are developed in the Da’anzhai lacustrine shale in Sichuan Basin. The pore development degree of different samples is obviously different, but all of them are characterized by a high development degree of nano-pores and micro-fractures. SEM images reveal that the pore development degree of depositional organic matter is poor, while the migration of organic matter develops a large number of organic pores, and the pore morphology is bubble-like with a PSD of 50–800 nm. The full-scale PSD curves show that pores of 100–1000 nm are the main storage space. The PSD of SEM image is inconsistent with the full-scale PSD, which may be caused by the small size of SEM sample. The oil-saturated plug sample is centrifuged at 12,000 rpm to acquire movable oil, broken and centrifuged at 12,000 rpm to obtain bound oil, and the rest is adsorbed oil. The variation of NMR T2 spectrum in different states reflects the content of shale oil in different occurrence states, and T2 cutoff value can also be acquired. The movable oil content is low, with an average of 21.4%, the bound oil averaged 12.4%, while the adsorbed oil content is high, with an average of 66.2%. Movable oil mainly occurs in brittle mineral pores with pore size larger than 350 nm, bound oil occurs in 30–350 nm, and pores smaller than 30 nm mainly store adsorbed oil. The occurrence and flow of shale oil are controlled by the macroscopic characteristics and pore structure. High TOC content can generate more shale oil, but TOC and clay minerals also have strong adsorption capacity, which is not conducive to shale oil flow. Brittle minerals such as quartz provide a large number of inorganic pores and microfractures, which not only provide a large amount of storage space but also provide an advantageous passage for shale oil migration. The fracture configuration relationship between organic matter and brittle mineral is more beneficial to shale oil migration. In addition, the increase in pore structure complexity positively affects the contact area between shale oil and pores and forms more adsorption pores and bound pores.
Footnotes
Declaration of conflicting interests
The author(s) declared no potential conflicts of interest with respect to the research, authorship, and/or publication of this article.
Funding
The author(s) disclosed receipt of the following financial support for the research, authorship, and/or publication of this article: This work was supported by the National Natural Science Foundation of China (Grant No. 42272171) and Shale Gas Evaluation and Exploitation Key Laboratory of Sichuan Province.