
Abstract
Terrestrial shale strata generally has frequent and strong heterogeneity characteristics, thus affecting shale gas enrichment and target selection. In this study, samples from the Da’anzhai Member of Well A in Yuanba area have performed a series of experiments including total organic carbon (TOC) content measurement, rock pyrolysis, organic petrology, vitrinite reflectance (Ro), whole-rock mineral composition, thin section analysis, focused ion beam scanning electron microscope, high-pressure Hg injection, nitrogen (N2) adsorption, and methane (CH4) isothermal adsorption. The results show that: (1) Da'anzhai (J1da) Member is a set of mixed sediments with various lithology, which consists of black shale and well-developed siltstone and carbonate rocks interlayers. The second section of the Da'anzhai Member (J1da2) has relatively greater organic matter abundance (1.24%TOC), better organic matter type dominated by type III and II, as well as higher maturity (1.67%Ro), which is the most favorable section of J1da. (2) J1da2 shale strata can be divided into three shale lithofacies types, two interlayer lithofacies types, and three macro-lithofacies assemblage types. Among them, mudstone–limestone lithofacies assemblage (type AB-I) has preferable hydrocarbon generation conditions, better reservoir properties, and more developed shell limestone interlayers with better fracturing performance, is thought the most favorable interval. (3) The optimal interval and horizontal target of J1da2 are further selected based on the source–reservoir coupling relationship, corresponding to the depth is 3909–3914 m, which imply the optimal horizontal target window for Well A. This study has application values not only for the identification of “sweet intervals” and well location deployment of J1da but also supports the later systematic studies of shale gas accumulation mechanism and enrichment regularity in Yuanba area.
Introduction
Shale gas production in the United States increases from 110 × 108 m3 in year 2000 to 7330 × 108 m3 (approximately 80% of U.S. dry gas production) in year 2020, leading to the tendency of natural gas rapid development in the world. Major gas-producing shales in the United States indicated that the organic-rich shales, from early mature to over mature with varying organic matter (OM) abundance, contained sufficient natural gas for commercial production, which arouse high expectations for shale gas in other countries such as China (Hao et al. 2013; Li et al. 2019a, 2022a).
Since the commercial development of shale gas in the Wufeng–Longmaxi Formation (WF-LM Fm.) of Well JY1 in year 2012, China has successively discovered several marine shale gas fields. Nowadays, terrestrial shale gas has been actively explored as a supplement (Cai et al. 2021; Zou et al. 2019). Jurassic strata in the Sichuan Basin is a focus. Recently, a few wells have obtained industrial oil and gas flow in the terrestrial Jurassic Dongyuemiao and Lianggaoshan (Qianfoya) Formations, indicating that the Jurassic strata may also have a good prospect for terrestrial shale oil and gas exploration (Guo et al. 2021; Hu et al., 2021). However, the geological researches and exploration practices in the Jurassic Da'anzhai Member (J1da) were relatively hysteretic due to the complex geological features and lack of the latest drilling data. Some typical outcomes were as follows. Zhou et al. (2020) analyzed the geological characteristics of J1da shale in the northeastern Sichuan Basin. Hu et al. (2021) and Liu et al. (2021) made a probe into the source–reservoir characteristics and coupling evaluations for the J1da shale reservoir. Xiao et al. (2021) made clear the sedimentary environment of J1da shale and established the OM enrichment model in the central Sichuan Basin. Feng (2022) pointed out that Fuxing and Yuanba areas were the favorable exploration areas of J1da shale gas using the GIS technology. Overall, it was recognized that J1da shale had good source and reservoir conditions, conducive to shale gas accumulation and enrichment. Nevertheless, more complex lithology made shale gas enrichment law more intricate and sweet spot optimization more difficult (Liu et al. 2019, 2021; Zhou et al. 2020). It was one of the key issues that restricted the stereoscopic development of Jurassic shale strata in the Sichuan Basin (Liu et al. 2019; Hu et al. 2021).
To better evaluate geological features and optimize sweet intervals of shale strata, “six properties” were usually comprehensively described (Guo et al., 2016). The “six properties” refer to lithological property, geochemical property, reservoir property, gas-bearing property, fracturability property, and electric property. In this study, a typical Well A aiming at the J1da shale in the Yuanba area was taken as an example to carry out a series of experimental tests on the “six properties.” Then the favorable geochemical intervals and reservoir intervals were further selected. Finally, the preferred horizontal target window of Well A was optimized. This study not only has great significance to the identification of “sweet intervals” and well location deployment of the J1da strata but also supports the later systematic studies of shale gas accumulation mechanism and enrichment regularity in the Yuanba area.
Geological settings
The study area Yuanba is located on the northern margin of the Yangtze plate, in the transition zone between the Central Sichuan uplift and the Northern Sichuan depression. It belongs to the superimposed block of the Micangshan arc tectonic belt, Dabashan arc tectonic belt, and Eastern Sichuan arc fold belt (Guo et al. 2021) (Figure 1).
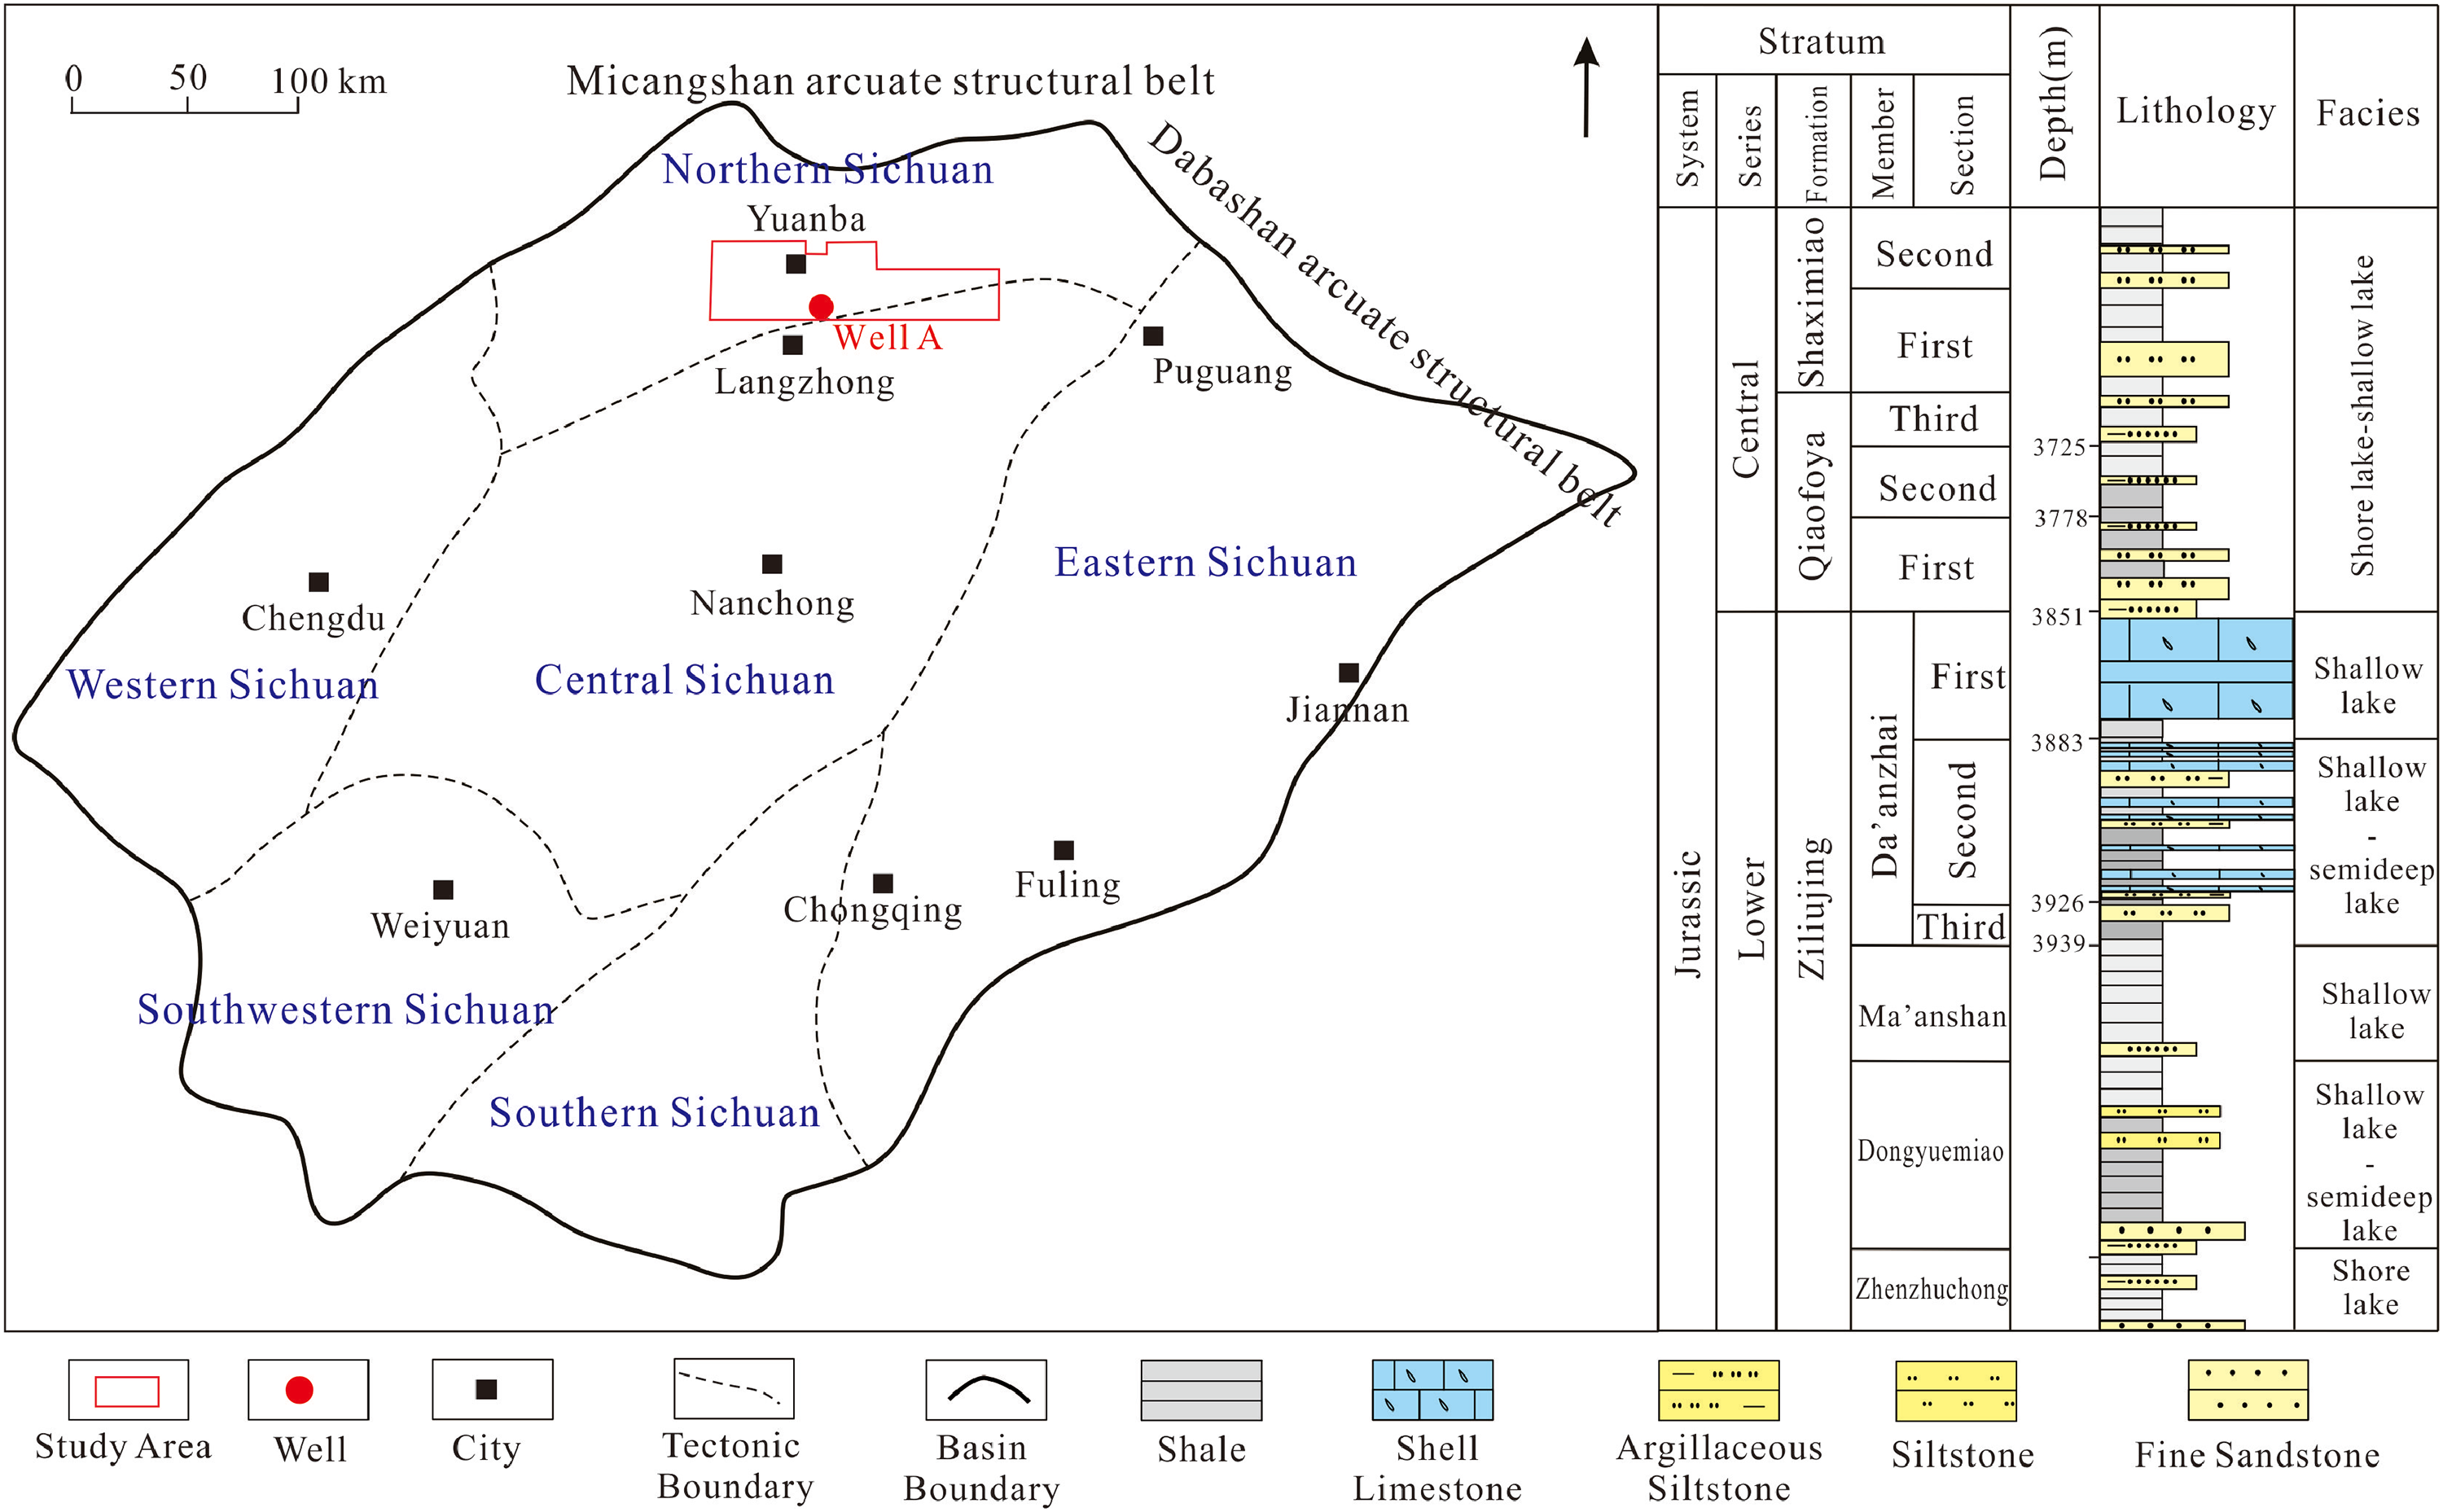
Regional structure of Sichuan Basin and stratigraphic histogram of Jurassic strata in the Yuanba area.
In the early Jurassic, the Northeast Sichuan Basin evolved into an inland lake, deposited a set of clastic rocks mainly composed of lacustrine facies interbedded with river-deltas. During the Da’anzhai period, it was a deep lake, semi-deep lake, and shallow lake environment, while the lake extent significantly reduced during the Qianfoya period. It was mainly due to the migration of the sedimentary center from the northeast to the southeast of Sichuan Basin. In the late Jurassic, the northeast Sichuan Basin evolved into a shallow lake environment (Liu et al. 2019, 2021; Zhou et al. 2020). Due to the evolution of the depositional environment, several sets of dark mudstone layers were deposited in the Jurassic period in the Yuanba area, shown in Figure 1. Among the formations and members, the J1da developed shell limestone and gray-black shale, showing a good source–reservoir coupling relationship and great exploration potential (Zhou et al., 2013, 2020).
Due to the frequent lake-level fluctuations and complex sediment provenances, the J1da strata showed obvious heterogeneity among different sections and layers (Wang et al. 2019; Zhou et al. 2020). According to the lithological characteristics, J1da can be divided into three sections. The lake level reached the maximum flooding during the second section of Da'anzhai (J1da2) deposition period. In this period, a few sedimentation centers formed in the south of Yuanba area and the west of Fuling area, in favor of developing good conditions for shale gas reservoir (Zhou et al. 2020).
Samples and methods
In order to systematically analyze the “six properties” and select the favorable target of J1da shale in the study area, more than 100 core samples were collected from the typical exploratory Well A in the southern Yuanba area. The location of Well A is shown in Figure 1. The sampling depth is 3883–3925 m with intervals 0.36–1.54 m. Then all or part of the core samples were performed laboratory tests including total organic carbon (TOC) determination, rock-eval pyrolysis, organic maceral analysis, organic carbon isotope, X-ray diffraction, conventional physical property, thin section observation, field emission scanning electron microscopy (FIB-SEM), computed tomography scanning, high-pressure mercury (Hg) intrusion, low-temperature nitrogen (N2) adsorption, and high-pressure methane (CH4) isothermal adsorption.
The TOC content was obtained using a LECO CS230 carbon–sulfur analyzer, and the experiment was conducted at 22ion.d. Vitrinite reflectance (Ro, %) values were identified using an MPM-80-type micro-spectrophotometer and a 614-B-type electronic AC voltage regulator on an optical sheet made of kerogen (Li et al., 2018). Rock-eval pyrolysis was conducted with pyrologger Rock-Eval6 apparatus, following the procedure suggested by Behar et al. (2001), and then pyrolytic parameters including S1, S2, and Tmax were acquired. Organic carbon isotope of kerogen was an effective index to determine OM type. It was operated on the stable isotope ratio mass spectrometer DELTA PLUS V. The values of δ13C were obtained (Jalil et al., 2018).
To obtain the mineral composition information, the whole rock and clay mineral X-ray diffraction analysis was carried out (Li et al., 2022). Ground the pulverized samples to a particle size of less than 40 μm and then thin-sectioned. Drew spectrograms according to the XRD analysis and calculated the mineral content (Wang et al., 2016). According to the mineral compositions, typical samples were selected to perform thin section observation using the instrument IMAGER.A2M and the magnification 10 × 5. The casting thin section observation was performed for the interlayer samples using the instrument Imager A2m polarized fluorescence microscope with a magnification of 10 × 5.
For the purpose of observing pore structure features, the focused ion beam scanning electron microscope (FIB-SEM) was carried out under the device Helios650 FIB-SEM/AZtec XMAX 50. Sliced samples were prepared in the vertical bedding direction and carbon-plated in advance. The experimental process referred to Ma et al. (2014). Conventional physical property tests were carried out to obtain the porosity and permeability by the gas-liquid combination method under 27°C and 58% humidity conditions. The pore structure parameters were analyzed by the simultaneous detection of high-pressure mercury intrusion and low-temperature N2 adsorption. N2 adsorption experiments and analyses were conducted using ASAP 2460 and ASAP2020M automatic specific surface area analyzer. The Brunauer–Emmett–Teller (BET) theory and the Barrett–Joyner–Halenda theory were used to determine the corresponding pore structure parameters from N2 adsorption isotherms (Barrett et al., 1951). The AutoPore 9520 mercury porosimeter was used for the high-pressure mercury intrusion test with 414 MPa maximum test pressure and 0.48 N/m mercury surface tension. The contact angle θ was 140°, and the pore size measurement range was 1.5 nm–36.0 μm.
Shale gas content was obtained directly by the on-site gas desorption method, which was calculated from the core when it was removed from the formation to the ground (Yu et al., 2015). Another method to obtain the shale gas content was based on the CH4 isothermal adsorption experiment. It was carried out under high temperature and high pressure with Rubotherm gravimetric isothermal adsorption apparatus. The experimental temperature was 95°C. The ternary Langmuir model was used to fit the experimental data, and the key parameters of adsorption performance were obtained.
Results
Lithological properties
Core observation of Well A shows that the J1da strata is a typical lake sedimentation, which is a set of mixed sediments of shale, silt (fine) sandstone, and carbonate rocks with rapidly changed lithology and well-developed interlayers. To be specific, the first and third sections of J1da (J1da1 and J1da3) mainly develop gray shell limestone within the shallow lake high-energy zone. However, J1da2 mainly develops black-gray shale, dark-gray calcareous mudstone, silty mudstone, and shell limestone in the shallow and semi-deep lake facies, which can be seen as the most suitable interval for shale gas generation and reservoir (Li et al. 2020a) (Figure 2).
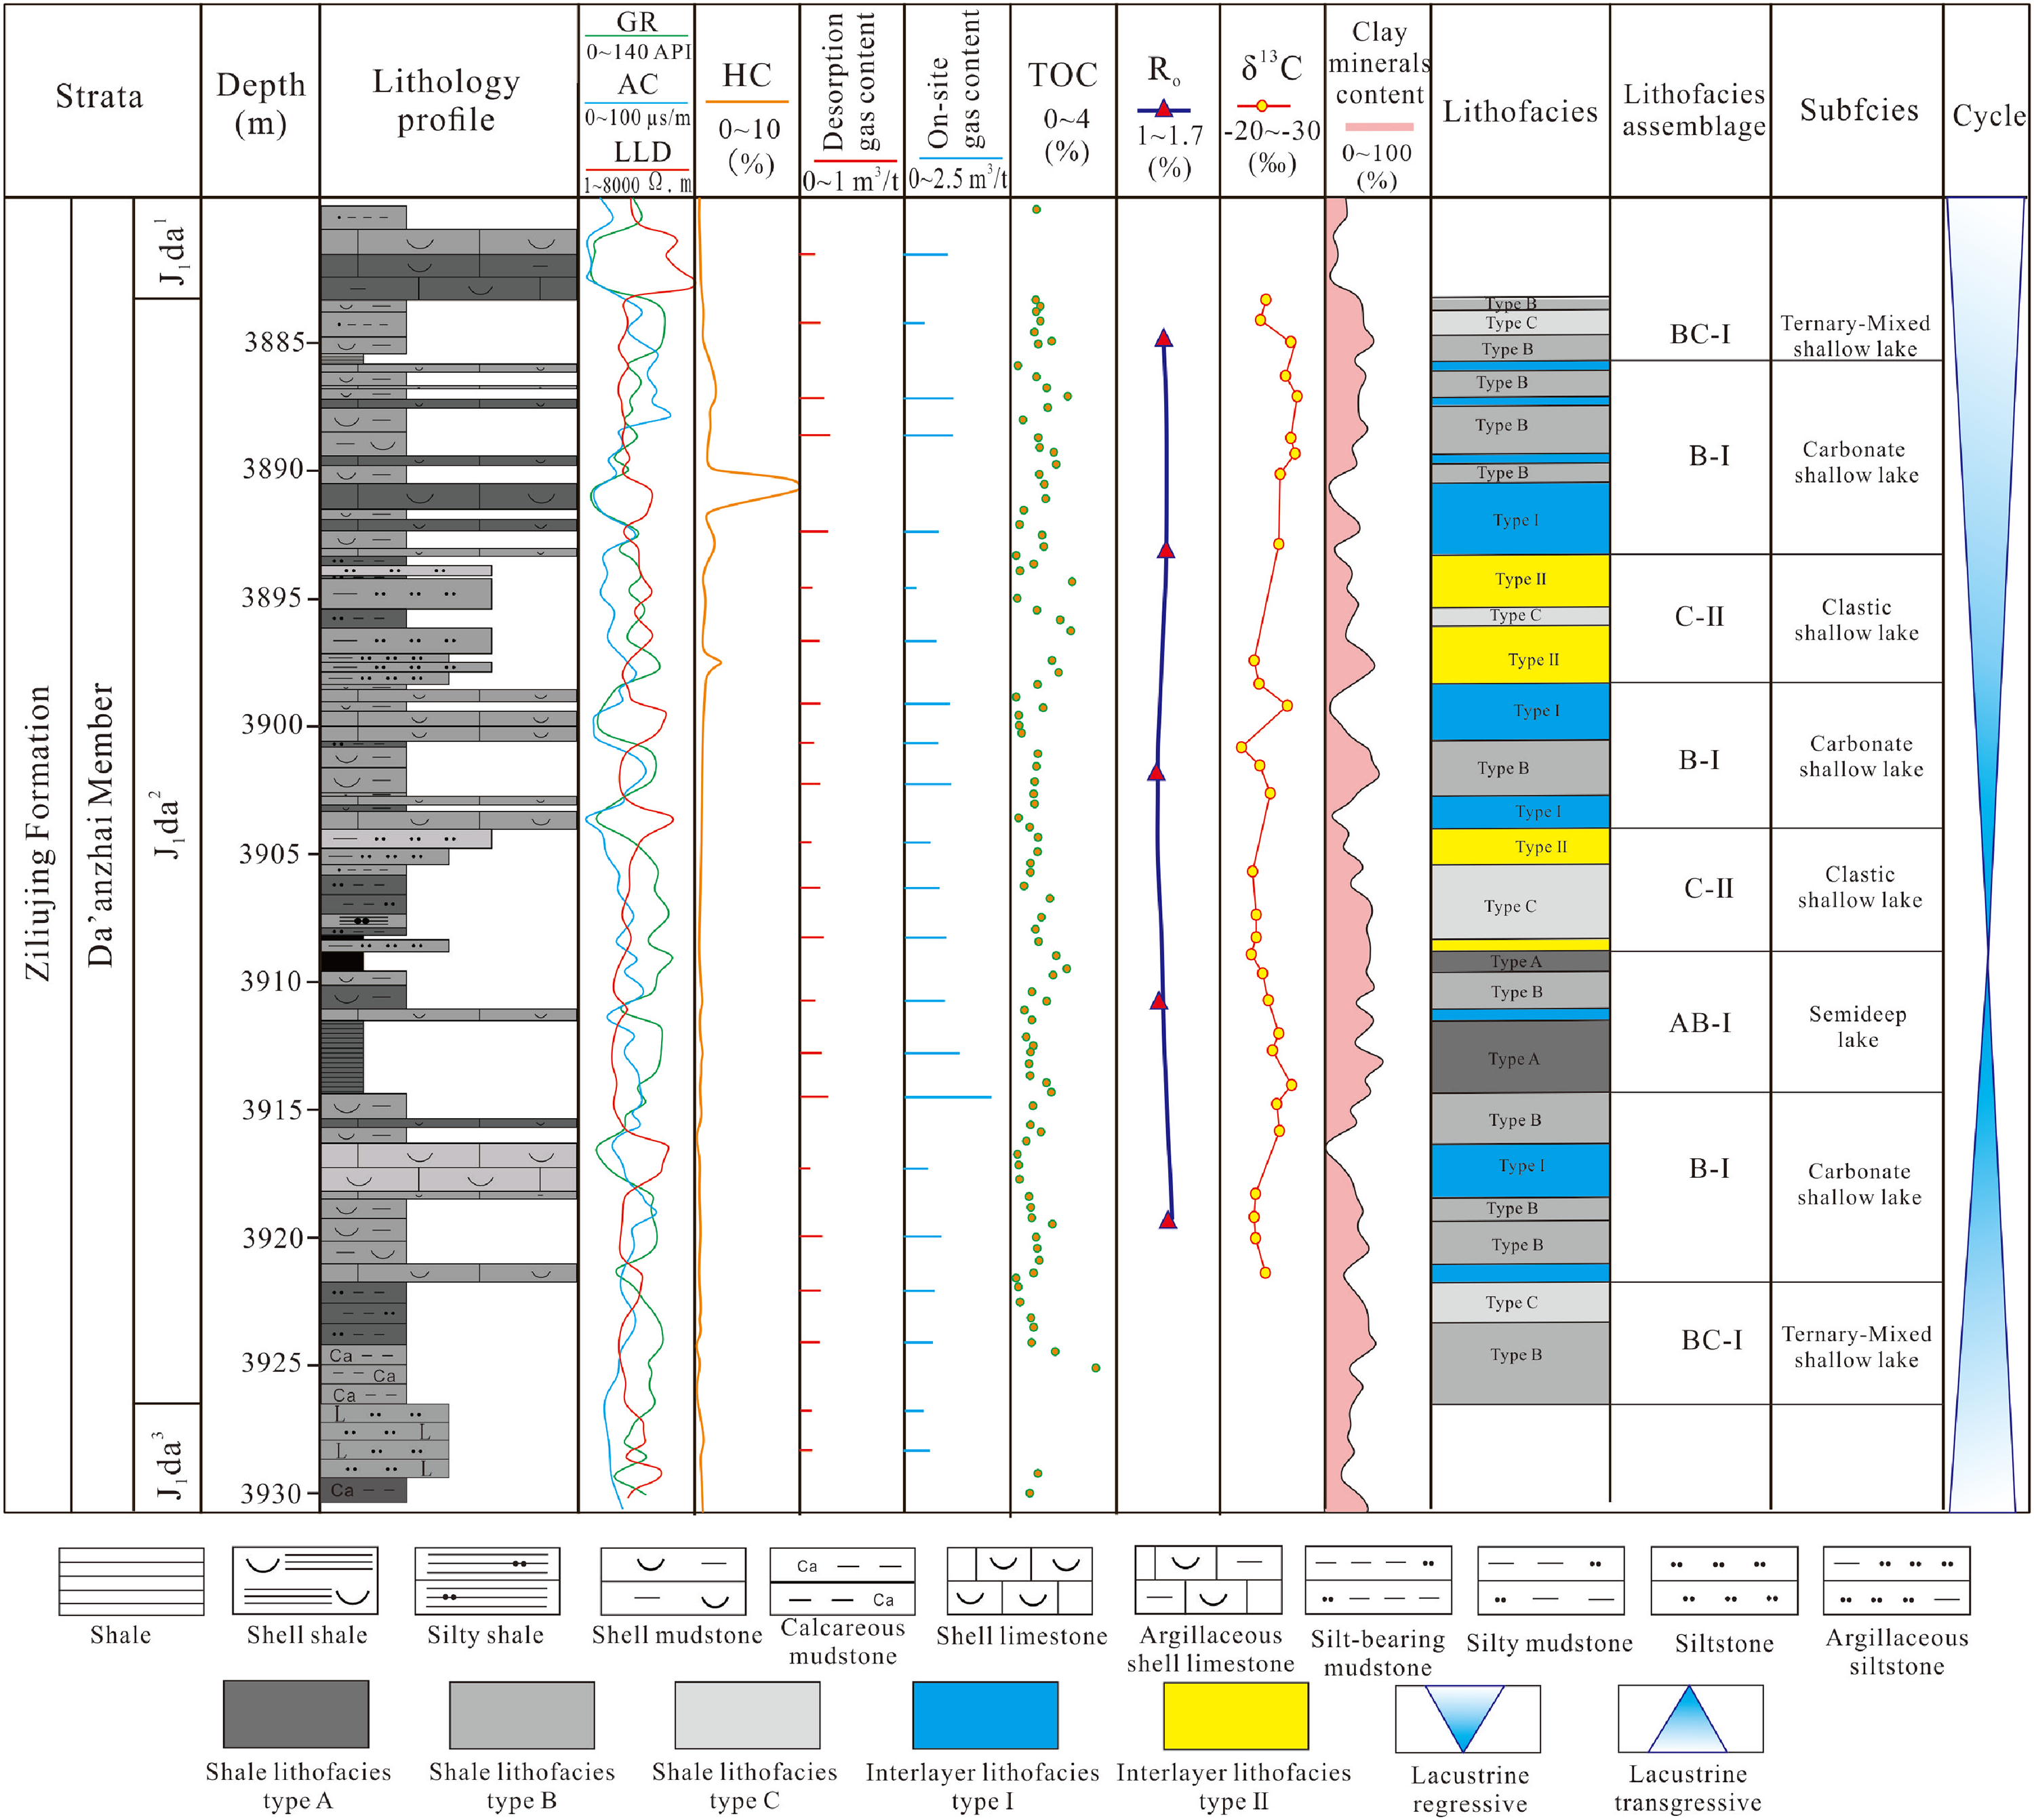
Comprehensive histogram of J1da shale strata of Well A in the study area.
Lithofacies were the sum of all lithological features in sedimentary rocks, including texture, color, stratification, structure, components, and grain-size distribution (Loucks and Ruppel 2007). Favorable lithofacies were the basis for shale oil and gas enrichment. According to the lithology analysis, the lithofacies of J1da2 are dominated by fine-grained (clay to silt size) sediment and skeletal limestone (Figure 2). In order to further analyze the lithofacies types and reservoir characteristics, 57 shale samples from the J1da2 strata were carried out for the rock X-ray diffraction analysis. Three shale lithofacies types were totally identified using the three-step lithofacies division method (whole rock mineral composition partition–TOC classification–correction and improvement of the mineral structure and sedimentary structure) proposed by Liu et al. (2019). They are clay shale lithofacies (type A), shell limy shale lithofacies (type B), and silty shale facies (type C). Representative characteristics of three types are listed in Table 1. Frequent interlayers are the typical feature of J1da strata in the Yuanba area compared with the marine WF-LM Fm. (Hu et al. 2021; Tang et al. 2020a; Zhu et al. 2017). Core observation and thin section analysis of 33 interlayer samples indicate that there are two interlayer lithofacies types, including shell limestone lithofacies (type I) and siltstone lithofacies (type II) (Table 1).
Characteristics of J1da2 shale and interlayer lithofacies types of Well A in Yuanba area.
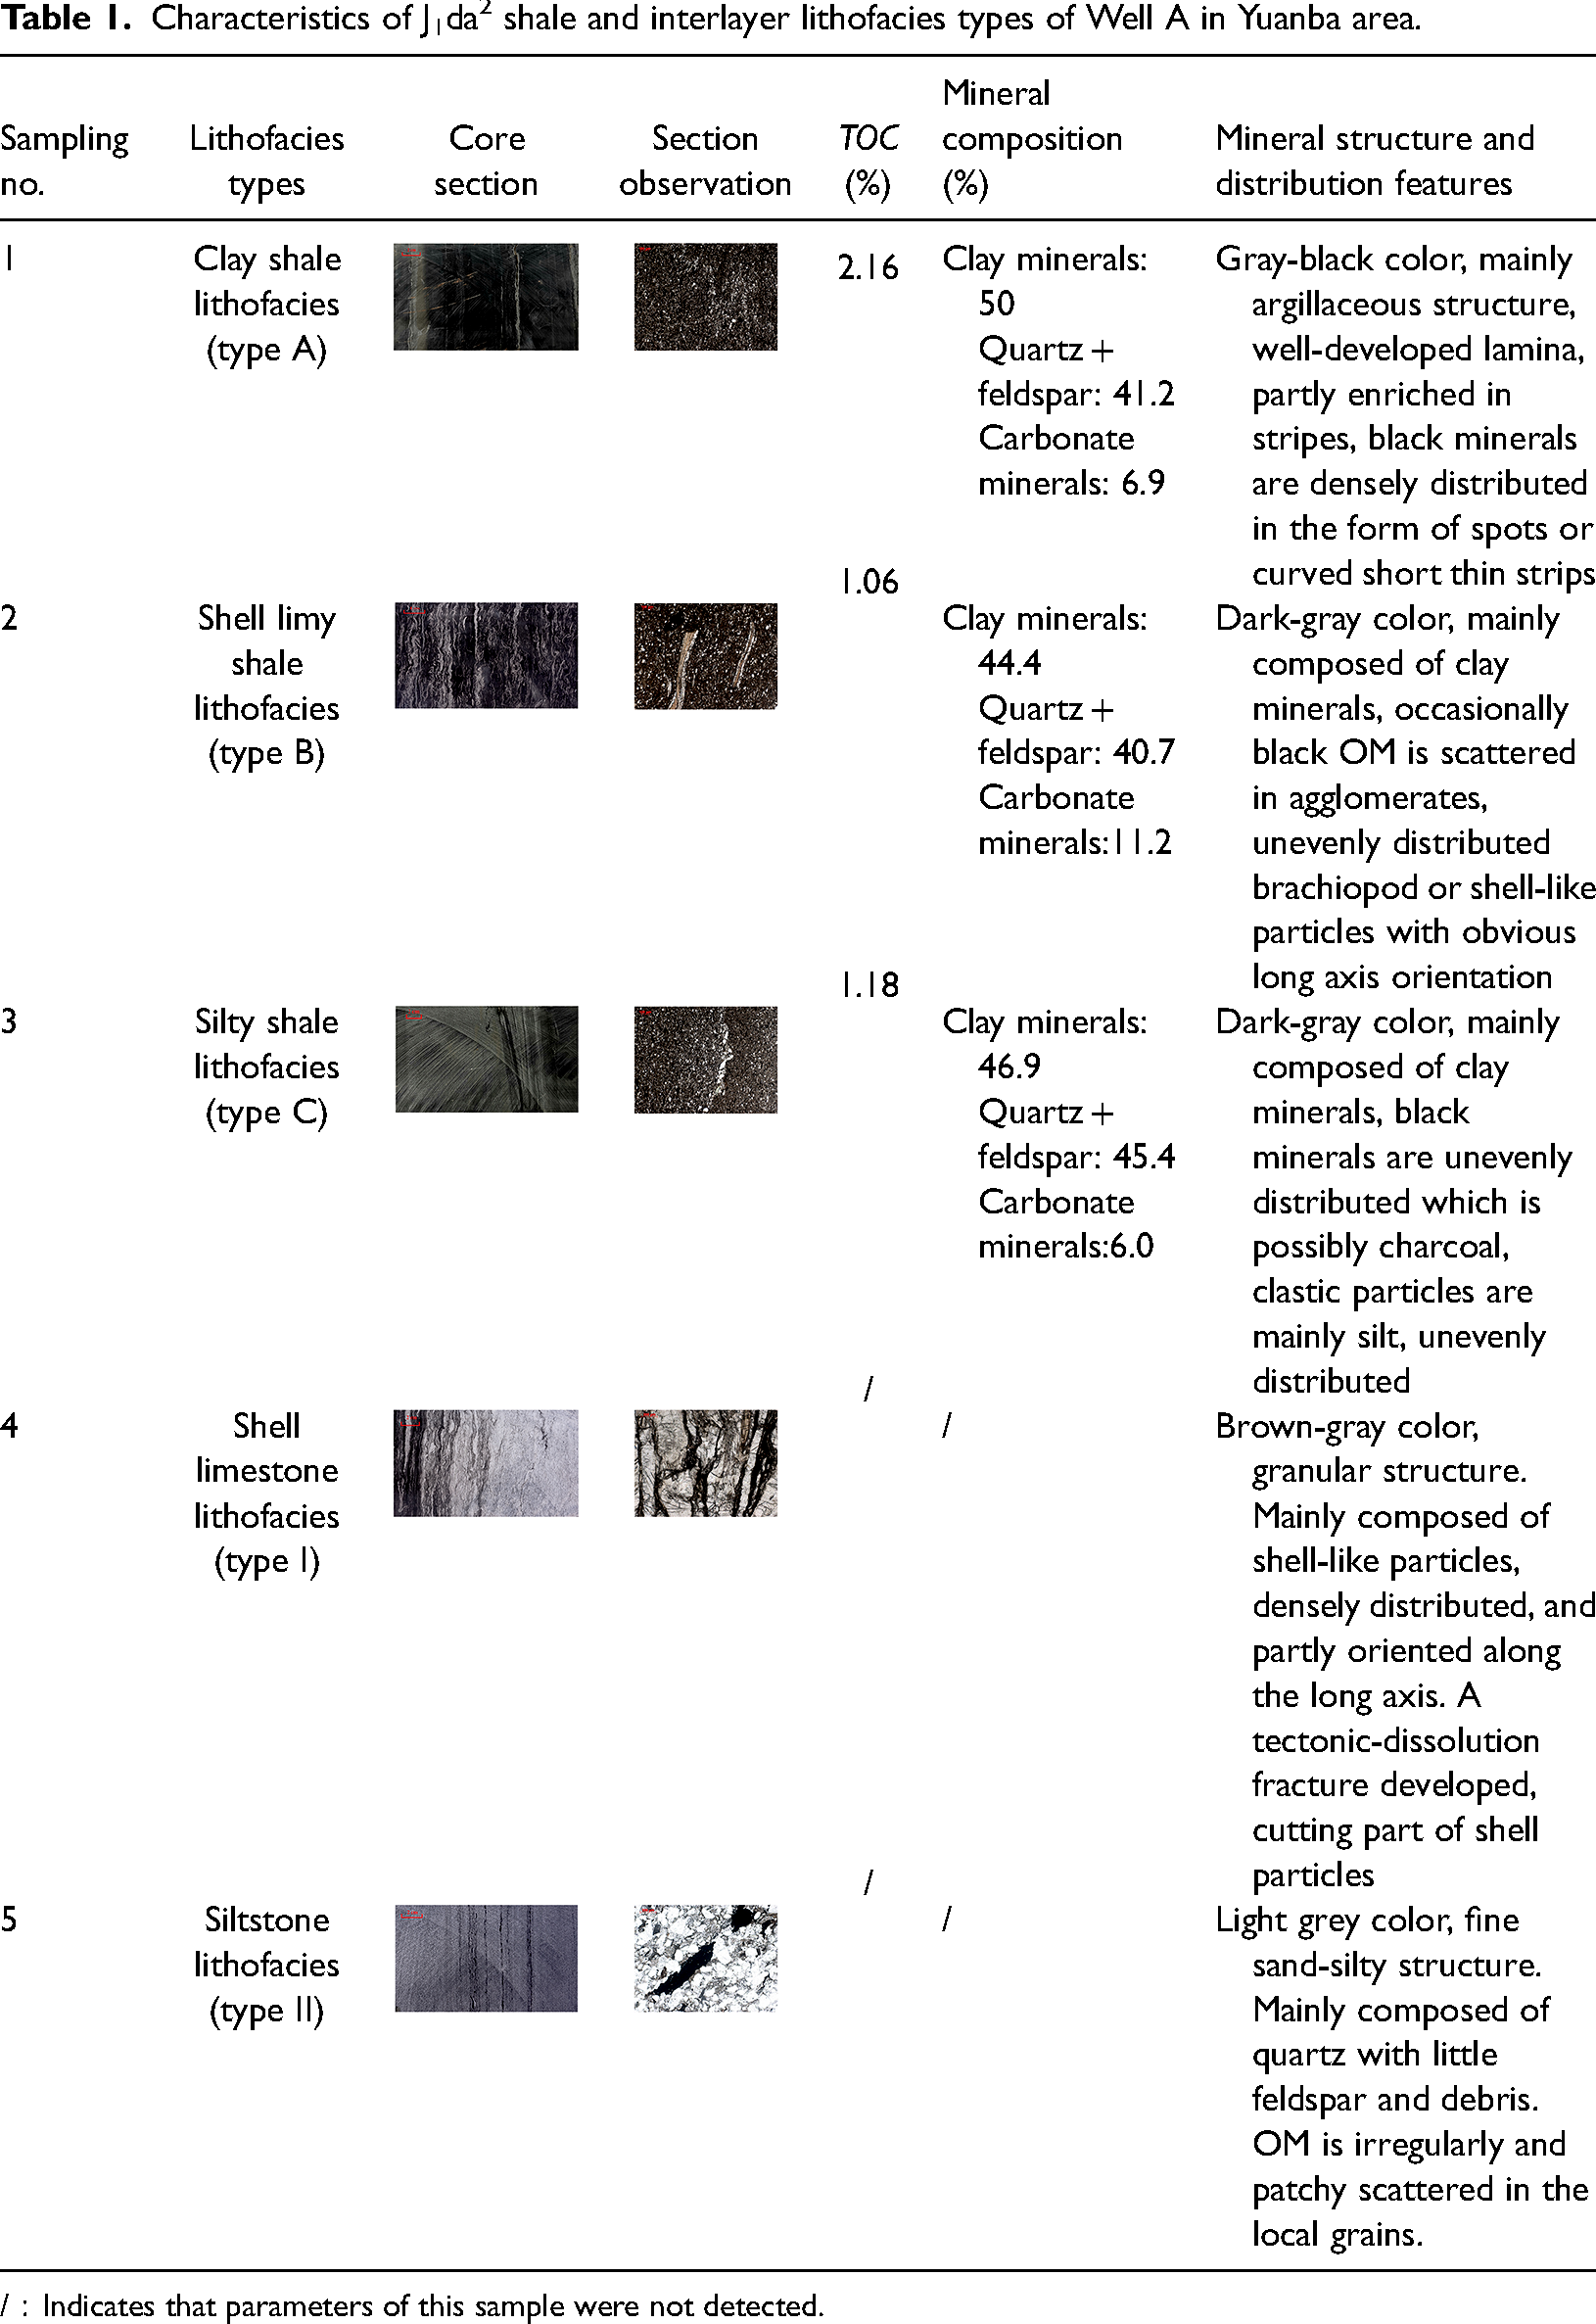
/:Indicates that parameters of this sample were not detected.
Based on the type, thickness, and quantity of shale and interlayers, three types of lithofacies assemblages are further divided, namely, mudstone–limestone lithofacies assemblage (type AB-I, B-I), mudstone–sandstone lithofacies assemblage (type C-II) and mudstone–limestone–sandstone lithofacies assemblages (type BC-I), shown in Figure 2. Type AB-I is mainly distributed in the lower-middle part of J1da2, with a thickness of about 5–6 m. It indicates good hydrocarbon generation conditions with higher TOC content and better brittleness, showing a typical feature of semi-deep lake sediments (Figure 2). Type B-I has the largest thickness in the J1da2 strata because of the extensive shell lamination and limestone. For this type, the calciferous shells are mainly intermittent lamellar along with shale stratification, whose numbers gradually increase from deep to shallow, indicating a typical carbonate shallow lake sedimentary environment. Type C-II has well-developed siltstone interlayers, reflecting a shallow lake sedimentary environment (Figure 2). Type BC-I mainly distributes in the upper part of J1da2, where shell limestone lithofacies and silty shale lithofacies are the main types. It shows the obvious characteristics of mixed sediments of “Mud, Lime and Sand,” reflecting the water body is shallow and turbulent (Zhou et al. 2013, 2020).
Organic geochemical properties
Organic matter abundance
Experimental results show that the average TOC content of the J1da2 shale samples is mainly in the two ranges of 1.0%–2.0% and 0.5%–1.0%. Samples with TOC content between 1.0% and 2.0% account for about 57%, which are higher than those of the J1da1 and J1da3 shales, regarded as the main target of high-quality source rock of Well A (Figure 3a). However, the TOC content of J1da2 shale is overall lower than that of the WF-LM shales, which are in the range of 0.55%–5.89% with an average of 2.54%. On one hand, the larger extent of the deep-water shelf facies in the WF-LM Fm. results in a wider lateral distribution and greater sedimentary thickness of the organic-rich mudstone/shale (Guo et al. 2016). On the other hand, for the source rocks with higher maturity, the residual TOC content can be much lower than the original one (Lu et al. 2003; Pang et al. 2014). Lu et al. (2003) concluded that with Ro increasing from 0.50% to 1.40%, TOC could lose 33%. Therefore, the measured TOC could not reflect the original hydrocarbon potential.
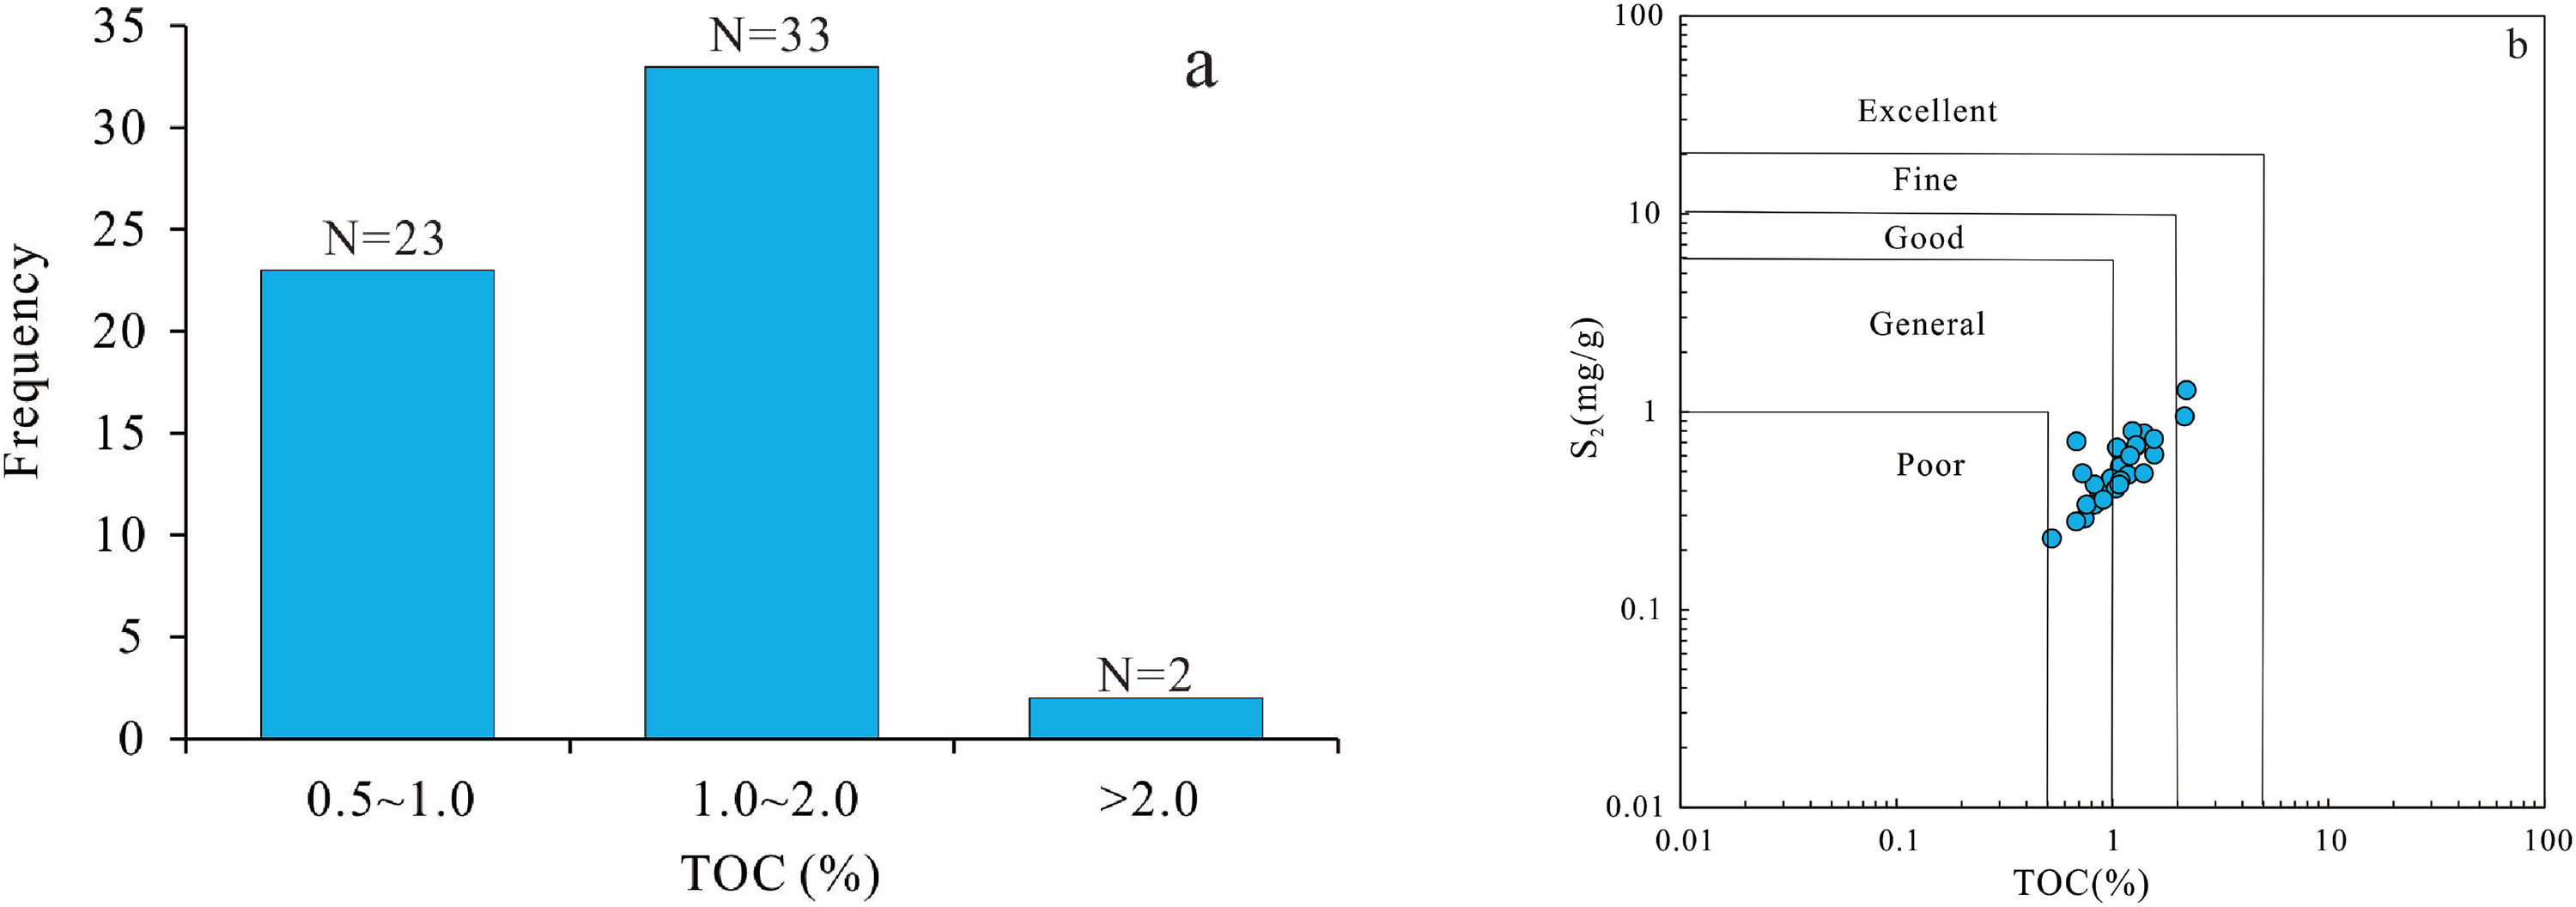
The relationship between TOC and S2 content of the J1da shale samples.
Rock pyrolysis analysis shows that the hydrocarbon generation potential (PG = S1 + S2) of the J1da shale from Well A is 0.78–1.98 mg/g, which can be evaluated as a poor source rock. However, previous studies indicated that, with the increase of thermal evolution degree, the hydrocarbon generation potential would decrease significantly as well (Lu et al. 2003). Therefore, the single index PG was not suitable for the highly mature shale samples in the Yuanba area. Even Vernik et al. (1996) proposed an empirical formula for hydrogen index (HI) and Ro of mixed kerogen type, the detected S1 was excessively low (only 0.01–0.69 mg/g) in this study, which may cause a large deviation. According to Peters and Cassa (1994), the relative content of TOC and S2 could be used for source rock evaluation. This method weakened the influence of maturity on a single parameter (TOC or S2) to a certain extent. Figure 3b shows a good correlation between TOC and S2 content of the J1da shale samples, that is, with the increase of TOC, S2 has a corresponding increasing trend. From the overall evaluation, it is thought that the J1da shales in Well A belong to good-general source rocks.
Organic matter type
Identifying the organic macerals and compositional characteristics under the microscope was an effective method to determine the OM types (Hu and Huang 1991). Microscopic observation and identification verify that the organic macerals of J1da2 consist of vitrinite, fusinite, solid asphalt, and microsomes. Vitrinite generally developed in all samples, with a content ranging from 40% to 92%, which has a uniform surface and gray-gray-white color (Figure 4b and d). It is speculated that they are mainly formed by humification and gelatination from lignocellulosic tissues of higher plants. The content of fusinite ranks only second to vitrinite, and it is mostly bright white with bulges (Figure 4a and e). It is thought transformed from the lignocellulosic tissue of higher plants by fusainization. Microsomes are dispersed in minerals and clay, so the content is no picnic to estimate. The solid asphalt is scarcely distributed in local intervals and is mainly found along with the rock cracks or mineral intergranular filling. It is generally considered that solid asphalt is the product of crude oil cracking (Liu et al. 2021). Larger solid asphalt content means greater oil and gas generation capacity.
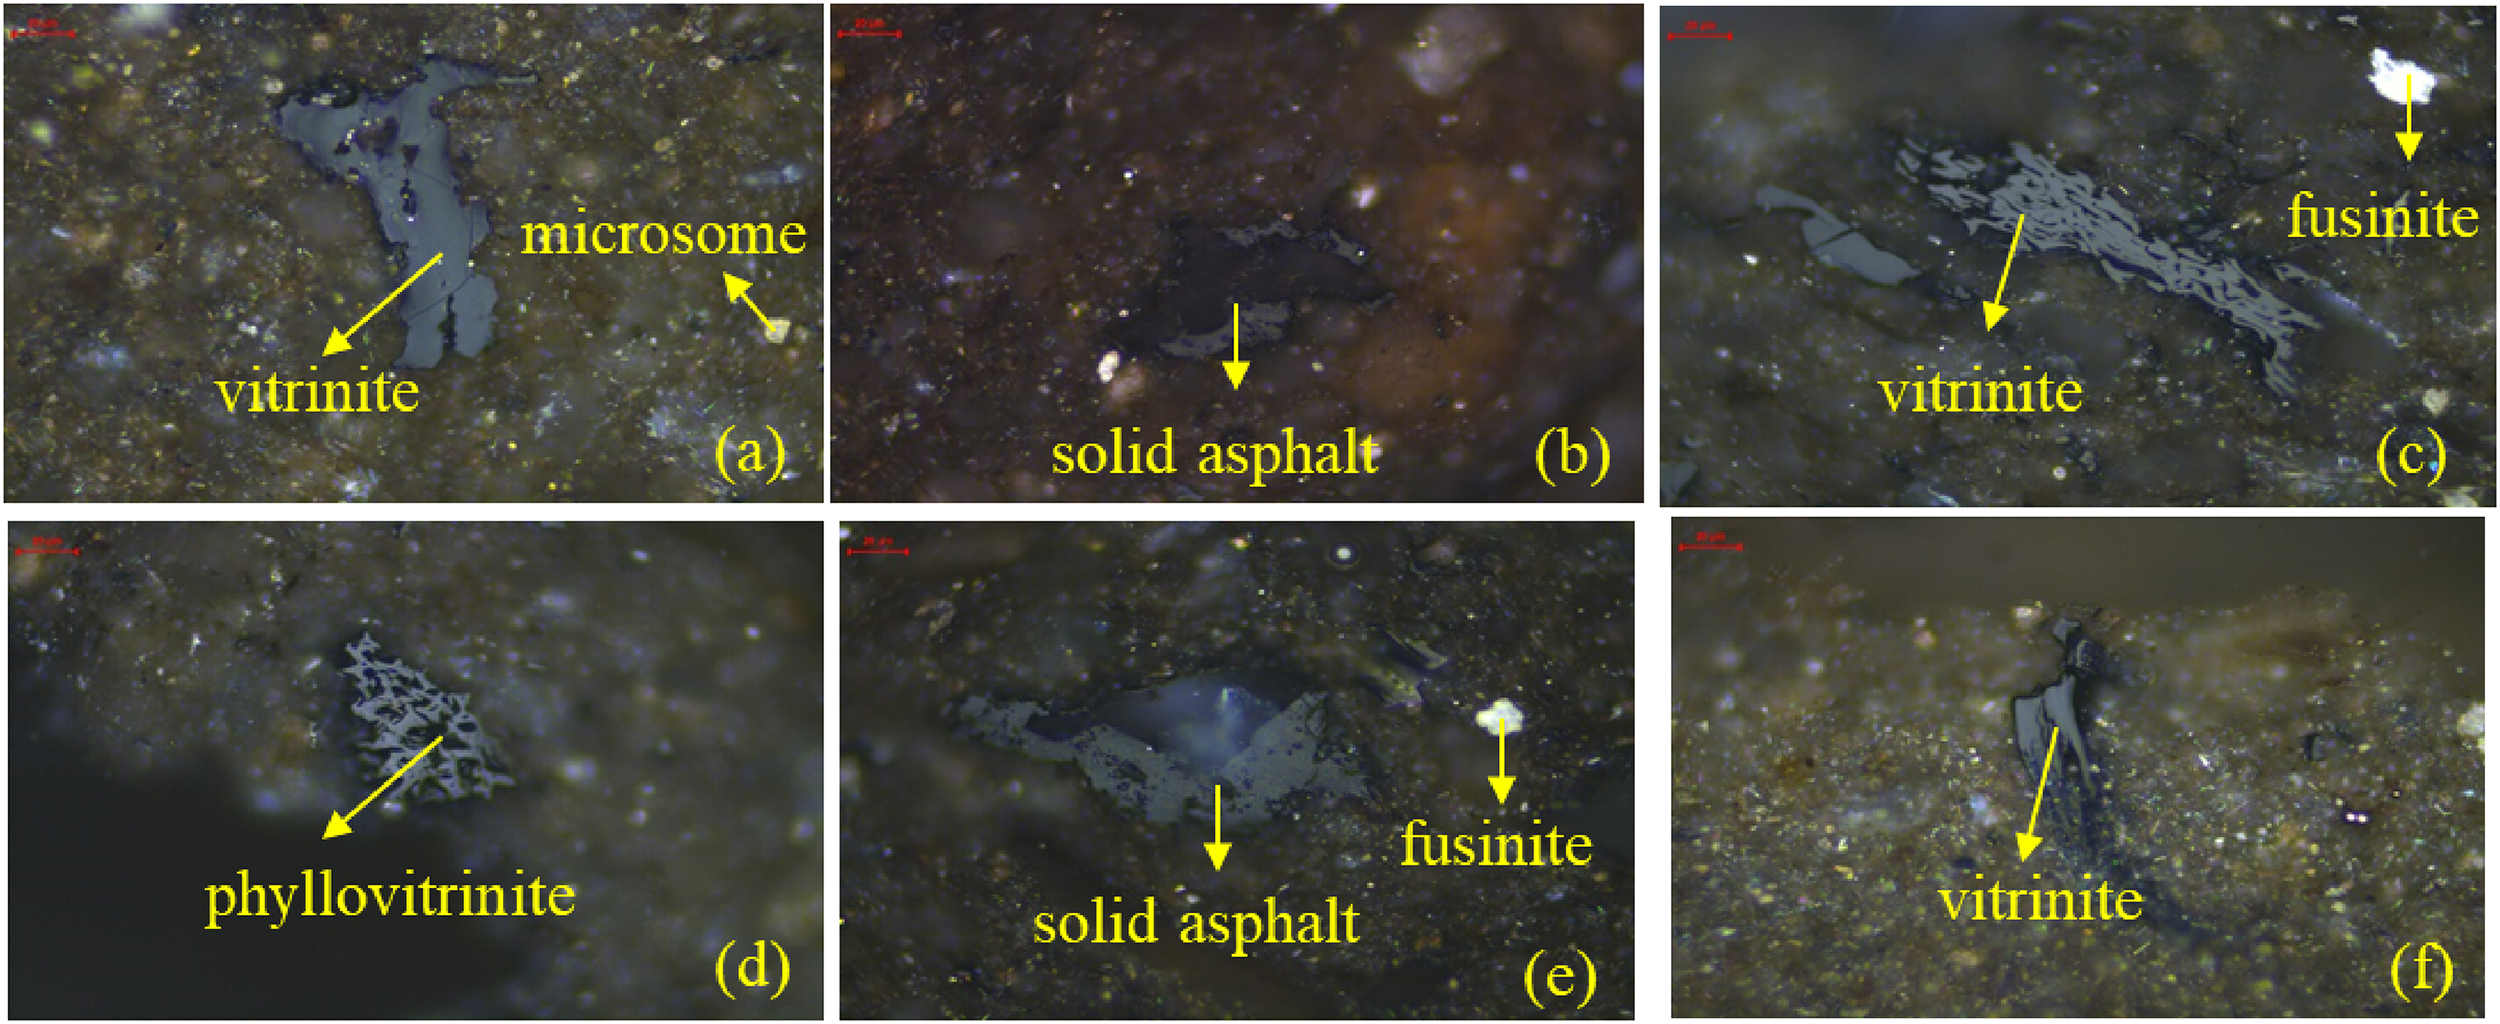
Organic macerals of typical J1da2 shale samples.
The carbon isotope of kerogen (δ13C) was related to the depositional environment and the origin of parent materials. δ13C had a good negative correlation with H/C, so the carbon isotope characteristics inherited from the parent material could be used for classifying kerogen types (Hu and Huang 1991; Tang et al. 2019a). Generally, δ13C was more enriched in type III kerogen (humic-type source rock), while it was low-content in type I kerogen (sapropel-type source rock) (Cheng et al. 2008). Hu and Huang (1991) thought δ13C of type I, II, and III for the terrestrial source rocks were <28‰, 28‰–25‰, and >25‰, respectively, and the evaluation criteria was been followed by others (Cheng et al. 2008). According to δ13C values in this study, OM types of J1da shale are classified and shown in Figure 5. It indicates that OM types in the study area mainly type II and type III, reflecting that the parent materials are derived from the mixed sources of terrestrial higher plants (Figure 5).
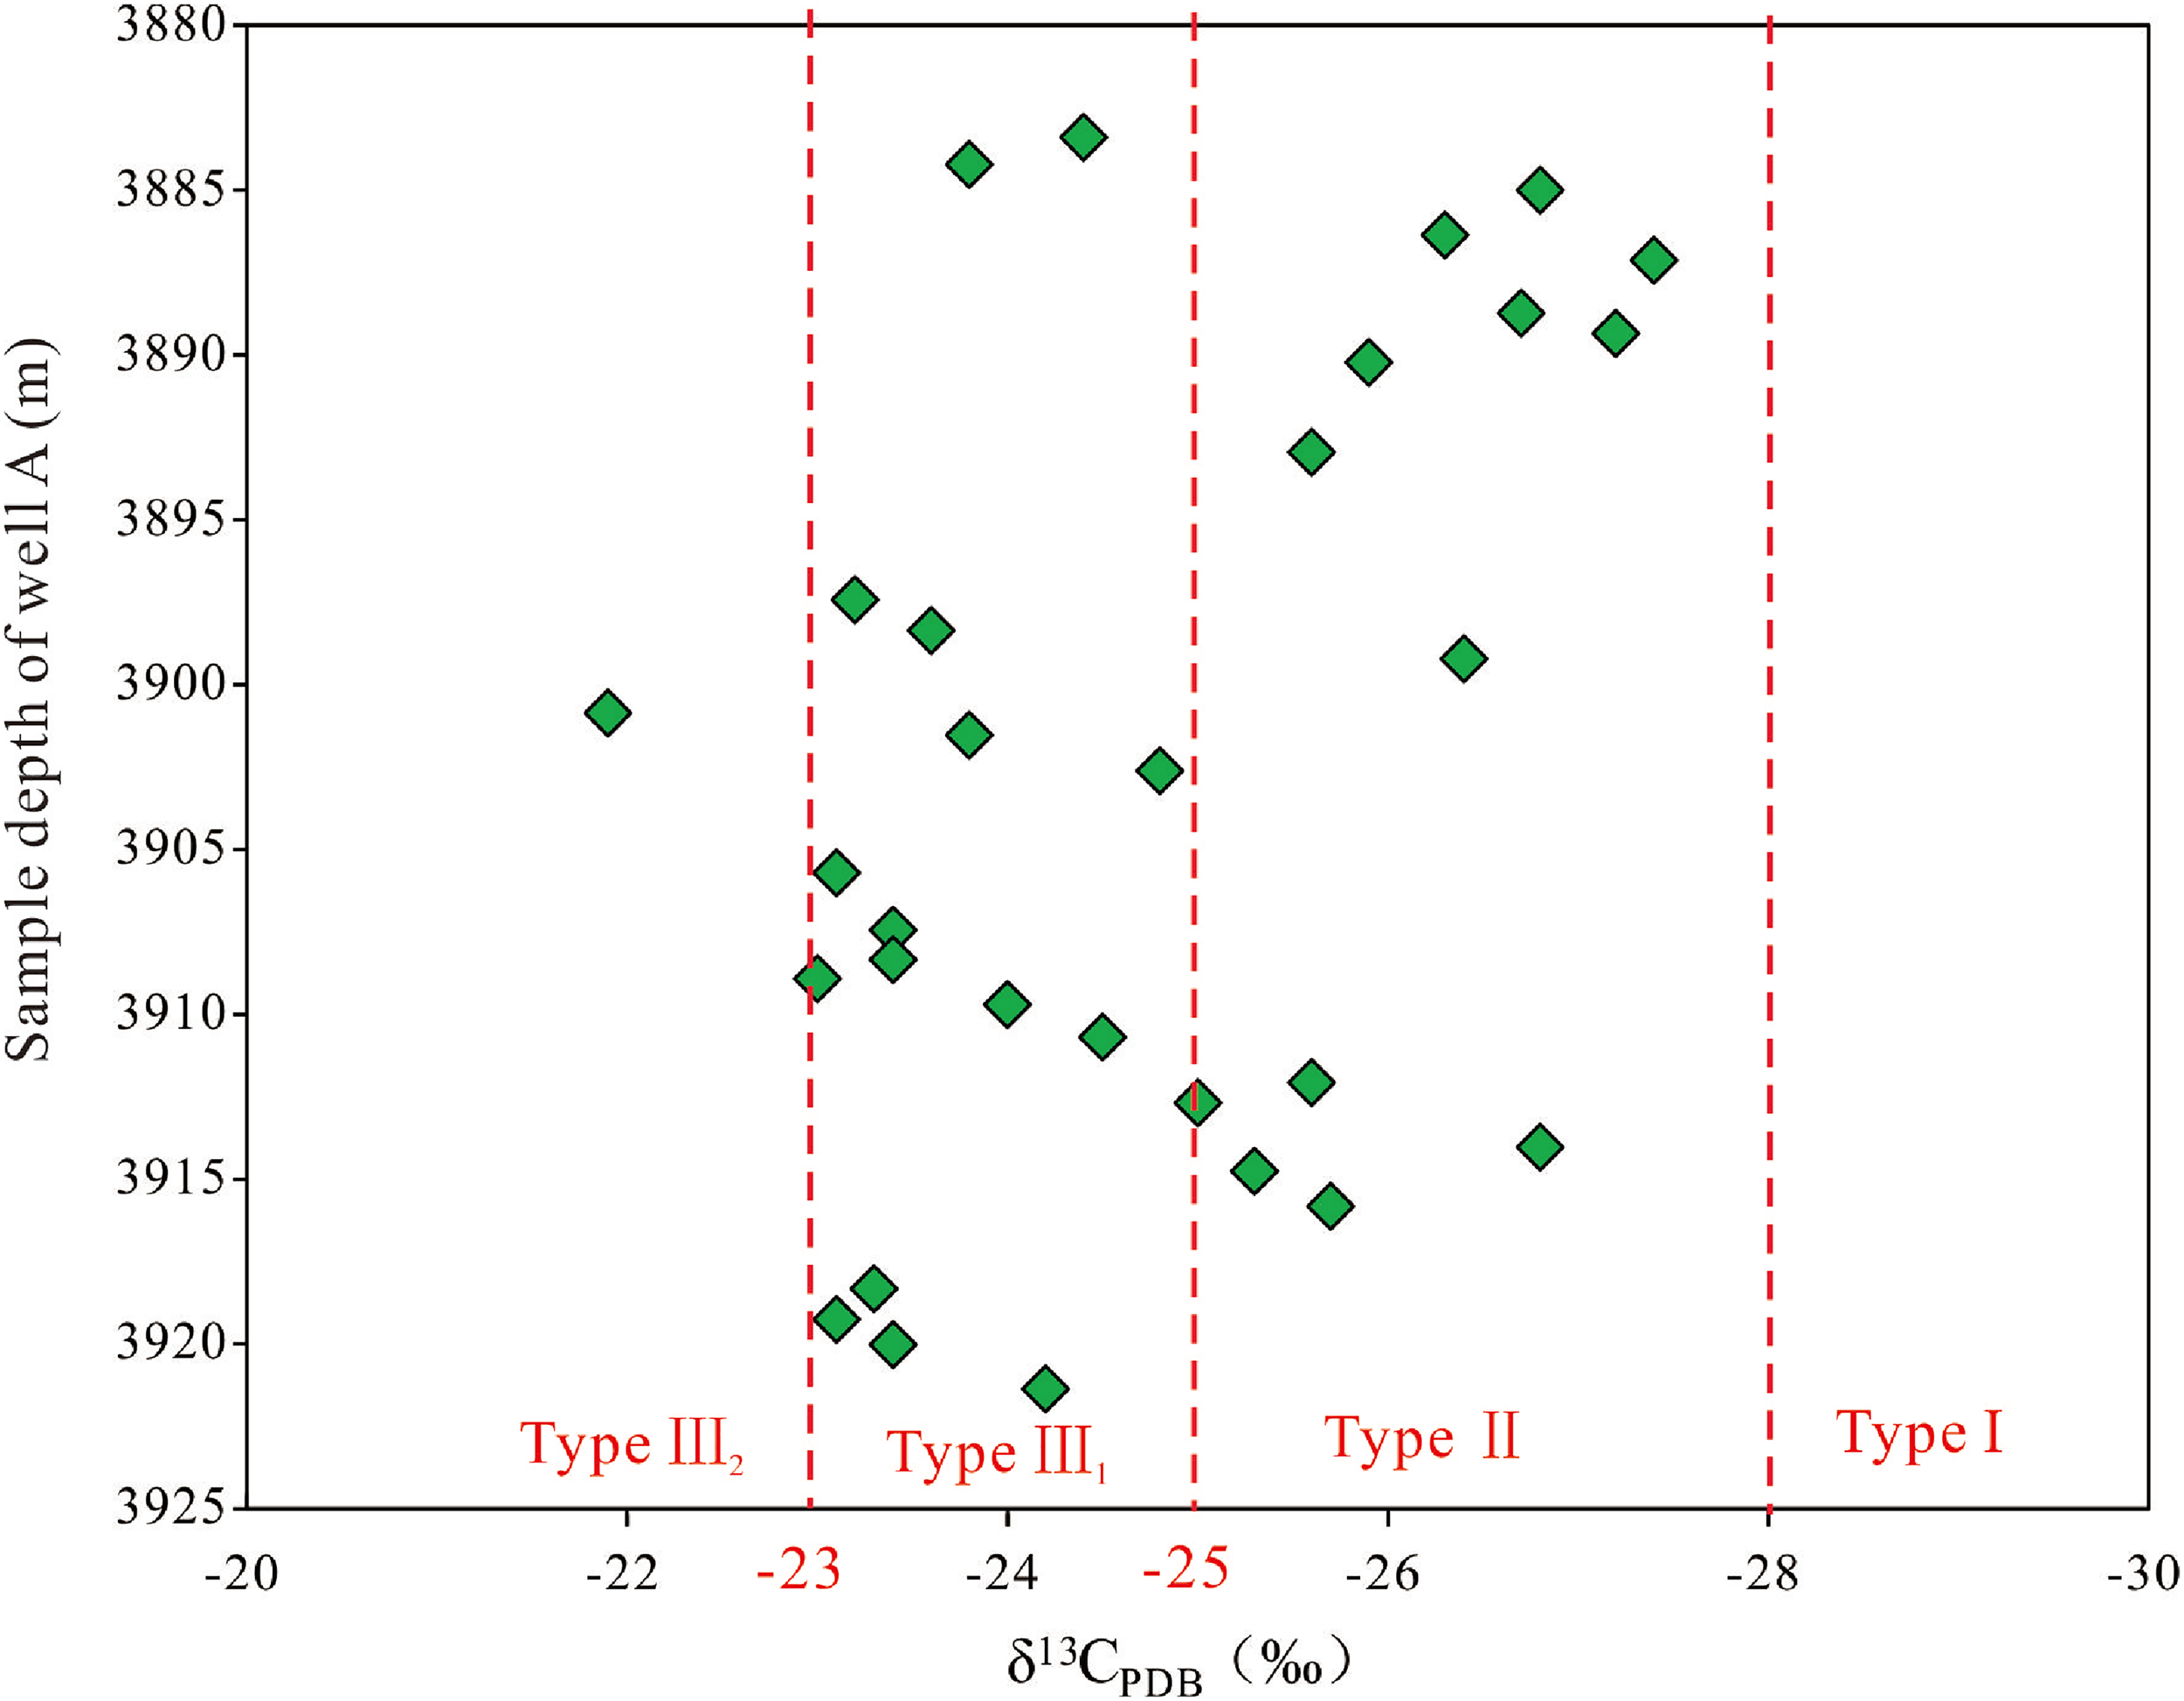
Classification of J1da2 OM types (According to Huang et al. 1993; Cheng et al. 2008).
Organic matter maturity
OM maturity determined the thermal evolution degree in source rock, and whether it was given priority to generate oil or gas, it was very important for evaluating the hydrocarbon generation potential (Chen et al. 2019a; Passey et al. 2010). Vitrinite reflectance (Ro) was currently the most effective indicator for determining OM maturity. Ro values of J1da2 shale vary in the range of 1.44%–1.83%, with an average of 1.67% (Figure 2), indicating that J1da2 shale has reached a mature-high mature stage, and is currently in the peak of gas generation period. Some scholars verified that Ro had an obvious positive correlation with the production of shale oil/gas, i.e., with the increase of Ro, GOR (gas/oil ratio) increased, thus the flowability increased, which was conducive to production (Guo et al. 2021; Zhang et al. 2021a).
Reservoir properties
Reservoir properties were the most intuitive features of clarifying shale reservoir performance, analyzing shale gas enrichment and distribution, optimizing shale gas sweet spots, and affecting the later fracturing and development, which included the geophysical properties, pore types, and structure (Loucks and Ruppel 2007; Zhang et al. 2021b).
Geophysical properties
In this study, 37 core samples were performed conventional core analysis, and then the physical properties data were analyzed and compared. Results show that the average porosity of types A, B, and C are 3.78%, 3.15%, and 3.18%, while the average porosity of types I and II is 1.41% and 1.15%, respectively (Figure 6a). The average permeability of types A, B, and C are 0.04, 0.12, and 0.001 md, while the values of type I and II are 0.007 md and 0.002 md, respectively (Figure 6b). According to relevant standards, J1da2 can be evaluated as a low porosity and ultra-low permeability reservoir, which is much poor in comparison with the WF-LM shale reservoir in the Fuling area (Guo et al. 2016; Tang et al. 2020b; Tang et al. 2022b). By contrast, types A and B show better reservoir physical properties than type C; however, the presence of interlayers significantly reduces the porosity and permeability of shale reservoirs. This may be due that the relatively developed pores and laminae of type A increase the reservoir quality, and the existence of micro fractures in type B contribute to the reservoir permeability to a certain extent, while pores and fractures in the interlayer lithofacies are comparatively underdeveloped (Zhu 2020). Therefore, when optimizing the favorable intervals, negative influence of interlayers on shale physical properties should be considered. On the whole, type A and type B have better physical properties.
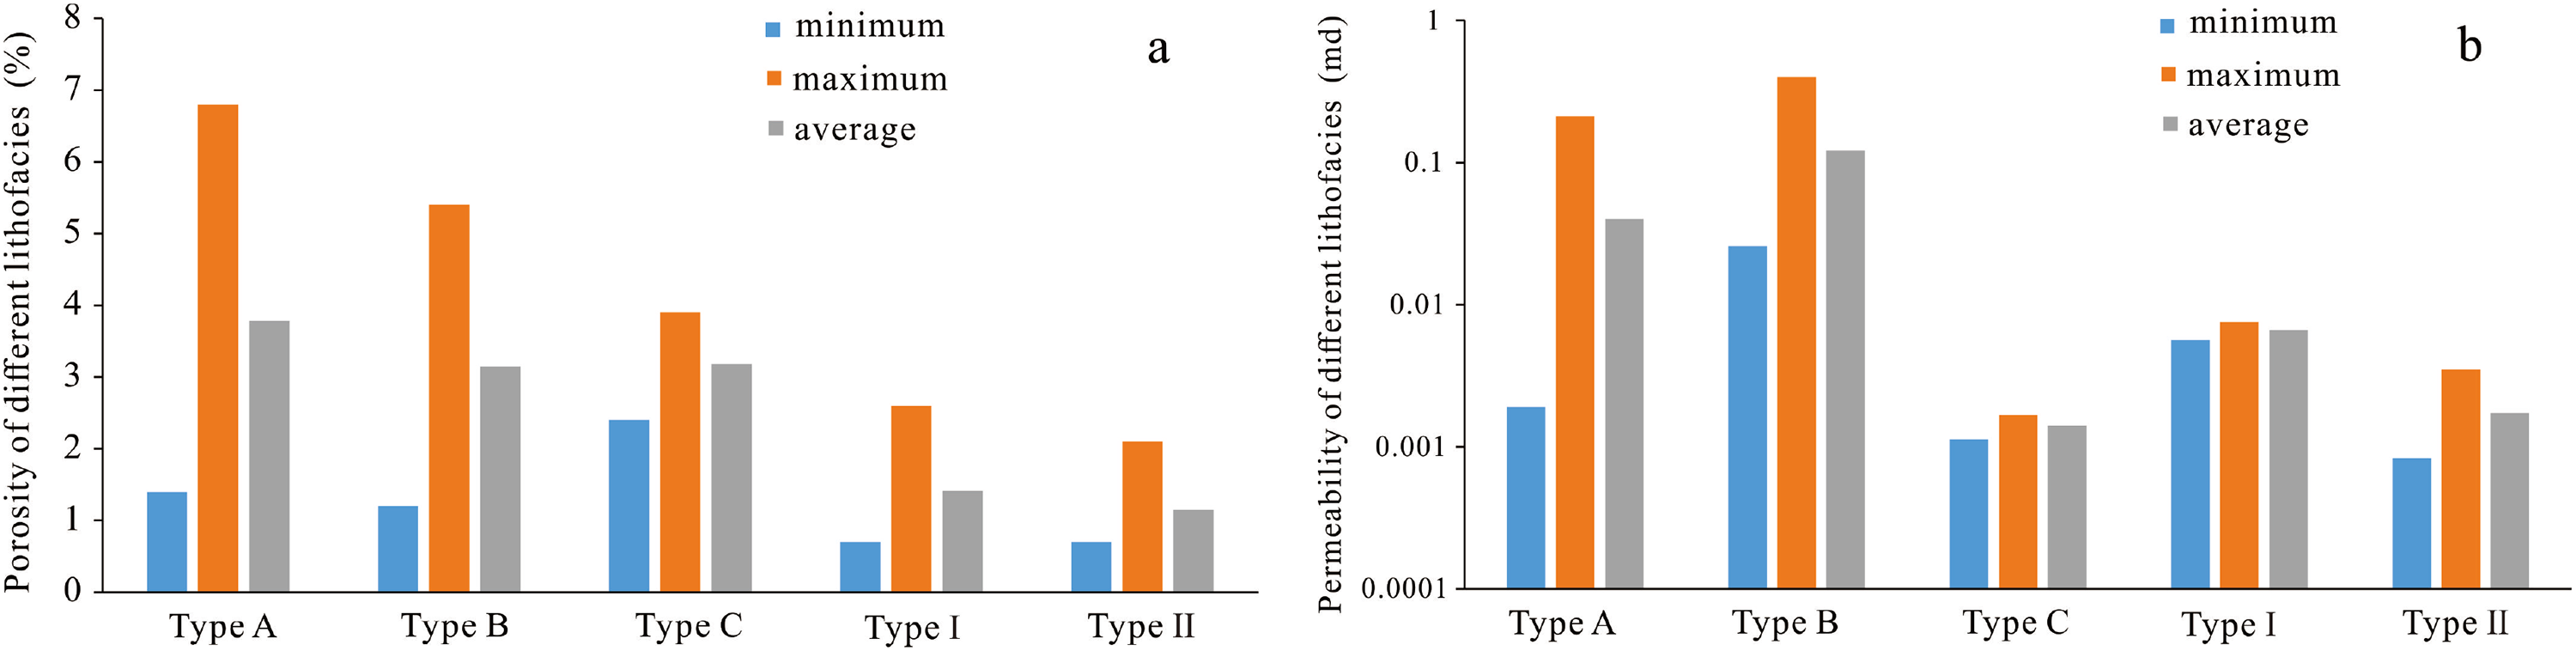
Distribution of porosity and permeability of J1da2 shale.
Reservoir space types
FIB-SEM observation of core samples shows that the reservoir space types of J1da2 shale are dominated by inorganic pores, organic pores, and micro fractures (Figure 7). Among them, inorganic pores mainly contain clay mineral pores and particle-related pores (calcite dissolution pores and quartz intergranular pores). They are relatively developed in all types of shale lithofacies and are seen as the predominant reservoir space types. Clay mineral pores are widely developed in the forms of linear interlaminar micropores, partly full-filled and semi-filled with solid asphalt (Figure 7a and b). Previous researches indicated that clay mineral pores were mainly formed from the primary pores between clay minerals due to compaction, diagenesis, and mineral alteration. Therefore, the higher the clay mineral content is, the more developed the clay mineral pores (Chen et al. 2019b). Compared with marine shale, the higher clay mineral content in terrestrial shale was the main reason for the more developed inorganic pores (Liu et al. 2019). The main mineral compositions of the widely developed type B and type I are quartz and calcite, which are conducive to forming calcite dissolution pores, and quartz intergranular pores in local intervals in the diagenetic process (Figure 7b and c). OM pores are mainly developed in primary OM, solid asphalt, and mineral asphalt matrix (Figure 7d and e). The structural fractures in the J1da2 shale strata are basically not developed. Only a small number of horizontal fractures and high-angle fractures are seen, which are mainly in mudstone sections and filled with calcite or mud (Figure 7a, e, f). The development of natural micro fractures is conducive to later fracturing reformation, jointly forming a pore-fracture system, and improving shale gas production capacity (Li et al. 2020b).
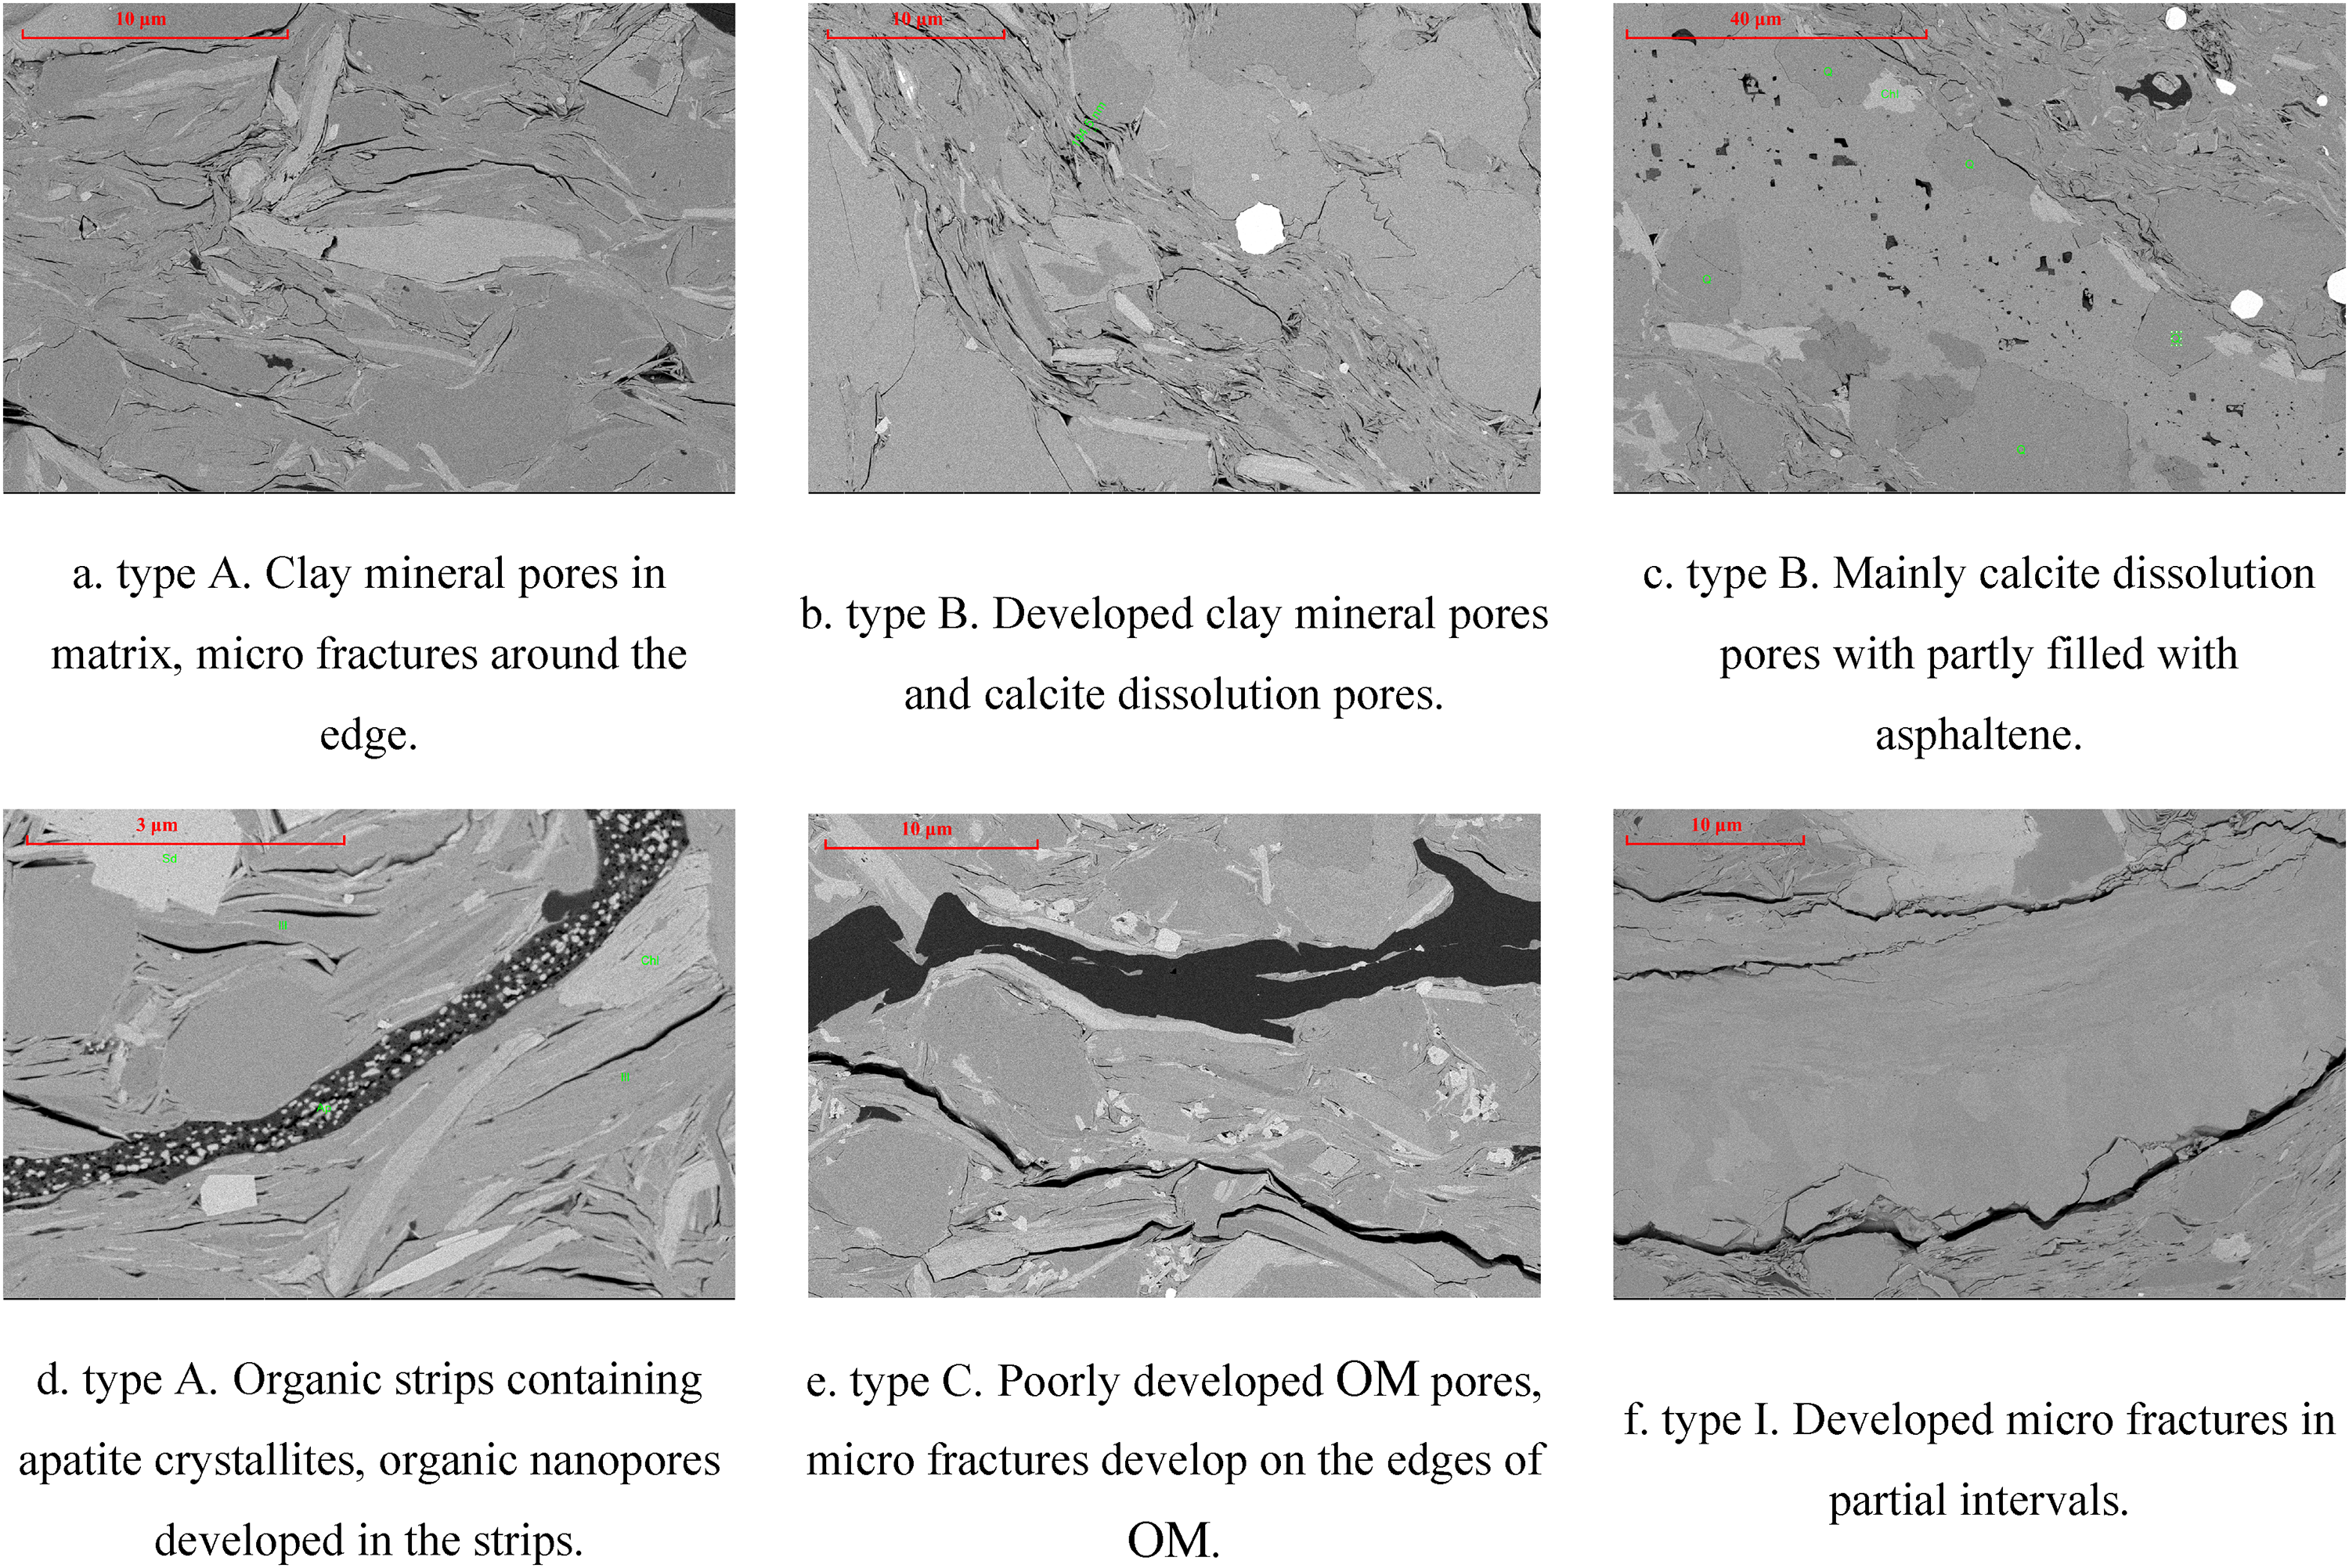
Characteristics and distribution of pores in J1da2 shale strata.
To quantitatively explain the contributions of organic pores and inorganic pores to total porosity, a multifactor linear fitting method was used. First, the J1da2 shale pore model was established according to the above recognition. It indicates the total porosity (Φ) is equal to the sum of organic pore (Φo), clay mineral pore (Φc), and particle pore (Φd). The model formula is as follows:
Pore structure properties
The evolution of pore structure was particularly important for oil and gas retention in the mature source rock (Loucks et al. 2009; Zhang et al. 2020). In this study, 28 shale samples were conducted with high-pressure Hg intrusion and low-temperature N2 adsorption. Then the experimental data were combined to perform a multiscale characterization. Quantitative parameters including pore volume (PV), specific surface area (SSA), and average pore diameter (APD) were analyzed to clarify the pore structure properties.
Analysis indicates that the pore size distribution characteristics of different samples are similar, dominated by mesopores (2–50 nm), with an average proportion of more than 60%; followed by micropores (<2 nm), about 20%, according to IUPAC classification (Figure 8a). Compared with the WF-LM shale, the percentage of mesopores and macropores of the J1da2 shale is larger, which is conducive to free gas storage (Liang et al. 2012). The distribution of APD shows the characteristics of “double peaks” in the range of micropores and mesopores, with the main peaks are 1 nm and 36 nm, respectively. The SSA calculated from N2 adsorption data with the multipoint BET model ranges from 2.96 to 12.09 m2/g with a mean value of 6.54 m2/g, and type A has the largest SSA (Figure 8b). It indicates that gas adsorption capacity of type A is greater than that of type B and type C, and type A is more conducive to the adsorbed gas occurrence (Kruk and Jaroniec 2001). The total PV varies from 0.006 to 0.022 ml/g with an average of 0.014 ml/g and has similar distribution characteristics with SSA. Li et al. (2021) showed that for the lacustrine laminar shale samples, SSA was negatively correlated with macropore and mesopore volumes, but positively correlated with micropore volume, which indicated that micropores played a decisive role in the SSA and gas adsorption capacity. Based on the above analysis, type A has the overall greatest micro-reservoir performance for the J1da2 shale.
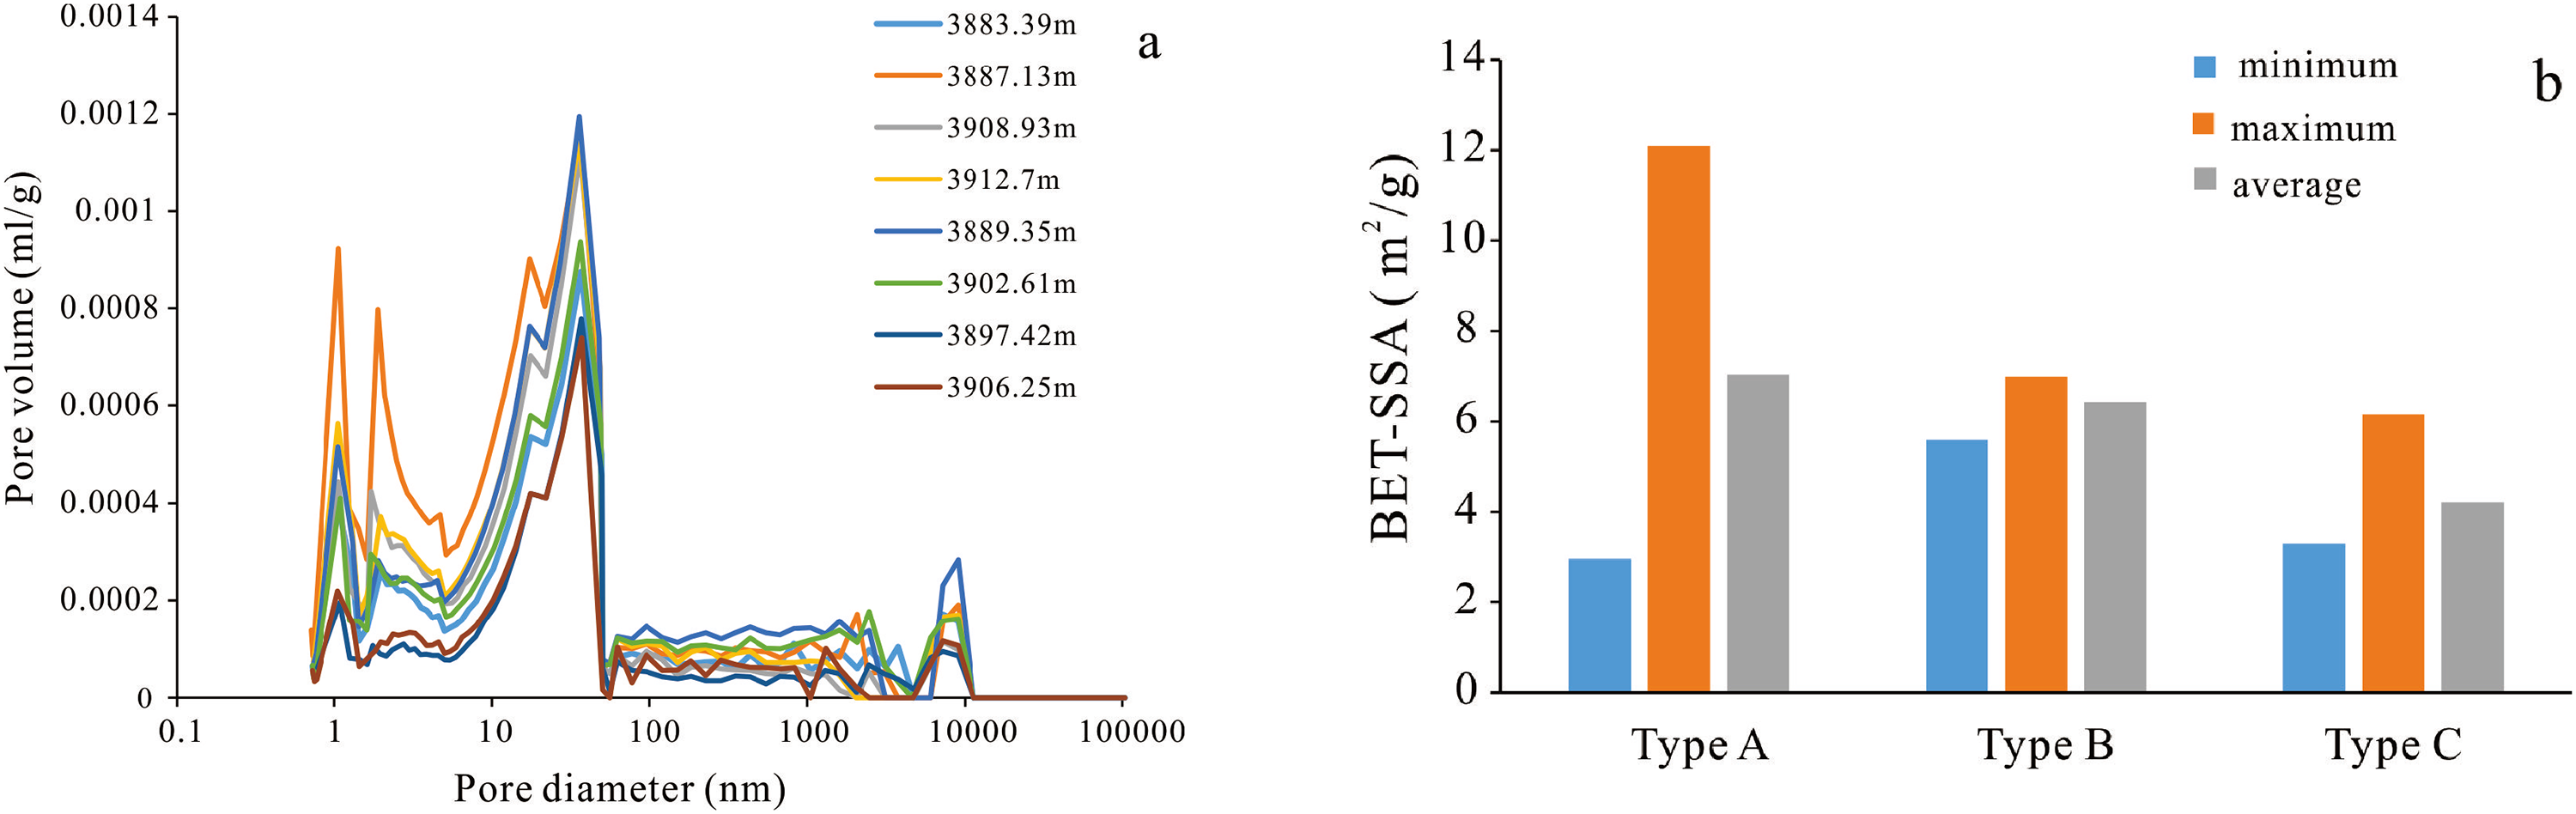
Pore size distribution of J1da2 shale samples.
Gas-bearing properties
Gas-bearing property was the direct index to evaluate whether the shale reservoir has commercial exploitation value (Tang et al. 2019b). It was acknowledged that shale gas existed mainly in the occurrence of adsorbed state and free state in shale reservoirs (Curtis 2002). Free gas content was crucial for the initial productivity of a shale gas reservoir, whereas adsorbed gas content determined the stable production time to an extent (Li et al. 2018; Orozco and Aguilera 2015). Determining the shale gas content and relative occurrence proportion was of great significance for evaluating shale gas bearing and clarifying development mode (Li et al. 2018, 2020b).
Gas logging values are the most intuitive feature to characterize the gas-bearing properties. Some sections in J1da2 have good hydrocarbon shows even can reach 10.17% (Figure 2). Due to the relatively high mud density (1.68–2.2 kg/m3), the gas displays and total hydrocarbon values are restrained to different degrees. On-site gas desorption method can test the amount of gas desorbed from the cores after they are sealed in the desorption canister. It shows that on-site desorption gas volume of the J1da2 strata is 0.091–0.464 m3/t, with an average of 0.205 m3/t. Due to the rapid gas dissipation in the process of coring and drilling from the strata to the ground, the loss gas content was sizeable. It can be calculated using the Amoco curve-fitting method, which refers to fitting all desorption data with the solution of the diffusion equation (Elke et al. 2013). The total on-site gas content is the sum of desorption gas content and loss gas content, which ranges from 0.225 to 2.034 m3/t (Figure 2). However, environmental factors, loss time, calculation method, and desorption device may have a significant impact on the on-site gas content, making the on-site gas content inaccurate.
A more accurate method to obtain shale gas content is calculating the content of adsorbed gas and free gas separately (Jaroniec et al. 1989). In this study, adsorbed gas content was acquired using the Langmuir function based on the CH4 isothermal adsorption experiments. It shows that the amount of adsorbed gas ranges from 0.54 to 1.63 m3/t, with an average of 1.09 m3/t (Figure 9), indicating a moderate adsorption capacity. The free gas content was calculated using the Ideal Gas Equation (Brown 1948), and relevant parameters were obtained through the website provided by NIST (https://webbook.nistgov/chemistry). Through calculation, free gas content is 1.28–2.88 m3/t with an average of 2.26 m3/t (Figure 9), and total gas content is 2.59–4.38 m3/t with a mean value of 3.35 m3/t. The average proportion of free gas is 67%, and the average proportion of adsorbed gas is 33%. It is close to the proportion of WF-LM shale in Well JY1 calculated by Yu et al. (2016), indicating that the J1da2 shale reservoir has good gas-bearing properties and high free gas proportion. For types A, B, and C, the mean values of total gas content are 3.51, 4.18, and 2.72 m3/t, and free gas accounts for 63.5%, 67.3%, and 77.4%, respectively, indicating types B and A make the primary contribution to later production of J1da2 reservoir.
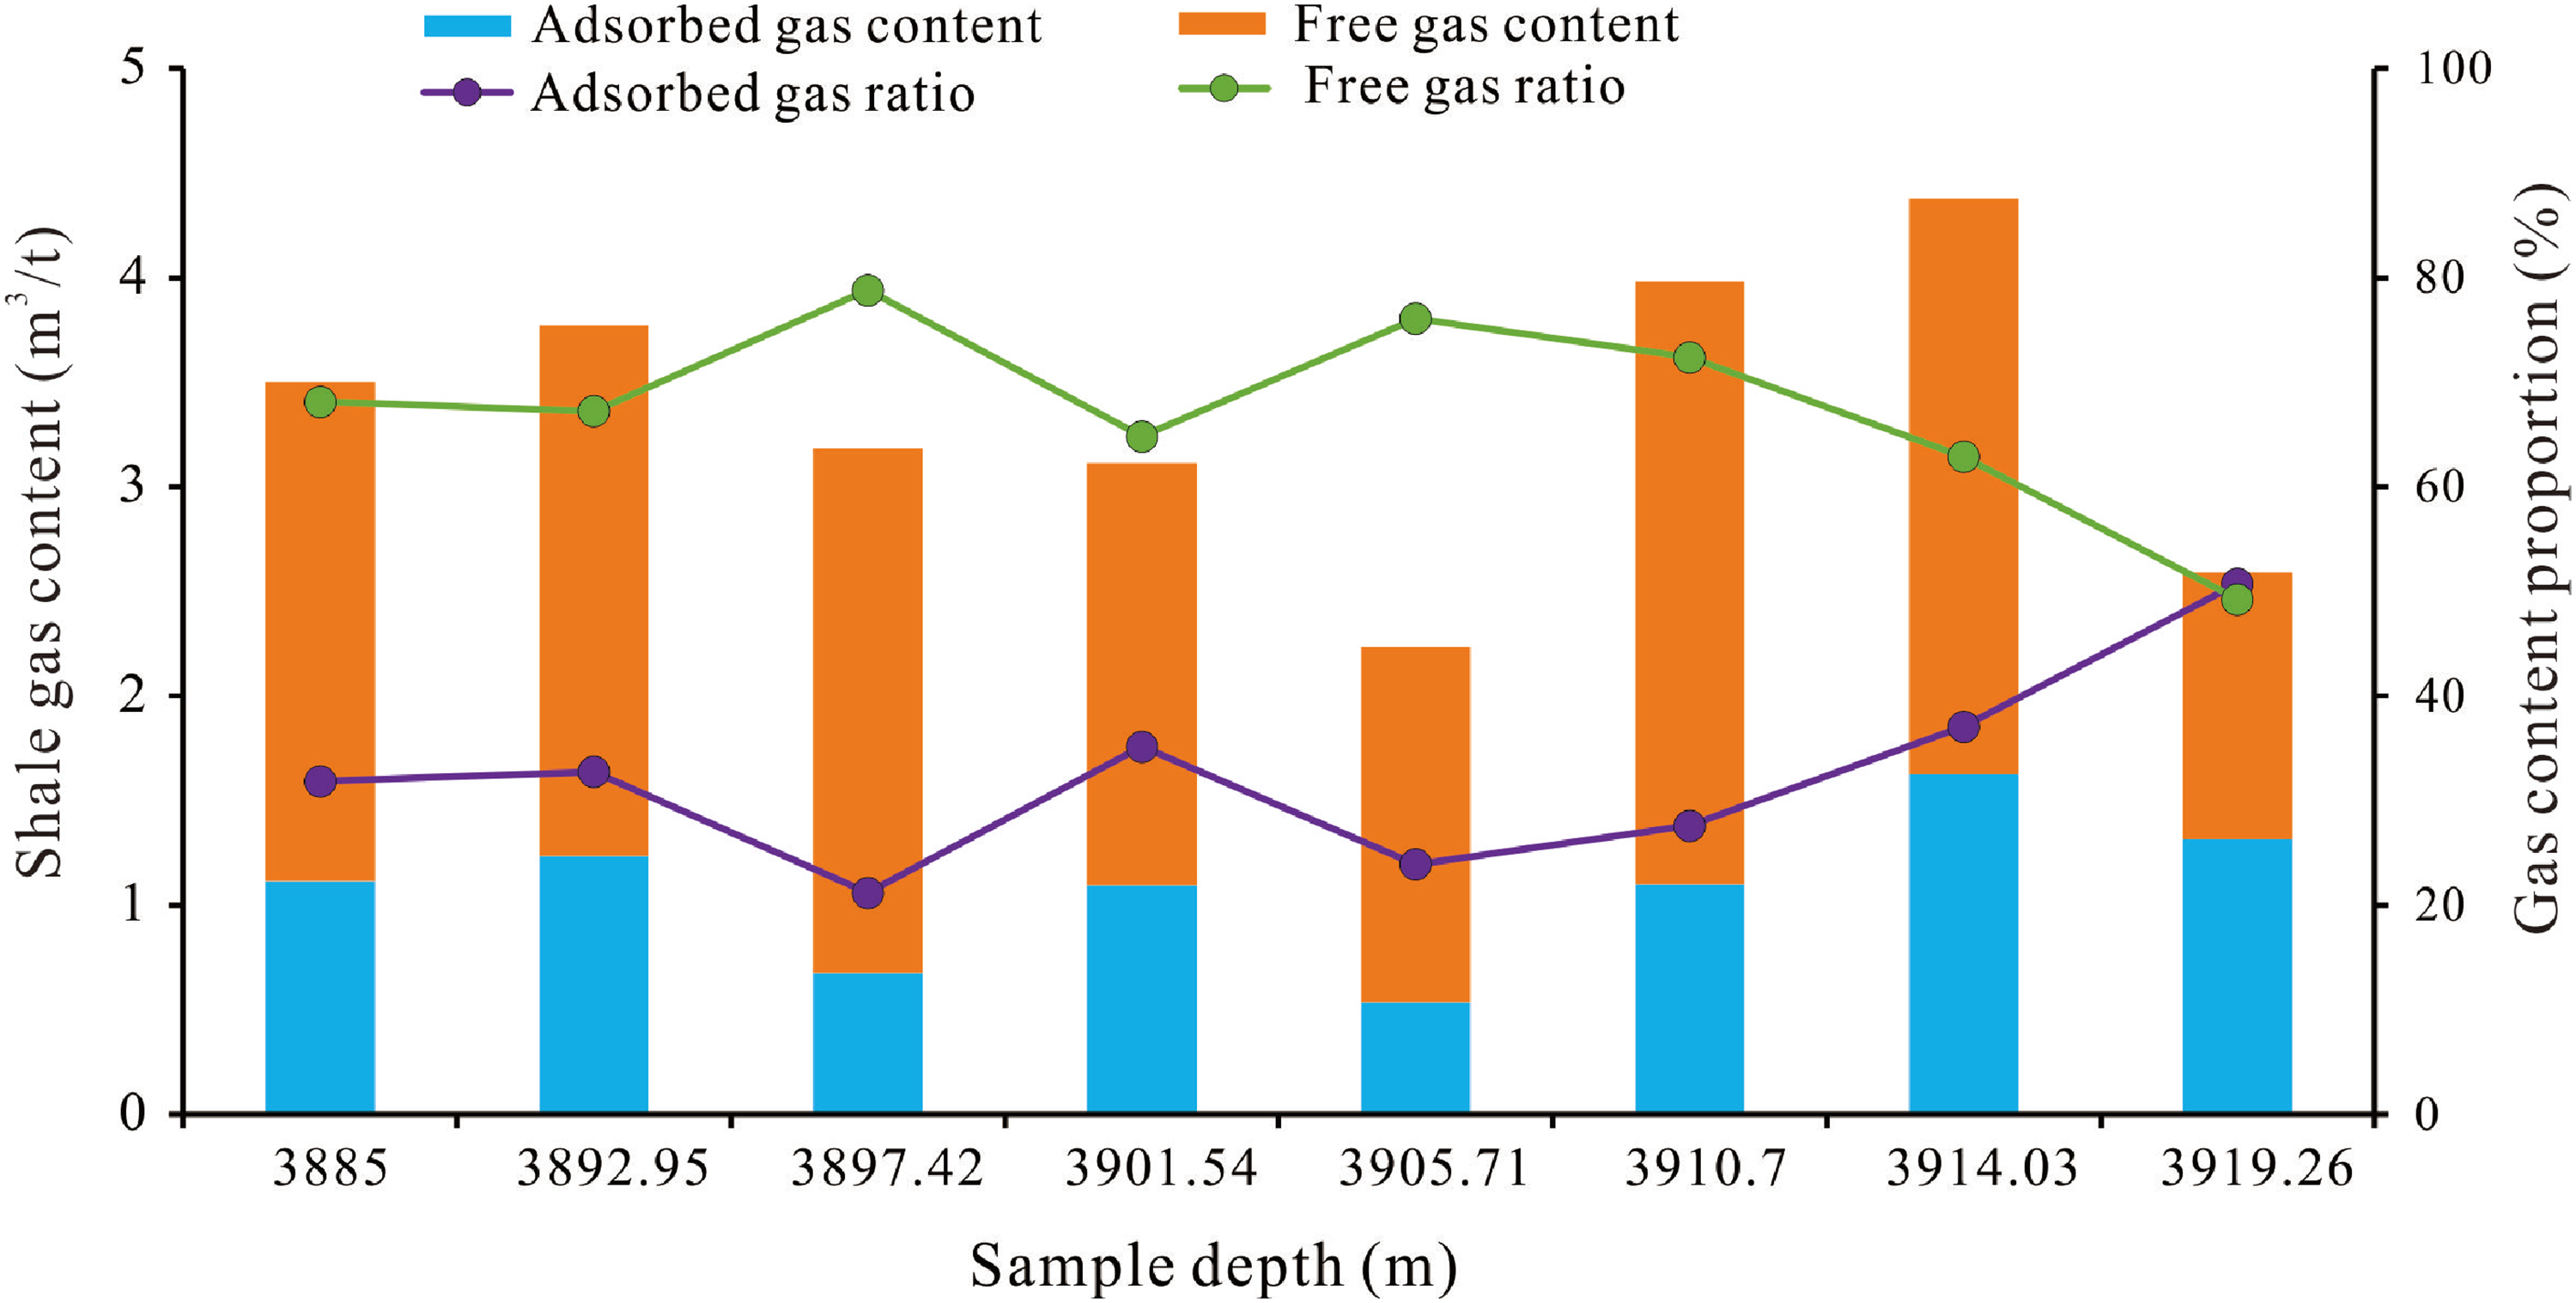
Distribution of free gas and adsorbed gas content in the J1da2 shale reservoir.
Fracturability properties
As the extremely low matrix permeability, to ensure the higher potential of shale gas productivity, shale reservoirs required not only sufficient gas-in-place but also a high concentration of brittle minerals (silica and/or carbonate) that was amenable to hydraulic fracturing (Michael et al. 2009). The optimization of favorable reservoirs needs to consider the fracturability properties in view of engineering, representing the brittle minerals content (Zhu 2020). Mineral compositions of samples show that it is mainly composed of clay minerals and quartz, the sum of which accounts for more than 70%. Followed by calcite, dolomite, and feldspar, with uneven distribution, the clay minerals content ranges from 2.9% to 60.6% with an average of 36%, the quartz and feldspar content is in the range of 1.7%–77.9% with an average of 38%, and the carbonate minerals content is 0.4%–95.1% with an average of 22.5% (Figure 10). By comparison, the average brittle mineral content of shale lithofacies is only about 50%, which is much lower than that of interlayer lithofacies. For the clay mineral compositions, they are mainly a composite of sensitive illite and illite–smectite mixed layers, which make up about 70%, indicating that shale lithofacies have less fracturability. Zhu (2020) reported that the brittleness index of interlayers in the Lower Jurassic shale and shell limestone in northeastern Sichuan can reach 0.67–0.76, which implied good fracturing ability. Moreover, in organic-rich shale, streak-like or band-like (single layer thickness is generally less than 1 cm) limestone can make up for its lack of brittleness (Ren et al. 2018; Zhao et al. 2015). Thus, the mudstone–limestone lithofacies assemblages (type AB-I, type B-I) have better fracturability properties.
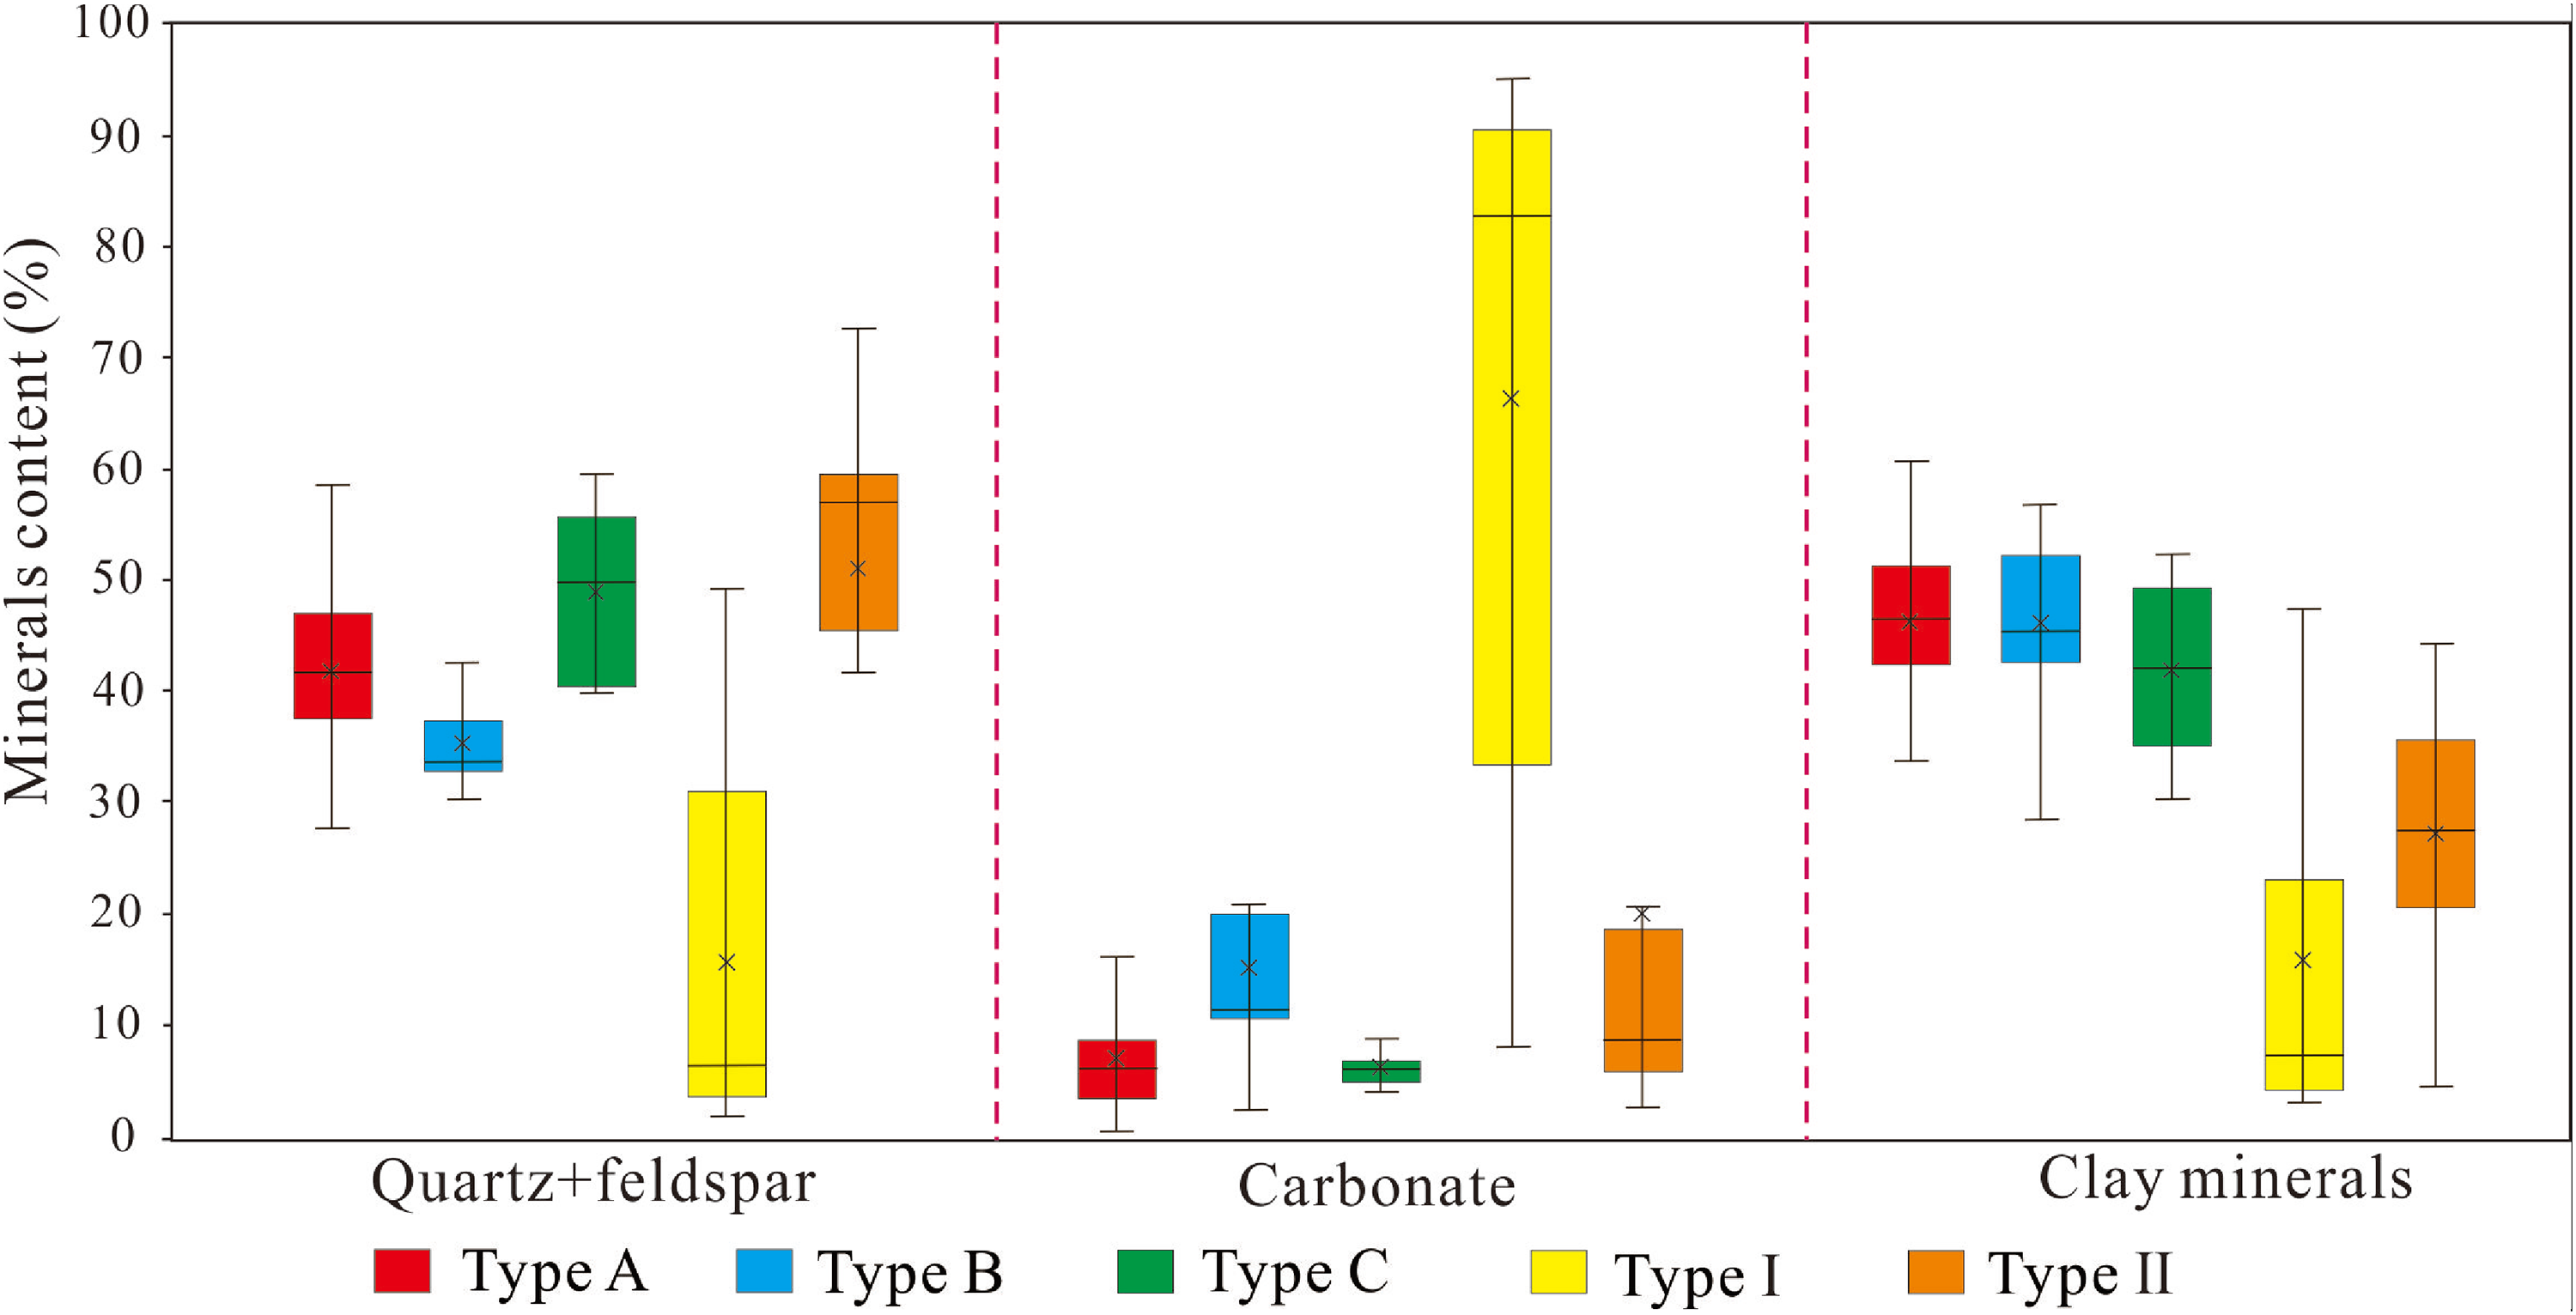
Mineral compositions and brittle minerals content of different lithofacies in the J1da2 samples.
Electric properties
Comparing the electric properties of WF-LM shale with Jurassic shale, the marine shale gas layers generally have a characteristic of “four highs and three lows,” which are the high natural gamma ray (GR), high uranium (U), relatively high acoustic time difference (AC), relatively high resistivity (Rd, Rs, LLD, and LLS), low density (DEN), as well as relatively low neutron (CNL), low uranium-free gamma. Among them, density logging (DEN) can better identify and classify shale gas layers, that is, the density value of shale gas layers is generally no more than 2.72 g/cm3 (Guo et al. 2016). However, in this study, for the lacustrine J1da2 shale, it presents the electrical characteristics of “three highs,” which are high GR, high AC, and relatively high resistivity (LLD, LLS), as shown in Figure 2. The standards of electric properties to ascertain J1da2 shale gas intervals are as follows: GR≥54 API, AC≥78 µs/ft, CN≥19%, R≥20Ω·m. The above characteristics show that the electrical properties of shale gas in the marine and terrestrial shale are similar to a certain extent, such as, they both have high GR, high AC and relatively high R. However, the DEN values of the J1da shales do not have a good positive correlation with TOC content, like the marine shale gas layers. In this study, the DEN values of J1da2 shale have a poor correlation with TOC content (Figure 11a). By correlation fitting, it is found that the TOC content also has a poor correlation with the U value (Figure 11b), distinctly different from the previous studies by Guo et al. (2016). He thought the U value of J1da2 shale in the Yuanba area was generally larger than 2.5 × 10⁻⁶. Therefore, both DEN and U values cannot be used to calculate the TOC content of J1da2 shale, indicating the electrical property is not enough to reflect the enrichment of shale gas in Well A.
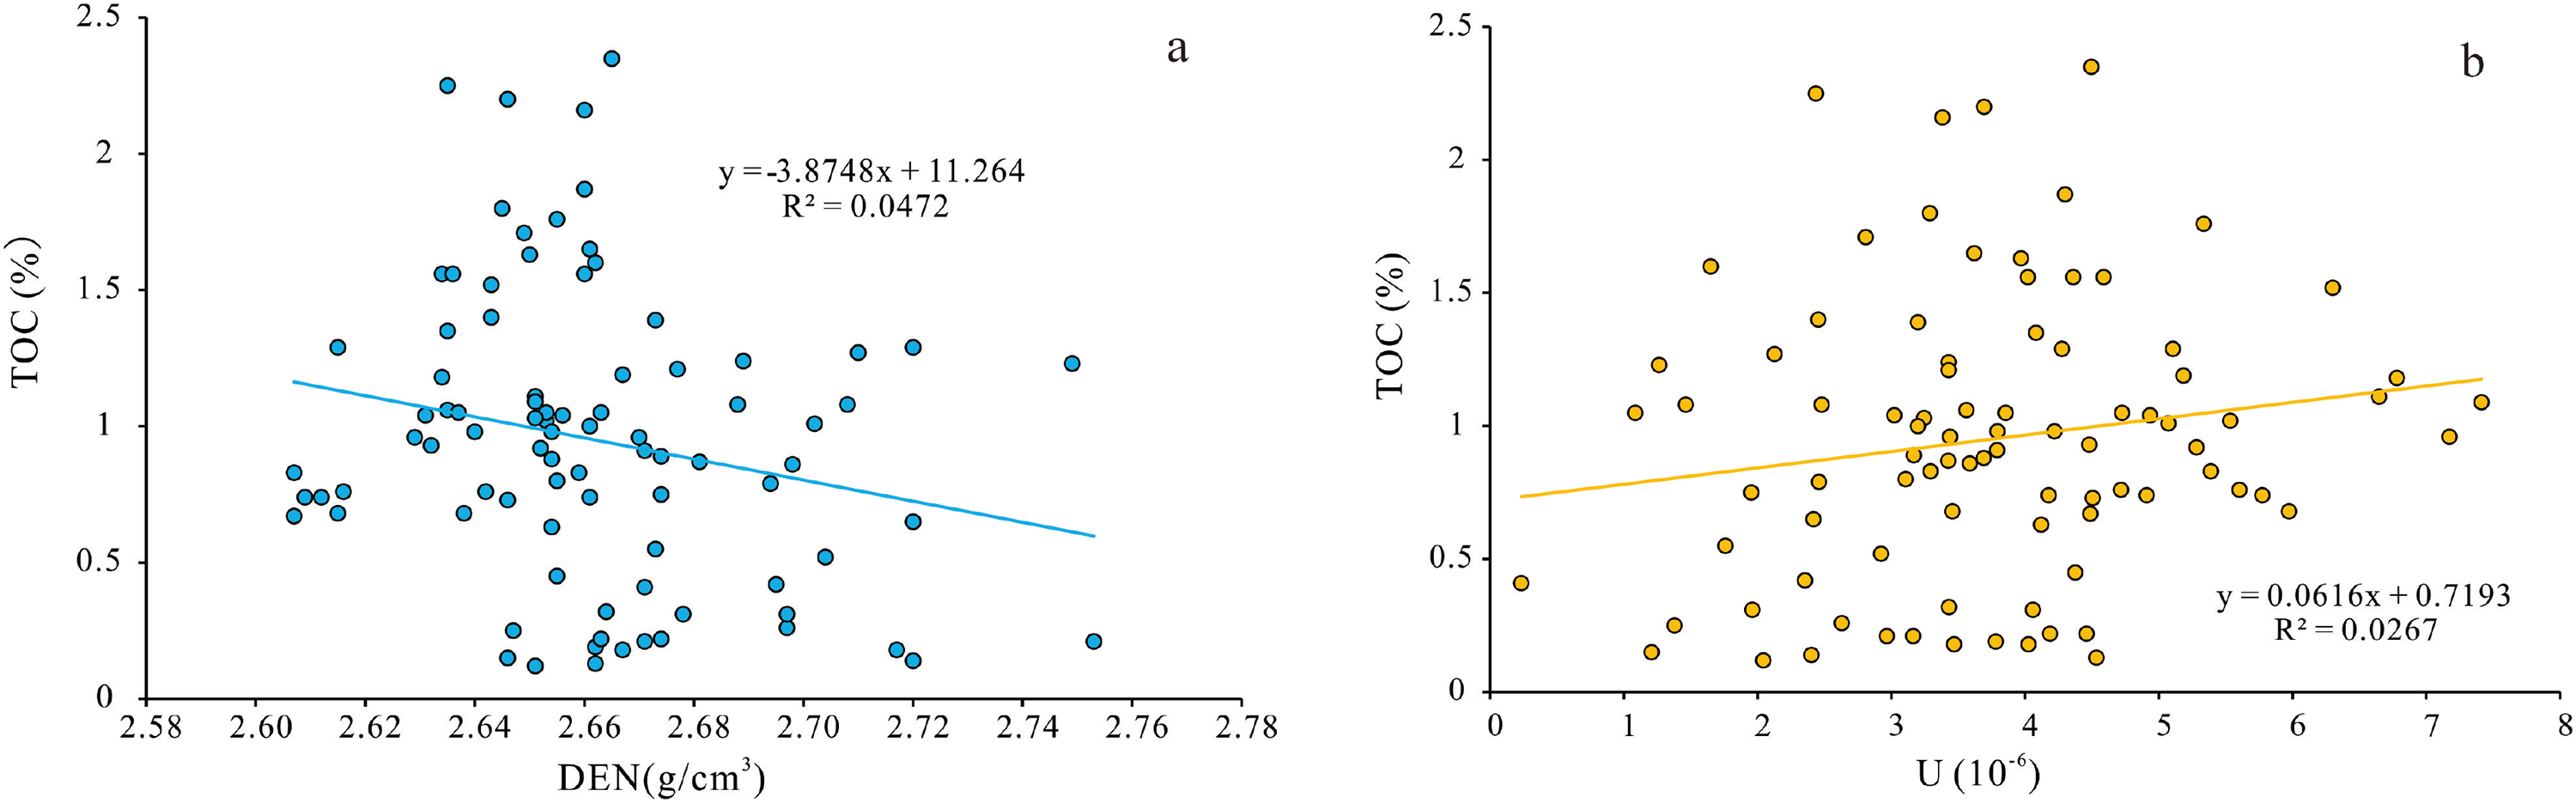
Correlations of TOC content and density, U value of the J1da2 in the Yuanba area.
Discussions
The integrated characteristic of source–reservoir was the core of shale gas generation, occurrence, enrichment, and production (Hu et al. 2021). Favorable organic geochemical conditions were the basis for shale gas generation, good reservoir conditions were the key to shale gas enrichment, and suitable “source–reservoir” coupling relationship guaranteed the optimal intervals to be selected (Liu et al. 2021; Tang et al. 2022a). Compared with the WF-LM shale, the J1da shale in this study has obvious differences in terms of source rock and reservoir. Firstly, the depositional environment changes frequently, leading to strong lithological heterogeneity and diverse lithofacies types. Common sedimentary structures such as laminae and interlayers, result in thin thickness and poor continuity of high-quality shale. Secondly, TOC content is lower and OM type is worse. The TOC content of J1da shale is mostly between 1% and 2%, and the OM types are mostly type II1 and II2. Thirdly, the inorganic pores are relatively developed, while organic pores are less developed. The development degree of organic pores is the core of judging the contribution of “source” to “reservoir” and the relationship of source–reservoir coupling. Lastly, clay mineral content is relatively high, indicating a poor compaction resistance ability, which is not conducive to fracturing and reflects the importance of laminations and interlayers. Therefore, it is believed that when selecting the optimal shale gas intervals and horizontal target of Well A, the following key parameters should be paid more attention: (1) TOC, OM type; (2) thickness of continuous organic-rich shale; (3) development of organic pores; (4) development of laminae/interlayers and lithological assemblages.
Favorable intervals evaluation of the “source”
Based on the above analysis, for the same shale, intervals rich in OM abundance, type and thickness are the key indicators for sweet spot evaluation and preferred target selection. Organic geochemical properties show that the OM abundance of J1da is overall general, lower than the marine shale (Huang et al. 2018; Liu et al. 2021). In this study, type A has the largest OM abundance with TOC content ranging from 0.52% to 2.2%, followed by type B with TOC content of 0.74%–1.87% and type C with TOC content of 0.82%–1.73%. Intervals of TOC larger than 1.0% were considered. It was well known that OM types represent hydrocarbon-generating parent materials, so it was hydrocarbon-generating capacities. Generally speaking, for the same TOC content per unit mass of shale, the overall ranking of hydrocarbon generation potential was in the order of type I > type II1 > type II2 > type III from strong to weak. Therefore, a better OM type was a key to optimizing the shale gas enrichment intervals (Liu et al. 2021).
Due to the rapid changes in the terrestrial facies, the thickness of organic-rich shale, especially the continuous organic-rich shale, was particularly important (Guo et al. 2021; Wang et al. 2013). The thickness of organic-rich shale determined the resource scale. The continuous shale deposition indicated that the lake was relatively stable, and the average TOC content was generally high, which could provide a material guarantee for hydrocarbon generation (Melnikov et al. 2019). For example, the thickness of high-quality shale both in the upper and lower parts of the Bakken Formation was 5–12 m and widely distributed in almost the entire Williston basin (Li et al. 2019b). The high-quality shale with 38 m thickness in the WF-LM Fm. of Fuling Shale Gas Field was known as a favorable target for exploration wells and commercial production (Nie et al. 2020). They proved the importance of finding thick organic-rich intervals in shale strata. However, influenced by the fast-changed sedimentary facies, the overall distribution and thickness of organic-rich shale in the J1da strata were not that stable, the strong vertical and horizontal heterogeneity made a poor continuous distribution and less thick of high-quality shale (Zhou et al. 2020).
Therefore, when selecting the favorable intervals of J1da2 shale from the perspective of geochemical characteristics, the superimposed intervals with higher TOC, better OM type, and larger continuous thickness should be given priority to consider. In this study, favorable intervals of the J1da2 shale strata in the Yuanba area can be selected as, shown in Figure 12, corresponding to the depths of 3885–3889 m and 3909–3916 m for Well A.
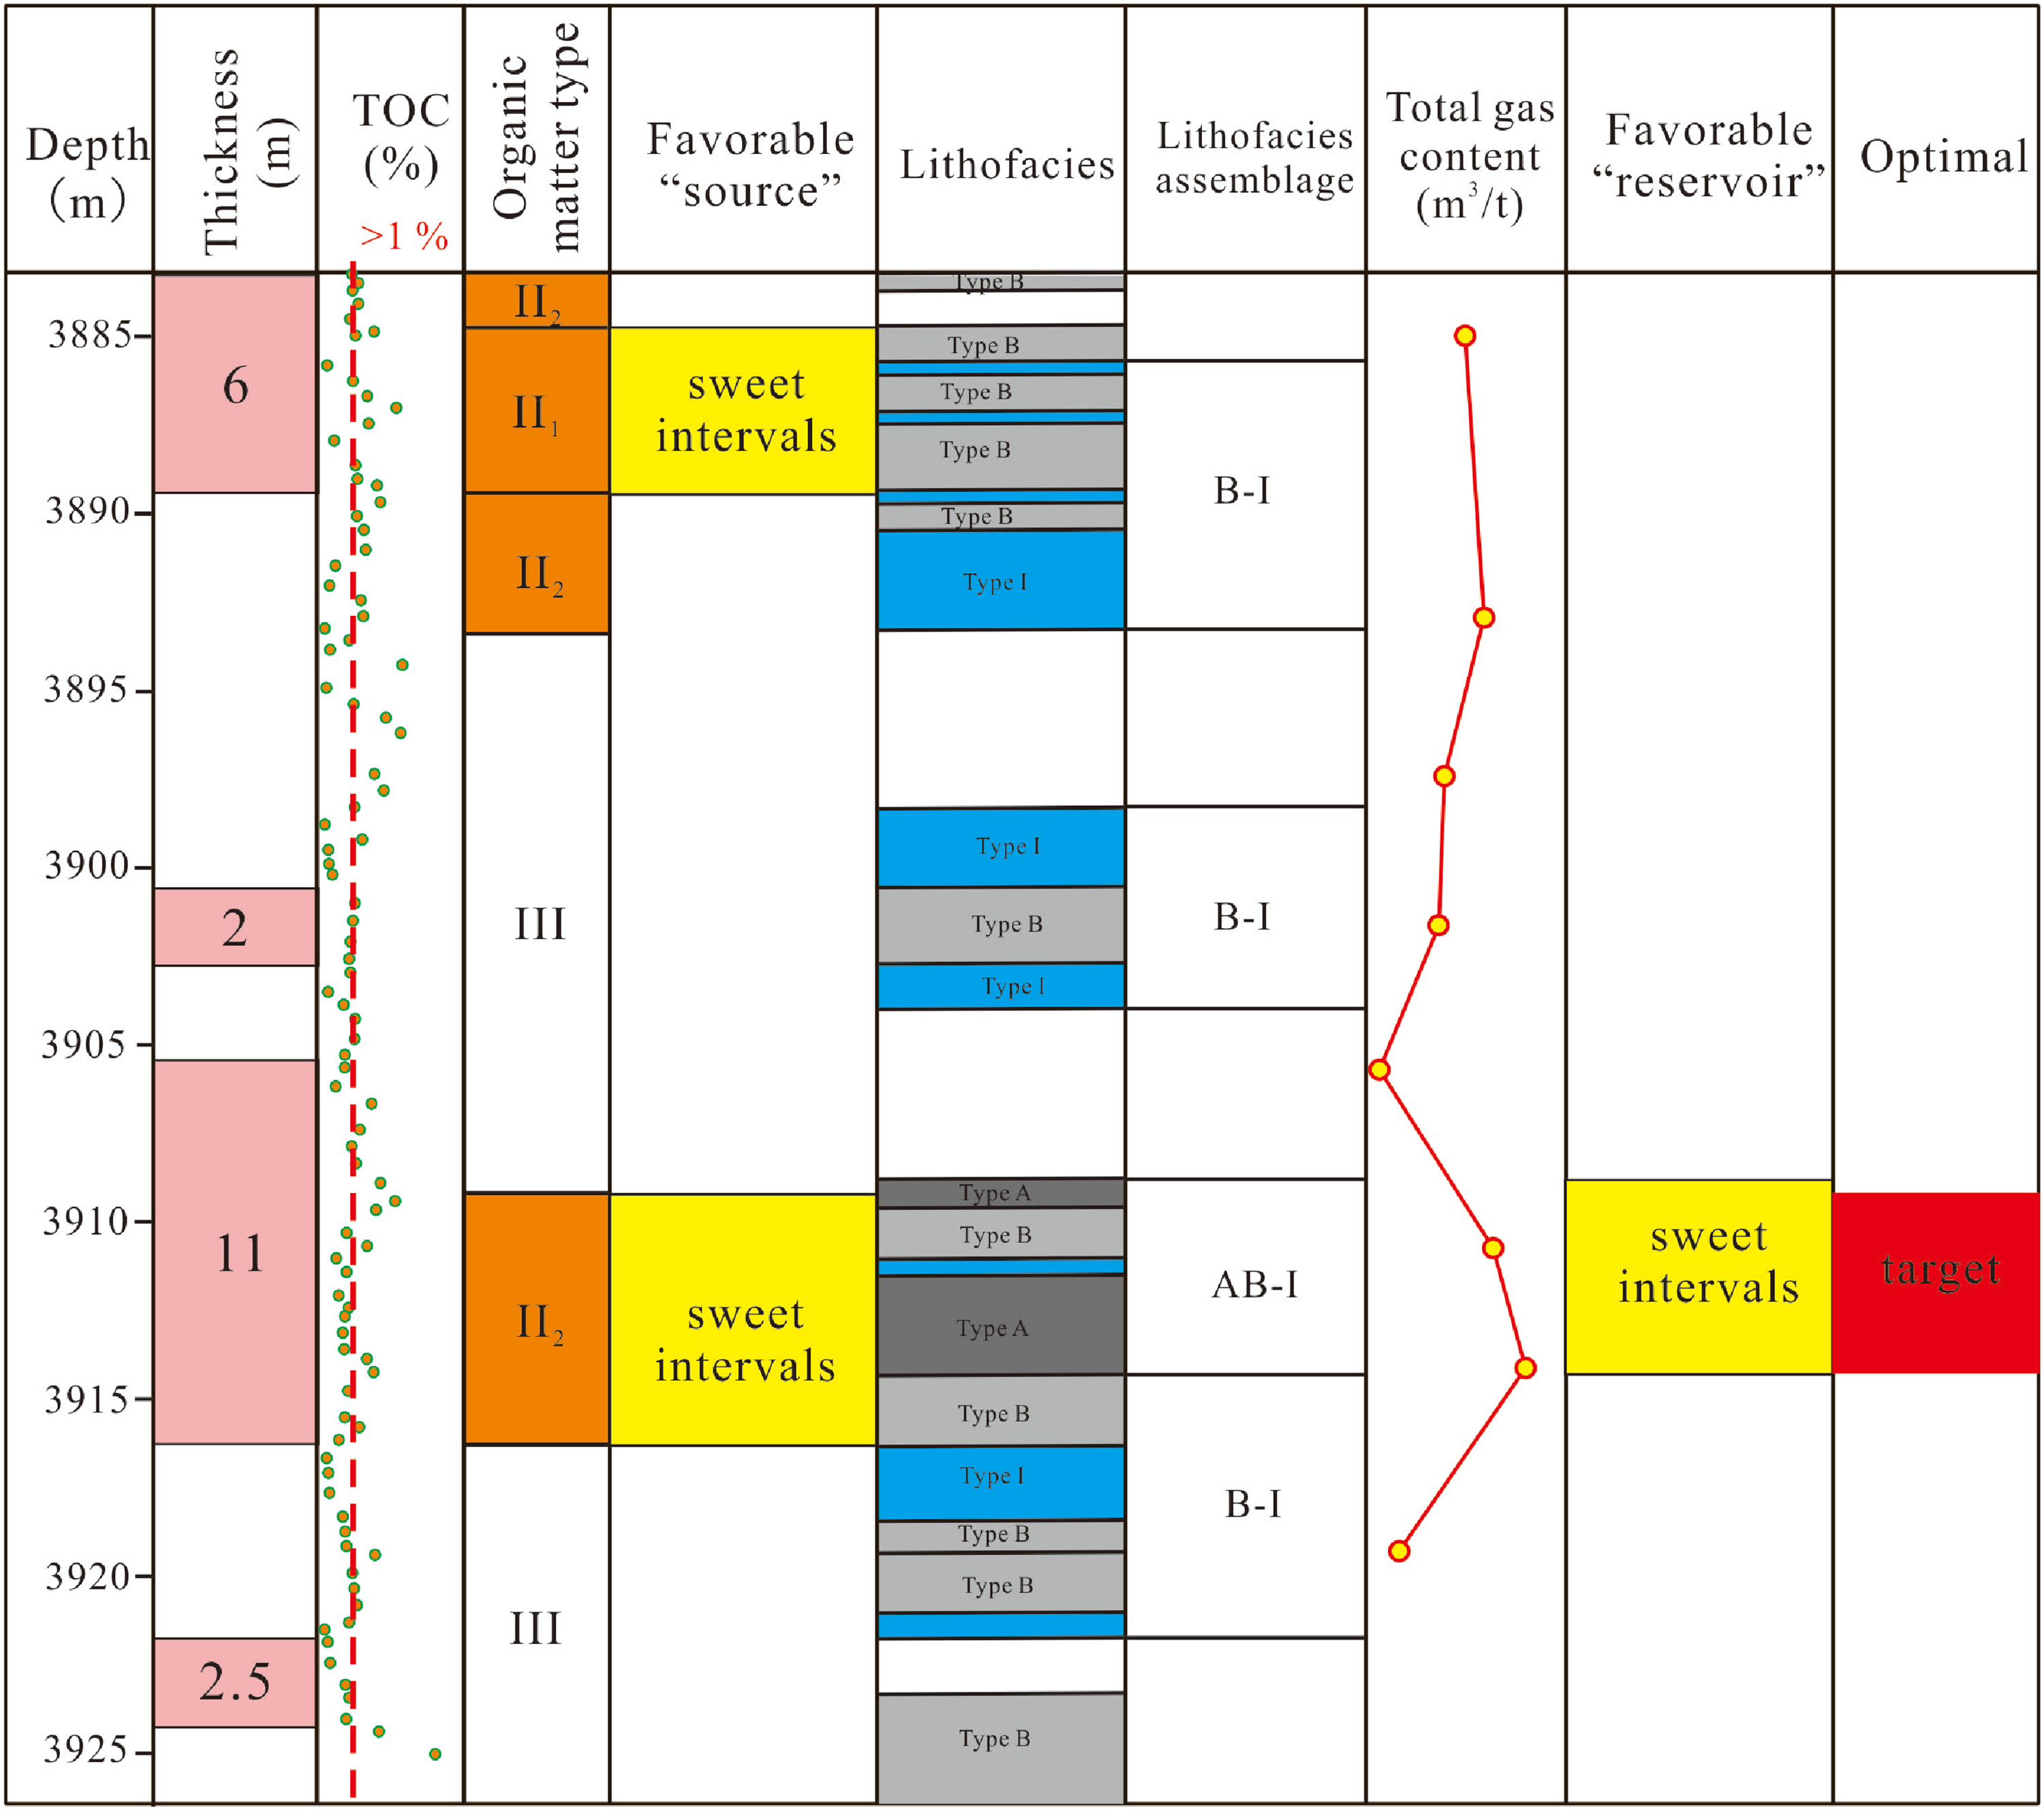
Optimal intervals selection of J1da2 of Well A.
Favorable intervals evaluation of the “reservoir”
From the current research, whether it was marine shale or terrestrial shale, well-developed OM pores were still the key to shale gas enrichment (Wu et al. 2016). Compared with the marine shale, the development of OM pores in the terrestrial shale was lower. Some thought that it was due to the thermal evolution degree of the J1da shale was generally lower, which led to the poor development of OM pores in shales (Hu et al. 2021; Xu et al. 2016). Liu et al. (2021) believed that the composition of organic maceral was also the key factor controlling the development of OM pores, and thought that OM pore abundance should be mainly controlled by OM type. The development of solid asphalt made a primary contribution to the development of organic pores. In this study, intervals with relatively developed solid asphalt have the most developed OM pores, as shown in Figure 7. OM type in types A and B is mainly mixed with a relatively high proportion of solid asphalt in organic maceral, and the shale strata has entirely entered the high-mature evolution degree, which is beneficial to the development of OM pores (Figure 12).
Through the above analysis and comparisons of various characteristics such as mineral compositions, TOC content, physical properties, pore structure, pore types, gas content, and fracturability of different lithofacies, the optimal lithofacies of J1da2 shale strata were selected. In sum, from a geological point of view, the physical properties of type I and II are worse than that of type A, B, and C, significantly reducing the quality of shale reservoirs. Therefore, shale lithofacies with developed lamination is more favorable than lithofacies assemblages. For different shale lithofacies, type A has higher TOC content, widely developed OM pores, and higher gas content, which can be considered the most potential reservoir type. Type B has relatively developed calcite dissolution pores, micro fractures, and higher free gas content, which is conducive to fracturing and later production and can be used as a secondary potential reservoir type. Type C has poor physical properties, underdeveloped pores and lower gas content, which can be seen as the lowest exploration potential. However, from the perspective of engineering fracturing performance, lithofacies assemblage type AB-I is the most favorable reservoir type, because it has well-developed lamellations, thin limestone interlayers with better brittleness, and large lithology differences among layers. It is beneficial for forming horizontal fractures and obtaining higher productivity after fracturing. Thus based on the above analysis, it is concluded that type AB-I is the favorable reservoir of J1da2, corresponding to a depth of 3908–3914 m, as shown in Figure 12.
Optimal intervals selection of J1da of Well A
The optimal interval selection of shale strata should consider both geochemical properties and reservoir properties, as well as the “source–reservoir” coupling relationship. Besides, gas-bearing and fracturability features should also be taken into consideration. Hu et al. (2021) revealed the macro source–reservoir configuration and micro source–storage coupling mechanism of the J1da shale strata. Liu et al. (2021) identified three macro source–reservoir coupling types by studying the Jurassic Ziliujing Formation. It was proposed that the lithofacies assemblages of shale type and shale intercalated thin-layer shell limestone type had good development conditions of “source” and “reservoir.” For this type, the correlation between source and reservoir was relatively high, which was the most favorable lithofacies assemblage type for the enrichment of terrestrial shale oil and gas. By comprehensively evaluating the “six properties” as the above analysis in this study, the optimal intervals and horizontal target of J1da2 are selected, corresponding to the depth is 3909–3914 m, shown in Figure 12. Within this interval, the geological “six properties” are favorable. In addition, the inorganic mineral content is basically the same, so the resistance to compaction is similar, and the contribution of “source” to “reservoir” is relatively large. It is conducive to the formation of a highly correlated source–reservoir coupling relationship. Therefore, this interval has better exploration and development potential.
In this study, taking Well A as an example, a series of geological characteristics of J1da shale strata in the Yuanba area have been formed, including new sights into the “six properties” of the Jurassic shales, and in-depth optimization of favorable intervals from both source and reservoir perspective. This study has application value for the selection of favorable targets of other wells in the J1da shale in the Sichuan Basin but also lay the foundation for the later systematic studies of shale gas accumulation mechanism and enrichment regularity in the Yuanba area.
Conclusions
The upper part and lower-middle part of J1da2 strata have greater capacity for oil and gas generation, which are the main geochemical targets. The superimposed intervals with higher TOC, better OM type, and larger continuous thickness are the favorable intervals of the “source,” corresponding to the depths of 3885–3889 m and 3909–3916 m in Well A.
J1da shale strata contain three shale lithofacies types and two types of interlayer lithofacies types, i.e., clay shale lithofacies (type A), shell limy shale lithofacies (type B), silty shale lithofacies (type C), shell limestone (type I), and siltstone (type II). Three macro-lithofacies assemblages types are further divided, including mudstone–limestone lithofacies assemblage (type AB-I, B-I), mudstone–sandstone lithofacies assemblage (C-II), and mudstone–limestone–sandstone lithofacies assemblages (type BC-I).
The optimal intervals and horizontal target of J1da2 is corresponding to the depth of 3911–3914 m, where the “six properties” are better, indicating greater exploration and development potential. In this interval, the contribution of “source” to “reservoir” is relatively large, conducive to the formation of a highly correlated source–reservoir coupling relationship.
Footnotes
Acknowledgements
This research is financially supported by the National Science and Technology Major Project (2017ZX05036004), and the China Petroleum & Chemical Corporation Technology Development Project (G5800-20-ZS-HX042). The authors would like to express our sincere gratitude to the Southern Company of Exploration, SINOPEC, for providing shale samples. The authors are also grateful to the Experimental Research Center of Wuxi Institute of Petroleum Geology, Sinopec Petroleum Exploration and Development Research Institute, to help us complete the experiments. Last but not least, the authors wish to thank the anonymous reviewers for their valuable comments that significantly improve the quality of this paper.
Declaration of conflicting interests
The author(s) declared no potential conflicts of interest with respect to the research, authorship, and/or publication of this article.
Funding
The author(s) disclosed receipt of the following financial support for the research, authorship, and/or publication of this article: National Science and Technology Major Project (2017ZX05036004); China Petroleum & Chemical Corporation Technology Development Project (G5800-20-ZS-HX042).