
Abstract
The effects of brittle minerals in shale diagenesis on shale pores remain controversial and it is difficult to quantify directly. However, the relationship between brittle minerals and shale pores could provide indirect guidance regarding diagenesis processes in post-mature marine shales. In this study, the pore size distribution was determined, and the relationship between pore volume and shale composition was examined in shale samples with different total organic carbon contents from the Wufeng and Longmaxi Formations, with the objective of distinguishing pore size ranges in organic matter and inorganic minerals, respectively, and studying shale diagenesis. The samples of the Wufeng and Longmaxi shales are composed of clay minerals, calcite, dolomite, quartz, feldspar, and some minor components. The pore size distributions, which were determined using nitrogen adsorption isotherm analysis of shale and kerogen, show similar trends for pore sizes less than approx. 6.5 nm but different trends for larger pore sizes. Mercury injection saturation shows that macropores account for 14.4–22% of the total pore volume. Based on a series of crossplots describing the relationships between shale composition and pore volume or porosity associated with different pore sizes as well as on scanning electron microscopy observations, organic matter pores were found to comprise most of the micro-mesopores (pore diameters < 6.5 nm). Organic matter pores and intraparticle pores associated with carbonate constitute the majority of mesopores (pore diameters 6.5–50 nm). Finally, interparticle pores associated with quartz comprise the majority of the macropores. The mesopores associated with carbonate were formed by dissolution during diagenesis, whereas the macropores associated with quartz are the remainders of the original interparticle pores. Mesopore volumes increase with increasing carbonate content while macropore volumes decrease due to the ‘pore size controlled solubility’ effect, which causes dissolved calcium carbonate to precipitate in larger macropores.
Keywords
Introduction
The great success of shale gas development in North America has attracted considerable attention from other countries, including China. Shale gas reservoirs are characterized as self-contained source reservoir systems (Jarvie et al., 2007; Wang et al., 2014), the depositional mechanisms of which include mass flows, bottom currents, and suspension depositions (Abouelresh and Slatt, 2012; Loucks et al., 2009; Shanmugam, 2012; Yang et al., 2017b, 2014a, 2014b, 2017a). Their mineral grains contain mainly micro- to nanometre-size pores, their organic matter (OM) contains nanopores, and micro-fractures are also present (Dai et al., 2014; Pang et al., 2018; Wang et al., 2017). The pore size classification of the International Union of Pure and Applied Chemistry (IUPAC) divides pores into micropores (less than 2 nm in diameter), mesopores (pores with diameters of 2–50 nm), and macropores (larger than 50 nm in diameter). This classification system has been recommended for characterizing shale pores by Chalmers et al. (2012), and it has been widely used in recent years (Klaver et al., 2015; Mastalerz et al., 2013). Both qualitative and quantitative approaches such as field emission-scanning electron microscopy (FE-SEM); transmission electron microscopy, atomic force microscopy, and helium ion microscopy; low-pressure nitrogen and CO2 gas adsorption; and high-pressure mercury intrusion provide geologists with convenient methods for determining pore properties such as pore size, specific surface area, pore volume, and pore connectivity.
Shale pores are mainly associated with minerals and OM (Curtis et al., 2012; Fishman et al., 2012; Ji et al., 2014, 2015; Slatt and O’Brien, 2011). Characterizing the influence of shale composition on shale porosity is critical for understanding the pore networks in shale (Kuila and Prasad, 2013; Tang et al., 2017). Adsorbed gas commonly accounts for 20–85% of the total gas in shale reservoirs (Curtis, 2002; Hill and Nelson, 2000). Moreover, OM is the primary material onto which shale gas adsorbs, followed by clay minerals (Chen et al., 2016; Ji et al., 2016, 2017). However, adsorbed gas accounts for less than 20% of the total production over 20 years when the initial amounts of adsorbed and free gas are nearly the same (Pan and Connell, 2015). Free gas stored in pores associated with quartz and carbonate tends to play a more important role in gas production. Therefore, it is necessary to study the effects of quartz and carbonate on shale pores. Previous studies that dealt with the relationship between pore features (type, morphology, and size range) and shale composition using FE-SEM (Chalmers et al., 2012; Klaver et al., 2012, 2015; Loucks et al., 2012) used image-based point counting methods to unravel the relationships between pore volume and shale components (Chen et al., 2016; Jiao et al., 2014). Unfortunately, the outcomes of such methods are severely affected by SEM resolution and man-made factors. Quantitative work emphasizing the pore sizes of the brittle mineral components has always been neglected.
Compositional control on shale pore is closely associated with diagenesis in shale. However, the diagenesis of calcite and quartz in organic- and clay-rich shale has still not been fully characterized, and there is an ongoing debate about the effects of those minerals on shale pores. Mathia et al. (2016) argued that the presence of carbonate cement within shale could result in a stiffer framework and inhibit compaction; thus, it would promote the retention of porosity. Han et al. (2016) found that carbonate-rich black shales typically have lower total porosity values and free gas contents than do carbonate-poor black shales. Volpi et al. (2003) found that the diagenesis of biogenic silica causes reductions in porosity, but Zhao et al. (2017) argued that the presence of authigenic microcrystalline quartz derived from biogenic silica could limit compaction and preserve internal pores. Therefore, the effects of shale composition on shale pores are still poorly understood, and further research on this topic is needed.
The Late Ordovician Wufeng Shale and the Early Silurian Longmaxi Shale in the Sichuan Basin and its surroundings in southern China are well known for their high contents of OM, large net thicknesses, and high degree of maturity (Zhao et al., 2016; Zou et al., 2010). The present study employs both qualitative and quantitative methods to characterize the system of pores in the black shales of the Wufeng and Longmaxi Formations in the southern Sichuan Basin and aims to determine the relationships between shale porosity and shale composition.
Geological setting
The Sichuan Basin, which covers an area of 180 × 103 km2, is located in southern China (Figure 1(a)). It is bounded in the east by the Dalou Mountains, in the south by the Daxiangling and Dalou Mountains, in the west by the Songpan-Ganzi Terrane and the Longmen Mountains, and in the north by the Micang-Daba Mountains. It is a prolific hydrocarbon superimposed basin that developed on the Yangtze Craton. During the Ordovician, a predominance of carbonates was deposited on the Upper Yangtze Platform (Figure 1(c)). During the Late Ordovician and Early Silurian, the Caledonian orogeny reached its greatest intensity, resulting in the development of the Central Sichuan High; the Qiangzhong High; and the North Sichuan High in the western, southern, and northern parts of the Yangtze Platform, respectively (Chen et al., 2015; Zeng et al., 2011). Controlled by the compression caused by the Caledonian orogeny and the development of those highs, the sedimentary environment of the Sichuan Basin changed from open marine in the Early to Middle Ordovician to a restricted sea in the Late Ordovician, which was characterized by a low-energy, undercompensation and anoxic depositional environment.
During the Late Ordovician and Early Silurian, two third-order global transgressions occurred that resulted in the deposition of the Wufeng and Longmaxi shales. Both contain substantial amounts of OM (Mou et al., 2011). The Late Ordovician Wufeng Formation is commonly less than 20 m thick. It is composed of a series of thin-layered black shales containing abundant graptolites. Under the influence of a rapid fall in sea level caused by the Hirnantian glaciation, a thin shell-rich marl and lime-rich mudstone were deposited; it comprises the Guanyinqiao Member, which is the upper part of the Wufeng Formation (Chen et al., 2004, 2000). It is typically less than 1.5 m thick. The black shale of the Early Silurian Longmaxi Formation is widely distributed throughout the Sichuan Basin. This black shale commonly has an OM content of over 2% and a thickness of approx. 30–40 m. The black shales of both the Longmaxi and the Wufeng Formations represent important hydrocarbon source rocks, and they are the target levels analysed in this work.
Sampling and methodology
A total of 138 core samples from the Wufeng and Longmaxi shales, including 18 core plugs with diameters of 2.5 cm, were collected from wells YB6, YB7, YB8, YB9, and B1 (Figure 1(b)) in the study area. The shale samples were named by ‘well name + sampling order of this well’.
Measurements of total organic carbon (TOC) and porosity as well as analyses using XRD, low-pressure nitrogen adsorption/desorption, and mercury intrusion methods were carried out at the Research Institute of Petroleum Exploration & Development-Langfang to analyse the pore characteristics, geochemical features, and mineral compositions of these samples.
Petrology and TOC
Petrographic investigations under polarized light were carried out using a Leica DM-4500P microscope equipped with a Leica DFC450 camera. The mineral contents of all samples were determined using a RINT-TTR3 X-ray diffraction unit using Cu Kα radiation with a scan speed of 1°/min produced at a voltage of 45 kV and a current of 30 mA; the samples were scanned over the range of 2θ = 5–45°. Before XRD analysis, the black shale samples were crushed into powder with a grain size less than 10 µm. Quantitatively analysed minerals were identified with the ‘K-Value’ method using RockQuanta, 2010 software.
The TOC analyses of all samples were performed using a LECO C230 carbon/sulphur analyser. For each sample, 1 g of crushed material was treated in a porous crucible using hydrochloric acid to remove carbonates. After 2 h, the treated samples were washed out by distilled water. When the water from the crucible drained, both the crucible and crushed samples were dried overnight at 70°C, after which TOC was measured.
Porosity and mercury intrusion
Twenty core plugs with different TOCs and compositions were analysed to determine porosity and capillary pressure. Porosity was tested first by the helium expansion method using an ULTRAPORE-200A unit. Mercury intrusion was then performed using a 9510-IV mercury porosimeter under pressures ranging from 0.003 to 50 MPa, which corresponds to a minimum pore throat diameter of approx. 23 nm.
Low-pressure nitrogen adsorption
Both the shale powders and kerogen isolated from the black shales of 15 samples were analysed by a Quadrasor™ SI surface area and pore size analyser. The shale powders were prepared as follows: 200–500 mg of black shale was crushed to approximately 60–80 mesh size grains and then outgassed at 150°C for 5 h, ensuring that the water adsorbed in clay was removed. The kerogen was isolated using chemical methods: ∼200 g of shale was crushed to power and treated by chloroform for 72 h to remove the soluble OM. Subsequently, the residue was treated with HCl, HF, and CrCl2 for 12 h to remove carbonates, silicate minerals, and pyrite, respectively. Distilled water was used to wash the mixture at the end of each step; the kerogen particles were separated by centrifuging and were then freeze-dried (−5°C) for 6 h and subsequently dried at ambient temperature.
Low-pressure nitrogen adsorption/desorption isotherm analyses were performed at −196°C and at relative pressures ranging from 0.005 to 0.991. Pore volume and the pore size distributions (PSDs) were derived from the sorption curves obtained for a pore diameter size range of 1.4–200 nm using the Barrett–Joyner–Halenda (BJH) method (Barret et al., 1951). The pore surface area was calculated using the Brunauer–Emmett–Teller (BET) equation (Brunauer et al., 1938). The pore volumes and surface areas of pores of different sizes were estimated by the t-plot method (De Boer, 1958).
Scanning electron microscopy (SEM)
The SEM observations were made in three labs. All samples were coated with gold for SEM imaging. Eight shale samples were processed by a Leica EM TIC020 ion mill, using an accelerating voltage of 9 kV, a sample current of 3.5 mA, and a milling time of 6 h. An FEI Quata200F equipped with an energy-dispersive spectrometer (EDAX TEAM™ Trident SM4) was used to observe polished samples at the China University of Petroleum (Beijing) under 15–20 kV accelerating voltage and working distances of 7.7–9.0 mm. Another eight unmilled samples were observed at Beijing Normal University using a HITACHI S-4800 equipped with an Oxford IE250X-Max50 energy dispersive specttometer to determine the microstructures and morphologies of the minerals and OM under a 20 kV accelerating voltage and working distances of 11–13 mm.
Monochromatic cathodoluminescence (CL) analysis was performed in the Analytical Laboratory of the Beijing Research Institute of Uranium Geology by an FEI Nova NANOSEM 450 equipped with a HORIBA CLUE RPM CL detector and OXFORD 80 energy-dispersive spectroscopy detectors; the CL spectra were processed with Labspec 6.0 software.
Results
Petrographic composition
Petrology
The black shales of the Wufeng and Longmaxi Formations are mainly composed of quartz, carbonates, clay, feldspar, and pyrite. The contents of quartz range from 3.8 to 43.5 wt% (average 21 wt%). The quartz consists of detrital angular–subangular monocrystalline grains (Figure 2(a)) and authigenic microcrystalline cement (Figure 2(b) and (c)); the authigenic quartz cement forms the majority and shows dull luminescence in SEM-CL and an irregular shape. The spectra display relatively low peaks P-1 (wavelength of approximately 350 nm) and P-2 (wavelength of approximately 410 nm) and a relatively high peak P-3 (wavelength of approximately 600 nm). The detrital quartz grains show a relatively high luminescence in SEM-CL images, and their spectra display a relatively high peak P-3 (wavelength of approximately 600 nm) and relatively moderate peaks P-1 (wavelength approximately 350 nm) and P-2 (wavelength of approximately 410 nm).
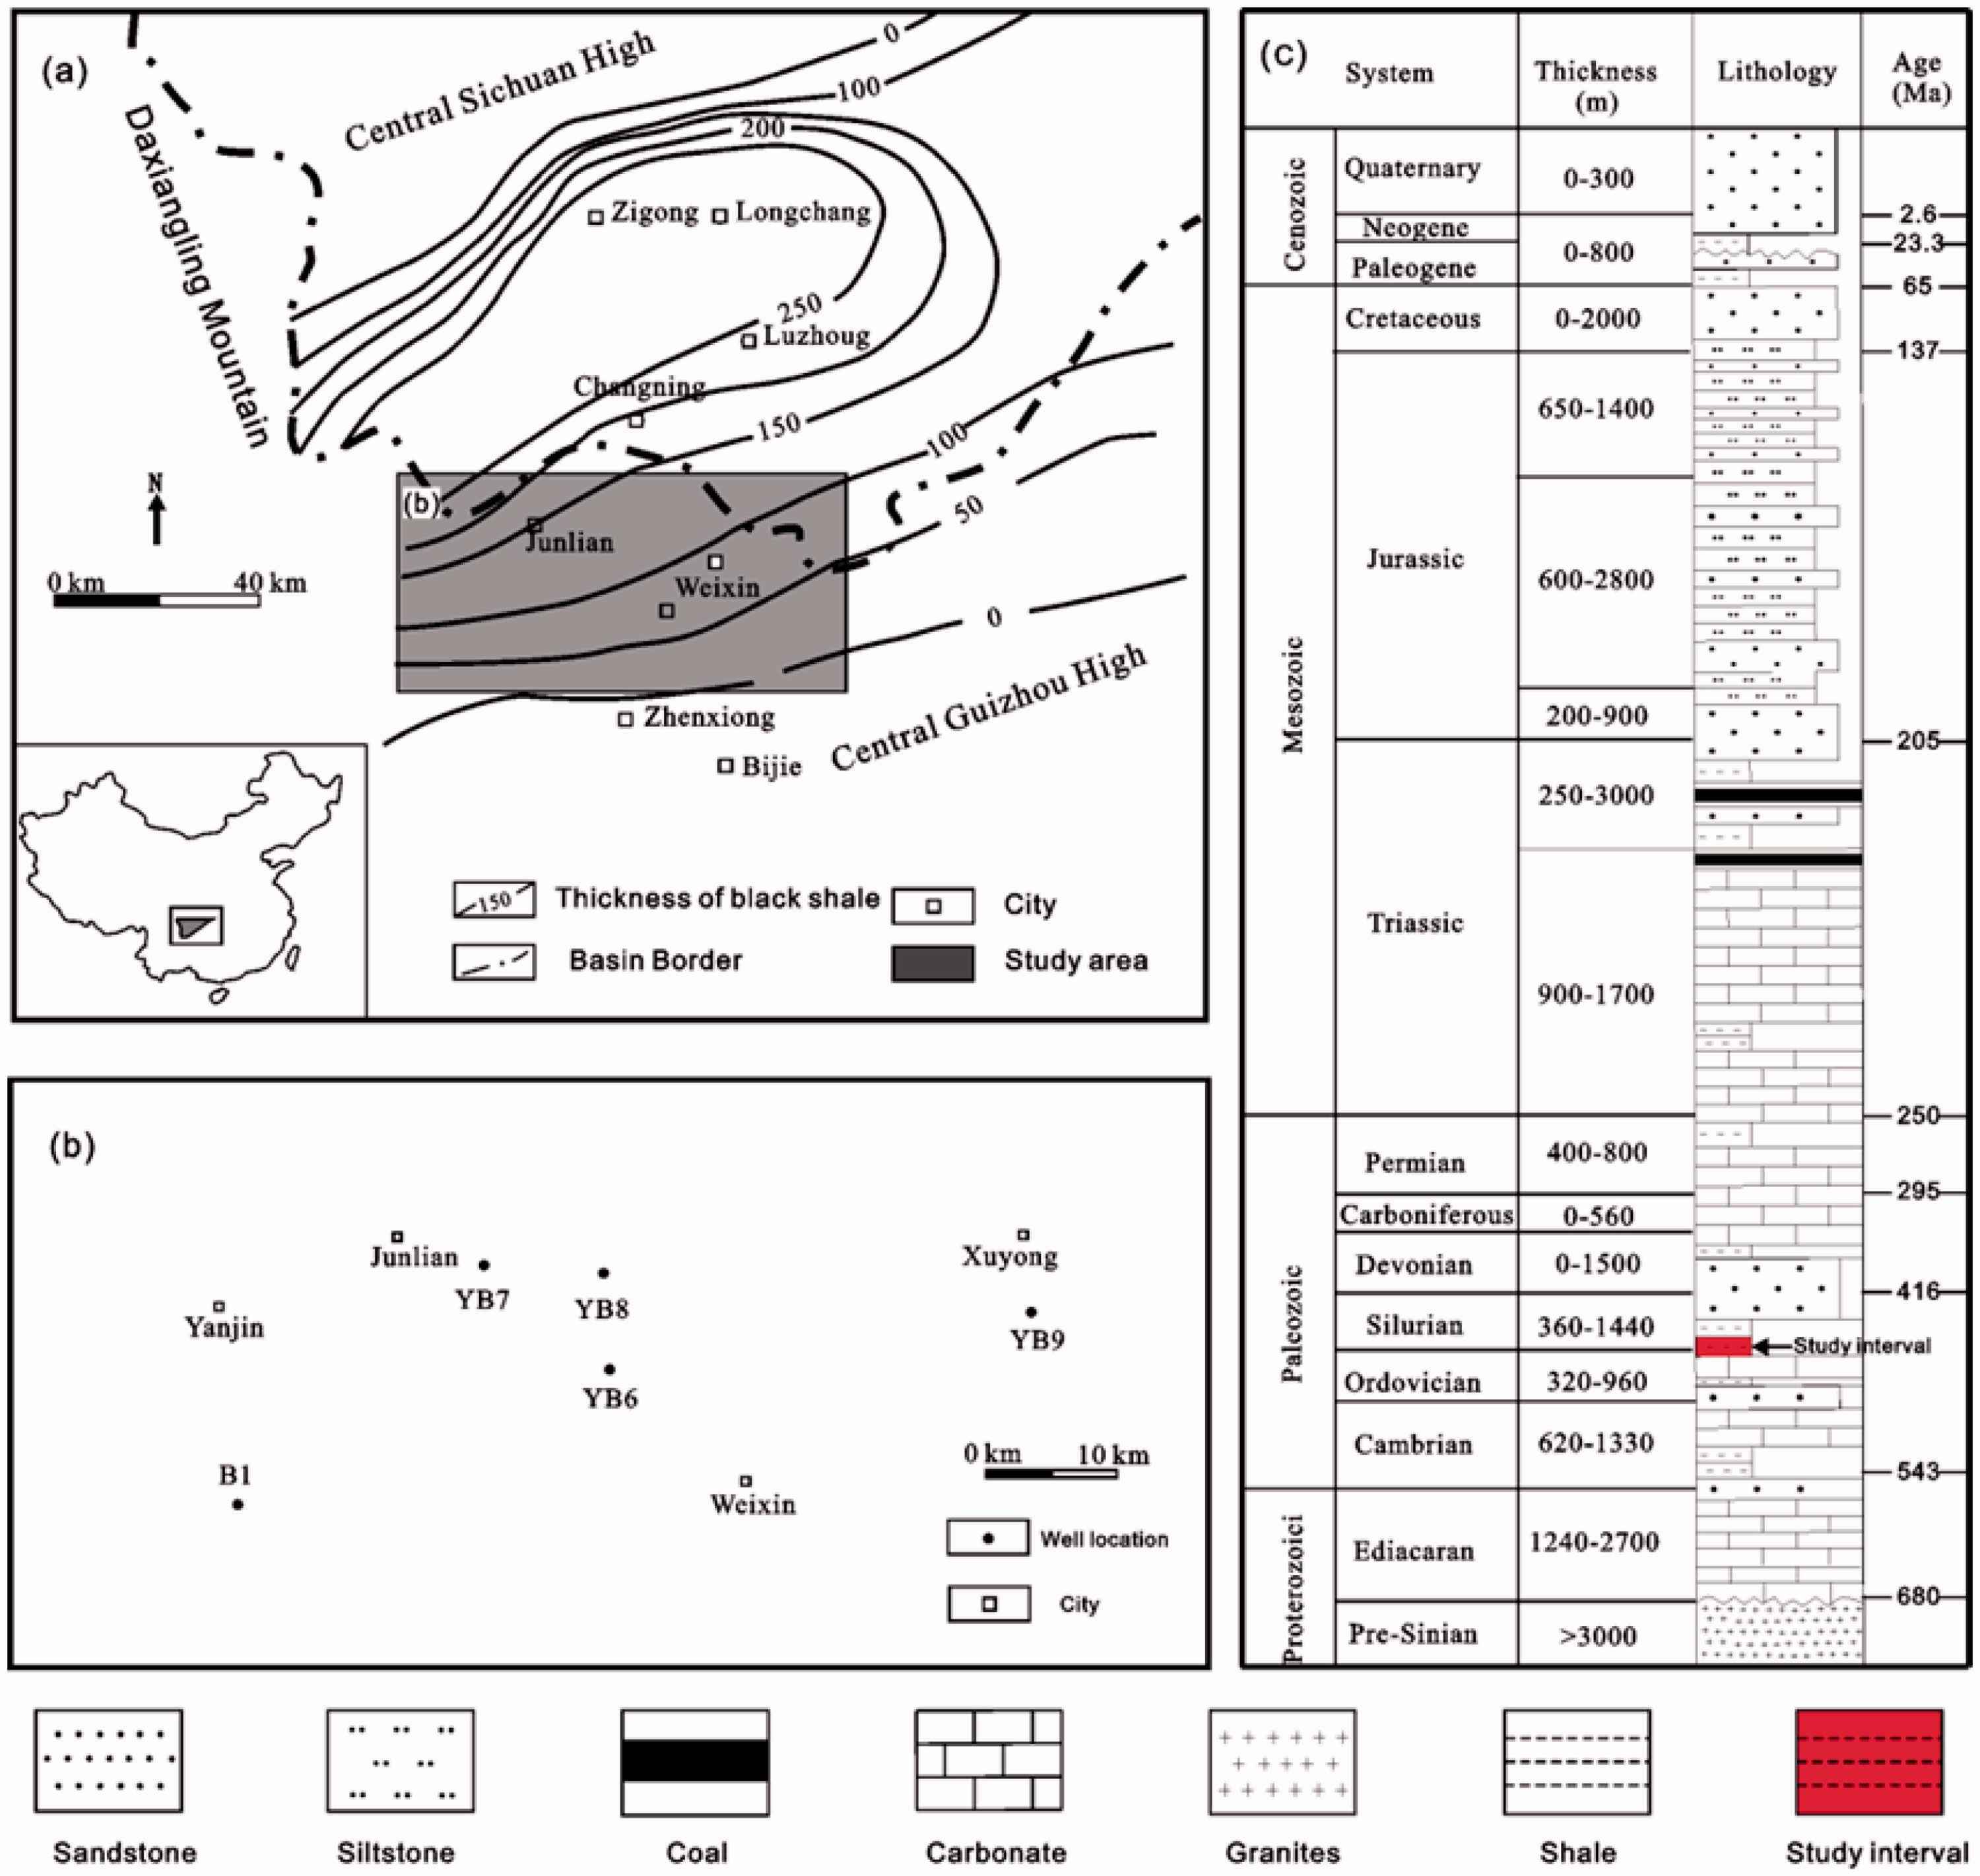
(a) Location of the study area (modified from Wang et al. (2013)), (b) location of the studied well, and (c) schematic stratigraphy of the Sichuan Basin (modified from Zhou et al. (2013)).
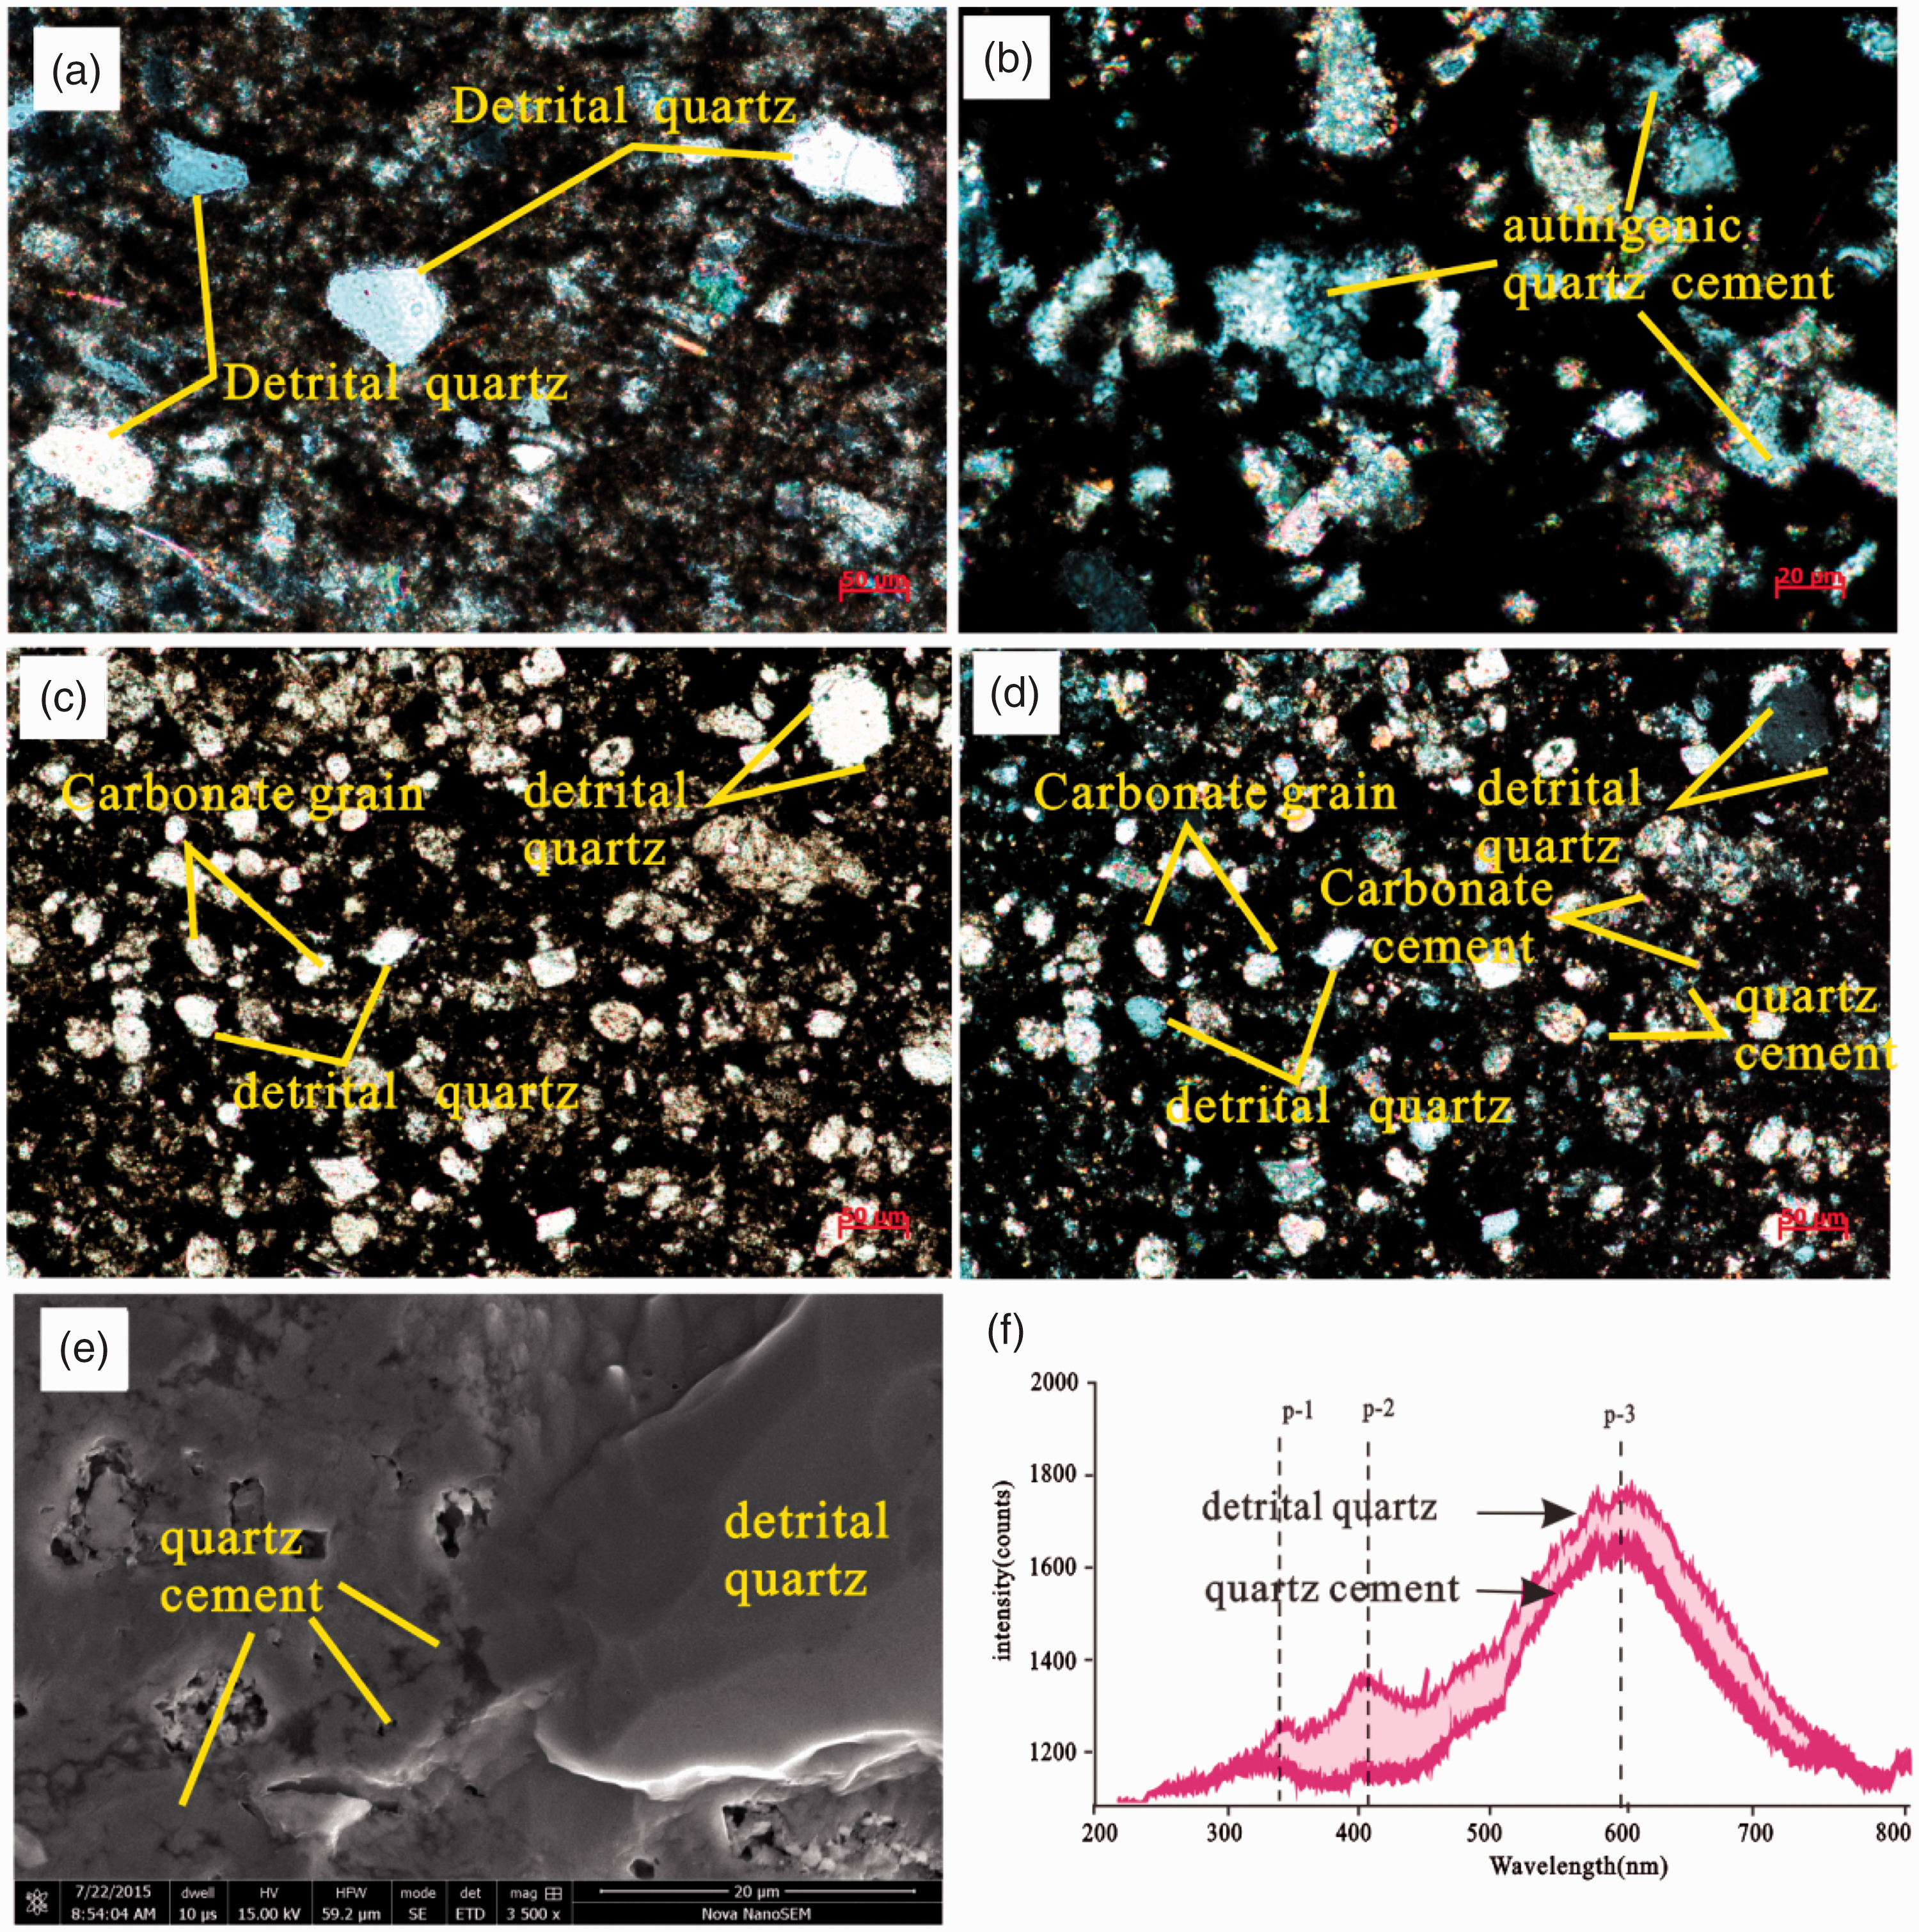
Petrographic features of the black shales obtained from the study area. (a) Characteristics of detrital quartz from the Longmaxi Formation, plane-polarized light, sample B1-1, 1181 m; (b) characteristics of authigenic quartz, crossed nicols, sample YB8-11, 2503.7 m, Longmaxi Formation; (c) carbonate grains showing a similar grain size as detrital quartz grains, plane-polarized light, YB8-2, 2474.6 m, Longmaxi Formation; (d) same sample as (c), but crossed nicols; (e) SEM photo of detrital quartz and quartz cement, sample B1-1, 1181.8 m, Longmaxi Formation; (f) CL spectra of detrital quartz and quartz cement, displaying relatively low peaks P-1 and P-2, and a relatively high peak P-3 for the cement; the detrital quartz grains display a relatively high peak P-3 and relatively middle peaks P-1 and P-2.
XRD
The carbonates include carbonate grains (allochems) and carbonate cement, and their total contents range from 8.9 to 65 wt% (average 32 wt%). Calcite accounts for 1–65 wt% (average 21 wt%), and dolomite ranges from 1.5 to 56.2 wt% (average 11 wt%). The dolomite and calcite grains show similar grain sizes (20–60 µm) and distributions as the detrital quartz and feldspar (Figure 2(c) and (d)), whereas the carbonate cement is composed of calcite with grain sizes of less than 10 µm. Clay, which accounts for 16–48.9 wt% (average 34 wt%), mainly includes illite (average 11.9 wt%), chlorite (average 8.16 wt%), and an illite–smectite mixed layer (average 12.24 wt%). Feldspar accounts for 0.8–14.1 wt% (average 7 wt%) and includes both K-feldspar and plagioclase, of which the latter is more common.
TOC
The TOC values of the black shales range from 0.24 to 7.9 wt% (average 2.54 wt%). The OM particles always occur between rigid grains and are oriented parallel to the bedding. The kerogen is mainly of the sapropelic type, with the humic-sapropelic type being second.
SEM observations and pore types
The SEM observations show that various types of pores occur in the shales, and the pore sizes range from several nanometres to several hundred nanometres. Based on the classification of Loucks et al. (2012), OM pores, intraparticle (intraP) pores, and interparticle (interP) pores have been identified in the samples. OM pores are the most common; they have spherical to ellipsoidal shapes, whereas a few are angular. Mesopores dominate in the OM, although small numbers of macropores also occur (Figure 3(a)). The unmilled samples show that the OM pores form three-dimensional networks of connected pores (Figure 3(b)).
InterP pores occur primarily around rigid particles or crystals, such as those of quartz (Figure 3(c) and (d)), dolomite (Figure 3(e)), feldspar (Figure 3(f)), and calcite. Their sizes range from tens of nanometres to hundreds of nanometres, while a few reach ∼1 µm; such pores are commonly called ‘macropores’. IntraP pores occur primarily in carbonates (Figure 3(g) and (h)), including pores formed via partial dissolution or fluid inclusions remaining after the formation of calcite and dolomite crystals, pores within framboidal pyrite, and cleavage sheet intraP pores within clay minerals (Figure 3(i)). The sizes of these pores range from a few nanometres to hundreds of nanometres, and mesopores tend to be the most common.
Helium porosity and mercury intrusion
The black shales found within the study area have extremely low porosities. The helium porosities range from 0.7 to 4.12% and have an average value of 2.37% (Table 1). Given the potential damage or compression effects on the shale porosity, a relatively low maximum mercury intruding pressure (49–50 MPa) was selected, and only pores with pore diameters larger than approx. 25 nm were detected. The cumulative mercury volume and pore volume distribution versus pore radius (Figure 4) indicate that most of the pores intruded by the mercury have pore sizes less than 200 nm. The mercury injection saturation shows that macropores account for 14.4–22% of the total porosity; their average value is 17.4%. Combined with mercury injection saturation and shale porosity, the percentages of macropores in the shale samples, which is termed ‘macropore porosity’, were calculated (Table 1) to range from 0.21 to 0.67% (average 0.44%).
Macropore porosity determined through mercury intrusion into selected shale samples.
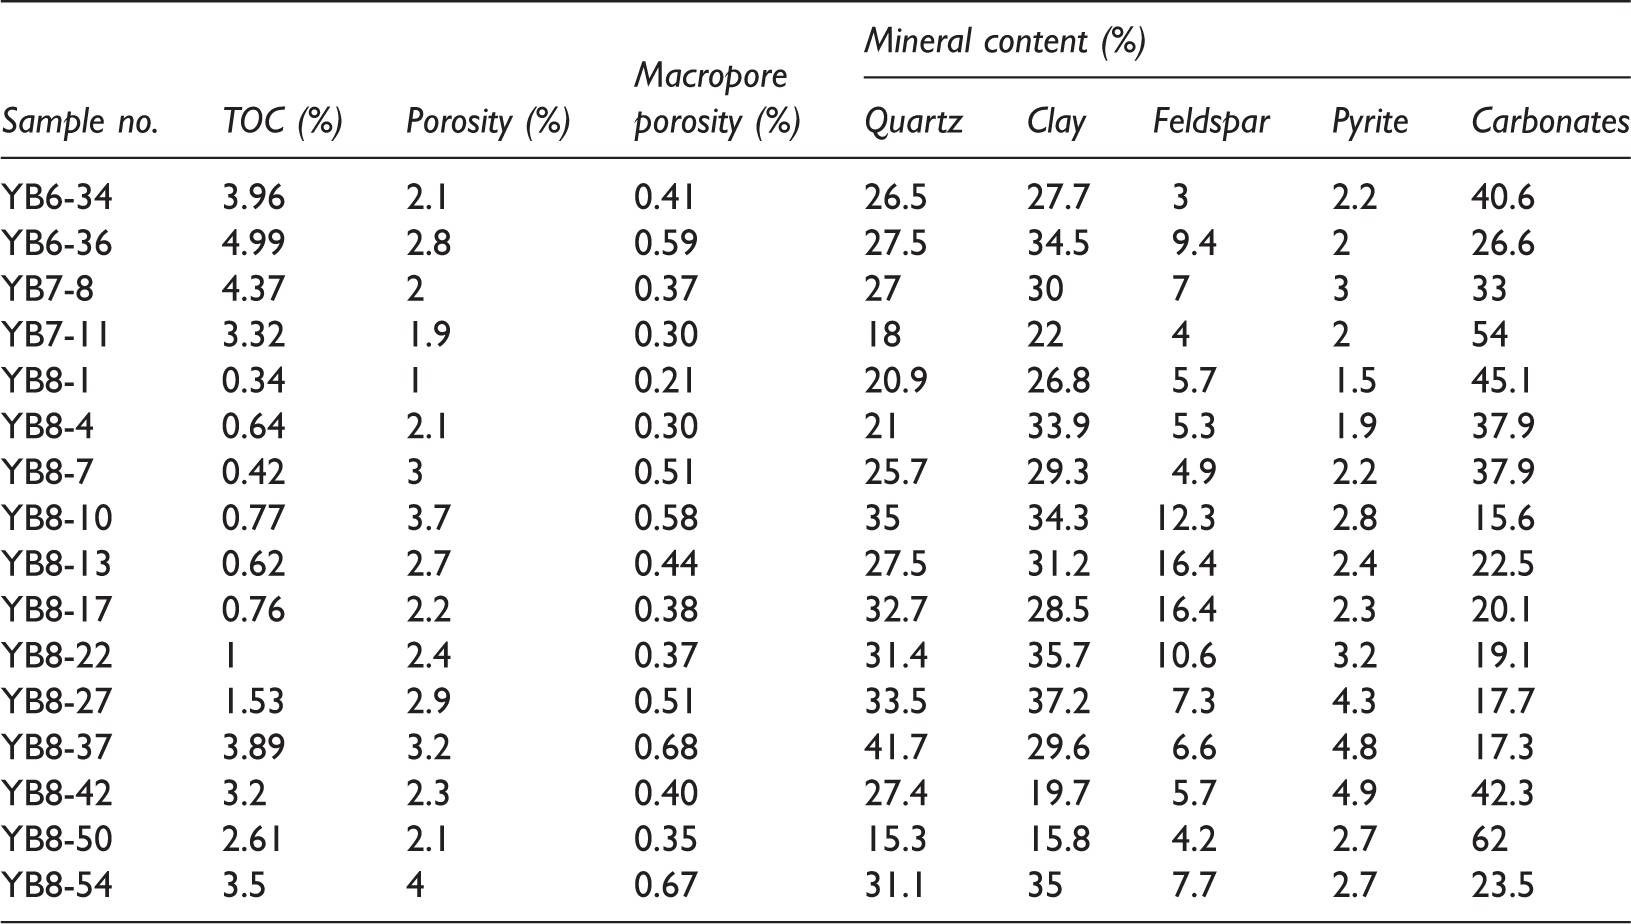
TOC: total organic carbon.
Low-temperature nitrogen adsorption/desorption isotherm of kerogens and shales
Nitrogen adsorption isotherm analysis
The nitrogen adsorption isotherms of core samples and kerogen are given in Figures 5(a) and 6(a). According to the IUPAC classification (Sing, 1985), the shapes of low-pressure nitrogen isotherms of the black shale samples and kerogen reflect type IV characteristics, which include hysteresis loops and are caused by the occurrence of capillary condensation in the mesopores (Figure 5(a)). The reversed S shapes of the nitrogen adsorption isotherms also indicate that these samples contain abundant micropores and mesopores (Brunauer et al., 1938). The adsorption volumes display a sharp increase, and no adsorption saturation occurs for P/Po close to 0.99, indicating that some large macropores are present in the shale samples. The nitrogen adsorption volume increases with increasing TOC content (Figure 5(a)), hysteresis loops have been classified by the IUPAC into four types, H1 through H4 (Sing, 1985), and these types are used to identify the pore and particle shapes. The hysteresis loops of the shale samples and kerogen are type H3, which is often associated with narrow slit-like pores.
Comparison of PSDs
The PSDs obtained for the black shales can be divided into two patterns (Figure 5(b)). Pattern A displays relatively wide hysteresis loops, which appear in the nitrogen adsorption isotherms of shale samples with relatively high TOC values (TOC >5%). For example, the PSDs of samples YB6–20 and YB6–21 (Figure 5(a)) show bimodal distributions that have major pore size peaks at approx. 3.8 nm (P1) and 6.5 nm (P2) (Figure 5(b)). Pattern B displays relatively narrow hysteresis loops and appears in the nitrogen adsorption isotherms of shale samples with relatively low TOC values (TOC <5%). For example, the PSDs of samples YB6–14, YB6–15, and YB6–17 (Figure 5(a)) show unimodal distributions with major pore size peaks at approx. 3.8 nm (P1) (Figure 5(b)). The PSDs of the kerogen show multimodal distributions with three pore size peaks at approximately P1, P2, and P3 (17.3 nm) (Figure 6(b)). The PSDs of the kerogen are multimodal (high P1, low P2 and P3) (Figure 6), the high TOC shale samples (TOC >5%) display bimodal distributions (middle P1 and low P2), and the low TOC shale samples (TOC <5%) display unimodal distributions (high P1) (Figure 6).
The PSD comparisons of kerogen and shale with different TOC values (Figures 5 and 6) show that the OM/shale pores increase from P3 to P1. That is, the shale pores with pore sizes close to P1 originate mainly from OM, and those pores constitute a high proportion of the OM pores. However, P2 appears only in the high TOC shale samples (TOC >5%), and shale pores with pore sizes close to P2 tend to originate from both OM and inorganic minerals. P3 is still not evident in the high TOC shale samples (TOC >5%), indicating that these pores mainly originate from inorganic minerals. OM tends to contain mainly pores with sizes less than approximately P2 (6.5 nm), and inorganic minerals, together with the OM, have shale pores with sizes exceeding 6.5 nm.
Relationship between pore volume and shale composition
Comparisons of the PSDs show that mineral compositions are expected to be responsible for the larger pores. The above findings, taking the pore sizes of 6.5 and 50 nm as critical values, are demonstrated in a series of figures showing the correlations between shale pore volume and porosity extracted from low-pressure adsorption analysis and mercury intrusion, on the one hand, and shale composition, on the other hand (Figures 7 and 8). Figure 7 shows that the pore volume is positively correlated with the TOC and the carbonate content, whereas it is negatively correlated with the amounts of quartz and clay. When the pore size is less than 6.5 nm, the correlation coefficients R2 describing the relationship between pore volume and the TOC and carbonate content are 0.79 and 0.54 (Figure 7(b-1) and (b-3)), respectively. When the pore size is between 6.5 and 50 nm, these correlation coefficients are 0.40 and 0.57 (Figure 7(b-1) and (b-3)).
The volumes of macropores, as determined using mercury intrusion, make up 14.4–22% of the total pore volume and average 17.4%. The macropore porosity is positively correlated with the contents of TOC, quartz, and clay, whereas it is negatively correlated with the carbonate contents. The correlations between macropore porosity and the contents of clay and TOC are relatively poor (0.21 and 0.31, respectively), whereas the corresponding value for quartz is 0.52, and that for carbonates is 0.39. The change of correlation coefficients between TOC and micro-mesopore volume or macropore porosity shows the percentage of OM pores presents a decreasing tendency from micro-mesopores to macropores.
Specific surface area and pore volume
Table 2 shows the BET surface areas, BJH pore volume, and the average pore sizes of some of the black shale samples and their TOC values. The BJH pore volumes are in the range of 0.0092–0.0255 ml/g, and the average value is 0.0156 ml/g. The BET surface areas range from 5.85 to 25.36 m2/g, and their average value is 13.85 m2/g. Both the BET surface area and the BJH pore volume increase sharply when the pore size is in the range of 3–8 nm (Figure 9). Figure 10 shows that BET surface area and BJH pore volume are positively correlated with the TOC content (Figure 10(a) and (b)), whereas the average pore sizes of the black shale samples, which range from 6.69 to 3.34 nm, display a strongly negative correlation with the TOC (Figure 10(c)).
Pore parameters from the nitrogen adsorption isotherms of some black shale samples and their TOC values.
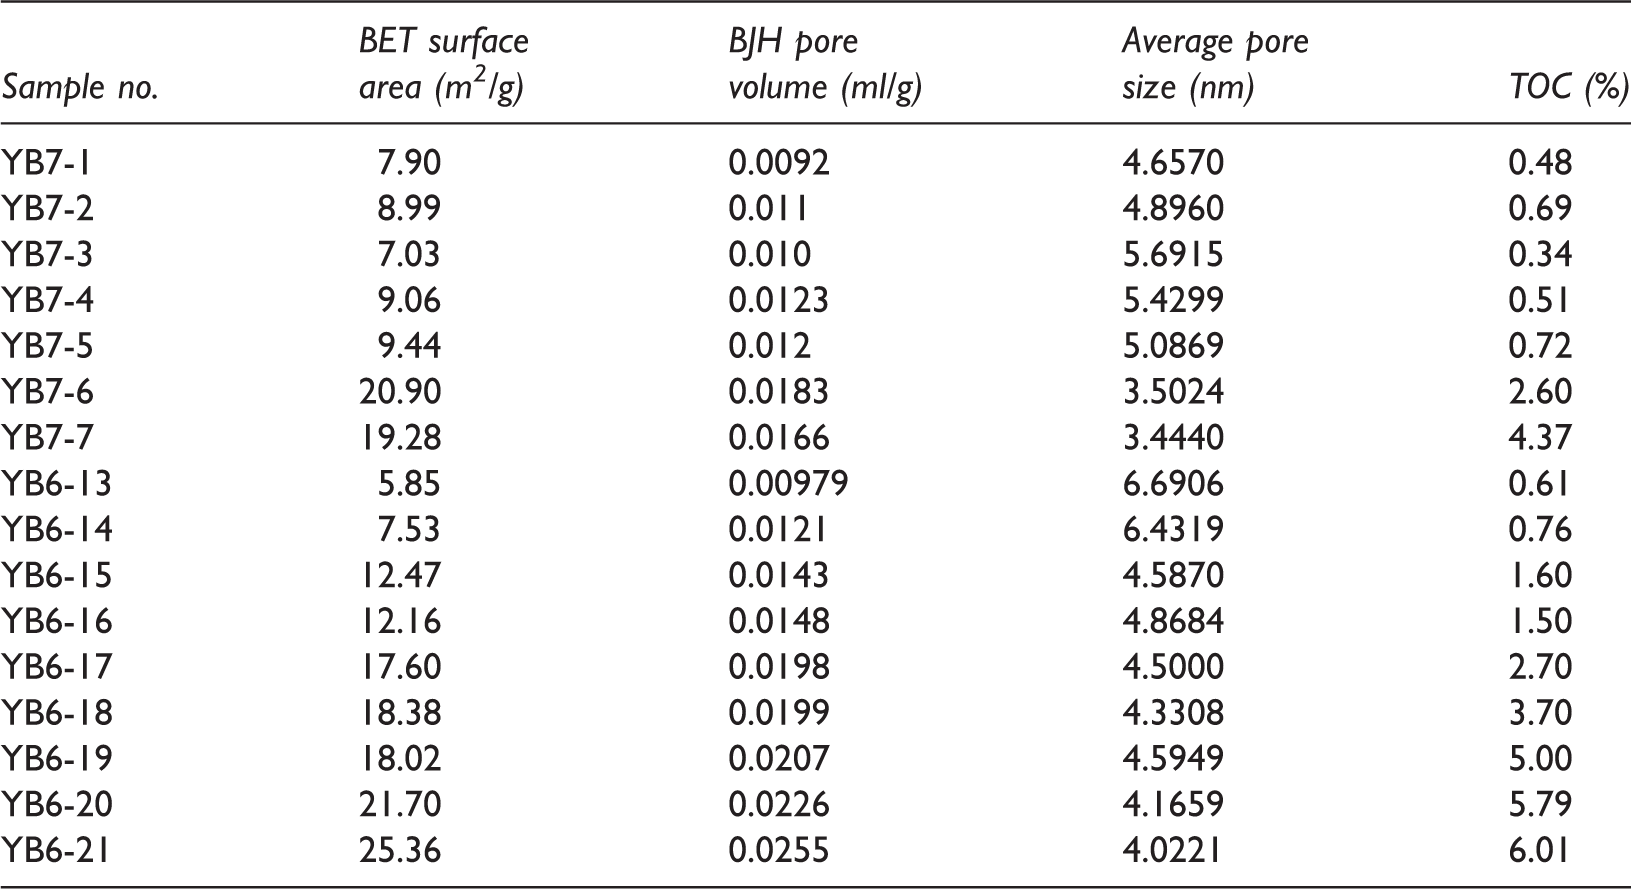
BET: Brunauer–Emmett–Teller; BJH: Barrett–Johner–Halenda; TOC: total organic carbon.
Discussion
Shale pore source analysis
OM pores are formed by the generation and expulsion of hydrocarbons during hydrocarbon maturation (Jarvie et al., 2007; Loucks et al., 2009, 2012). Previous SEM studies of shales have noted that the OM found in marine shales contains abundant nanopores (Curtis et al., 2012; Loucks et al., 2009). The strong correlations between TOC and BET surface area, on the one hand, and BJH pore volume, on the other hand (Figure 9) indicate that OM pores are the predominant pore system within the Wufeng and Longmaxi shales. This finding is consistent with the results found for the Barnett Shale and the Marcellus Shale (Loucks et al., 2009; Milliken et al., 2013).
The SEM observations have also been used to study the relationships between pore volume and shale components (Chen et al., 2016; Jiao et al., 2014), but the results appeared to be seriously affected by both SEM resolution and man-made factors. In this study, PSDs (Figures 4 and 5) show kerogen has multimodal distributions with three pore size peaks (high P1, low P2, and low P3), the high TOC shale samples (TOC >5%) display bimodal distributions (middle P1 and low P2), and the low TOC shale samples (TOC <5%) display unimodal distributions (low P1). This indicates, with the decreasing TOC content, OM pores account for a decreasing percentage, and inorganic pores present an increasing tendency from P1 to P3 which lead to the disappearance of P2 and P3 in the low TOC shale samples. Therefore, these pores with pore sizes less than 6.5 nm mainly originate from OM pores, the remaining mesopores with pore sizes of over 6.5 nm are mainly derived from inorganic minerals and OM pores, and macropores mainly originate from inorganic mineral pores. These findings are confirmed by crossplots (Figures 7 and 8) between shale pore volume for different pore size ranges and shale compositions. It must therefore be deduced that OM tends to provide most of the shale pores for pore sizes below 6.5 nm, OM and carbonates both provide shale pores between 6.5 and 50 nm, whereas quartz tends to provide macropores.
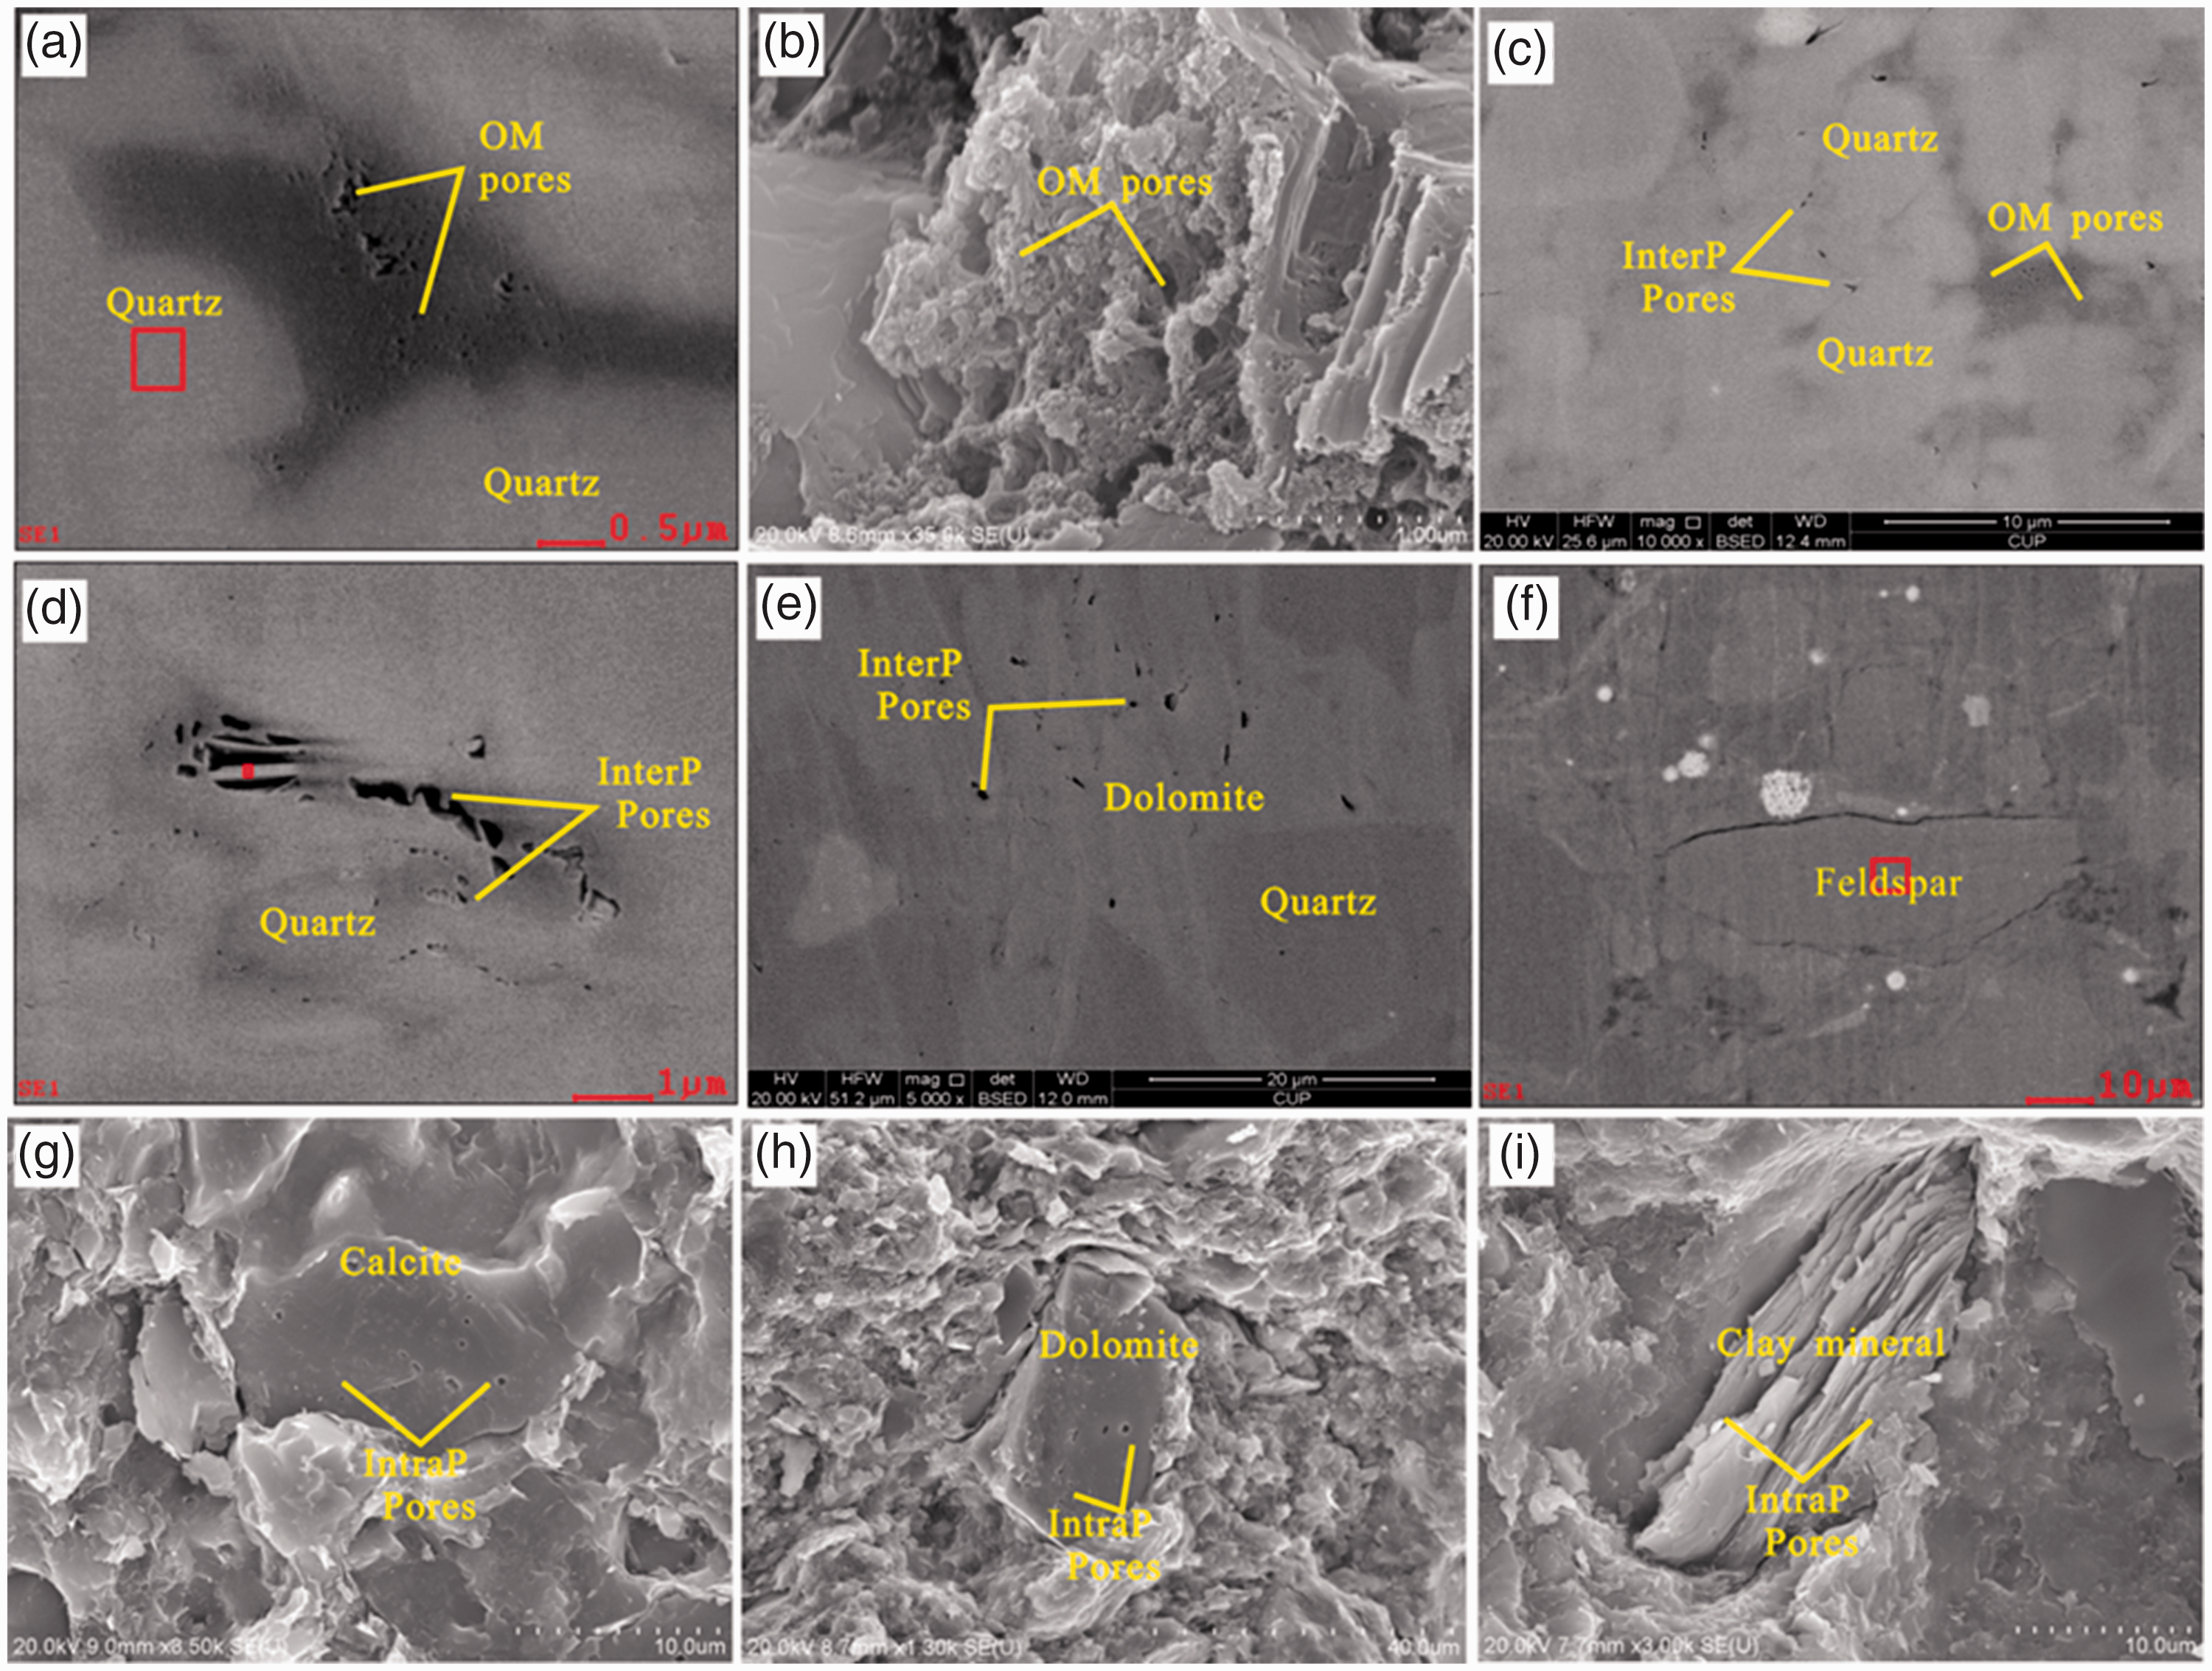
Pore types in shale samples from the Wufeng and Longmaxi Formations. (a) OM pores, BSE, sample YB6-6, 1439.8 m, Wufeng Formation; (b) OM pores showing good connectivity in three dimensions, SE, sample YB6-19, 1392.4 m, Longmaxi Formation; (c) interP pores between quartz grains and OM pores, BSE, sample YB9-3, 2203 m, Wufeng Formation; (d) interP pores between quartz grains and bioclastics, and interP pores around quartz grains, BSE, YB6-14, 1413.2 m, Longmaxi Formation; (e) interP pores between dolomite, BSE, YB9-12, 2170.2 m, Longmaxi Formation; (f) interP pores around feldspar grains, BSE, sample YB6-19, 1392.36 m, Longmaxi Formation; (g) interP pores between calcite grains, SE, sample YB7–5, 2283.9 m, Longmaxi Formation; (h) intraP pores in dolomite, SE, sample YB6-9, 1428.4 m, Wufeng Formation; (i) intraP pore in clay minerals, SE, YB6–19, 1392.4 m, Longmaxi Formation. interP: interparticle; intraP: intraparticle; OM: organic matter.
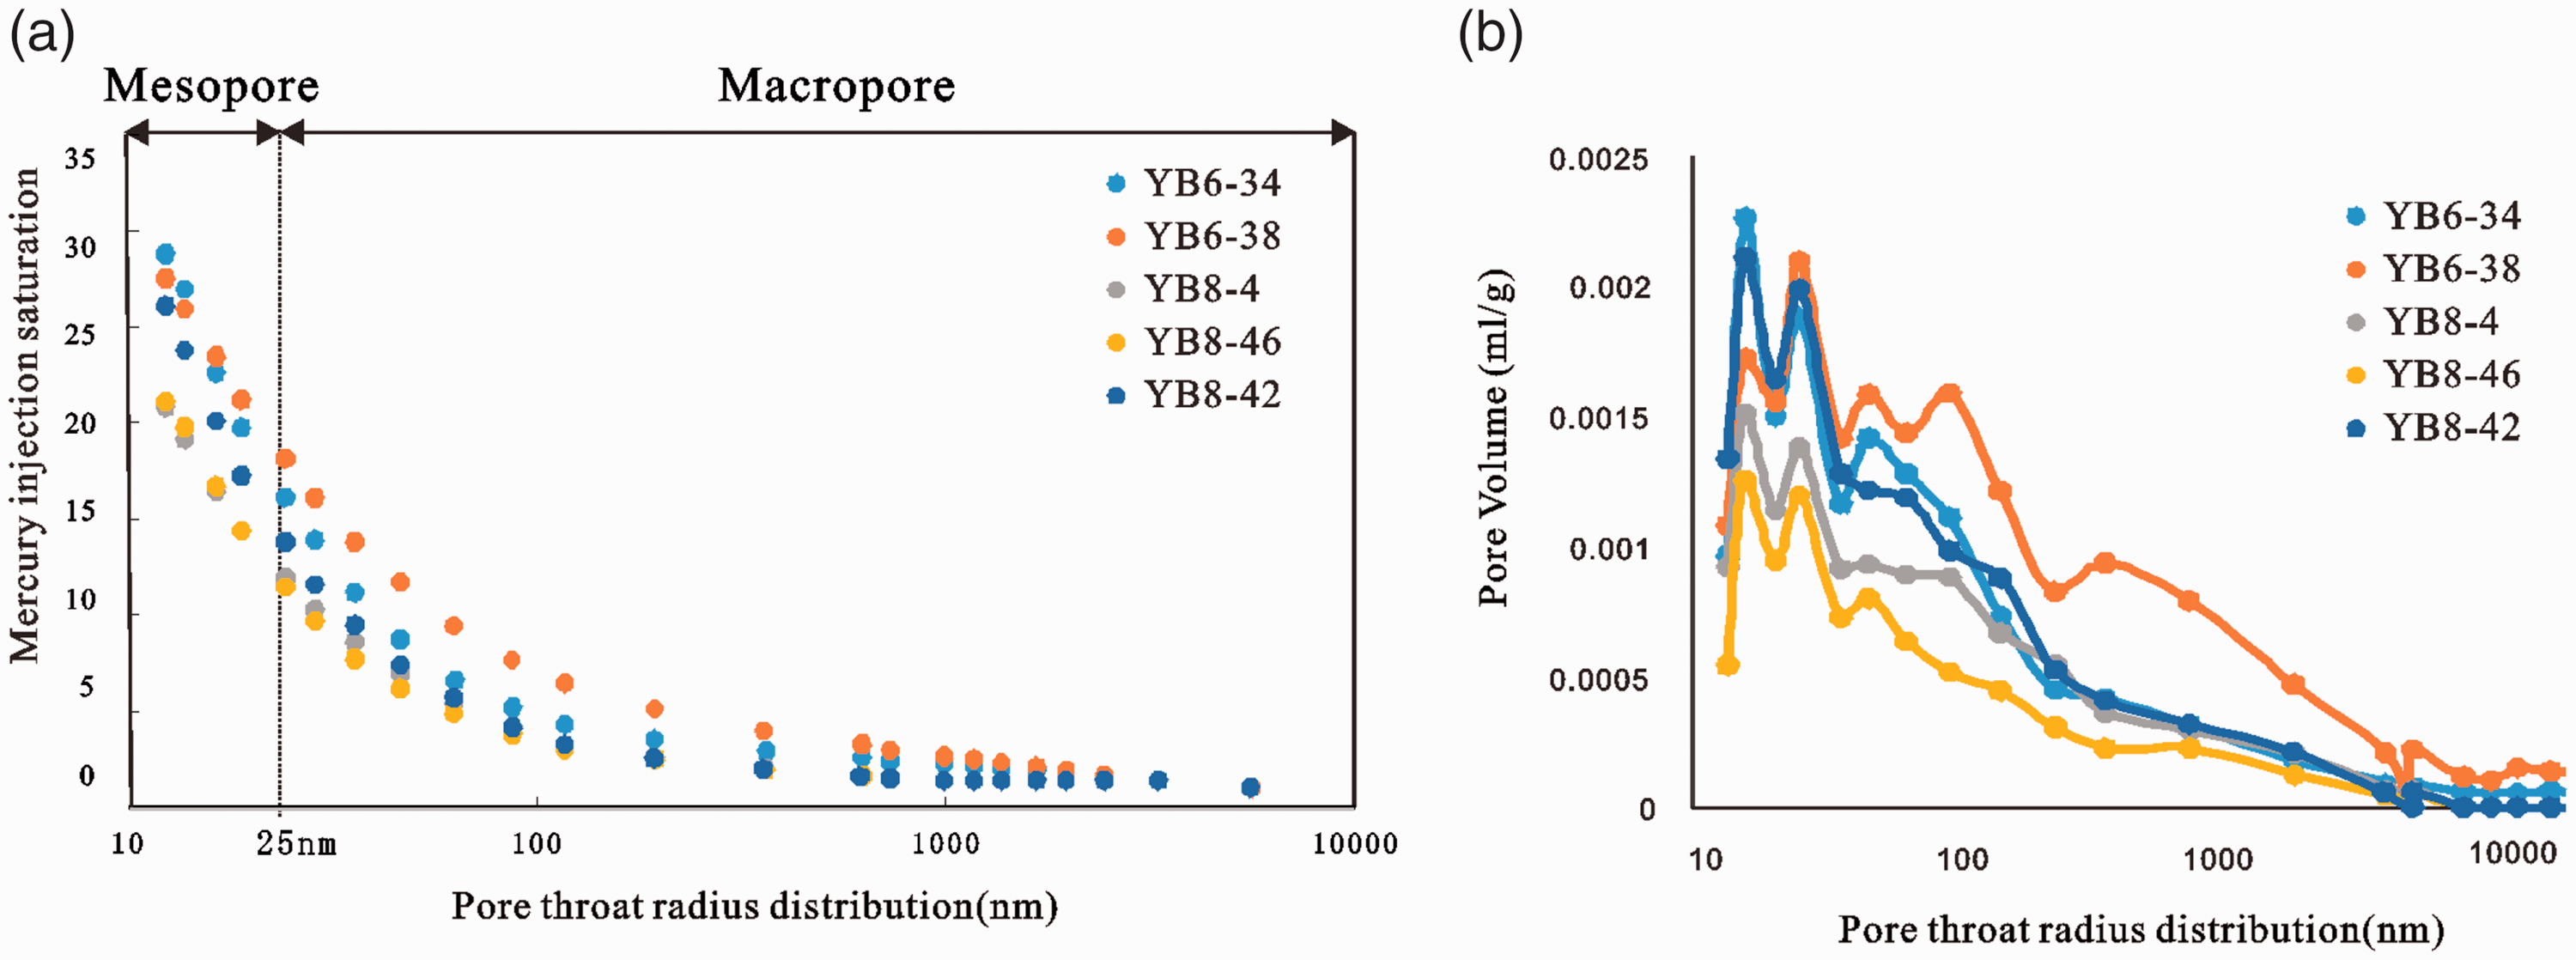
Mercury intrusion curves (a) and pore volume distributions as a function of pore size (b).
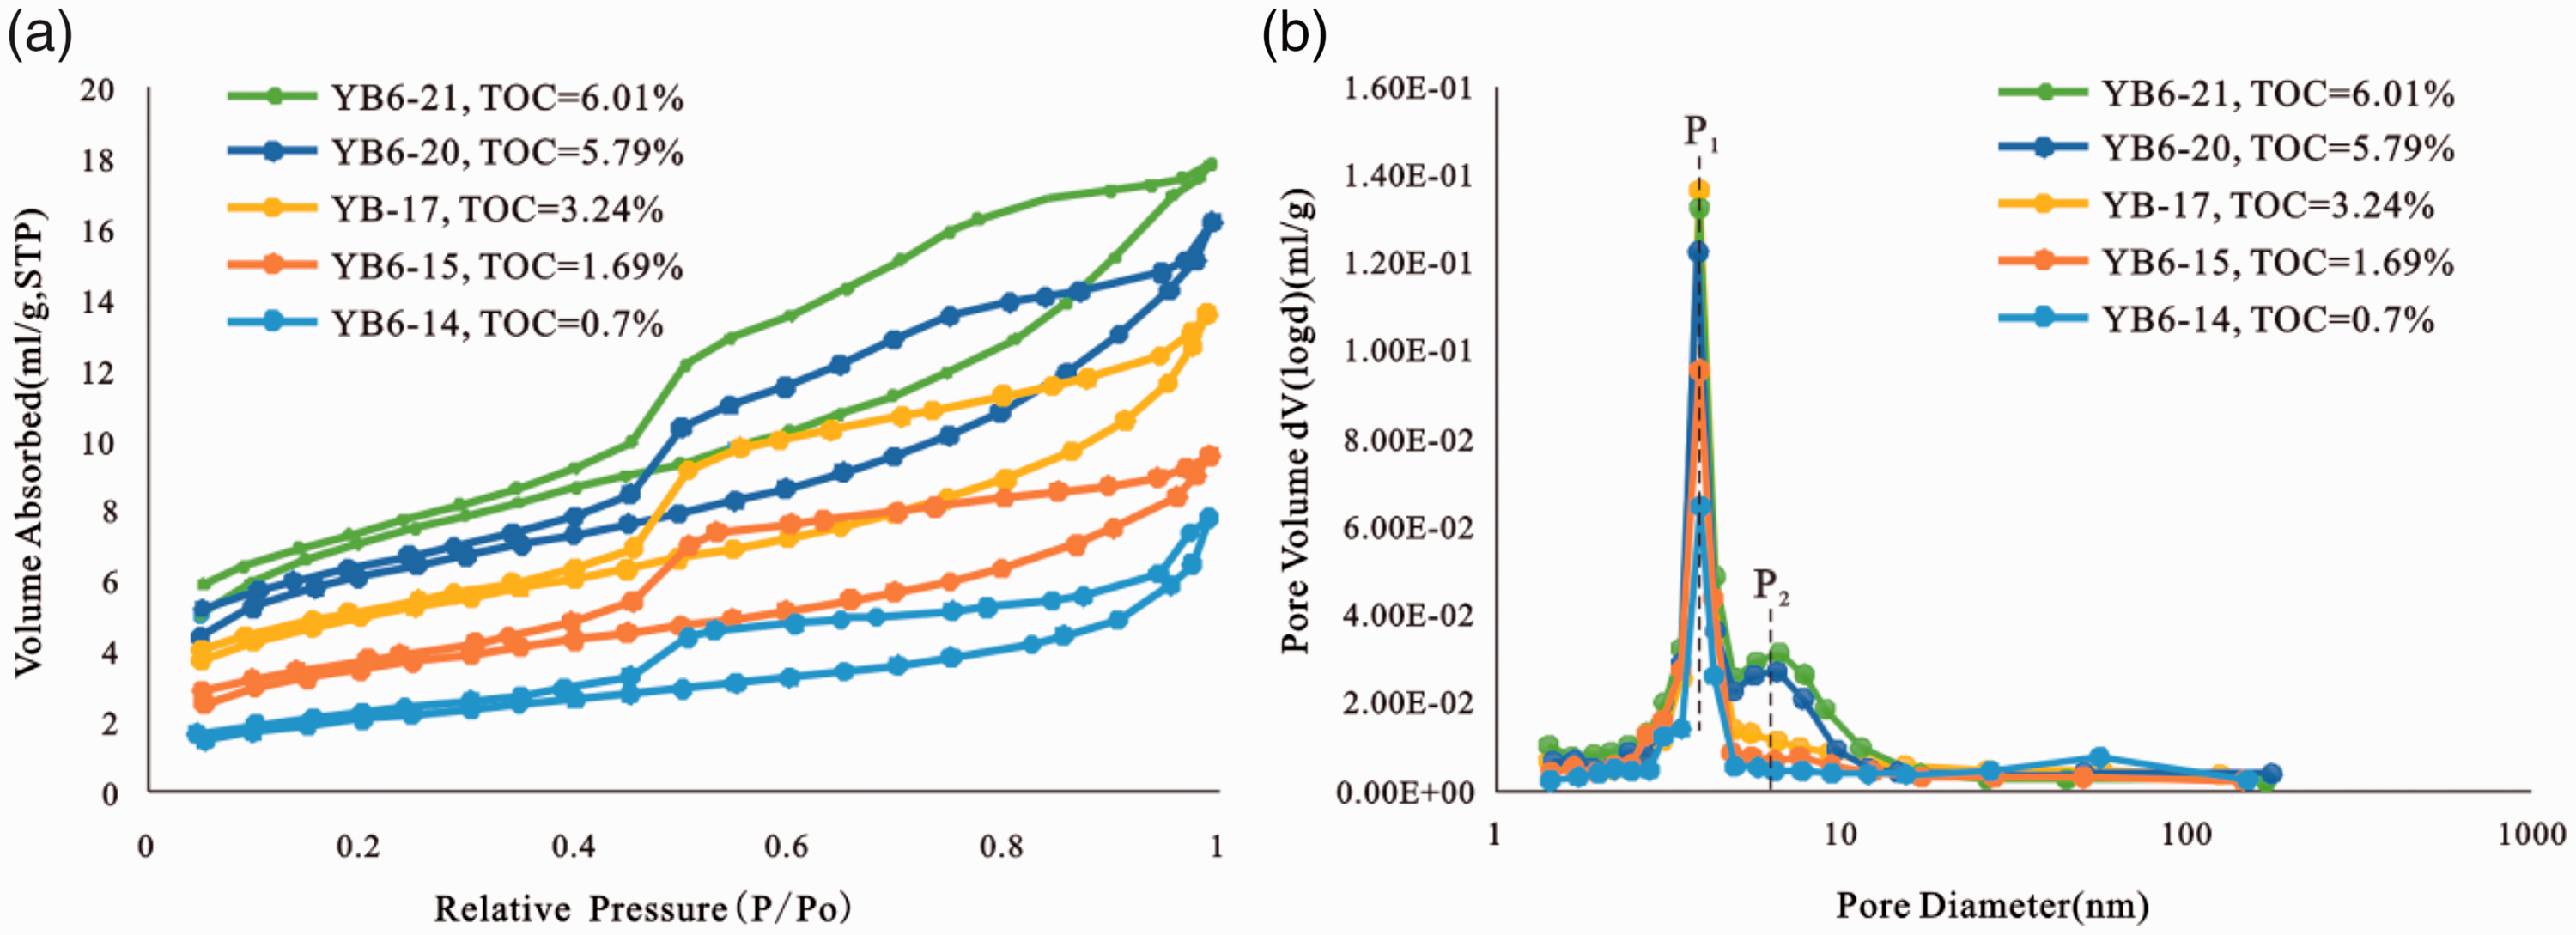
Nitrogen adsorption and desorption isotherms (a) and pore volume distributions as a function of pore size (b) for five representative core samples. TOC: total organic carbon.
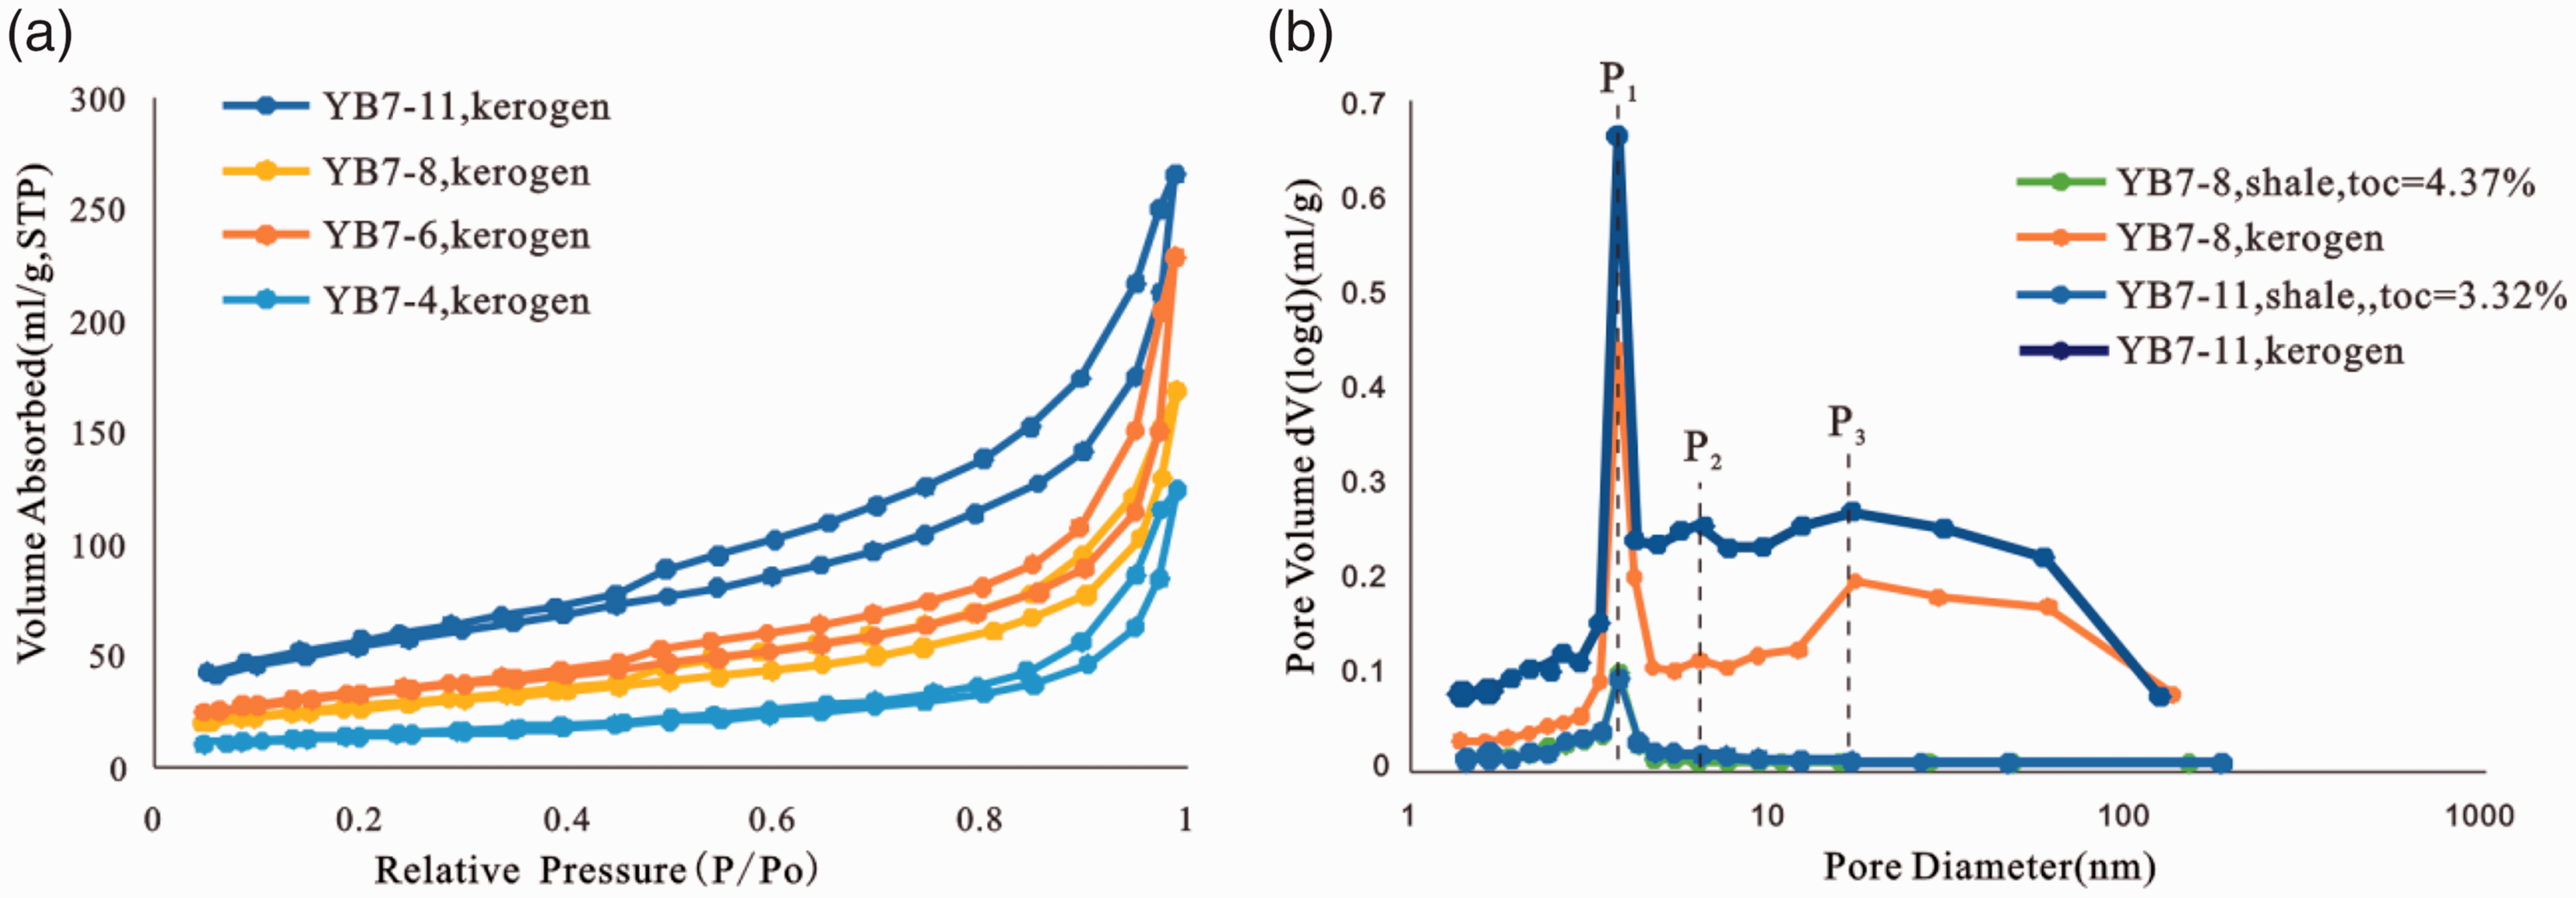
Nitrogen adsorption and desorption isotherms of the kerogen (a) and a comparison of PSDs for the shale and the kerogen (b).
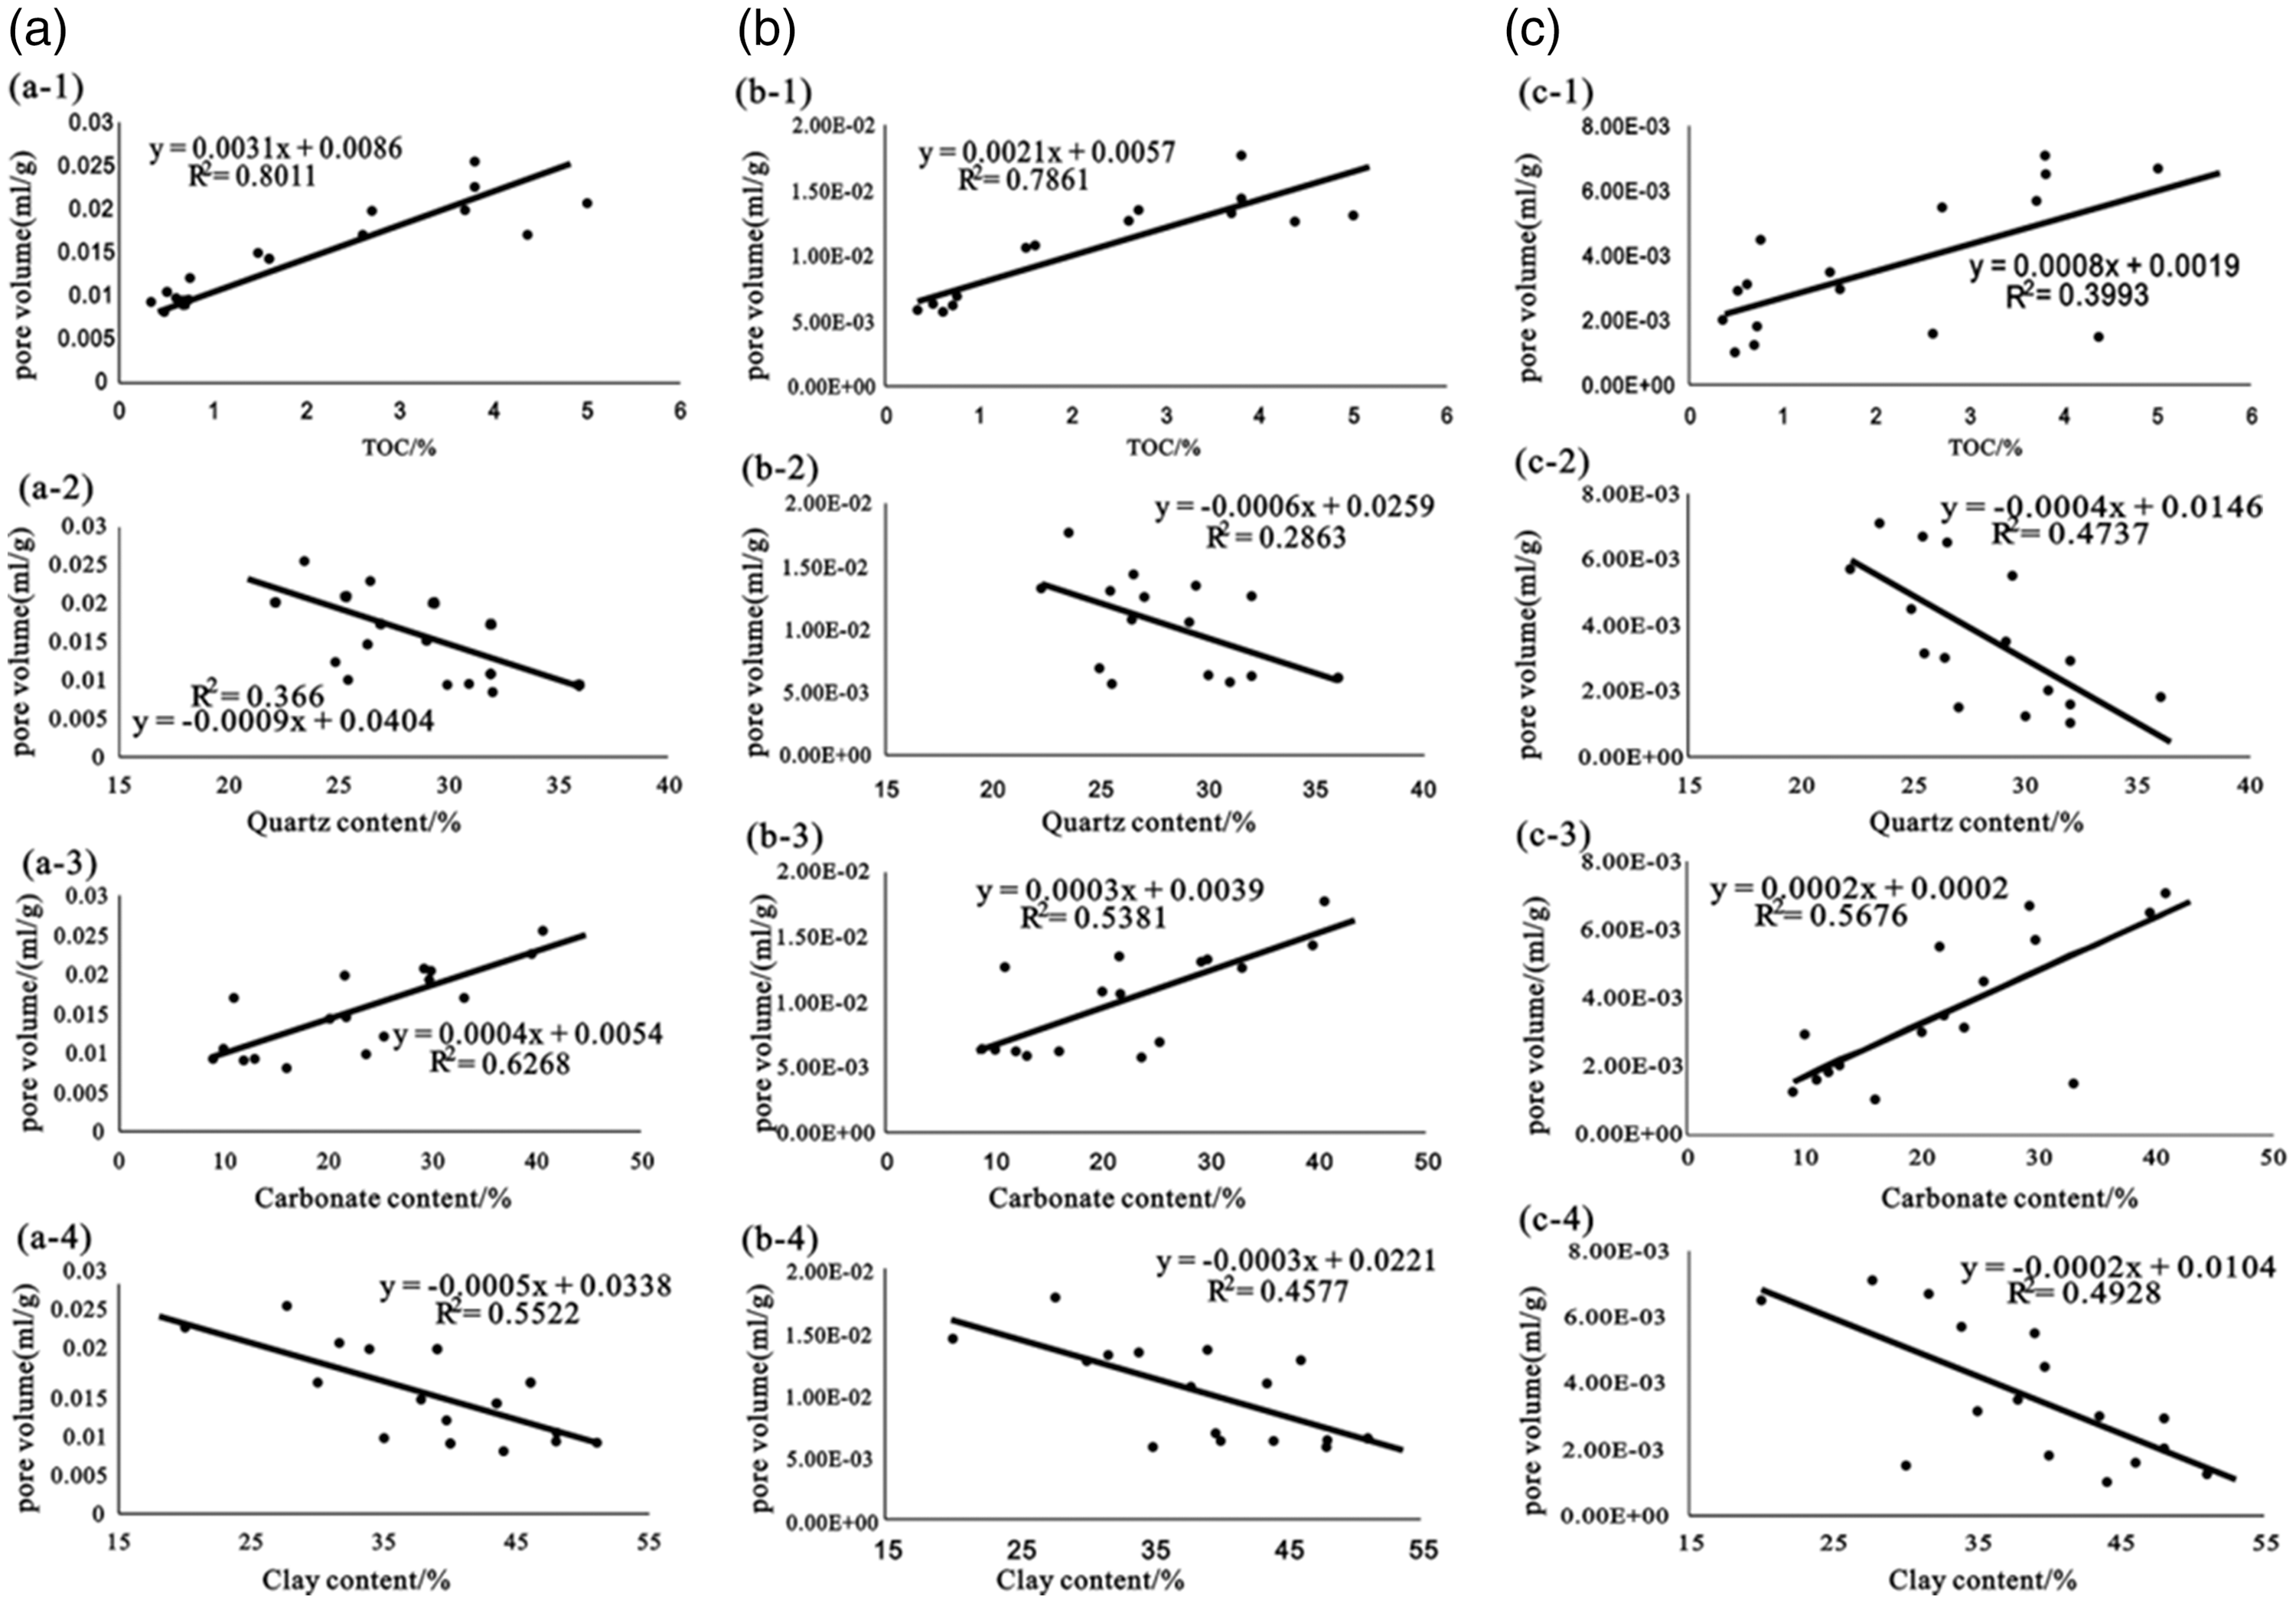
Relationship between shale composition and pore volumes, as obtained from nitrogen adsorption isotherm analyses. (a) Pore size < 50 nm, (b) pore size < 6.5 nm, and (c) 6.5<pore size < 50 nm. TOC: total organic carbon.
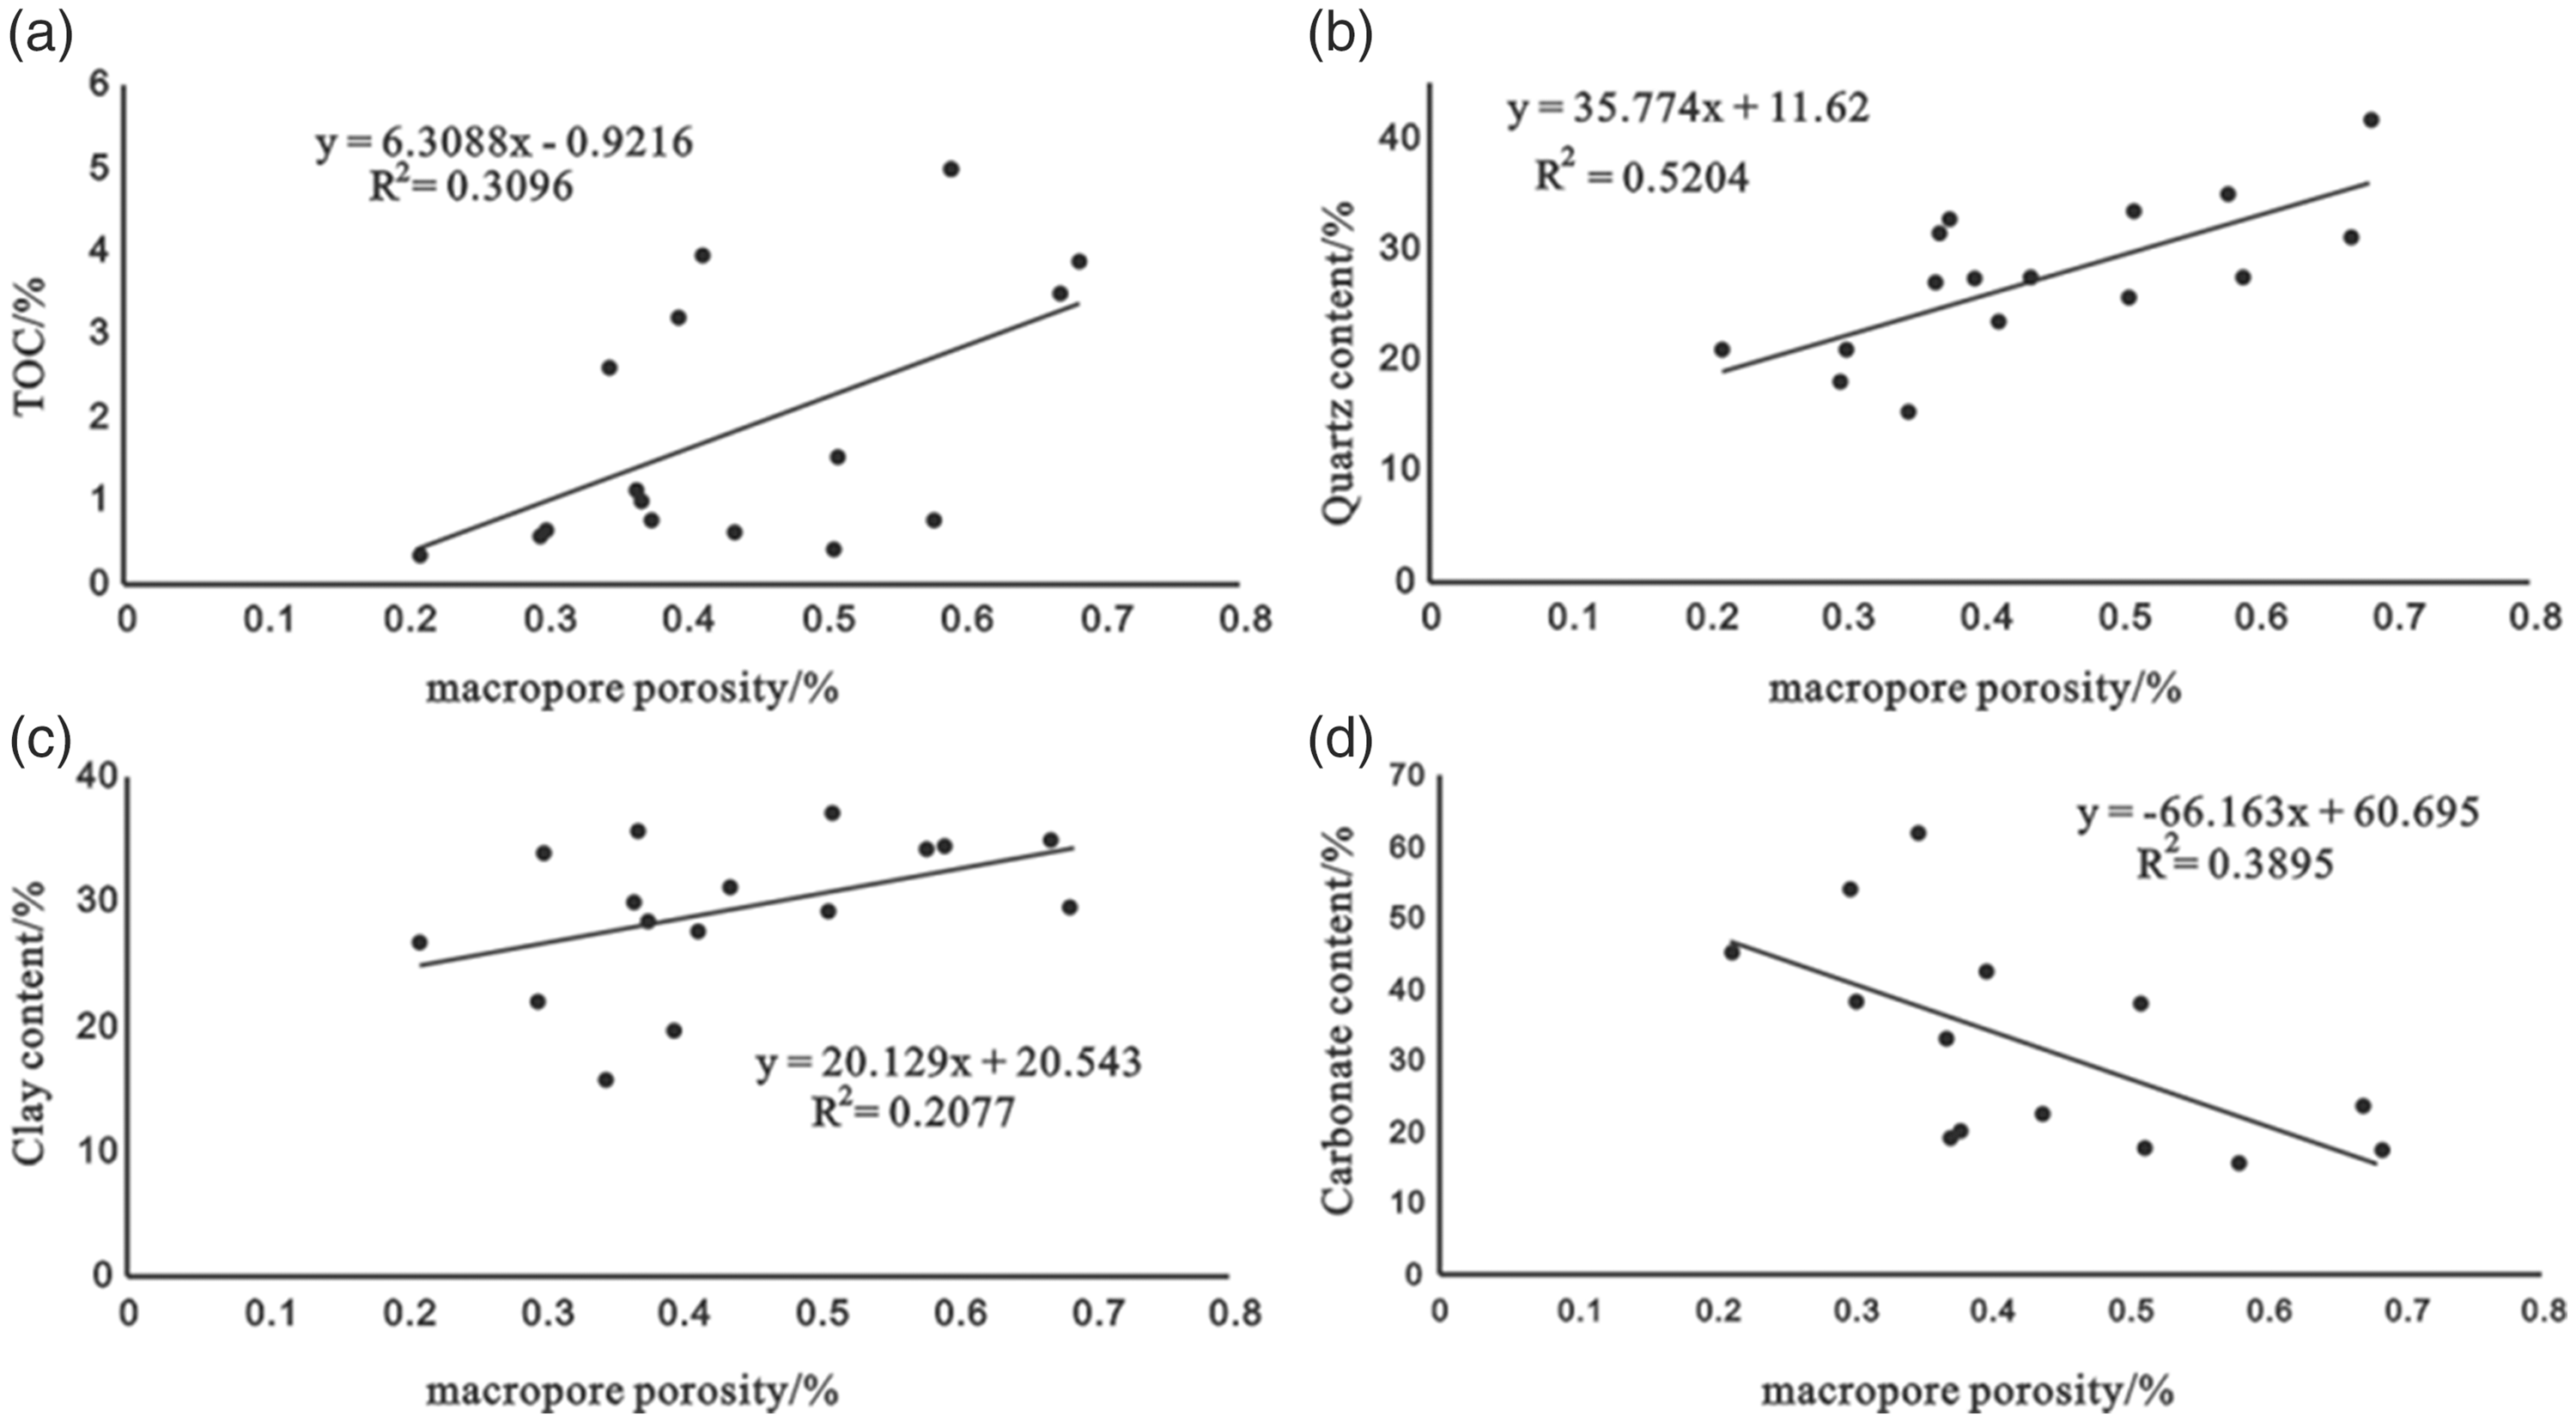
Relationship between shale composition and macropore porosity.
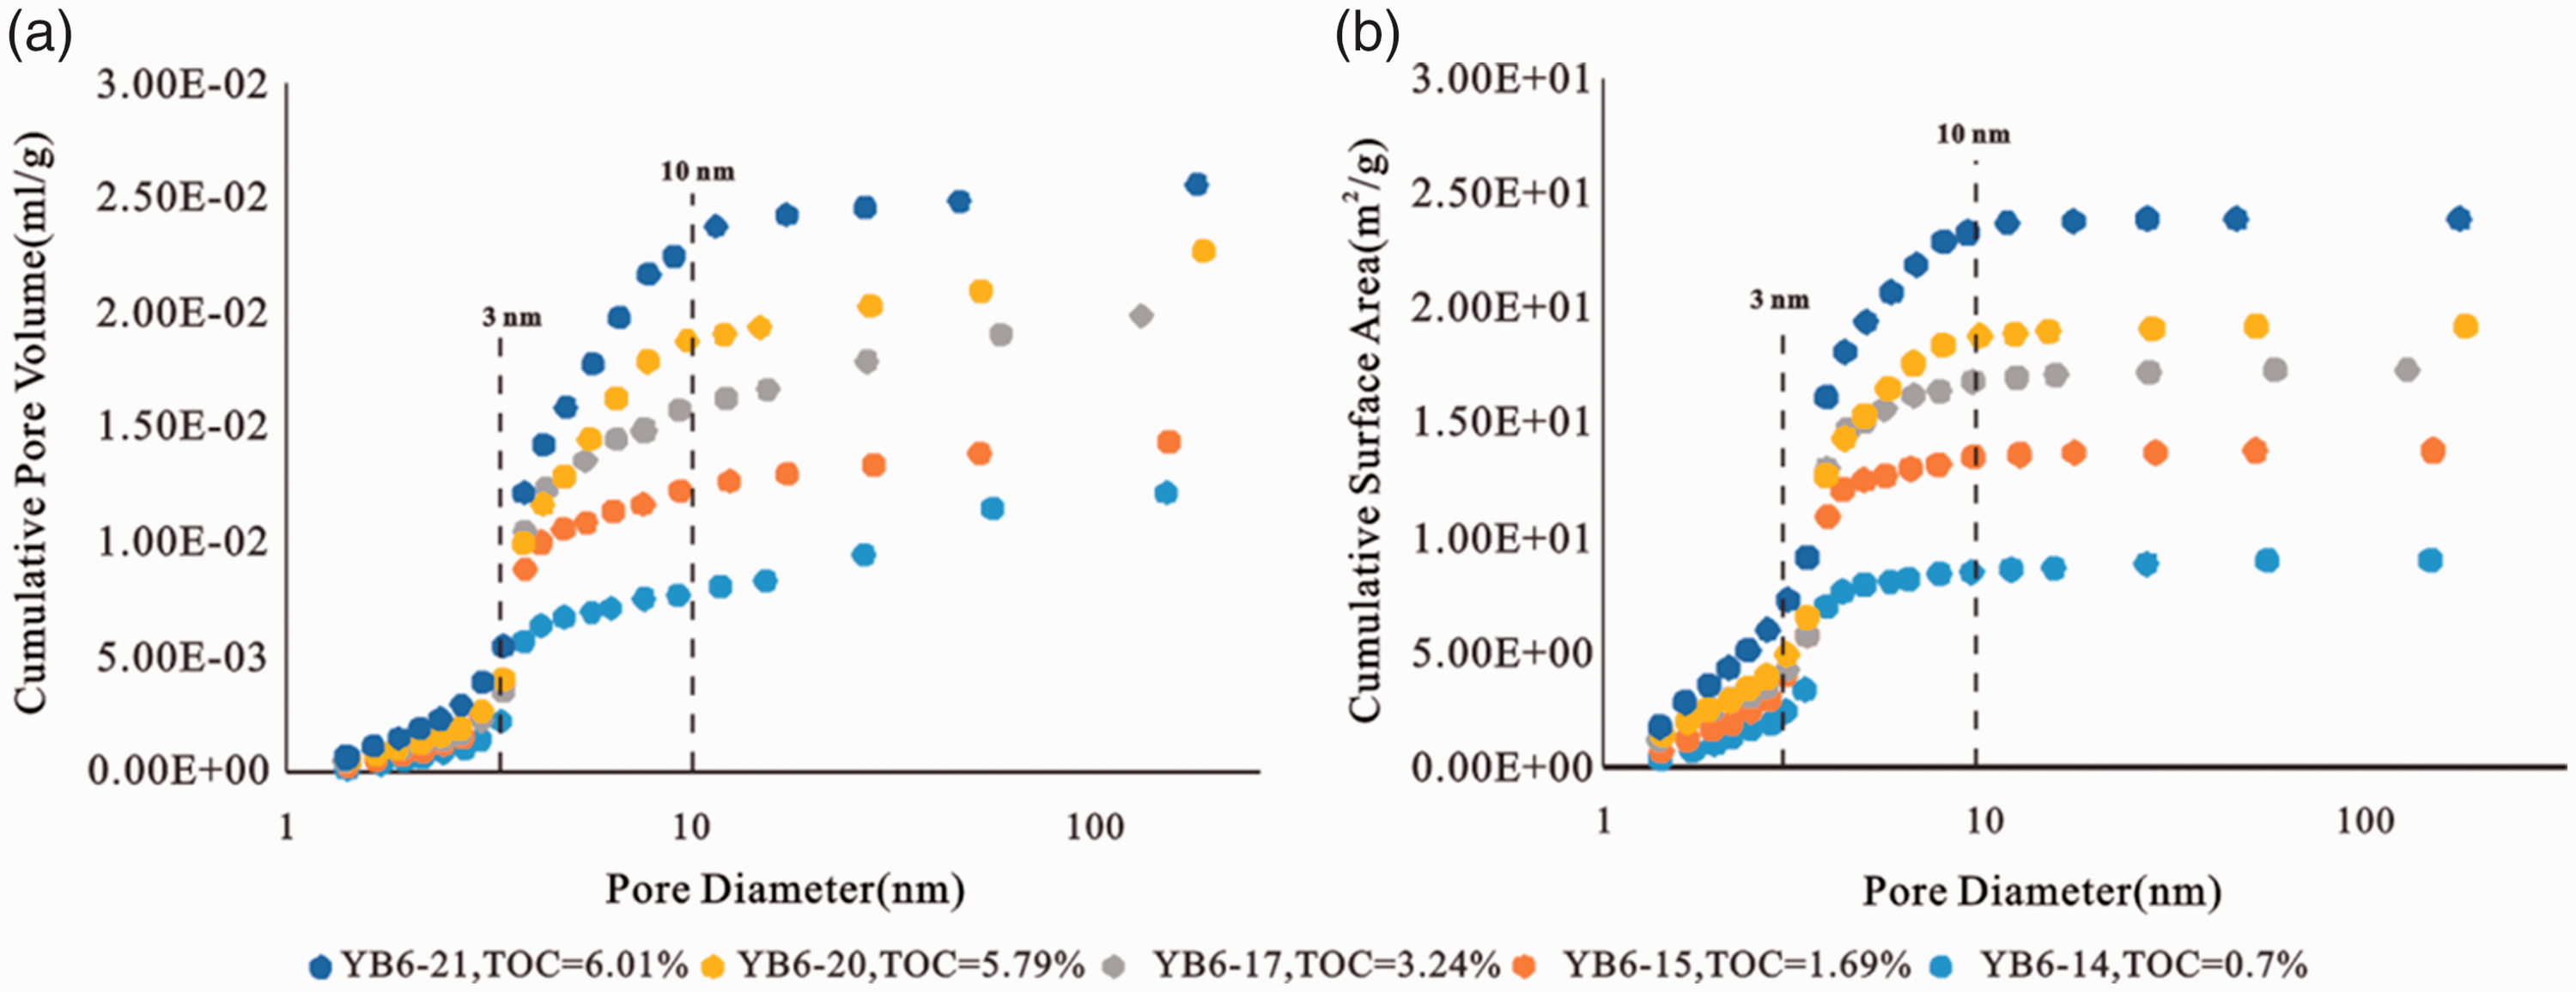
Cumulative pore volumes and surface areas of five representative core samples from the shales based on their nitrogen adsorption isotherms. TOC: total organic carbon.
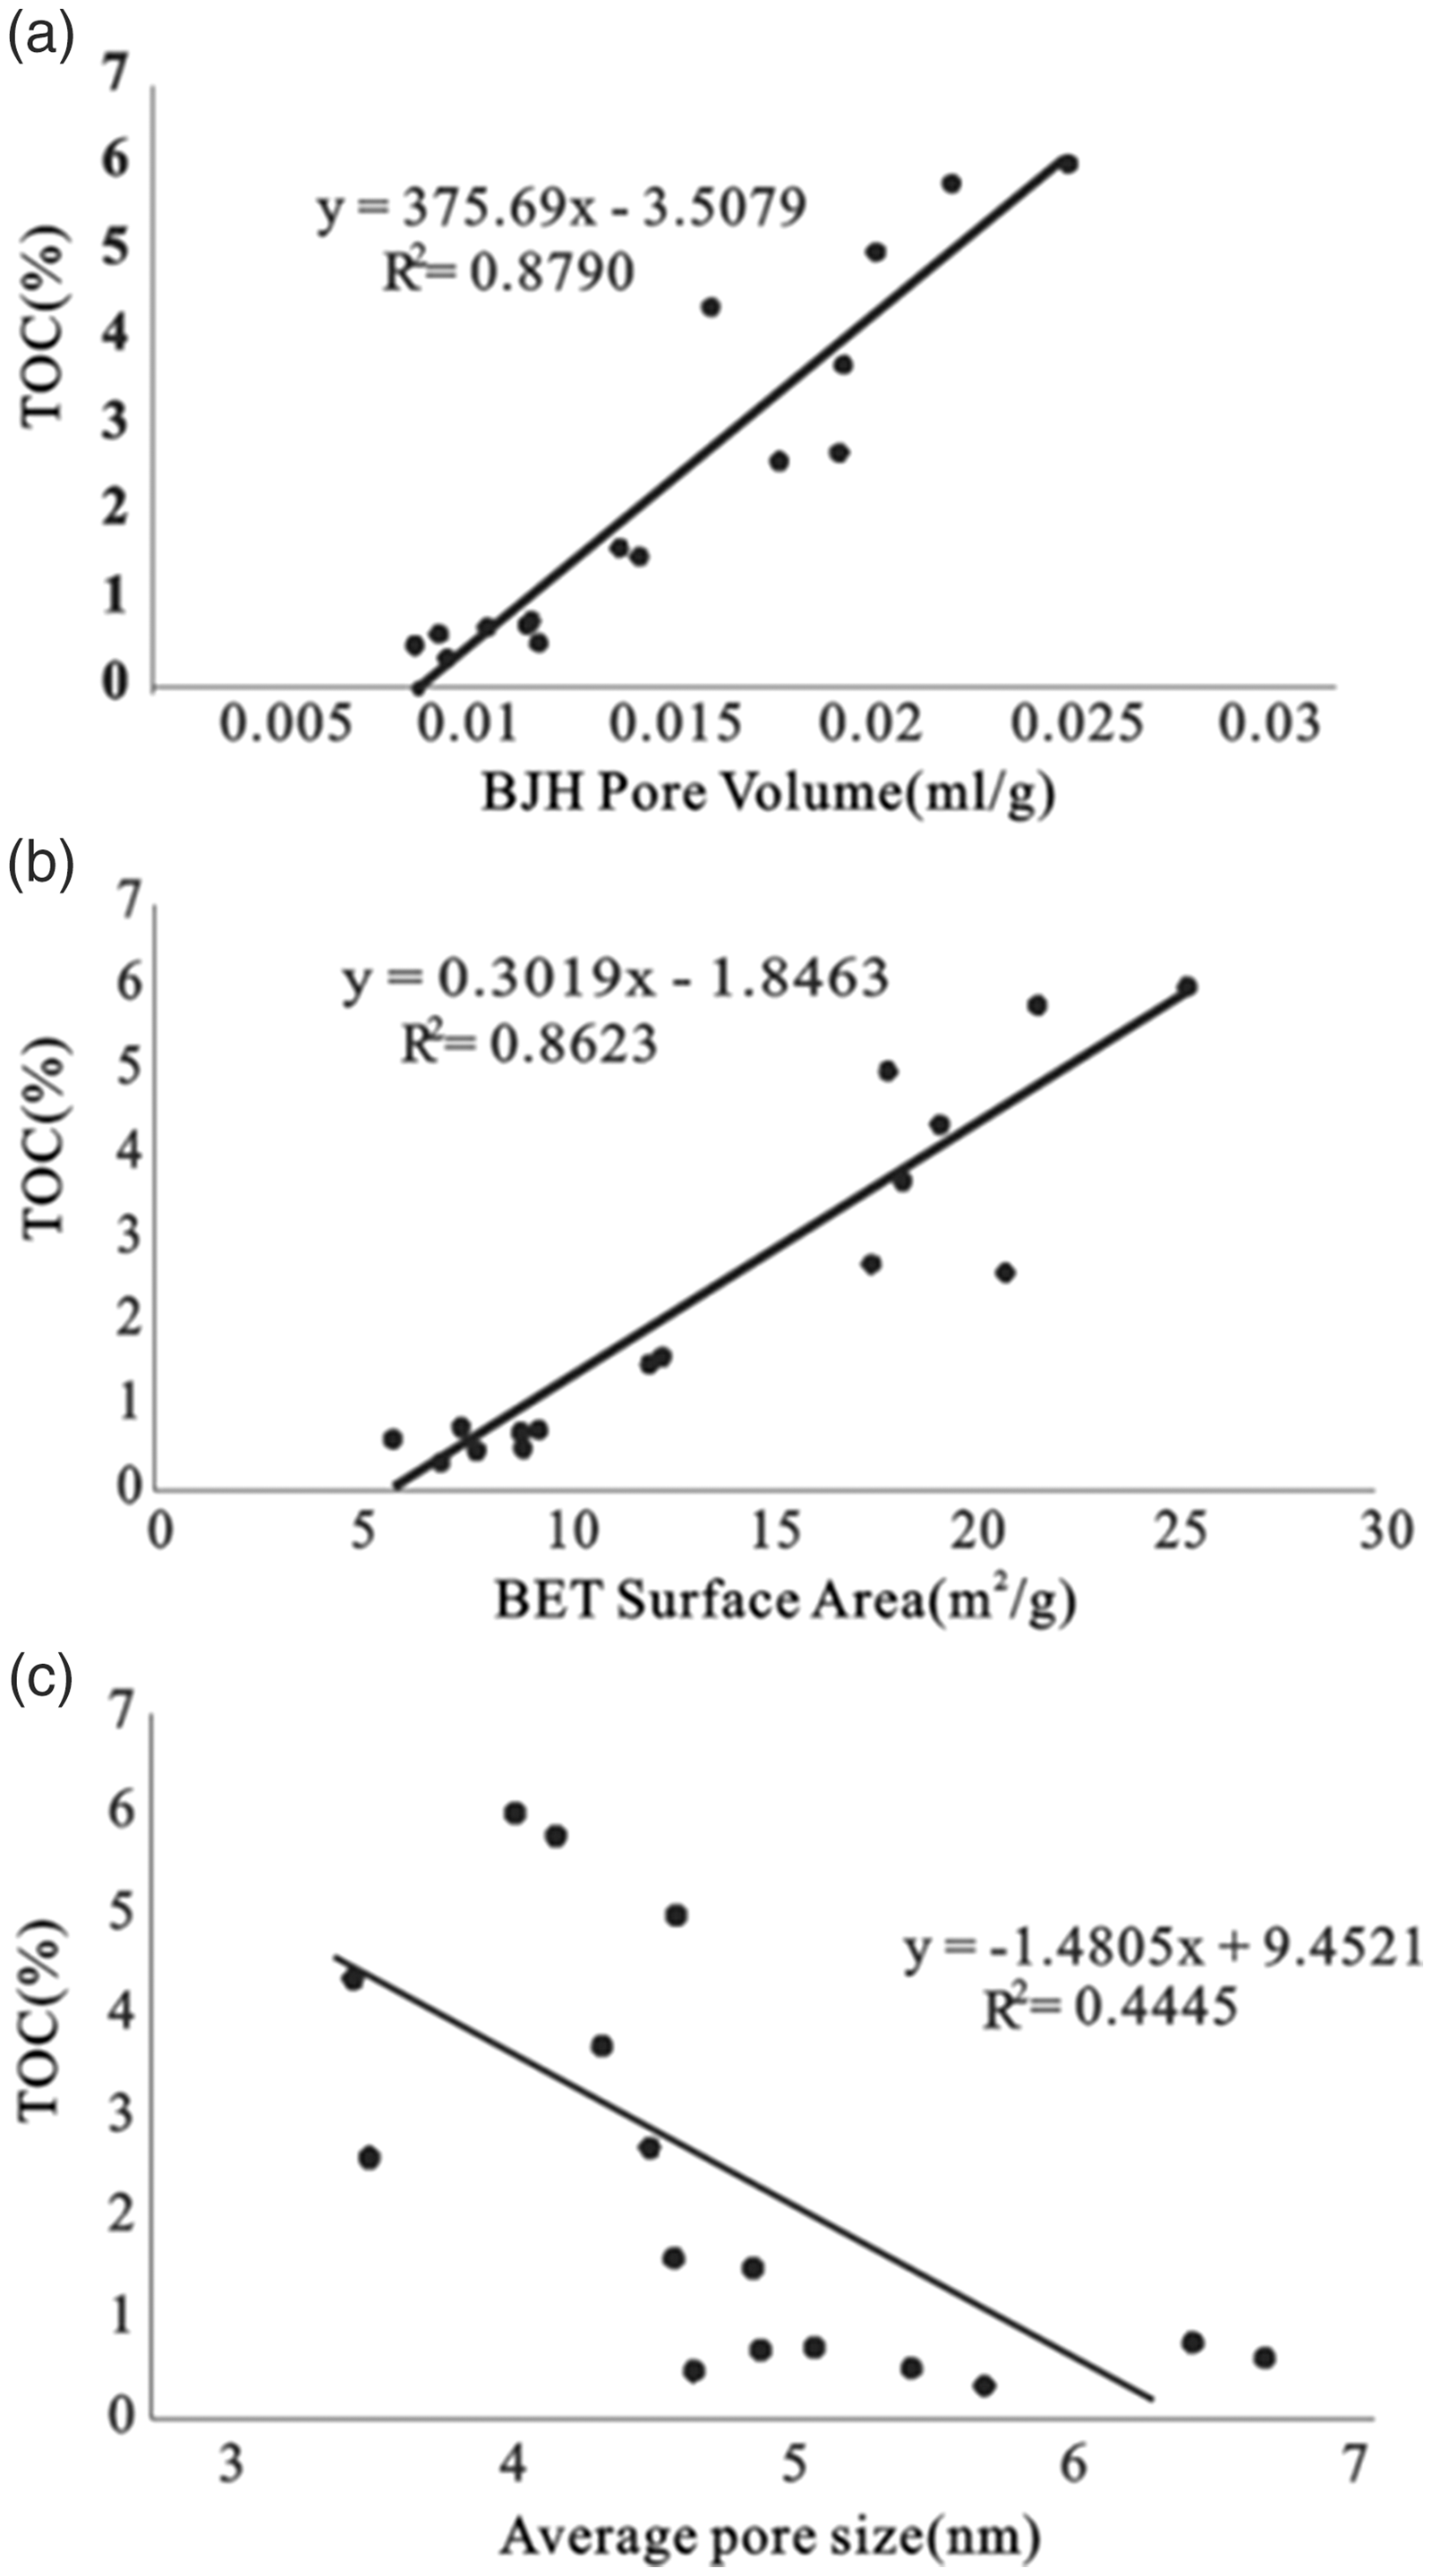
Correlation between TOC content and pore volume (a), surface area (b), and average pore size (c). TOC: total organic carbon.
Shale pores associated with carbonates
The SEM observations show that pores associated with carbonates include intraP pores and interP pores; the intraP pores are more common, and the interP pores were found only in a few dolomite-rich shale samples. Crossplots show that there is a positive correlation (Figure 7(a-3), (b-3), and (c-3)) between the volume of mesopores and carbonate content. In contrast, a negative relationship exists between macropore volume and carbonate content. We may safely conclude that the carbonate content tends to provide mesopores and block macropores in the black shales under study here. However, SEM observations by other researchers showed that intraP pores within carbonates range from 86 to 580 nm and are typically less than 100 nm in strongly matured shale (Chen et al., 2016). Possible reasons for this apparent discrepancy in findings are the high precision of nitrogen adsorption and the fact that smaller pores are commonly overlooked in SEM observations.
The nature of carbonate diagenesis in shale is still unclear. During late diagenesis, the carboxylic and phenolic acids that form during the thermal evolution of OM dissolve the carbonates and create pores (Klaver et al., 2012; Schieber, 2010). Moreover, fluid inclusions produced during crystallization may also lead to the formation of intraP pores. However, the dissolved Ca would precipitate without long-distance transport because of the low porosity and low permeability of shales during late diagenesis. Some researchers have suggested that clay minerals tend to inhibit carbonate precipitation (Baker et al., 1980). This result is consistent with a study of the Early Toarcian Posidonia Shale Formation that showed that pore-filling carbonate was relatively rare in the investigated shale samples (Mathia et al., 2016). However, Pommer and Milliken (2015) found that calcite occurs not only as a replacement for detrital grains but also as pore-filling cement, thus leading to a reduction in the primary pores of the Eagle Ford Formation. The negative correlation between macropore volume and carbonate content in the study area suggests that carbonate precipitation may still proceed at an uncertain rate during diagenesis and lead to the partial blocking of macropores.
However, it is unclear which factors can account for the positive correlation between the mesopore volume and the carbonate content as well as for the negative correlation between macropore volume and carbonate content. This phenomenon has been interpreted as the ‘pore size controlled solubility’ effect, i.e. a higher solubility would be required for precipitation in small pores because of the larger radius of curvature by the pore walls (Emmanuel and Ague, 2009; Emmanuel et al., 2010; Stack et al., 2014), which is consistent with the fact that cement prefers to precipitate in large rock pores rather than in nanopores (Emmanuel and Ague, 2009; Emmanuel et al., 2010; Putnis and Mauthe, 2001).
Shale pores associated with quartz
The positive correlation between macropore volume and quartz content shows that macropores are deeply influenced by the presence of quartz. The sizes of interP pores between the rigid minerals range from 100 nm to 3 µm in shallow buried deposits (Milliken et al., 2013) and range from 50 to 500 nm in high matured shale (Chen et al., 2016); this is well consistent with our result. Based on the SEM observations, quartz affects shale pores in two ways: first, some of the OM that contains abundant OM pores is commonly distributed among quartz grains (Figure 8(a) and (c)); second, residual original interP macropores are found around quartz grains (Figure 8(c) and (d)). Because the OM pores are mainly micro-mesopores, the second reason plays a major role.
During burial diagenesis, the smectite-to-illite transformation and the recrystallization of biogenic opal-A to opal-CT may release Si (Awwiller, 1993; Fan et al., 2017; Schieber, 2010), but the final sink of this Si is still unclear (Taylor and Macquaker, 2014). The quartz of the Wufeng and Longmaxi Formations consists of both detrital and authigenic quartz; the latter is dominant (Han et al., 2016; Zhao et al., 2017; Han et al., 2018). Petrologic and geochemical analyses show that the authigenic quartz mostly originates from the dissolution and reprecipitation of biogenic silica (Zhao et al., 2017). The progressive transformation from opal-A through opal-CT and opal-C to microcrystalline quartz is widely recognized in siliceous marine sediments. Isotopic evidence from the siliceous member of the Miocene Monterey Formation indicates that this transformation occurs at 17–21°C in an early diagenetic stage (Matheney and Knauth, 1993). Even though the development of authigenic microcrystalline quartz partly destroys interP porosity, partly primary pores still exist. During subsequent diagenesis, this authigenic quartz, together with detrital grains, resists compaction and preserves the pores left around itself. Therefore, authigenic quartz is also beneficial to the preservation of porosity, which is consistent with our finding of a positive correlation between quartz content and macroporosity.
No previous correlation was found between mesopores and quartz content by SEM analysis. Therefore, an increase in quartz content must be accompanied by a decrease in carbonate content, which provides the mesopores. This behaviour may explain the negative correlation between the mesopores and quartz content.
Conclusions
SEM, Ar ion milling, nitrogen adsorption, XRD, and mercury intrusion were used to determine the effects of shale composition on porosity and provide insights into shale diagenesis. The main conclusions are as follows.
The black shales of the Wufeng and Longmaxi Formations are mainly composed of quartz, clay, calcite, dolomite, and feldspar. OM pores, intraP pores, and interP pores have been identified. Correlation analyses together with SEM images confirm that OM provides almost all pores with sizes below 6.5 nm. Moreover, OM pores together with the intraP pores associated with carbonates comprise most of the mesopores (6.5–50 nm), and the interP pores associated with quartz comprise most of the macropores. The carbonate content increases with increasing mesopore volume and decreasing macropore volume. The former correlation is caused by the formation of mesopores by dissolution during hydrocarbon maturation; the latter correlation is caused by the destruction of macropores by the precipitation of carbonate cement during diagenesis. The ‘pore size controlled solubility’ effect causes dissolved calcium carbonate to tend to precipitate in relatively large macropores. The quartz content is positively correlated with macropore volume because authigenic quartz formed during early diagenesis, and detrital quartz is capable of preserving pores during later stages of diagenesis.
Footnotes
Declaration of conflicting interests
The author(s) declared no potential conflicts of interest with respect to the research, authorship, and/or publication of this article.
Funding
The author(s) disclosed receipt of the following financial support for the research, authorship, and/or publication of this article: This work was financially supported by National Natural Science Foundation of China (41702131, U1663201, and 51674156), Natural Science Foundation of Shandong province (ZR2017BD001), Taishan Scholar Talent Team Support Plan for Advantaged & Unique Discipline Areas, Major Scientific and Technological Innovation Projects of Shandong Province (2017CXGC1602 and 2017CXGC1603), SDUST Research Fund (2015TDJH101), and the Applied Research Projects Supported by Qingdao for Postdoctoral Researchers (2016127).