
Abstract
Over the past decades, CO2 flooding in low-permeability porous media has continued to grow. Furthermore, propelled by the current movement toward CO2 sequestration, the flooding of CO2 is expected to further increase. Thus, it is of scientific significance to study the mechanism of displacement of CO2 flooding as well as the CO2 storage characteristics. In this study, CO2 miscible/immiscible flooding experiments were conducted on two low permeability samples to study the difference between them. Specifically, the effect of oil displacement and CO2 storage coefficient for different displacement models were measured and compared. In addition, nuclear magnetic resonance (NMR) tests and frozen pelleting experiments were conducted. The NMR tests clarified the lower limit of pore throat where oil can be displaced by CO2 miscible/immiscible flooding. Furthermore, the frozen pelleting experiments analyzed the distribution characteristics of the remaining oil before and after CO2 miscible/immiscible flooding. The investigation showed that the development efficiency of CO2 miscible flooding is higher than CO2 immiscible flooding in low permeability reservoirs. The results also indicated that CO2 miscible flooding increases the recovery of hard-to-produce semi-bound oil phase and CO2 storage coefficient with CO2 miscible displacement is more significant than that with CO2 immiscible flooding. The data from this study is a critical input for reservoir simulation, which sheds light on the CO2 miscible/immiscible flooding in low permeability reservoirs.
Introduction
As a fluid injected into oil reservoirs, especially unconventional reservoirs (tight sandstone, tight carbonate, and shale), carbon dioxide (CO2) has been widely applied around the world, and CO2 miscible/immiscible flooding has been proven to be an effective enhanced oil recovery (EOR) method (Abdassah and Kristanto, 2000; Dyer and Farouq, 1989; Khatib et al., 1981; Zhou et al., 2020). The main mechanisms of CO2-EOR include that CO2 could dissolve easily into the crude oil, swell the oil, reduce oil viscosity and density, and extract the light components of crude oil at moderate pressure (Al-Otaibi et al., 2015, 2019; Zhou et al., 2020). As stated by Alotaibi et al. (2019), there were more than 50 CO2-EOR projects in the United States with oil production about 300,000 bbl/d. Therefore, it is of scientific, theoretical, and environmental significance to study the displacement mechanism of CO2 flooding as well as the characteristics of CO2 storage.
CO2-EOR can be classified as CO2 miscible flooding (Koottungal, 2014; Zhou et al., 2020) and immiscible flooding (Dyer and Farouq, 1989; Mohammed and Singhal, 2005; Yellig and Metcalfe, 1980). Koottungal (2014) suggested that, compared to other EOR methods in the United States, CO2 miscible flooding has provided the highest daily production since 2012. Zhang et al. (2018) concluded that under reservoir conditions, CO2 miscibility flooding could not be always achievable and CO2 immiscible flooding would be implemented due to technical difficulties or commercial considerations. Furthermore, they also pointed out that CO2 immiscible flooding has been successfully implemented throughout the world although the CO2 immiscible displacement was less sufficient than CO2 miscible displacement. For example, as stated by Dyer and Farouq (1989), CO2 immiscible flooding was first conducted in Bartlesville, Oklahoma, in 1958. Therefore, to better understand the mechanism of CO2 flooding, relevant researches are needed.
Nuclear magnetic resonance (NMR) technique has been successfully used to characterize rock pore structure by measuring the signal intensity of hydrogen atoms in pore spaces. Compared with conventional methods, nuclear magnetic resonance (NMR) techniques can determine the pore size distribution more accurately without damaging the sample (Hosseini et al., 2018; Liu et al., 2020). For instance, NMR was used to study the pore size distribution in tight sandstones (Wang et al., 2001). Nuclear magnetic resonance techniques can also be used to assess the porosity of mobile fluids in a reservoir (Wang et al., 1998, 2001). NMR is widely used for studying CO2 flooding recently. Sun et al. (2016) carried out investigation of CO2 and water exchange in coal. Cai et al. (2021) used NMR method to investigate CO2 displacement for low permeability core in both miscible and immiscible flooding, Zhang et al. (2022) used online low-field NMR to study CO2 flooding and water flooding mechanism in ultralow-permeability sample, and the in situ stress effect on oil recovery.
Fluorescence is a phenomenon of luminescence produced by a substance subjected to laser radiation. When a molecule of matter is exposed to a special light source and absorbs a photon, the electron in the ground state is excited to jump. If energy is released by emitting the corresponding photons and returning to the ground state, fluorescence is emitted (Kaoping et al., 2004). The fluorescence methods described here are straightforward and affordable to apply and can be carried out using a basic steady-state fluorescence spectrometer (Sommer et al., 2015). This method is widely used in chemistry, medicine, and biology (Gibson et al., 2016; Miller, 2019; Sommer et al., 2015). Fluorescence analysis was also used to study the remaining oil distribution after polymer flooding (Kaoping et al., 2004; Li, 2004; Xilong, 2022). Fluorescence analysis application in CO2 flooding is rarely reported.
In this study, CO2 miscible/immiscible flooding experiments were, respectively, conducted on two low permeability samples. In addition, nuclear magnetic resonance (NMR) tests and frozen pelleting experiments were conducted to better understand the displacement efficiency and CO2 storage effect by CO2 flooding. The remainder of the article is organized as follows: “Methodology” describes the details about core samples and the process of various experiments process used in this study. “Results” presents the results and discussions of CO2 flooding, NMR tests, and Frozen pelleting experiments. Finally, “Conclusions” concludes the main finding of the study.
Methodology
Core samples and experimental fluids
In this study, two core plugs were sampled from a low permeability formation, named Chang 8, located in Block Zhuang 46 in Changqing Oilfield, Ordos Basin. Routine core analysis was carried out to determine the length, diameter, core dry weight, total core volume, pore volume, porosity, and gas permeability of each core plug. Table 1 summarizes the basic physical properties (dimension and routine data) of these two samples. It should be noted that both samples were scanned to ensure that there were no fracture and permeability barriers in these two samples before the experiments. As a result, it is reasonable, to some extent, to consider these two samples to be homogeneous. Furthermore, each core sample (FY-1 or FY-2) was divided into different parts for CO2 flooding, frozen pelleting, and NMR experiments. Because the divided parts were from the same homogeneous core sample, it was assumed that they had the same pore structure. Furthermore, kerosene and CO2 were used as the oil phase and the gas phase, respectively. The formation water, whose components were listed in Table 2, was used as the water phase.
Properties of the core plugs used in the experiments.
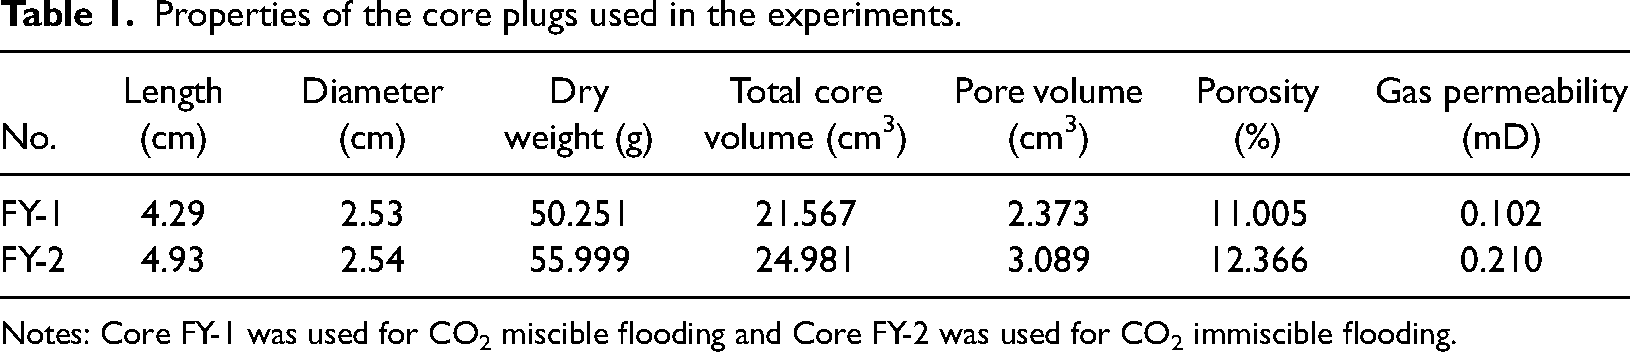
Notes: Core FY-1 was used for CO2 miscible flooding and Core FY-2 was used for CO2 immiscible flooding.
Composition of the formation water.
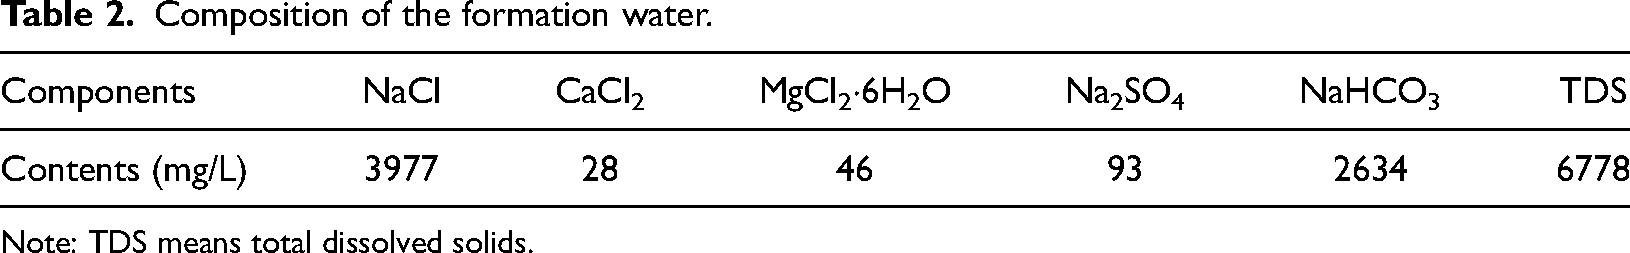
Note: TDS means total dissolved solids.
Experimental procedures
CO2 flooding
The CO2 miscible/immiscible flooding experiments on the low permeability core were carried out in the high-pressure and high-temperature (HPHT) displacement experiment device to determine the efficiency of CO2 miscible/immiscible flooding and the corresponding storage coefficient. The minimum miscibility pressure between CO2 and oil is 22 MPa in this study. The back pressure and temperature during the miscible flooding were 25 MPa and 70°C, respectively. However, as a comparison, during the immiscible flooding, the back pressure and temperature were 15.5 MPa and 70°C, respectively. The injection of CO2 is in the supercritical phase. In addition, the injection rate was 0.01 mL/min. As shown in Table 1, Core FY-1 was used for the CO2 miscible flooding experiment and Core FY-2 was used for the CO2 immiscible flooding experiment. It is well known that quantitative characterization of the micro occurrence state of fluids can be realized through laser confocal series detection. Thus, to illustrate the results of CO2 flooding, the distribution of oil phase before and after CO2 miscible/immiscible flooding in these two cores were characterized through the frozen pelleting experiments. The detailed procedures for CO2 flooding experiments could be summarized as follows:
Wash the oil in the cores using the weight balance method and dry the cores, and the criterion for qualified oil is that the core sample reaches Level 3 under fluorescent light. Place the core samples (FY-1 and FY-2) into the core holder, and maintain the confining pressure of the sample at 3 MPa by using a hand pump. Vacuum the core samples for 24 h by using a vacuum pump. Inject the simulated formation water into the cores and record the pressure. When the pressure gauge reading was kept at 0.5 MPa, terminate the water injection process. Kerosene was injected into the core samples at a rate of 0.005 mL/min until no water was produced at the outlet of the device. Measure the volume of water and determine the irreducible water saturation. Place the core holder in a thermostat for 24 h, take out the cores (FY-1 and FY-2) and cut the cores end of about 1.5 cm to prepare the frozen thin slices, then carry out the CO2 miscible/immiscible flooding experiments on the remaining cores at a constant rate of 0.01 mL/min. After the CO2 miscible/immiscible flooding experiments, cut the core end by about 1.5 cm to prepare the frozen slices. Use the laser confocal cryopreservation technology to analyze the microscopic occurrence of fluids and the remaining oil distribution after CO2 miscible/immiscible flooding in the two cores. Record the oil and gas output at the outlet at an interval (about 1 h), and terminate the experiment when no oil is observed at the outlet. Finally, determine the CO2 storage coefficient by using the following equation:

where Me is the CO2 effective storage volume in the core, g; N is the oil in place in the core sample, g; Rs is the CO2 storage coefficient, g/g; Vzg is the cumulative volume of CO2 injected, ml; Vcg is the cumulative volume of CO2 produced, ml; ρg is the CO2 density, g/cm3; ρo is the oil density, g/cm3; and Vo is the saturated oil volume, ml.
NMR experiments
To further explain the results of CO2 flooding, the NMR relaxation time T2 tests were carried out with the high frequency (23 MHz) NMR instrument in the study. The specific procedures were as follows:
Weigh the dry core samples and measure the length and diameter. Then, pressurize and saturate the dry core samples with the simulated formation water and weigh the core wet weight. For core samples saturated with water, perform an NMR T2 spectrum measurement. Conduct centrifugal experiments on rock samples under 500 psi for 3 h, then measure the T2 spectrum of the centrifuged cores with NMR measurement. Dry the centrifuged core, inject kerosene into the cores, and weigh the core saturated with kerosene. Then, measure T2 spectrum of the cores saturated with kerosene. Carry out CO2 flooding experiments on cores saturated with kerosene, and measure the T2 spectrum of the cores after CO2 displacement.
For a given core sample, since the T2 spectrum measured by NMR reflects the number of hydrogen atoms in the pore space, it is proportional to the pore radius (Fang et al., 2018; Li et al., 2020; Xiao et al., 2016). T2 spectrum is a function of surface relaxation and the ratio of pore volume Vp to surface area Sp (Gao et al., 2019; Gao and Li, 2015; Saidian and Prasad, 2015; Xiao et al., 2016). Thus, one has the following equation: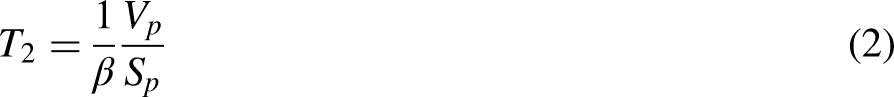

Figure 1 is the flow chart of the experimental equipment.
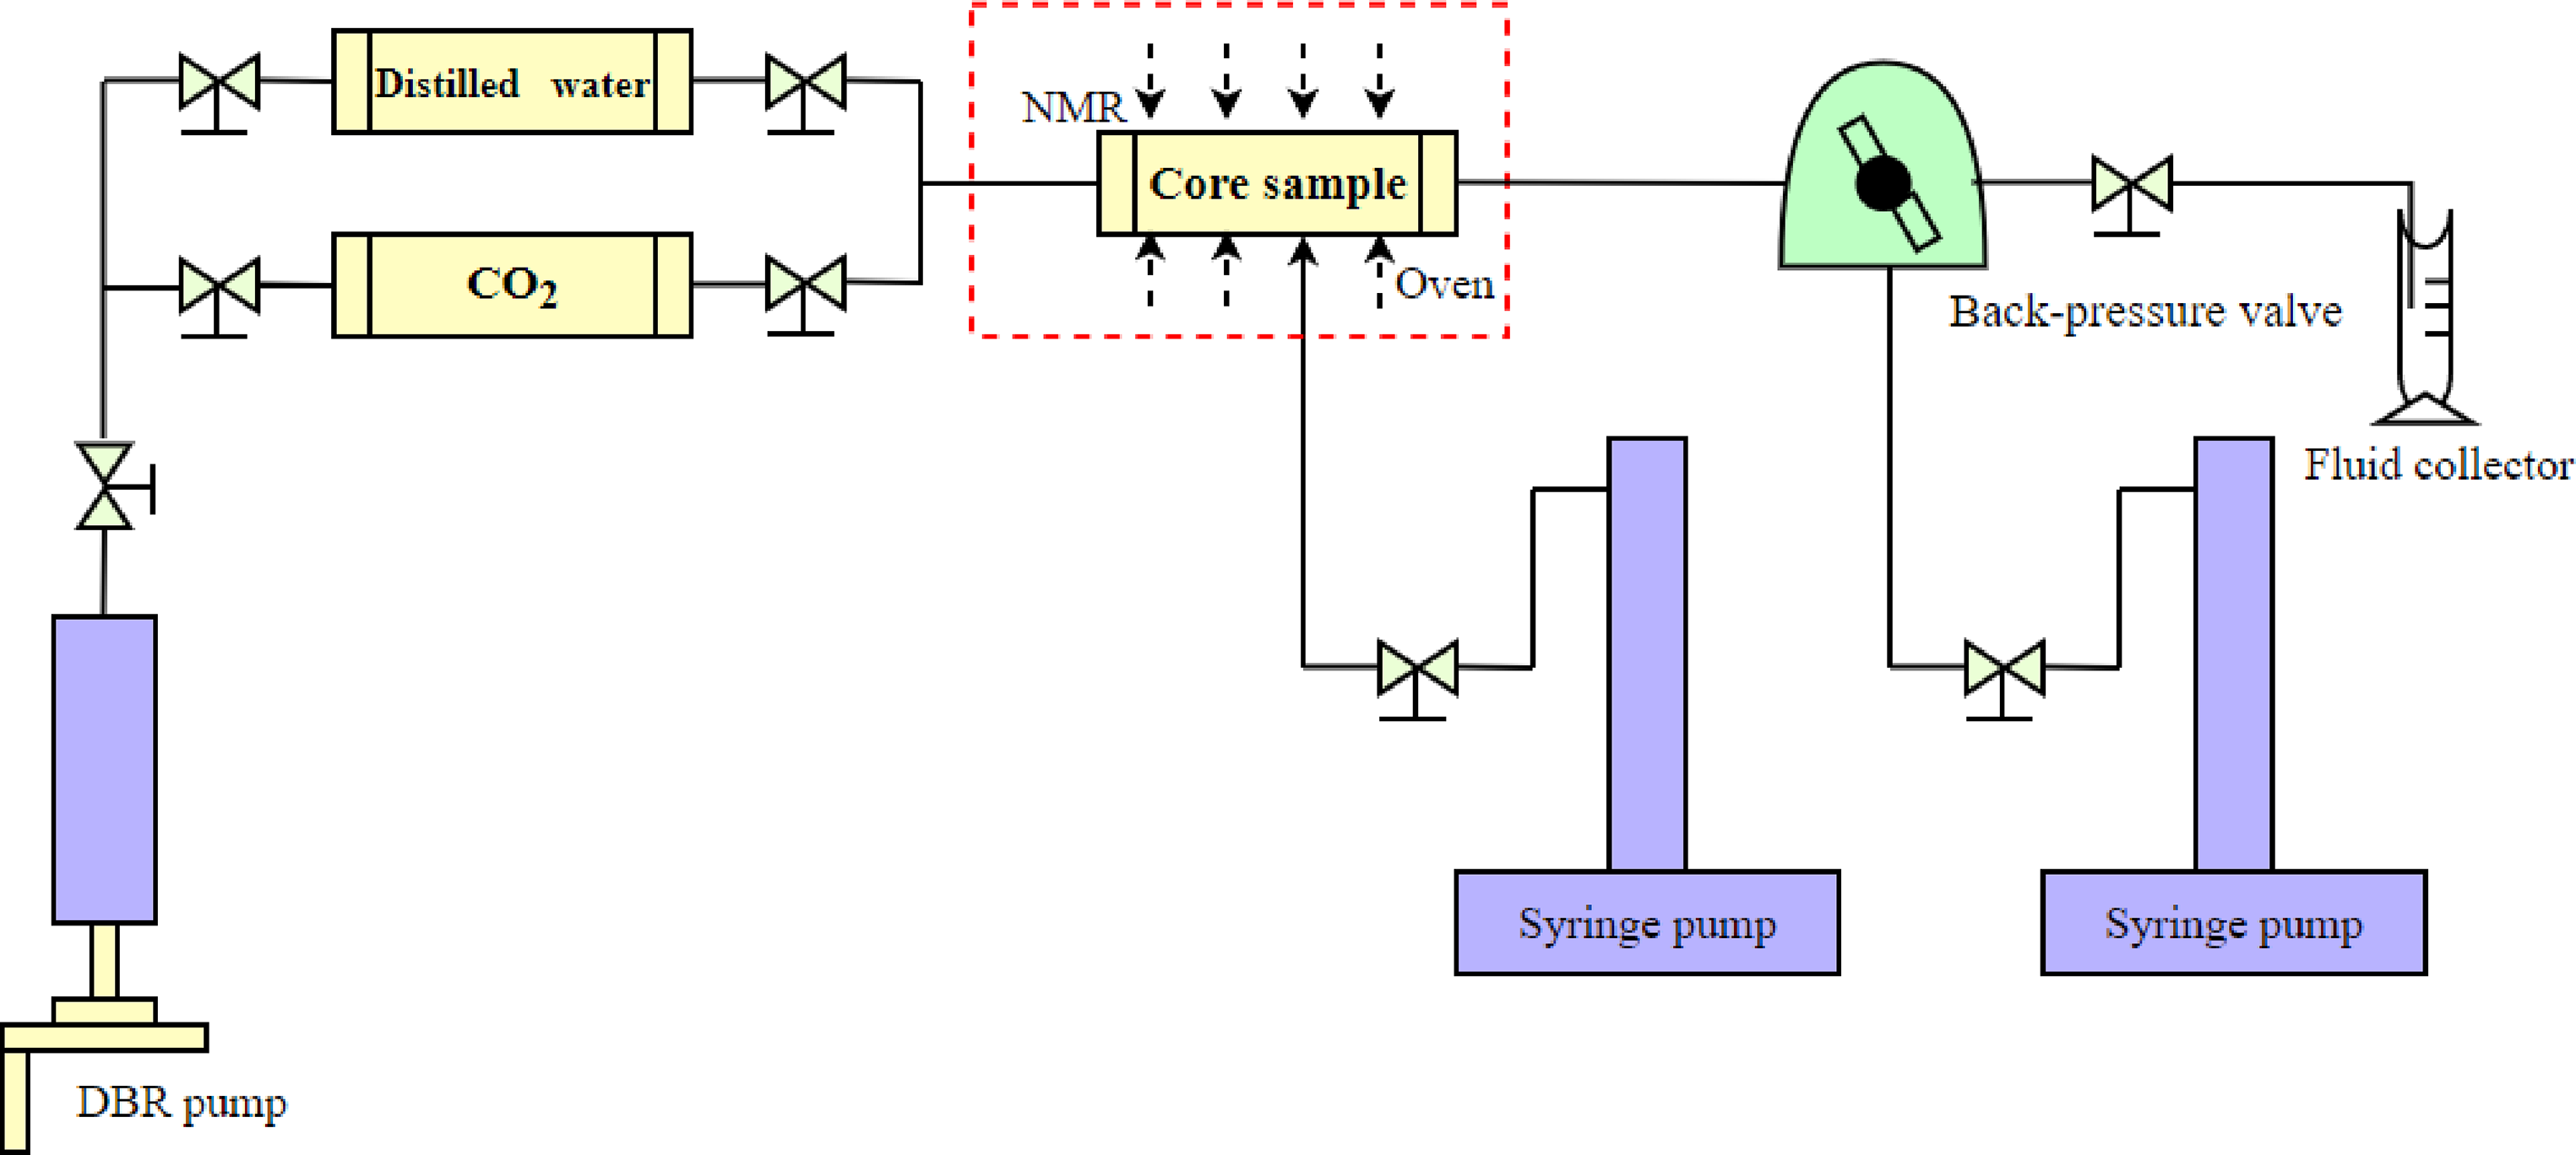
Schematic of CO2 injection with NMR.
Results
CO2 miscible/immiscible flooding
Figure 2 shows the results (e.g. recovery, storage coefficient, and gas–oil ratio) between CO2 miscible flooding of Core FY-1 and CO2 immiscible flooding of Core FY-2. It suggests that CO2 miscible flooding leads to better oil displacement effects in ultralow permeability reservoirs than CO2 immiscible flooding. For example, although irreducible water saturation of Core FY-1 (46.66%) is similar with that of Core FY-2 (45.56%), the oil displacement efficiency of CO2 miscible flooding in Core FY-1 is 76.19%, which is much higher than that of CO2 immiscible flooding in Core FY-2 (about 40.98%). In addition, Figure 1 also reveals that the gas breakthrough for CO2 miscible flooding is later than that for the immiscible flooding (the delay time is about 0.11 PV). Moreover, based on equation (1), the CO2 storage coefficient for CO2 miscible flooding was 0.834, which is much higher than that for CO2 immiscible flooding (0.135). It illustrates that CO2 miscible flooding leads to a better CO2 storage effect in ultralow permeability reservoirs.
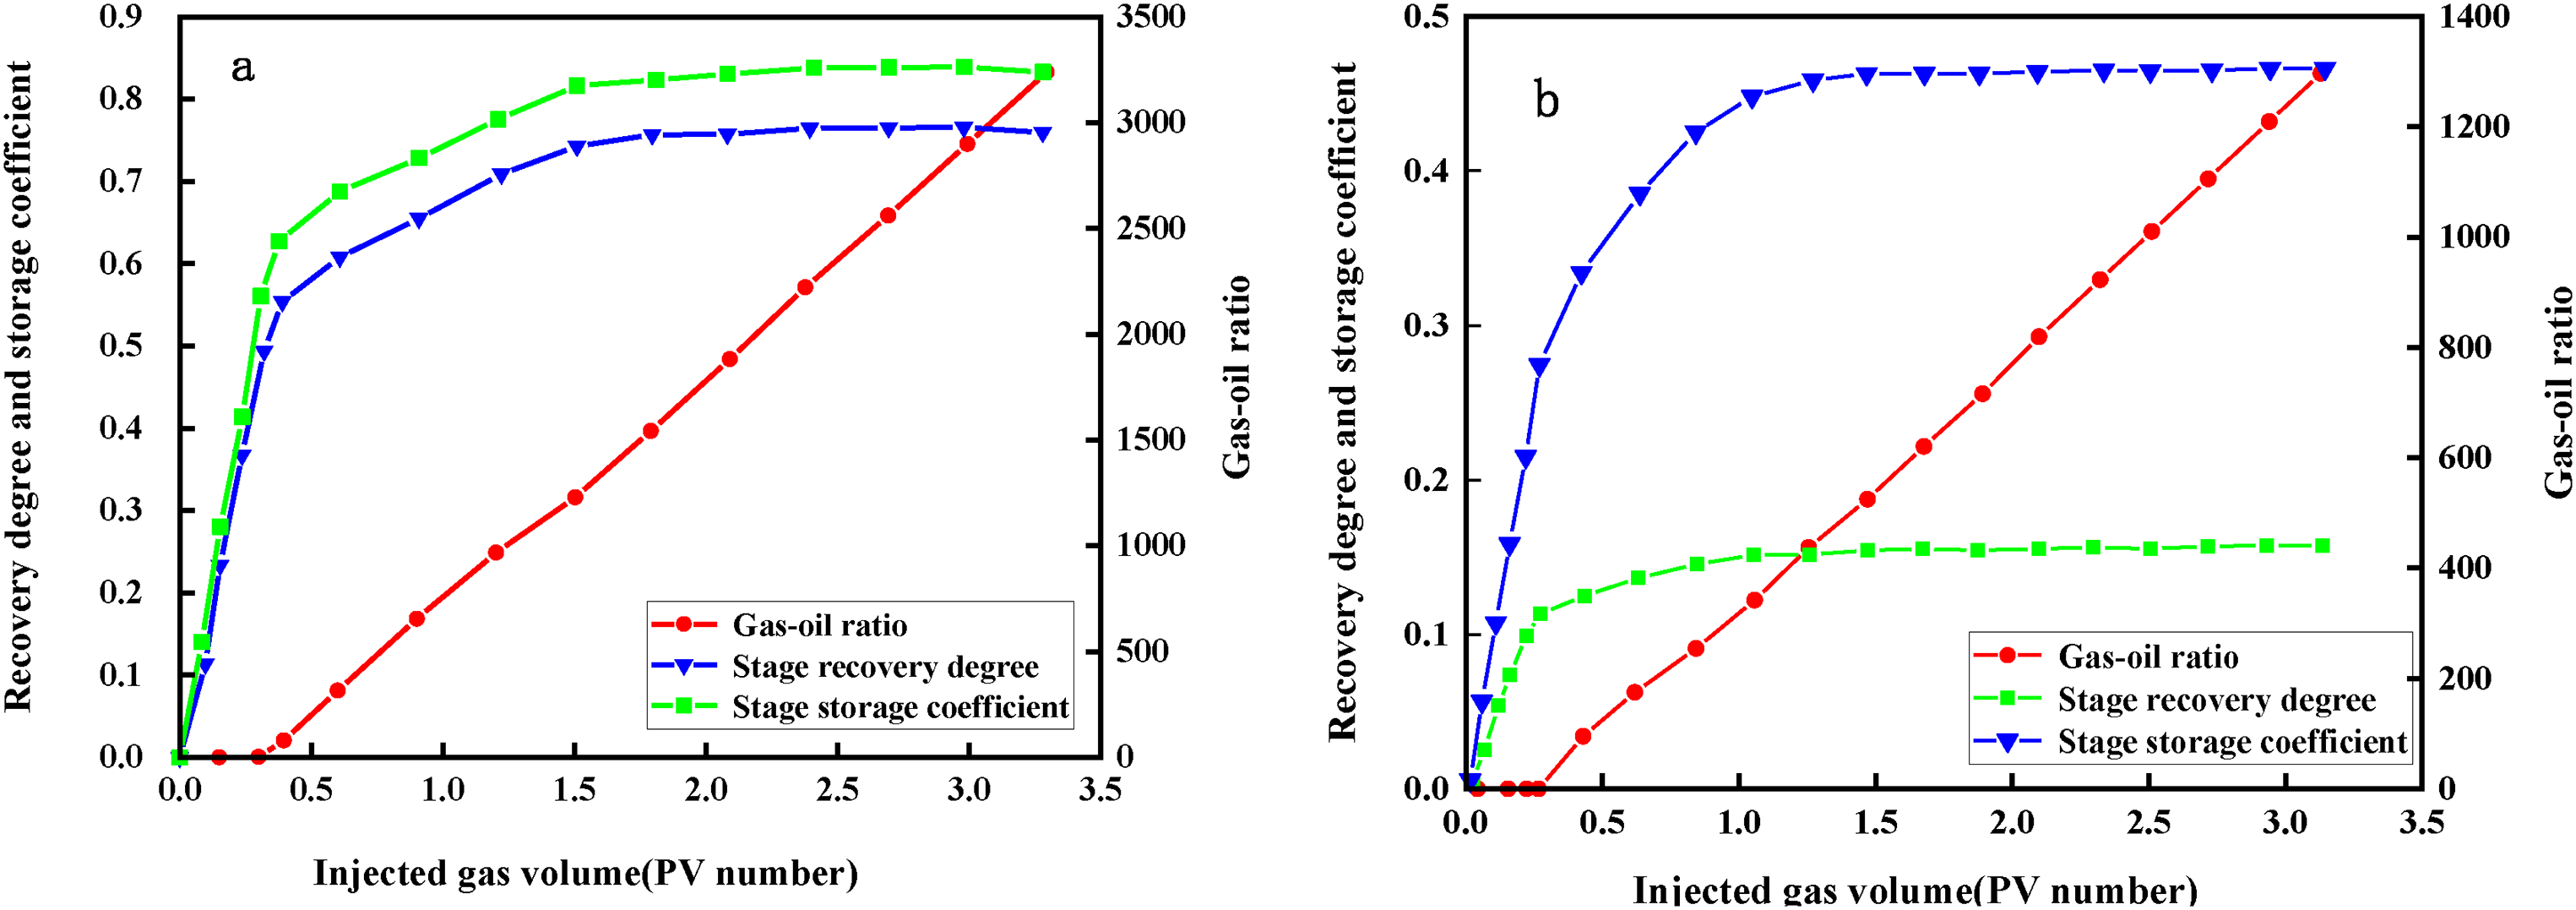
Comparison of the CO2 displacement results between Core FY-1 and Core FY-2. (a) CO2 miscible flooding, (b) CO2 immiscible flooding.
NMR tests
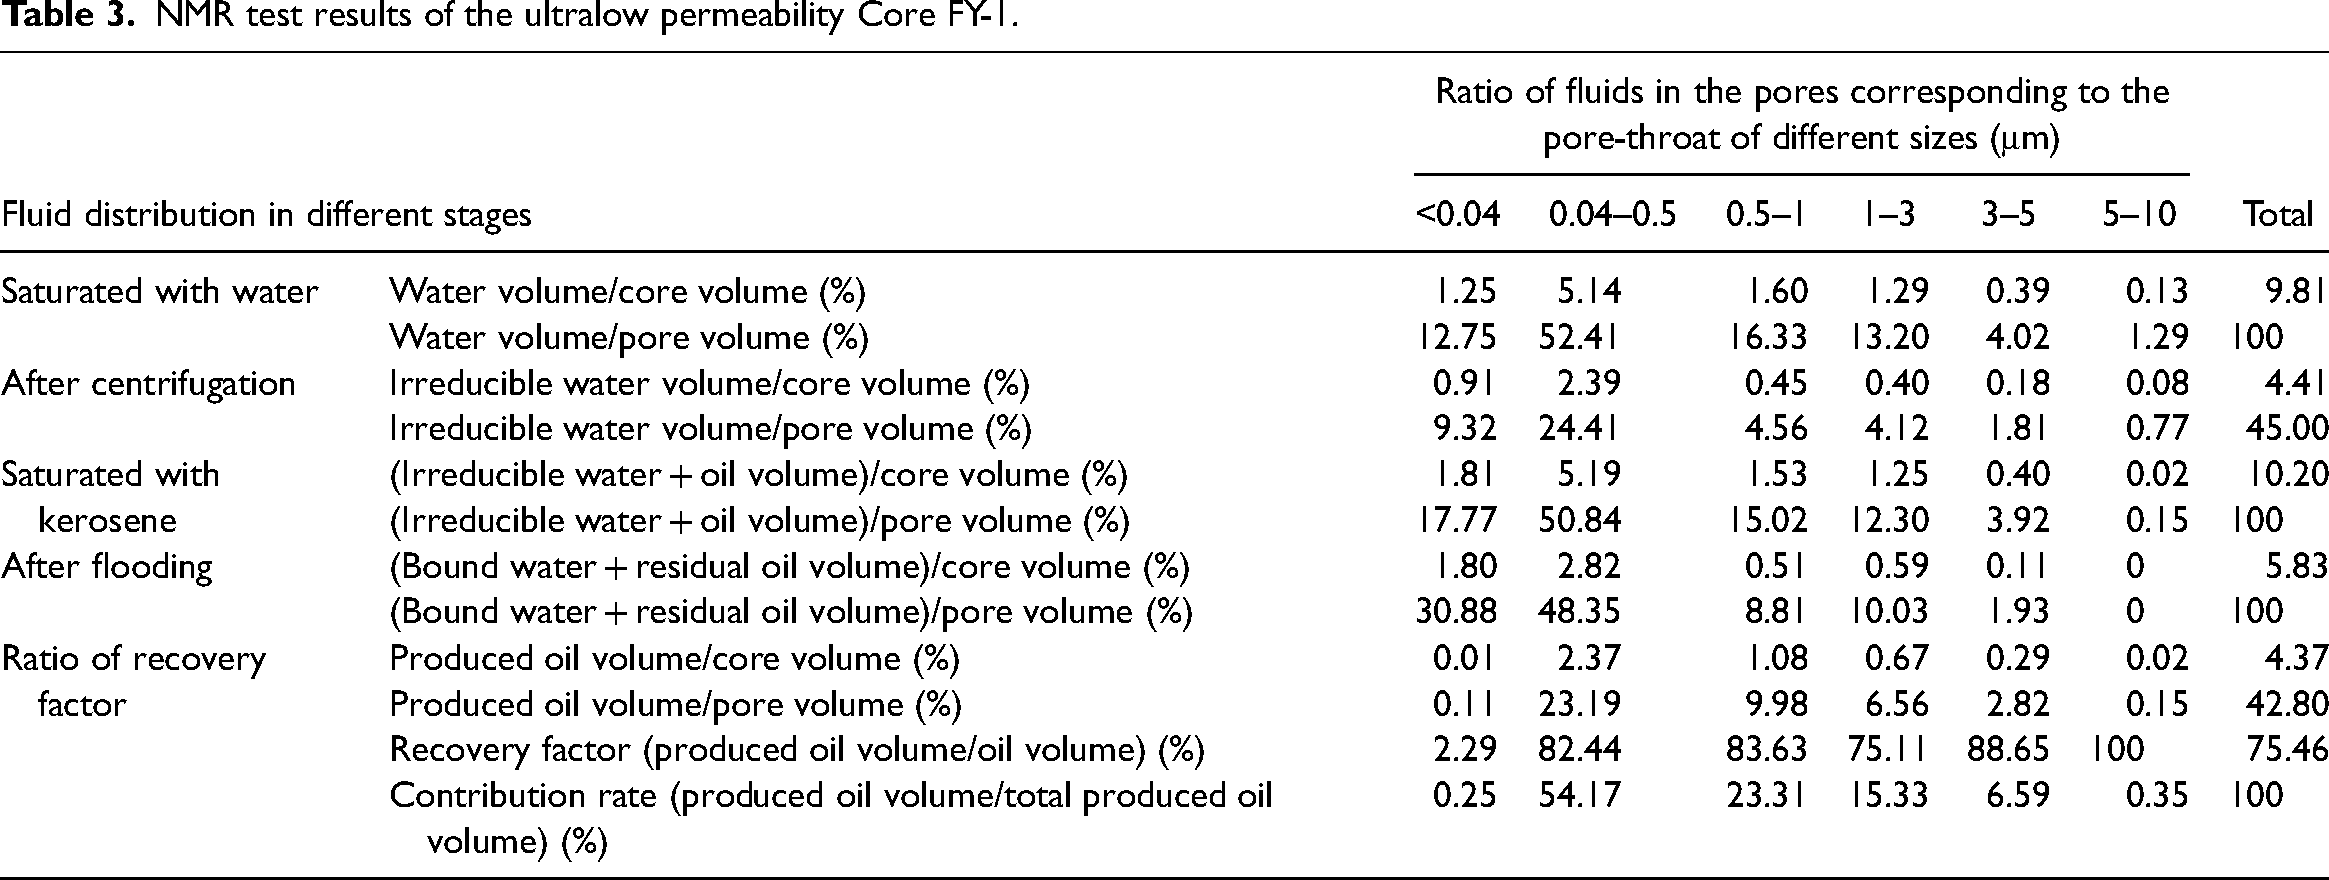
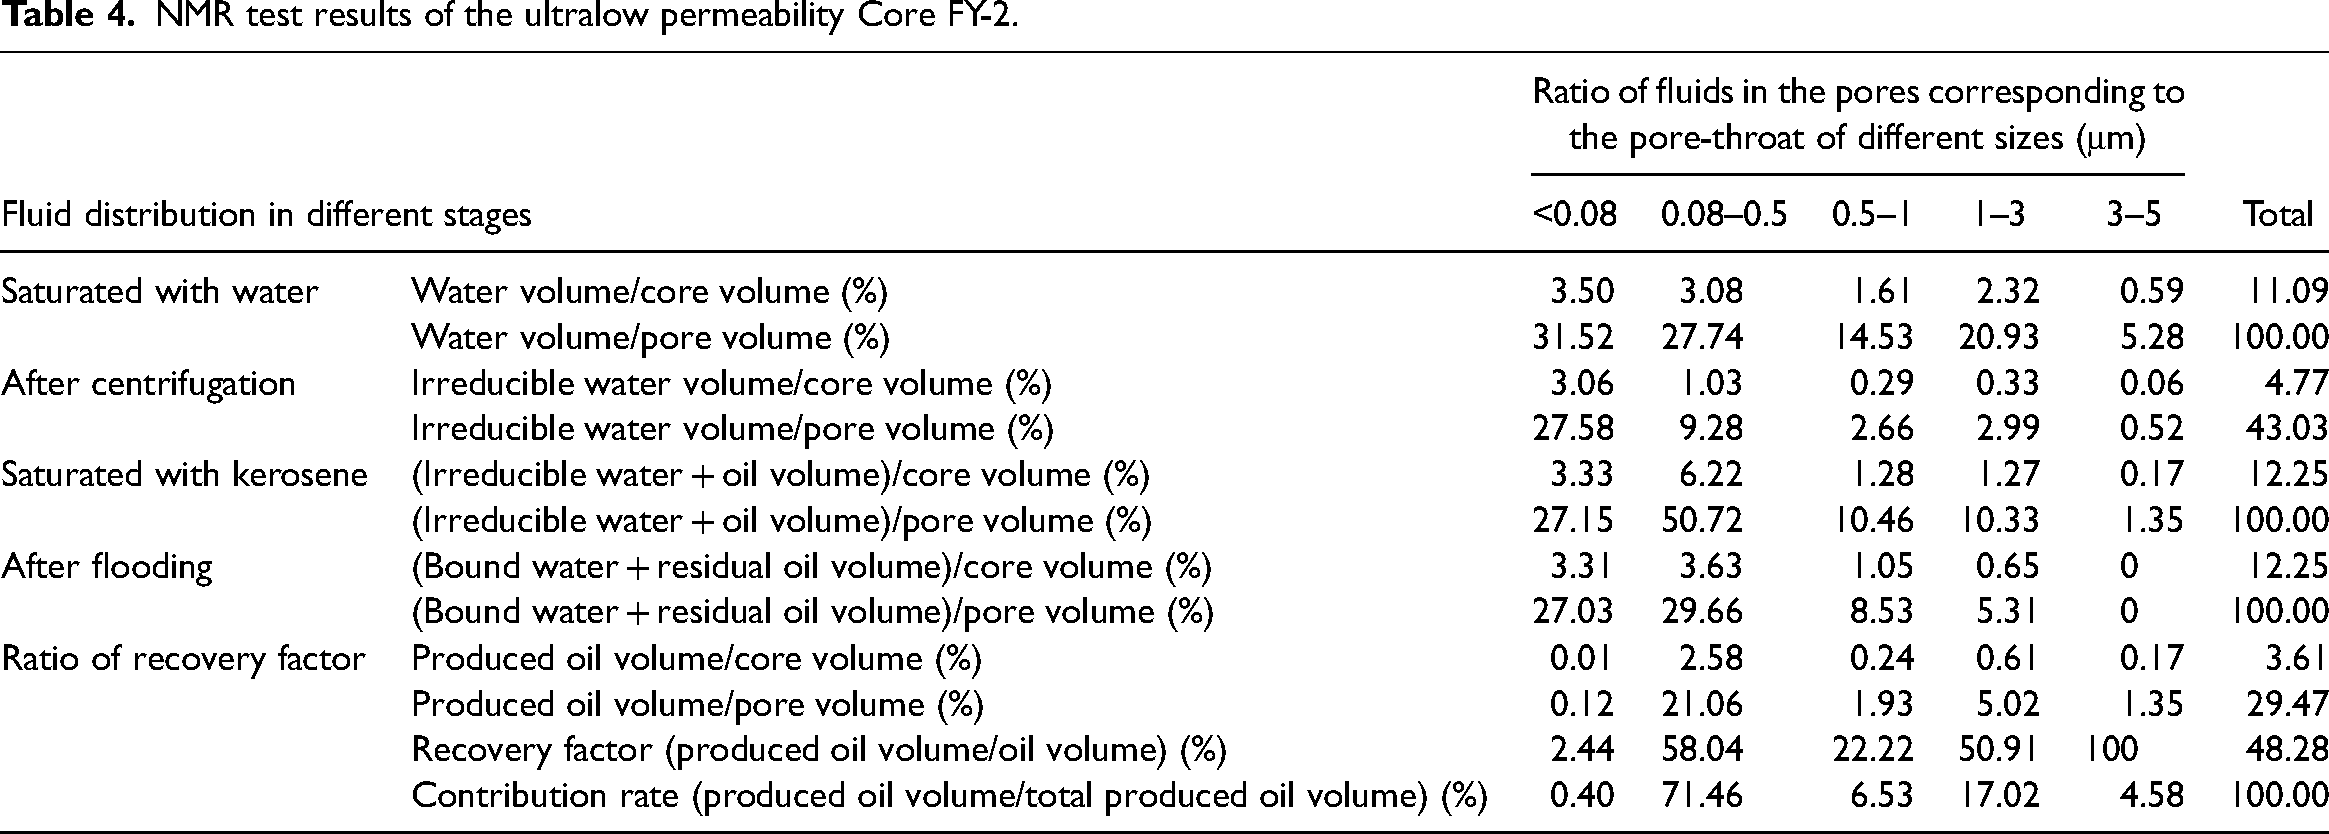
Figure 3 presents the results of the NMR of CO2 miscible/immiscible flooding. More specifically, Figure 2(a) and (b) shows the results of the NMR test for CO2 miscible flooding and Figure 2(c) and (d) shows the results of the NMR test for CO2 immiscible flooding. As depicted in Figure 2, the measured T2 distribution curve can reflect the pore radius distribution and porosity components of the sample. Furthermore, based on the results in Figure 2, the lower limit of rock pore throat for CO2 flooding could be determined (Tables 3 and 4). Table 3 suggests that the lower limit of Core FY-1 pore throat for CO2 miscible flooding is 0.04 μm, and the 0.04–0.5 μm pore throats contribute most to the recovery factor. For example, the 0.04–0.5, 0.5–1, 1–3, 3–5, and 5–10 μm pore throats lead to the contribution of 54.17%, 23.31%, 15.33%, 6.59%, and 0.35% to the recovery factor, respectively. Table 4 shows that the lower limit of the Core FY-2 pore throat for CO2 immiscible flooding is 0.08 μm and the 0.08–0.5 μm pore throats contribute the most to the recovery factor (71.46%). As a consequence, the lower limit of the pore throat for CO2 miscible flooding is 0.04 μm, which is less than the value for CO2 immiscible flooding (0.08 μm). The range of the pore throats contributing the most to the oil recovery is 0.04–0.5 μm in CO2 miscible flooding and is 0.08–0.5 μm in CO2 immiscible flooding. That is, the pore throats that contribute the most to the recovery factor in CO2 miscible flooding are less than that in CO2 immiscible flooding.
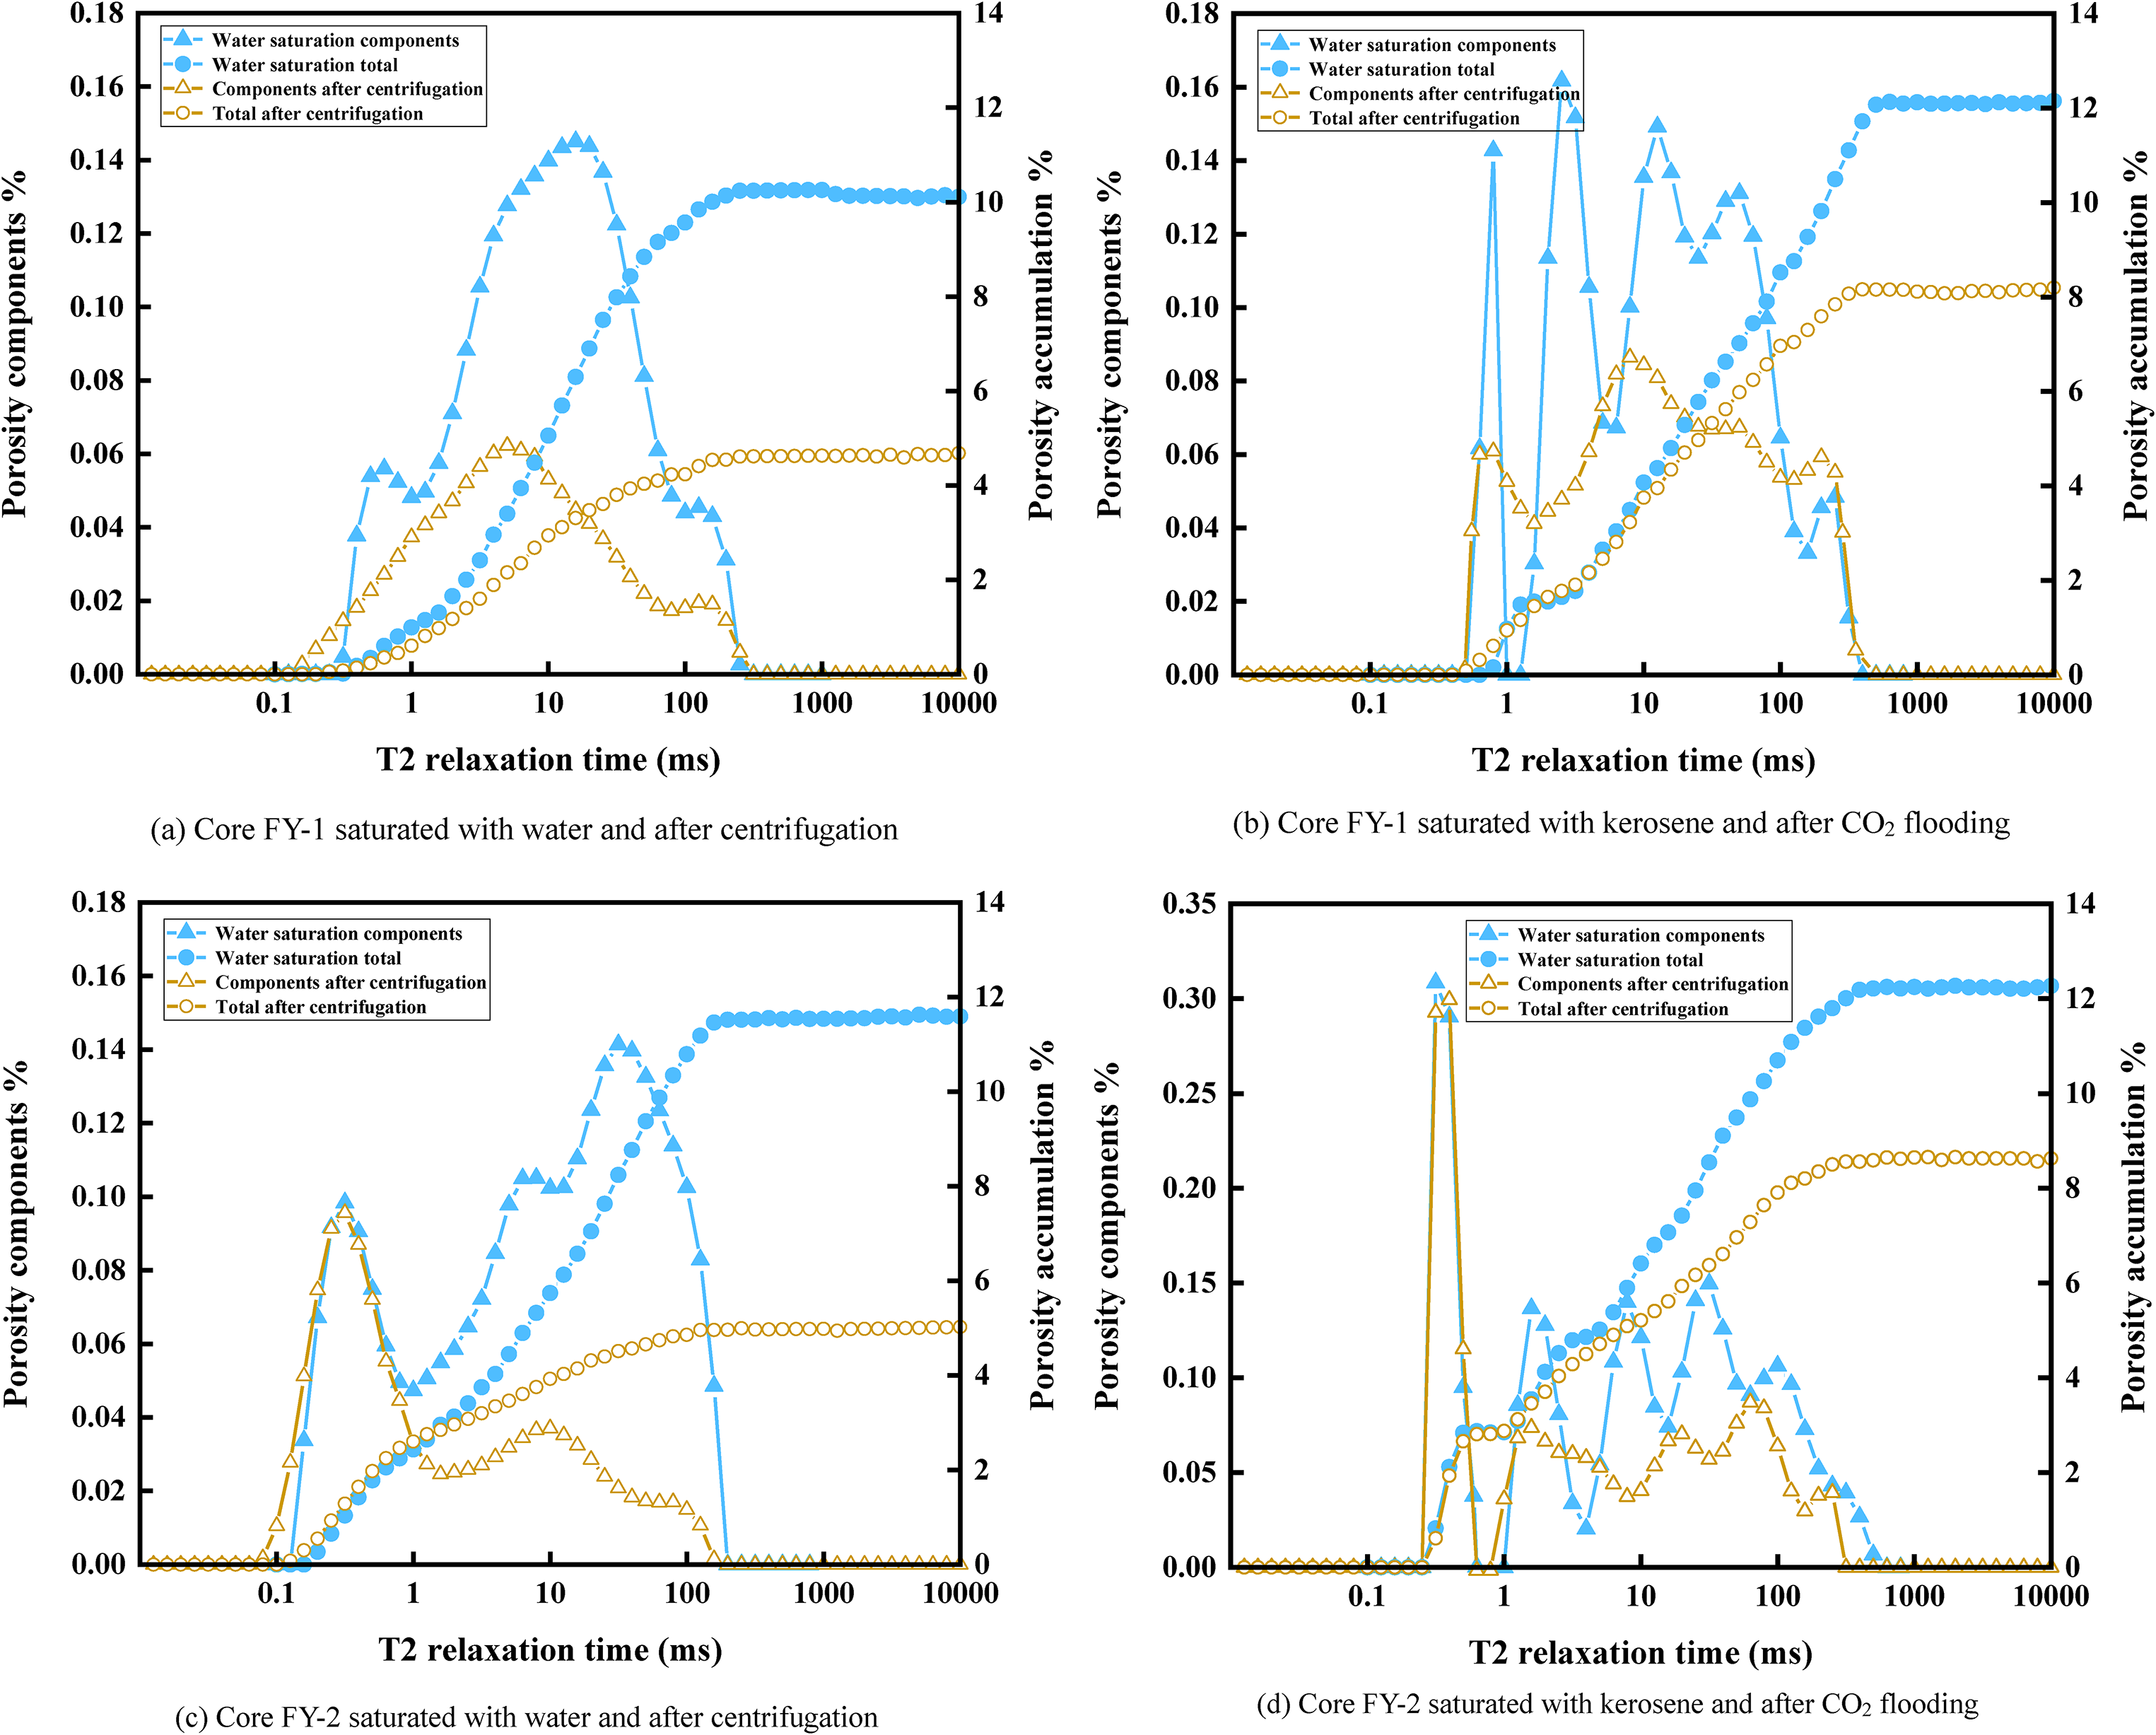
Comparison of the NMR test results between Core FY-1 and Core FY-2. (a) Core FY-1 saturated with water and after centrifugation, (b) Core FY-1 saturated with kerosene and after CO2 flooding, (c) Core FY-2 saturated with water and after centrifugation, (d) Core FY-2 saturated with kerosene and after CO2 flooding.
NMR test results of the ultralow permeability Core FY-1.
NMR test results of the ultralow permeability Core FY-2.
Frozen pelleting experiments
State of fluid occurrence before and after CO2 miscible flooding
Based on the core fluorescence software (Image J), frozen slice images of Core FY-1 before CO2 miscible flooding could be analyzed. The initial state of the mobile oil in throat, cluster, and corner shapes before CO2 miscible flooding for Core FY-1 are depicted in Figure 4(a). The immobile oil mainly is bound in intergranular adsorption and slit shapes (Figure 4(b)). Water is mainly irreducible water. After CO2 miscible flooding, the remaining oil is bound in throat-shaped, cluster-shaped, corner-shaped, intergranular adsorption-shaped, and slit-shaped.
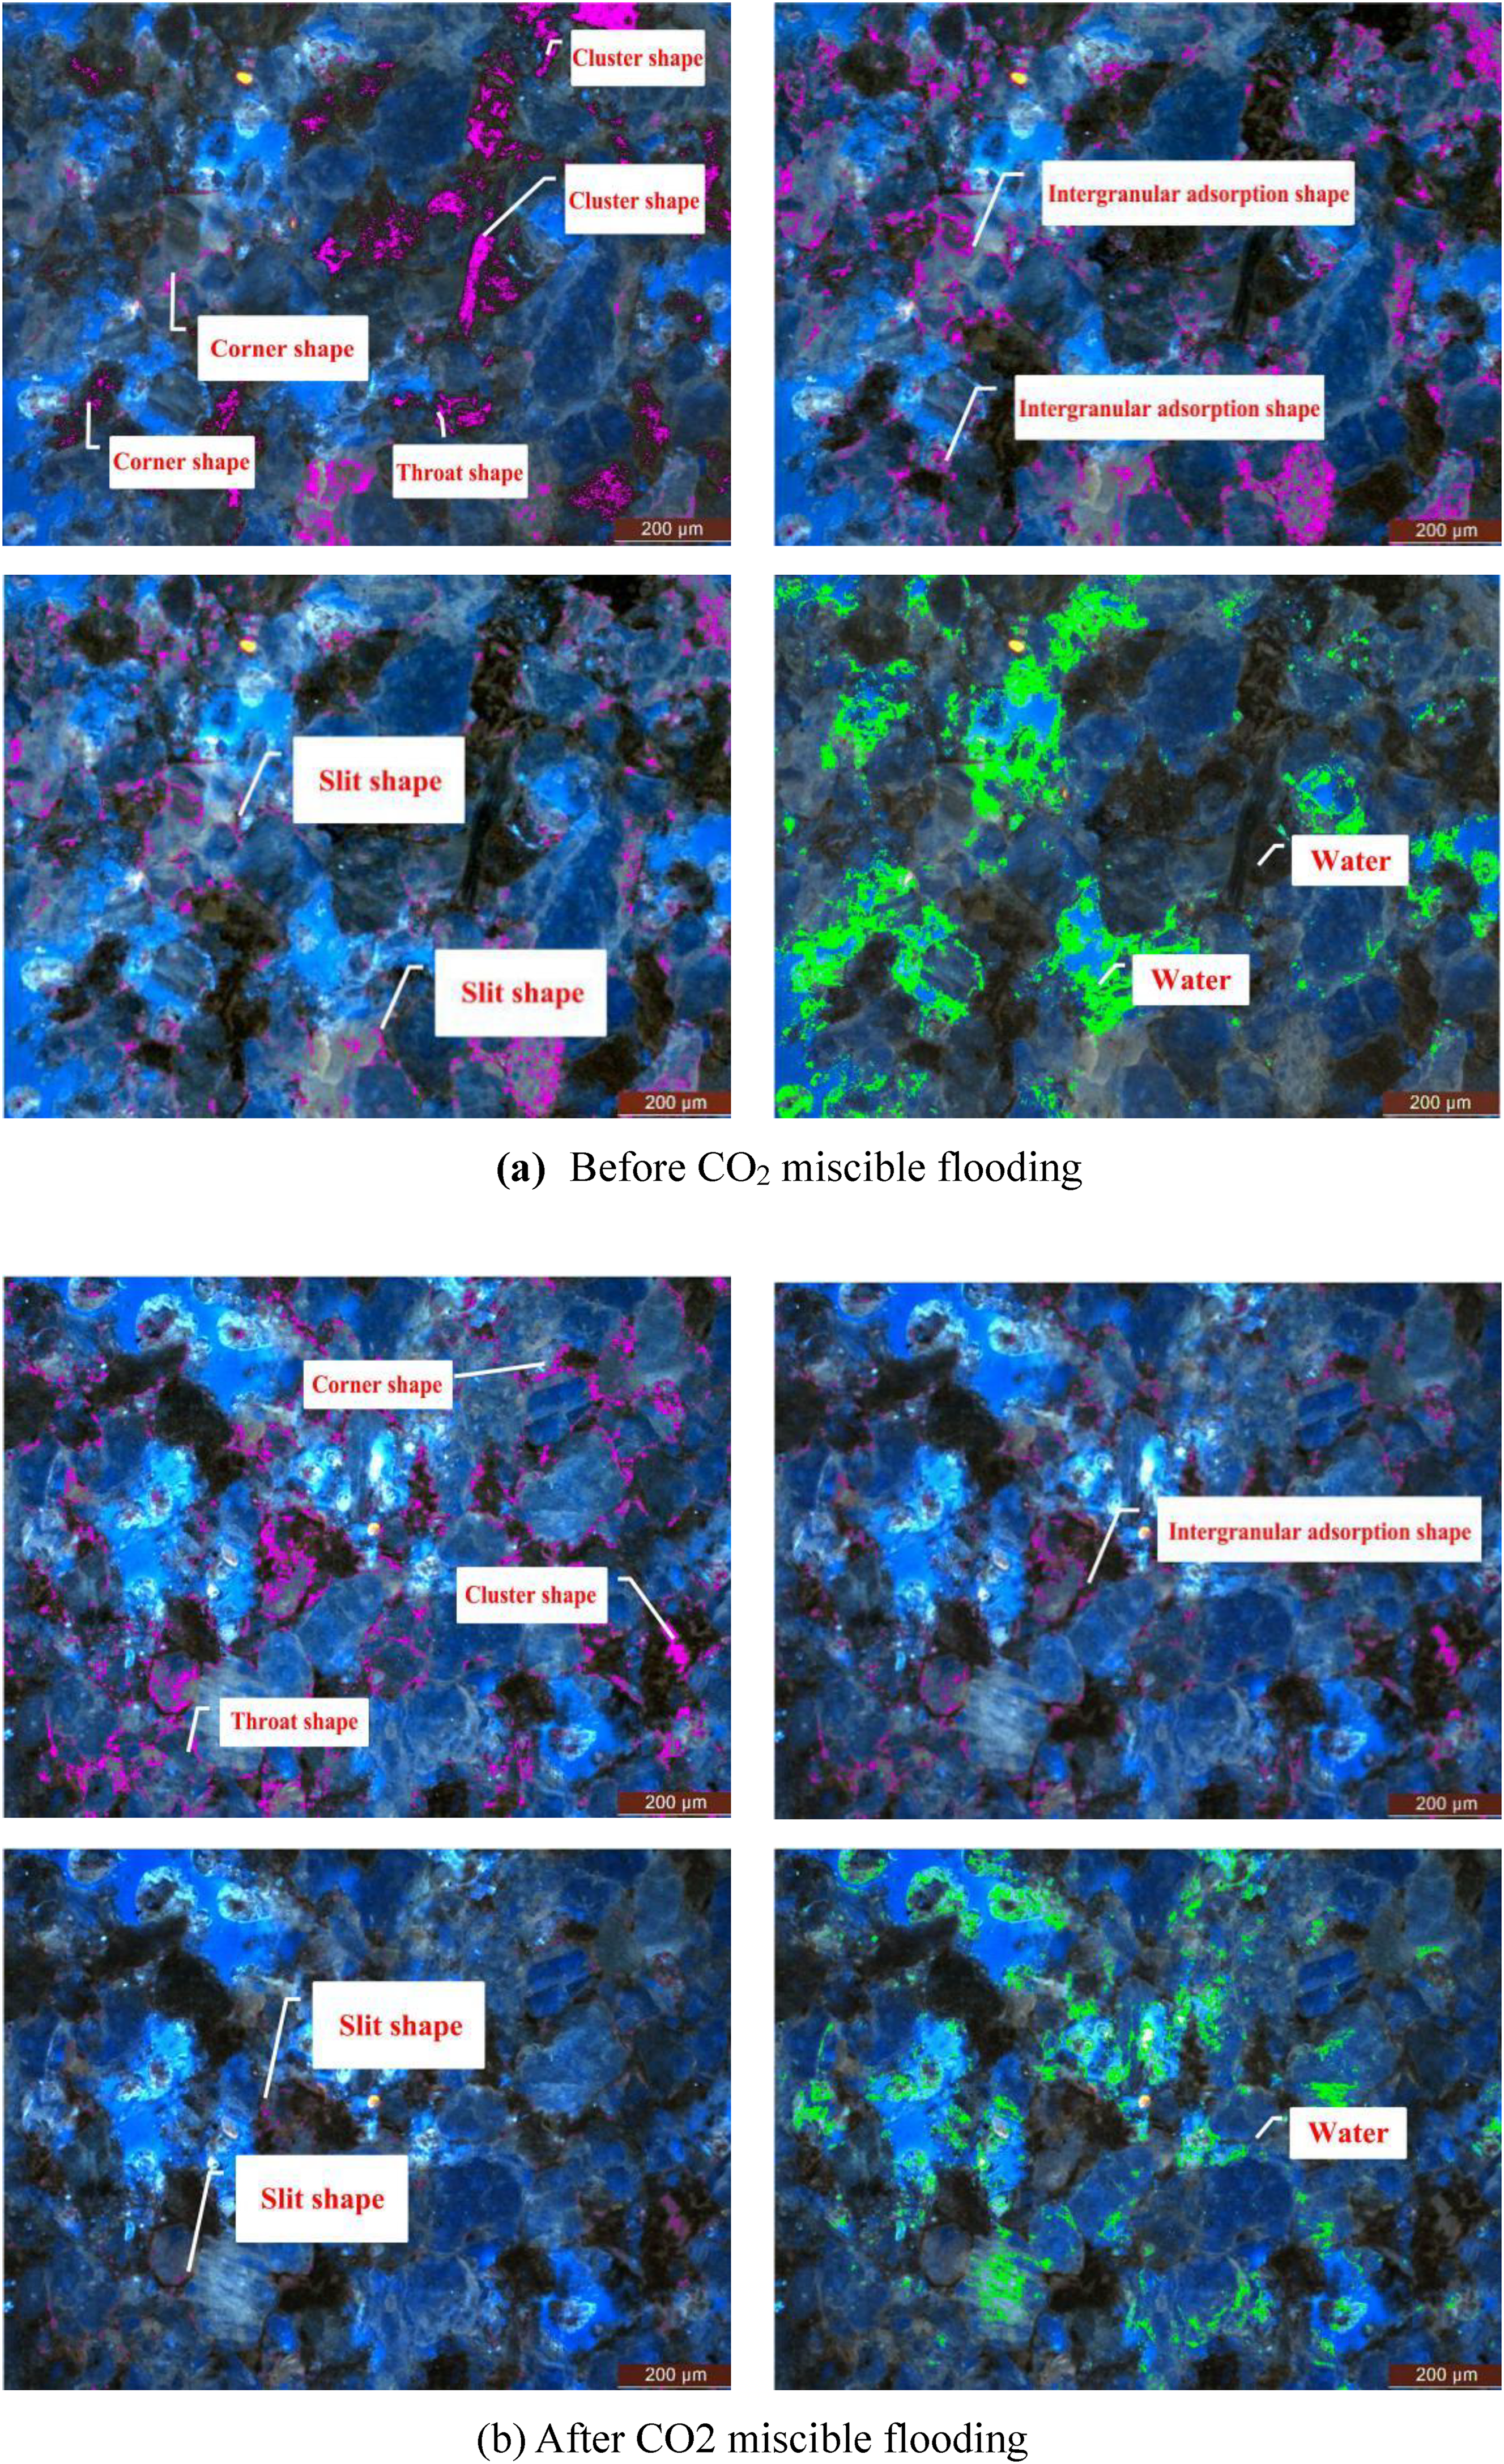
Frozen slice images of Core FY-1. (a) Before CO2 miscible flooding, (b) after CO2 miscible flooding.
The comparisons in Figure 5 suggest that throat-shaped oil, cluster-shaped oil, corner-shaped oil, intergranular adsorption-shaped oil, slit-shaped oil, and irreducible water account for 7.91%, 24.72%, 8.54%, 12.45%, 1.27%, and 44.16%, respectively, before CO2 miscible flooding. After CO2 miscible flooding, the throat-shaped oil, cluster-shaped oil, corner-shaped oil, intergranular adsorption-shaped oil, slit-shaped oil, and irreducible water account for 3.63%, 5.27%, 4.73%, 2.27%, 0.36%, and 40.53%, respectively. It is obvious that both oil saturation and water saturation decrease after CO2 miscible flooding. Before and after CO2 miscible flooding, oil saturation drops from 54.89% to 16.26%, with a change of 38.63%. The order of significant change from largest to smallest is the cluster-shaped oil, the intergranular adsorption-shaped oil, the throat-shaped oil, the corner-shaped oil, and the slit-shaped oil. In addition, water saturation declines from 44.16% to 40.53%, with a change of 3.63%.
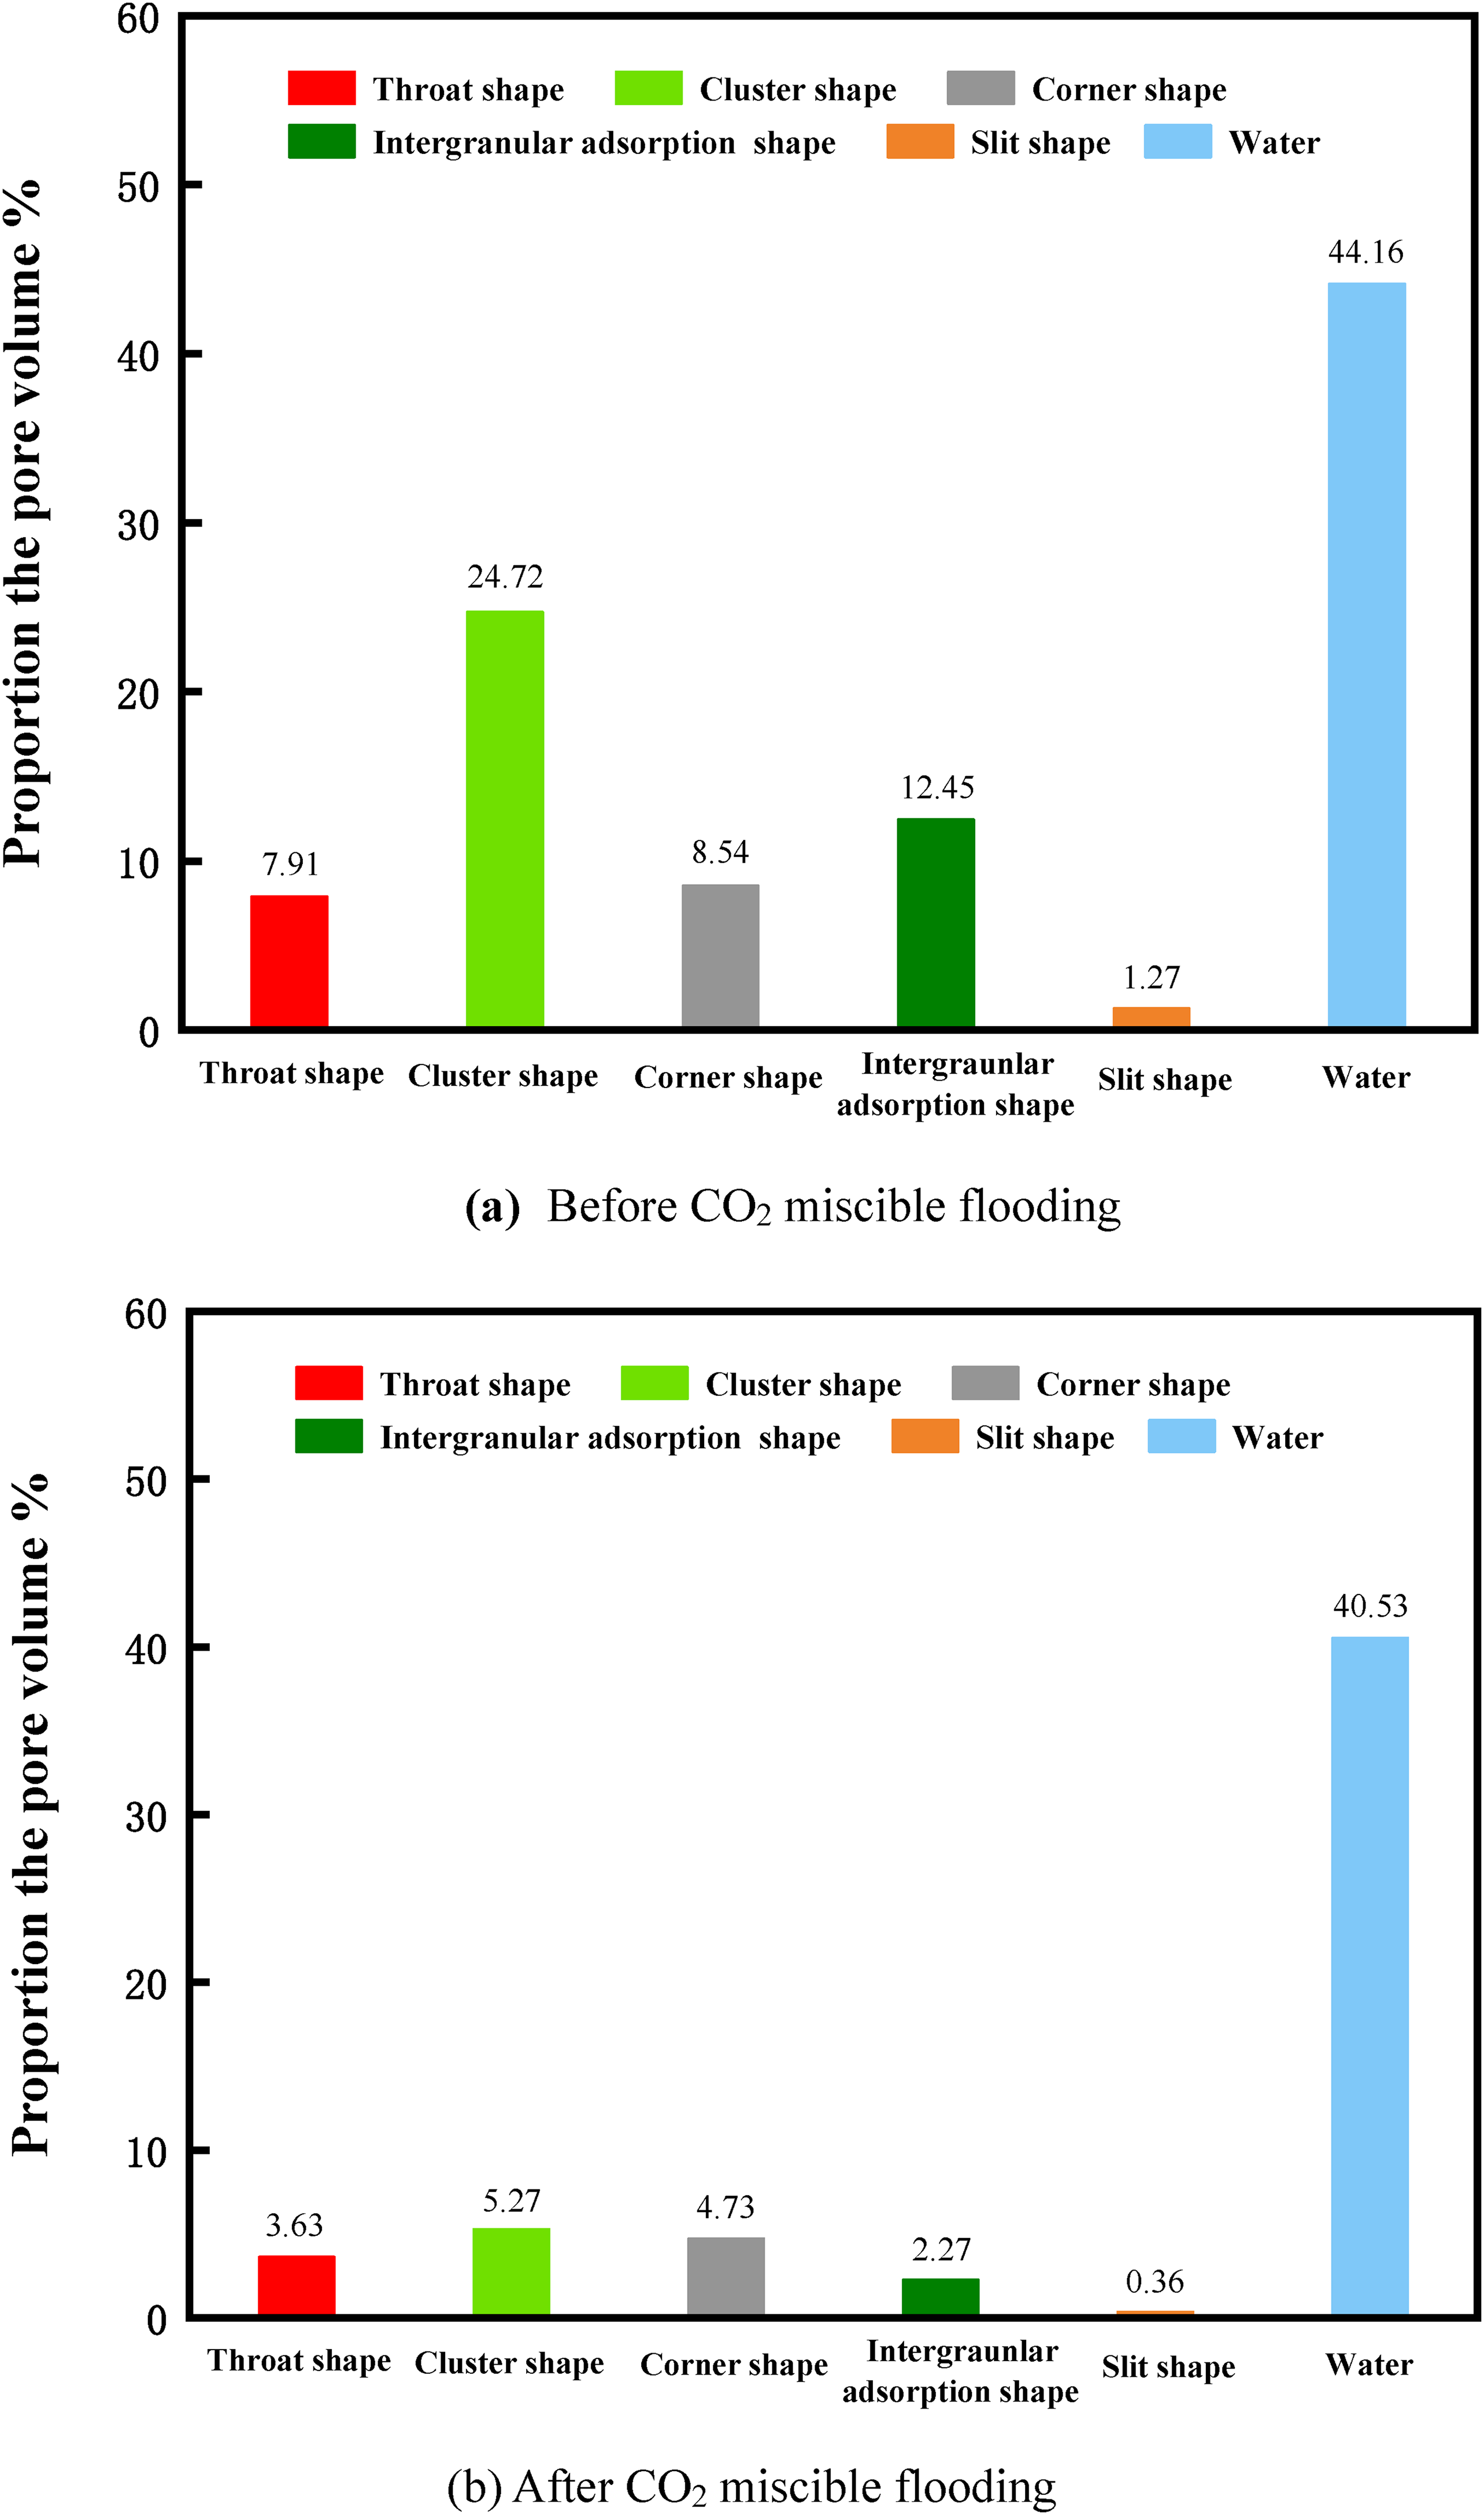
Analysis of the fluid microscopic occurrence of Core FY-1. (a) Before CO2 miscible flooding, (b) after CO2 miscible flooding.
State of fluid occurrence before and after CO2 immiscible flooding
With the same method, frozen slice images of Core FY-2 before and after CO2 immiscible flooding were analyzed. As depicted in Figure 6, the initial state of the oil phase (mobile oil and immobile oil) can also be classified as throat shape, cluster shape, corner shape, intergranular adsorption shape, and the slit shape for core FY-2 before CO2 immiscible flooding. After CO2 immiscible flooding, the remaining oil distributes in throat, cluster, corner, intergranular adsorption, and slit shapes.
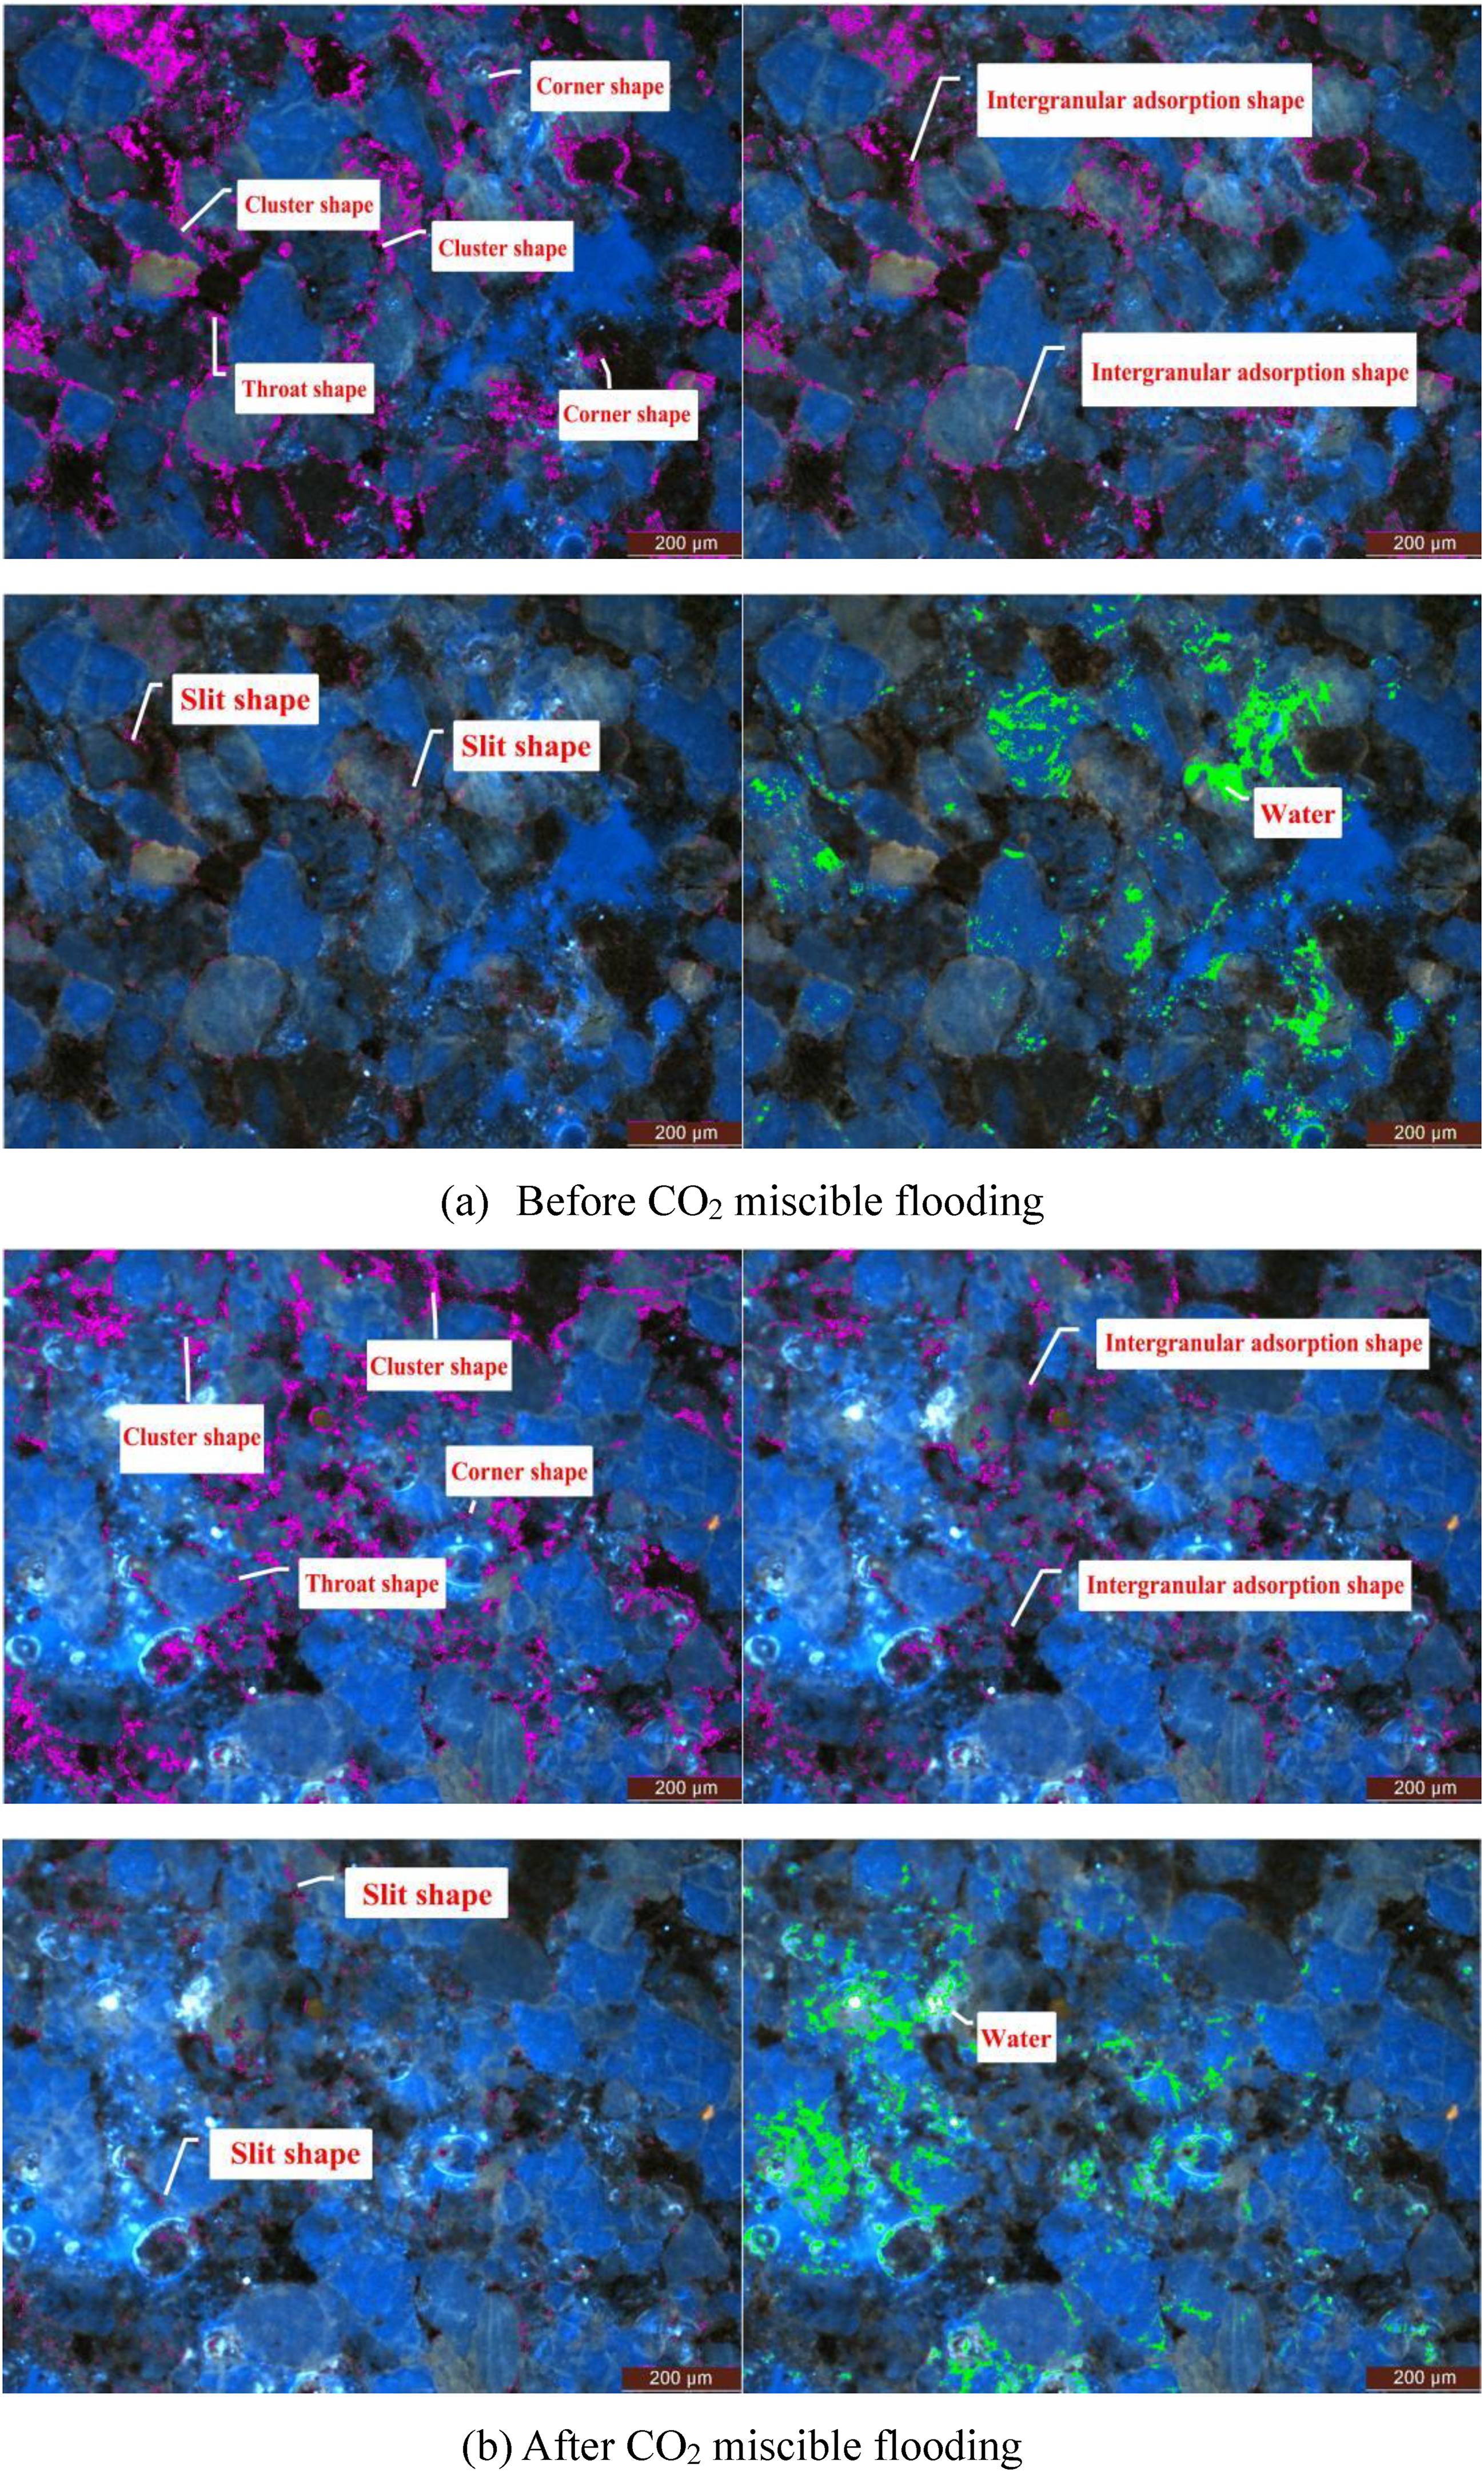
Frozen slice images of Core FY-2. (a) Before CO2 miscible flooding, (b) after CO2 miscible flooding.
Results from Figure 7 suggest that oil saturation drops from 57.33% to 35.76%, with a change of 21.57% after CO2 immiscible flooding. Before and after CO2 immiscible flooding, the oil saturation difference in the throat-shaped, cluster-shaped, corner-shaped, intergranular adsorption, and slit is 2.51%, 10.19%, 2.10%, 6.23%, and 0.54%, respectively. Water saturation reduces from 40.11% to 38.65%, with a change of 1.46%. Thus, compared with CO2 immiscible flooding, CO2 miscible flooding can produce more oil and water in various types of pore.
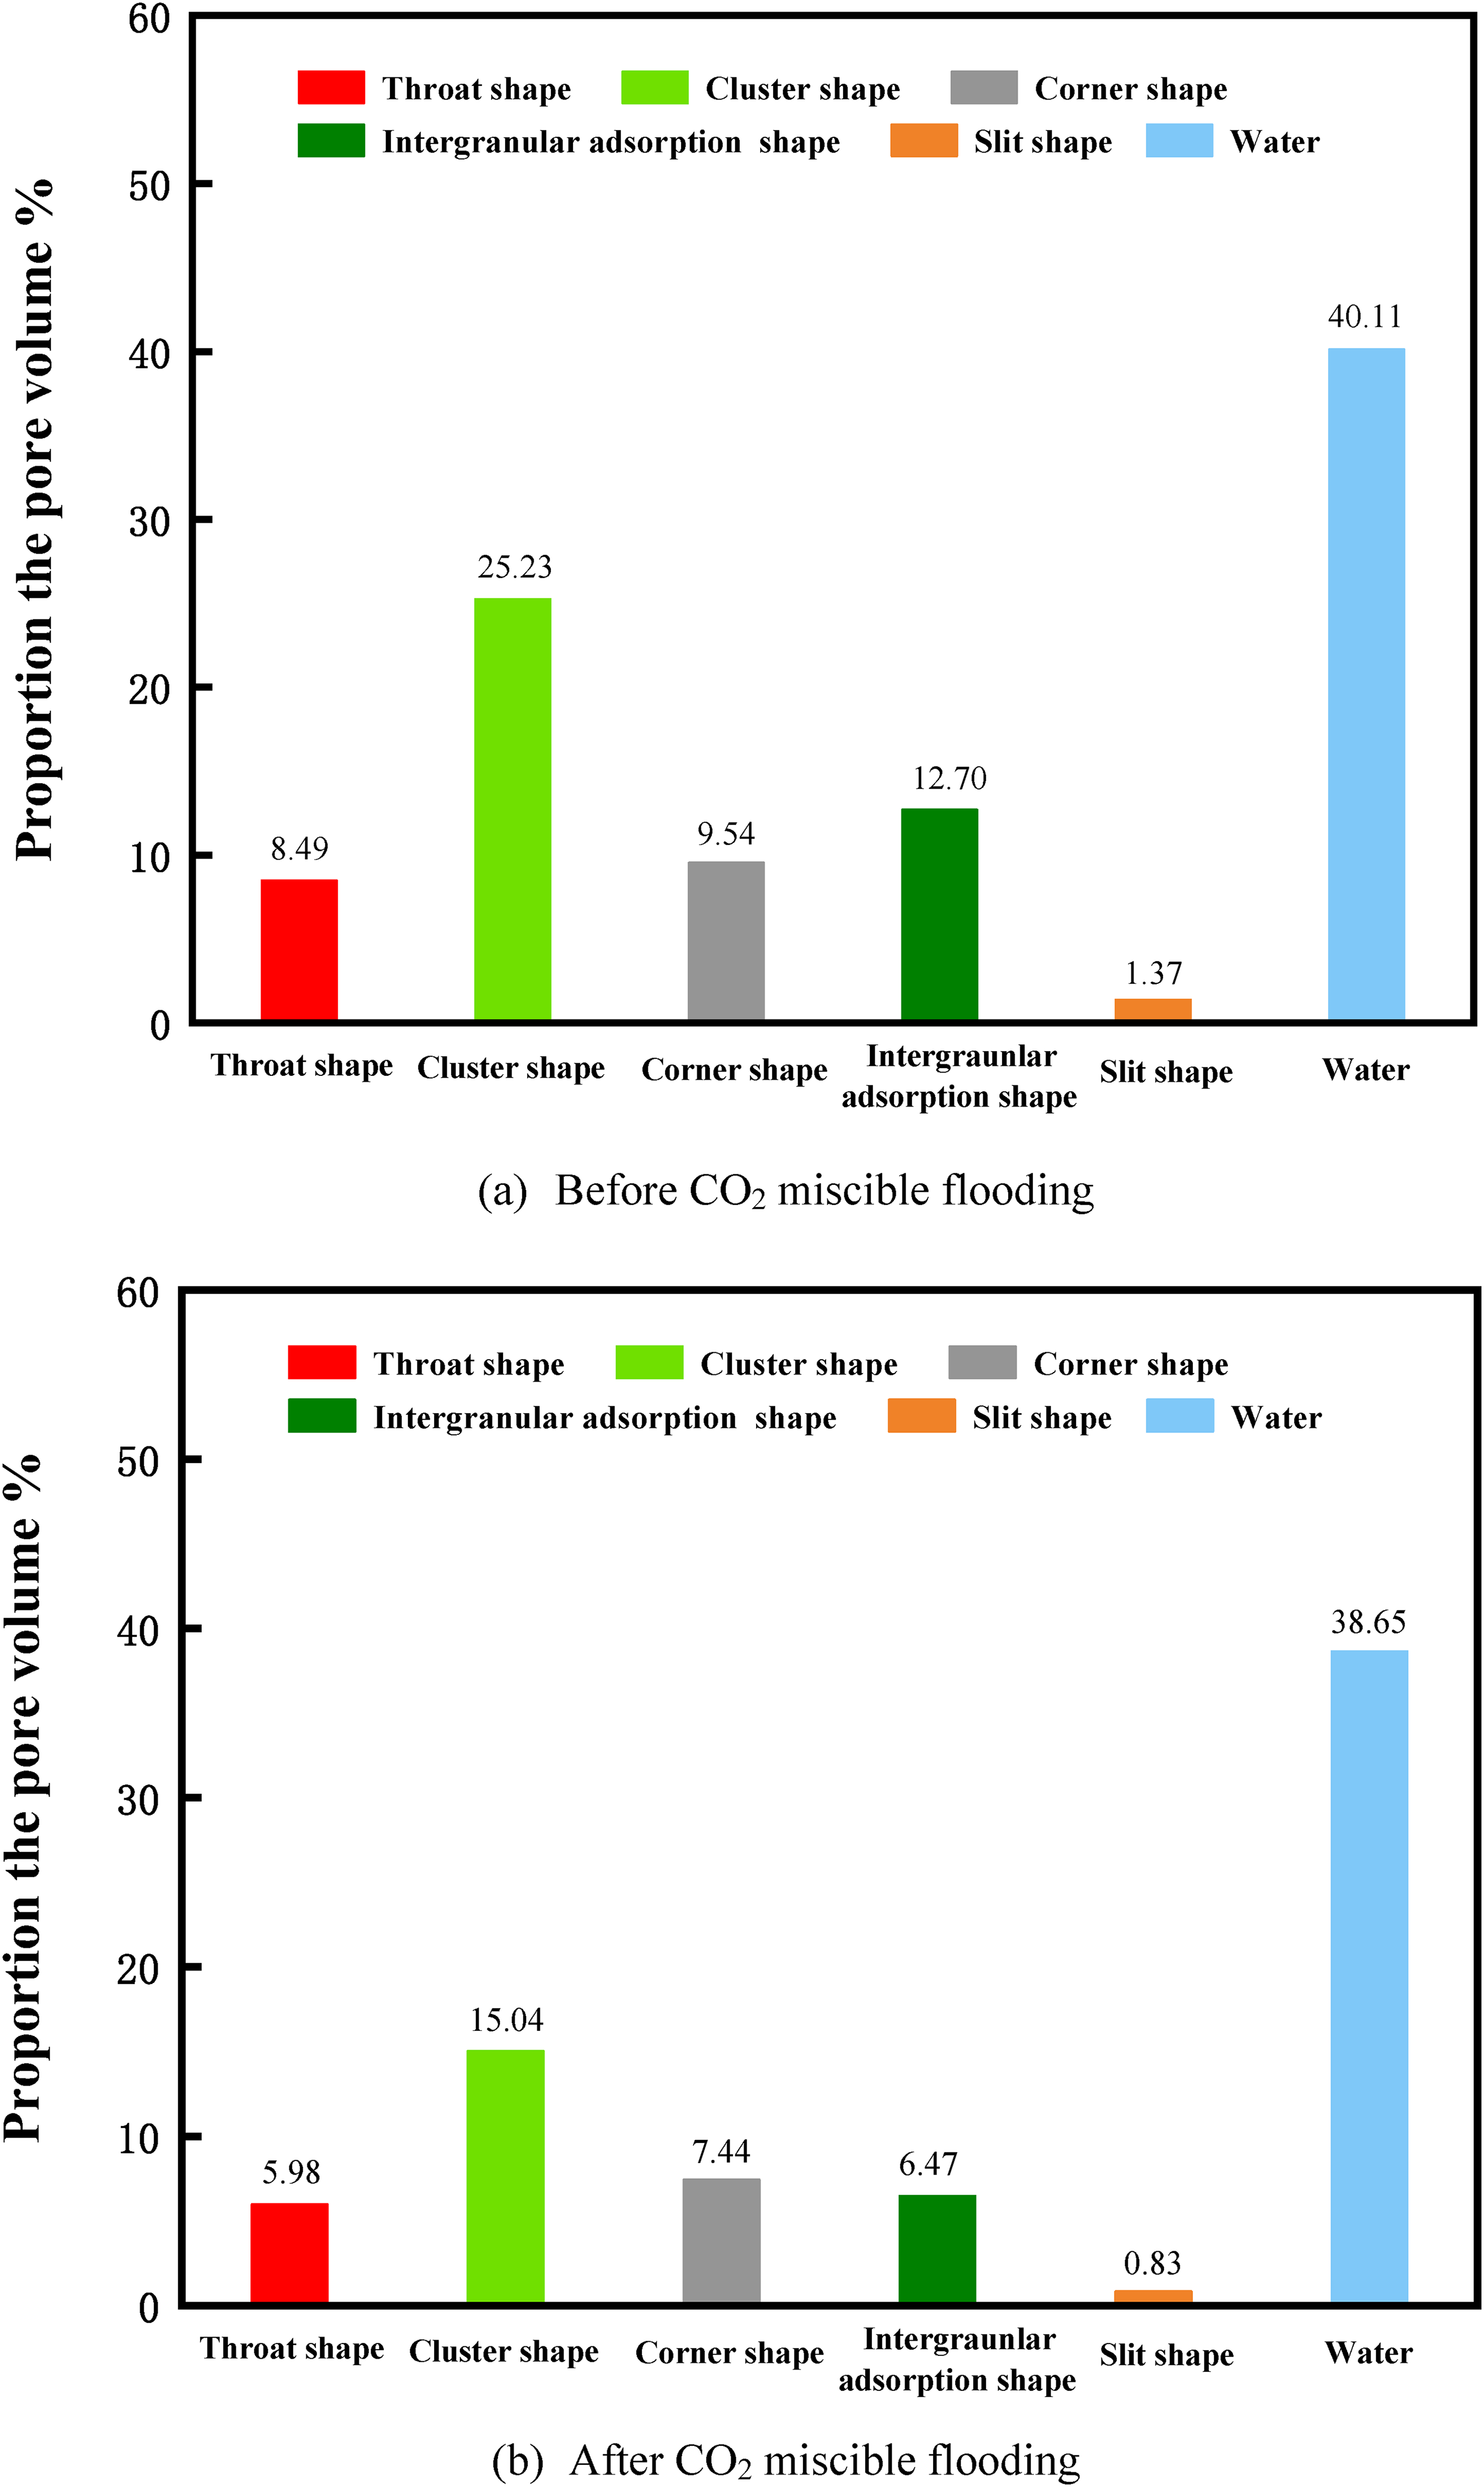
Analysis of the fluid microscopic occurrence state of FY-2 core before CO2 immiscible flooding. (a) Before CO2 miscible flooding, (b) after CO2 miscible flooding.
Based on the experimental measurements, the fluid occurrence state before and after CO2 flooding, the recovery enhanced by CO2 miscible/immiscible flooding, and the production characteristics of various types of remaining oil were compared and analyzed. The comparison results are shown in Figures 8 and 9. Before CO2 miscible and immiscible flooding, the irreducible water saturation and the occurrence state of various oil types are basically the same (Figure 7(a)). However, the difference between various types of bound oil becomes obvious after CO2 flooding (Figure 7(b)). The recovery of CO2 miscible flooding is much higher than that of immiscible CO2 flooding. Figure 8 suggests that CO2 miscible flooding increases the recovery of hard-to-produce oil (throat-shaped oil and corner-shaped oil) by 3.48%.
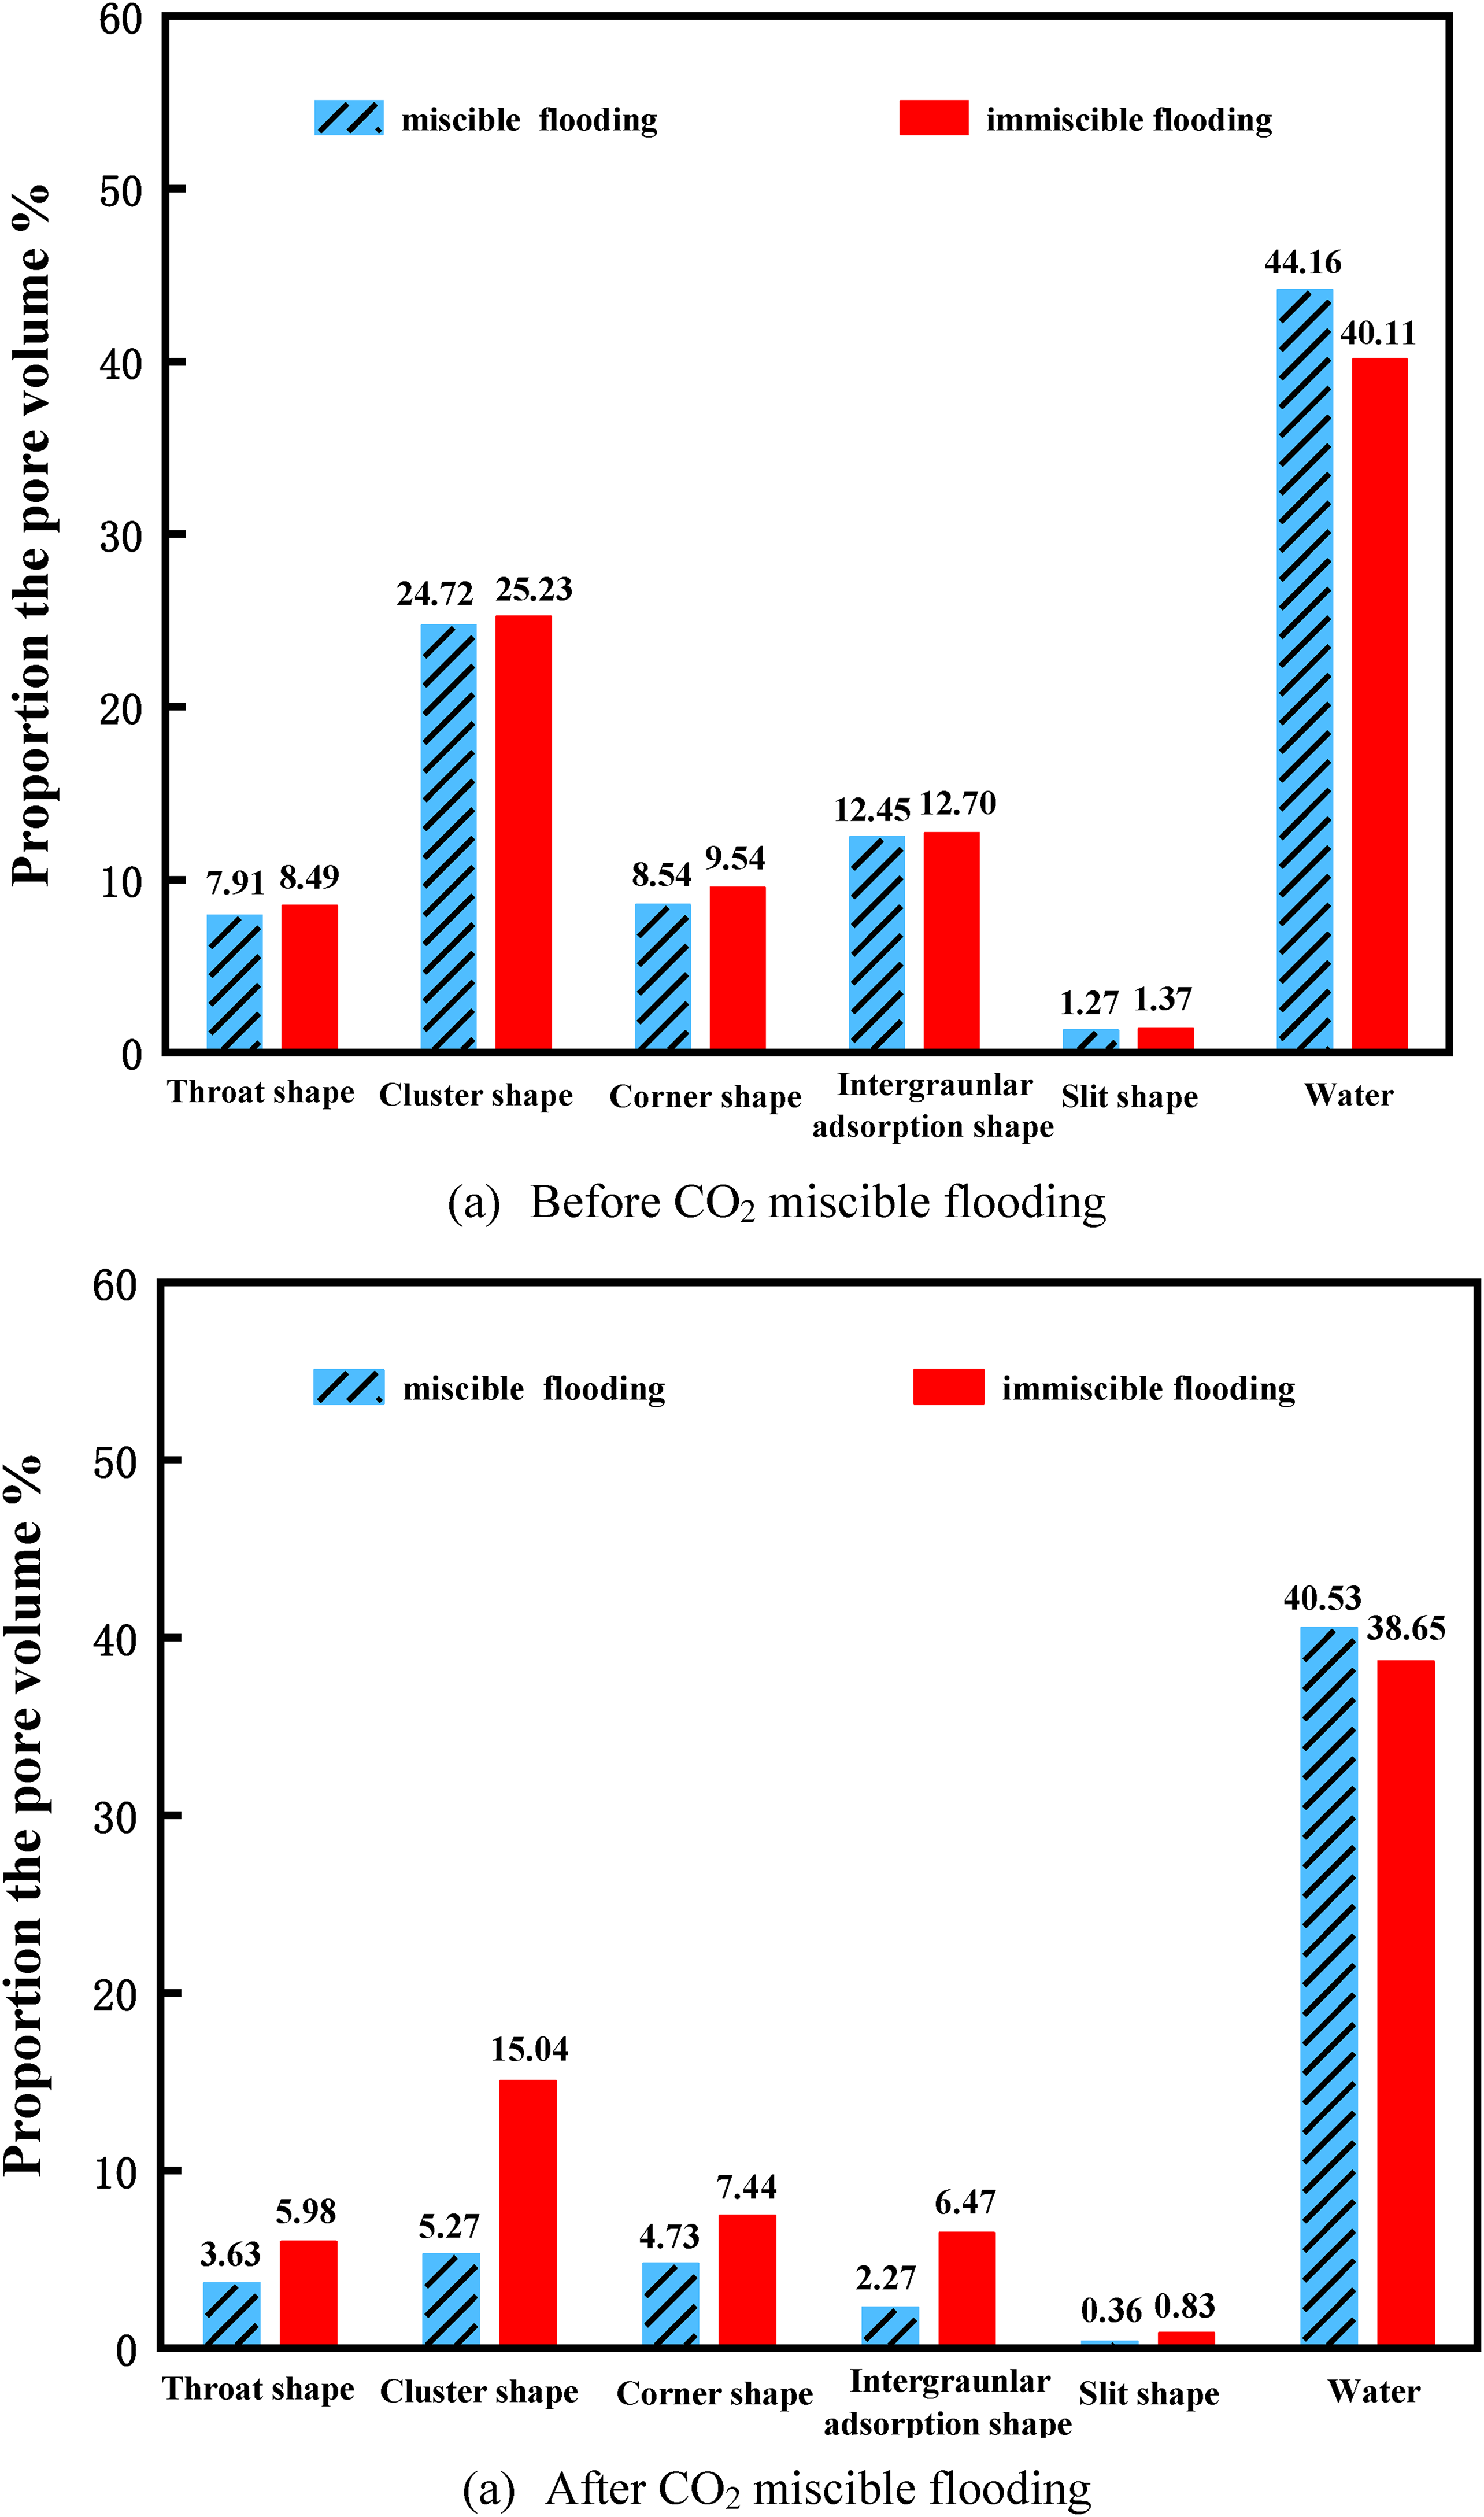
Statistics of the fluid occurrence state. (a) Before CO2 miscible flooding, (b) after CO2 miscible flooding.
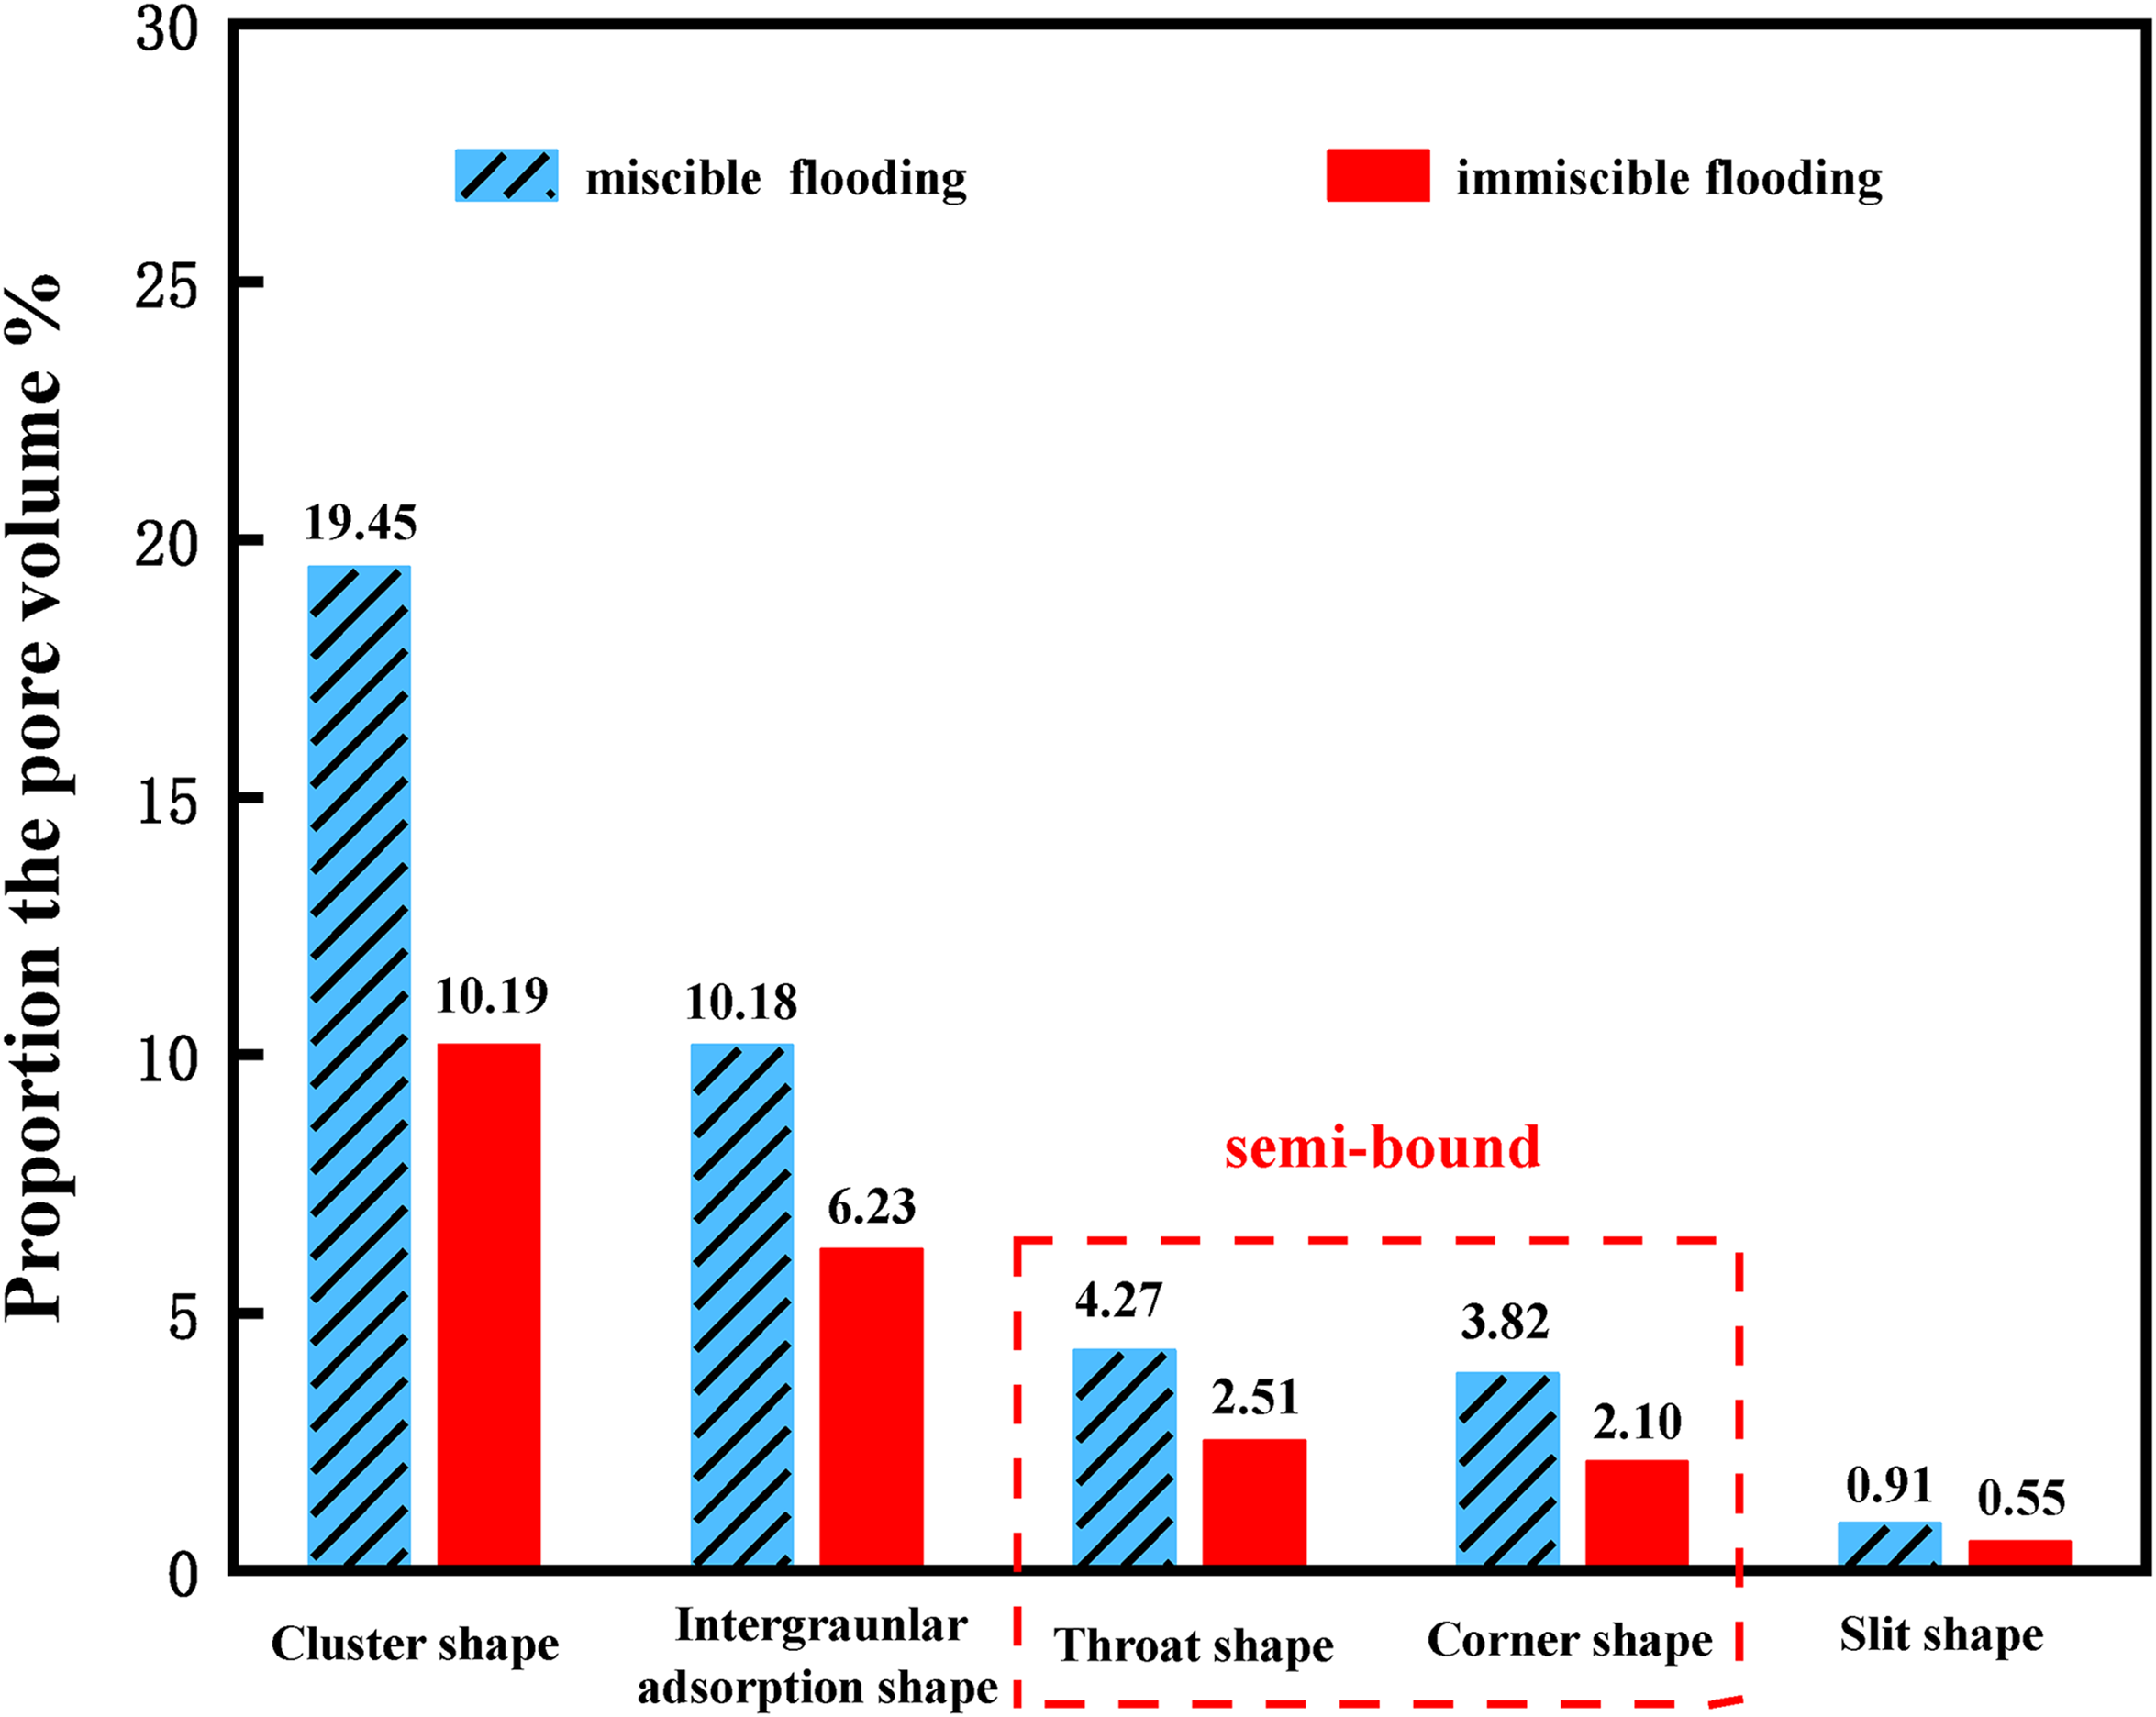
Proportion of different types of remaining oil after CO2 flooding.
Conclusions
In this article, we carried out CO2 miscible/immiscible flooding and the nuclear magnetic resonance (NMR) experiments on two low permeability samples to study the mechanism of CO2 displacement in ultralow permeability sandstone reservoirs. The difference in oil displacement efficiency, CO2 storage coefficient, and the lower limit of pore throat for CO2 miscible and immiscible flooding were analyzed. Furthermore, by combining the HPHT displacement equipment and the frozen pelleting technology, the distribution of the oil before and after CO2 miscible/immiscible flooding was analyzed. Based on the results and observations of the study, the following conclusions can be drawn.
For low permeability reservoirs, the gas breakthrough in CO2 miscible flooding is generally later than that in CO2 immiscible flooding, and the recovery of CO2 miscible flooding is 32.74%, which is higher than that of immiscible CO2 flooding. For both CO2 miscible and immiscible flooding, the pore with higher permeability is easier to produce, meanwhile, compared with immiscible flooding, CO2 miscible could produce more oil in low permeability pore, such as throat shape and corner shape.The lower limit of pore throat, where oil can be produced with CO2 miscible flooding, is 0.04 μm, which is smaller than that of Core FY-2 with CO2 immiscible flooding (0.08 μm). For the low permeability reservoirs, CO2 storage coefficient (0.834) of Core FY-1 with CO2 miscible displacement is greater than that (0.135) of Core FY-2 with CO2 immiscible flooding, which reveals that CO2 miscible flooding provides a better CO2 storage alternative.
Footnotes
Declaration of conflicting interests
The author(s) declared no potential conflicts of interest with respect to the research, authorship, and/or publication of this article.
Funding
The author(s) disclosed receipt of the following financial support for the research, authorship, and/or publication of this article: This project was supported by the National Natural Science Foundation of China (No. 52074250, No. 41802195).