
Abstract
The recent advances in the modern power grids, such as growing energy demand and penetration of higher amounts of distributed energy generators like renewable energy resources, caused additional grid integration challenges for the distributed energy system operators. Besides, deep electrification impacts triggered by a growing share of electric vehicles as additional electric loads made it essential for the distributed energy system operators to re-investigate their upgrade plans in terms of distributed energy system lines and corresponding infrastructure investments. An energy storage system offers the opportunity to use energy flexibly, resulting in deferring the inevitable upgrade costs of the distribution grid elements and increasing the power quality. In this study, a new method is proposed to extend the lifespan of distributed energy systems with an energy storage system and reduce line upgrade costs. The proposed method is tested on the IEEE-33 with different case studies. The findings of this study indicated that the investigated energy storage option has a positive impact on the distributed energy system components and assets in terms of extending their lifespan and helping to mitigate growing demand peaks because of the load increase. According to the results, the proposed method reduces the total cost by up to 66%. Furthermore, the power losses are reduced by an average of 34.8%, and the voltage profiles are improved with the energy storage system.
Keywords
Introduction
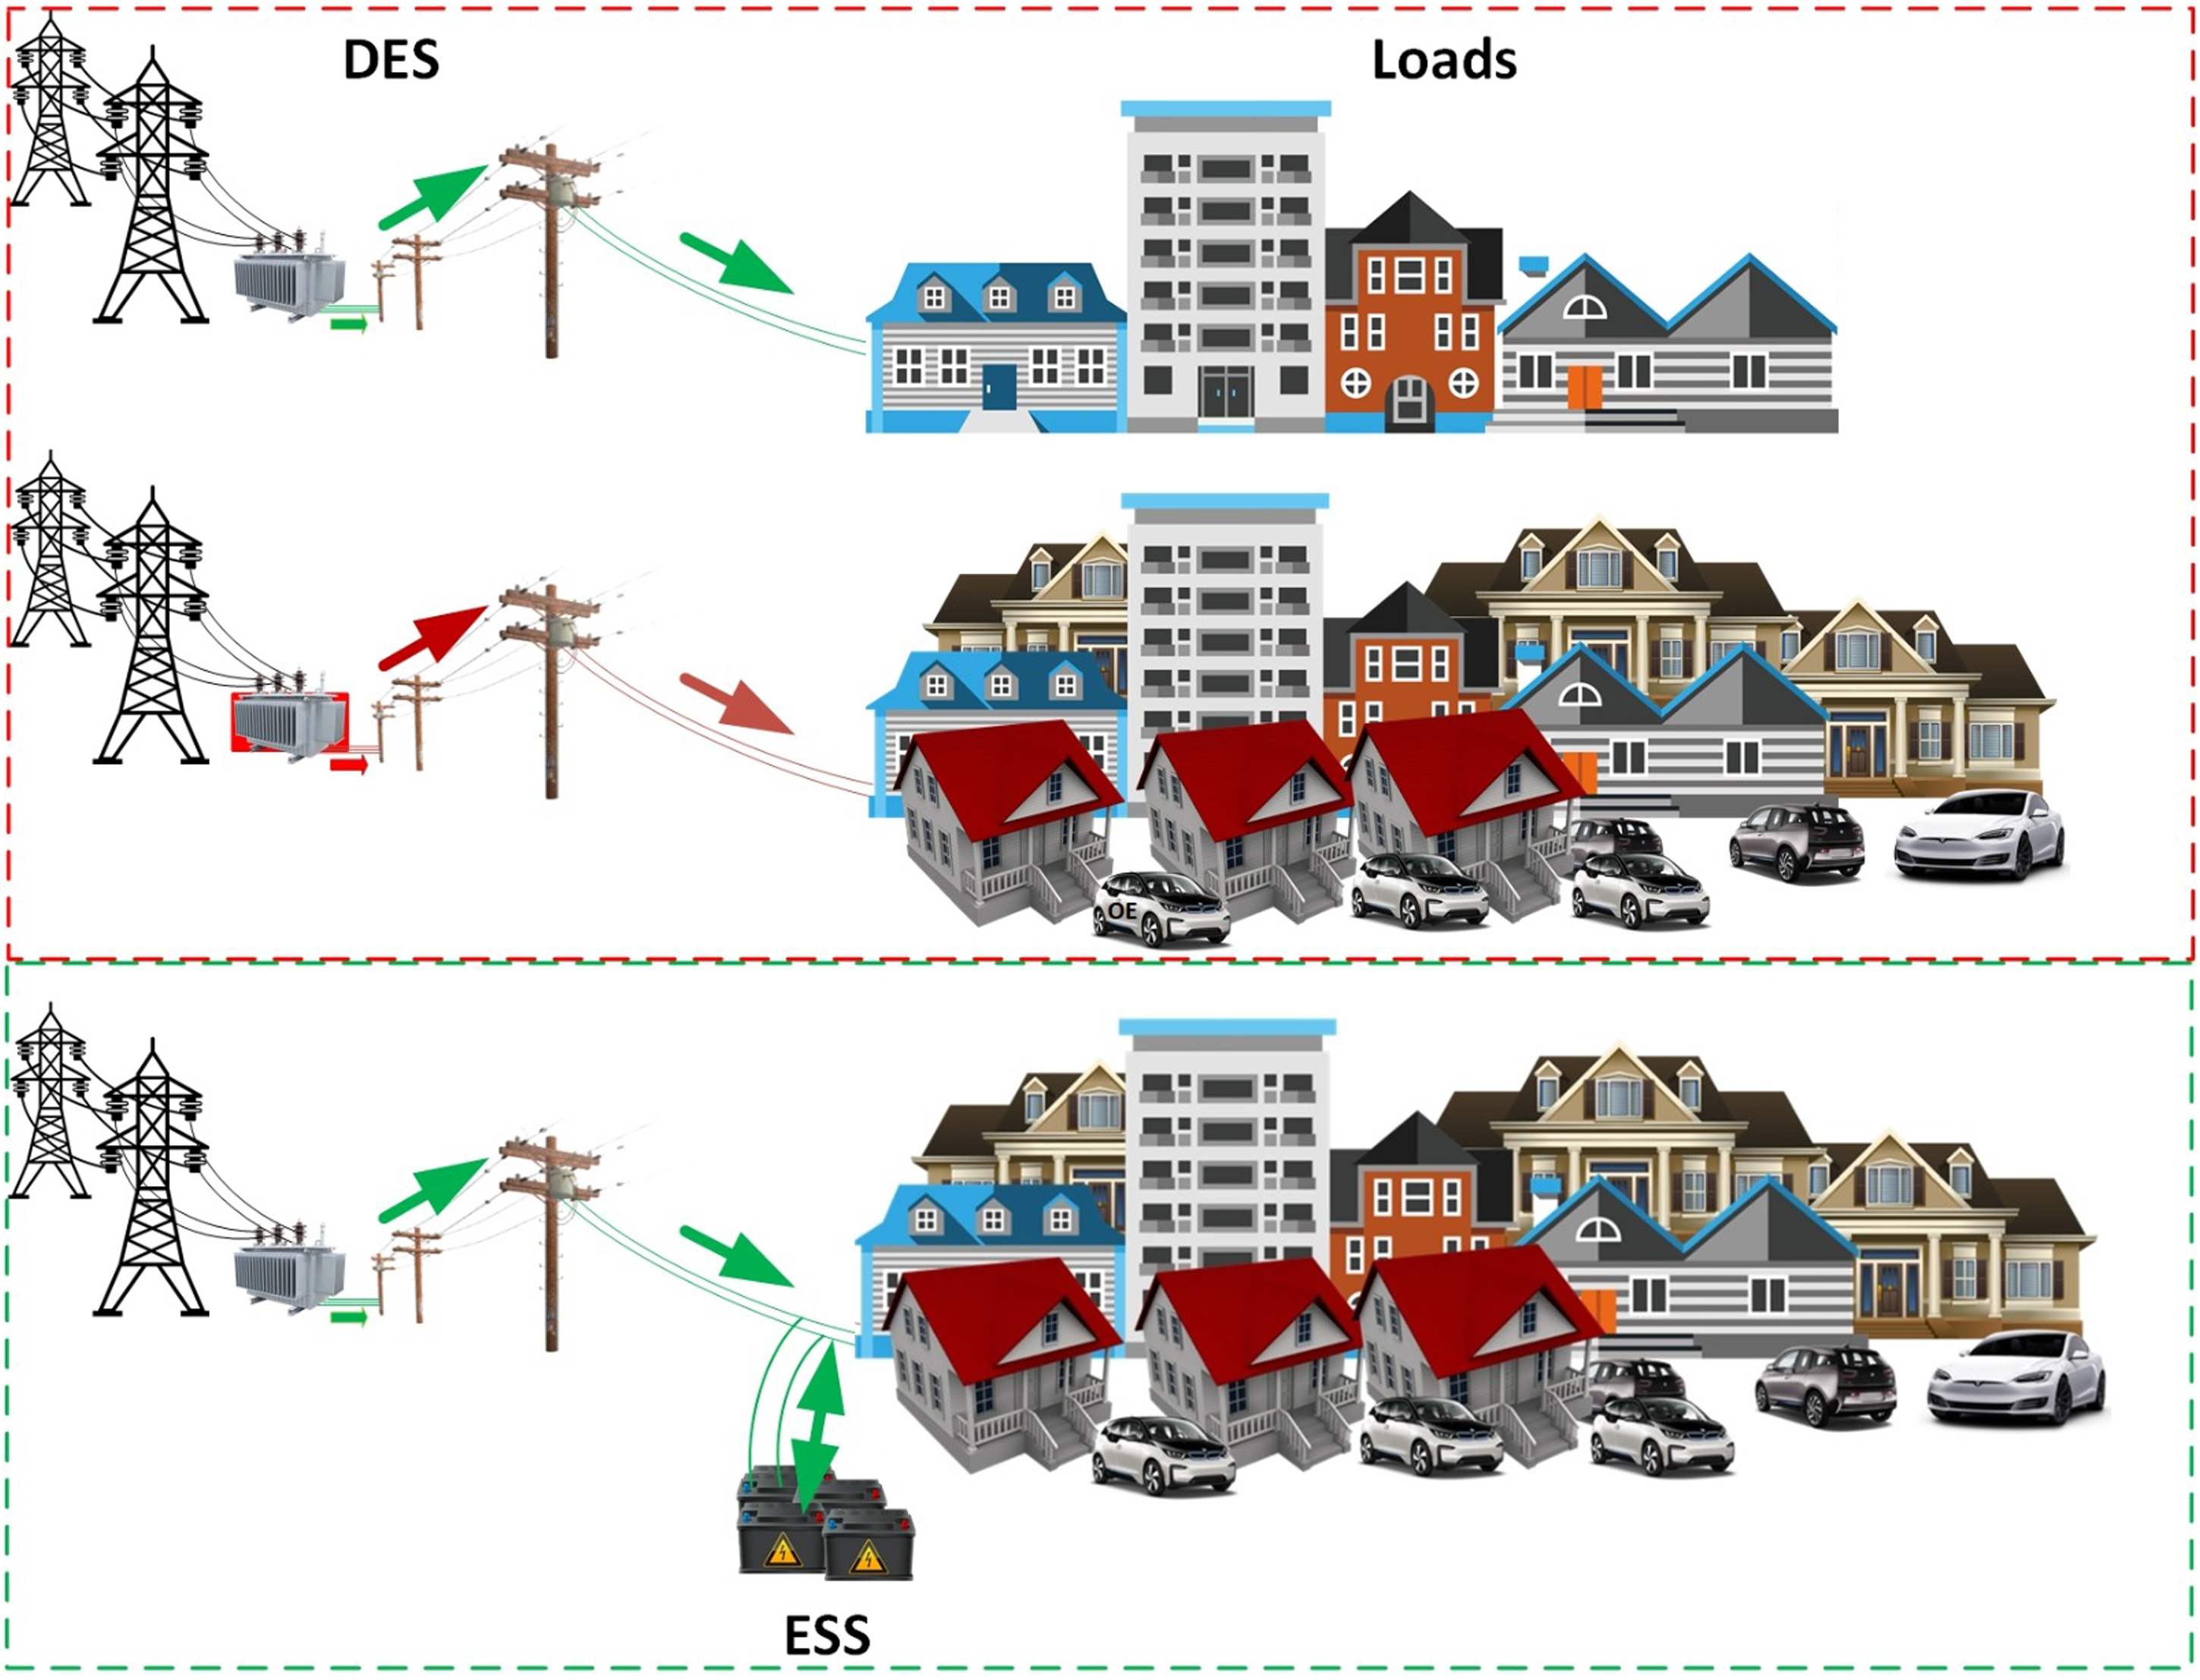
Expansion planning (EP) is crucial for the distribution system operator (DSO) and customers. EP may prevent overloading or over/under voltages in any parts of the distributed energy system (DES). The upgrading lines in DES may affect life in the affected community and create extra costs. Negative impacts during the upgrading of underground cables may significantly disrupt daily life, such as traffic interruptions and noise pollution. Some methods of EP consist of adding distributed generation (DG), load shedding, line upgrading, and installing a centralized or distributed energy storage system (ESS). ESSs are short-term and long-term solutions to control overloading, among other methods. The line upgrade cost (LUC) can be deferred by utilizing commercially existing ESS technologies. Therefore, the stored energy in the ESS can be discharged to the DES during peak time to keep the DES infrastructure capable of meeting the ongoing demand. Since the power taken from the grid decreases by using an ESS, the DES can meet peak demand without overloading. To reduce the peak load of the DES, the ESS stores energy from the grid when load demand is low and discharges to the DES when load demand is high (Bennett et al., 2015; Katsanevakis et al., 2019; Tant et al., 2013; Venu et al., 2009). A prosumer generates energy for its demand and the demand of neighbors and otherwise stores energy in the ESS. It permits a significant decrease in the power supply from the distribution substation in the DES (Fichera et al., 2020).
DES will face an annually increasing demand and the rapidly increasing electric vehicles (EVs) charging demand in upcoming years. Many local and state governments have already decided to prohibit internal combustion engine vehicles inside their cities. For example, California will not allow gasoline-powered vehicles to be sold inner the city after 2035. Moreover, the penetration of EVs cannot be predicted precisely; EV charging may overload DES sooner than expected. Overloading is a short-term event lasting about 1–4 h a day (Venu et al., 2009). However, overloading causes permanent damage, more power loss, extra voltage drop, and short or long energy outages. For instance, using an ESS in a DES may prevent possible energy outages (Tercan et al., 2018).
Besides many grid applications, ESSs are also suitable for EP. The ESS installation and operation costs may be reduced by using it for some auxiliary applications. For example, an ESS exchanges energy between peak and off-peak time. Energy bought at a low price by charging the ESS and sold at a high price by discharging the ESS to the DES decreases total cost due to the hourly varying electricity price in the energy market. This profit is called arbitrage revenue, which is naturally related to ESS usage. Many studies focus on locating and sizing of ESS for DESs to increase arbitrage revenues, reduce power losses (Fleischhacker et al., 2019; Hung et al., 2014; Jayasekara et al., 2016; Münderlein et al., 2019; Nick et al., 2018; Tant et al., 2013), and defer the DES upgrade (Awad et al., 2015, 2017).
EP of a DES with an ESS can reduce or shift the upgrade costs of the DES, such as distribution lines and transformers. EP with an ESS for the distribution network in MV reduces expansion costs by 22% if the distributed ESS and renewable energy source (RES) units are used. Saving EP costs in the worst-case is calculated by almost 50%, relying on the predictions of weather that cannot be accurately predicted over the long term (Müller et al., 2019). It compares predefined scenarios instead of load growth factor (LGF) and mainly focuses on medium voltage. The installation and operation costs and arbitrage revenues of ESS and the occupation costs of transmission lines are mathematically modeled. The results indicate that the DSO can reduce the upgrade cost of the DES using an ESS (Leou, 2012). The performance of ESS technologies is economically examined for the distribution substation transformer rated 30 MVA (Chacra et al., 2005). It is stated that polysulfide bromide batteries would be more cost-effective than vanadium redox (VR) batteries. The feasibility of an ESS installation project is defined according to the net present value (NPV). An investigation on DG is carried out for deferring the DES upgrade (Gil and Joos, 2006). The concern about an insufficient generation of DG without the ESS if the generation of RESs is less than expected is especially prominent during peak times. It is also stated that DG helps to reduce electricity bills. Making a profit by using an ESS in the DES can be described by deferral of LUC as a function of load increase, DG penetration, and peak shave (Deeba et al., 2016). In addition, this shows that the financial feasibility of using an ESS in the DES for deferring the upgrade increases as either the loading or the photovoltaic (PV) penetration increases. As a result, in the future, the LGF and expected PV penetration must be carefully considered to determine the financial viability of using an ESS in the DES to defer the upgrade cost. The EP of a DES with an ESS continues to become widespread. An EP is proposed to determine the location and size of the ESS for the distribution grid, which minimizes the total grid upgrade cost through genetic algorithm and dynamic programming (Celli et al., 2009). The cost of an ESS includes capital investment and operating costs. A multipurpose optimization reduces the LUC and the capital and O&M costs of DG units. It also minimizes energy losses and total emissions (Zidan et al., 2013). RES allocation methods considering ESS installations, DES reconfigurations, adding new connection switches can prevent energy outages affecting the customers connected to the fault lines (Meneses De Quevedo et al., 2015; Ravadanegh et al., 2017). However, installing new connection lines with switches may be expensive because underground cable installation requires available ground, and overhead lines are not permitted in many inner cities.
Improving bus voltages is another benefit of using an ESS in DES. An inverter-based strategy has been developed to improve bus voltage using an ESS (Kashem and Ledwich, 2007). The control strategy regulates bus voltages providing active and reactive power. The proposed technique is evaluated by simulation on a three-phase DES. It shows that the ESS improves the overall voltage profile and reduces energy not supplied (ENS) significantly (Saboori et al., 2015). EP of DES can prevent bus voltages from violating the margins and reduce the overloading of lines. RESs are increasingly connected to DESs in recent years due to their environmentally friendly power generation. Integration of RES with ESS is envisaged due to the intermittent nature of RES. The ESS is identified as one promising solution to mitigate PV intermittency and reduce the power from the grid (Xiong and Nour, 2019). The use of ESS to prevent reverse power flow and maximize distributed RES integration into DES is also examined (Purvins and Sumner, 2013). Selecting the low-cost ESS type makes the integration of ESS into DESs more economically feasible (Atwa and El-Saadany, 2010). Detailed information about ESS for RES integration to DES can be found in numerous studies (Agajie et al., 2020; Akinyele et al., 2017; Ata et al., 2019; Chen et al., 2009; Crampes and Trochet, 2019; Eyer and Corey, 2010; Larsen and Sauma, 2021).
There are seminal studies that focus on ESS application in the distribution grid. Some EP methods include adding new feeders or transformers to keep radiality, minimize outage time and investment cost, and grow energy trading benefits. These are time-consuming and comprehensive EP approaches. The proposed analytical method in this paper is based on upgrading existing lines and adding an ESS to DES in available places. The impact of ESS on EP alone is revealed considering only several parameters. Even though many studies deal with RES-integrated ESS use, few refer to the distribution grid upgrade. Nonetheless, a number of studies consider the distribution grids upgrades related analyses. However, the information regarding the location or segment of the lines and upgrade times was not mentioned in detail (Awad et al., 2014, 2015, 2017; Leou, 2012). This study primarily focuses on determining the lines to be upgraded individually with LGF for a grid model.
Battery degradation is not a well-known issue for battery-based ESSs. It depends on ambient temperature, depth of discharge, and the number of cycles. Even the degradation process is not well-known, though some studies have tried to consider the degradation of batteries technically in the optimization of EP. On the other hand, some studies consider EP without ESS degradation in the recent literature (Ansari et al., 2021; Larsen and Sauma, 2021; Saber et al., 2018; Trpovski et al., 2020; Tsianikas et al., 2021). The operational cost of the ESS may cover degradation resulting in capacity loss. This paper aims to find the economic effects of different ESSs on deferring LUC. The degradation process differs by ESS type. Thus, the explanation and evaluation of ESS type-dependent degradation are not included as they are beyond the scope of this paper.
The advantages of centralized and distributed ESSs in EP are discussed and evaluated to improve DN's power quality and investment and operation costs. In our study, ESS units are owned and operated by the DSO. Furthermore, the DES model and the load flow analysis (LFA) are implemented in PSS® Sincal software (Siemens, n.d.). The original contributions of this study are:
A new approach has been proposed to extend the lifespan of DES infrastructure using ESS deferring upgrade investments The investment payback period of ESS using a DES upgrade is examined The proposed method prevents DES from voltage violation and reduces the total costs of DES Simulations of ESS integration are performed based on the actual distribution grid model of the IEEE-33 bus The proposed method has been tested with different case studies, including centralized-distributed and different types of ESS The economic feasibility of ESS for different battery types has been examined.
The remainder of the study is organized as follows. First, the methodology of EP of DES with an ESS is introduced using mathematical equations in the next part. Then, the modeling of DES and ESS are described in system modeling with details. Then, case studies and results are given together. After detailed results of the technical analyses, the feasibility of EP with ESS is discussed in discussion and managerial suggestions. Finally, the last part consists of the concluding remarks.
Methodology
EP of DES with an ESS decreases the number of upgraded lines and defers the LUC. The methodology of EP with an ESS is described in Figure 1. Increasing loads in number and size alongside the rapid integration of EV charging loads cause the unavailability of DES infrastructure. Instead of upgrading lines that exceed the thermal limit after certain years, installing an ESS into the DES can reduce the number of lines to be upgraded and extend the DES lifespan. Exceeding the thermal limit of lines in the DES is determined by peak loading conditions. Line upgrade decisions are based on extreme power flows, especially peak load states (Awad et al., 2015). In other words, any component of the DES, such as line, transformer, etc., has a current above the nominal ampacity to be upgraded in the EP. Thus, it is sufficient that LFA is run only for peak conditions to determine the EP of the DES. If peak loading can be decreased by using an ESS, lines keep serving the DSO and customers. Therefore, LFA should be repeated during every planning stage, considering the annual LGF. First, the overloading of lines by LFA with the LGF for each stage without the ESS is determined. Then the result is used to compare LUC after deferring upgrade with ESS. Finally, the LUC of each line is calculated and normalized to the beginning of the planning stage.
A general overview of EP of DES with ESS.
The three-phase AC power flow formulations are given in equations (1)–(7). First, overloading lines are determined without ESS. Second, after installing the ESS to specific buses in the DES, overloading lines for each case are determined again. In every case, the LFA is repeated for the number of planning years. Third, EP is analyzed for centralized and distributed ESS. LFA is made with the following equations.


The overloading of line i is described by a constraint in equation (5). The thermal current limit of line
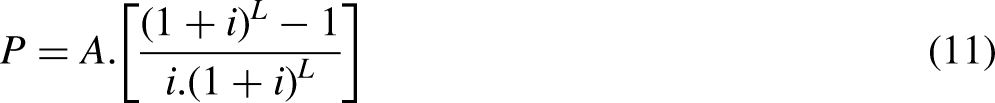
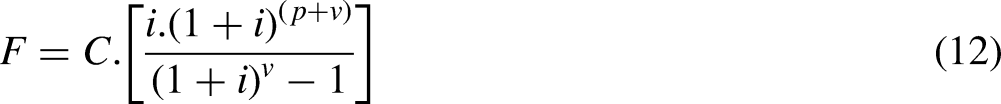

The LUC of DES is calculated using equations (11)–(13) and deferring LUC with an ESS is described as follows, given in Figure 2. Distribution grid parameters such as line and load data are entered, and the LFA is run for stage t = 0 without an ESS. Any line with a load above the thermal limit is recorded in the EP stage in the first LFA. Then t is increased by 1, and loads are increased by LGF. LFA is repeated until the planning stage year, t = L. Line upgrade is carried out by adding a new line and transformer parallel to existing ones. In the results of all following LFA, the NPV of LUC of all recorded lines in the EP is calculated at the end of the planning stages. This calculation includes only LUC, not any ESS. EP cost without an ESS is determined to compare EP with an ESS.
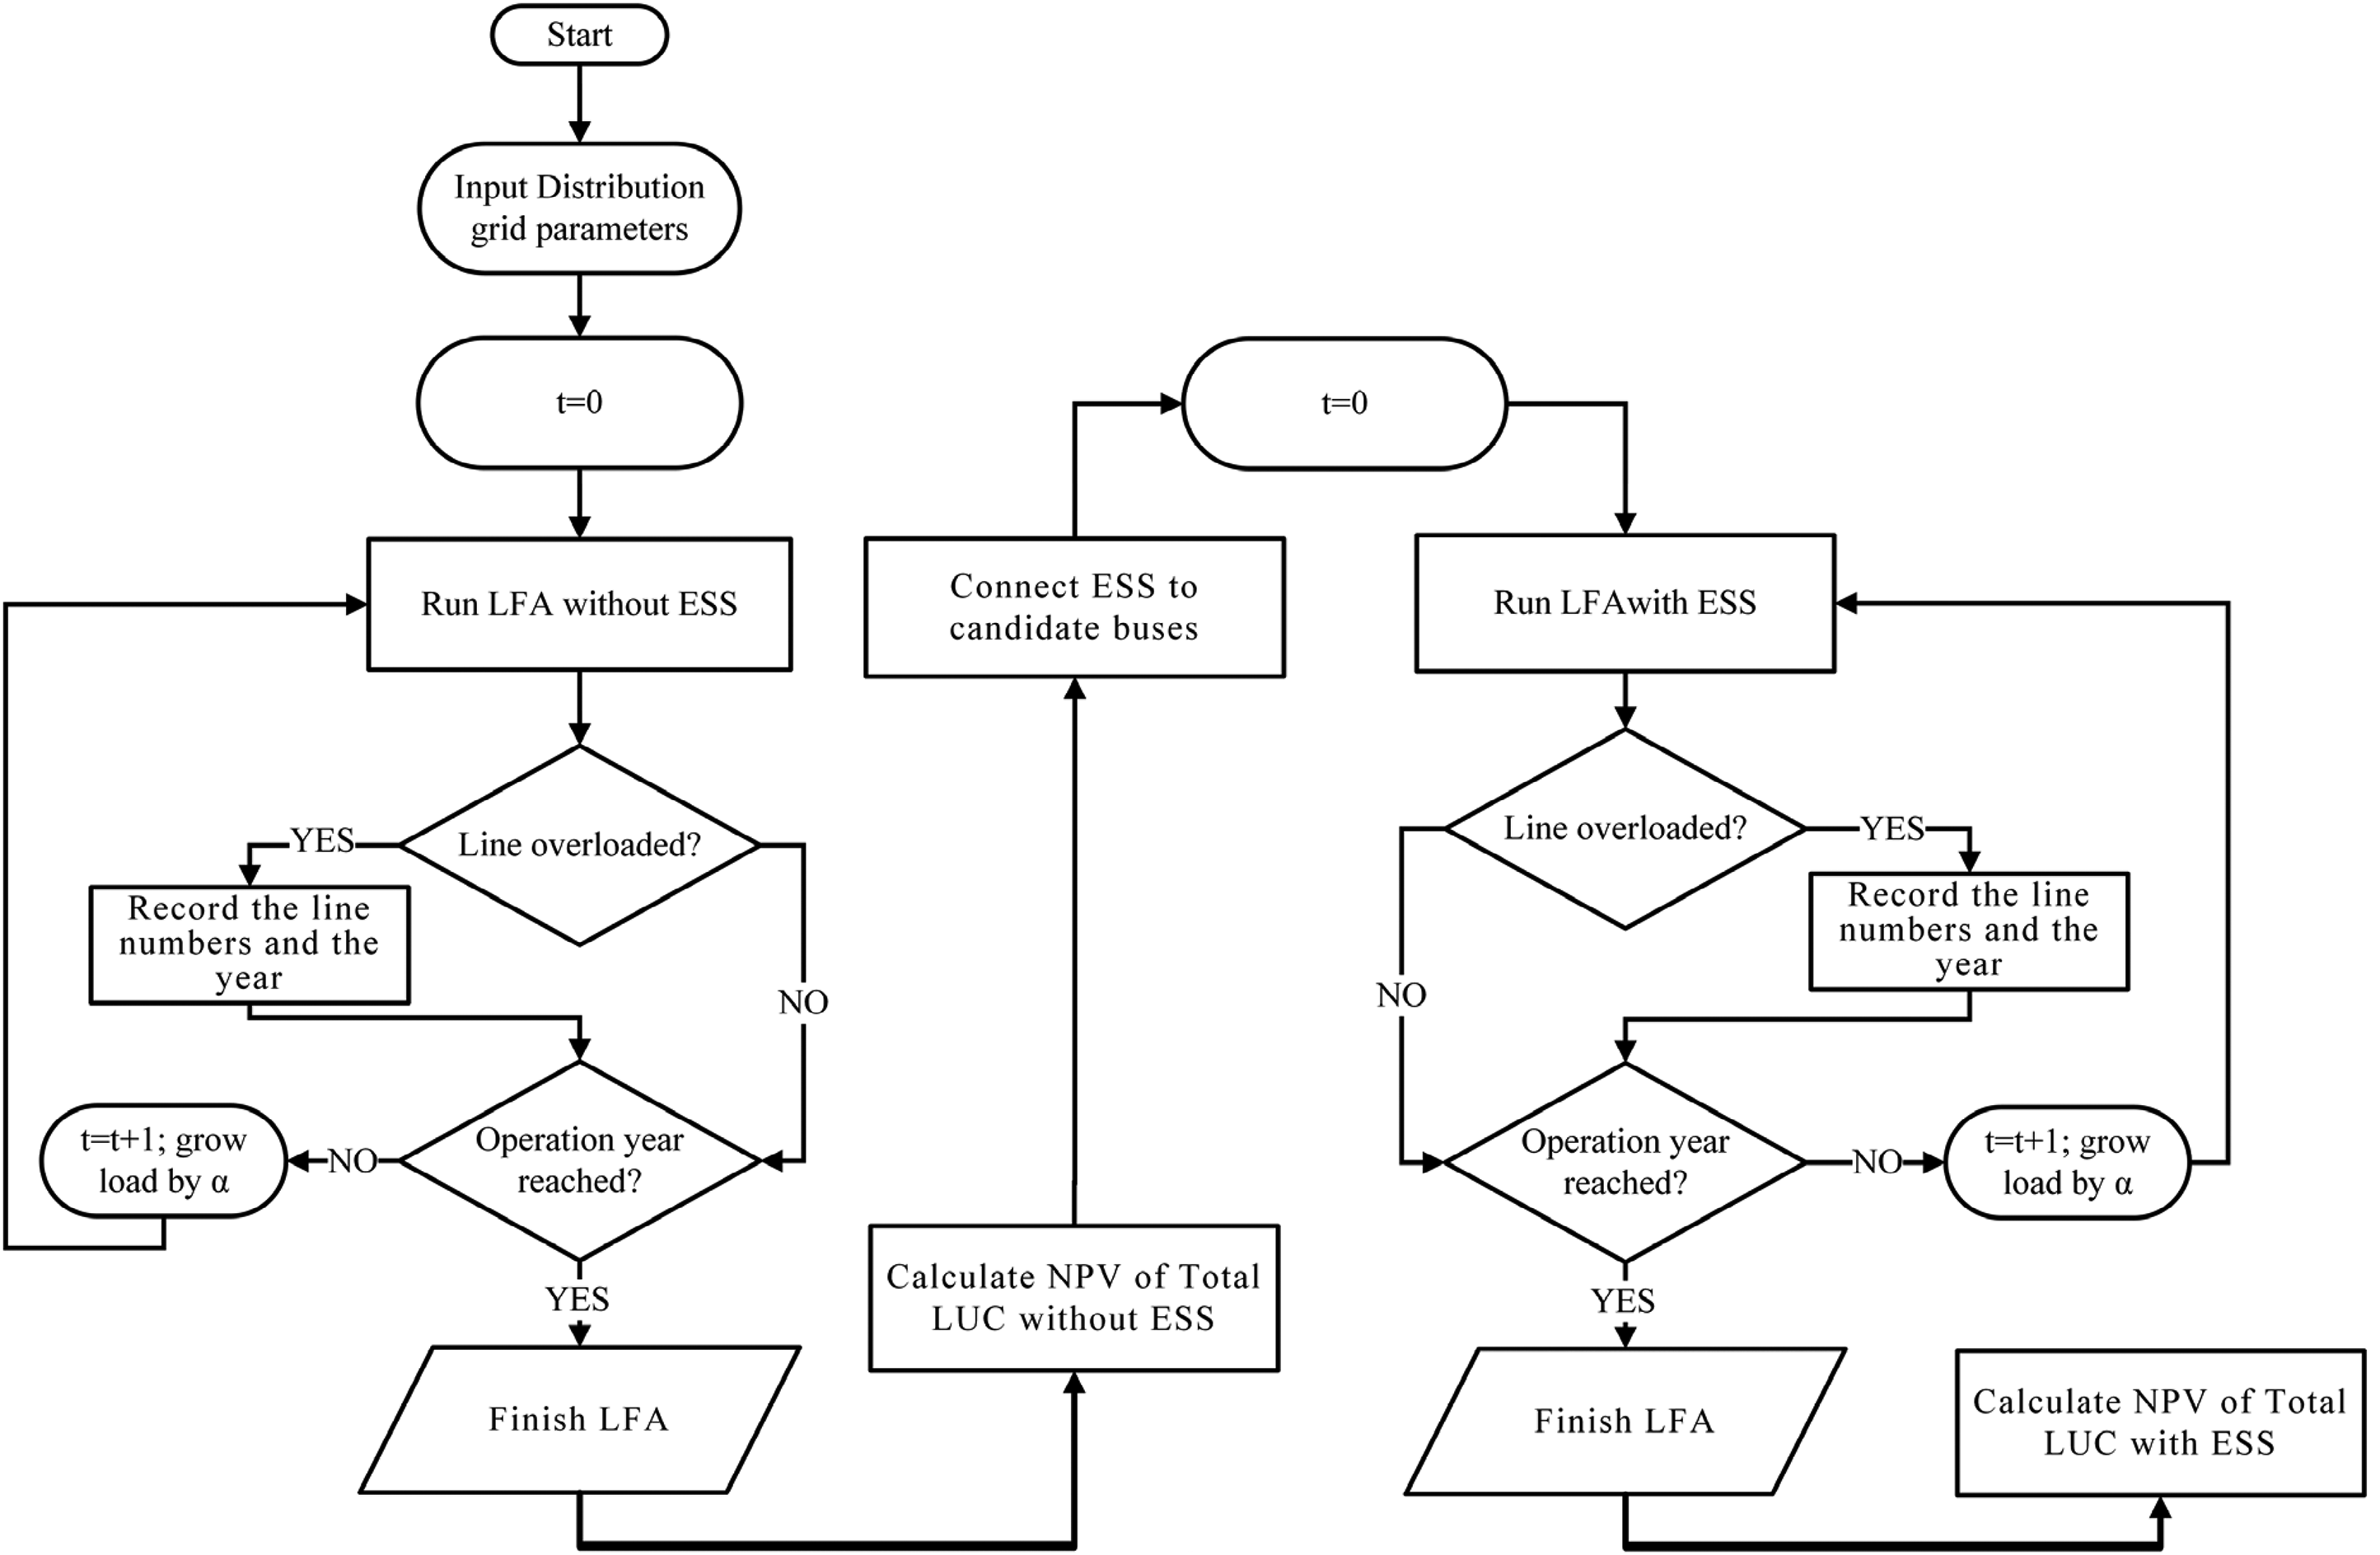
The flowchart of EP of DES with ESS.
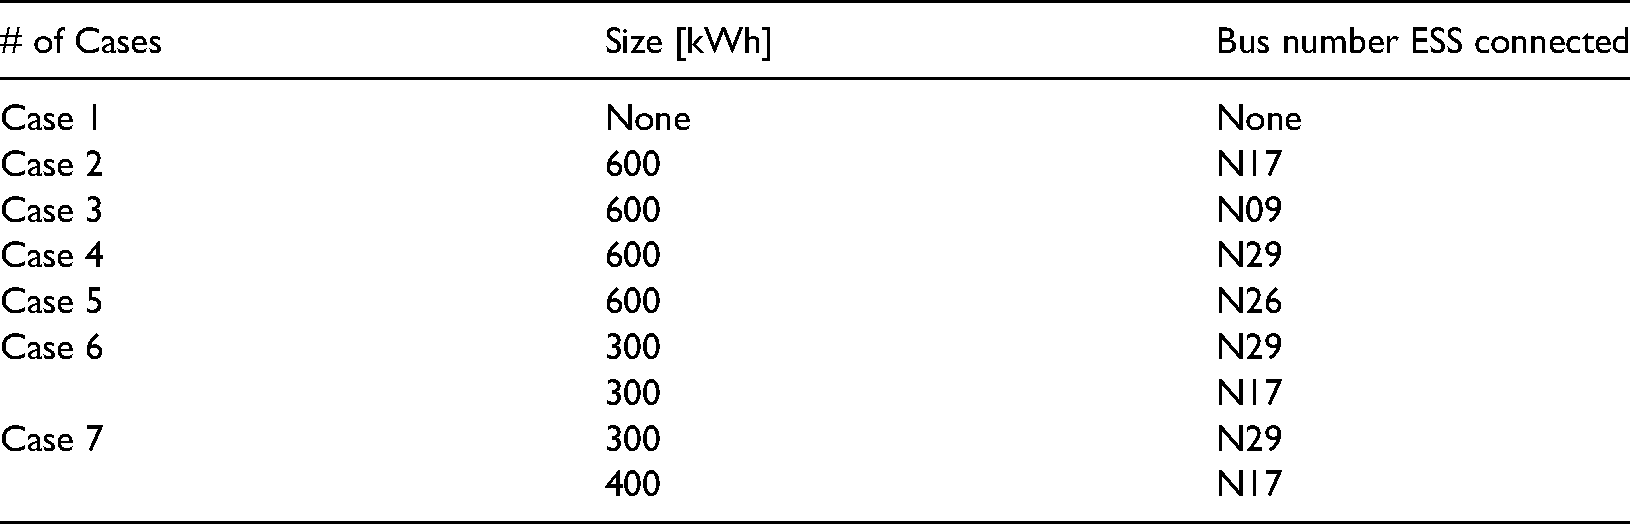
On the other hand, candidate buses for ESS connection are identified as having the following features: 1-Near heavily loaded lines, 2-Far away from the substation, or 3-More voltage drop. LFA with ESSs starts to connect an ESS to each candidate bus for each case given in Table 1. LFA is run for stage t = 0 with an ESS. In the first LFA with an ESS, any line with a load above the thermal limit is recorded in the EP stage. Then t is increased by 1, and loads are increased by LGF. LFA with an ESS is repeated until the planning stage year t = L. In the results of all following LFA with an ESS, the NPV of LUC of all recorded lines in the EP and ESS investment costs are calculated at the end of the planning stages. This calculation includes both LUC and ESSs.
Size and connection bus of ESS units.
Load forecasting
Distribution networks in developing countries have higher LGF than in well-developed countries. For example, Ethiopia's load forecasting for 2013–2028 indicates the average LGF is 13.95% (Agajie et al., 2020). Thus, the LGF is determined as constant for load forecasting. Even though many studies are focused on load forecasting, the main objective is to balance renewable generation and consumption in the day-ahead market (Haupt et al., 2017). In our study, the LGF (α) representing well-developed countries is considered constant to highlight the benefit of ESS investment more clearly (Eyer and Corey, 2010; HassanzadehFard and Jalilian, 2018; Haupt et al., 2017). Equation (14) is used to calculate the load for the desired year (m).
System modeling
Modeling of a DES with an ESS includes distribution lines, loads, and ESS units. First, the modeling of the distribution grid is described, and then the modeling of the ESS is explained.
Modeling of distribution grid
EP evaluation with different sizes and locations of ESS in the DES is analyzed on the IEEE-33 bus model in Figure 3. It is suitable for DES analyses because it has several branches and a radial network structure similar to the DES (Baran and Wu, 1989). Bus numbers are shown in the figure above the black dots, and line numbers are shown below the lines with tags starting with the letter L, e.g., “L28”. Information about the model is given in Table 2.
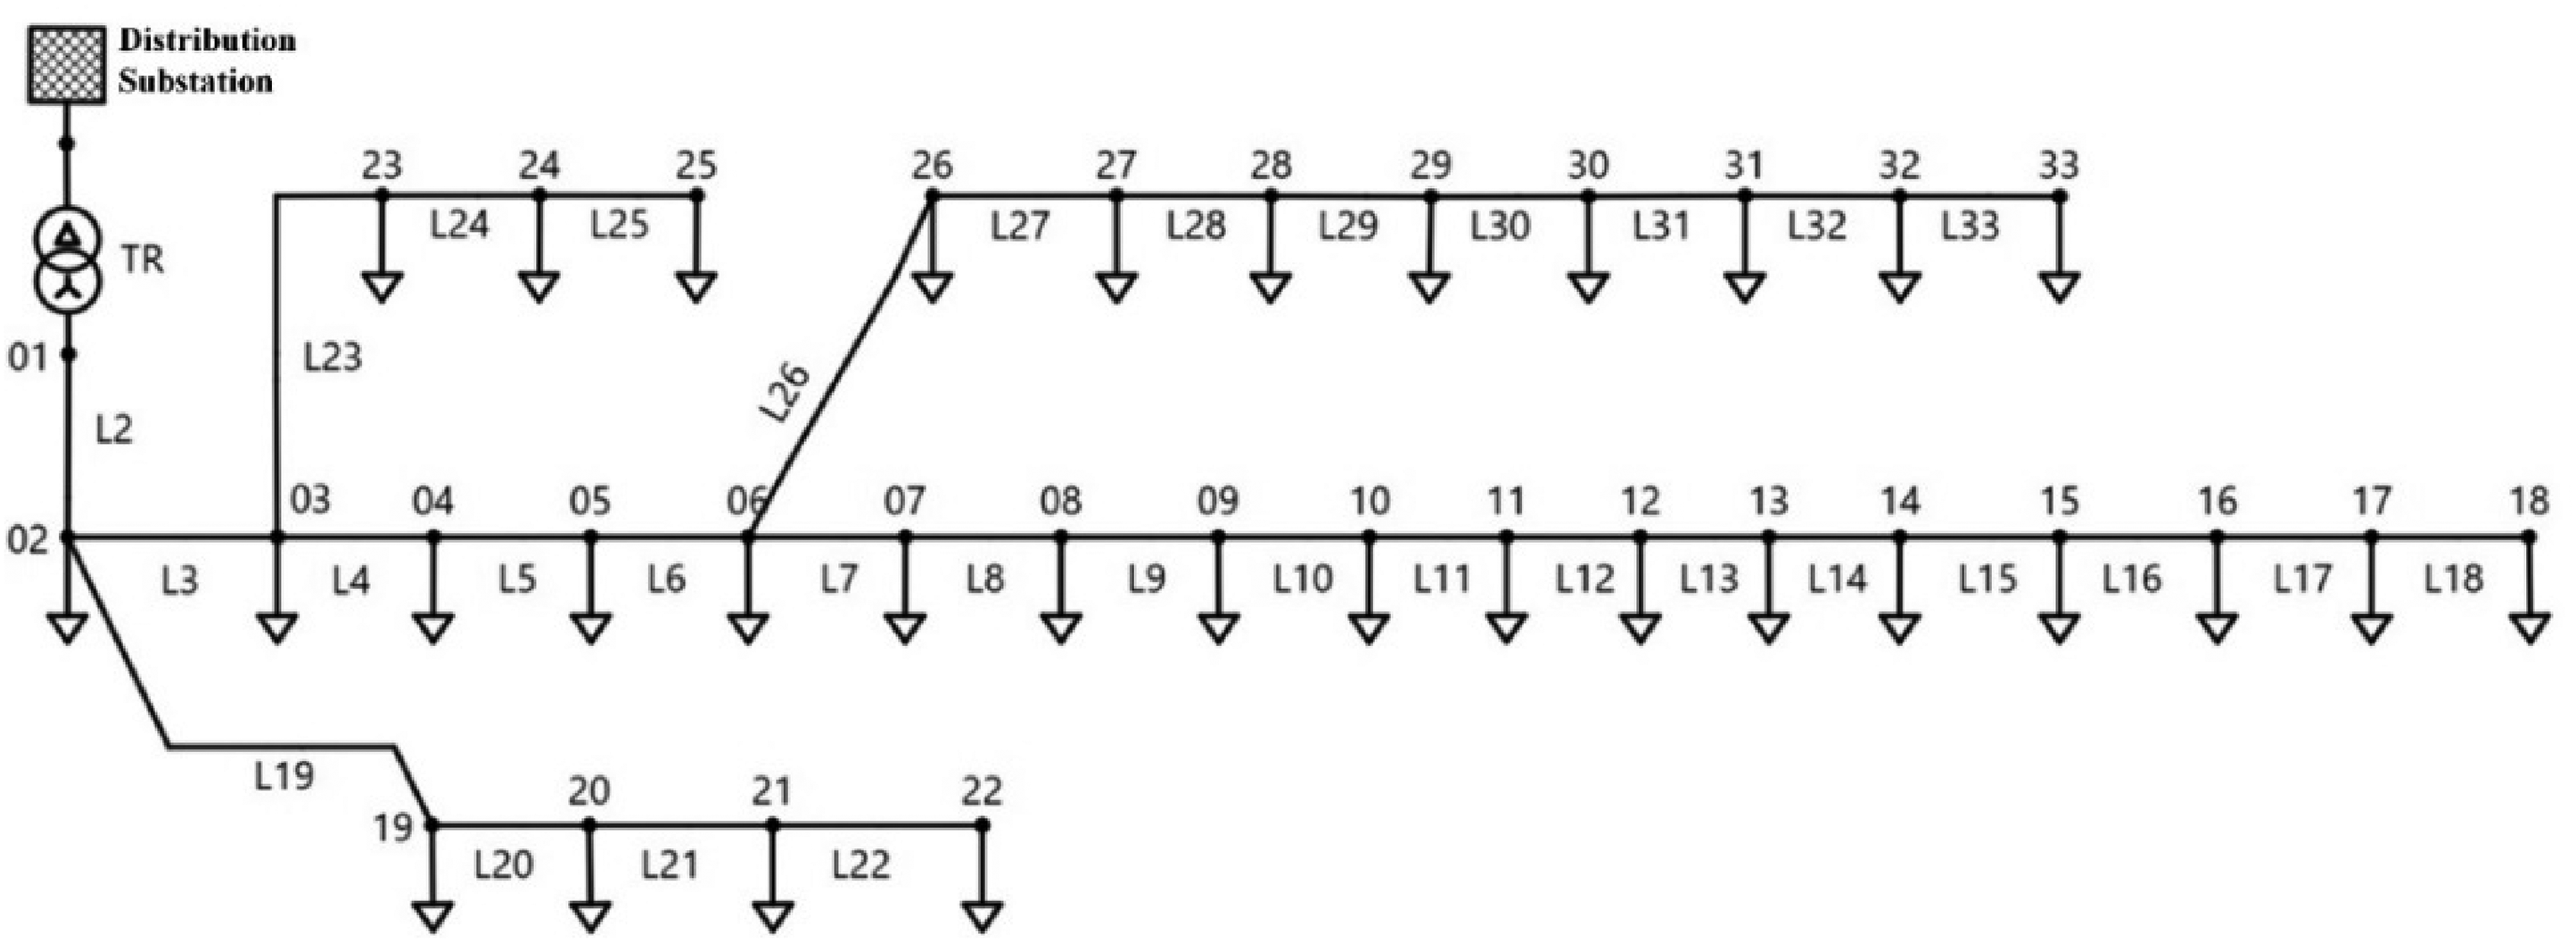
Single-line of the DES.
Information about loads and lines in DES.
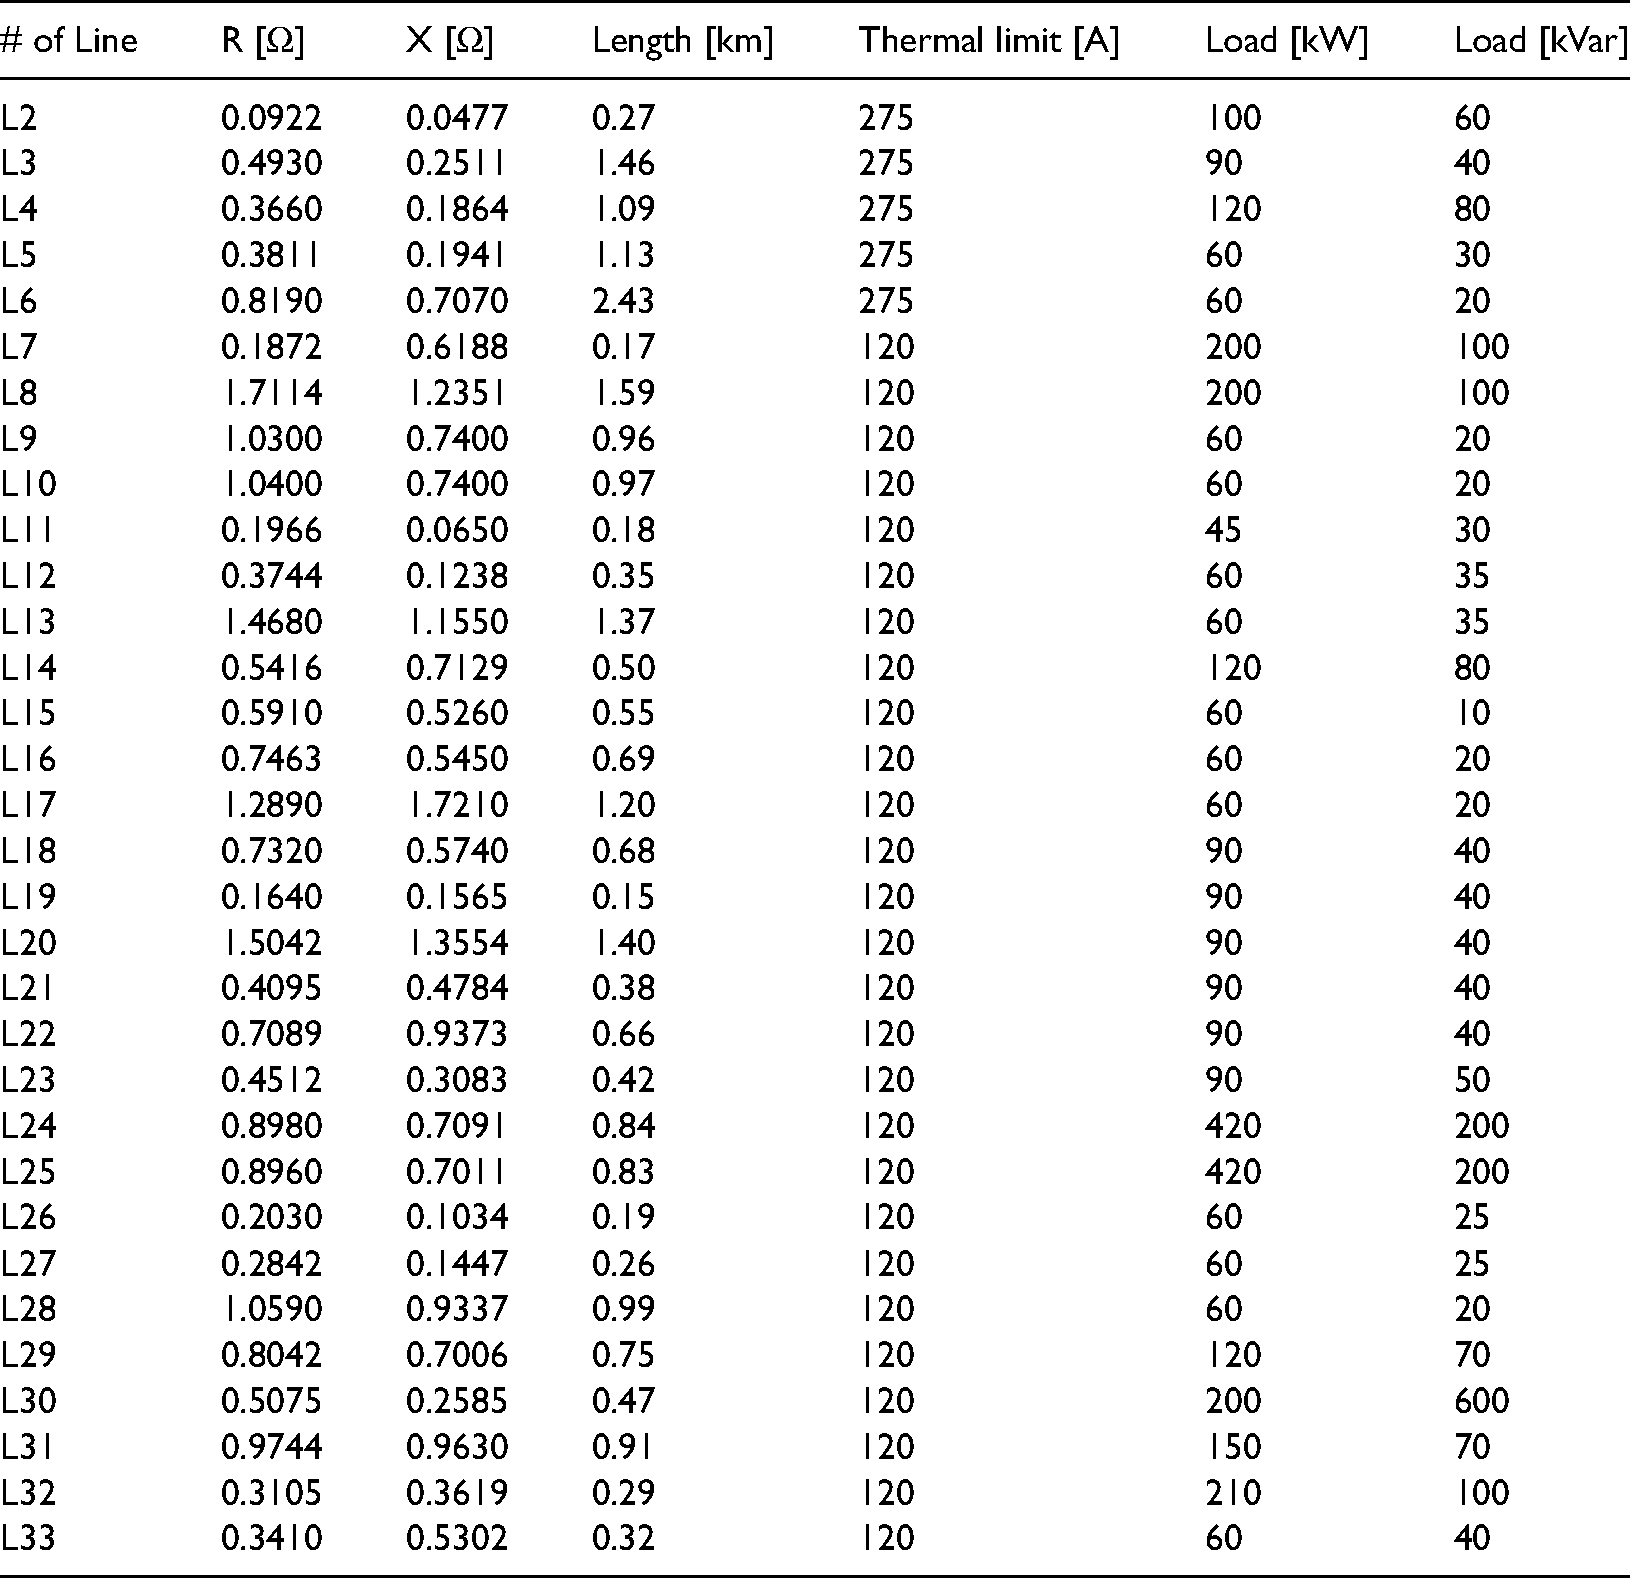
For precise EP evaluation with an ESS, distribution lines in the model are divided into two categories. The main lines are severely loaded, and the minor lines are slightly loaded. Main lines are assumed to have pigeon conductors, and minor lines are assumed to have swallow conductors. They have 275 A and 120 A thermal current limits, respectively. These limits are used to illustrate the comparative overloading of lines and LUC. Namely, L2, L3, L4, L5, and L6 are assumed as main lines and as pigeon, which its limit is 275 A since they have loads more than others. The other line's limit is 120 A. If a line has a current more than these limits, the line is assumed to be overloaded. Line lengths are calculated considering the resistance 0.3366 Ω/km for pigeon and 1.0742 Ω/km for swallow and given in Table 2. The longest line is L6, which has 2.43 km in length. L19 is the shortest line as the length is only 170 m. The largest loads showing in Table 2 are connected to buses 24 and 25, 420 + j200 kVA. The most loaded line is L2.
Modeling of ESS
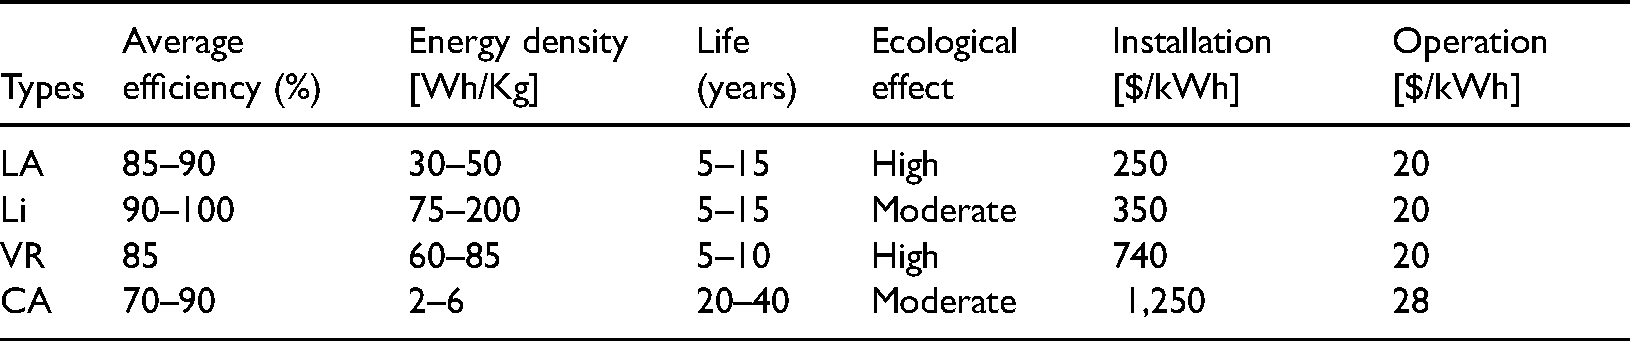
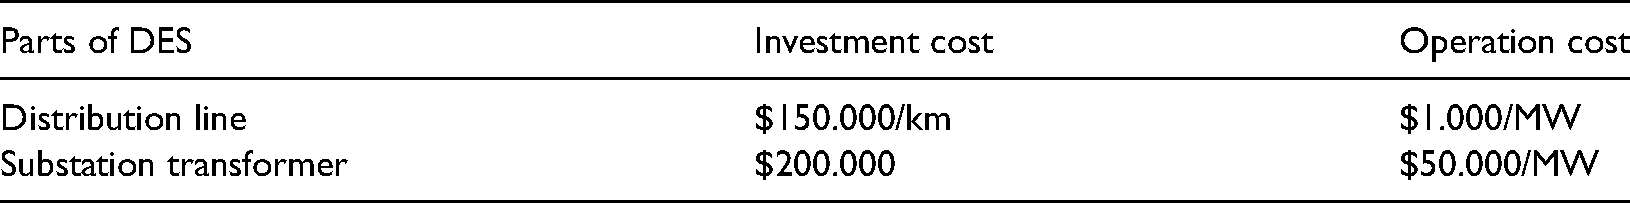
The recent developments in ESS offer new possibilities, including grid support in different manners such as load shifting (Shen et al., 2017; Yang et al., 2011), power quality (Hoffman et al., 2010), smoothing power generation of RESs (Sheibani et al., 2018), and power loss reduction (Ghosh et al., 2010; Lazzeroni and Repetto, 2019). The commercial types of ESSs used in the EP of the DES in this paper are lead-acid (LA), lithium-ion (Li), VR, and compressed air (CA). Some parameters of these types are given in Table 3 (Sheibani et al., 2018). There are many ESS types, but considering the impending increasing attraction to EVs, EV batteries’ second use will be more available, cheaply, and in number. However, after 5–8 years of service in EV, the batteries are insufficient for the power and energy need (Viswanathan and Kintner-Meyer, 2011). The state of energy (SoE) of ESS is given in equation (15). SoE is kept between 20–80% for all ESS units to avoid more age effects, given in equation (16) (Cho et al., 2019).


Parameters about different types of ESS.
In this study, the ESS charge is controlled by Sincal. When the bus voltage that the ESS is connected to is above the limit
LA type ESSs are widely used because installation and operational costs are very competitive among other types. Li is a preferable ESS option for grid applications, with the increasing popularity of EVs having massive-sized Li. A long cycle-life and low operational cost make Li a new challenging type of storage. Comprehensive performance and grid-scale applications of VR make it a good ESS prospect in the DES application, although expensive investment costs (Gong et al., 2020). CA investment cost is much higher than other ESS types, while its life expectancy is longer than various ESS types (Jabbari Ghadi et al., 2020). Since CA utilization in DES has certain benefits, it is investigated in this paper. Information about the installation and operational costs of different types of ESS is given in Table 3.
Case studies
The case studies were designed to include centralized and distributed ESSs. LFA is used to show the loading of the DES lines exceeding the limit. Every year in the LFA, all loads were increased by α. In the LFA, the LGF was 3%. In the first case, LFA was run without ESS. Thus, case 1 is the base case used for comparison. According to the flowchart, the candidate bus numbers are N09, N17, N26, and N29. In case 2, ESS was connected to the bus N17, which is more loaded and distant from the substation and has the most voltage drop. In cases 3, 4, and 5, ESS with the same size in case 2 connected to bus N09, N29, and N26, respectively. Cases 2–5 have a centralized ESS. Thus, only one ESS with the same size is connected to different candidate buses. Cases 6 and 7 have distributed ESSs. In case 6, the half-size ESSs were connected to two buses, N29 and N17. In case 7, to show the impact of different ESS sizes on the DES, the ESS size connected to N17 was increased by 100 kWh. Namely, the 300 kWh ESS was connected to N29, and the 400 kWh ESS was connected to N17. The difference between cases 6–7 is described in detail in the following section. According to the first LFA without an ESS, the first overloaded line is L26, and the peak load for the first year is 920 + j950 kVA. The ESS is placed between N26–N33. The second overloaded line is L7 without an ESS, the peak load for the first year is 1,075 + j510 kVA, and another ESS placement is between N07–N18. Considering the ESS investment cost, EP with 600 kWh ESS makes the penetration level 55% for cases 2 and 3, 65% for cases 4 and 5, 60% for case 6, and 70% for case 7. All cases’ battery penetrations have been kept above 50%, and size is iteratively increased like in previous studies (Akram et al., 2018; Awad et al., 2014, 2015). Further, the total losses of the DES in each case are evaluated.
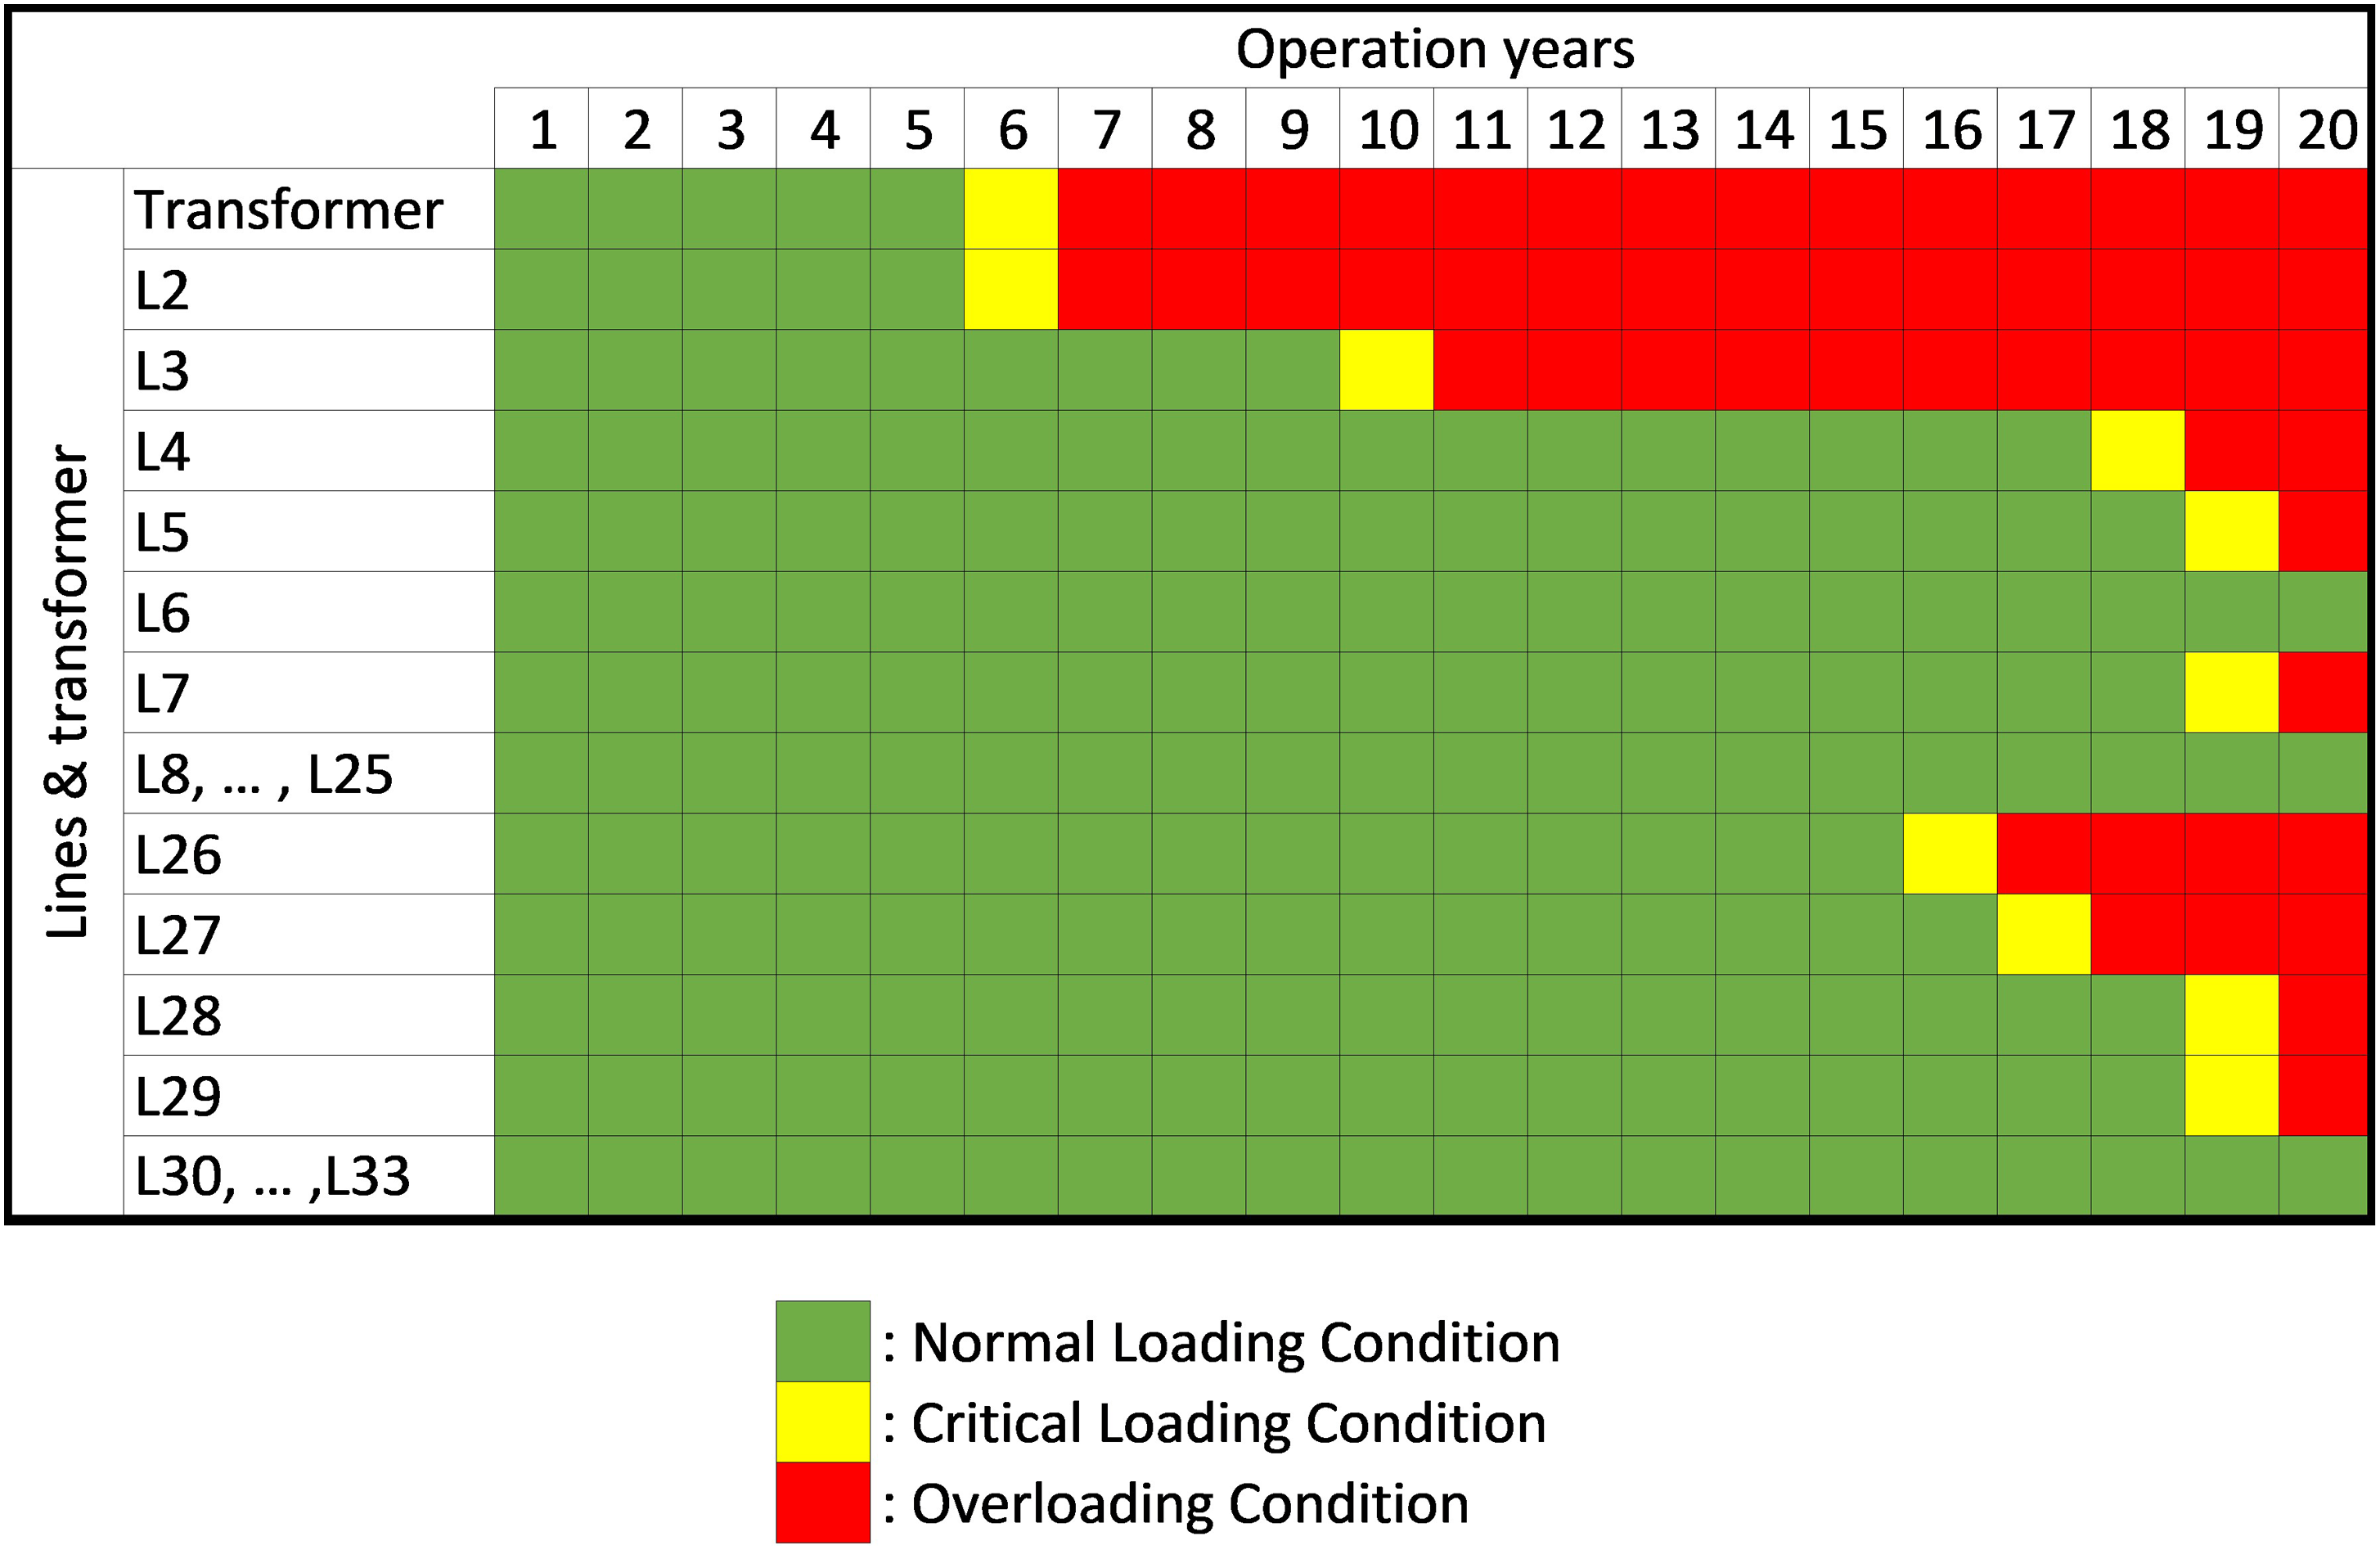
In the EP, loading conditions of DES are described as normal, critical, or overloading in Figure 4. Some lines do not need to upgrade, although annually increasing loads. Some lines need to upgrade after a specific year. For example, the line L2 will be unavailable to carry load demand after six years of operation in case 1, and a new line with the same characteristic as L2 should be added to L2 in parallel. Meanwhile, lines through L8–L25 do not need to upgrade in the whole EP stage. The upgrade years of overloaded lines for all cases are listed in Table 4. There is no need to upgrade any line in the first six years in case 1. However, in the 7th year, L02 is overloaded where the thermal limit of the line is reached. After four years of operation with the LGF, another line L03 needs to upgrade while the loading of L02 reaches 115% above the thermal limit. The third line that needs upgrade is L26, which is overloaded in the 17th year, ten years after the first overloaded line. L27 needs to upgrade after one year of the upgrade of L26. Then L04 and L07 need to upgrade one year later, and L05, L28, and L29 need to upgrade at the end of 20 years of operation. The distribution transformer of the system also needs to upgrade in each case, together with the first upgraded line. Hence, the distribution transformer is not shown in Table 4, but it is at each case.
Line loading conditions in case 1.
The years and the line numbers of upgraded lines.
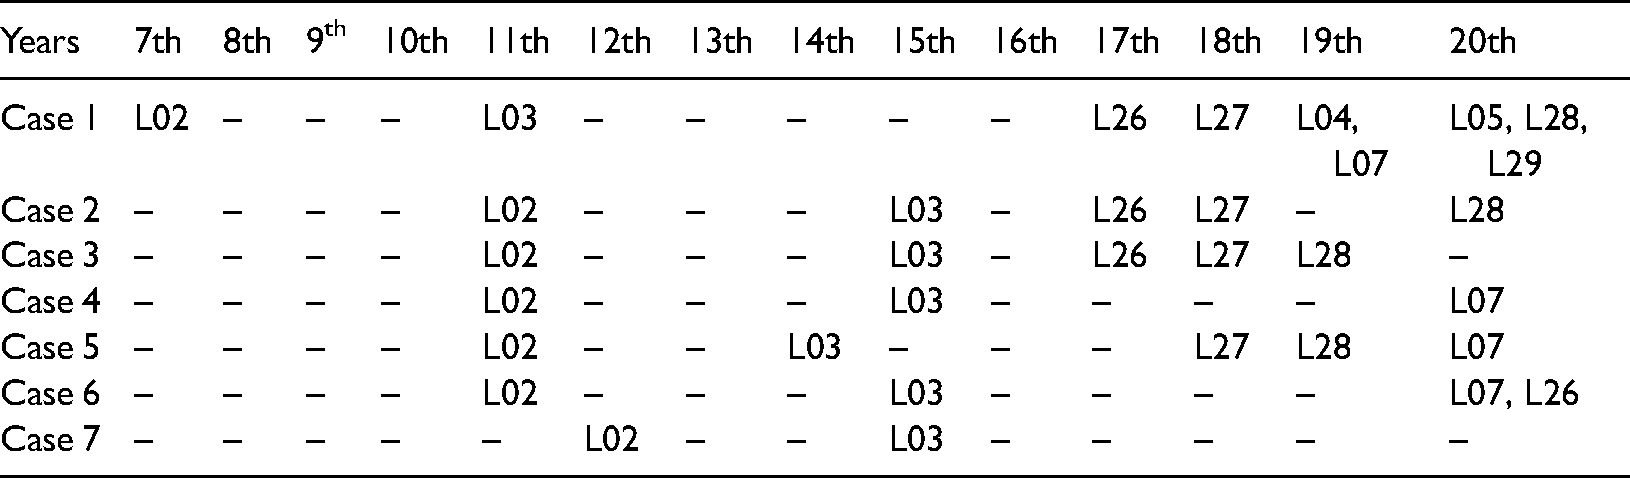
In case 2, the first line needs to upgrade in the 11th year, and the second line needs to upgrade in the 15th year. According to case 2, the first two upgrading events are deferred four years later by adding the ESS. In addition to this, the upgrading of L26, L27, and L28 are not deferred, while L04, L05, L07, and L29 do not need to upgrade anymore. The total number of lines that need to upgrade for case 1 is 9, but for case 2 is 5. Thus, four lines no longer need to upgrade with ESS, and the upgrading events are deferred for four years. The results of case 2 are similar to case 3; while the ESS size is still the same, the placement of ESS is changed. In case 4, the first and second lines need to upgrade in the 11th and 15th years, respectively. At the end of the 20 years, L07 needs to upgrade. The total number of lines that need to upgrade is only three, L02, L03, and L07. Again, with an ESS, the first two upgrading events are deferred four years in case 4. Upgrading in case 5 is similar to case 3, but the first two upgrading events are deferred for four years. For case 6 with a distributed ESS, upgrading L02 and L03 is deferred. The number of lines is four due to adding L26 to upgraded lines in case 4. The only two lines needing to upgrade after four years in case 7, another case of distributed ESSs, are L02 and L03. The numbers and length of lines to be upgraded in each case are given in Figure 5. Transformer upgrade cost was not pointed out for clearly expressing varying total expansion cost by the length of the upgraded line. However, it is included in the total expansion cost.
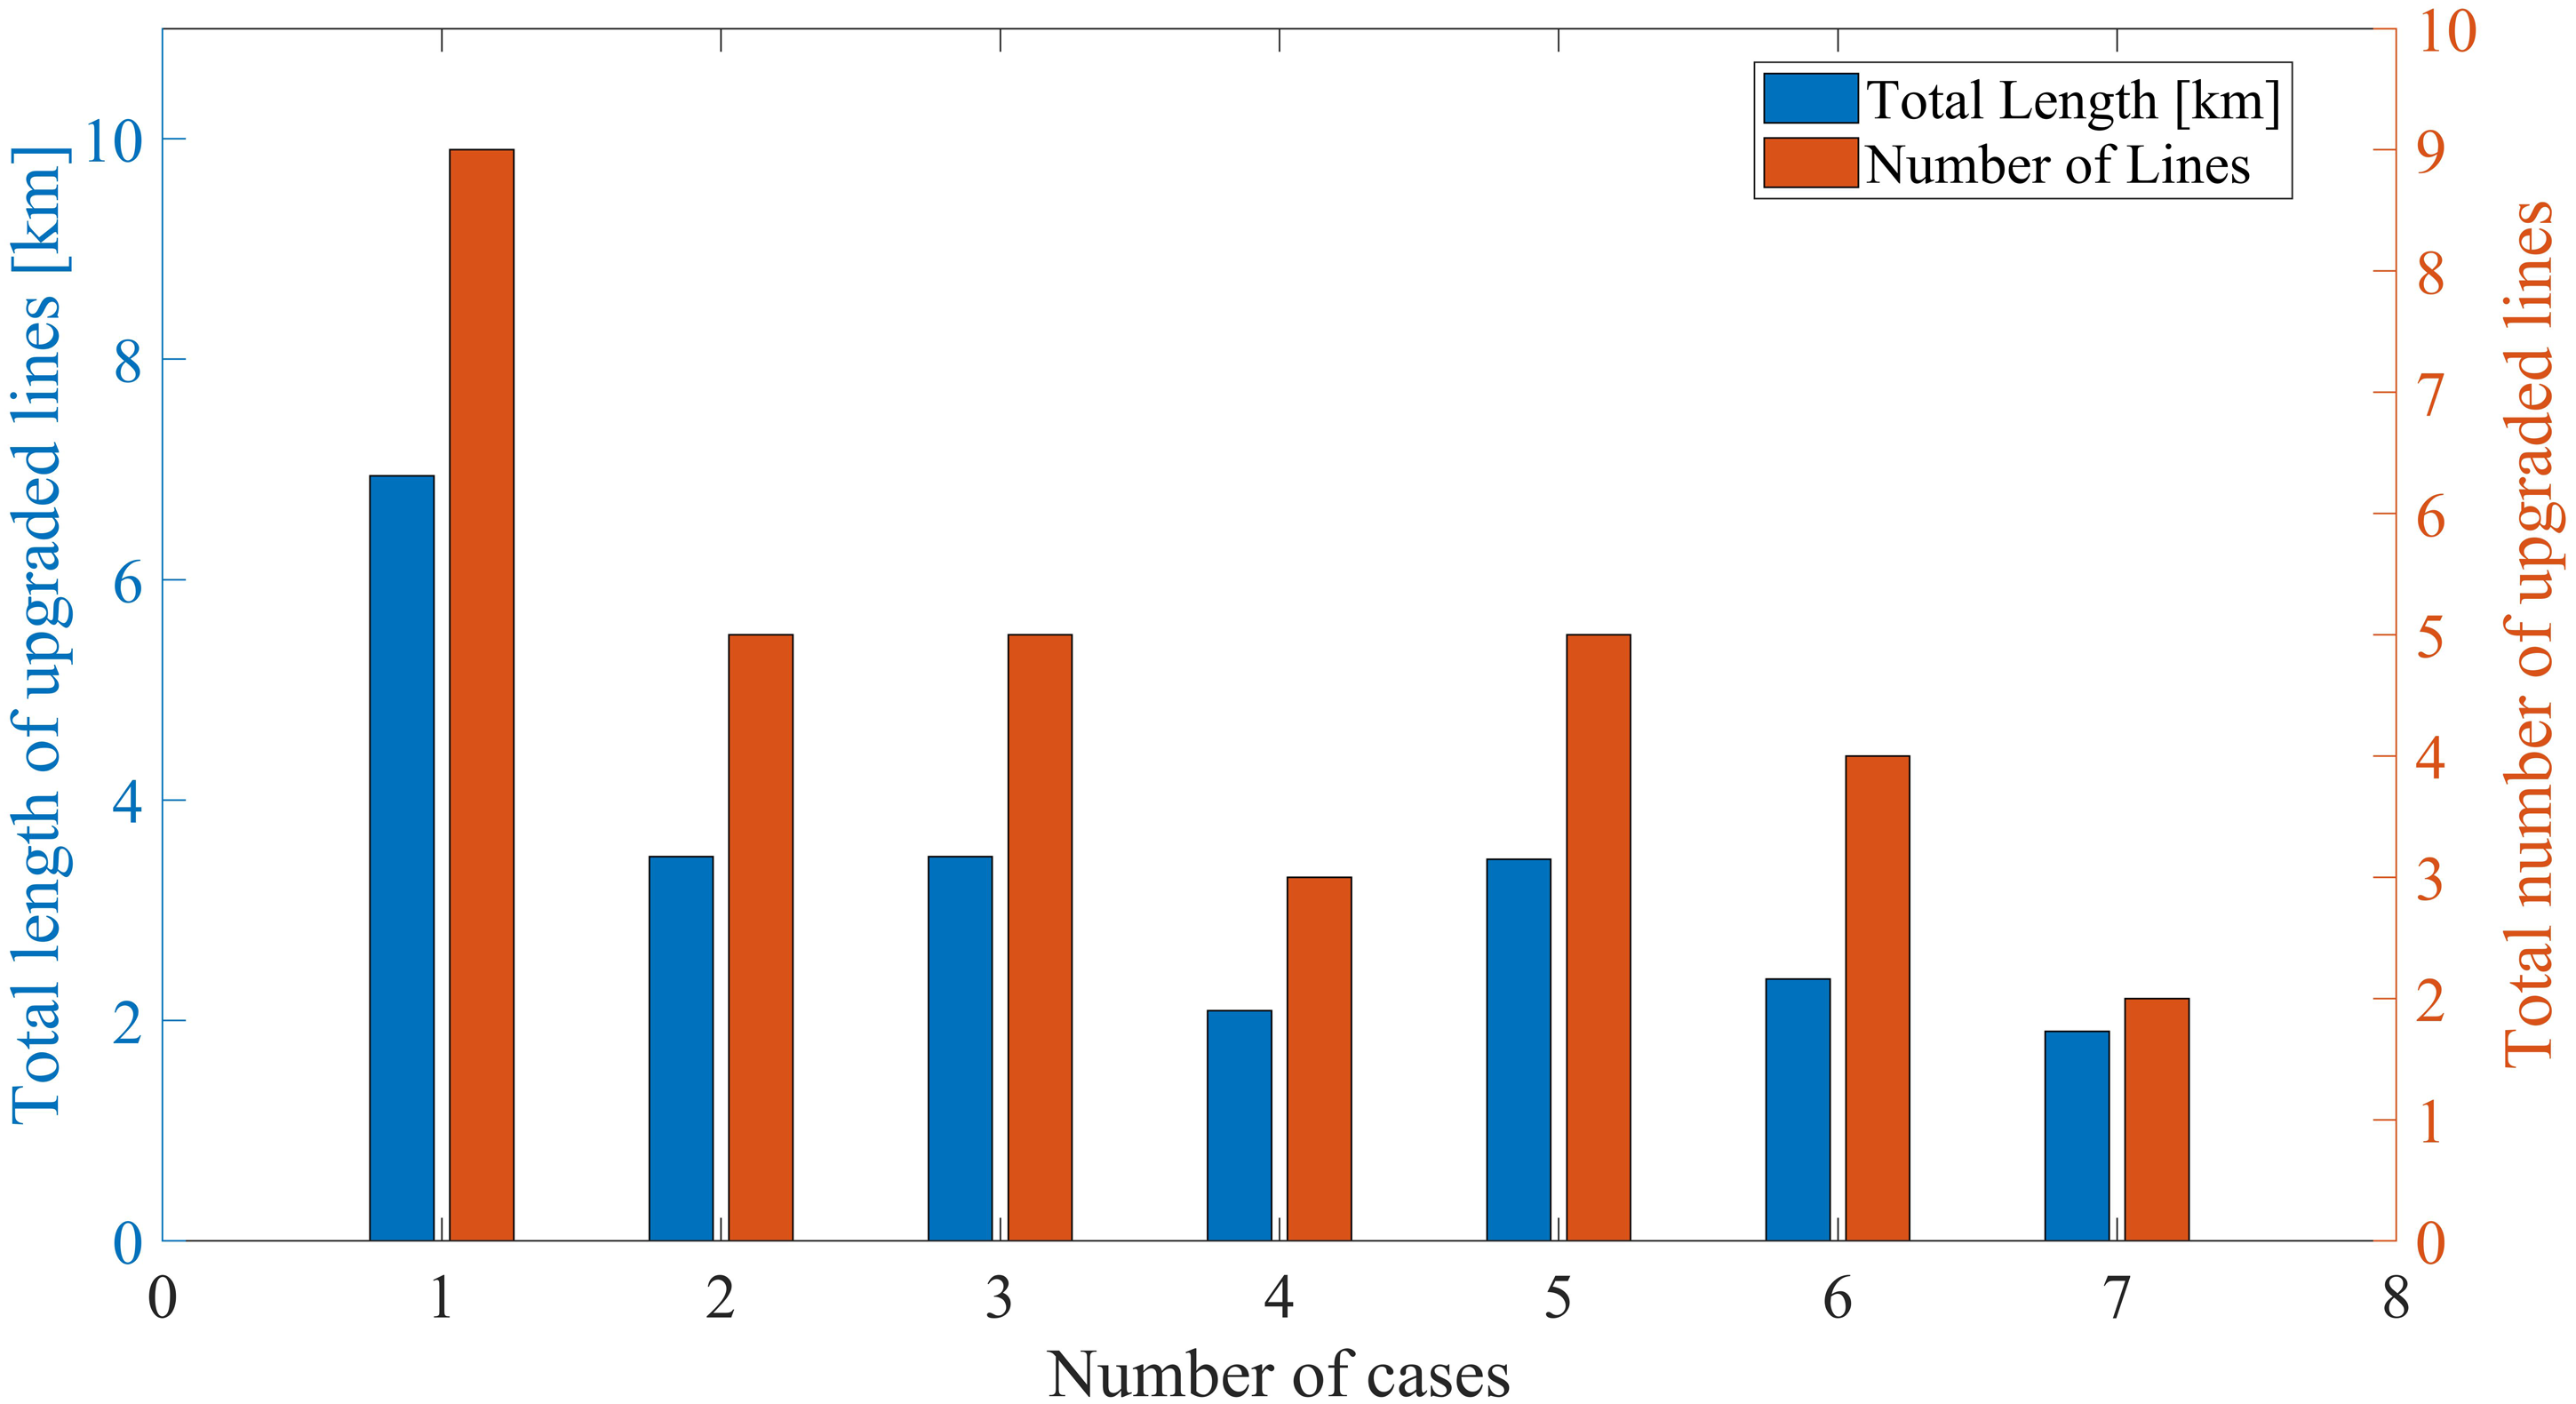
The numbers and lengths of lines to be upgraded.
For example, the number of lines to be upgraded in case 4 is three, while the total length of upgraded lines is nearly 2 km. Figure 5 shows that adding the ESS prevents more LUC. In the overall results with an ESS, the total length of upgraded lines is less than 3 km, compared with case 1. The number of upgraded lines in case 4 is one in three, but the total length of upgraded lines is not decreased compared to case 1 since the lines in the two cases are not the same lengths. The upgrading of distribution lines is illustrated, without an ESS in Figure 6(a) and with an ESS in Figure 6(b). When the line was upgraded, the year was written above the line in Figure 6. For example, L04 was upgraded in the 19th year of operation if an ESS was not used. L04 does not need to be upgraded because no overloading exists in this line in the case of ESS utilization. However, some lines need to be upgraded without ESS at the same time. For instance, L04 and L07 should be upgraded in the 19th year because overloading started by the 19th. There are only two lines, L02 and L03, that need to upgrade in Figure 6(b). Multiple upgrades occur in the last year of operation. For instance, only one line was upgraded in the 7th, 11th, and 15th years, but in the 19th and 20th years, two lines were upgraded in the same year. Namely, after 20 years without ESS, nine lines are upgraded. If an ESS supports the distribution grid, only two lines are upgraded.
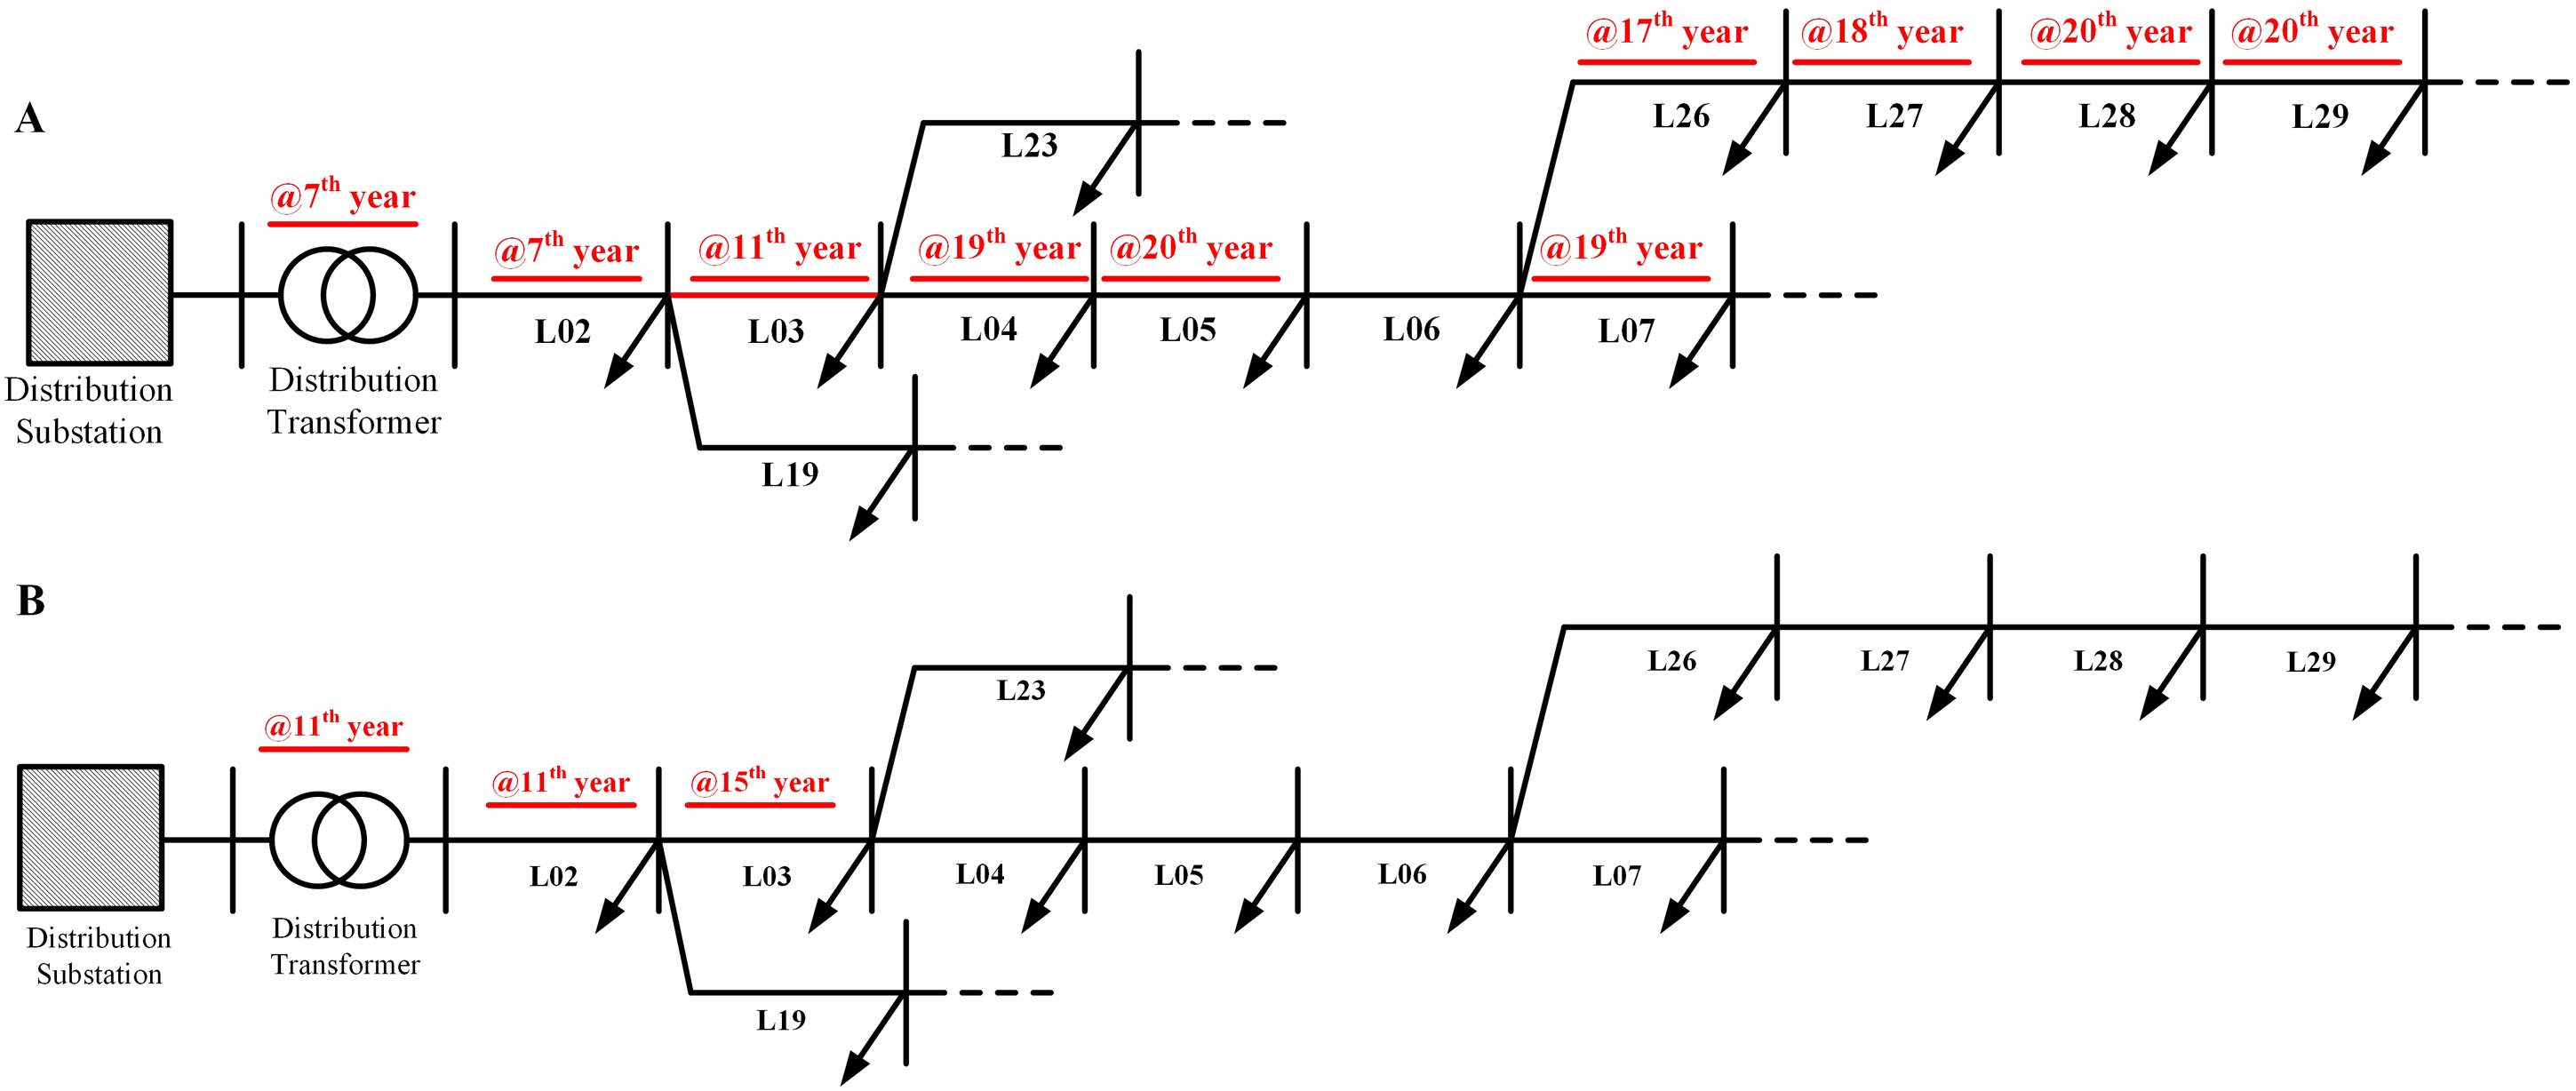
(A) The line upgrade years without ESS, and (B) with ESS.
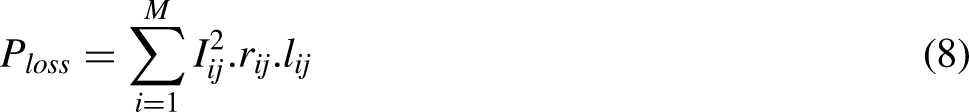
Moreover, the use of an ESS not only diminished the number of upgraded lines but also deferred the upgrades to future years. For example, the distribution transformer and the line L02 have to be upgraded inevitably at the 7th year of operation in case 1. However, this upgrade was deferred four years to the 11th year with the ESS. The ESS penetrations and total losses are given in Figure 7. The summation of power losses for each line is calculated by equation (2). Power losses increase line loadings furtherly, especially during peak hours. During peak hours, the rate of losses on the line current is higher than off-peak hours. If the power losses are decreased, line overloading can also be postponed. Thus, the power losses during peak hours are only considered to discover the benefit of the proposed method. It can be stated from Figure 6 that power losses diminish as the battery penetration is increased. The proposed method reduced the total power losses between 25.7–43.27% in cases 2–7.
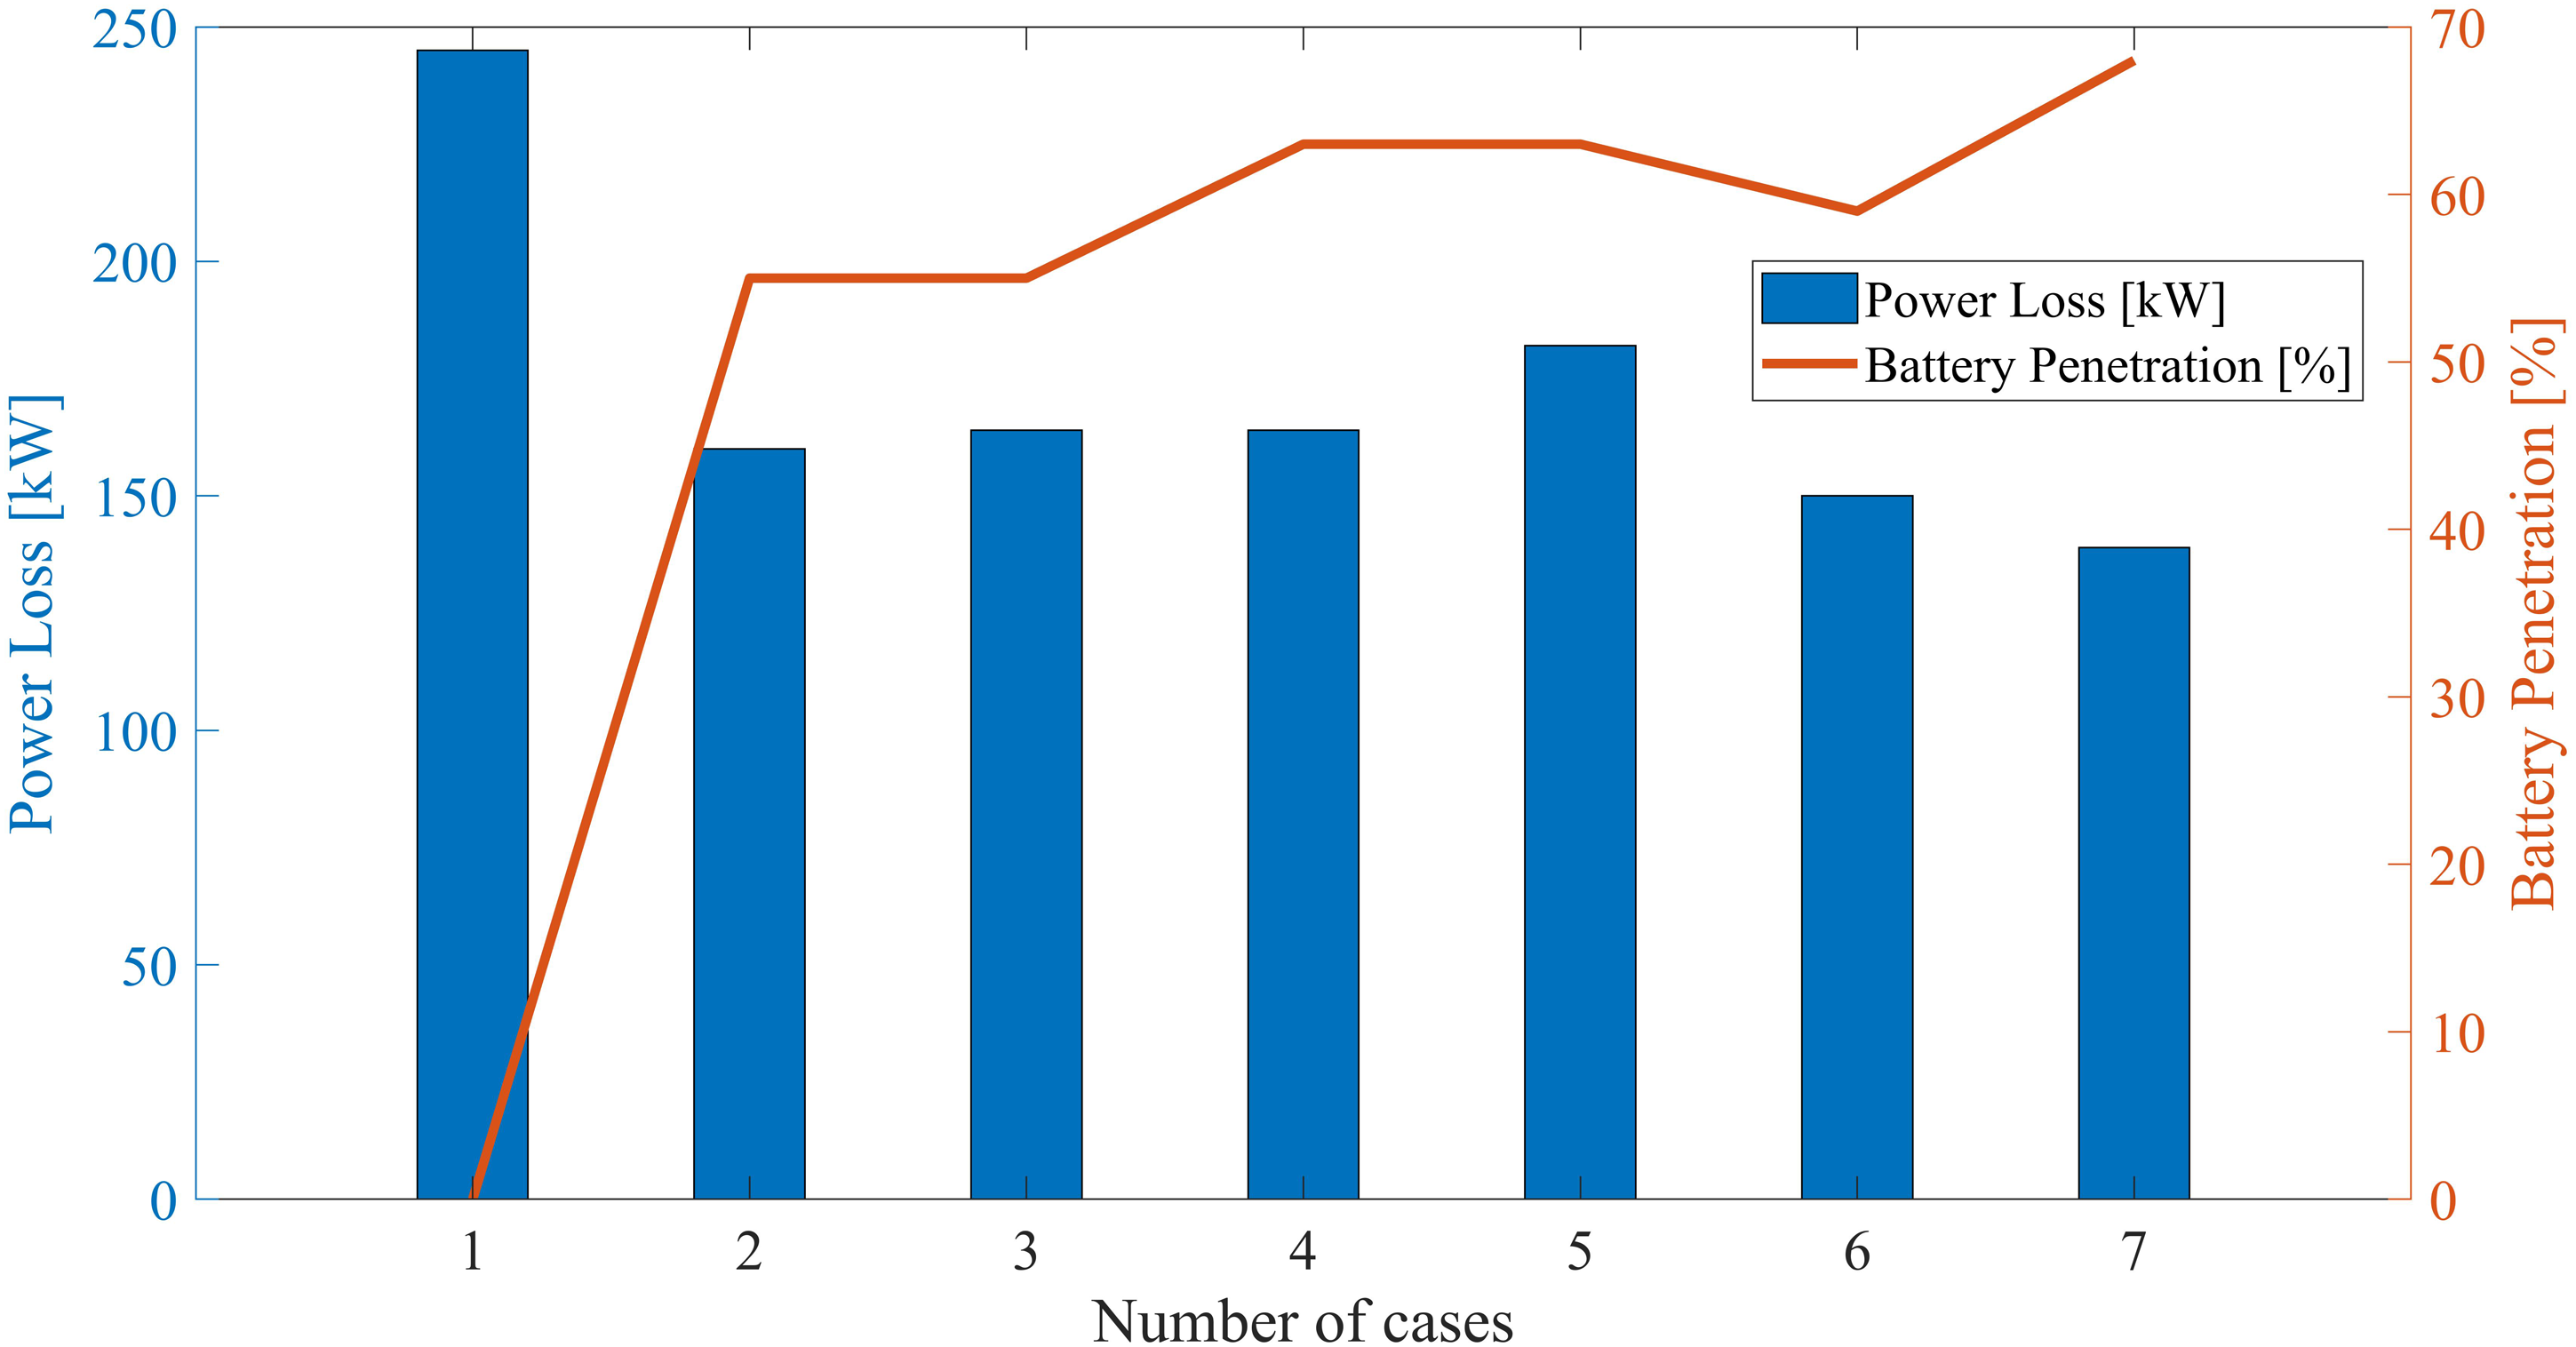
Power losses vs. battery penetration.
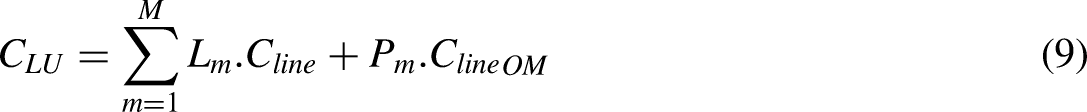
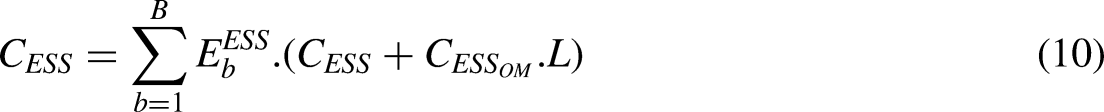
The EP cost for all cases through L-year operation without and with ESS (LA) is given in Figure 8. In case 1, the entire EP cost is over $7 M without an ESS. This cost includes the LUC of 9 lines having 6.3 km length and one distribution transformer investment. It can be easily seen that the total investment cost in case 2 is decreased to below $6 M by EP with the ESS. The total upgrade cost in case 3 and case 5 is very similar to the cost in case 2. For case 4, upgrade cost decreases by $1 M due to the total length of upgraded lines being decreased by only one km. Case 6 and 7 are the cheapest alternatives for the proposed method. Their total upgrade costs are very similar and slightly more than $2 M. There is an apparent difference between cases 6–7 and 2–3–5 in total upgrade cost; hence, the total length is less, the number of upgraded lines is fewer, and power losses are low. EP costs of the DES are given in Table 5 (Wong et al., 2009). ESS costs can be found in (Lockhart et al., 2019). A comparison of EP using other types of ESS is given in Table 6. Total costs include an investment of different ESS types and DES upgrade costs. Total costs are changing according to the ESS type. The highest cost relates to VR and CA because of the high investment cost Total costs are reduced in any case, thanks to an ESS integration, even using VR or CA types. Case 7 has the lowest cost due to the minimum number of upgraded lines with the minimum length.
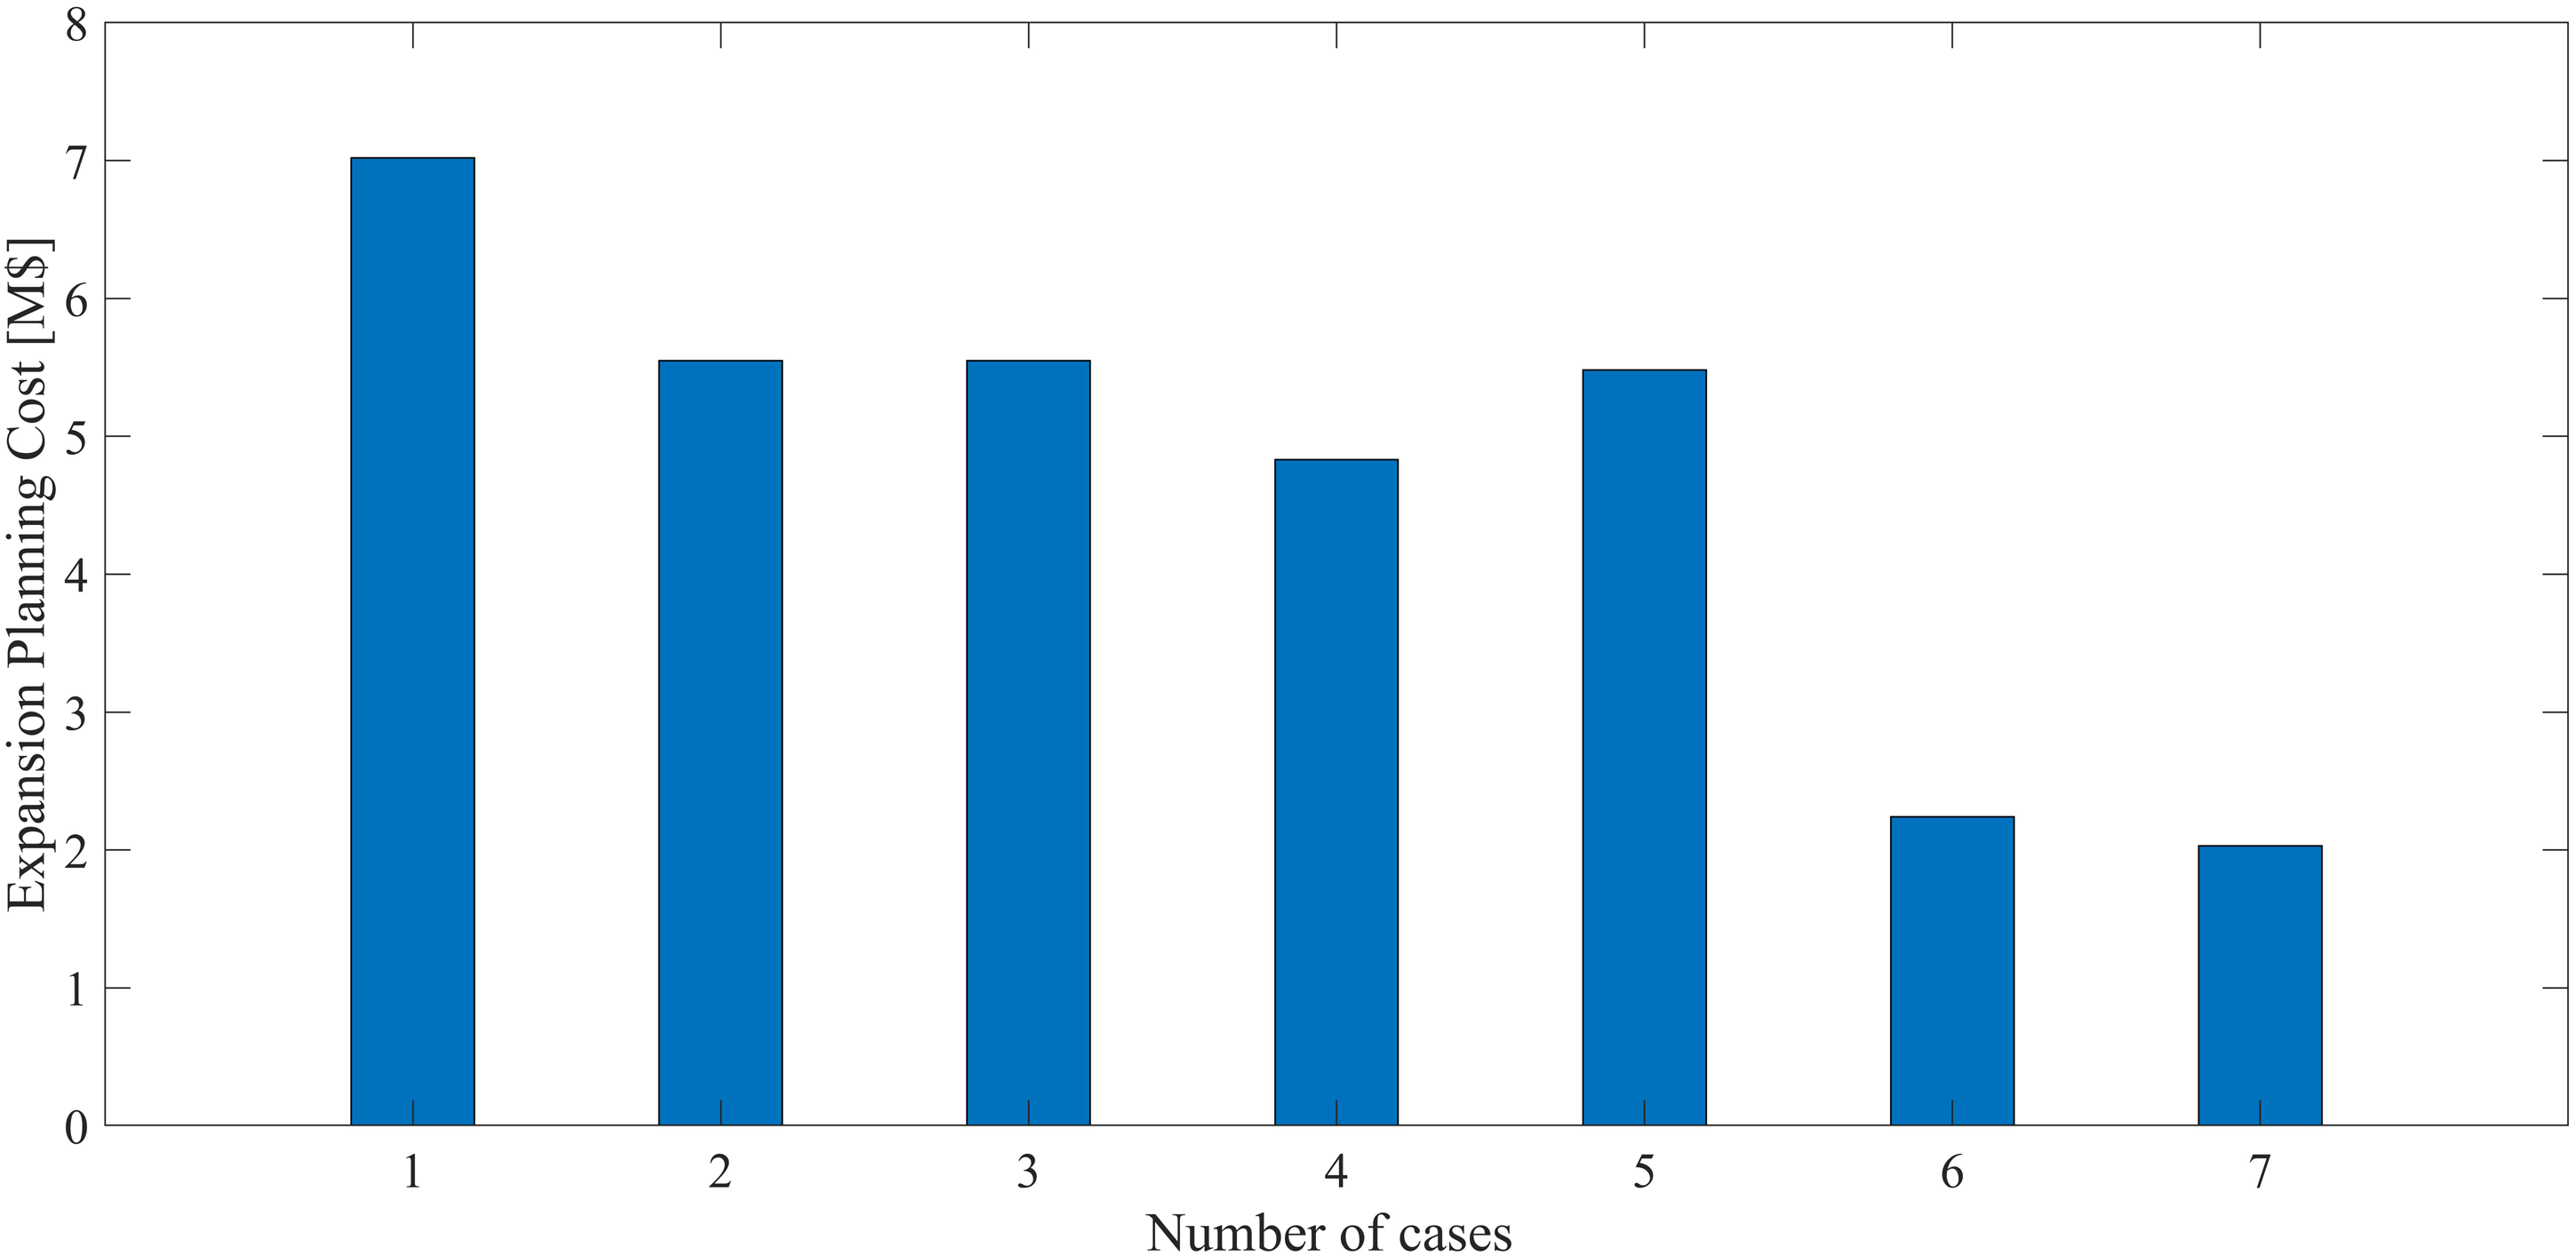
The total expansion costs without and with ESS (LA).
Ep cost of DES.
Total expansion costs [$M].
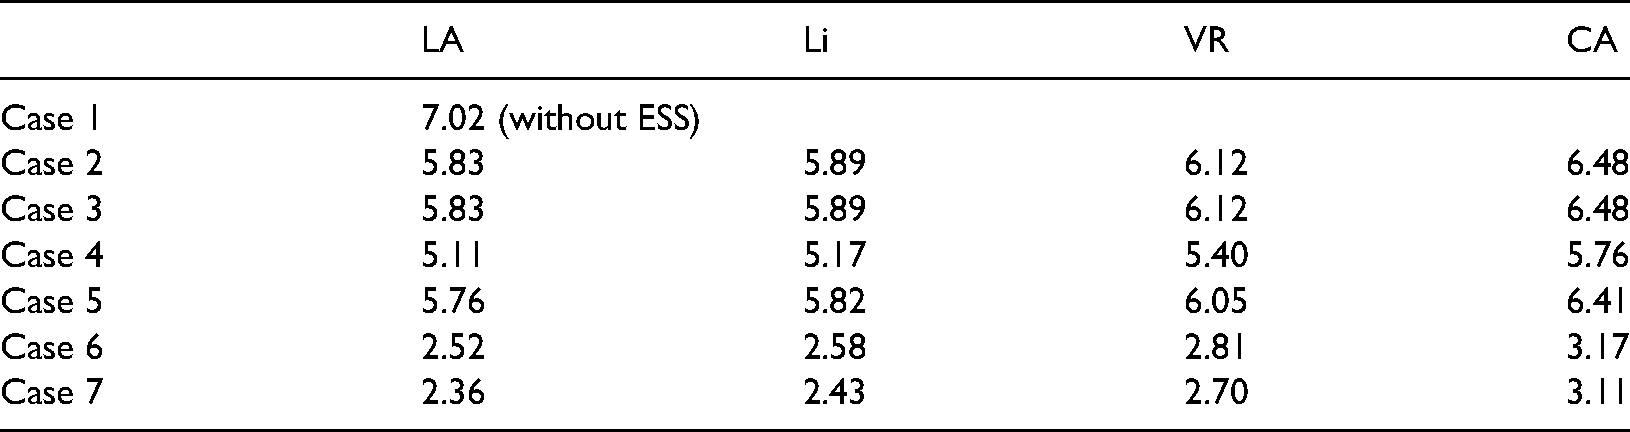
Additionally, LA significantly reduces the total cost because of lower installation costs. Although the installation cost of Li is higher than LA, it may decrease soon considering the availability of many second-use EV batteries after 5–8 years of use in EV. Figure 9 shows the results given in Table 6. Different colors are used to illustrate the total cost of EP of DES with various ESS types. They include LUC and the investment and operational costs of ESS. It is seen that EP with an ESS can reduce the total expansion cost in every case depending on the ESS type.
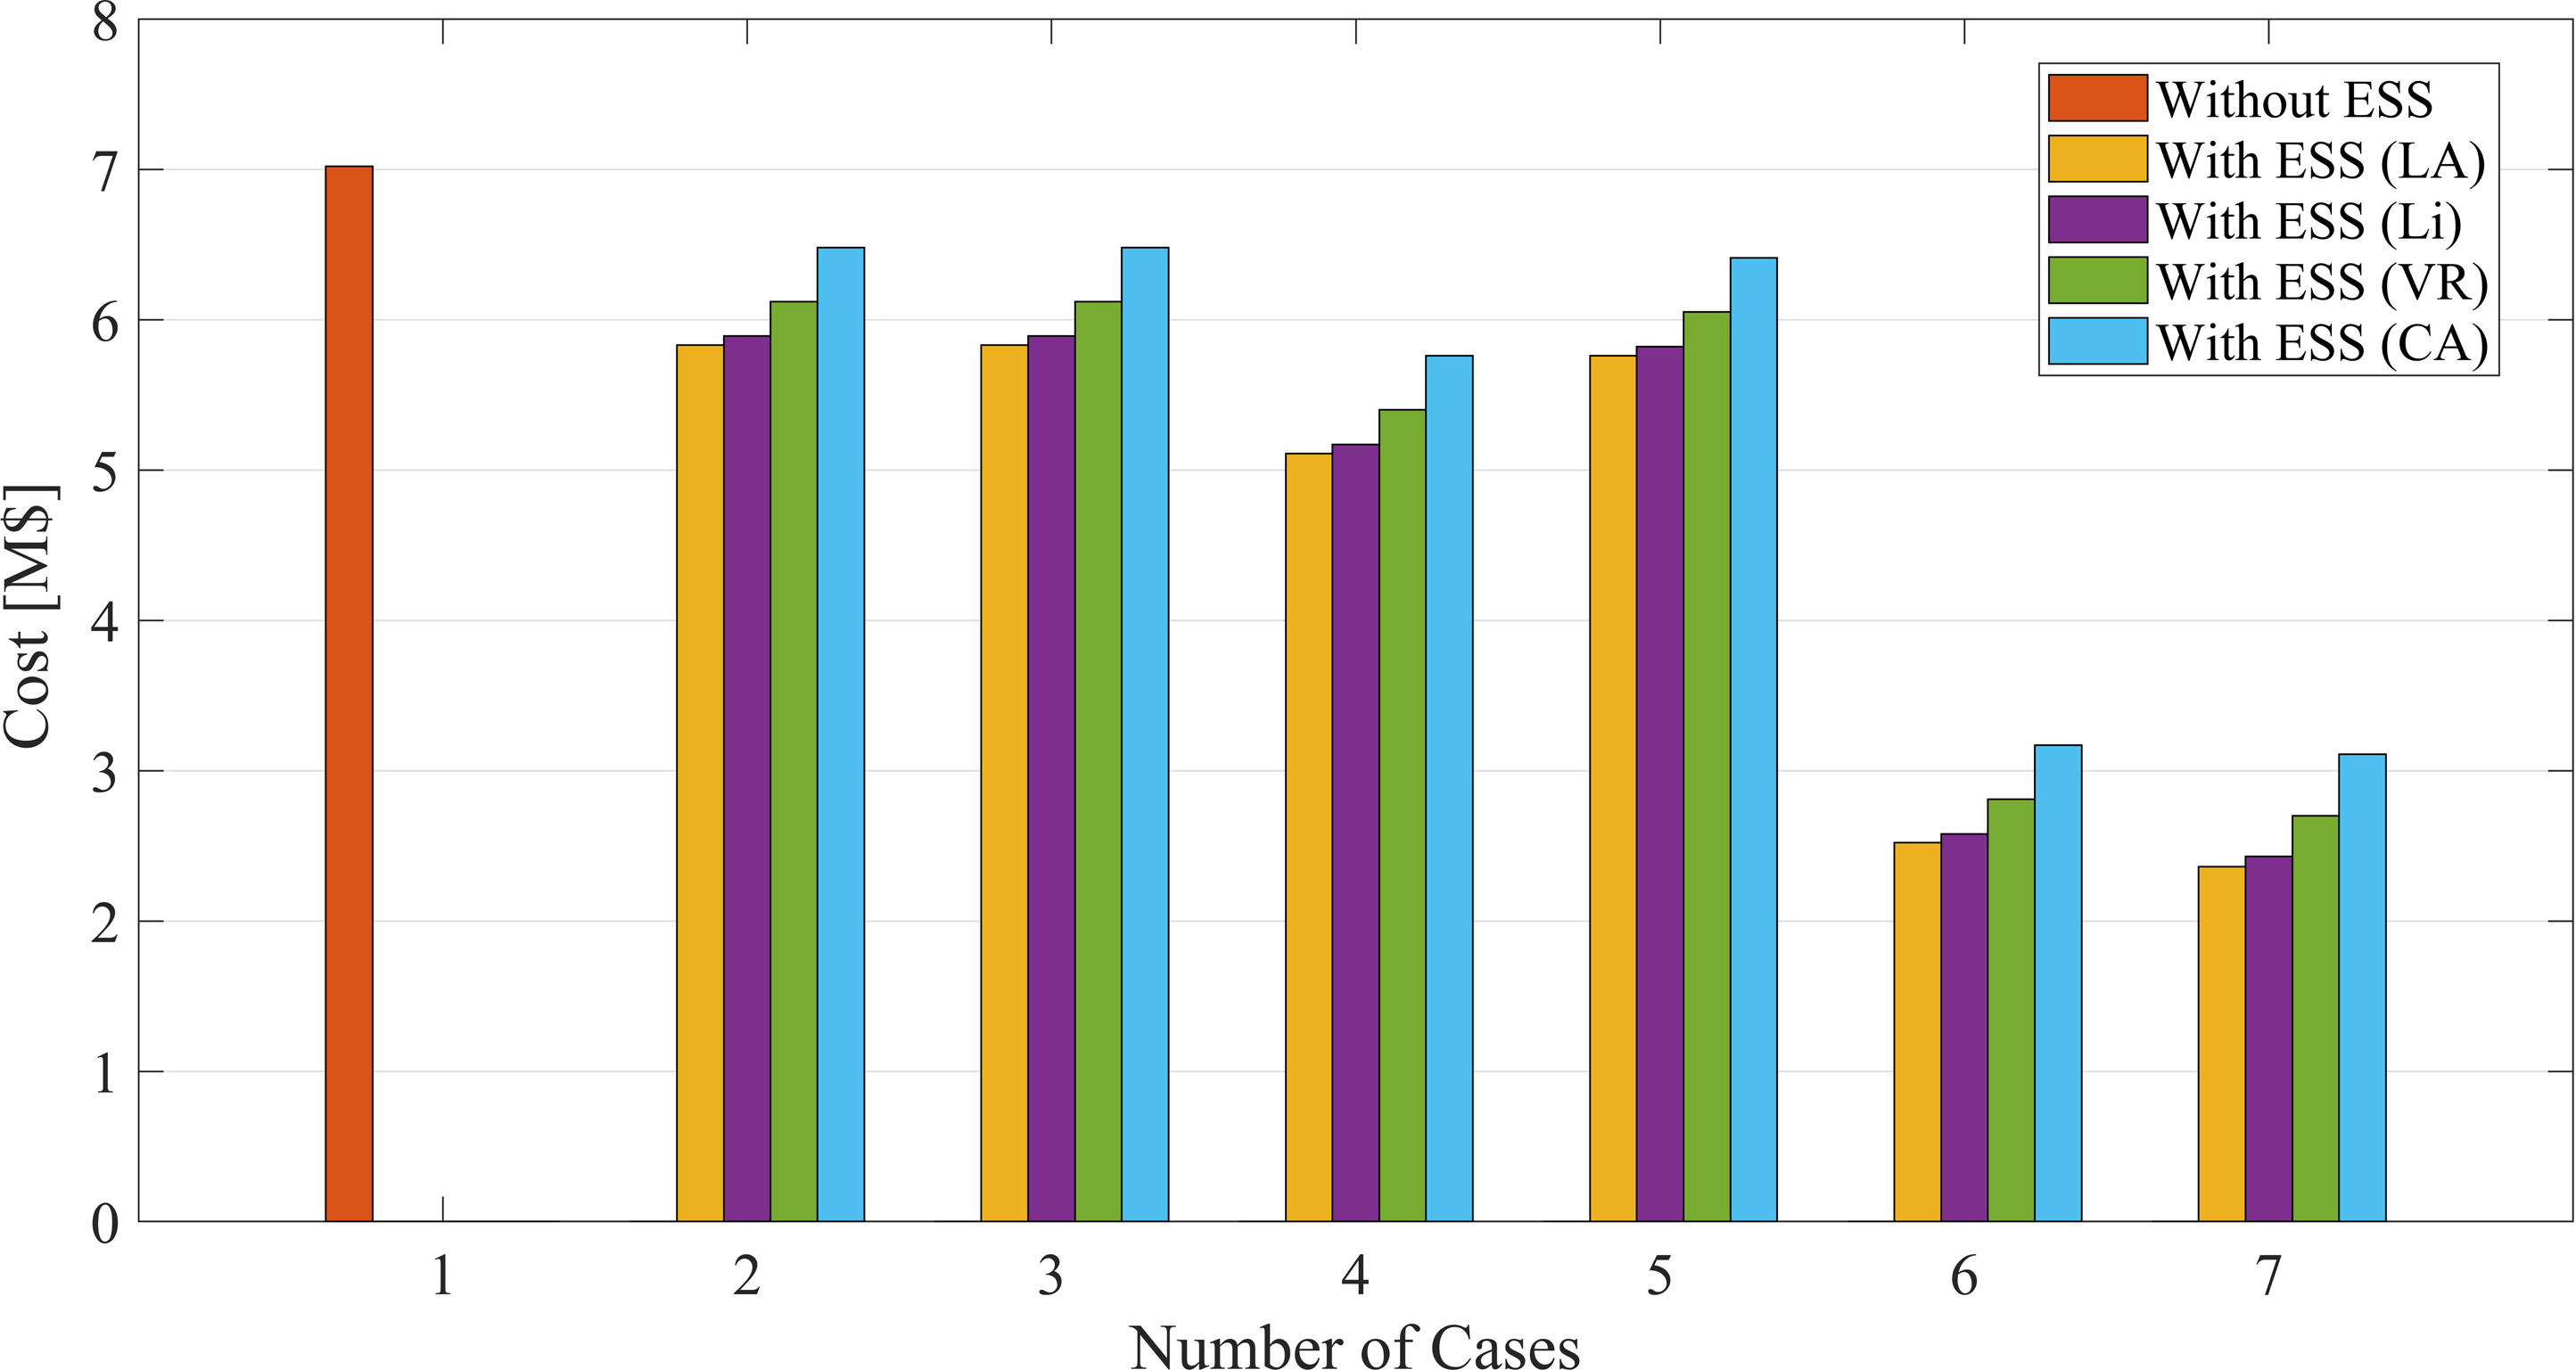
The total expansion costs for different ESS types.
The voltage profile of bus N18 is given in Figure 10 for 20-years of operation with the LGF. The voltage of N18 in case 1 without an ESS drops to 88% at the 8th year due to LGF. The N18 voltage never goes below 85% after ESS use in cases 2–3–6–7 at the end of 20 years of operation.
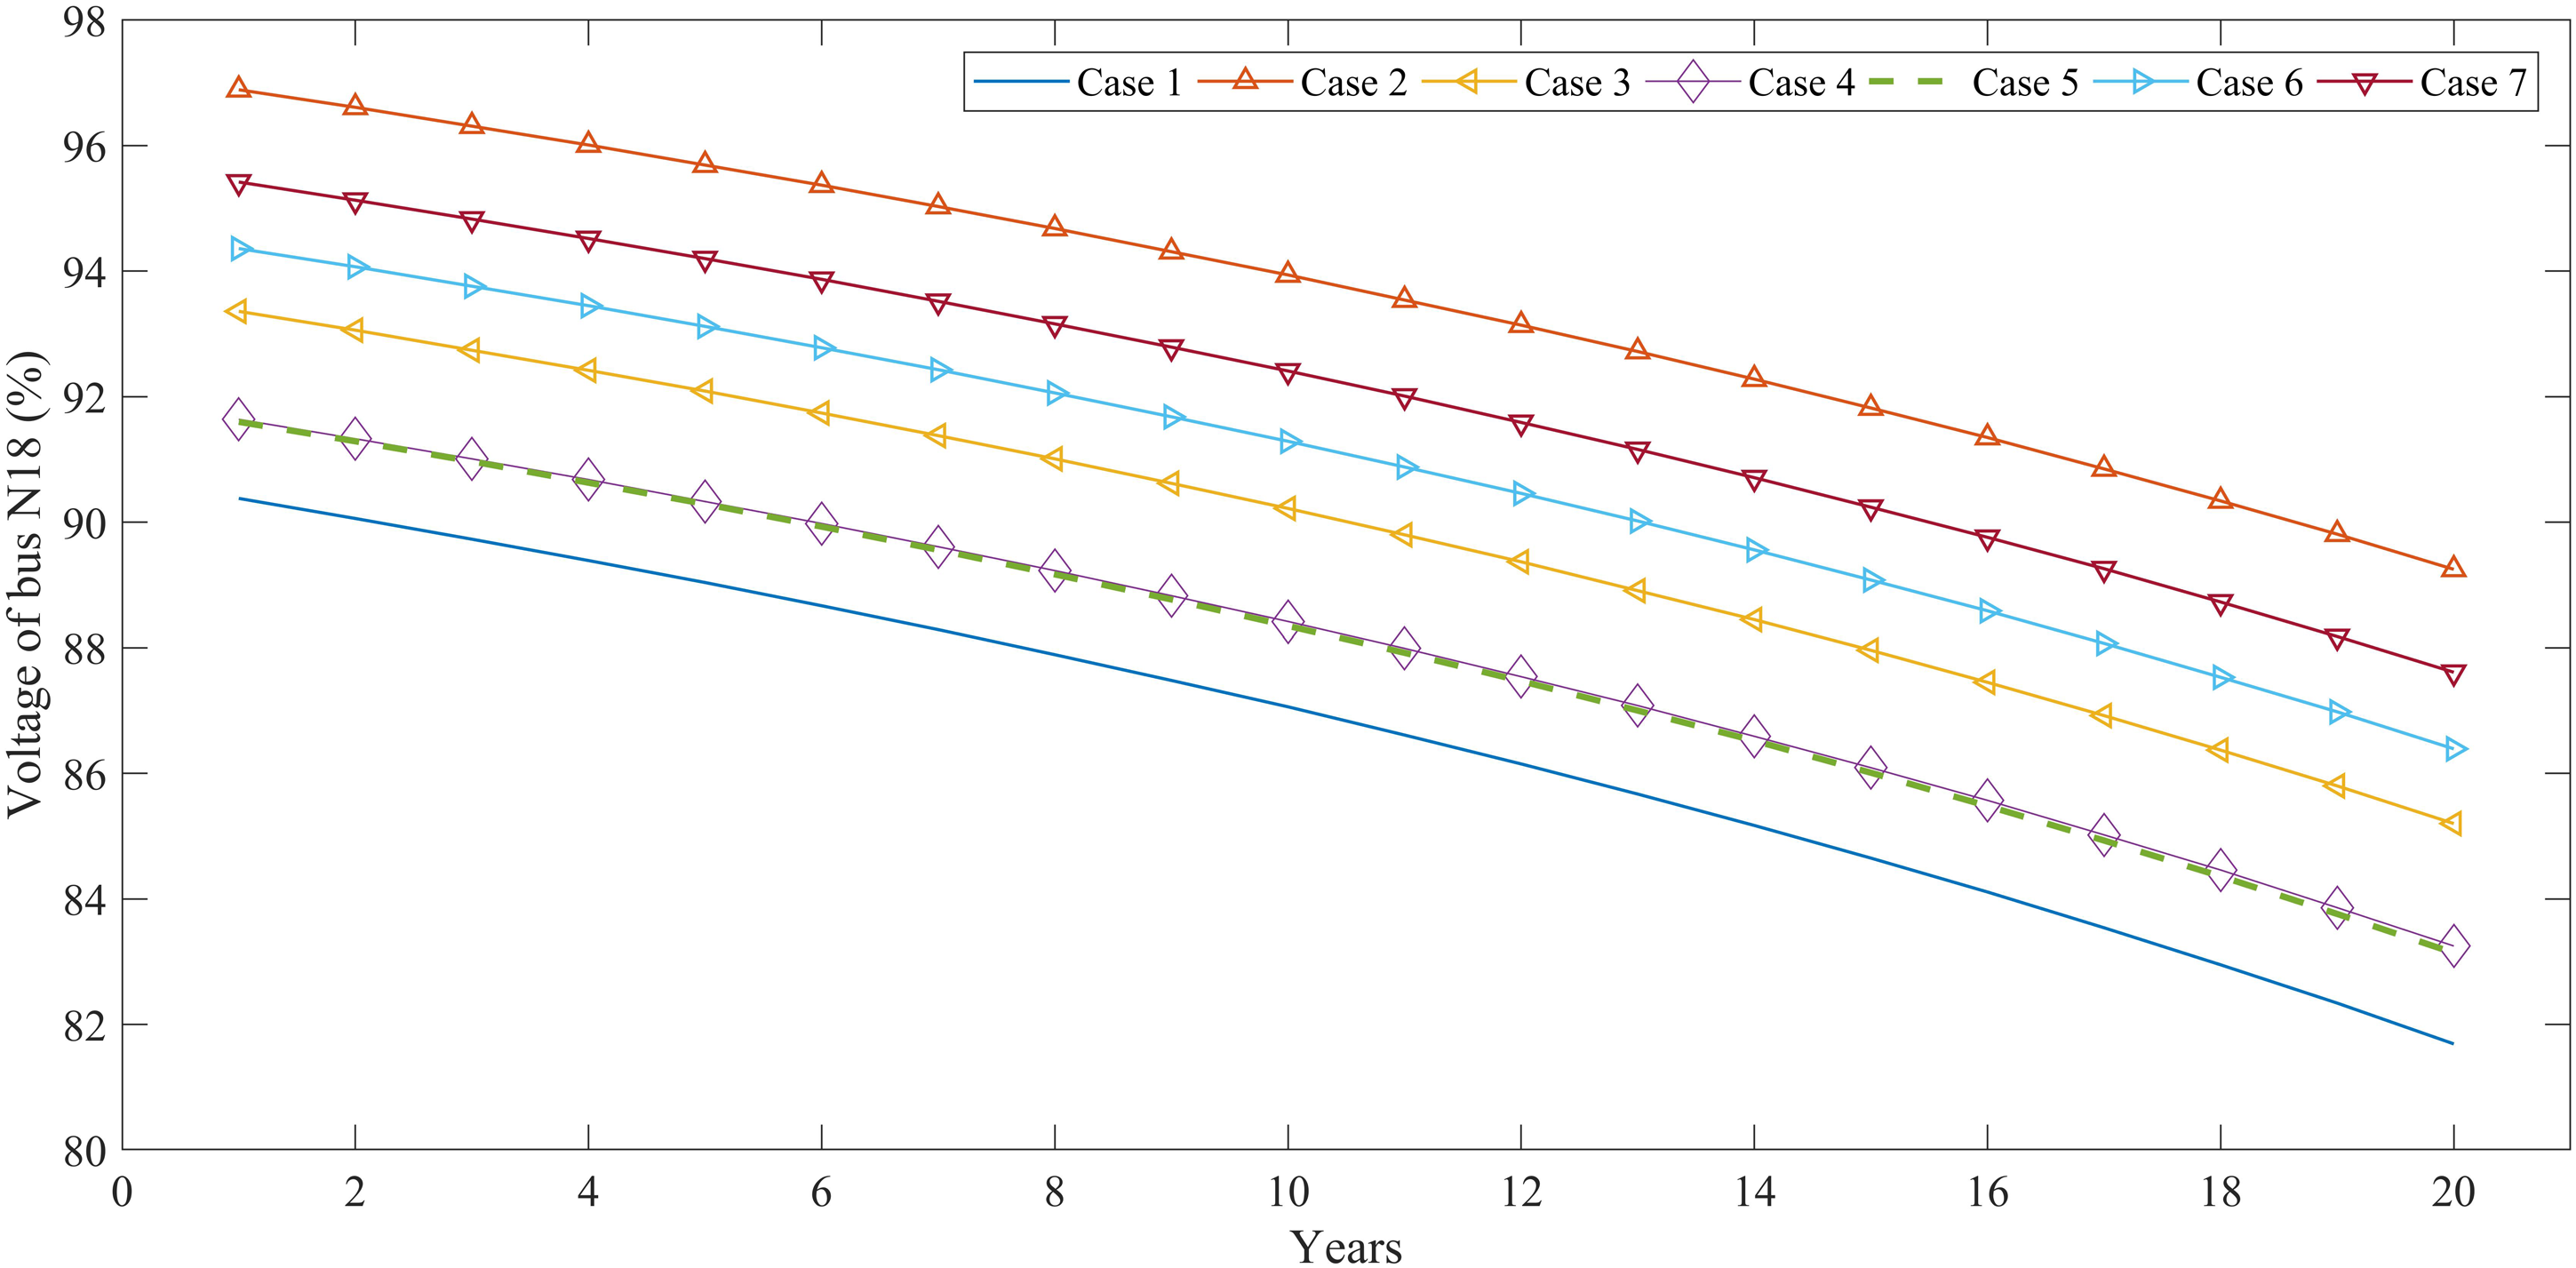
Comparison of the voltage of N18 throughout the study.
Discussions
Some studies focus on EP of DES with DG, but they do not consider any ESS (Agajie et al., 2020). ESS can be utilized with PV for EP in order to maximize benefits for DSOs and prosumers. However, additional loads and investment costs from PV and ESS were not considered (Fichera et al., 2020). Also, transmission EP with ESS can help reduce total system cost by around 13.1% and improve the voltage profile by about 18.5% (Ansari et al., 2021; Katsanevakis et al., 2019; Larsen and Sauma, 2021). However, these studies use higher capacities and focus on expensive ESS types. Another suggested EP method can reduce the power loss up to 25% and limit the voltage deviation to around 13.3% in a medium voltage distribution network (Lazzeroni and Repetto, 2019). According to the findings of the presented study, the total length of upgraded lines can be reduced up to 72.6%. Namely, the total number of upgraded lines is reduced up to 77.78%. The proposed method has decreased the total power losses of the DES by around 34.8%. The total operating costs of DES could be reduced by up to 66.38%; due to the deferral of LUC. In addition, bus voltage drops increase as the current on the DES lines increases. Therefore, some precautions should be considered to prevent bus voltages from violating the limits. The ESS can support the DES loads, especially near the line end, and help to improve the bus voltages (Zeraati et al., 2018). EP with an ESS can improve the bus voltages, especially in peak hours, so that voltage drop is limited via discharging of the ESS to meet the demand at that time. The bus voltage deviations are limited to 12.13% from the beginning to the end of operation considering LGF. Case 7 is the most suitable in terms of cost reduction, while case 2 is better for voltage improvement.
Studies related to ESS investment rely on the cost of continually improving ESS technologies. The cost projections of ESS in the literature are given in the short and long term. Short-term predictions include that the installation cost of the ESS will be reduced by 21–67% in 2030. Long-term projections include more than 31% and not much more than 80% for 2050 (Cole and Frazier, 2019). There is more reduction expected for ESS prices soon. The LGF used in this paper represents high-developed regions. Developing regions have a higher LGF, such as 7–10%. If the LGF is considered higher, the benefits of EP with ESS are more significant.
As presented in this study, the proposed approaches help DES operators reduce operational and investment costs due to lowered LUC and power losses. Besides, the investigated options increased the service quality of the DES operators with higher voltage quality with effective use of ESS in the system. Therefore, it is projected that the overall costs of ESS will reduce over the next decade dramatically, which will be a more feasible option for all power market participants, including DES operators. On the other hand, line upgrades require some constructional operations that may cause traffic jumps and air/noise pollutions. Besides the technical benefits of EP with ESS, these problems are overcome with the proposed method without hampering inner-city life comforts.
Conclusions
Higher penetration of RES with fluctuated and non-controllable power outcomes causes additional challenges in grid integration for DES operators. Deep electrification options such as mobile and stationary ESS become increasingly important within the smart grids as potential grid integration solutions to high RES. This study suggested an expansion planning method using ESS for DES operators to defer and decrease line upgrade costs. The proposed method was realized with the help of PSS® Sincal software on the IEEE-33 bus model in different case studies considering centralized and distributed ESS allocation. According to the results for 20 years of operation, more than 70% of total line upgrades could be deferred for four years at least. Each upgraded line was indicated with lengths and numbers for all cases to compare the total costs. The total operating cost of DES could be reduced by up to 66% using LA-type ESS. In addition, the power losses of DES have been reduced, and the voltage profiles have been improved. It is recommended that investment decision-makers monitor possible price reduction and continuous developments of ESS technologies in terms of lifespan, efficiency, and similar technical performance metrics. A reduction in the investment and operating costs of ESS is expected to increase the techno-economic availability for future DES integrations. Additionally, policymakers are recommended to create new incentive mechanisms to support various ESS use cases including deferring upgrade investments until such technologies become more competitive. Further, the performance of ESS in DES and microgrids should be investigated with real application in further studies.
Footnotes
No Acknowledgments.
Author contributions
Conceptualization, S.M.T. and E.G.; methodology, S.M.T., O.E.; software, S.M.T.; validation, E.G., O.E.; formal analysis, S.M.T., O.E.; data curation, S.M.T.; writing—original draft preparation, S.M.T., O.E., U.C.; writing—review and editing, S.M.T., O.E. and U.C.; visualization, O.E.; supervision, E.G.; All authors have read and agreed to the published version of the manuscript.
Declaration of conflicting interests
The author(s) declared no potential conflicts of interest with respect to the research, authorship, and/or publication of this article.
Funding
The author(s) received no financial support for the research, authorship and/or publication of this article.