
Abstract
Integrating renewable energy resources into electrical distribution networks necessitates using battery energy storage systems (BESSs) to manage intermittent energy generation, enhance grid reliability, and prevent reverse power flow. Thus, this study focuses on the optimal sizing of BESS in electrical power distribution networks, considering, cost, grid reliability, and environmental impact. The adapted electrical power distribution network in this research has a 25 MVA/33 kV capacity with 7 MWp photovoltaic power plants. The variability of renewable energy sources and the ampacity limitations of the adapted electrical power network are analyzed first. After that, a linear optimization approach is applied to minimize the storage system's cost subject to a specific grid's reliability. In addition to that, a life cycle assessment approach that evaluates the environmental impacts of different BESS technologies is used to evaluate the options of BESSs. Results indicate that integrating an optimally sized BESS significantly improves grid reliability, reduces energy deficits, and lowers operational costs. Moreover, the environmental impact assessment reveals that Lithium Iron Phosphate batteries are the most environmentally friendly option due to their high cycle life and moderate efficiency. The study concludes that the optimal BESS size for the adapted network is 120 Ah/33 kV, with a loss of load probability of 1% and annual savings of $0.367 million.
Keywords
Introduction
As the world is progressing towards a carbon-neutral future, renewable energy (RE) resources are taking the front stage in this transition process. However, the intermittent energy generation from RE sources makes it necessary to have a battery energy storage system (BESS) to control the supply, prevent reverse power flow, and enhance the grid's voltage (Kaabeche and Bakelli, 2019). Moreover, in some situations, battery energy storage system can support loads in the case that the main power supply cannot fulfill these loads completely (Cossutta et al., 2022).
Although BESS strengthens self-consumption and decreases the use of conventional fuels, these benefits must not be overshadowed by the manufacturing, use, and disposal of the BESS (Cossutta et al., 2022). Thus BESS size optimization is crucial for future sustainability (Kaabeche and Bakelli, 2019).
According to reports, oversized BESS may deter investment due to high cost and environmental impacts, while undersized BESS does not lead to the desired benefits to the grid (Das et al., 2018; Hannan et al., 2020). Similarly, it is claimed that having the optimum size of BESS reduces the cost and environmental impacts of manufacturing, transportation, operation, and waste management (Olaszi and Ladanyi, 2017). Thus, optimizing the size of the BESS guarantees operating the grid sustainably and economically while ensuring the resilience of the grid and maximizing grid reliability (Kaabeche and Bakelli, 2019; Hannan et al., 2020; Wu et al., 2022).
Literature review
The optimal sizing and techno-environmental considerations of BESS are critical for the successful integration of these systems into electrical distribution networks. Recent research provides valuable insights into design procedures, environmental impact assessment methods, and optimal deployment strategies.
The sizing methodology of BESS involves determining the optimal capacity and configuration to meet specific energy demands and operational constraints. This process typically utilizes multi-objective optimization techniques that balance various factors such as cost, efficiency, and reliability. Objective functions for BESS sizing can vary, but in general, it implies minimizing the total system cost, operational costs, and energy losses, while maximizing system reliability and RE utilization (Secchi et al., 2021; Ntube and Li, 2023). These optimization problems are usually solved by either linear optimization approaches or artificial intelligence-based optimization methods (Kamble et al., 2018; Arias et al., 2021). Moreover, it is always important to consider actual system performance when optimizing BESS. This practice helps in addressing uncertainties in energy production and consumption, thereby enhancing the overall performance and economic viability of BESS deployments (Song et al., 2024).
As a fact, there are many researches on the sizing of BESS in electrical power systems. Amorim et al. (2024) addressed the challenge of mitigating power fluctuations in photovoltaic (PV) power plants due to the high variability of solar irradiance. The study highlights the importance of incorporating BESS to smooth these fluctuations and ensure stable power injection into the grid. The authors propose a detailed methodology for sizing BESS based on energy requirements, power, discharging rate (C-rate), and mission profile, which considers local solar irradiance and ambient temperature. Similarly, Tejero-Gómez and Bayod-Rújula (2024) addressed the challenges associated with the variability of PV energy by incorporating BESS. The study aims to determine the optimal size of BESS installations and their operating setpoints to ensure a constant and reliable energy supply from PV plants. The research includes an aging analysis to evaluate the long-term performance and degradation of the batteries. Moreover, Koutenaei et al. (2024) discussed strategies for optimal sizing of BESS to mitigate the fluctuations of RE sources. The study highlights the importance of integrating RE sources into the electricity grid to achieve sustainable energy goals, despite their inherent intermittency, which poses challenges for grid stability and reliability. The authors propose various strategies to enhance the predictability of RE sources output and the performance of BESS, including forecasting models, stochastic optimization, and hybrid systems. The paper also addresses challenges related to battery degradation, safety concerns, and grid integration hurdles.
As a fact, the previously mentioned proposals did not consider the performance of the electrical power system and kept the focus on the PV-BESS sizing approach. Meanwhile, in some other research, this issue was considered. Ibrahim et al. (2024) presented a method for optimal placement and sizing of BESS in power distribution networks. The method uses the Hunger Games Search Algorithm, which is inspired by the behavior of animals in finding food. The main goals are to reduce power losses and improve the voltage deviation index in the distribution system while adhering to operational constraints. The objective function in the paper aims to minimize both active power losses and voltage deviation index. This was formulated as a single objective function with a weighting coefficient to balance the two goals. The paper uses IEEE 69-bus and IEEE 85-bus distribution systems under various scenarios, demonstrating significant improvements in power loss reduction. However, the paper does not consider any cost analysis of the BESS installation. Meanwhile, in Apribowo et al. (2024), optimal sizing and placement of BESS are proposed to maximize the penetration of variable renewable energy (VRE) sources like PV and wind energy in Lombok, Indonesia. The integration of BESS is proposed as a solution to stabilize the power supply and enhance the flexibility of the energy grid. The study employs a mixed-integer linear programming (MILP) model to optimize BESS placement and sizing. Results indicate significant cost reductions and increased VRE penetration compared to current system conditions, demonstrating the feasibility and benefits of BESS integration. The objective function in this paper aimed to minimize daily forward operational costs. The minimized costs include costs of conventional power generation production, RE curtailment, loss of load, and BESS operation. The costs are analyzed under various scenarios to determine the optimal configuration for minimizing operational expenses while maximizing RE penetration. Finally, the IEEE RTS-24 electrical power system is used as a testing system in this study.
Similarly, Grover-Silva et al. (2018) discussed the optimal sizing and placement of BESS within distribution grids using a second-order cone programming optimal power flow algorithm. The study integrates smart grid operations into the planning phase and conducts a techno-economic analysis to compare the benefits of BESS against their investment costs. Key findings indicate that while BESS can significantly improve grid operations and RE penetration, the current high costs of battery systems can make their economic viability challenging.
Ali et al. (2024) proposed a method for optimal placement and management of distributed resources, including distributed generation and BESS, in power distribution networks. The study aims to enhance the sustainability, reliability, and flexibility of modern power systems by concurrently addressing distribution network reconfiguration and DR allocation under the variability of RE sources. The authors propose an improved bidirectional coevolutionary algorithm to solve this multi-objective optimization problem. This optimization aims to minimize energy costs, power losses, and voltage deviations. Similarly, the optimal sizing and placement of BESS to enhance frequency stability in power systems is considered in Alsharif et al. (2022). The study emphasizes the importance of accounting for uncertainties in system parameters, such as loads and generation, to improve the accuracy of frequency stability assessments. The proposed methodologies for optimal BESS size and placement are validated using the IEEE 39-electrical power system and a simplified South-East Australian power system, demonstrating significant improvements in frequency stability. Meanwhile, in Ramos et al. (2023), a binary grey wolf optimization approach is used to define the locations and sizes of BESSs to improve voltage and frequency stability in a weak grid. The objective function is proposed to minimize voltage deviation and frequency response stability following a fault. Additionally, in Wong et al (2019b) whale optimization algorithm is implemented to optimize the location and size of BESS in the grid to reduce the energy losses in the distribution network.
In most of the aforementioned research regarding optimizing BESS size and location in electrical power systems, the authors use fictional electrical power systems to demonstrate their proposals. Moreover, most of the investigations were done at the high voltage side considering the system's stability, voltage, and frequency. The system's power losses were also considered. However, none of these researches have considered the system's reliability at the distribution level (33 kV or smaller).
Considering electrical power system reliability, and the dynamics of the load demand profiles. However, few types of research considered this issue. In Mohammad Rozali et al. (2018), for example, the authors introduced an advanced methodology for optimizing storage size in hybrid power systems by shifting electricity load from peak to off-peak hours. This approach leverages power pinch analysis to account for energy losses during power conversion, transfer, and storage. The authors develop two optimization strategies where the first shifts peak hour demand to off-peak periods with maximum electricity surplus. Meanwhile, the second targets periods with high excess electricity from the previous day. These strategies are tested on a case study involving wind, solar, and biomass energy sources, using sodium sulfur batteries for storage. The results demonstrate that implementing these load-shifting heuristics can significantly reduce the required storage capacity by up to 30%, and lower both storage and electricity costs. In addition to that, Li et al. (2018) applied multi-subgroup hierarchical chaos hybrid algorithm based on differential and particle swarm optimization to find the optimum size of BEES in a microgrid with RE generation. The method is then verified by using a modified IEEE-33 bus system. Moreover, in Rallabandi et al. (2019), the authors modeled the effect of coupling 1 MW/2 MWh BESS to a 10 MW PV system with a single inverter, where the BESS is operated to smooth out the output of the PV system. MILP is used to minimize the size of the BESS coupled with the PV system under two tariff scenarios which are feed-in tariff and flat rate, after considering the battery degradation rate (Wu et al., 2022).
However, in all of the aforementioned research, the environmental impact of such proposals was not considered. This statement was seconded by Murrant and Radcliffe (2018) who stated that although energy storage systems have multidimensional impacts on the grid including environment, society, and economy, these aspects are not usually considered as compared to techno-economic impacts. Moreover, Cossutta et al. (2022) claimed that studies about BESS sizing that address the technical, economic, and environmental aspects together are rare in the literature. Zhang et al. (2023) also concluded that optimal sizing of the BESS considering the environmental impacts is almost non-existent in 121 recently published research papers. Similarly, in Wong et al. (2019a, 2019b), it is claimed that out of 110 reviewed papers on optimal sizing of BESS, none of them considered optimizing the size of the BESS based on the least environmental impacts.
Research gaps, objectives, and contribution
As concluded from the literature, the majority of studies focus on the techno-economic aspects of BESS optimization, with limited attention to the environmental impacts. Moreover, most of the studies consider the integration of BESS at high-voltage levels of the electrical power system (higher than 33 kV). This is to avoid the dynamic load profile and other challenges such as multi-tariff and ampacity limitation implications. Moreover, most of the research articles do not consider real electrical power system performance and use fictional testing systems. Thus, there is a need for more comprehensive studies that incorporate environmental considerations into the optimal sizing of BESS considering real electrical power distribution networks with real operational challenges. Therefore, this research aims to
Analyse a real electrical power distribution network with a real reliability problem for possible BESS integration Utilize a real electrical power distribution network with high photovoltaic power penetration for possible BESS integration Optimally size BESS considering real dynamic energy tariff scheme Size the desired BESS battery based on an objective function that aims at minimizing the cost of the BESS subject to the maximum possible system's reliability and minimum environmental impact
Adapted network analysis
In this research, a 25 MVA/33 kV electrical power distribution network with a 7 MWp PV power plant is adapted. This network belongs to Jerusalem District Electricity Company (JDECo) which serves four main districts in Palestine namely East Jerusalem, Ramallah, Bethlehem, and Jericho. JEDCo distribution network is considered the biggest electricity distribution network in Palestine with a total contracted capacity of 915 MVA, thousands of kilometers of electrical power distribution lines, 48 (33/11 kV) power stations, 3290 (11/0.4 kV) power distribution transformers, and 360k end-users by the end of 2023.
JDECo electrical power distribution network experiences varying peak demand based on the season, with the highest peaks in the summer and the winter (648 MVA and 598 MVA, respectively). The total energy consumption of the JDECo electrical power distribution network was 2972.07 GWh during 2023.
The main electrical power sources of the JDECo network are from four main sources which are Israel Electric Corporation (IEC), Palestinian Electricity Transmission Ltd (PETL), Jordan, and several PV power plants as shown in Table 1. It is worth noting that PETL also sources electricity from IEC, making the real percentage of electrical power supplied by IEC to be 91.31%.
JDECo's electricity by source.
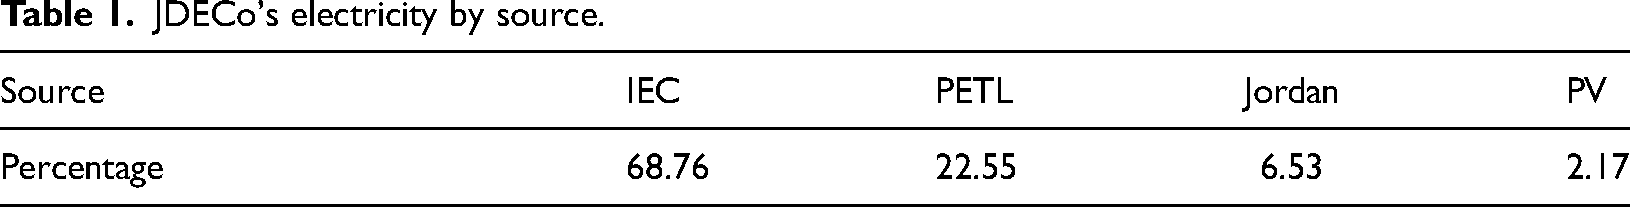
As a fact, JDECo faces significant challenges concerning ampacity limitations within its electrical network due to the current political situation (Khatib et al., 2021). These limitations are particularly problematic during peak demand periods when the current demand exceeds the network's capacity. Furthermore, shortages in electrical supply exacerbated by regional and geopolitical factors often strain the network, leading to inconsistent power availability in certain areas. In addition to ampacity limitations and supply shortages, JDECo also grapples with the challenges associated with integrating new PV power systems installations into the grid. The current electrical infrastructure often lacks the capacity and flexibility to efficiently incorporate these new energy resources. This integration requires significant upgrades to the existing topology of the grid to be capable of handling bidirectional energy flows, especially as IEC does not accept reverse power flow at the injection points. Thus, the intermittent nature of solar power necessitates the development of robust energy storage solutions to ensure stability and reliability.
Figure 1 shows the adapted electrical power distribution network. This electrical power distribution network serves an area that consists of 13 villages, with a total number of end-users of 7724.
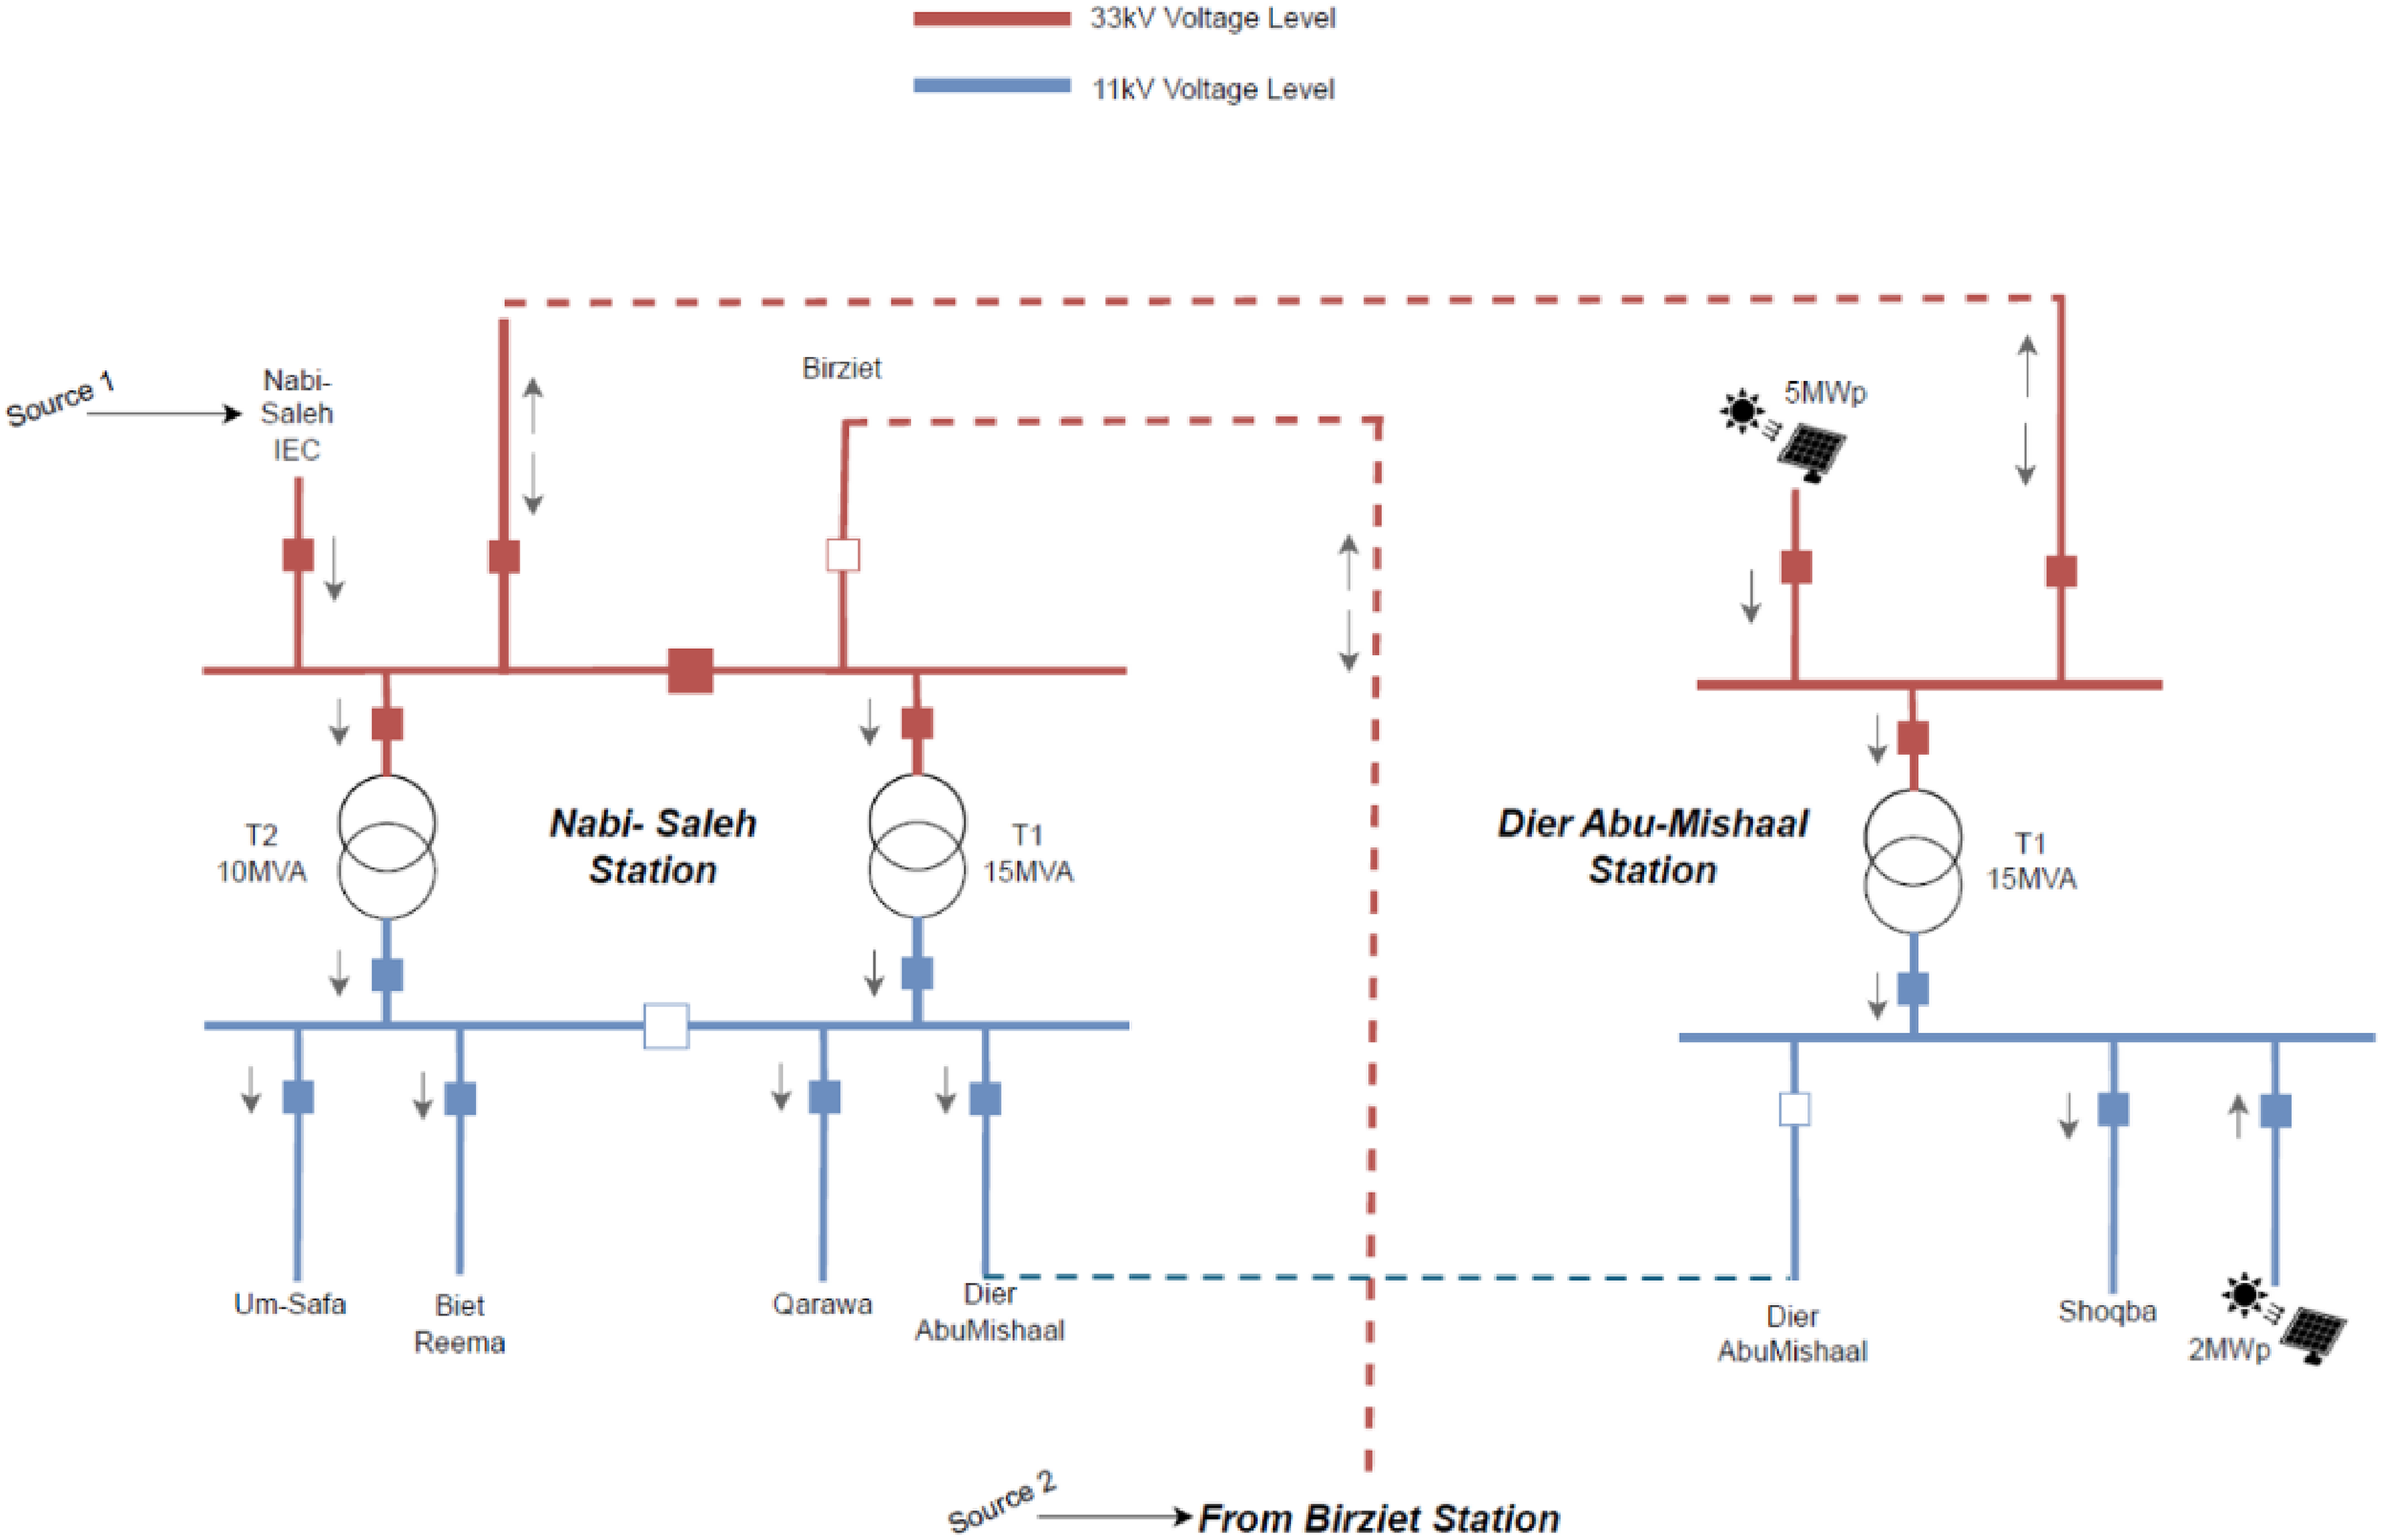
Adapted electric power distribution system.
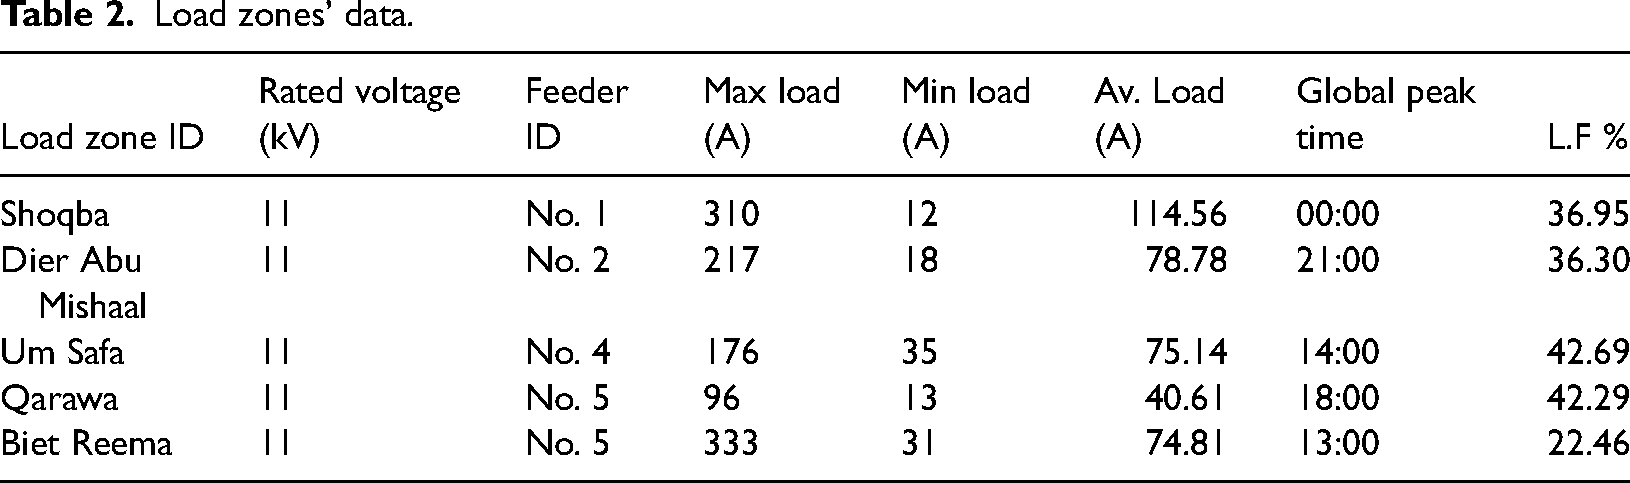
This network consists of five main load zones as specified in Table 2. The main source of this electrical power distribution network is a 33 kV coupling point from IEC with a capacity of 7.5 MVA. This point powers two 33/11 kV power stations. The first power station has two main power transformers with capacities of 15 MVA, and 10 MVA. Both of these transformers power an 11 kV busbar that is connected to four main feeders (No. 2, No. 3, No. 4, No. 5). The other station has another 15 MVA transformer. The two 33/11 kV stations are connected via a 33 kV power corridor which it is used to power loads of Shoqba. Meanwhile, it is also used to evacuate PV power in case of surplus energy to the main coupling point. Moreover, the main coupling point is supported by a backup 33 kV power feeder incoming from Birzeit substation which is directly connected to 161/33 kV power station from IEC with an ampacity cap of 27 A/33 kV.
Load zones’ data.
This power distribution zone is also powered by two main photovoltaic power plants with capacities of 5 MWp and 2 MWp. The 5 MWp system is connected to the power distribution network via two 0.8/33 kV transformers each rated at 2.5 MVA (at the power corridor feeder). The length of the power corridor is 9.3 km and it is connected directly at the main coupling point. Meanwhile, the 2 MWp photovoltaic plants is connected via a 0.8/11 kV transformer rated at 2 MVA to the 11 kV busbar at Shoqba load zone, and it mainly powers shoqba loads and in case of surplus energy, it evacuates power via the power corridor.
The actual performance of this network is recorded to use it in conducting this research. These hourly data were obtained from the SCADA center of JDECo. These data are for the period of 2 January 2024, to 24 May 2024. A sample of these data is shown in Figure 2.
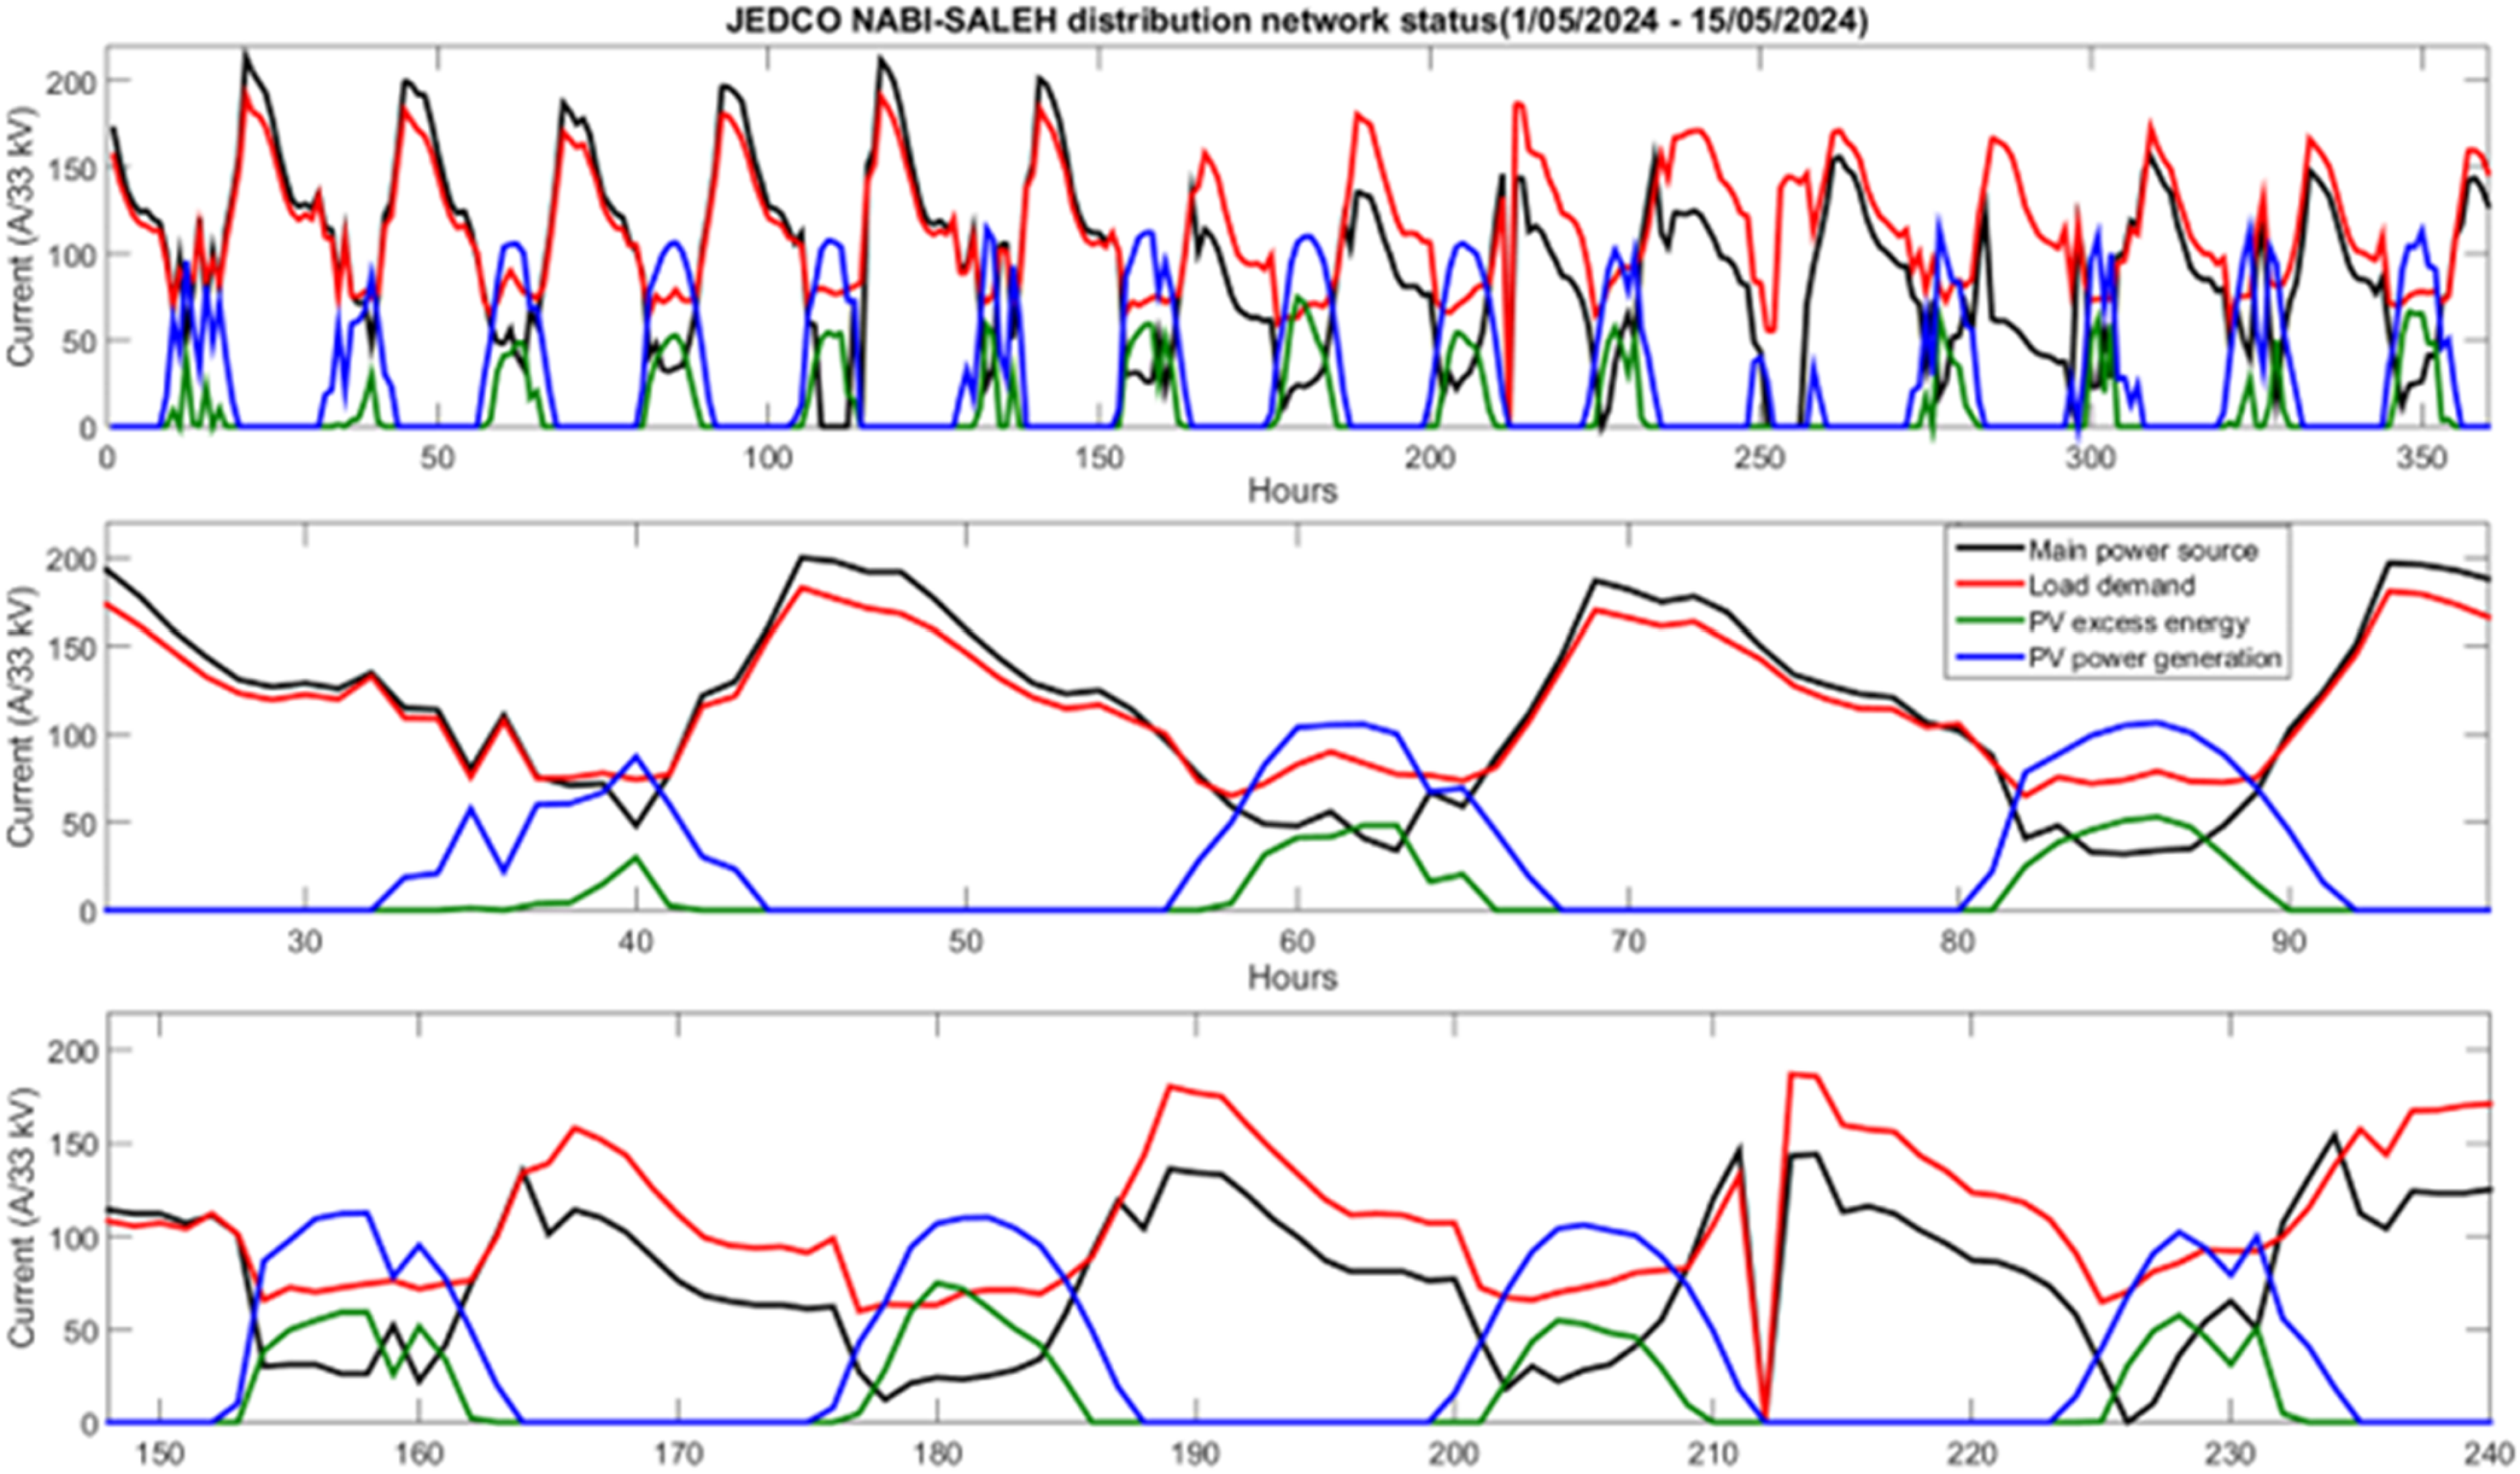
Actual performance of the adapted electrical power distribution network (a) Actual performance of all system's components (first subplot), (b) The case of excess power (second subplot), and (c) The case of power deficit (third subplot).
Figure 2(b) (second subplot) shows the case where the demand is covered by the available sources with no deficit. Meanwhile, Figure 2(c) (third subplot) shows the case when the available resources are unable to cover the demand. In this case (the case in Figure 2(c)), the backup feeder incoming from Birzeit station (12.5 km away) is used as this deficit occurs during times when there is no PV generation. However, by analyzing these data, it can be concluded that cases of excess energy during the day also occurred. The excess energy is also exported via the backup feeder incoming from Birzeit station to avoid any reverse power at the IEC main coupling point.
Table 3 shows a summary of the adapted electrical power distribution network data analysis. This table summarizes the total available energy from conventional sources, the total load demand, total PV energy consumed locally, total PV energy exported, total reverse energy towards IEC and Birziet station, and finally total deficit of energy.
Daily energy balance of the distribution network.
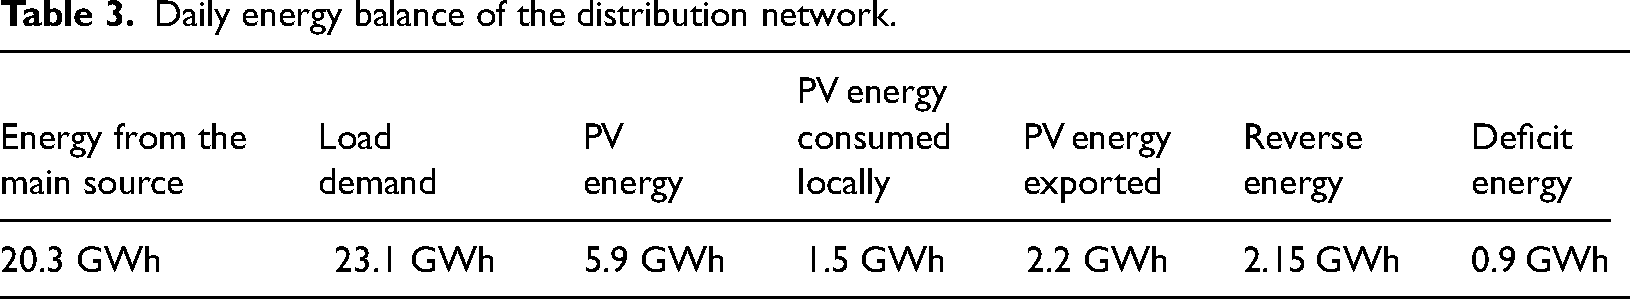
During the day when the PV generation is at its maximum, and the conventional sources are readily available, excess energy is exported far away from the center of loads to prevent the occurrence of reverse power at the IEC coupling point. Meanwhile, during deficit times, energy is imported via a backup feeder from Birziet station to fulfill the demands. However, all of these procedures do not prevent the occurrence of energy deficit at specific times. Moreover, such practice is being applied manually and results in technical losses that can be avoided if the excess PV energy can be stored in addition to available conventional energy during the off-peak time to be used in the deficit time.
Moreover, this practice costs about 300% of the normal energy cost as the tariff during the deficit time is almost triple the energy cost during the day. Table 4 shows the tariff scheme of IEC which mainly powers this electrical distribution network. The green color means that the cost of energy is 0.08939 USD/kWh including value-added tax (VAT), while the red color means that the cost of energy is 0.2359 USD/kWh including VAT.
Energy tariff scheme in the adapted electrical power distribution network.

BESS sizing
Figure 3 illustrates the proposal of this research. Based on a comprehensive analysis of the electrical power distribution data, most of the deficit energy incidences occur during the afternoon and night (after 16:00). Meanwhile, there is excess energy from the PV plant during the noon. Moreover, the IEC electrical power point is slightly loaded during the noon which means that the excess energy of PV and the spare energy of the IEC electrical power point can be used to charge a BESS to fulfill the deficit energy during the night. This practice will supply the loads locally without the need to import power from far electric power points via backup transmission lines. Moreover, this practice will power the loads at a much lower price according to the applied energy tariff scheme.
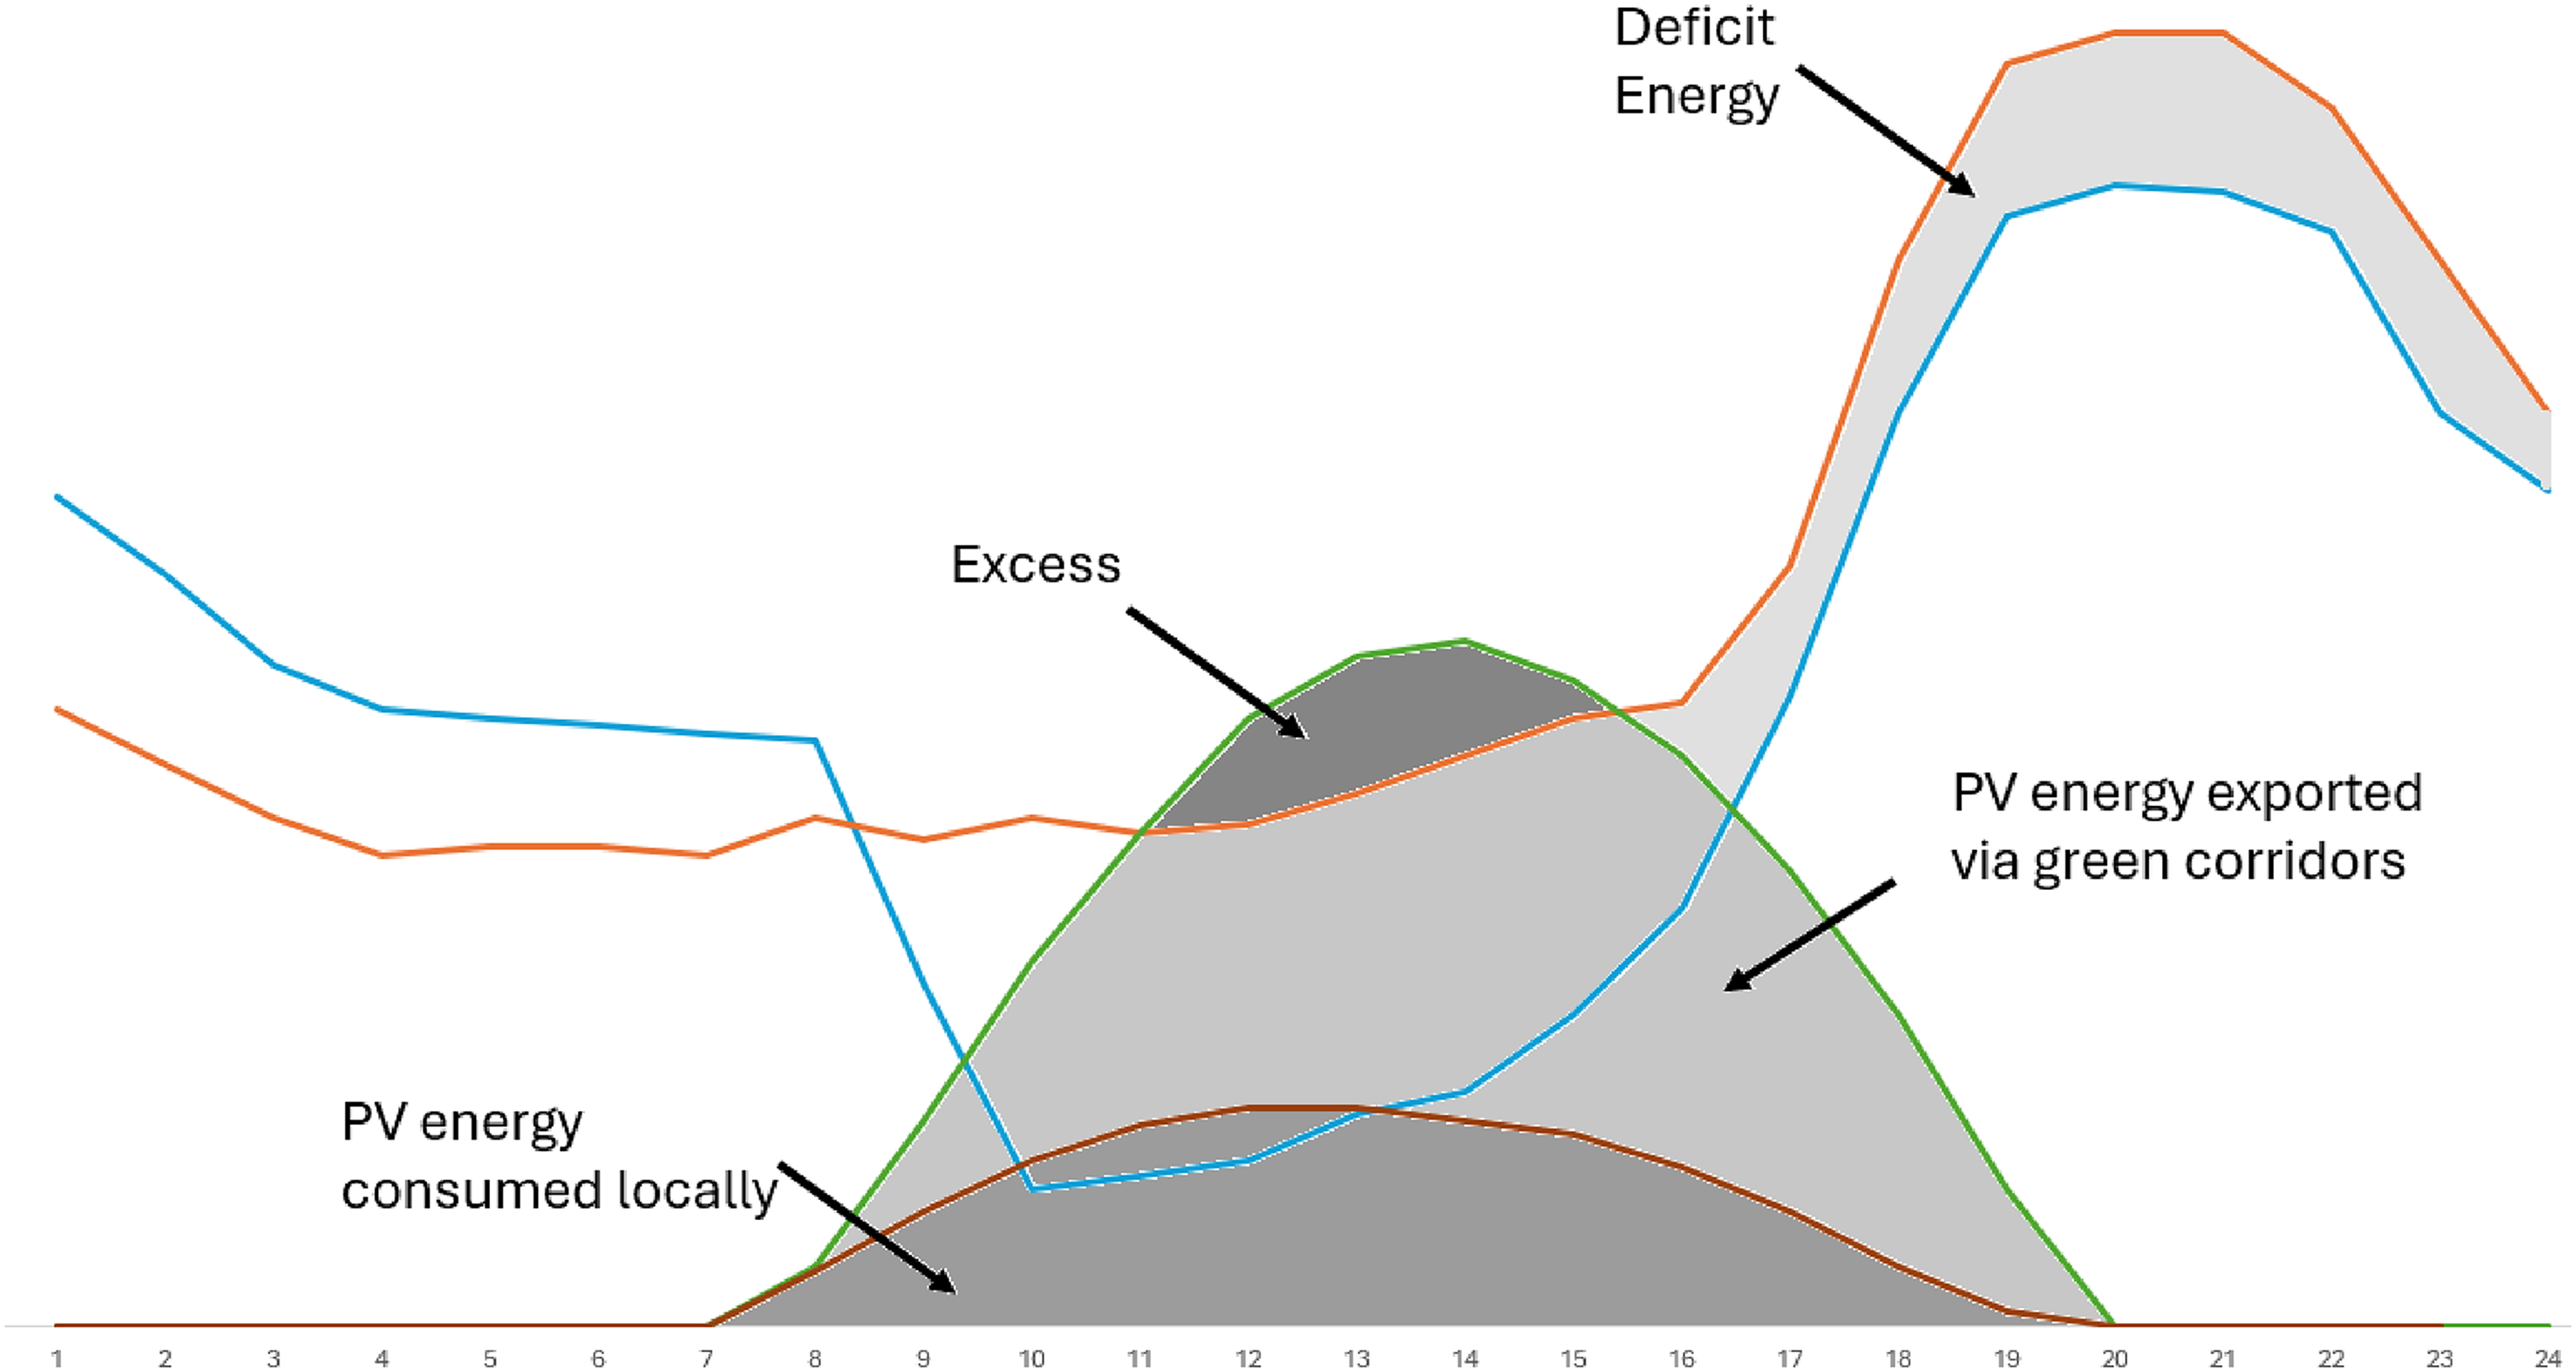
Typical daily behavior of the adapted electrical power-distributing network.
To do so, optimization of the BESS based on the daily deficit energy considering BESS cost, energy tariff, and proposal feasibility is required. All this should be subject to a low load rejection rate and environmental impact. The load rejection is defined in this paper as loss of load probability. Meanwhile, the environmental impact is assessed based on a detailed life cycle assessment (LCA).
Network modeling
To conduct an optimization of the desired BESS, the adapted electrical power distribution network is modeled mathematically. The main power source (SOURCE) is obtained based on the reading of the current sensor at 33 kV as the main IEC power point and defined below,
Meanwhile, load demand data are obtained from the current sensors at each power transformer at 11 kV and then converted to 33 kV values as below,
Similarly, the PV generation is obtained from current sensors at each step-up transformer (33 and 11 kV) and then unified at the same voltage level as below,
Excess energy is defined as the difference between PV generation and load demand during the solar daytime as follows,
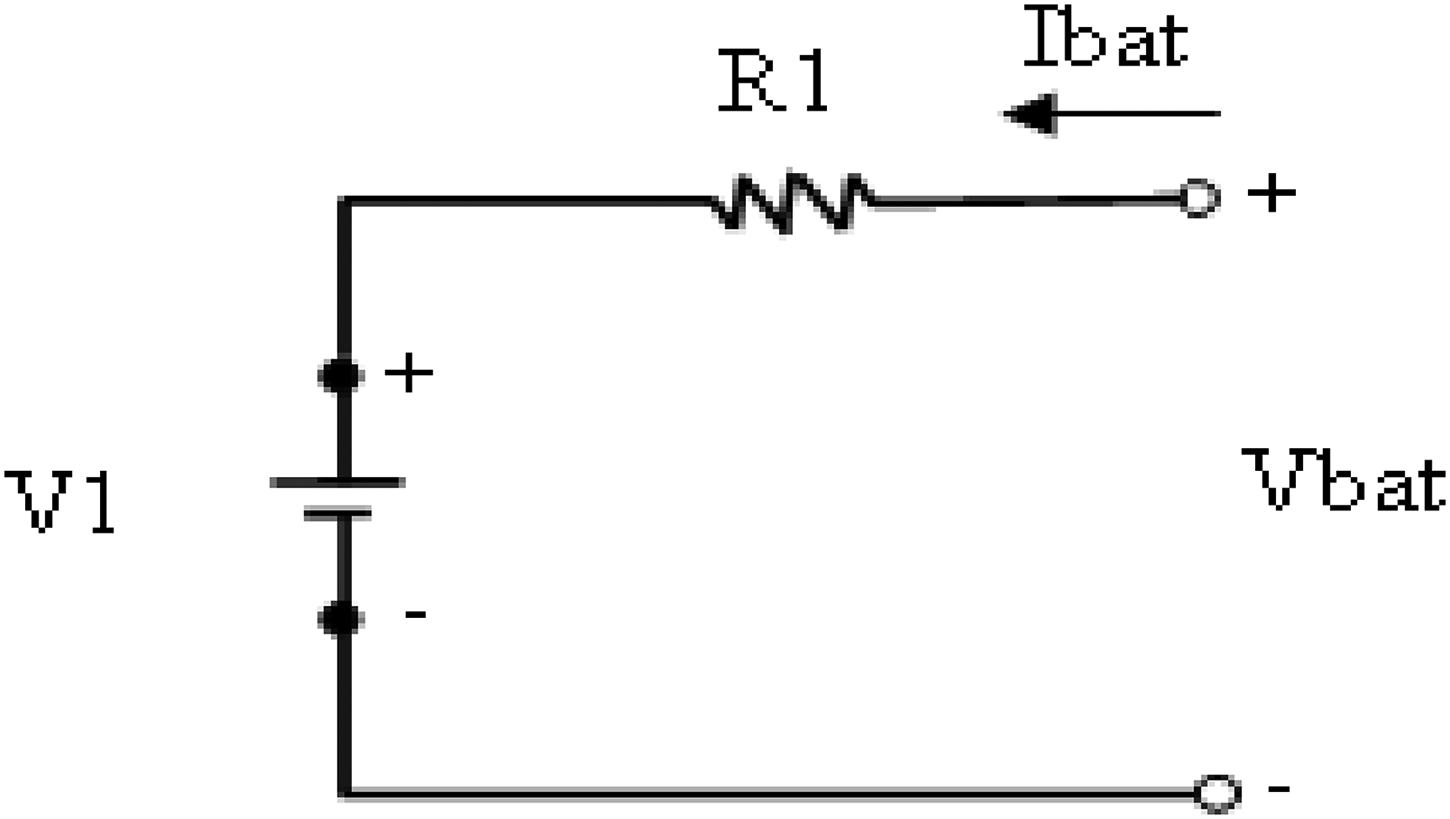
Physical model of the battery in the charging mode.
The state of charge (SOC) of the battery is expressed as,
The depth of charge (DOD) of the battery is given by,


Rch represents the charging resistance and it can be calculated by the following equation,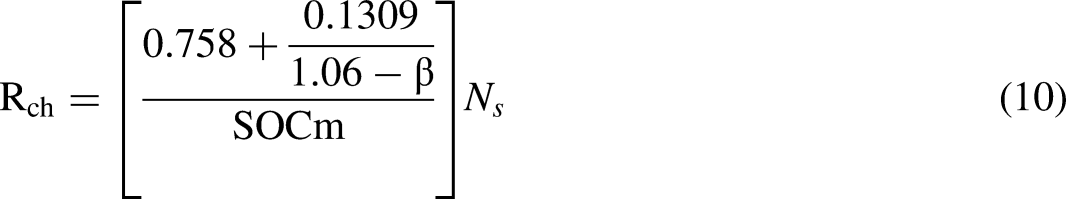


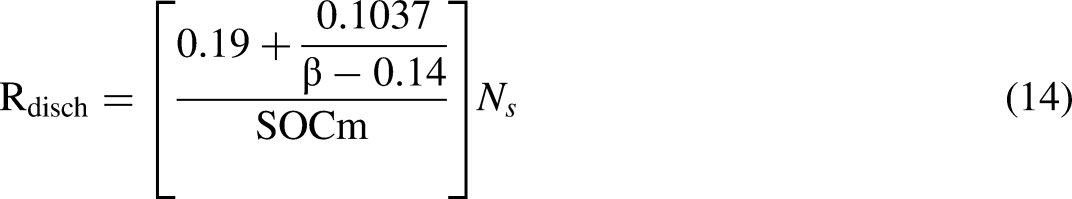
The discharging mode is defined by the following equations:


The required energy to charge the BESS during the project's lifetime can be calculated by,
Environmental impacts assessment of BESS
LCA is a systematic method used to evaluate the environmental impacts associated with all stages of a product's life from cradle to grave. This includes raw material extraction, material processing, manufacturing, distribution, use, and disposal or recycling. The LCA methodology for BESS follows several standardized steps as below,
Goal and Scope Definition: The first step is defining BESS boundaries. In this research, the boundaries defined by Thomas et al. (2020) for different BESS applications are adapted. These boundaries, considers the cradle-to-gate analysis which includes raw material extraction and manufacturing processes. Life Cycle Inventory (LCI): This phase involves the collection of data related to the energy and material inputs and outputs for each stage of the battery's life cycle. Data sources include industrial databases, literature reviews, and direct measurements from manufacturing facilities. In this research the LCI proposed by Hiremath et al. (2015) is utilized. This LCI contains data on material and energy flows for various battery chemistries. Life Cycle Impact Assessment (LCIA): LCIA phase converts the inventory data into potential environmental impacts. This involves categorizing and quantifying the effects on different environmental aspects such as global warming potential, acidification, eutrophication, and resource depletion. In this research the methodology proposed by Yudhistira et al. (2022) is adapted for the LCIA. Interpretation: The final step involves interpreting the results to make informed decisions, identify significant impacts, and suggest improvements (Pellow et al., 2020).
In this research Ecoinvent database, literature, and industry reports are used. Data from Majeau-Bettez et al. (2011) which implies incorporated comprehensive data from the Ecoinvent database for material and energy flows involved in battery production are used. After that ReCiPe method (Tolomeo et al., 2020) is used to assess the environmental impacts BESS. This methodology is used to evaluate the different BESS technologies after obtaining size optimization results. This practice is to ensure using technology with least environmental impact.
Optimization algorithm
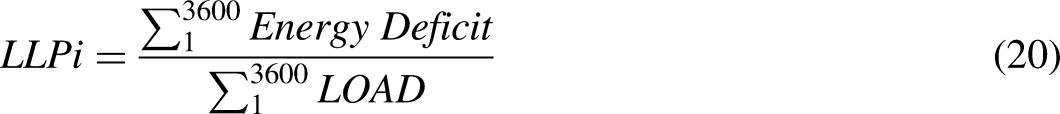
In this research, the objective function of the optimization is drafted as below,
Figure 5 shows the approach for solving the objective function drafted in equation (20). The process begins with the collection of various data inputs, including the load demand and PV generation capacity. Initially, data on the energy load demand of the network is gathered, along with the PV energy generation capacity. Additionally, the maximum ampacity of the IEC injection point is specified (170 A at 33 kV), and the characteristics of the BESS to be used are determined (mainly the roundtrip efficiency, the desired DOD, and C-rate).
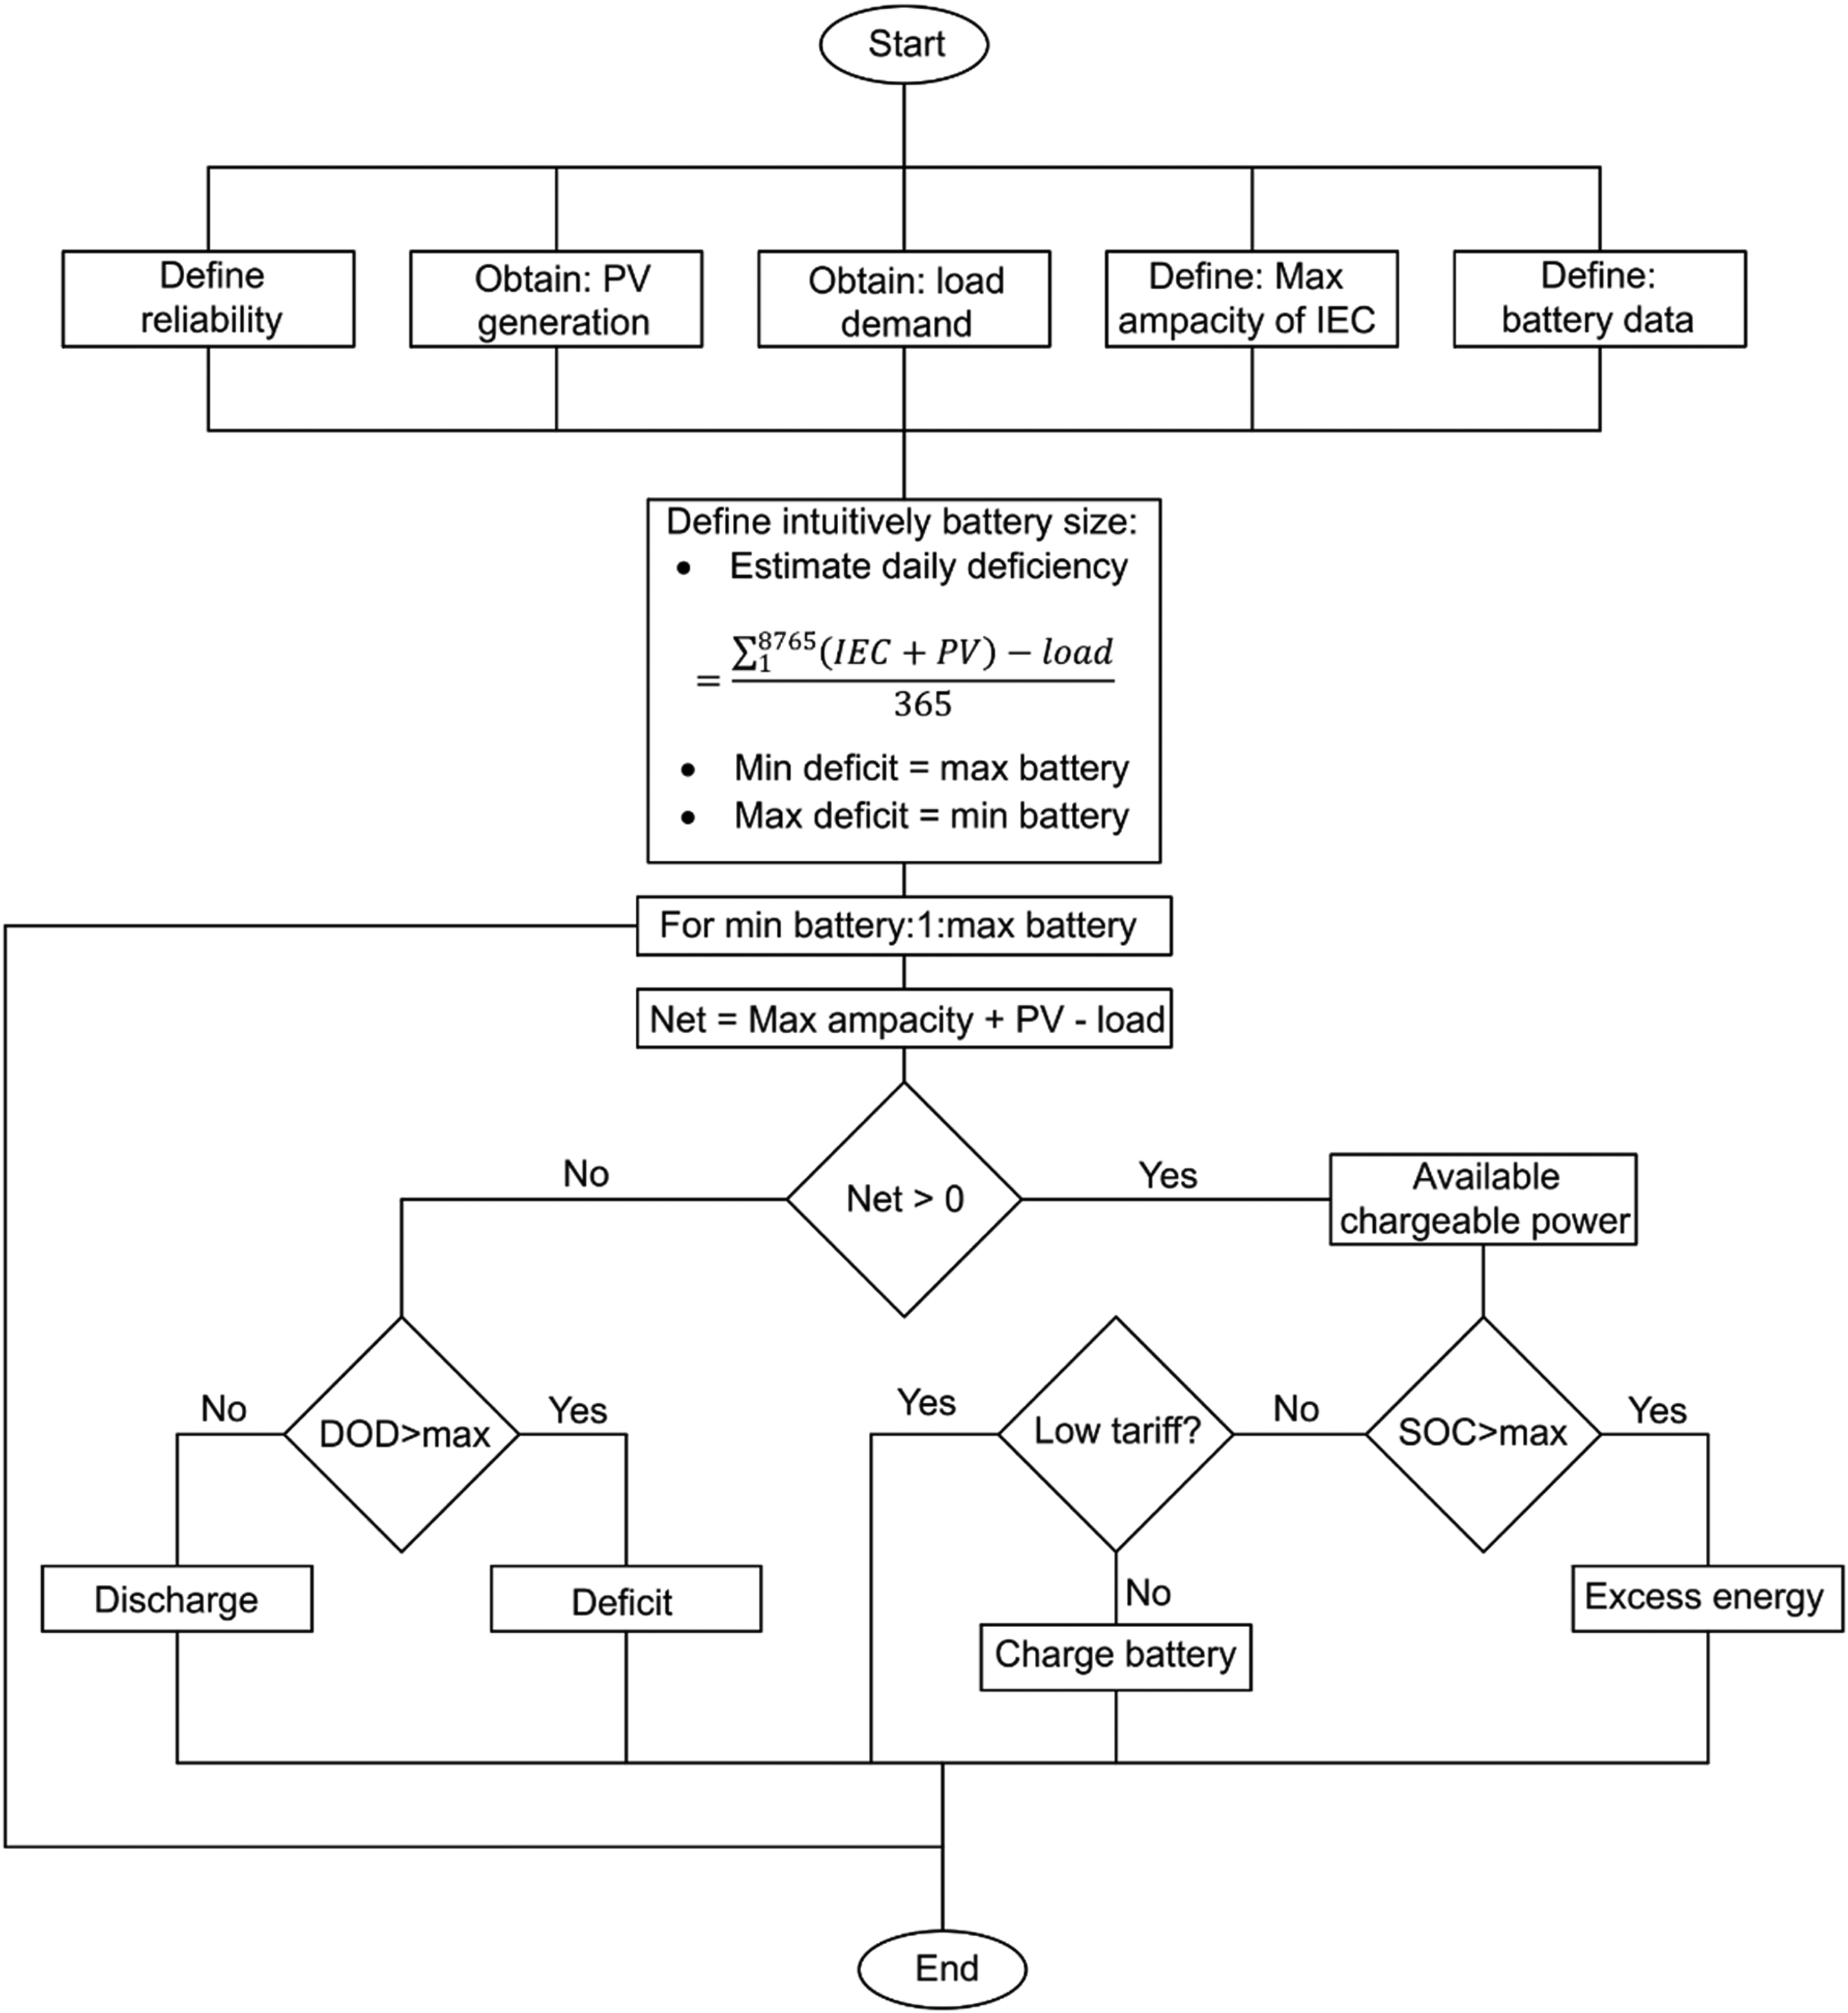
Optimization algorithm flow chart.
After that, the net energy available is calculated by subtracting the load from the sum of the maximum ampacity from IEC and PV generation. Following this, an iteration through potential battery sizes from minimum to maximum capacities is performed. During this iteration, the daily energy deficiency is estimated based on the calculated net energy. Reliability criteria are defined to ensure the selected battery size consistently meets the network's energy demands.
Energy management within this framework involves several conditional checks. If the net energy is greater than zero, indicating surplus energy, the available chargeable power is determined. At this stage, the current tariff is checked; if it is low, the battery is charged. Otherwise, it is not allowed to charge the battery from the IEC. Conversely, if the net energy is less than zero, indicating an energy deficit, the battery is discharged to meet the energy demand. Throughout this process, it is ensured that the DOD does not exceed the maximum allowed value and that the SOC remains within the permissible range.
For all potential battery sizes, LLP is evaluated to determine the minimum BESS size that meets the desired LLP value. This methodical approach ensures that the selected BESS size can efficiently balance the energy surplus and deficit in the network, optimizing both reliability and cost-effectiveness.
The process described in the algorithm in Figure 5 produces a design space array that contains various battery sizes with corresponding LLP. After that, the LLP is then set to 1% thus resulting in a smaller array that only contains battery sizes that satisfy the desired LLP. The cost of each size option in the optimum sizing array is then calculated and based on the lowest cost, the optimum size is concluded.
Results and discussion
BESS optimization results
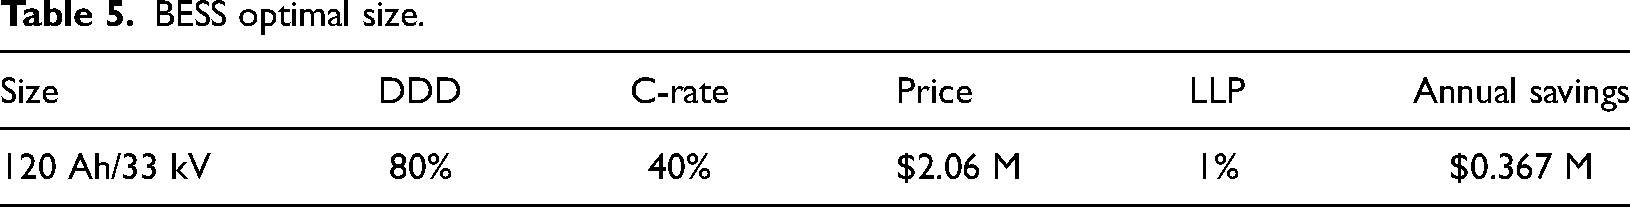
Figure 6 shows the optimization results as a relation between BESS size, and the LLP. From the figure, it is clear that the relation between BESS size and LLP is logarithmic, whereas BESS size increases dramatically when LLP decreases. It is clear from the figure as well that BESS size which is around 120 Ah/33 kV fulfils the desired LLP level (1%). Here sub-design space with different BESS sizes is generated and the cost of each BESS choice is calculated based on cost assumptions. In this research, it is assumed that the 1 Ah/33 kV costs 17,166 USD including VAT. This cost includes the battery and its power conditioning and management unit, the metering unit as well as the switchgear. This price also includes shipping, installing, and commissioning the batteries. The cost of the battery containers, including cooling devices and high voltage components, is about 58% of this cost. Meanwhile, 15% of this cost is for the shipping of the battery. The remaining cost is for the installation and commissioning of the system, including all required equipment and logistics. Meanwhile, the cost of energy per kWh is obtained from Table 4 given that the green color means the cost of energy is 0.08939 USD/kWh including tax, while the red color means that the cost of energy is 0.2359 USD/kWh including tax. Table 5 shows the optimal size selected from this optimization process.
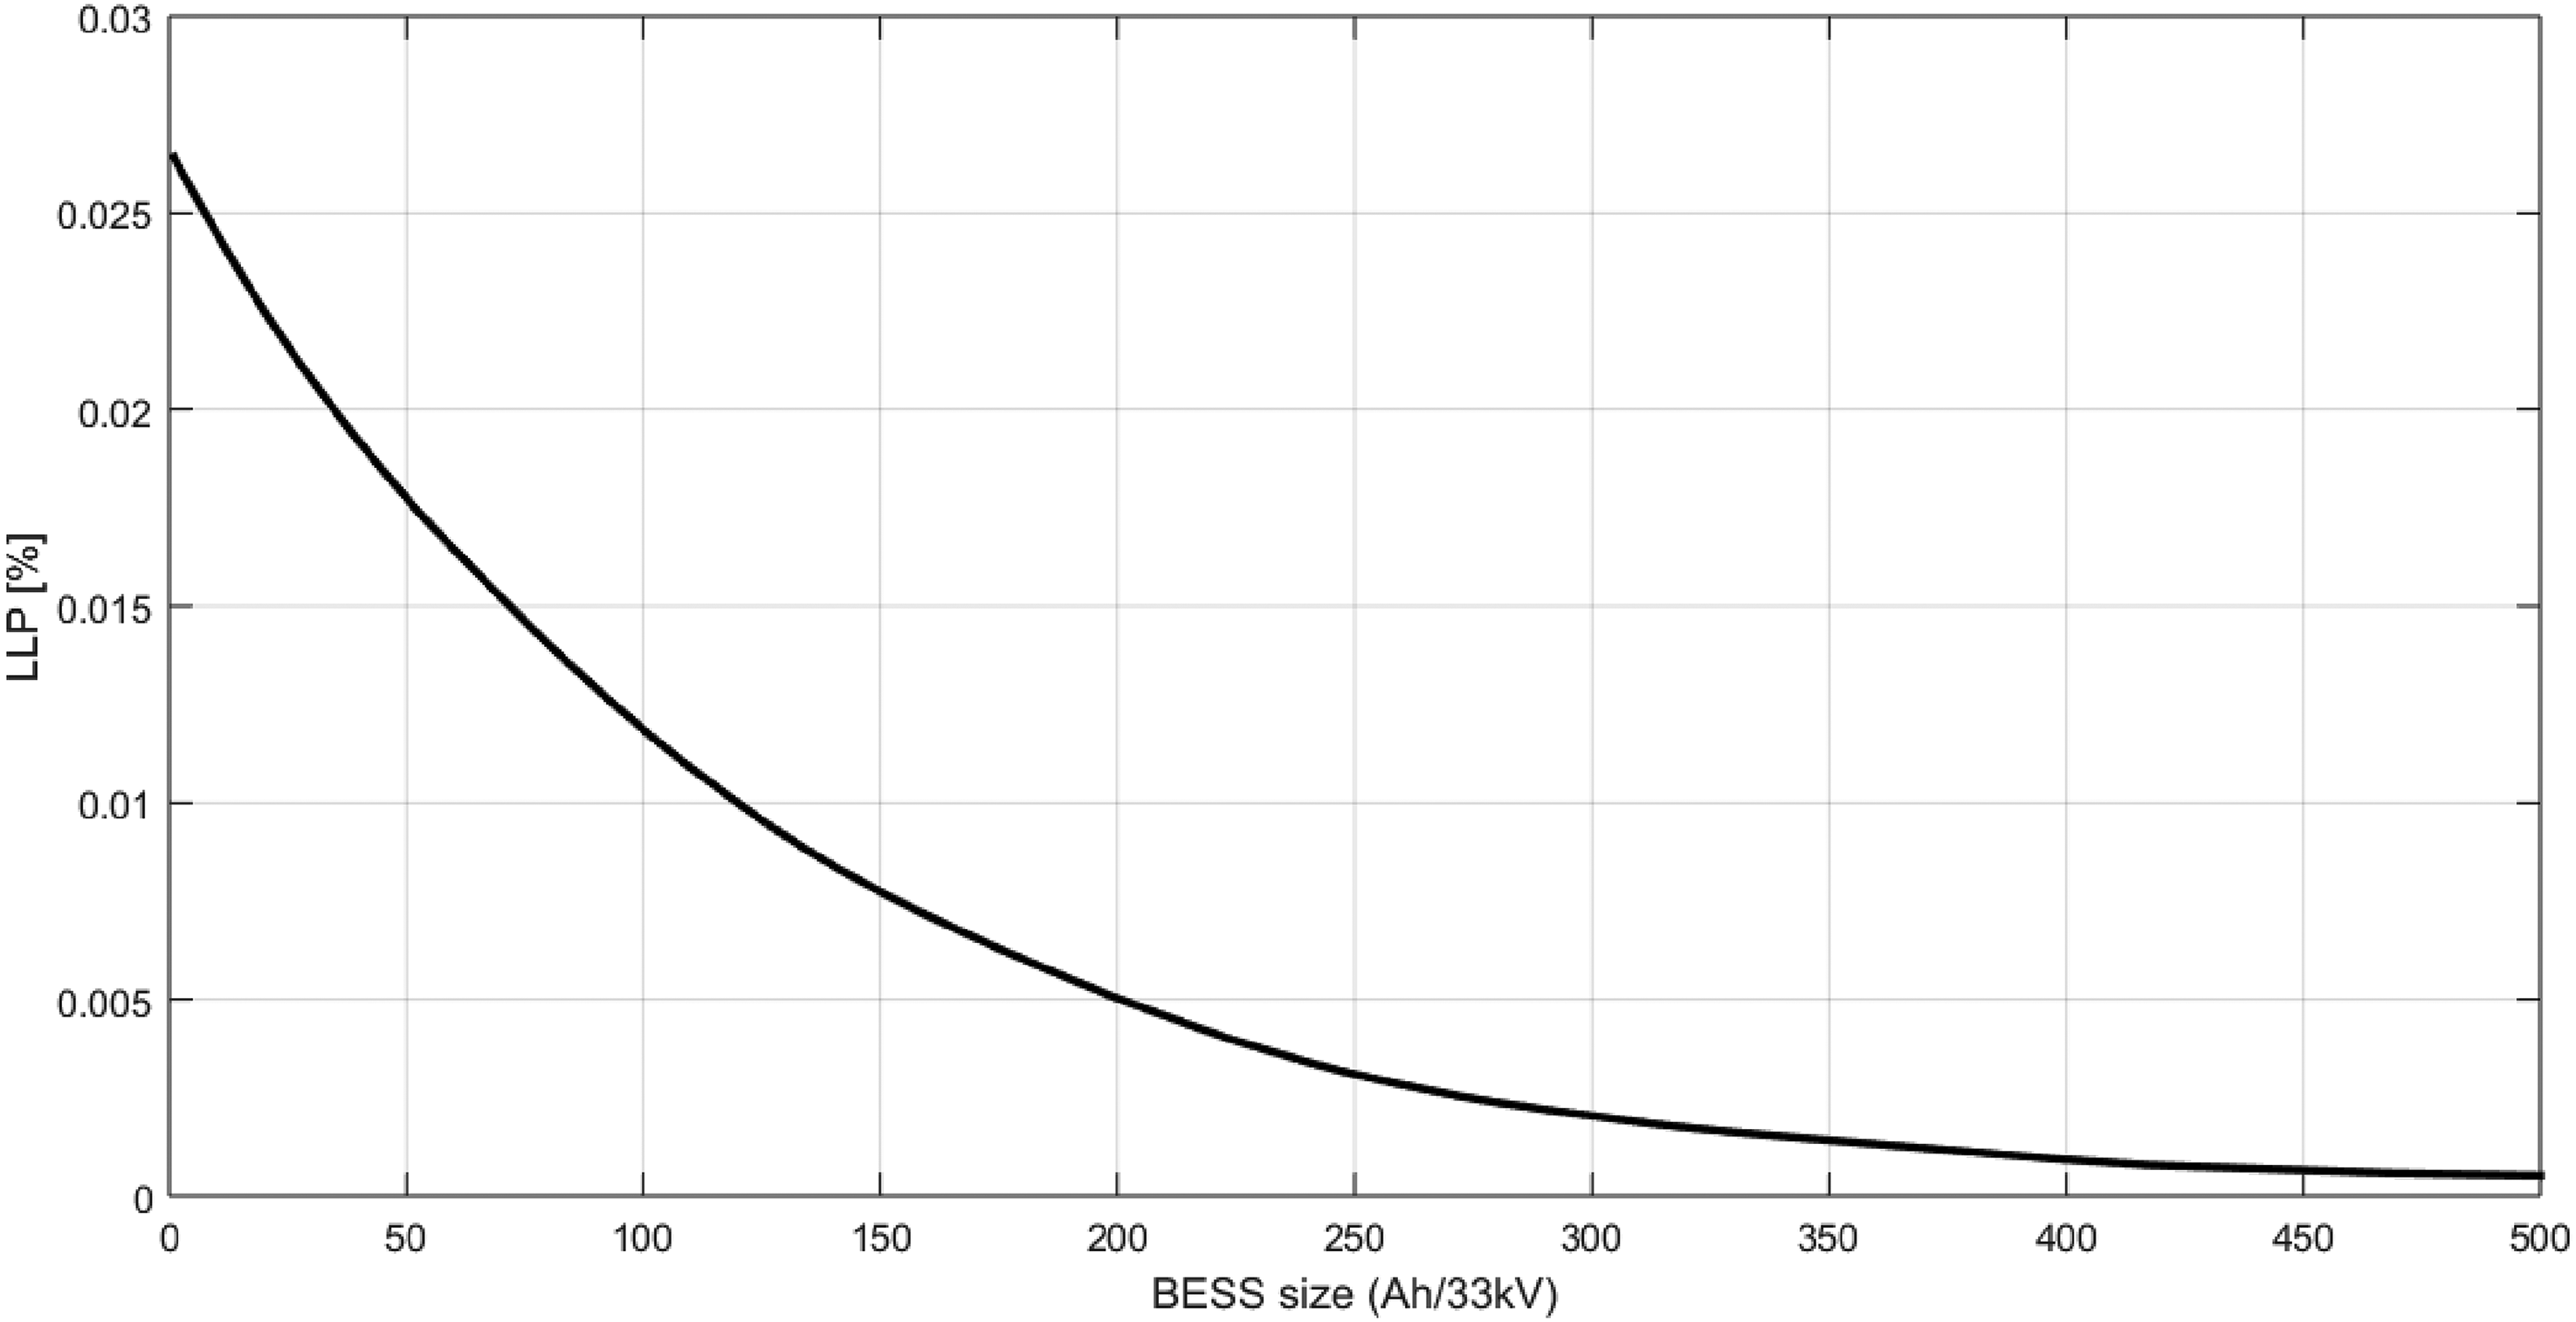
Relationship between BESS size and loss of load probability.
BESS optimal size.
To validate the result of the proposed optimization algorithm, a real-time simulation is performed for the adapted electrical power distribution network with the suggested BESS. Figure 7 illustrates the results of the analysis performed on an hourly data basis. Figure 7 consists of four subplots, each representing a different aspect of the electricity supply and demand over a 240-h period (10 days).
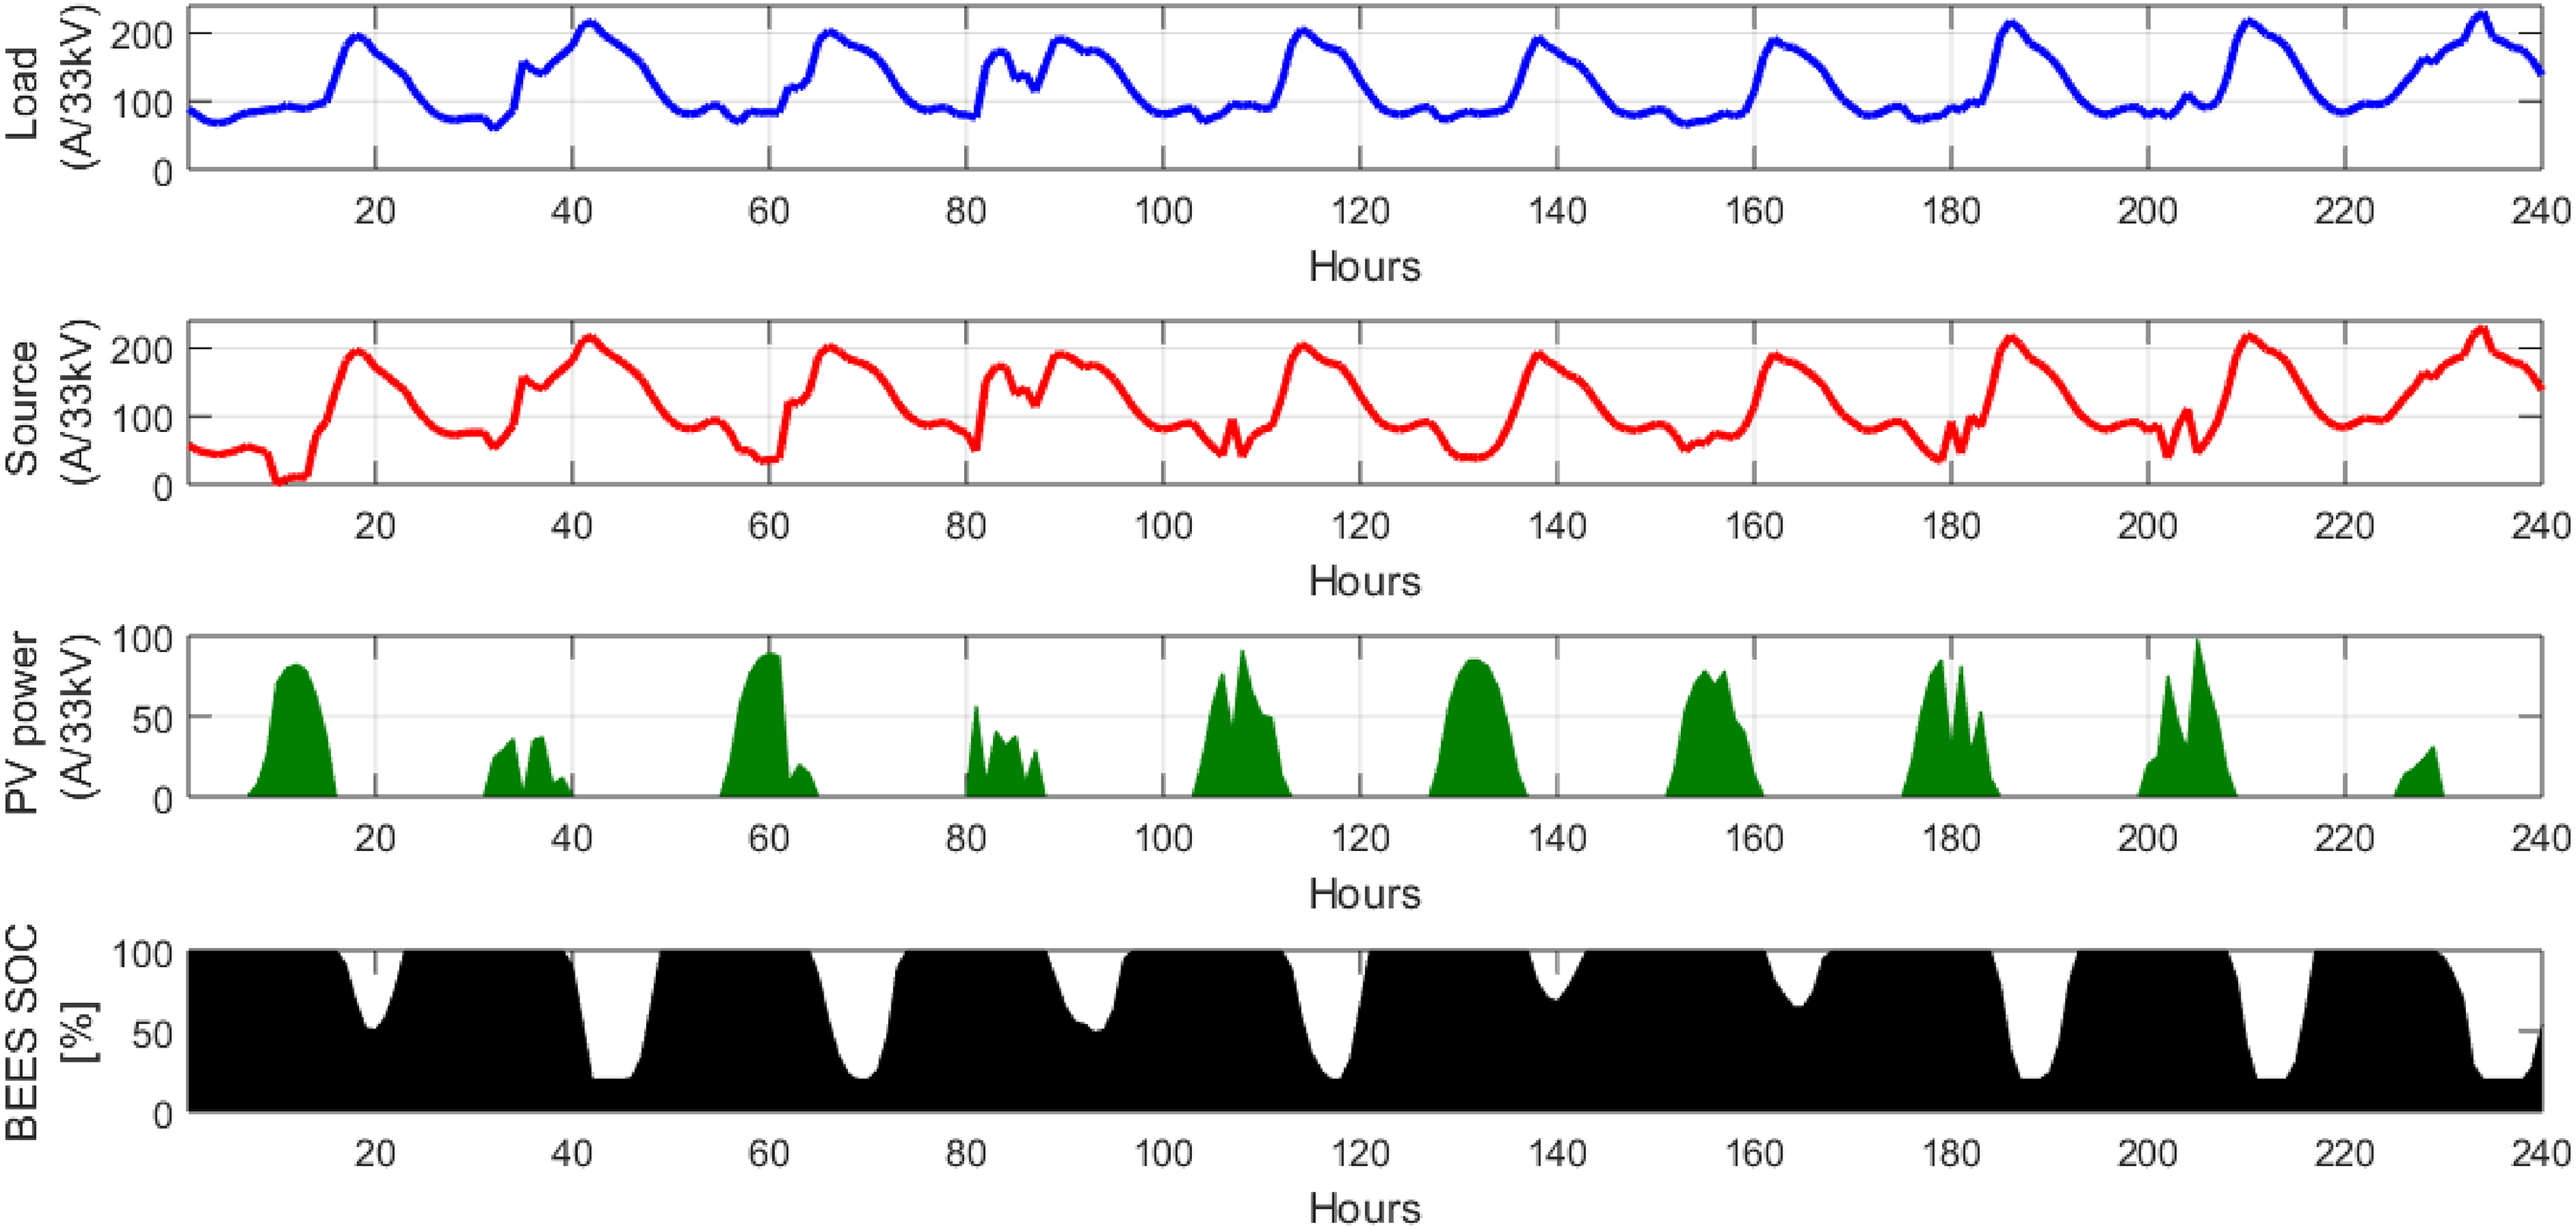
Hourly analysis of electricity supply, demand, PV generation, and BESS state of charge for the JDECO network.
Figure 7(a), depicted in blue, shows the total electrical demand (load). The load fluctuates significantly, indicating variable demand at different times. Peaks and troughs can be observed, which are characteristic of daily usage patterns. Meanwhile, Figure 7(b), shown in red, represents the electricity supply from the main source with notable synchronization with the load patterns, suggesting a close matching of supply to demand. On the other hand, Figure 7(c), illustrated in green, shows the power generation from PV sources. The PV power data indicates periods of generation primarily during daylight hours, with peaks corresponding to times of higher solar irradiance. The PV power contributions are intermittent and vary in magnitude. Lastly, Figure 7(d), displayed in black, represents the SOC of the proposed BESS for the network. The SOC fluctuates between 20% and 100%, reflecting the charging and discharging cycles of the BESS. The SOC trends show the BESS responding to the balance between load demand and PV generation, storing excess energy when available and discharging during periods of higher demand.
In addition, Figure 8 focuses more on BESS SOC status during the simulation period. From the figure, it is clear that the suggested BESS could successfully power the extra load demand and perform a daily cycle of Charge and discharge. It is also worth mentioning that the figure shows that the battery avoids any charging current during the “high energy cost” time in order to increase the feasibility of the proposed solution.
BESS SOC status over the simulation time.
On the other hand, Figure 9 illustrates the impact of integrating the described BESS into the electrical network under investigation by comparing the energy deficit both before and after the integration of BESS.
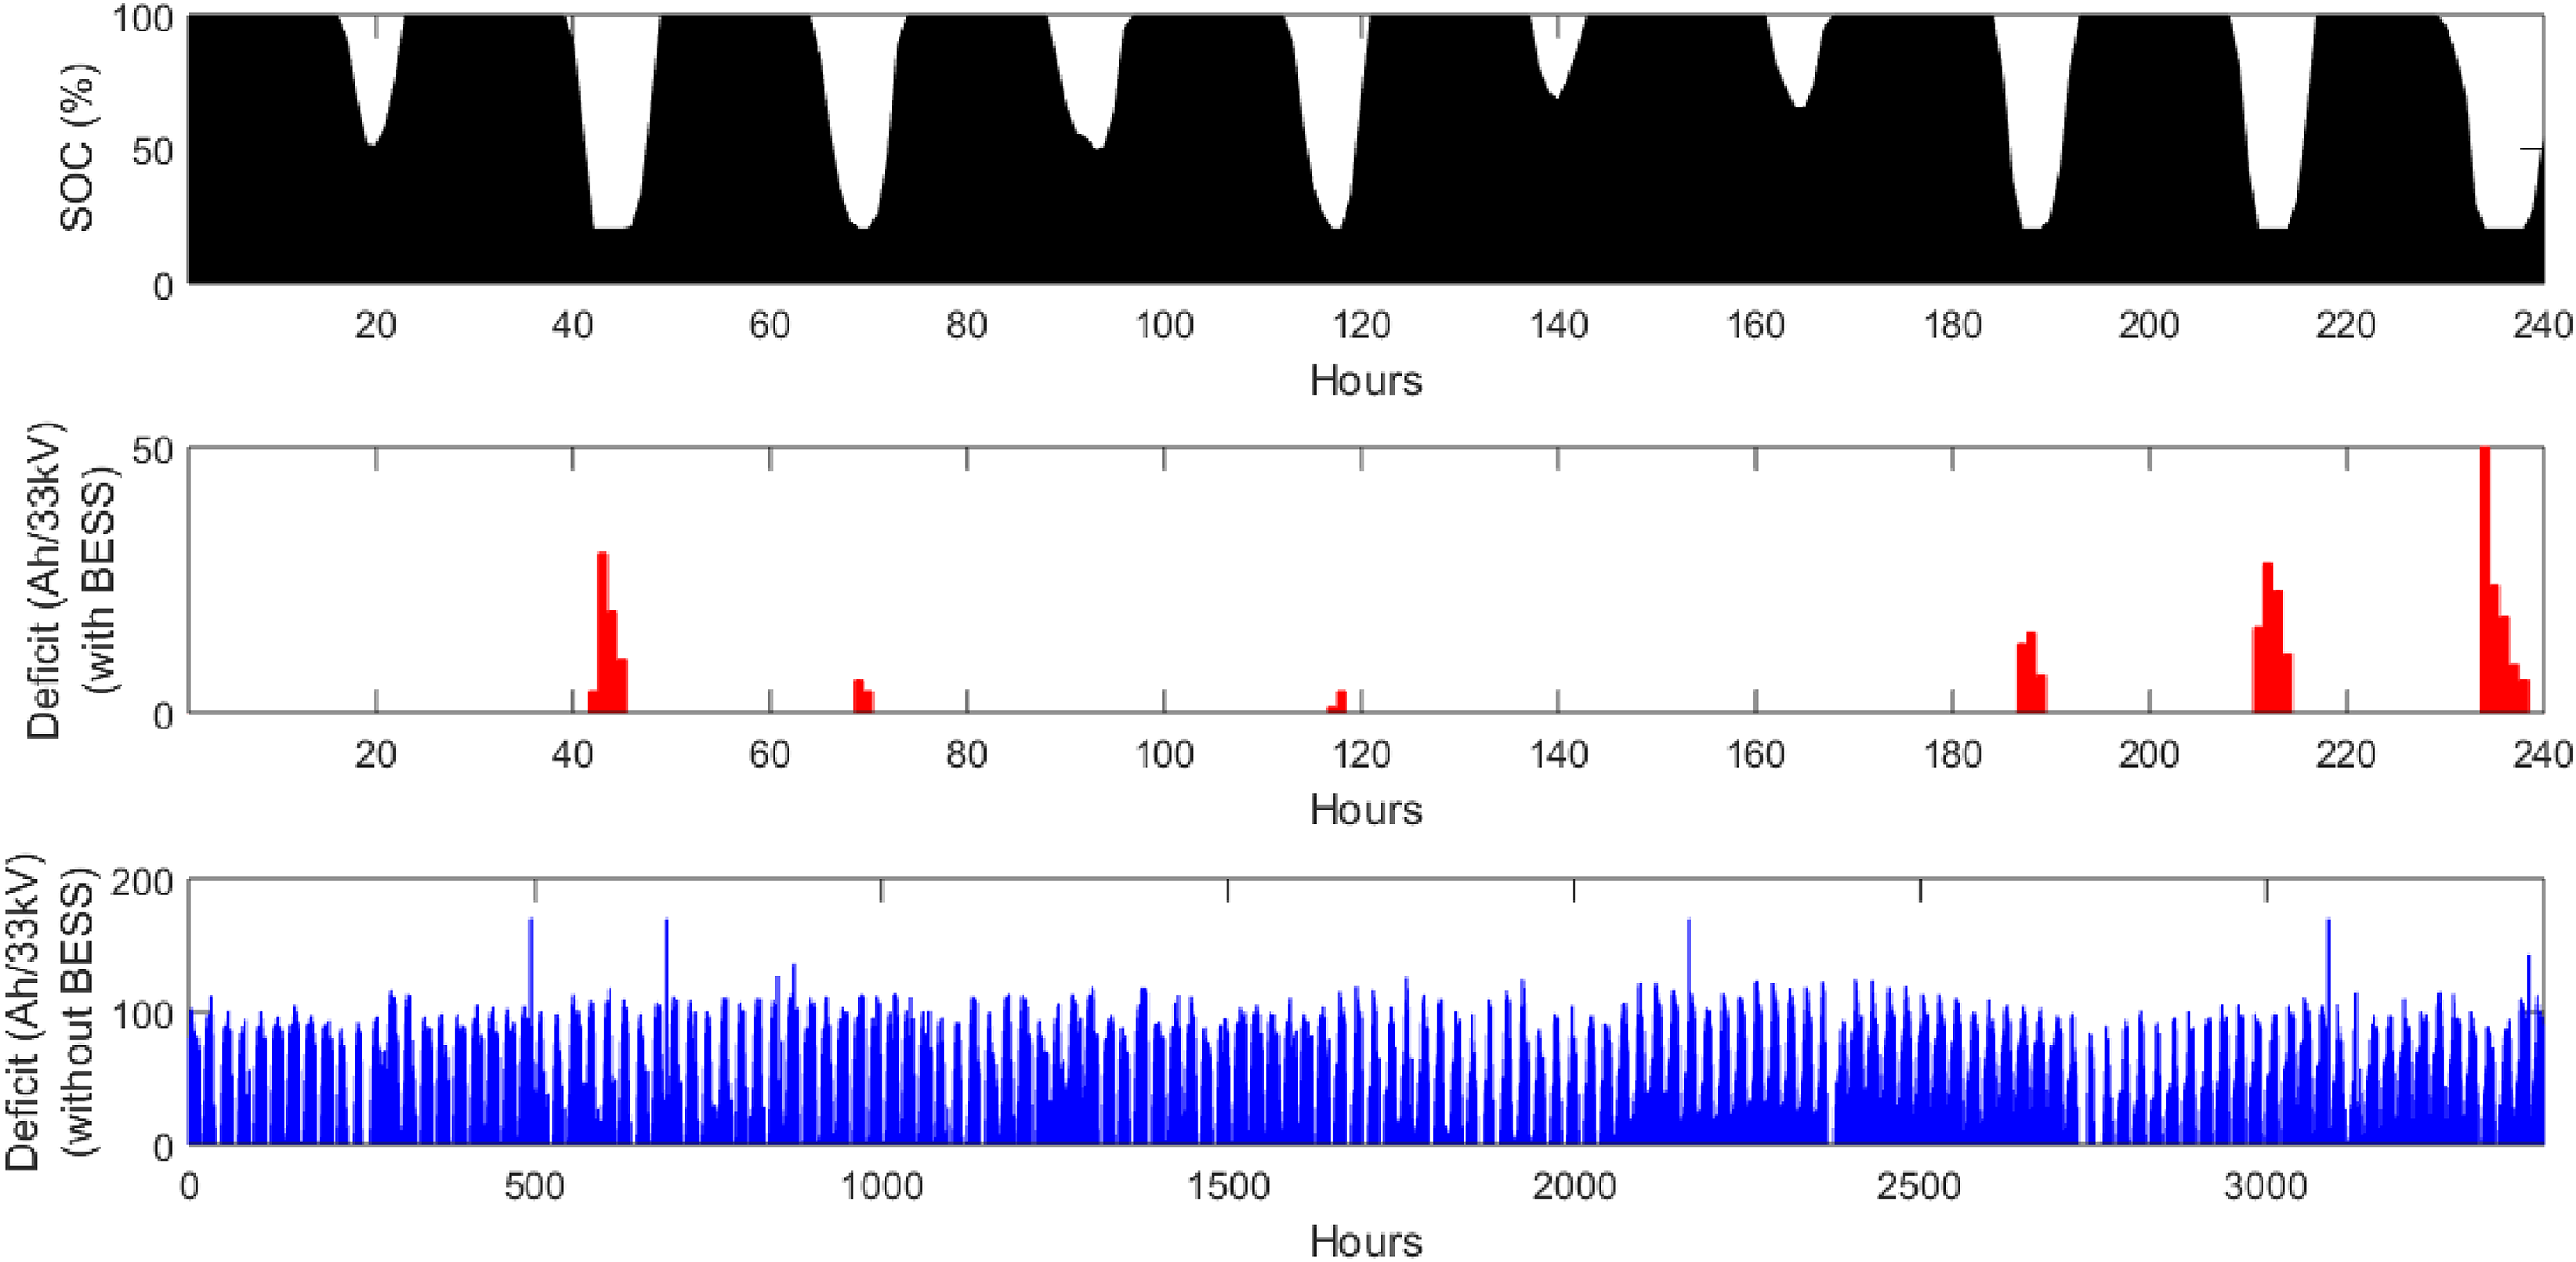
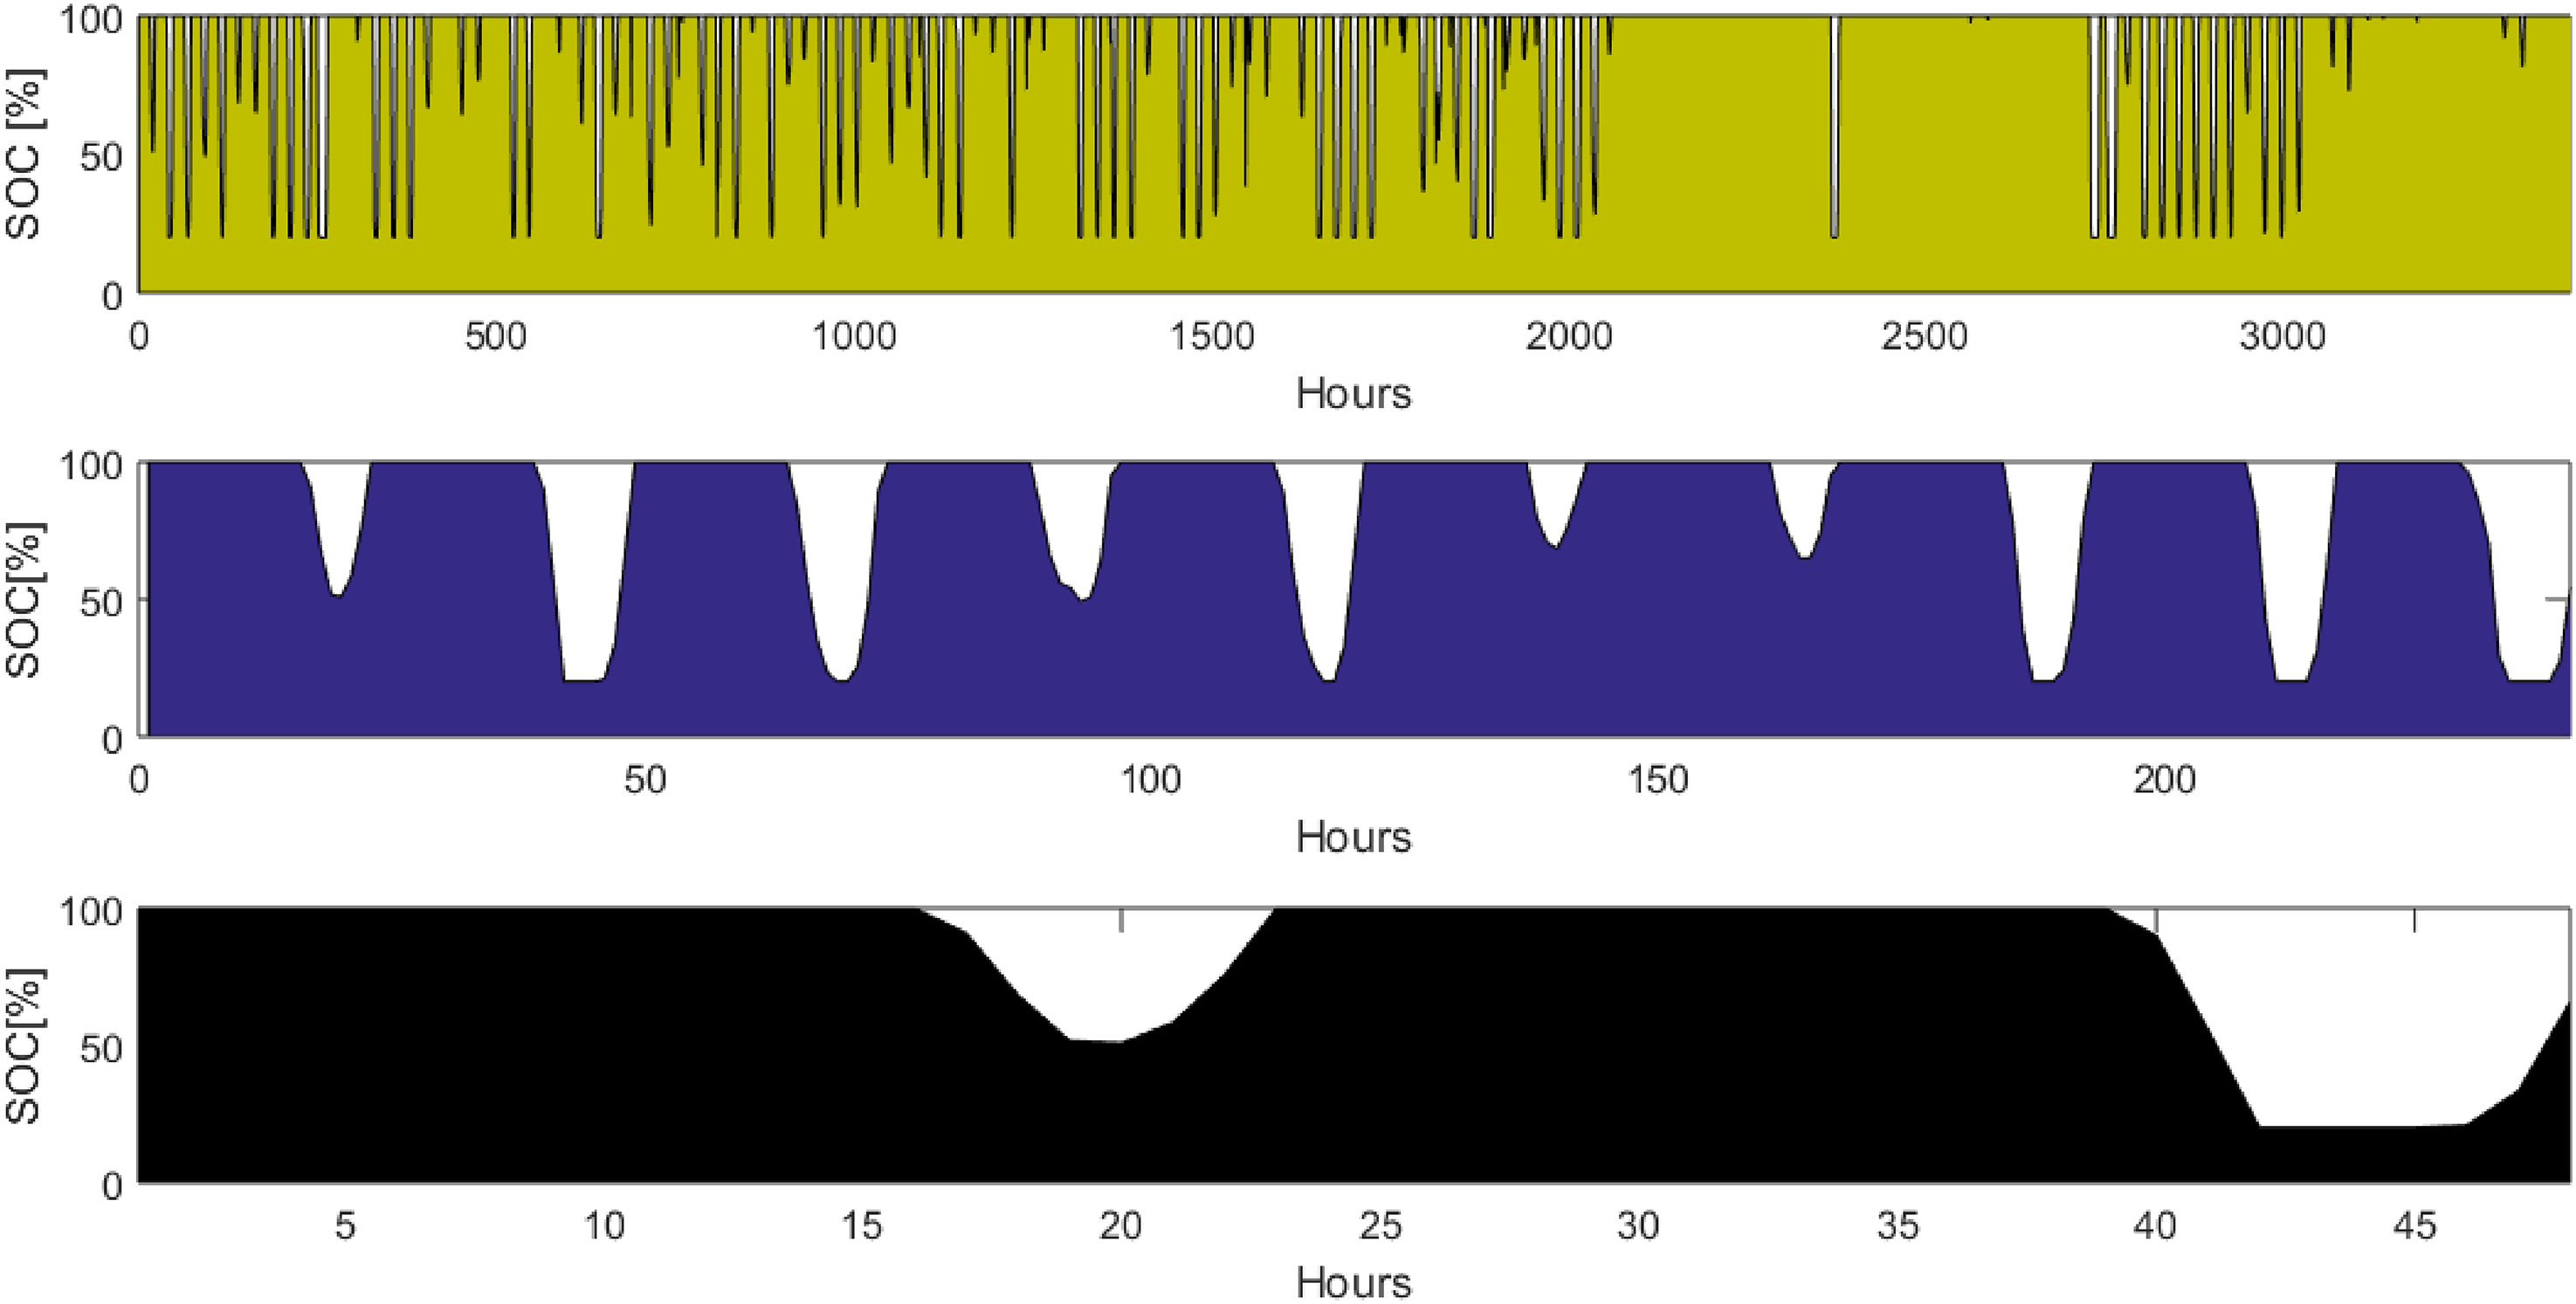
Impact of BESS on energy deficit in the electrical network under study (a): SOC; (b): Deficit with BESS added c: deficit without BESS.
Figure 9(a) displays the SOC of the BESS over 240 h. The SOC fluctuates, indicating periods of charging and discharging. The cycle of depletion and recharge is evident, with the SOC dropping significantly before being replenished, showing the dynamic response of the BESS to the network demands. While Figure 9(b) quantifies the energy deficit (in Ah/33 kV) when the BESS is integrated into the network, the presence of the BESS significantly reduces the frequency and magnitude of the energy deficits. The deficits are intermittent and occur at discrete intervals, with a maximum recorded deficit reaching approximately 50 Ah/33 kV. Finally, Figure 9(c) illustrates the energy deficit (in Ah/33 kV) in the absence of the BESS, without the BESS. As a result, the energy deficit is not only more frequent but also substantially higher, peaking at around 200 Ah/33 kV. This consistently high deficit underscores the critical role of the BESS in mitigating energy shortfalls in the network.
Optimized BESS LCA result
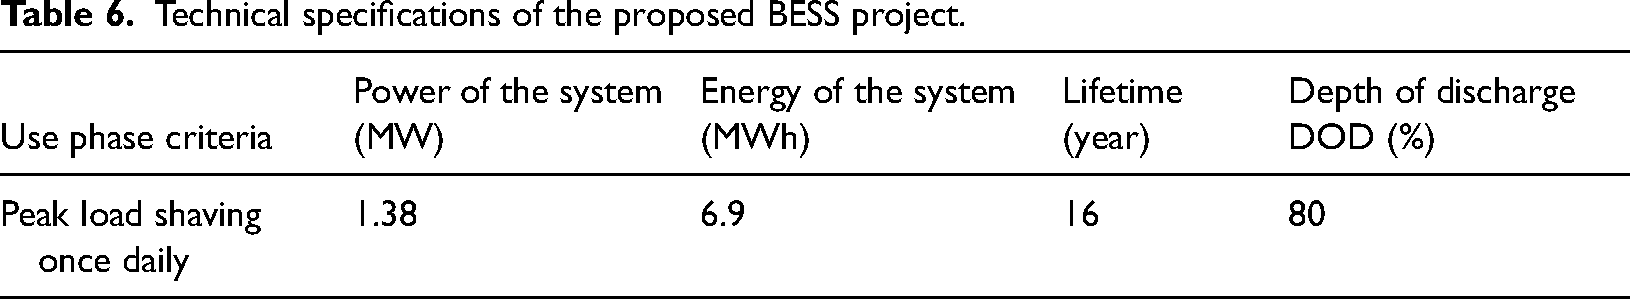
After finding the optimum BESS size, the suggested BESS characteristics are shown in Table 6. A cradle-to-grave LCA framework is formulated to examine the environmental impact of three li-ion chemistries which are Lithium Iron Phosphate (LFP), Nickel Cobalt Manganese (NCM), and Lithium Manganese Oxide (LMO). This evaluation is standardized under ISO-14040 and is used to analyze the environmental impacts throughout the entire life cycle of these batteries, from manufacturing to end-of-life. After choosing the chemistry with the least environmental impacts, the environmental impacts of charging the BESS considering the energy mix of Palestine are considered.
Technical specifications of the proposed BESS project.
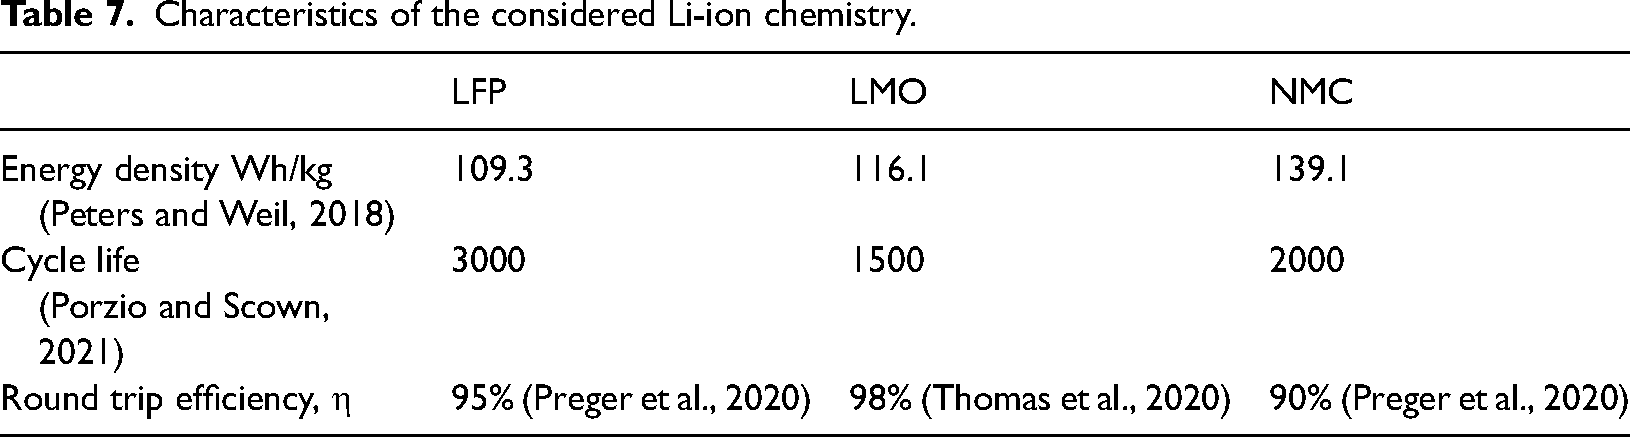
The goal and scope of the LCA study is defined first, and then LCIA is conducted by using OpenLCA v2.0.0, Ecoinvent v3.9.1 databases, and the ReCiPe 2016 v1.03 midpoint (H) method. The three aforementioned BESS technologies are compared based on parameters such as energy density, cycle life, and round-trip efficiency.
As a result, LFP batteries have the lowest energy density but the highest cycle life and moderate efficiency. Meanwhile, NCM batteries have the highest energy density but the lowest efficiency. It is worth mentioning that the lifetime of the BESS project is assumed to be 16 years. Table 7 shows the characteristics of the considered li-ion chemistry
Characteristics of the considered Li-ion chemistry.
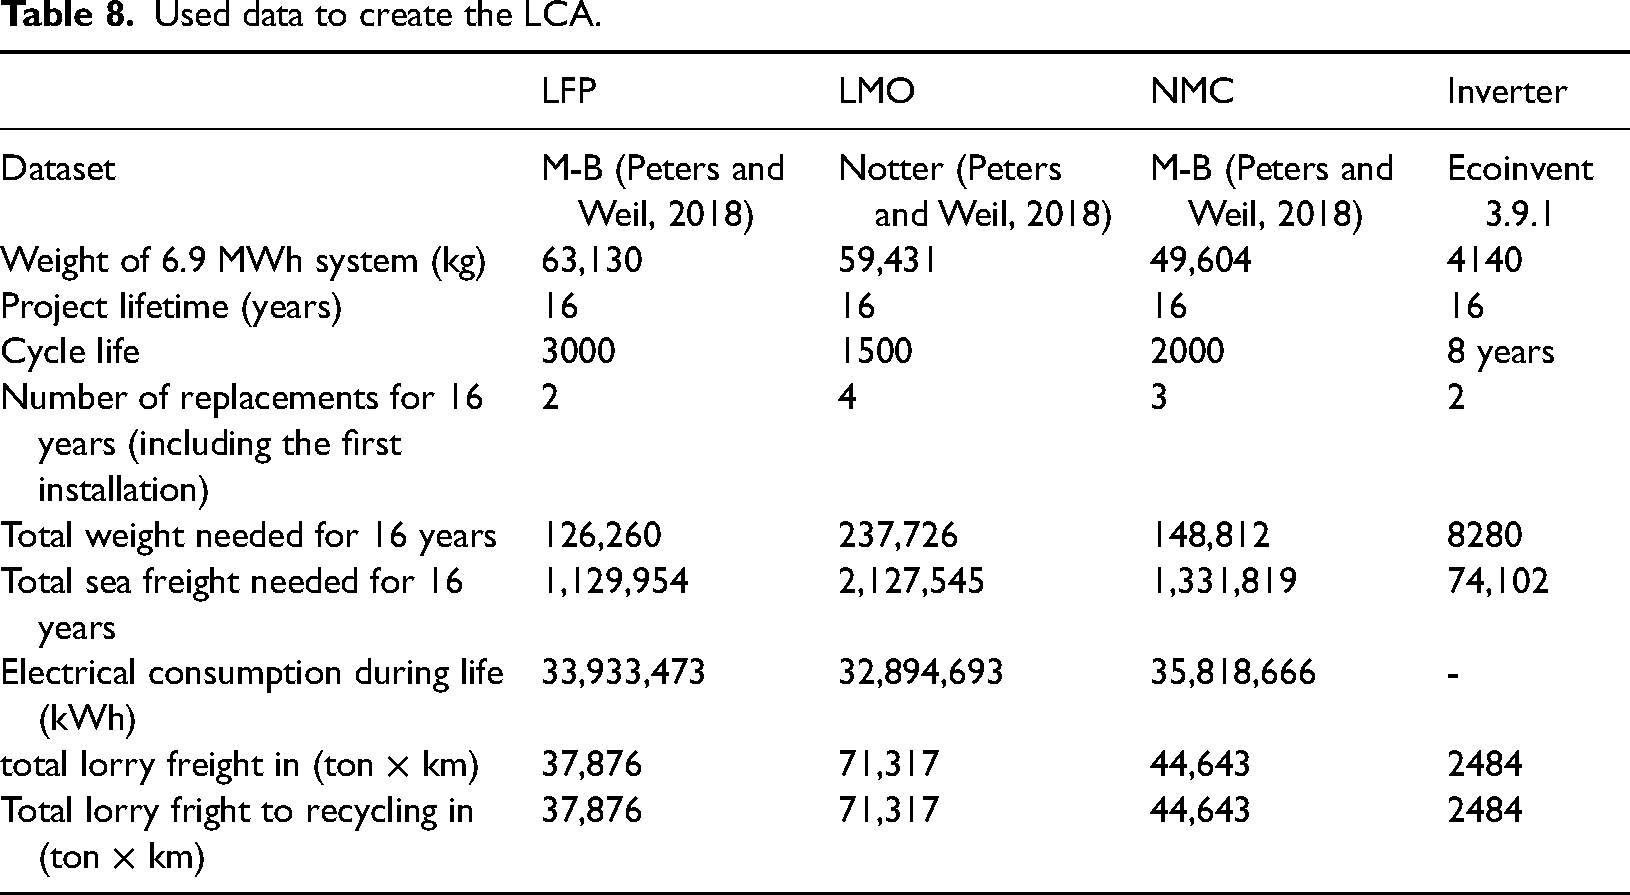
The functional unit is assumed to be the entire BESS system over the project's lifetime (one item). Table 8 shows the inputs of openLCA software used when evaluating the technologies in this research.
Used data to create the LCA.
where BESScapacity is the rated capacity of the BESS, DOD is the depth of discharge that the BESS will operate at, Ndays is the lifetime of the project by days, and η is the roundtrip efficiency of the BESS.
openLCA v2.0.0 and ecoinvent v3.9.1 are used for the LCA. The LCI from (Peters and Weil, 2018) and ReCiPe 2016 v1.03 midpoint (H) are used to evaluate the impacts of a 6.9MWh system for the three considered chemistries, the results are presented in Figure 10 levelized to LFP chemistry.
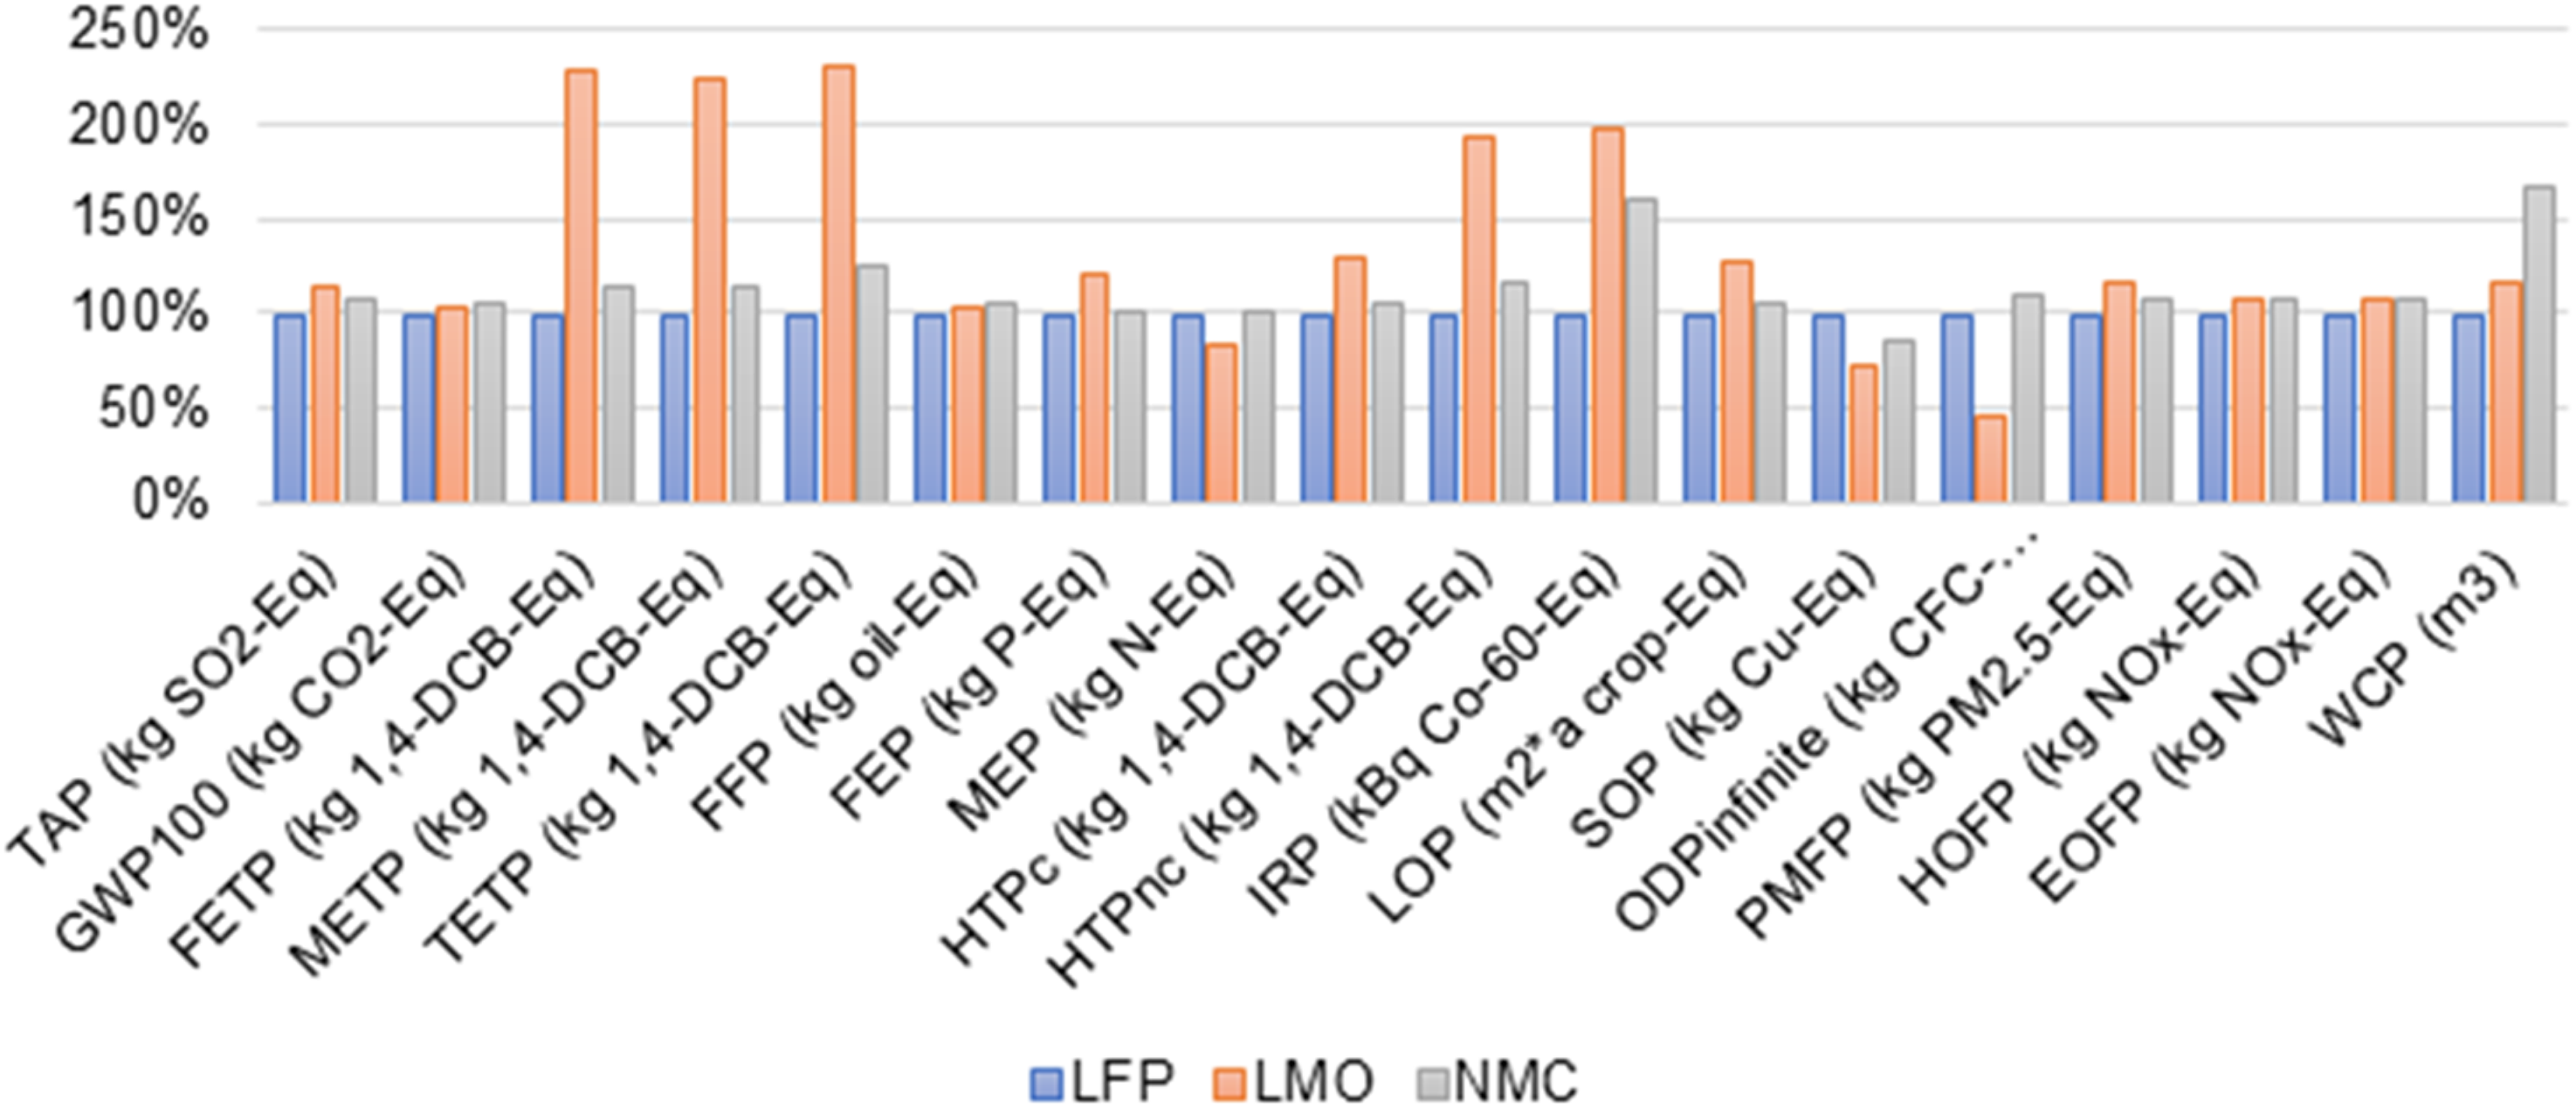
LCA results levelized to LFP impacts.
The LCA results show that LFP batteries have the least environmental impact compared to NCM and LMO batteries. LFP batteries require fewer replacements over the project's 16-year lifespan, reducing the overall environmental burden. They exhibit lower impacts in critical categories such as Global Warming Potential (GWP), Fossil Fuel Depletion Potential (FFP), Agricultural Land Occupation (LOP), and Water Consumption Potential (WCP). This makes LFP batteries the most environmentally friendly option among the three BESS technologies that were analyzed. In conclusion, LFP batteries are the most environmentally friendly among the three BESS technologies analyzed.
Conclusion
This paper presented a comprehensive approach to optimizing the size of BESSs in electrical power distribution networks, with a specific focus on balancing environmental impact costs and grid reliability. The research was conducted based on data of a real electrical power distribution network, with a capacity of 25 MVA/33 kV system with 7 MWp photovoltaic power integration. Findings highlighted the critical role of BESS in managing the variability and intermittency of RE sources. The optimal BESS size determined for the adapted network was 120 Ah/33 kV, which achieved a loss of load probability (LLP) of 1%, ensuring high reliability and resilience of the grid. The integration of this optimally sized BESS resulted in substantial improvements in grid stability, reduction of energy deficits, and significant annual cost savings of $0.367 million. The environmental impact assessment, performed through a detailed LCA, indicated that LFP batteries offer the most environmentally friendly option among the considered chemistries, due to their high cycle life and moderate efficiency. The proposed methodology demonstrated a practical and sustainable solution for enhancing the reliability and environmental performance of electrical distribution networks with high RE penetration. Future research should explore the application of this optimization framework to different grid configurations and geographic locations, as well as the integration of advanced energy management strategies. In conclusion, the optimal sizing and integration of BESS not only enhanced grid reliability and reduced operational costs but also contributed significantly to having environmentally sustainable and friendly electrical power systems. This research provided valuable information for utility companies and policymakers aiming to achieve a resilient and environmentally sustainable energy future.
Footnotes
Abbreviations
Acknowledgments
The authors would like to thank Eng. Amjad Kamal, Eng. Fadi Taha, Eng. Sari Ibrahim, and Eng. Izz Malakh from Jerusalem District Electricity Company (JEDCO) for helping them in obtaining data for the adapted electrical power distribution network.
Availability of data and materials
Data including the system's performance and MATLAB code are available upon request.
Declaration of Conflicting Interests
The authors declared no potential conflicts of interest with respect to the research, authorship, and/or publication of this article.
Ethical approval
The research does not include any type of experiment on humans or animals.
Funding
The authors received no financial support for the research, authorship, and/or publication of this article.