
Abstract
Geothermal energy is one of the most potential renewable energy resources. How to efficiently extract and utilize geothermal energy has been a worldwide hot topic. Co-axial closed-loop geothermal system is a novel method using a continuously closed wellbore without water exchange with. It is more suitable for reservoirs with medium or low temperature and permeability because many problems could be avoided such as lack of in situ groundwater or low infectivity of the reservoir. Many companies and research institutes have applied closed-loop geothermal system in building heating engineering and some fine results have been gained. However, in practical engineering construction, the area of a closed-loop geothermal system heating system is a very important parameter. It directly determines the cost accounting and initial design of the project. Accurate and reliable estimation of heating capacity becomes very important. In this study, a wellbore–reservoir coupling model is established, which is calibrated using measured data from a short-term field trial operation. We have carried out mixed convective–conductive fluid-flow modeling using a wellbore flow model for TOUGH2 called T2Well to investigate the heat extraction performance of closed-loop geothermal system. The system evolution and the effect of flow rate and injection temperature on heat production performance are discussed. The result shows that the intermittent production cycles are more beneficial for heat extraction and system maintenance, and the temperature recovery between two heating seasons is enough to maintain system heating. And we can calculate that a geothermal well can ensure heating of buildings of 10,000–20,000 m2 and the heating area of intermittent operation is 4000 m2 more than continuous operation. Besides, the sensitivity analysis of parameters is also carried out.
Keywords
Introduction
Nowadays, energy crisis and environmental pollution are getting serious around the world. It is important to develop new energy with large reserve and environmental friendliness. Geothermal energy has characteristics of clean and sustainable (Barbier, 2002; Pastor-Martinez et al., 2018; Sun et al., 2018c). It is widely distributed all over the world and universally acknowledged for its excellent stability and reliability of energy supply (Aali et al., 2017; Boyaghchi and Safari, 2017; Erdeweghe et al., 2017). The utilization potential of geothermal resources is 1814.4 EJ/year, of which 403.2 EJ/year is classified as high-temperature resources (more than 150°C) and 1411.2 EJ/year is correspond to low-to-medium temperature (between 20°C and 150°C) (Chandrasekharam and Bundschuh, 2008; Stefansson, 2005). It is reported that the annual electricity generation by geothermal energy will reach up to 16 GW in 2020 (Bertani, 2016; International Energy Agency, 2012; Kordlar and Mahmoudi, 2017; Nami et al., 2018; Yildirim and Genc, 2017). In 2050, it will account for about 3.5% of the world’s total energy consumption (Ali and Kumar, 2017; Ghaebi et al., 2018; Li et al., 2017).
Geothermal resources can be developed and utilized in diversified forms according to the reservoir temperature. It can be classified as three types: (a) low-temperature geothermal (lower than 90°C), (b) medium-temperature geothermal (between 90°C and 150°C), and (c) high-temperature geothermal (higher than 150°C) (Modi and Haglind, 2017; Pérez-Mora et al., 2017; Wang et al., 2017). Usually, high-temperature geothermal resource is more suitable for geothermal power generation or complex energy conversion systems (Bayer et al., 2013; Garg and Orosz, 2018; Li et al., 2018; Su et al., 2018; Suter et al., 2012; Tomasini-Montenegro et al., 2016). Due to the technical limitations and low conversion efficiency of medium- and low-temperature geothermal resource (Walraven et al., 2013), it is more often used for residential heating (Østergaard and Lund, 2011; Self et al., 2013).
During the running of hydrothermal geothermal system, the cold water is injected into reservoir, flowing through and heated by the pores and fractures, then recovered from production well. Such geothermal system we can call it open-loop geothermal system (OLGS). Recently, a new approach, called closed-loop geothermal system (CLGS), is proposed by the Technical University of Berlin (Schulz, 2008) and it could be applied for both hydrothermal and hot dry rock sites. The CLGS is a relative isolated system. The working fluid is injected into a continuously closed wellbore and circulated back to the ground, without direct contact with geothermal reservoirs and the in situ water (Song et al., 2018).
The advantages of CLGS are as follows: (1) There is no water circulating in the reservoir, so there is no need to consider the water contaminant and permeability of the reservoir; (2) there is no contact between the reservoir and working fluid during the running period, so there is no risk of groundwater pollution and scale deposit plugging in reservoir; and (3) the requirements for permeability of reservoirs are lower than other geothermal system, so reservoir stimulation projects are not needed, and the additional costs and risks are reduced.
The heat transfer process of OLGS includes heat conduction and convection, while for CLGS, it is only heat conduction around the geothermal well. Hence, the heat extraction rate of CLGS is lower than that of OLGS. In the past, it has been argued for a long time if the heat conduction of rock can compensate for the thermal depletion around closed-loop geothermal well and if the system can maintain a stable production for a long term (Nalla et al., 2004). With the development of technology and the decrease of cost in recent years, many problems of the geothermal cost and technology feasibility have been solved. The CLGS is becoming a new technology for extracting geothermal energy from low-permeability and low-temperature reservoirs (Song et al., 2018).
The CLGS design can be classified as three types: co-axial, multiple string, and U-shaped (Figure 1) (Sun et al., 2018a;, 2018b; Yu et al., 2019). The conception of co-axial geothermal system was first proposed by Horne (1980). A co-axial closed-loop geothermal well is consisted of two tubes and an annulus existing between inner tube and outer tube. During co-axial CLGS running, low-temperature working fluid, such as cold water or supercritical carbon dioxide, is injected through the outer tube from wellhead, heated by the surrounding formation in the process of descending to the well bottom, and then extracted to the ground from inner tube with a good adiabatic performance.
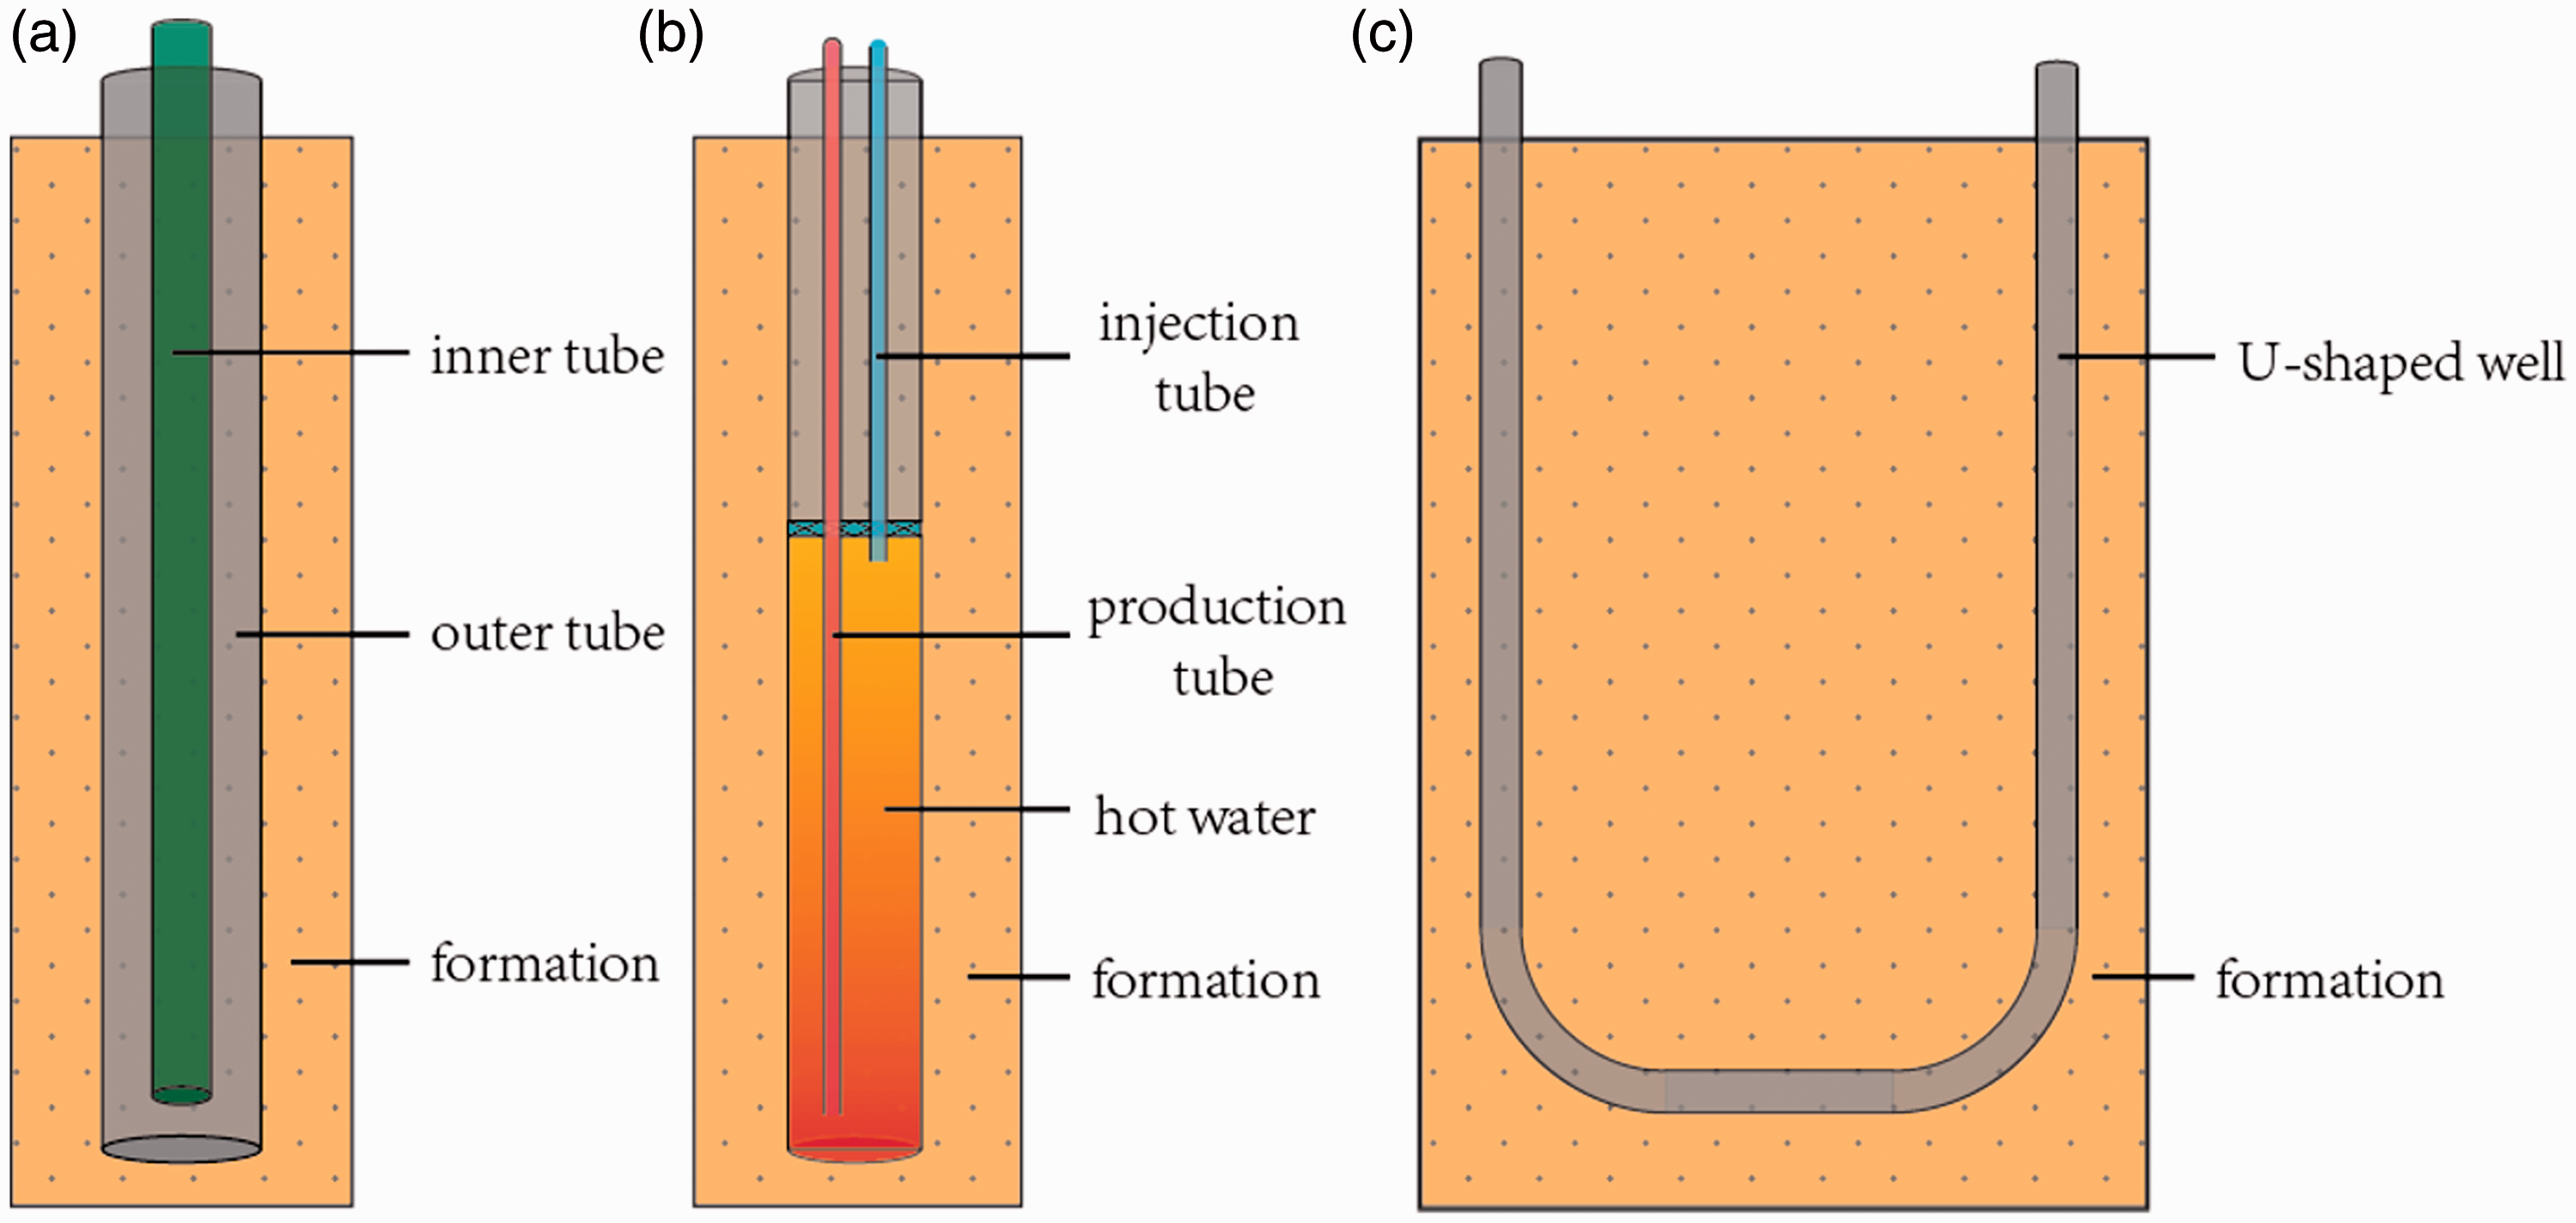
Conceptual designs of closed-loop geothermal system: (a) co-axial design, (b) multiple string design, and (c) U-shape design.
In recent years, many scientists carried out experiment and numerical simulation to study the CLGS with water as working fluid. The results indicate that the insulation of the inner tube has great effect on the performance of the system (Eharasci et al., 2005; Morita et al., 2005; Yokomine et al., 2012). Due to the limitation of the insulation material of inner tube, the development of CLGS has stopped for some years. With the breakthrough of insulation material, the CLGS comes back in people’s sight. At present, many kinds of thermal insulating inner tube have been developed, including insulating coatings on the tube wall, thermal insulating tubing, or other developed thermal insulating materials recently. Many relevant companies and research institutions around the world have conducted actual engineering experiments and have obtained satisfactory results (Kim et al., 2006; Morita et al., 2005; Strang, 2017).
Multiple string design is proposed by (Hasan et al., 2002), the bottom part of the well is full of liquid (e.g., water), while the upper portion is full of gas (e.g., nitrogen) (Riahi et al., 2017). However, geothermal well with multiple strings design always require a large borehole diameter because there are two tubes in the geothermal well, which is difficult to construct. Multiple string designs are usually suitable for shallow geothermal resources. U-shaped well design has two vertical wells, which are connected by a horizontal well. Obviously, U-shaped well design has larger contact area than other well designs, which can increase the thermal efficiency. However, the cost of two vertical wells and a horizontal well is much higher than other single well design (Song et al., 2018).
In summary, the co-axial closed-loop geothermal system (CLGS) has a wide prospect for the development and utilization for medium–deep geothermal resources. Previous studies mainly focus on its potential of heat extraction, and well wall is considered as Neumann boundary condition of heat and ignored the influence of formation. However, with the long time running of the geothermal system, the temperature decreases around the well will have errors because the influence of strata is neglected. Therefore, a model coupled wellbore with reservoir has far-reaching significance for the study of geothermal system under long-term operating conditions. Besides, considering the actual requirements of heating to buildings, discontinuous simulation is implemented in this research. In order to determine the thermal performance of a co-axial CLGS under long-term discontinuous operating conditions with the influence of changes in formation temperature, the study focus on a co-axial CLGS heating project in North China. Simulation results are compared with the measured data to investigate the feasibility and energy extraction potential of a co-axial CLGS. The evolution and recovery of the geothermal system is also studied for a running period of 20 years. Then, the effect of circulating flow rate and fluid temperature on different heat production performance is discussed. The results show that a discontinuous running of the co-axial CLGS can promise a higher performance than continuous running. In the process of intermittent operation, reservoir temperature recovery plays a very important role during the closure of geothermal system. The annual non-heating period can recovery the reservoir temperature to almost original level. Intermittent operation can make geothermal system run stably and efficiently for a long time.
Geological setting and geothermal conditions
This work is based on a geothermal operation test in North China. The Quaternary cap rock layer is about 400 m, which mainly consists of clay. The main stratum of the region is shown in Figure 2. Each stratum is basically a nearly horizontal sedimentary stratum. The lithology is mainly mudstone, sandstone, and dolomite. There is little magmatic intrusion without large fault. The lithology and well temperature records are also shown in Figure 2. The temperature measured at the bottom of 2800 m depth is 77°C, and the geothermal gradient is about 20°C/km.
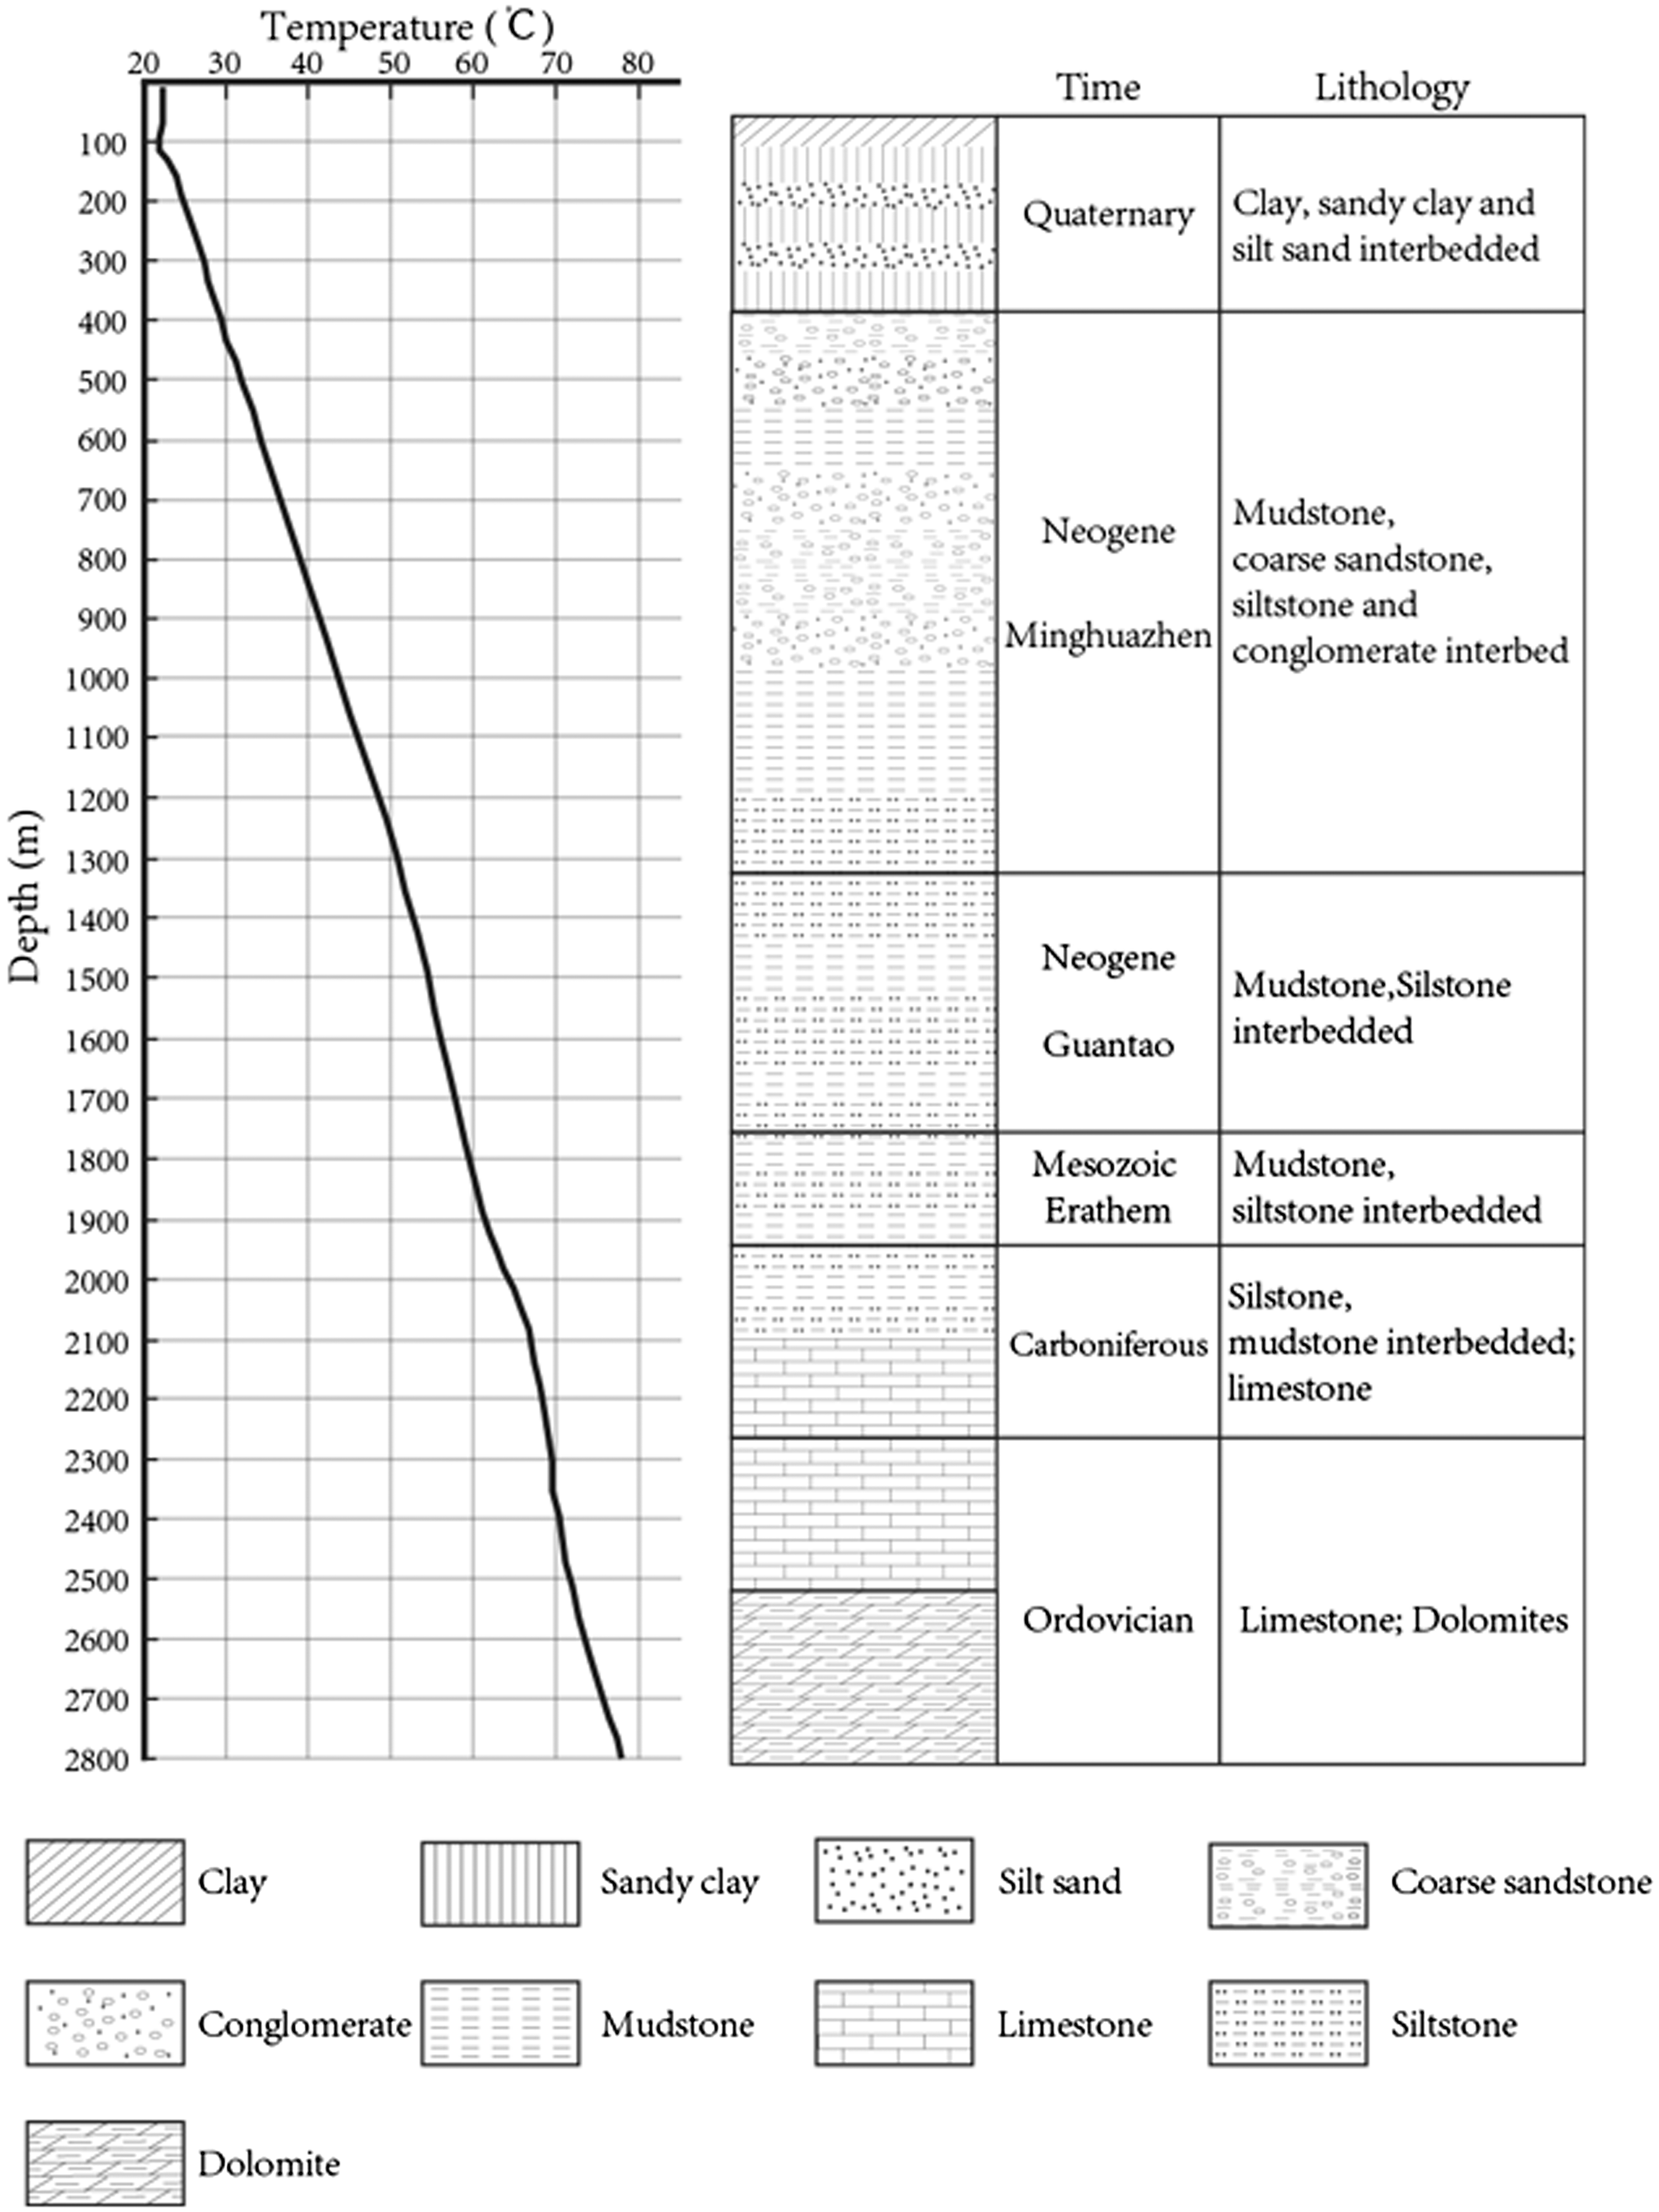
The lithology and well temperature records of the research domain.
Numerical Simulation
Concept model of CLGS
The sketch of a typical co-axial closed-loop geothermal well and the wellbore–reservoir coupling concept model are shown in Figure 3. The whole circulation process is demonstrated in Figure 3(a) (Riahi et al., 2017). It is assumed that no heat will exchange between inner and outer tubes when the system runs, which is considered as an isenthalpic process along the inner tube.
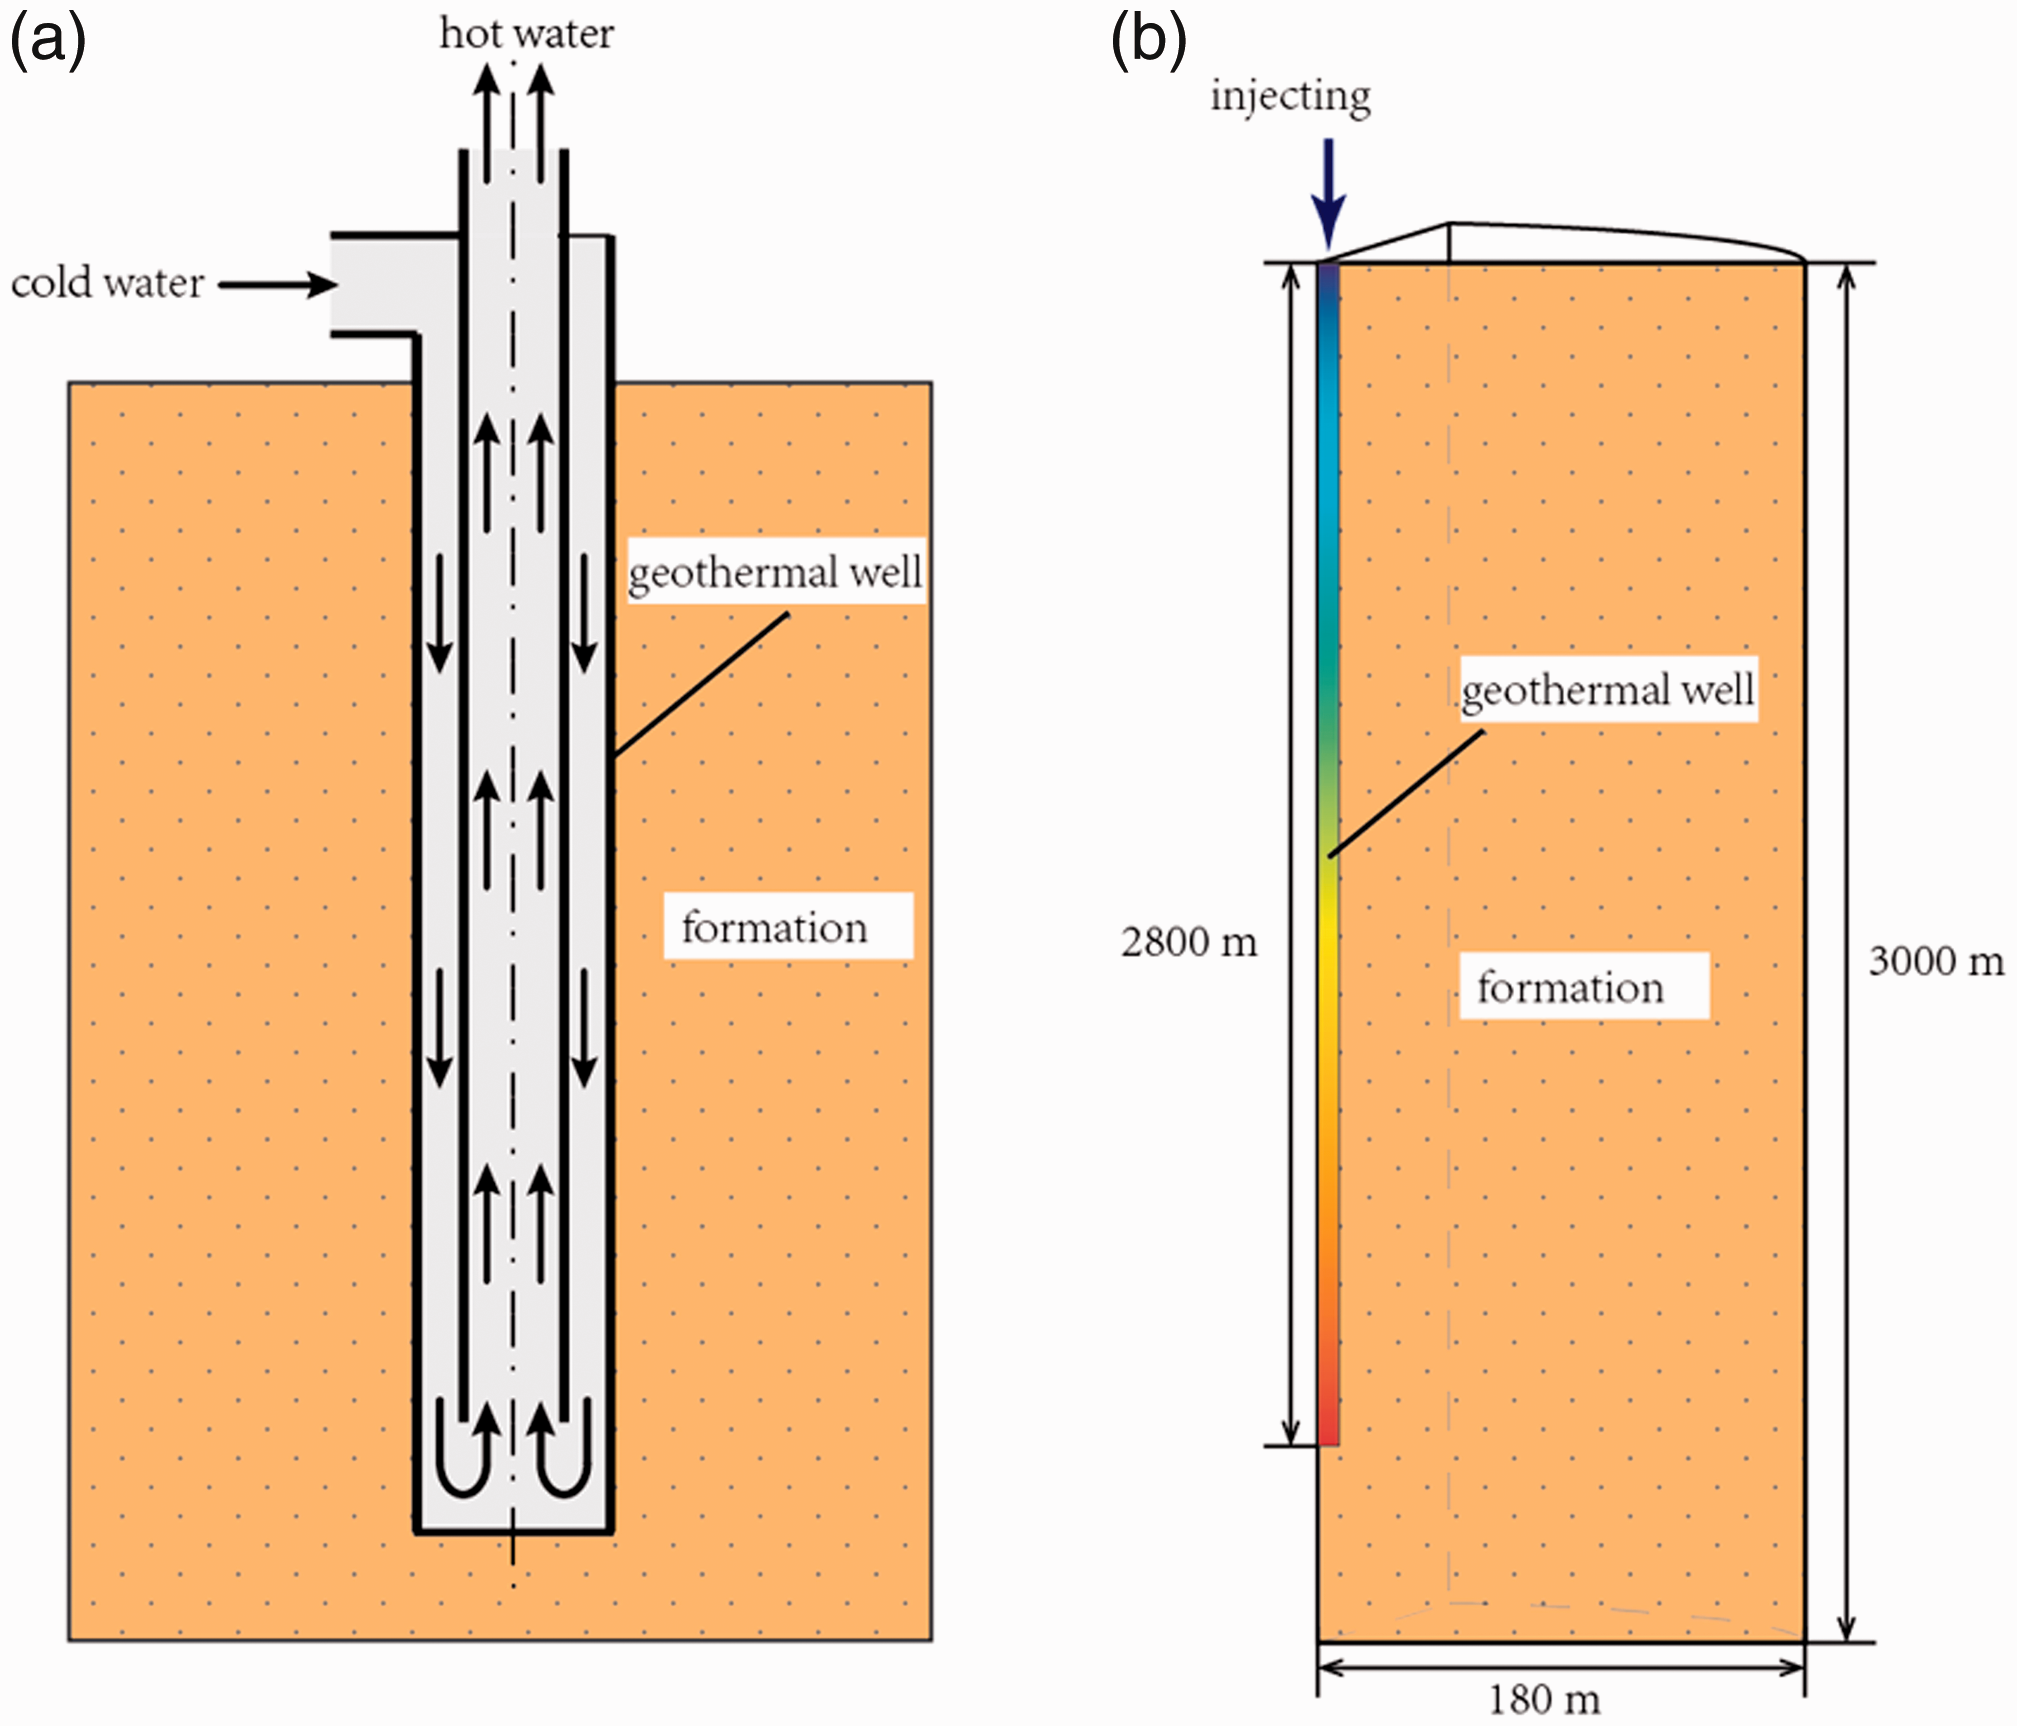
The sketch of (a) closed-loop structure of geothermal well and (b) the wellbore-formation concept model.
The sketch of wellbore–reservoir (formation) coupling model is shown in Figure 3(b). The depth of well bottom is 2800 m. It is assumed that the properties of strata are isotropic in horizontal direction, and it could be simplified as a two-dimensional axisymmetric model, the geothermal well is located in the symmetry axis. Since there is no water exchange with the rock formation, geothermal exploitation has little effect to the natural flow field. So the extra 200 m down extension is enough to eliminate the influence of the bottom boundary. For the same reason, the lateral direction also extends to 180 m to guarantee the lateral boundary not to be affected by the heat extraction.
According to the actual structure of geothermal well, the boundary between geothermal well and rock formation has heat conduction only, and no water movement. Since the influence of the bottom and lateral boundaries can be neglected, those boundaries are assumed to be constant temperature and pressure. According to the data shown in Part 2, the temperature in the top and the bottom of the model is 19.83°C and 81.35°C, respectively. We can set pressure according to the hydrostatic pressure 0.13 MPa and 29.5 MPa at the top and the bottom of the model, respectively.
In order to characterize the distribution of temperature field near the well, the spatial discretization in the radial direction is refined near the geothermal well, and the discretization is homogenous in vertical direction. The radial length of the grid near the geothermal well is 0.2 m, and the radial grids are increasing gradually to 10 m. The vertical length of all grids is 20 m. The total number of grids in the model is 7800.
Numerical simulation code and wellbore–reservoir coupling theory
In this study, a TOUGH-based wellbore–reservoir coupled program, T2Well (Pan and Oldenburg, 2014; Pan et al., 2011), is applied for the simulation. The T2well is a widely accepted numerical simulation program, and many publications use it to study problems about geothermal development. The accuracy of this code has been recognized by the industry and scientific research institutes (Li et al., 2015; Vasini, 2016; Vasini et al., 2018; Xu et al., 2018).
This program uses different flow governing equations in the wellbore–reservoir part. Darcy’s law is used to describe the seepage and heat transfer of fluids in the formation. The drift model and related governing equations are used to describe the non-isothermal transient flow in the wellbore. The integral finite difference method has been used to solve the mass and energy conservation to simulate the heat transfer process of the wellbore and surrounding rock (Pan et al., 2011; Pruess et al., 1999). Considering the rapid flow of fluid in the well, Pan and coworkers (Pan and Oldenburg, 2014; Pan et al., 2011) use the instantaneous momentum balance equation instead of the steady-state pressure loss equation to solve the mixing speed and improve the accuracy of the simulation. Expatiation of coupling theory and governing equations has given in Pruess et al. (1999) and Pan et al. (2011).
Simulation strategy
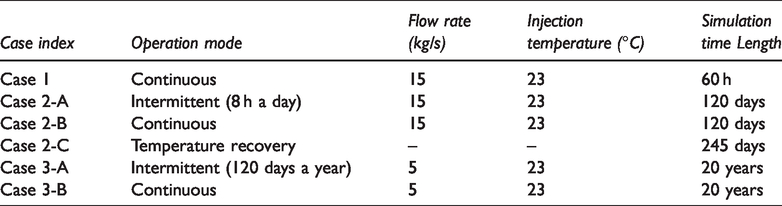
To investigate the performance of the system, two cases of different operational period are studied. For the short-term case (120 days), three schemes are concerned. Two schemes are concerned for the long-term case (20 years). Intermittent and continuous operations are discussed in both short-term and long-term scenarios. Computing scenarios and detailed operation parameters are shown in Table 1.
Computing scenarios and operation parameters.
Data fitting and parameter determination
The reliability of numerical simulation results depends on the determination of calculating parameter values. The physical parameters of the whole model are determined by matching with the measured data of field trial (Case 1). In this case, the injection temperature and flow rate setting are the same as those in the actual engineering. The reservoir temperatures were set to be same as the temperature measurement results shown in Figure 2, and the pressures were set according to the hydrostatic distribution. According to the results of a 130-hours operation test of CLGS, the calculating parameters are determined by simulating the geothermal system and comparing the results.
Evaluation of short-term operation
Because many heating supply projects will operate only in a certain period of time every day, it is necessary to study the heat production performance in intermittent operation conditions. Short-term numerical simulation studies the heat production of geothermal system in a heating period of one year (120 days) and the temperature recovery after the heating period. In this case, the operation modes of geothermal system are intermittent operation (Case 2-A) and continuous operation (Case 2-B), respectively. Intermittent operation mode is the same as that of heating equipment in North China, i.e. from November 15 to March 15 of the following year, totaling 120 days. And every intermittent operation divides two parts every single day, which is in heating period of 120 days every year into two parts. The first part runs geothermal system for 8 h and the other part stops running for 16 h. This model simulates the actual operation of geothermal system. According to the result, we can estimate the operation of the geothermal system in one year and determine whether it meets the heating requirements. Besides, the recovery of formation temperature field after operation is also studied (Case 2-C).
Evaluation of long-term intermittent operation
Considering that the service life of general heating projects will exceed 20 years, we take a study of the performance of geothermal system under long-term operation (20 years). Considering that the heating period is usually 120 days in every single year, Case 3-A is geothermal system running uninterruptedly for 120 days and the system will be close during the remaining 245 days of each year; Case 3-B is running continuously for 20 years. In this part, we will get the capacity of the geothermal system under the condition of long-term operation and determine whether the geothermal system can produce long-term stable heat for heating. By comparing the output temperature and heat extraction rate of each case, the difference of heat production capacity of geothermal system was compared.
Results and analyses
Data fitting and parameter determination
Figure 4 shows the fitting results of measured data and simulation results after parameter adjustment. The results indicate that the data fit well at the beginning and then slightly deviate from the measured data. There are two reasons for the deviation. One is the heterogeneity of the thermal properties of the formation, which is simplified to be homogeneous due to lack of data. The other reason is natural flow in the rock formation is neglected, which may change the temperature field and result in deviations. Overall, the fitting results indicate that the calibrated thermal properties are reasonable enough. The calibrated parameters are shown in Table 2.
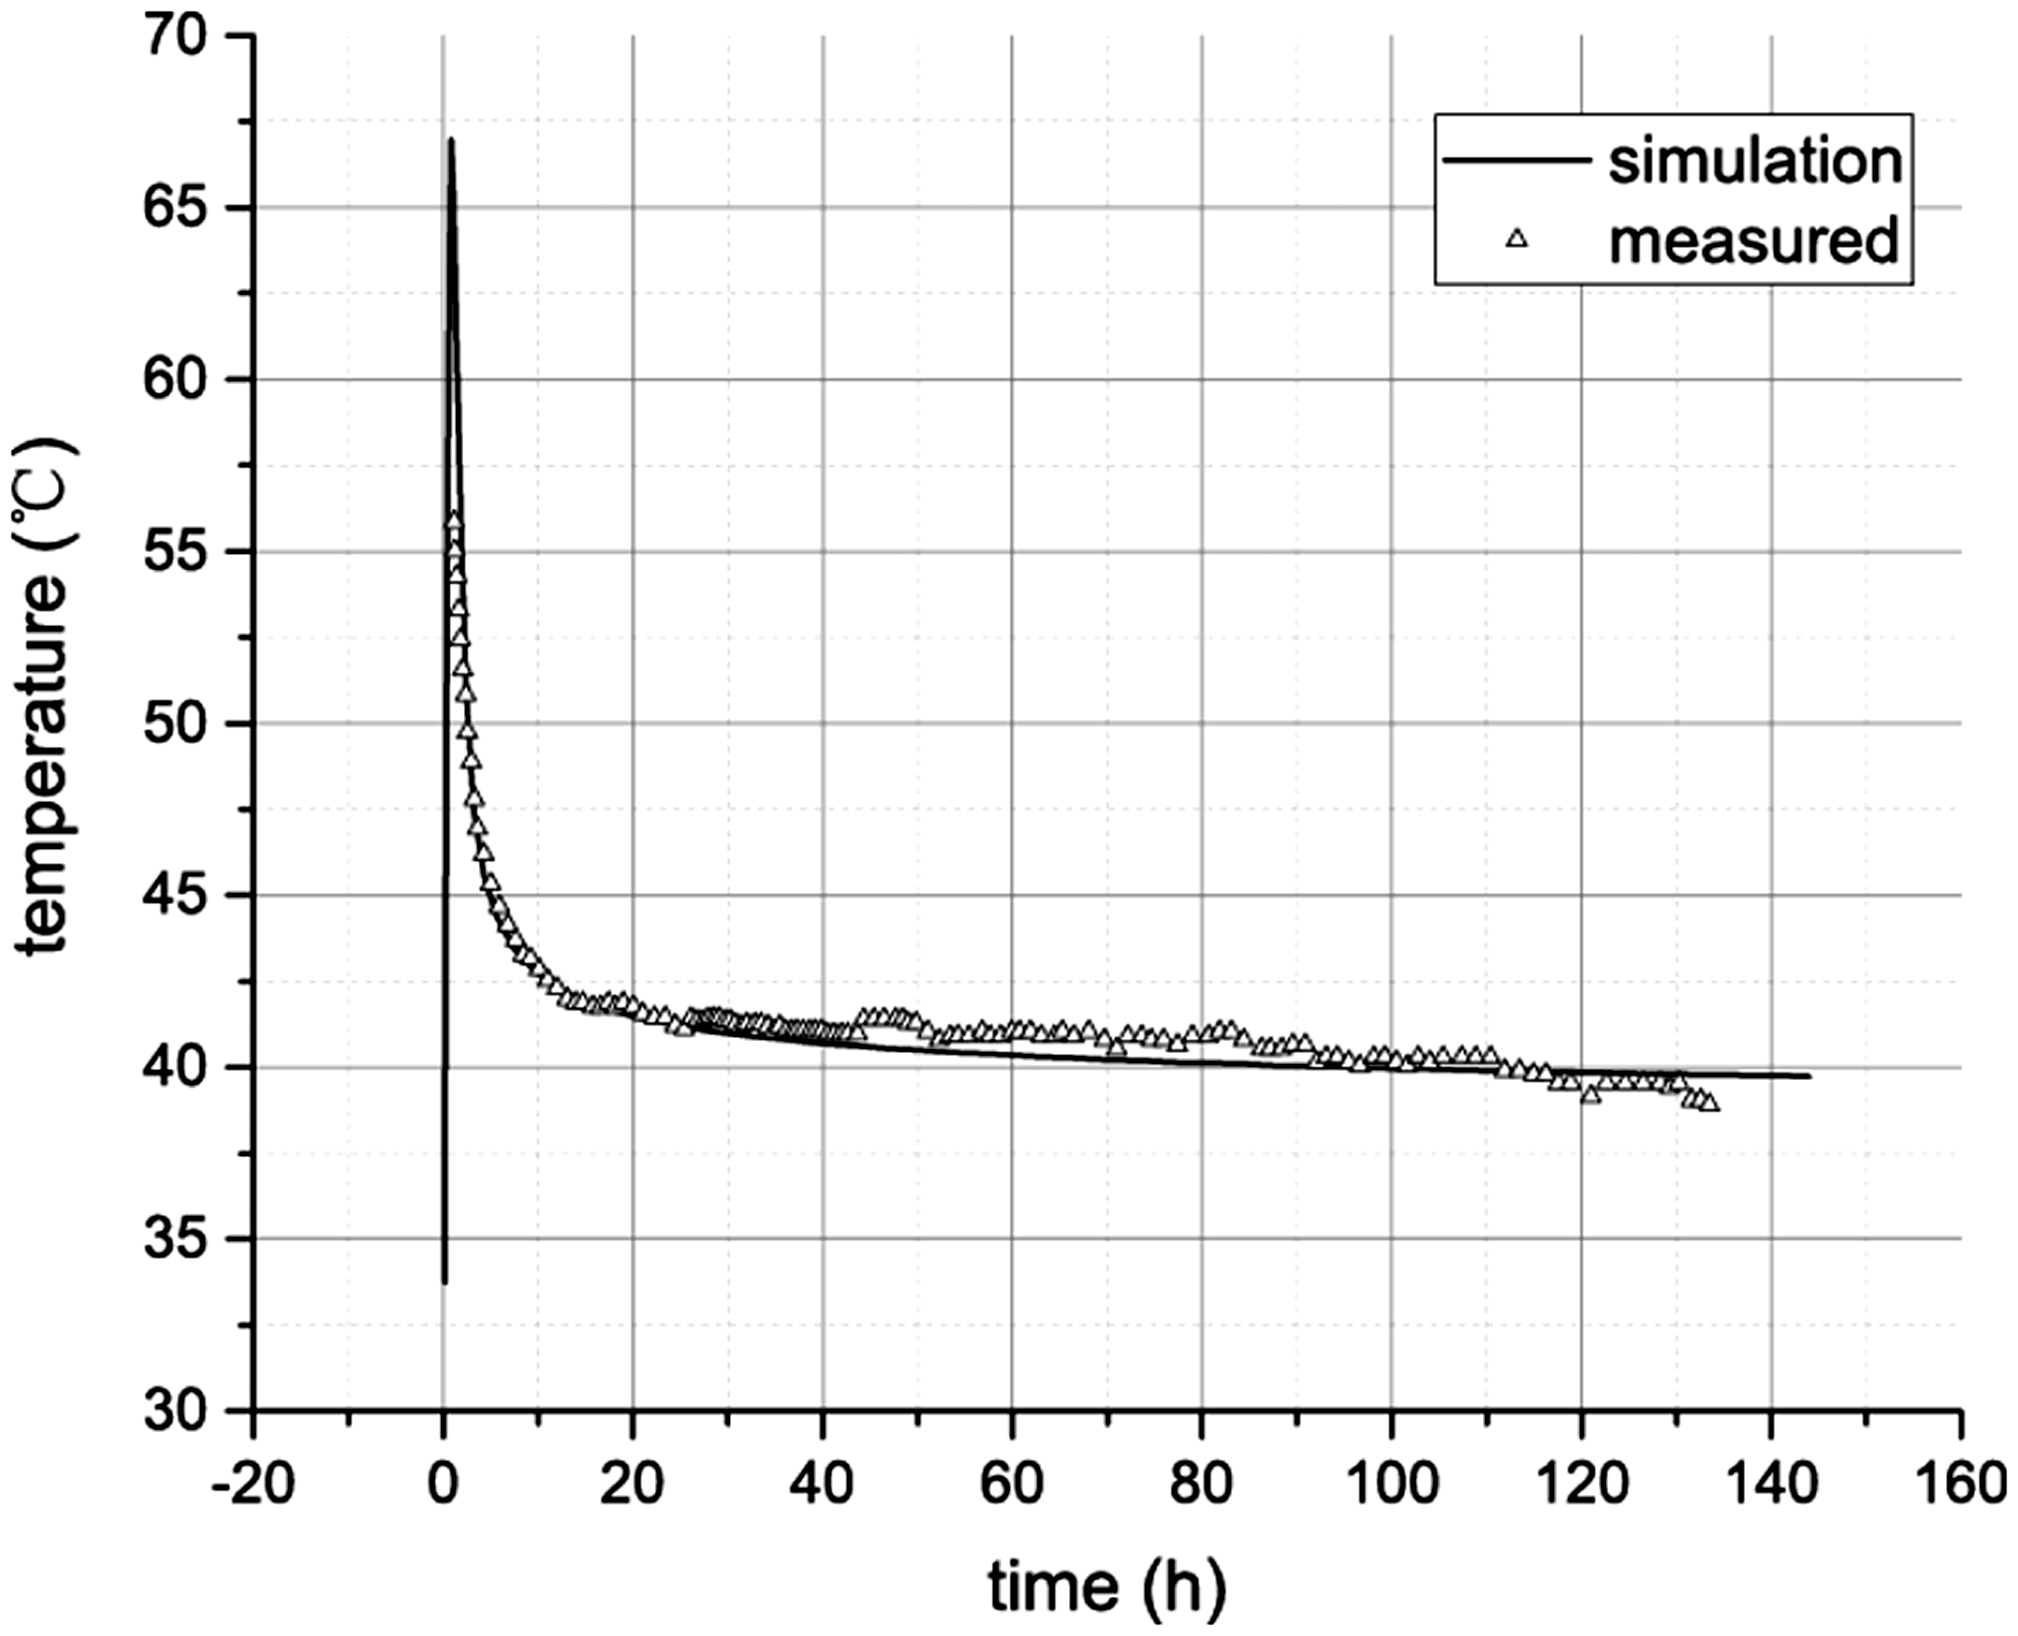
Fitting results of measured production temperature and numerical simulation results in Case 1.
List of calibrated thermal–physical parameters (Yang et al., 2018).
Evaluation of the short-term operation
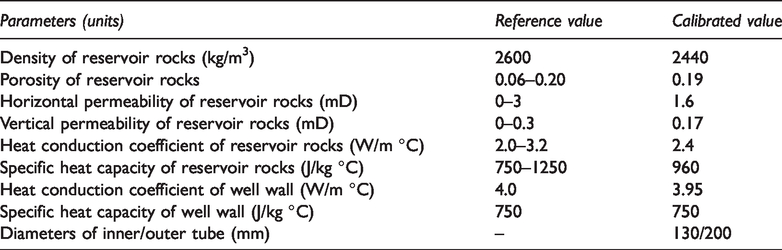
Figure 5 shows the simulation results of production temperature and heat extraction rate of Case 2-A and Case 2-B. Solid line is the result of intermittent operation, and each peak is the production temperature (left) and heat extraction rate result (right) during 8-h running in each day. A 120-day numerical simulation is carried out, and the results show that the daily lowest production temperature of Case 2-A decreased from 42.76°C to 40.08°C is in the first 40 days, and the average production temperature (average daily production temperature of the highest and lowest production temperature) during this period of time decreases from 53.5°C to 45°C. In the last 80 days, the lowest production temperature in each day is basically stabilized at 39.8°C and the average production temperature is stabilized at about 45.2°C. Comparatively, when the system is running continuously for 20 years, the production temperature drops from 40°C (at the end of the first operating day) to 38.26°C (at the end of the 40th operating day), and then it is stabilized at 38.2°C, which is obviously lower than intermittent operation. It indicates that the shutdown of geothermal system every day can effectively recover the temperature of the formation near the well and increase the production temperature in the next running period.
Evaluation of production temperature (left) and heat extraction rate (right) for intermittent (Case 2-A) and continuous (Case 2-B) operations.
The trend of heat extraction rate is similar to temperature. In the 40th day, the daily average heat extraction rate of intermittent operation and continuous operation is 1300 kW and 926 kW, respectively. Then, it remains constant with a range of decrease less than 10 kW. Refer to standard EN1264, if we calculate the building heating standard to 38 W/m2 (Olesen et al., 2003) and all the heat extracted by geothermal system is used for building heating, a CLGS under such geological condition we used can heat about 34,210 m2 and 24,370 m2 of buildings when the geothermal is running intermittently and continuously, respectively. We can notice that intermittent operation can provide 10,000 m2 more heating than continuous operation. But this value of heating area is just the first year of geothermal system running. For a long-term running condition, we discuss in “Evaluation of long-term intermittent operation” section.
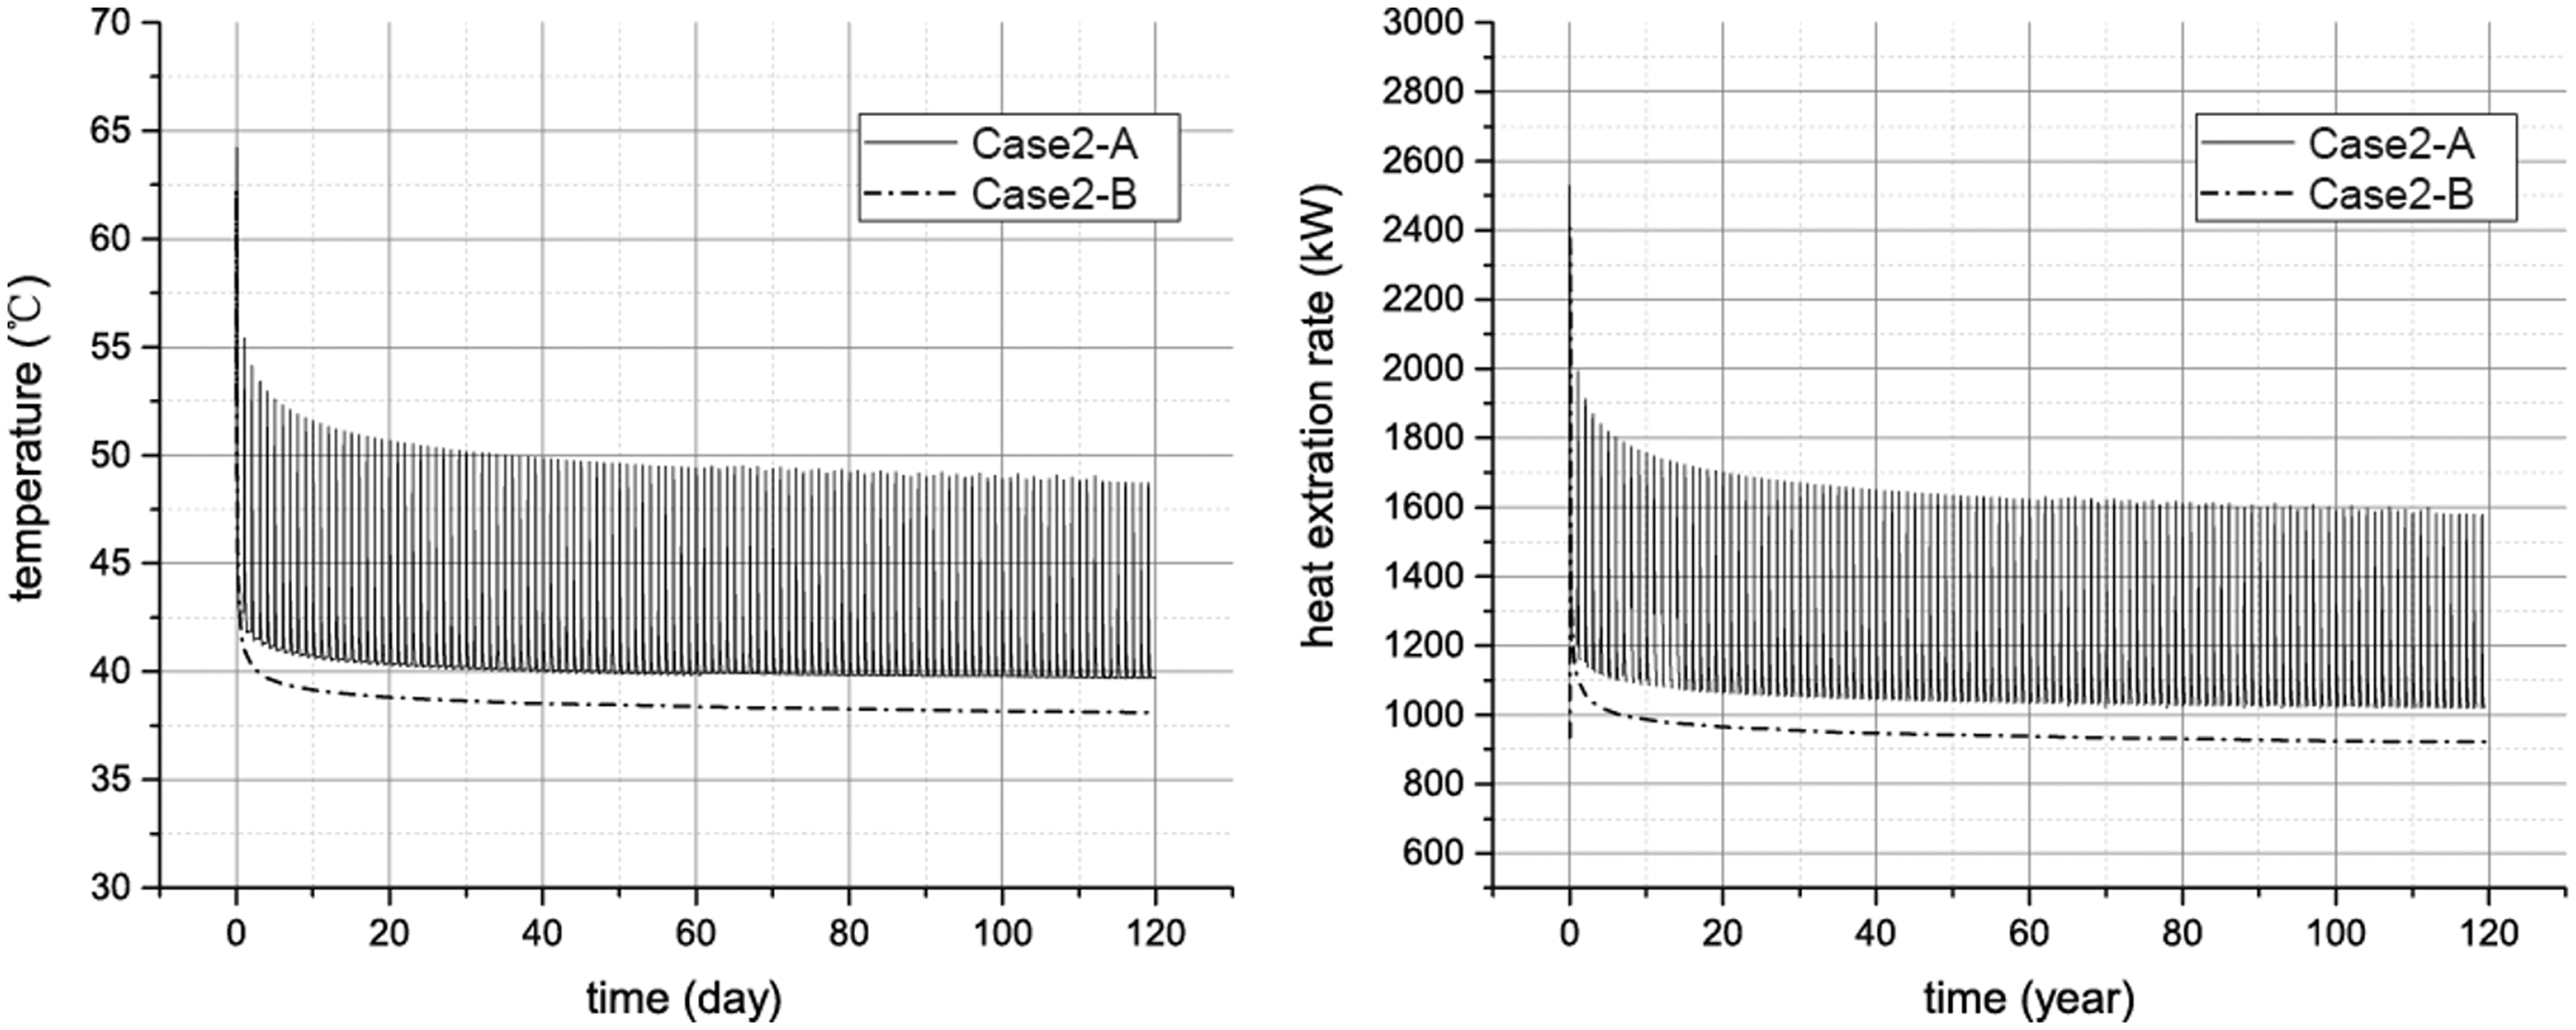
According to the result analyzed, it indicates that the temperature of surrounding formation recoveries quickly enough to maintain stable operation of the system. Figure 6 shows the formation temperature distribution before and after geothermal system shutdown in Case 2-C and the temperature evolution of geothermal well bottom after the heating period, respectively. The simulation result shows that the radius of cooling region before geothermal system shutdown is 12 m and it increases to 22 m. Besides, the isoline of the formation temperature field becomes smooth and the temperature around the well rose obviously.
Temperature distributions before and after geothermal system shutdown in Case 2-C and the evaluation of formation temperature at the well bottom during 245 days’ shutdown period. (a) Is the formation temperature distribution before geothermal system shutdown. (b) Is the formation temperature distribution after 245 days' shutdown of geothermal system. (c) Is the evalution of formation temperature at the well bottom.
The evaluation of formation temperature at the well bottom indicates that the temperature recovering rate decreases with time rapidly until about 15 days after geothermal system is shutdown. When the temperature recovers for 15 days, the temperature is 70.82°C in Case 2-C. Comparing with 77.22°C of initial formation temperature, the temperature recovering ratio is 91.7%. In addition, it will increase to 98.6% at the end of temperature recovering period.
The reason for this phenomenon is the large temperature gradient near the geothermal well when the geothermal system is just shutdown and it will lead to a very large heat flux from far-well region to near-well region. Therefore, the temperature recovery is fast at the beginning. The temperature gradient decreases gradually and the heat flux also decreases by the recovery.
Evaluation of long-term intermittent operation
Figure 7 shows the simulation results of the production temperature and the heat extraction rate in Case 3-A (intermittent) and Case 3-B (continuous). The results indicate that in intermittent operation conditions, production temperature and heat extraction rate are higher than that in continuous operation conditions. Under the condition of intermittent operation of geothermal system, the evaluation of production temperature and heat extraction rate at each year is the same, and the average temperature and the average heat extraction rate are decreasing slightly in the first four years. Numerically, average production temperature of intermittent operation (53.62°C) is 10°C larger than that of continuous operation (43.64°C) when the temperature stabilizes (after system running for four years). Heat extraction rate shows the similar result. The average value of intermittent operation is about 200 kW larger than continuous operation. The heat extraction rate decreased slightly during the operation. The average value decreases from 570 kW to 508 kW. The heat extraction rate is almost constant during the 20 years of intermittent operation. This indicates the formation temperature near the well can recover to the initial value after 245 days. Therefore, we have enough confidence to be sure that the shutdown period of geothermal system between two operation periods can satisfy the temperature recovery of the formation. This will essentially maintain a long-term stable heating from the CLGS.
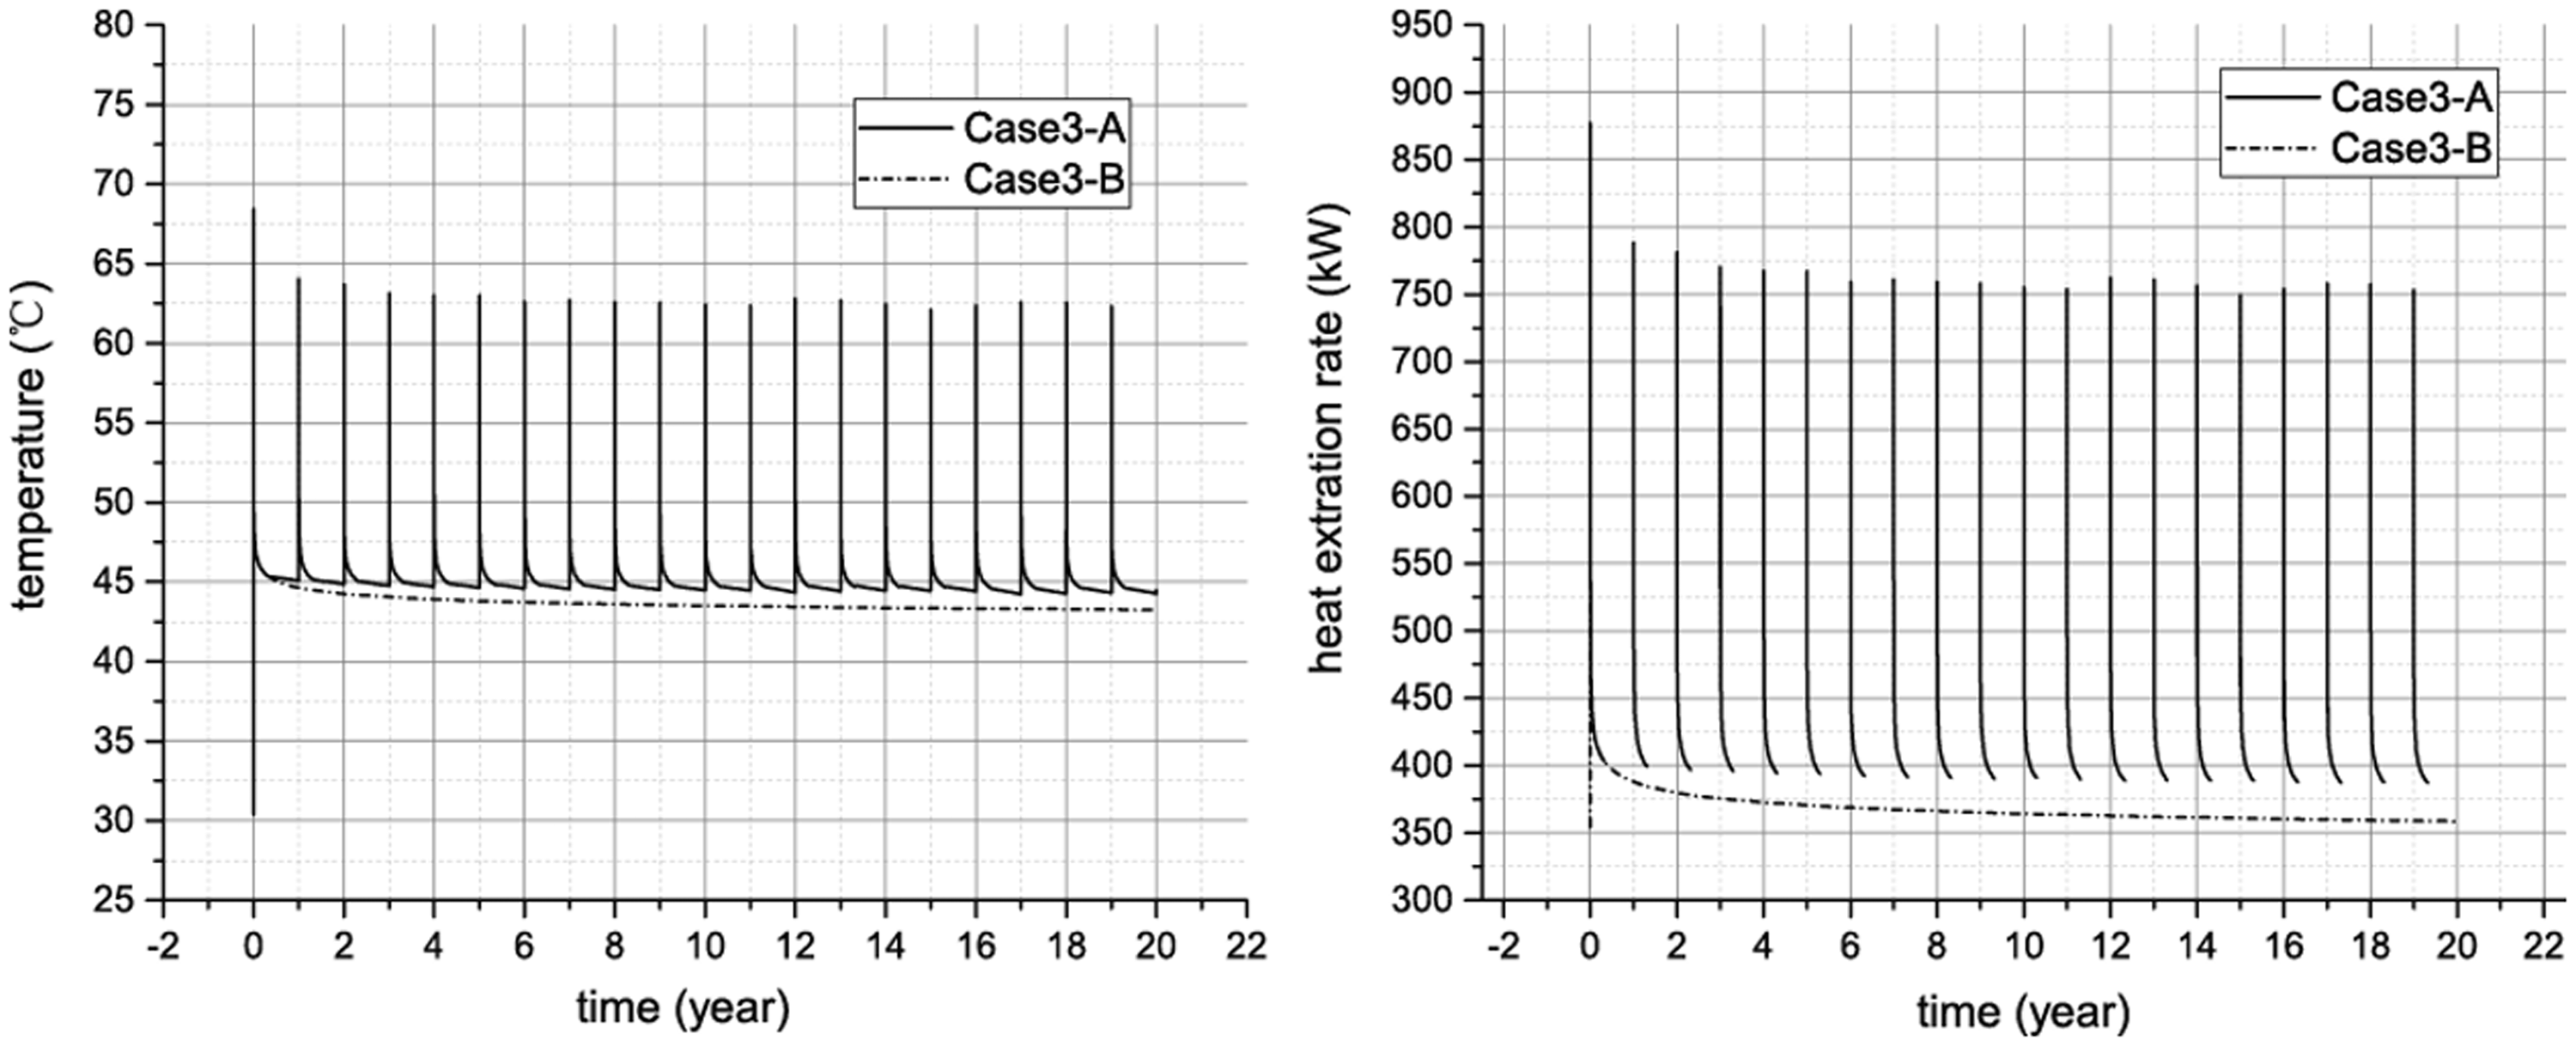
Simulation results of the production temperature and the heat extraction rate in Case 3-A (intermittent) and Case 3-B (continuous).
The evaluation of temperature distribution for 20 years is shown in Figure 8. The effected distance is within 65 m after 20 years. Therefore, it could be inferred that if there are more than one well drilled, the distance between each two wells should be larger than 130 m. While 80–100 m is also an acceptable distance when the sites are limited and cannot give enough distance for well construction.
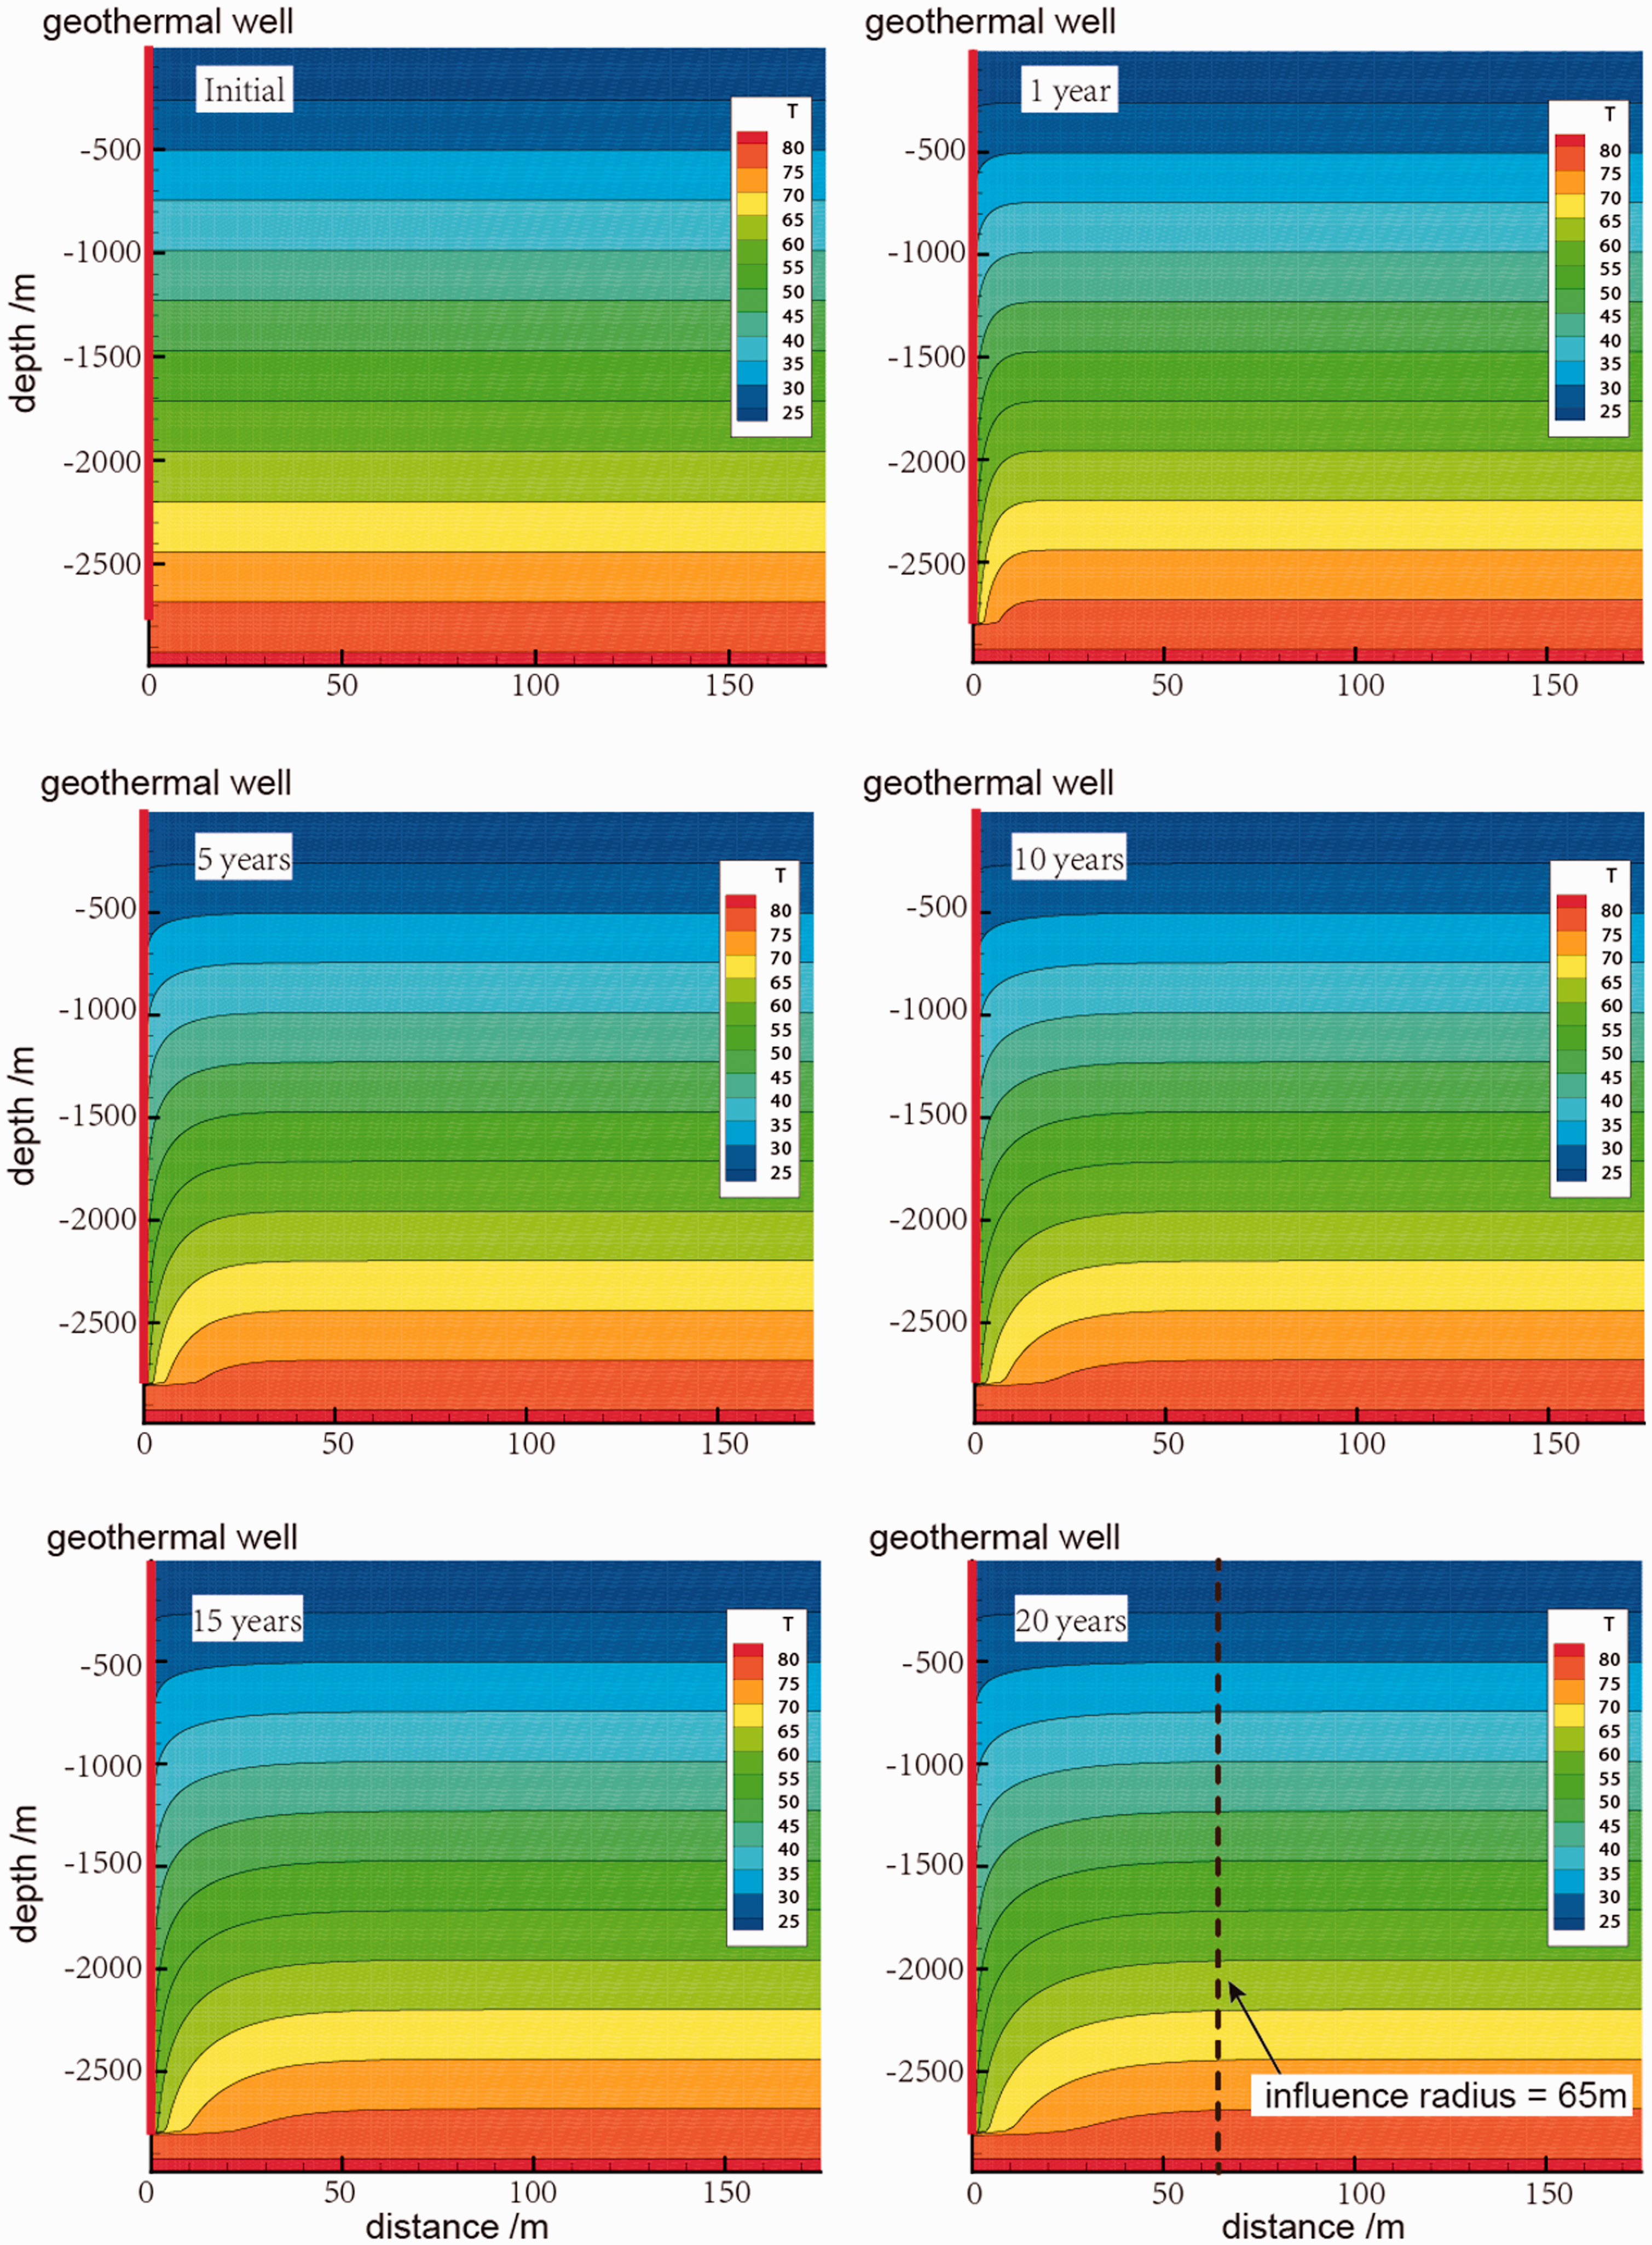
Evaluation of formation temperature field during system operation for 20 years.
Referring to the standard used in “Evaluation of the short-term operation” section, the heating capacity of a GLGS is 13,157 m2 when it runs intermittently after system running for 20 years. If we think the distance of temperature decrease range is 65 m, then we need 77 geothermal wells and about 1 million m2 of site for heat buildings of 1 million m2. Besides, the difference of heating area between continuous operation and intermittent operation decreases gradually with the prolongation of operation time. In 20 years of operation of geothermal system, the heating area of intermittent operation is 9210 m2 and the difference between them is reduced to 4000 m2.
Discussion
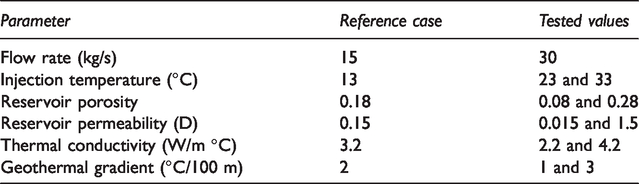
When the actual heating project is designed, the requirement of geothermal system performance is different according to different heating projects. In actual engineering, the injection temperature and flow rate are usually changed to adjust the different heat production performance of the geothermal system. Considering the actual operation capacity of pumps and the economy and safety of geothermal engineering, the highest flow rate in general geothermal heating engineering is about 30 kg/s. This is quite a large flow rate for hydrothermal geothermal engineering, but it is acceptable in CLGS. The injection temperature varies with the heating load, so we choose 23°C and 33°C as injection temperature for sensitivity study. This value will reach at low heating load. The influences of those two parameters in the 20 years’ intermittent operation are discussed in this section. In addition, based on site geological conditions, such as porosity, permeability, thermal conductivity, and geothermal gradient, may also affect the thermal performance of the geothermal system, so sensitivity analysis of these factors is also carried out. Simulation schemes and investigated values of the two parameters are listed in Table 3.
Overview of scenarios of the adjustable parameters.
Influences of flow rate
Figure 9 shows the simulation results when the injection temperature is 13°C and the flow rate is 15 kg/s and 30 kg/s. The results indicate that the average production temperature decreases from 54°C for 15 kg/s to 50°C for 30 kg/s, and the average heat extraction rate increases from 778 kW to 1023 kW. It means that a large flow rate will lead to a smaller production temperature and a higher heat extraction rate. However, the average production temperature and the average heat extraction rate do not decrease within 20 years. The reason is that a higher flow rate will extract more heat per unit time and the heat extraction rate will be higher. However, a higher heat extraction rate will also lead to a lower temperature at the formation near the well. Therefore, the production temperature and the flow rate are negatively correlated. According to the results of “Evaluation of the short-term operation” and “Evaluation of long-term intermittent operation” sections, the formation temperature will recover when the geothermal system is shutdown while the performance will not decrease in 20 years. According to the studies of different flow rates, flow rate will not affect the recovering temperature. The recovering temperature in 245 days’ geothermal system shutdown can also satisfy the next year’s heating.
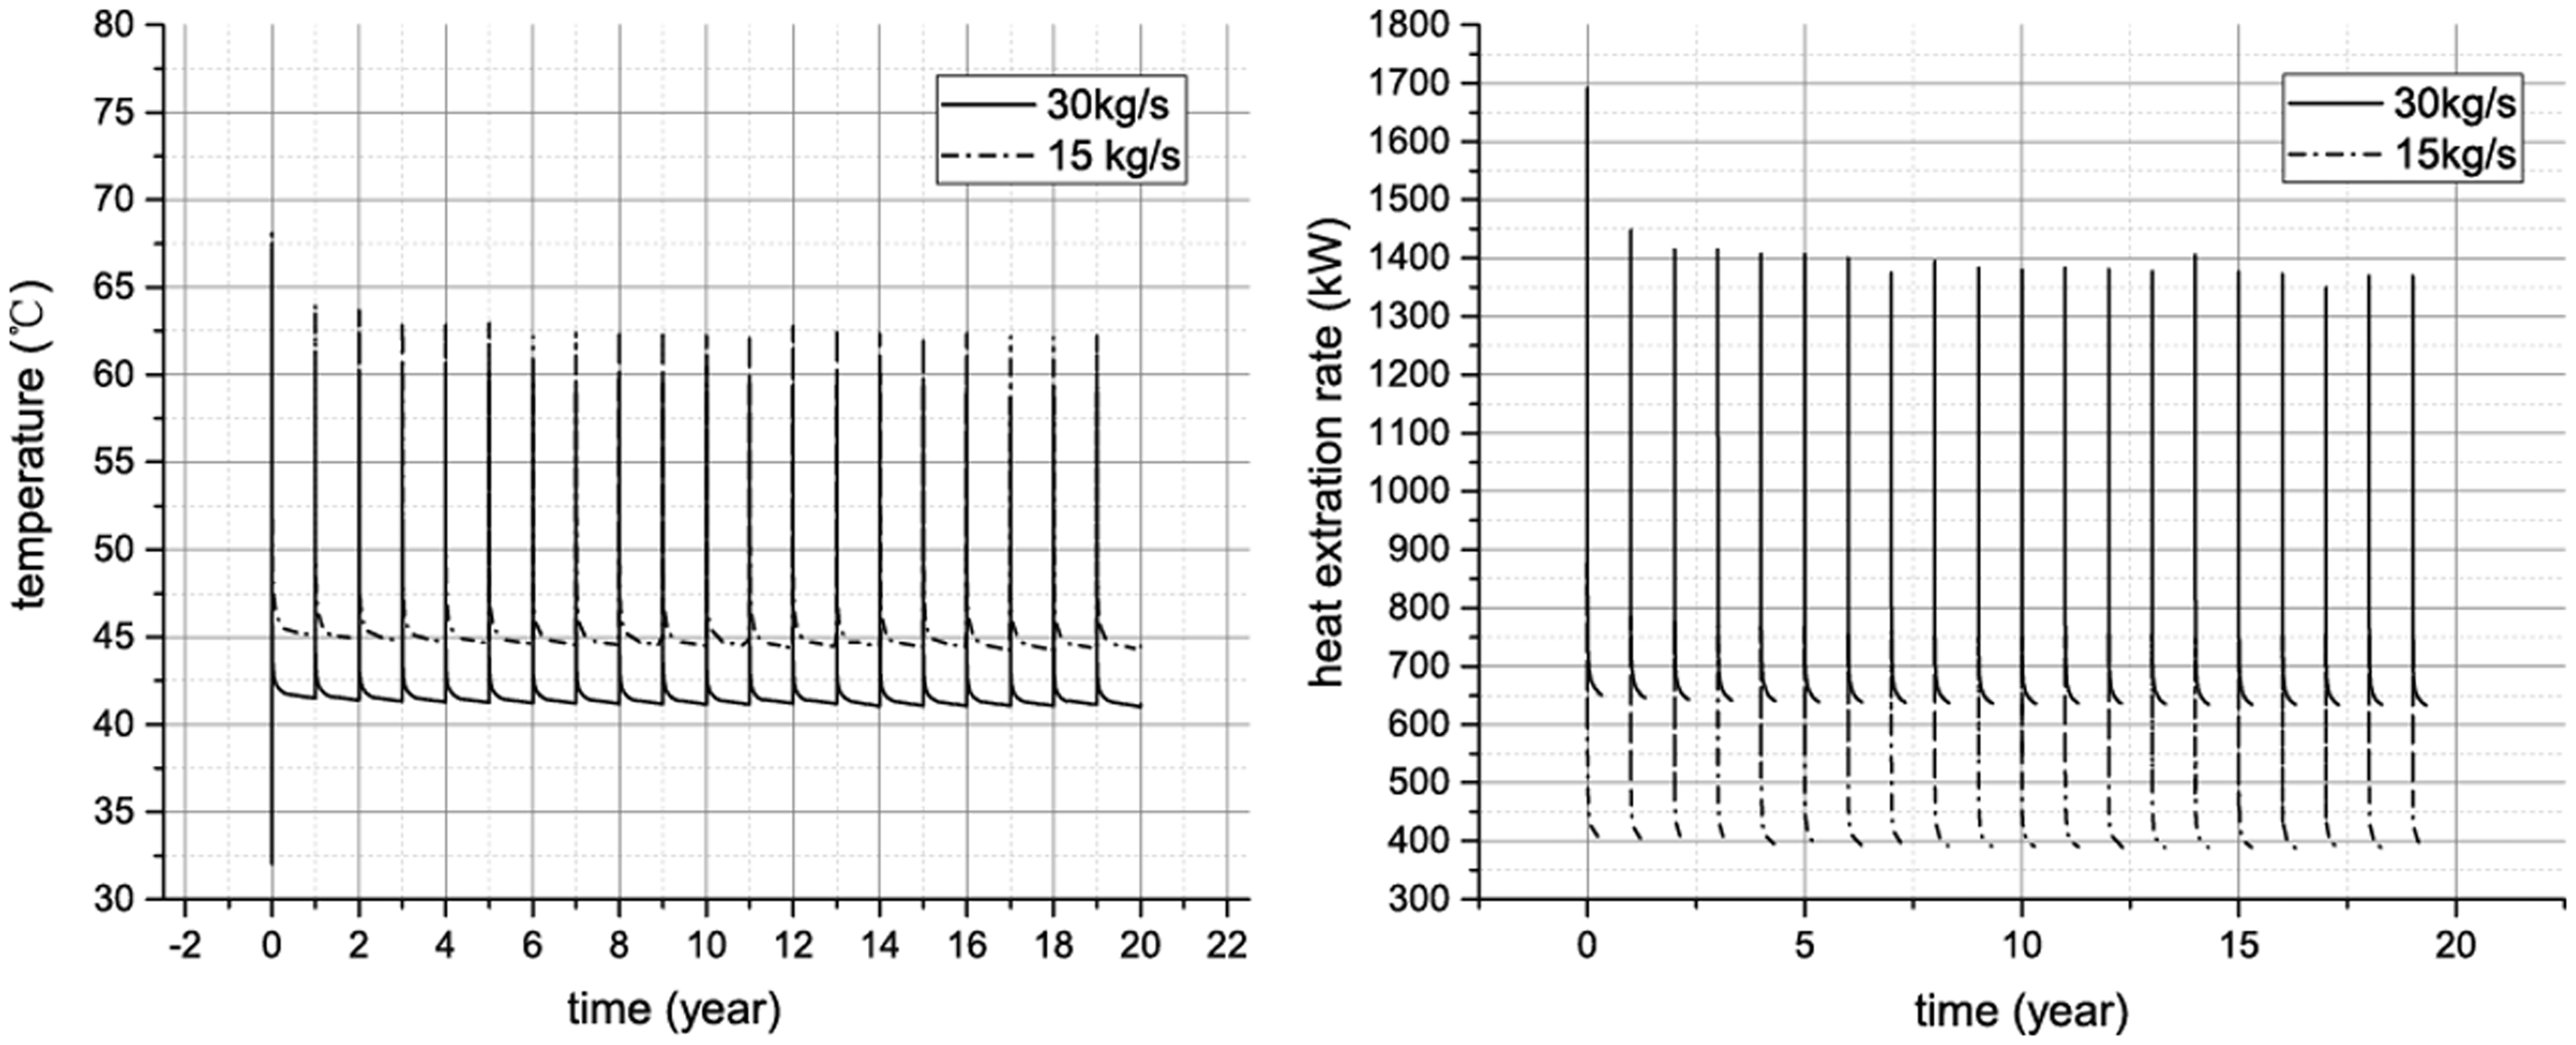
Simulation results of production temperature and heat extraction rate when the injection temperature is 13°C and the flow rate is 15 kg/s and 30 kg/s.
Influences of injection temperature
Figure 10 shows the simulation results when the injection temperature is 13°C, 23°C, and 33°C, with the same flow rate of 15 kg/s. The results showed that the average production temperature is 38.7°C, 44.7°C, and 57.4°C, and the average heat extraction rate is 727 kW, 647 kW, and 562 kW, respectively. It indicates that a higher injection temperature will lead a higher production temperature and a lower heat extraction rate. The reason is that the higher injection temperature corresponds to the lower temperature gradient with the formation temperature, and the heat extraction is proportional to the temperature gradient.
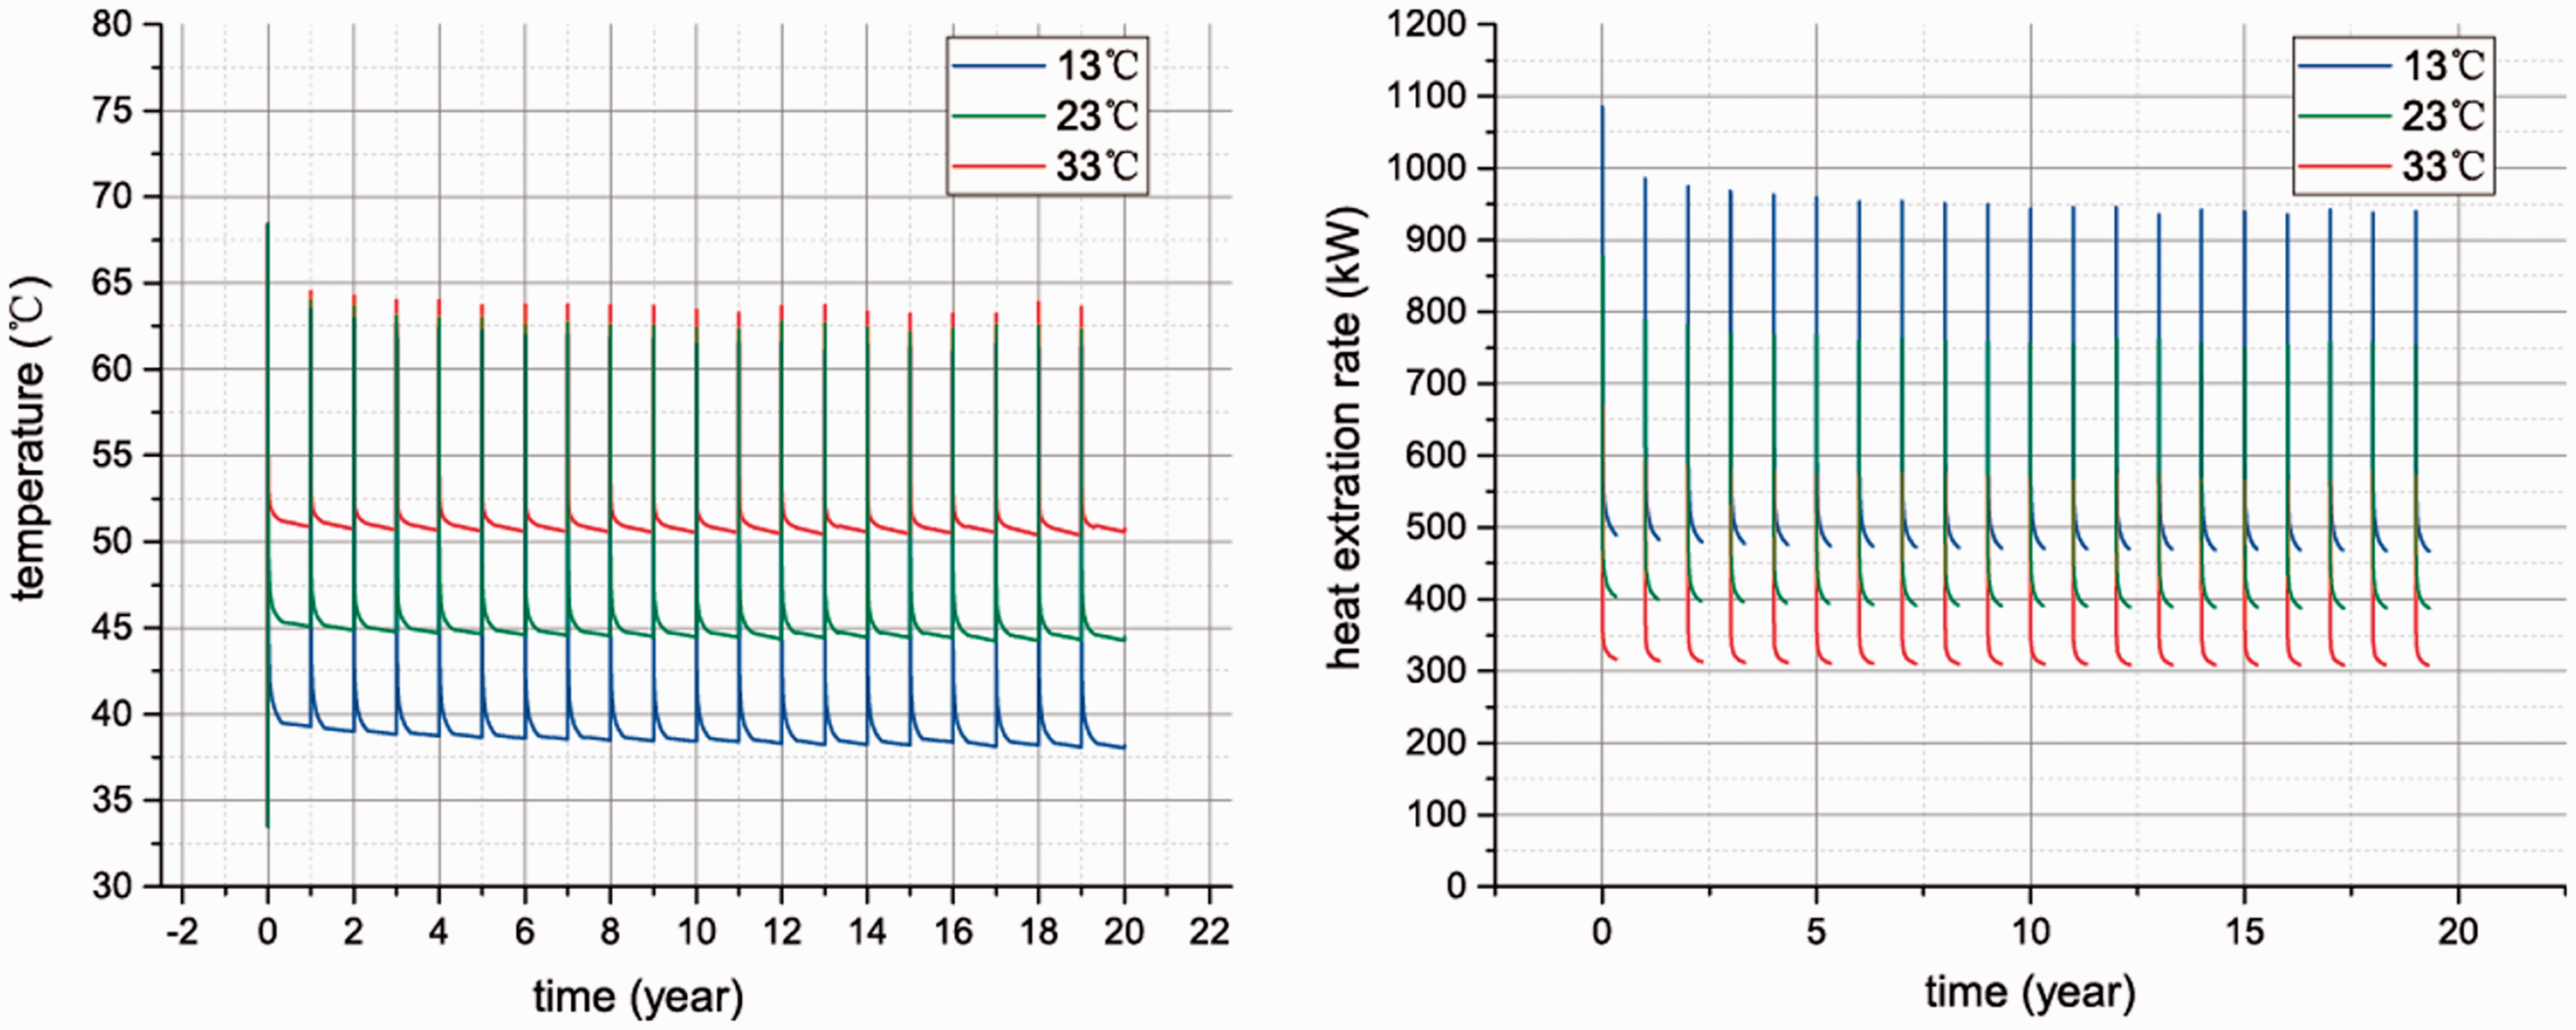
Simulation results of production temperature and heat extraction rate when the injection temperature is 13°C, 23°C, and 33°C, with the same flow rate of 15 kg/s.
Influences of reservoir porosity and permeability
Figure 11 shows the simulation results when the injection temperature is 23°C and the flow rate is 15 kg/s. The simulation results show that the permeability and porosity of reservoir hardly affect the productivity of geothermal system. The reason is that because of the low extent of formation cooling and the weak convection caused by the temperature difference in the formation, the factors controlling groundwater flow have less influence on the geothermal system. This means that we can ignore the influence of formation permeability to some extent on geothermal system in the actual site development process, which greatly simplifies the design and site selection of geothermal system.
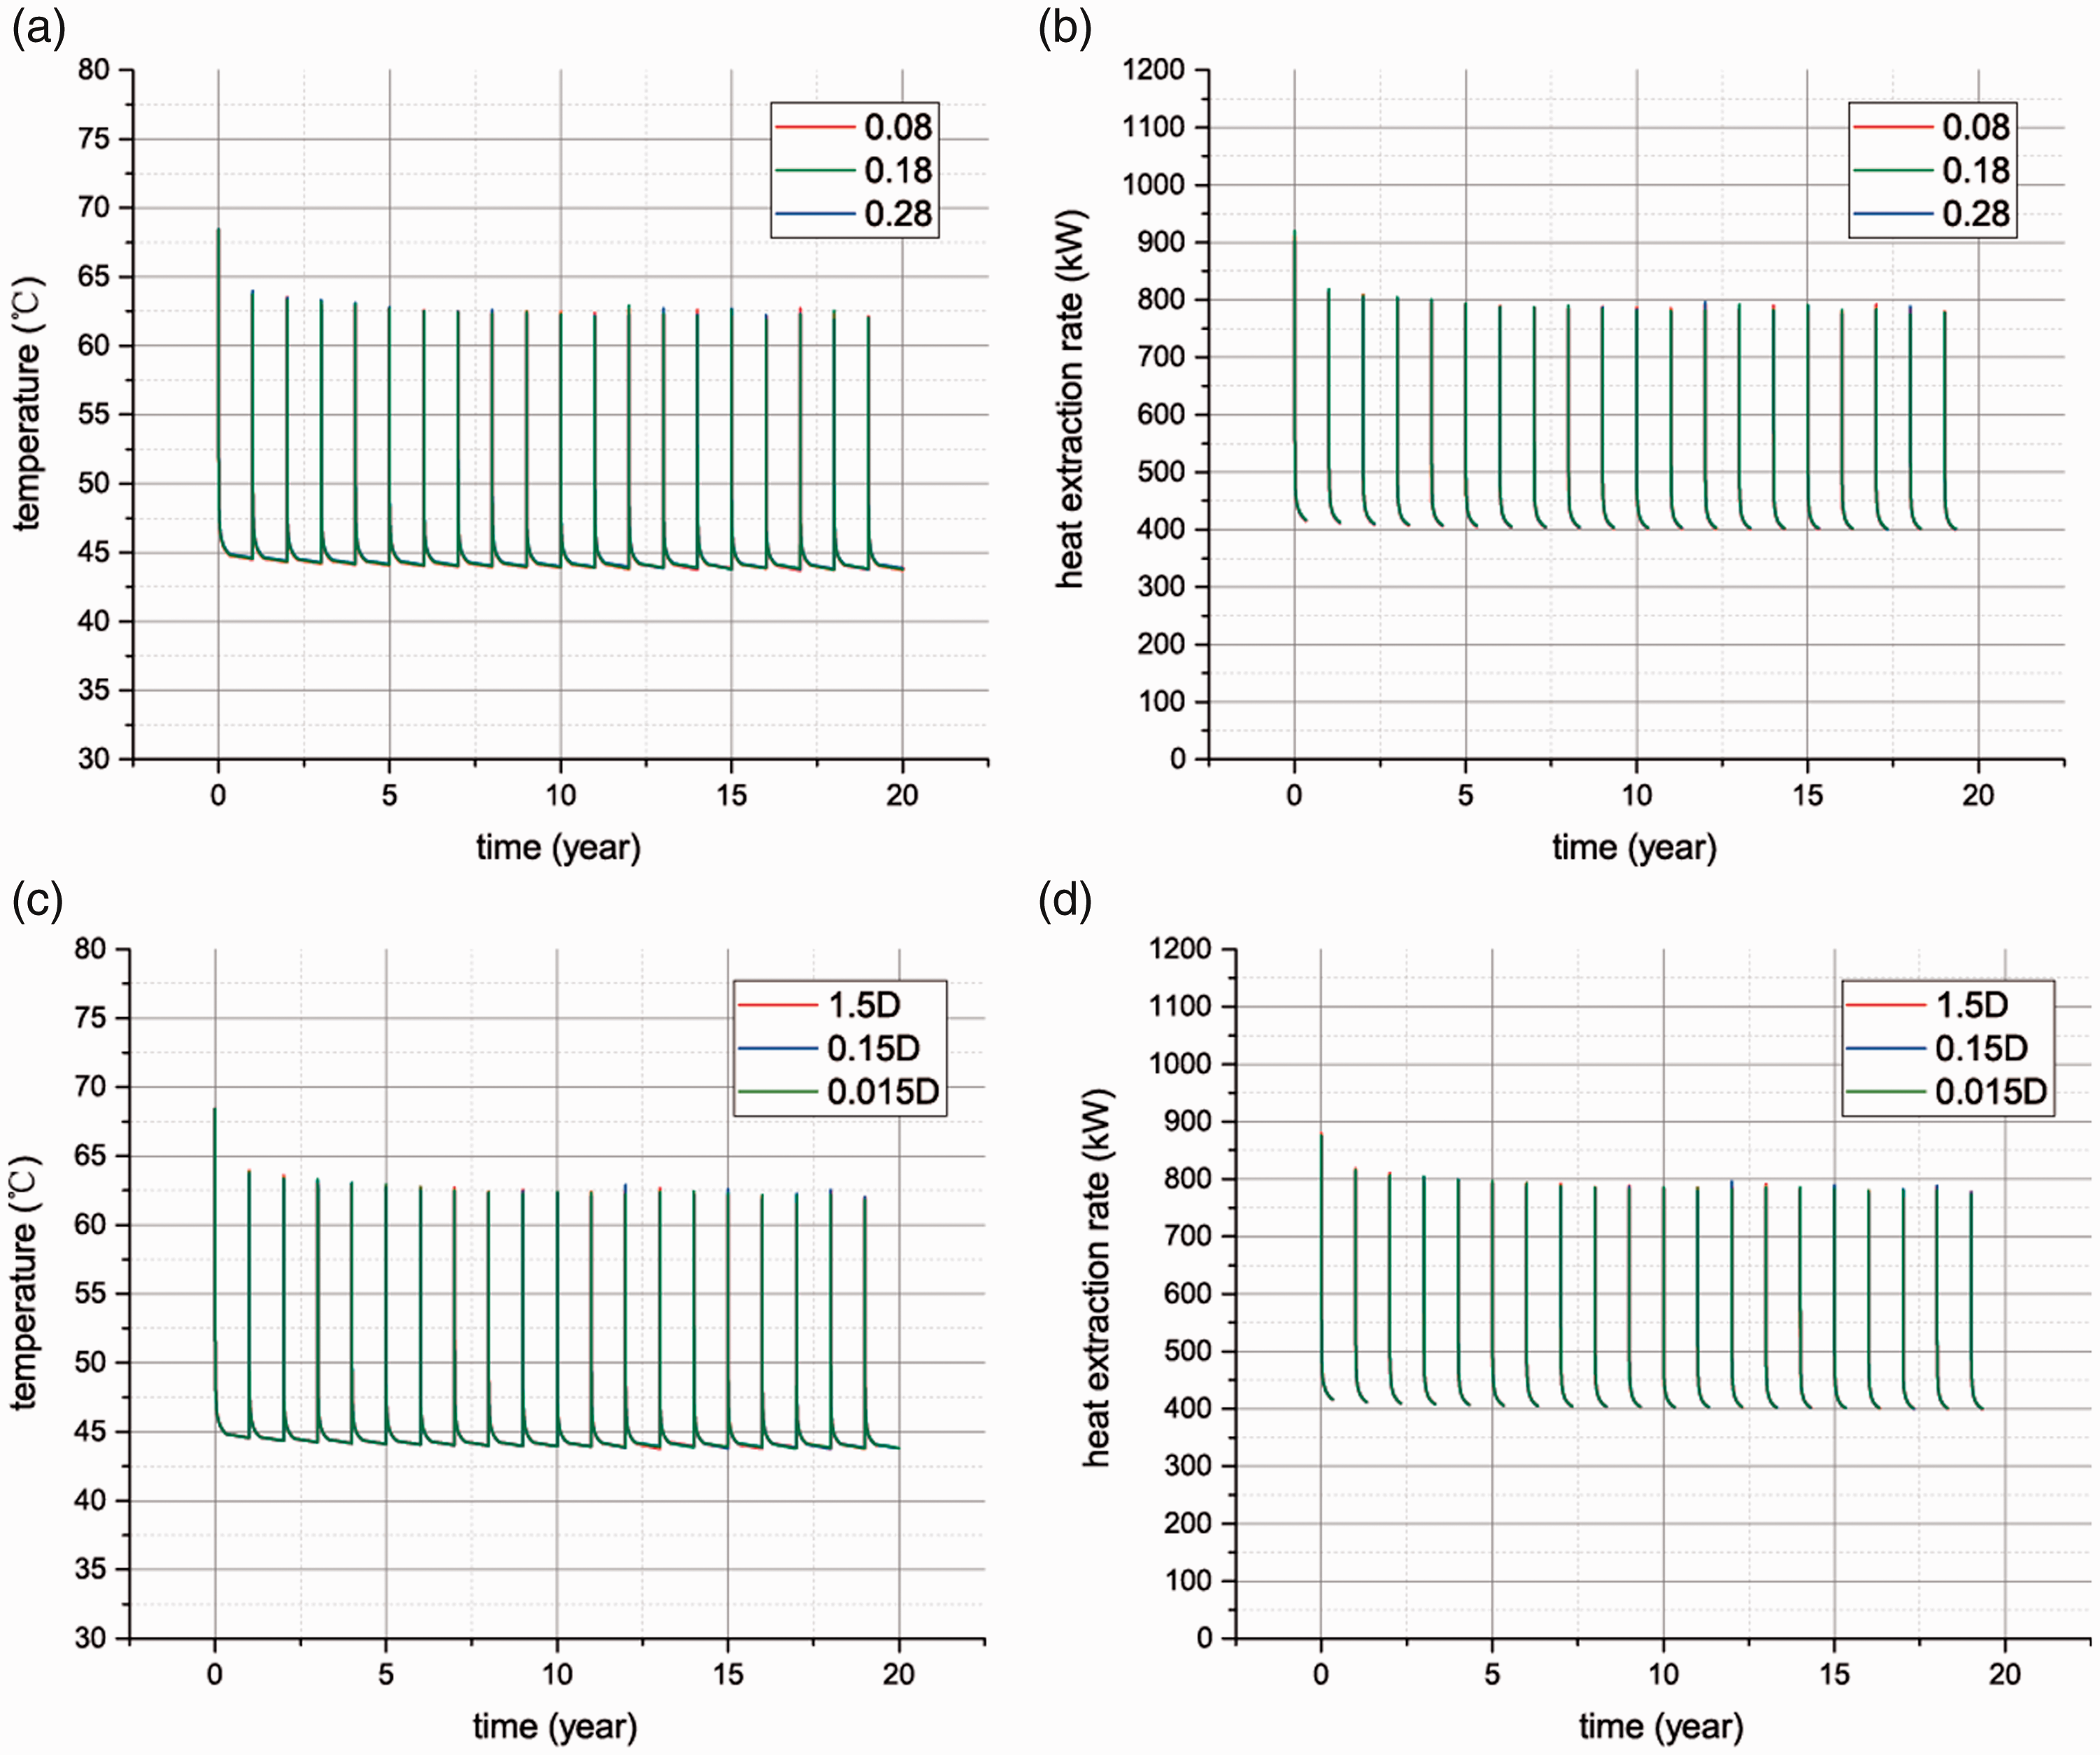
Simulation results of production temperature and heat extraction rate with the different porosity and permeability when the injection temperature is 23°C and the flow rate is 15 kg/s. (a) and (b) is the output temperature and heat extraction rate with the different porosity; (c) and (d) is the output temperature and heat extraction rate with the different permeability.
Influences of the reservoir thermal conductivity
Figure 12 shows the simulation results when the injection temperature is 23°C and the flow rate is 15 kg/s, same as the last one. The simulation results show that the results are quite different under different heat conductivity. Higher heat conductivity has higher output temperature. Obviously, the heat flow in there reservoir is faster when the thermal conductivity is lager. This is why the higher thermal conductivity of reservoir will led to a higher output temperature and heat extraction. In addition, the radius of the cooling region of the geothermal well is larger when the thermal conductivity of the formation is larger, but the difference of the radius of the main cooling region (regions with a large temperature dropping) is very small (shown in Figure 13). Therefore, it can be determined that the higher thermal conductivity of the formation will be more conducive to the heat production of the geothermal system during the system operation period of about 20 years, but at the end of the recovery period. The area of formation cooling is not sensitive to formation thermal conductivity.
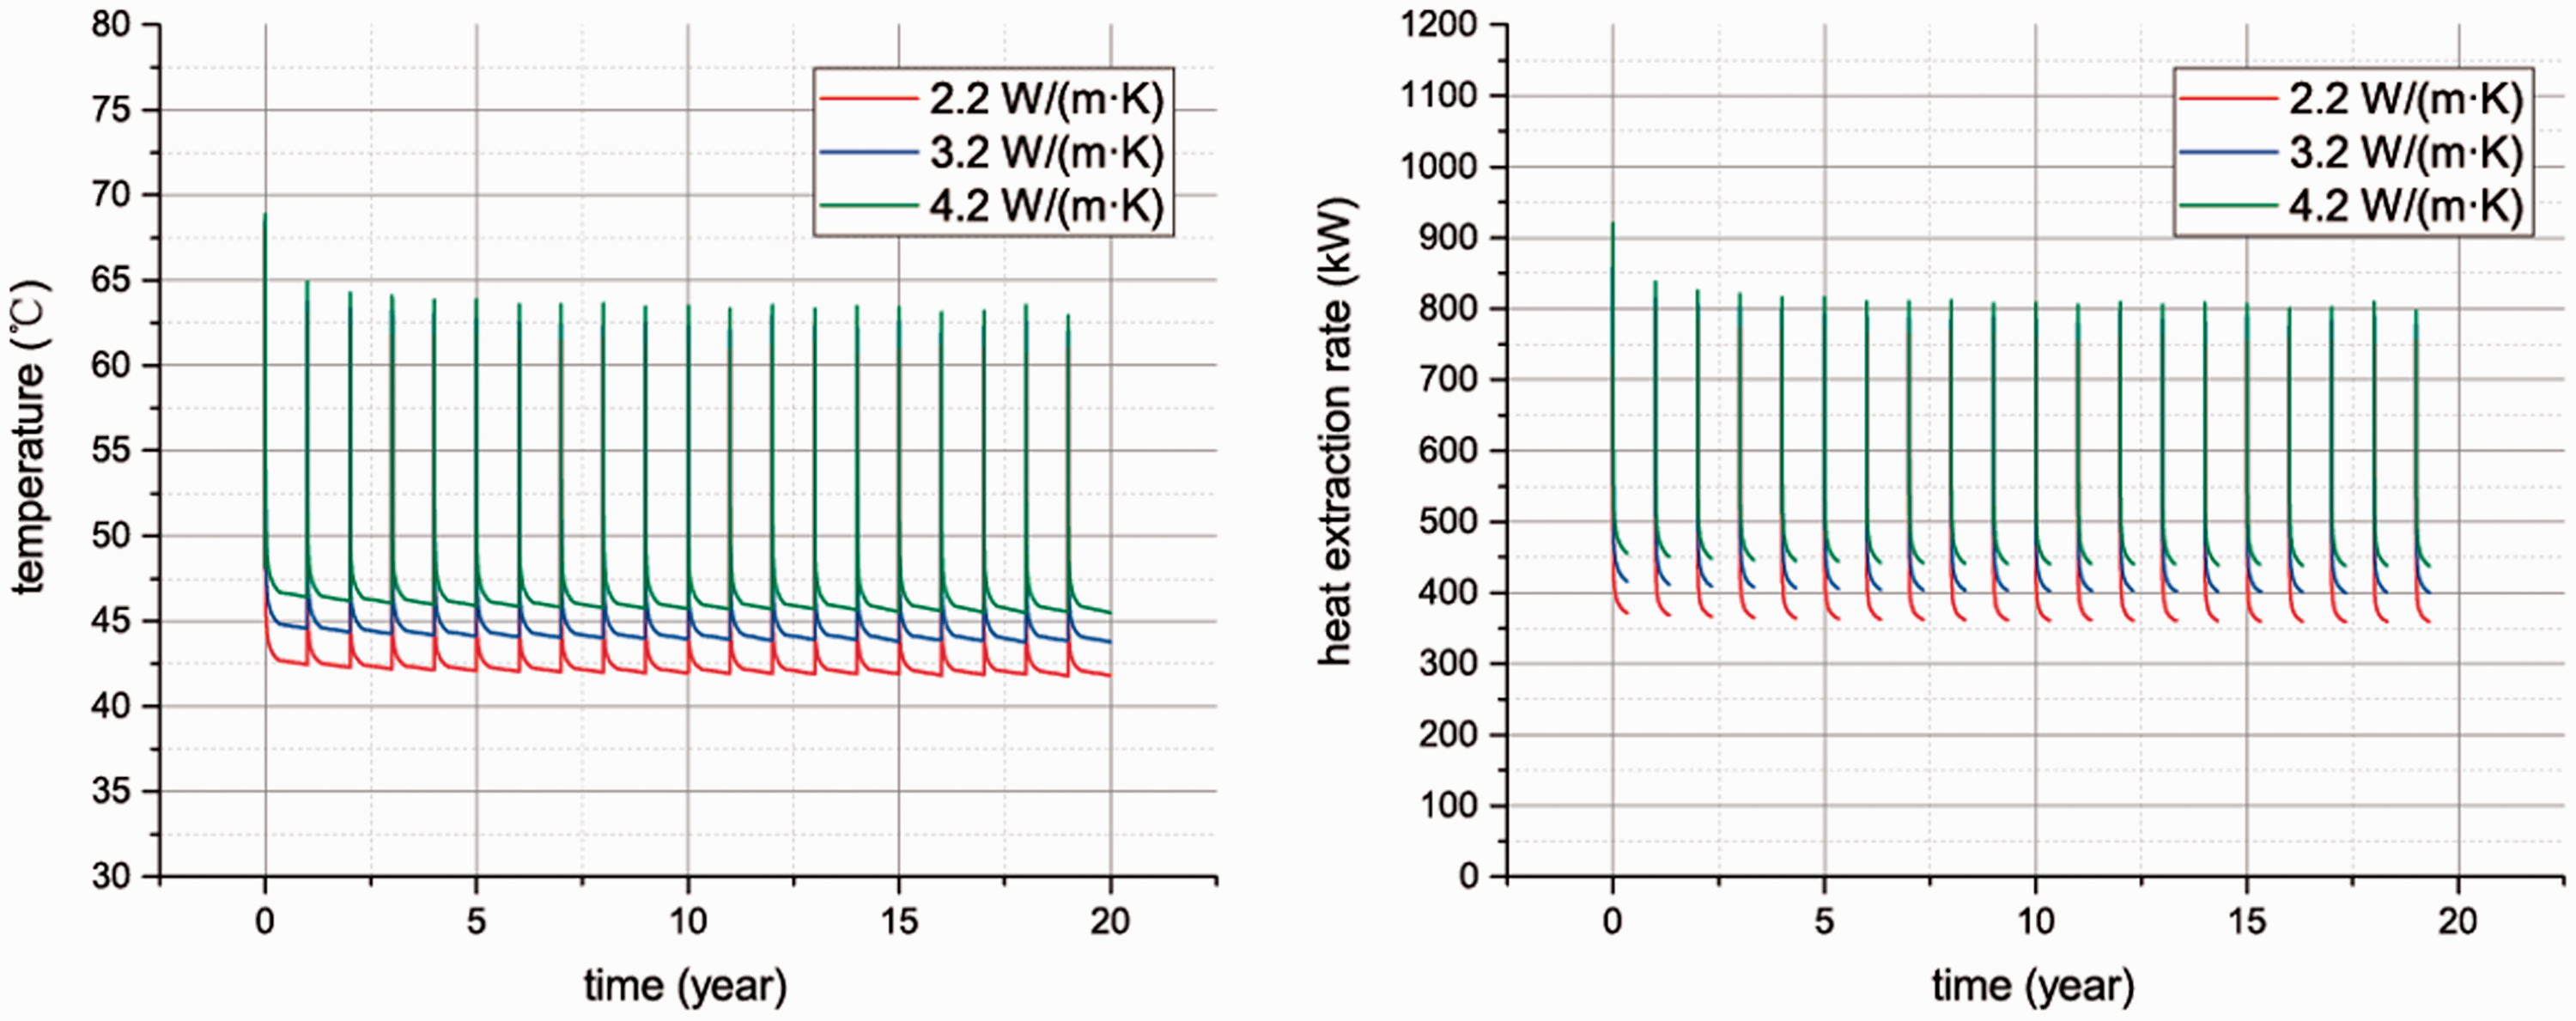
Simulation results of production temperature and heat extraction rate with the different thermal conductivity when the injection temperature is 23°C and the flow rate is 15 kg/s.
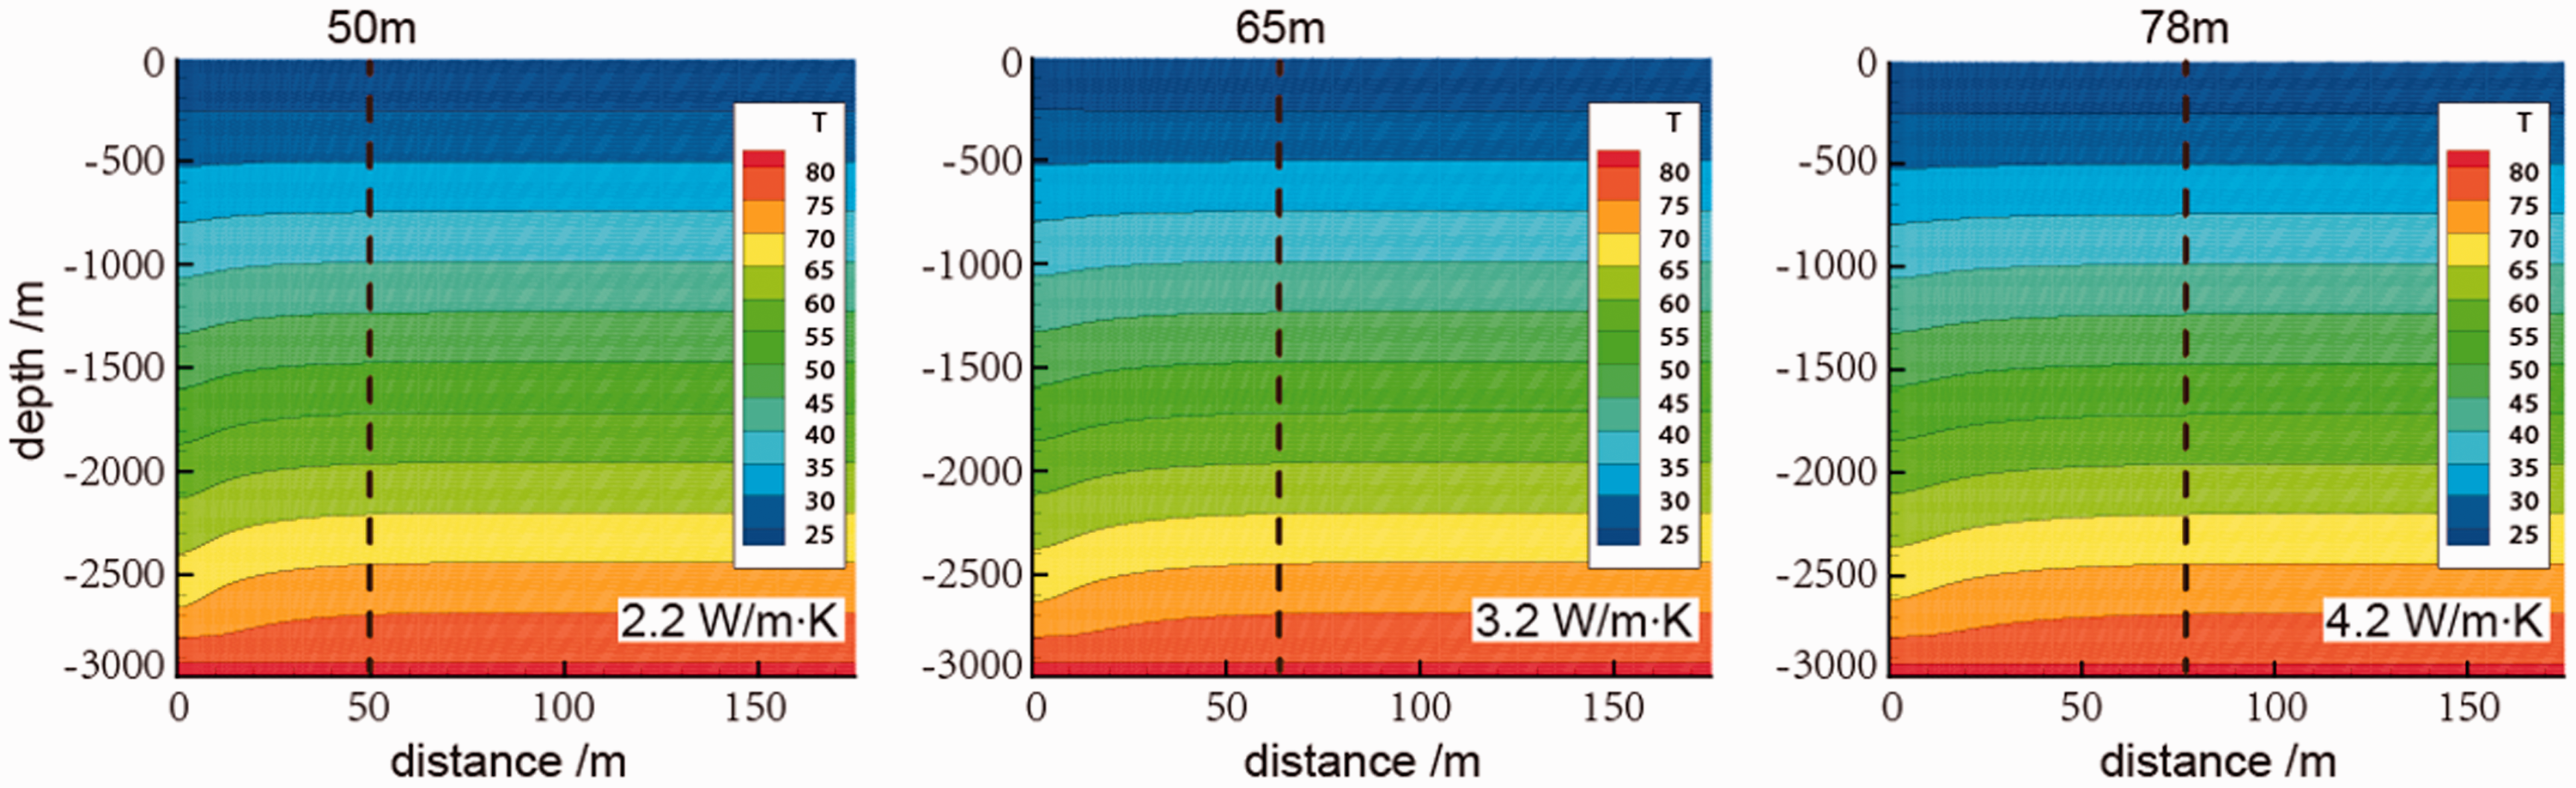
Distribution of temperature field after 20 years running of the geothermal system with different thermal conductivity.
Influences of the geothermal gradient
Figure 14 shows the simulation results when the injection temperature is 23°C and the flow rate is 15 kg/s, same as the last one. The simulation results show that the higher geothermal gradient has a great influence on the performance of geothermal system. This is also a normal result of higher geothermal gradients we can imagine. Because of the higher reservoir temperature due to geothermal gradient, not only the output temperature will be higher during system running but also the initial output temperature will be higher at the beginning of each heating period. In addition, it can be seen that the output temperature increase caused by the high geothermal gradient is in the whole operation period, which is very conducive to the operation of the geothermal system. This also indicates that the geothermal gradient is the main influencing factor of a CLGS.
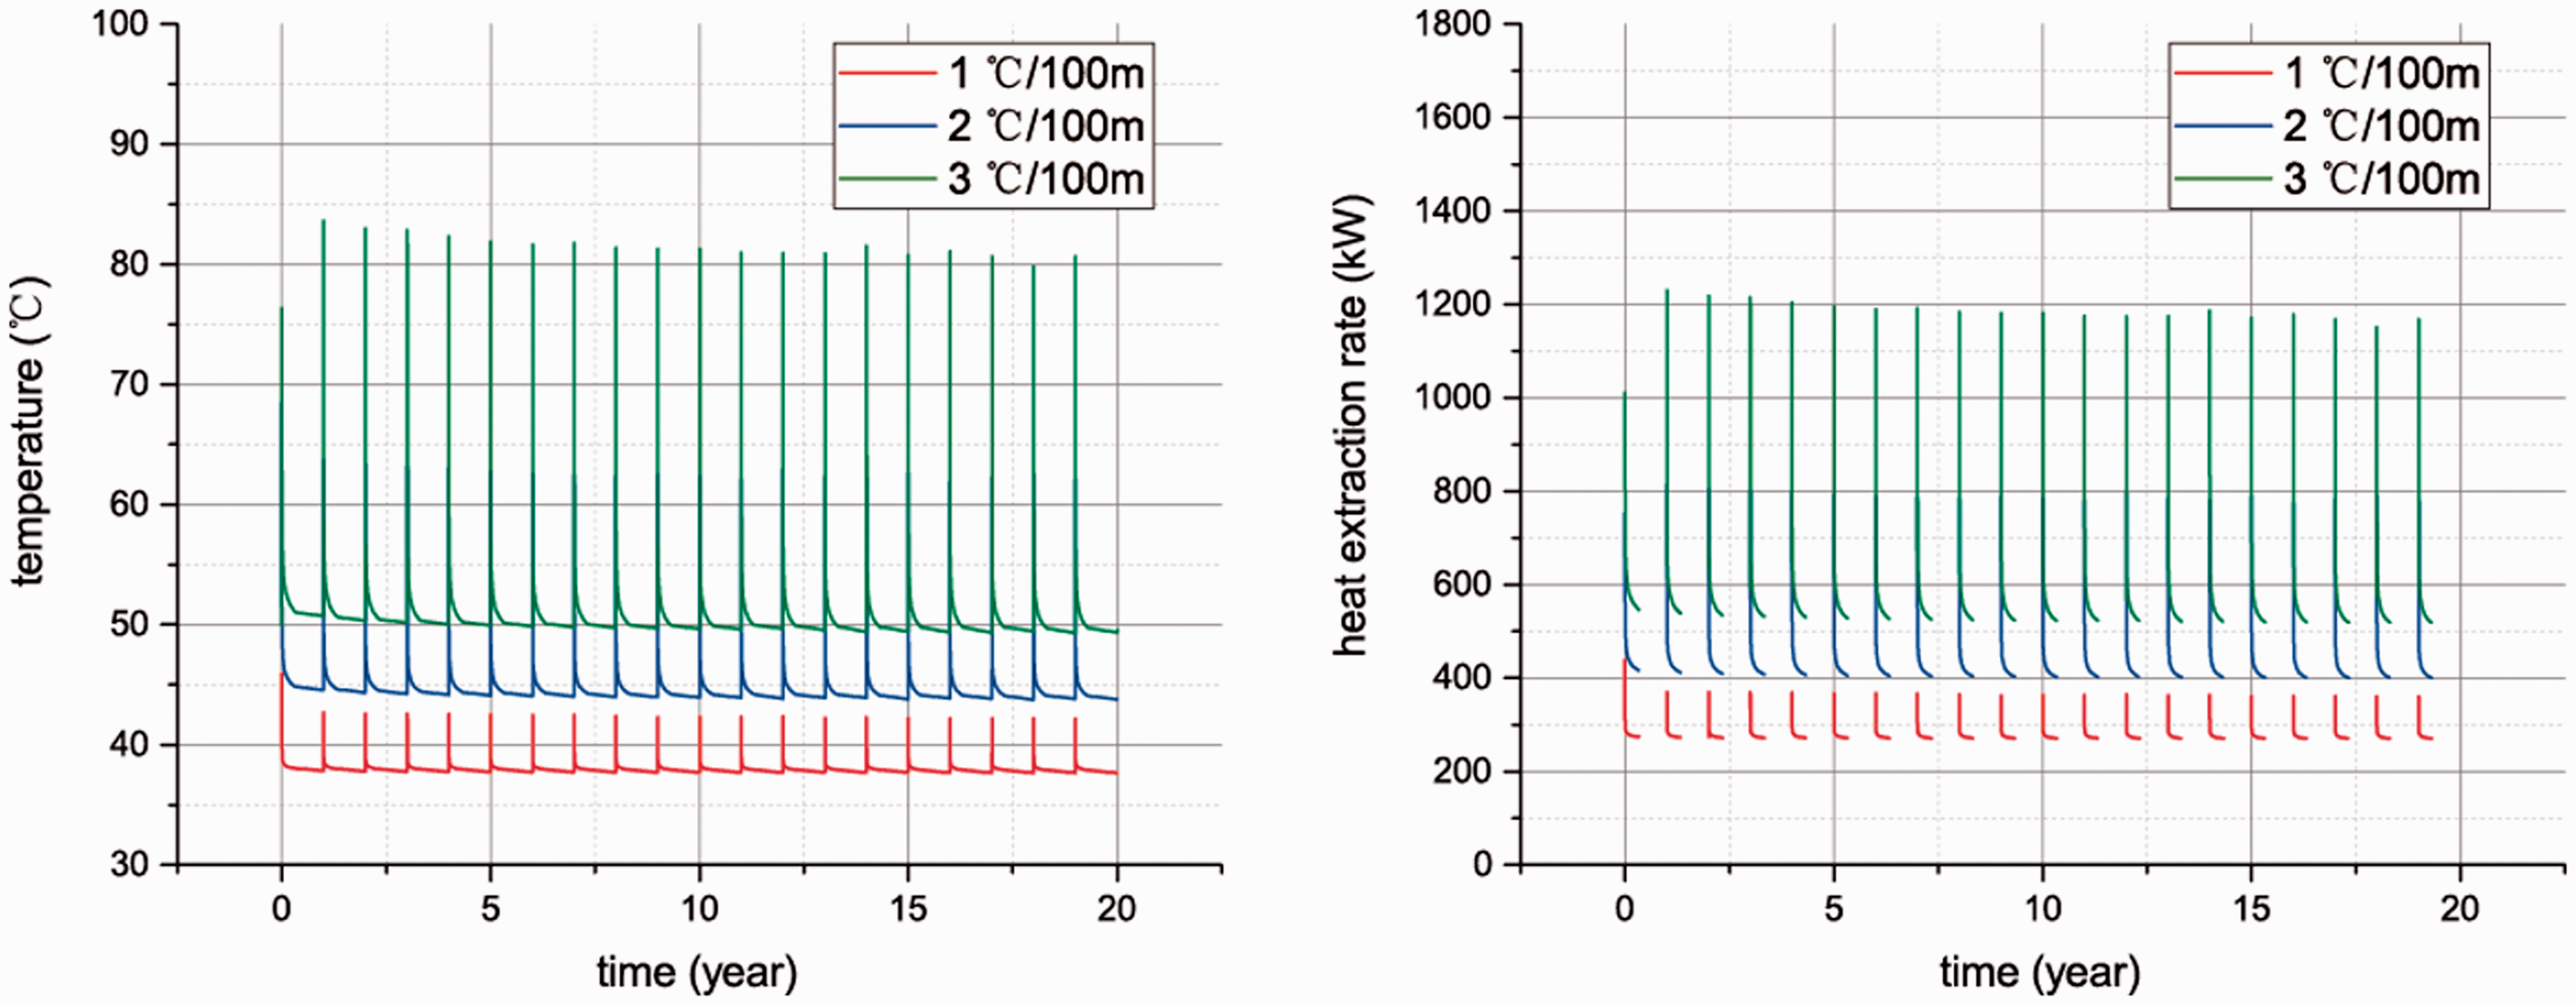
Simulation results of production temperature and heat extraction rate with the different geothermal gradient when the injection temperature is 23°C and the flow rate is 15 kg/s.
Conclusions
In this study, the heating capacity and stability of a single-well CLGS are studied using wellbore–reservoir coupling numerical simulations. Thermo-physical parameters of the model are calibrated with a short-term field test. Production temperature, heat extraction rate, and formation temperature distribution for short-term and long-term operations are evaluated. The influences of flow rate and injection temperature have been discussed. Based on the modeling results and analyses, the following conclusions can be drawn:
Intermittent operation can extract more thermal energy from the formation than that of continuous operation, and the stability can be guaranteed. Temperature recovery in the formation around the geothermal well can be quickly restored after the geothermal system is shutdown. Therefore, the temperature in the formation can be fully restored during the period of stopping heating in summer, and the heating in the next year will not be affected. Under long-term operation, a geothermal well can ensure heating of buildings of 10,000–20,000 m2 and the heating area of intermittent operation is 4000 m2 more than continuous operation. A higher injection temperature and lower flow rate will increase the production temperature, but the heat extraction rate will decrease. In the design of actual projects, the injection temperature and flow rate should be optimized according to the site geological and geothermal condition and ground equipment and project requirements. For different geothermal sites, the porosity and permeability of the formation have little effect on geothermal system. But the thermal conductivity and the geothermal gradient has a great influence on the operation effect of geothermal system.
The range of problems concerning the process in the wellbore-formation geothermal system is very broad. The present modeling results are specific to the conditions and parameters considered. The “numerical experiments” do give a detailed understanding of the dynamic evolution and provide useful insight into water flow, heat exchange, and energy extraction processes in the geothermal system.
Footnotes
Declaration of conflicting interests
The author(s) declared no potential conflicts of interest with respect to the research, authorship, and/or publication of this article.
Funding
The author(s) disclosed receipt of the following financial support for the research, authorship, and/or publication of this article: This work was jointly supported by the National Key R&D Program of China (2018YFE0111300), Jilin Provincial Department of Education Project (Grant No. JJKH20170807KJ), and China Jilin Province Provincial School Joint Construction Project: New energy special (Grant No.SXGJSF2017-5).