
Abstract
Deep shale has gradually become a focus point for unconventional natural gas exploration and development in China and even the world. The key to deep shale development is the fracability evaluation of a reservoir; conventional evaluation methods cannot provide accurate evaluations of deep shale fracability under high confining pressures. In this study, experimental methods are used to obtain the mechanical parameters, mineral composition, and stress–strain characteristics of shale. The fracture complexity coefficient based on the fractal dimension and fracture angle is defined by analyzing the fracture morphology of shale samples. Using the rock fracturing complexity as an index, the weight coefficients of different factors for the shale fracture morphology are obtained, thus establishing a new evaluation model for the deep shale brittleness index. The results show that the Young's modulus, dilatancy angle, and peak strain are the main factors affecting the complexity of shale fractures. The gray correlation theory is used to calculate the weights of various factors in the model. The weight coefficients of the Young's modulus, dilatancy angle, and peak strain on the rock brittleness index are 0.262, 0.353, and 0.385, respectively. Based on this, a novel method for evaluating the fracability of deep shale using the brittleness index is proposed. The fracability index of the horizontal section of the deep shale gas well in this area was calculated, and the location of the fracturing perforation cluster was optimized accordingly. This technology has been successfully applied in more than 10 deep shale gas wells in the southern Sichuan Basin, effectively reducing the fracturing pressure by 5–10 MPa, increasing the average daily production of a single well by 15.3 × 10⁴ m3. This paper proposes a novel fracability evaluation method for deep shale based on the brittleness index, which provides a reference for optimizing deep shale fracturing design.
Introduction
Most shale gas reservoirs in the south of the Sichuan Basin in China are located at a depth of 3500–4500 m, such that volume fracturing is a vital technology for production stimulation (Lu et al., 2019a). The development of shale gas requires the formation of a complex fracture network in the reservoir to provide an effective flow channel for shale gas (Shen et al., 2019). Fracability evaluations assess the ability of reservoirs to form fracture networks. The method of evaluating the shale fracability using the traditional brittleness index for deep shale in the southern Sichuan Basin is notably not applicable owing to the shale's high confining pressure, high fracturing pressure, and strong rock plasticity (Jiang et al., 2017; Bian et al., 2019).
Internal and foreign researchers have recently proposed their own evaluation methods for reservoir fracability from different aspects. Early research used rock brittleness to evaluate fracability. Hucka and Das (1974) used the uniaxial compressive strength test and a Brazilian test to obtain the compressive strength and tensile strength, then calculating the rock brittleness. Rickman et al. (2008) proposed the use of the normalized elastic modulus and Poisson's ratio to calculate the brittleness index, setting each weight parameter to 0.5; based on the results of rock mechanics experiments on the Barnett shale gas field reservoir, they developed a suitable brittleness index prediction chart for the gas field reservoir. In addition, several studies have evaluated the brittleness index through rock mineral compositions. Jarvie et al. (2007) proposed a method for evaluating brittleness based on the relative content of mineral components, in which only quartz is the brittle mineral. The brittleness index of the rock is calculated by the proportion of quartz content to the total content; higher quartz contents yield greater brittleness values. Li (2013) regarded quartz and carbonate as brittle minerals, clay minerals as non-brittle minerals, and calculated the proportions of quartz and carbonate. Jin et al. (2014) provided a comprehensive expression of the mineral brittleness for silicate (quartz and feldspar, among others) and carbonate minerals (dolomite and calcite, among others), which expanded the inclusion of brittle minerals. Quartz, feldspar, mica, dolomite, calcite, and other carbonate minerals can be included in the category of brittle minerals. Therefore, Liu and Sun. (2015) integrated elastic parameters and mineral components to construct two new relative brittleness factors to predict shale brittleness. Due to the complexity of the deep shale geology in China, different factors have different degrees of impact on rock brittleness. In general, internal and foreign researchers have proposed various methods to evaluate the brittleness, but these methods only consider the inherent properties of rocks and cannot accurately evaluate the brittleness of China’s deep shale. Finding a universal brittleness characterization method has therefore been challenging.
A large number of production examples have proved that the use of the traditional rock brittleness index to evaluate the fracability of shale reservoirs is not comprehensive and accurate. Guo et al., (2015) and Tang et al. (2012), for the first time, defined shale reservoir fracability as the ability of shale to be effectively fractured to increase production, pointing out that the main factors for shale reservoir fracability are shale brittleness, natural fracture, quartz content, and diagenesis. Mullen and Enderlin. (2012) considered that the fracability evaluation of shale reservoirs is an assessment of the ability of reservoirs to form complex fracture networks. Previous studies have pointed out that the fracability of shale reservoirs cannot be accurately evaluated via rock mechanical parameter calculations, i.e., the characteristics of the sedimentary structure and mineral content should be considered. Guo and Guo. (2013) conducted rock mechanics experiments and conducted shale core tests on the tensile strength, uniaxial compressive strength, shear strength, and fracture toughness, combining them with indoor fracturing simulations to perform shale fracturing evaluations. Yuan et al. (2013) considered that the brittleness index, fracture toughness, and rock mechanical properties are the basis for influencing the fracability of shale reservoirs, establishing a fracability index model based on the brittleness index and fracture toughness. Jiang et al. (2014) suggested that the fracability evaluation should not only consider the situation near the wellbore, but should also fully use fracturing data. Therefore, the fracturing curve was used to characterize the shale reservoir brittleness and comprehensive geological sweetness indicators, followed by the utilization of the fracturing parameters to evaluate the fracability. Zhao et al. (2015) speculated that the shale brittleness, fracture toughness, and natural weak surface cover all of the factors that affect shale fracability, pointing out that fracability reflects the main characteristics of the geological reservoir during hydraulic fracturing. Yuan et al. (2017) proposed a fracability evaluation model considering the brittleness, fracture toughness, and in situ stress using the Brazilian test and logging data. Wu et al. (2018) analyzed the influence that diagenesis and natural fractures have on reservoir fracability, proposing a comprehensive mathematical model for fracability evaluation based on a combination weight method. A multilevel subsystem was developed based on the analytic hierarchy process, and then, a catastrophe evaluation model, avoiding oversubjectiveness in defining the weighting coefficient of factors, was proposed to evaluate deep shale reservoirs’ fracability (Zhai et al., 2019). Liu et al. (2019) fully considered the effects of formation confining pressure and rock anisotropy on parameters, and formed the calculation method of fracability evaluation parameters. Long et al. (2020) combined geological parameters with engineering parameters to propose a method for the fracability evaluation of shale reservoirs based on gray correlation analysis, which can rapidly analyze the main factors that may affect production.
Based on the current research from internal and foreign institutions, fracability is affected by many factors, such as mechanical properties, mineral composition, and deformation characteristics of the rock, especially for deep shale under high confining pressures. These influencing factors and laws are more complicated at increasing depths within the reservoir. The conventional method of evaluating the shale fracability only based on the brittle mineral composition or rock mechanical parameters to calculate the brittleness index is no longer applicable to deep shale. Therefore, we must explore a new method suitable for deep shale fracability evaluations.
Laboratory experiments
Taking shale from the Longmaxi Formation in the southern Sichuan Basin as a case study, with a depth of 3500–4500 m, 20 shale samples were collected for experimental testing. The X-ray diffraction method was used to determine the mineral composition of the shale samples. The rock mechanical parameters, stress–strain characteristics, and rock fracture morphology were obtained through triaxial mechanical experiments.
Shale mineral experiments
Twenty shale samples were ground into powder with a diameter of <200 mesh, and the mineral composition of the rock samples was tested using an X-ray diffractometer (X'Pert PRO MPD). The mineral analysis results (Figure 1) show that the shale in this area is mainly composed of clay, quartz, feldspar, and carbonate minerals, with average contents of 37.2%, 33.6%, 4.4%, and 23.0%, respectively. There are significant differences in the mineral composition of the shale samples and strong heterogeneity.
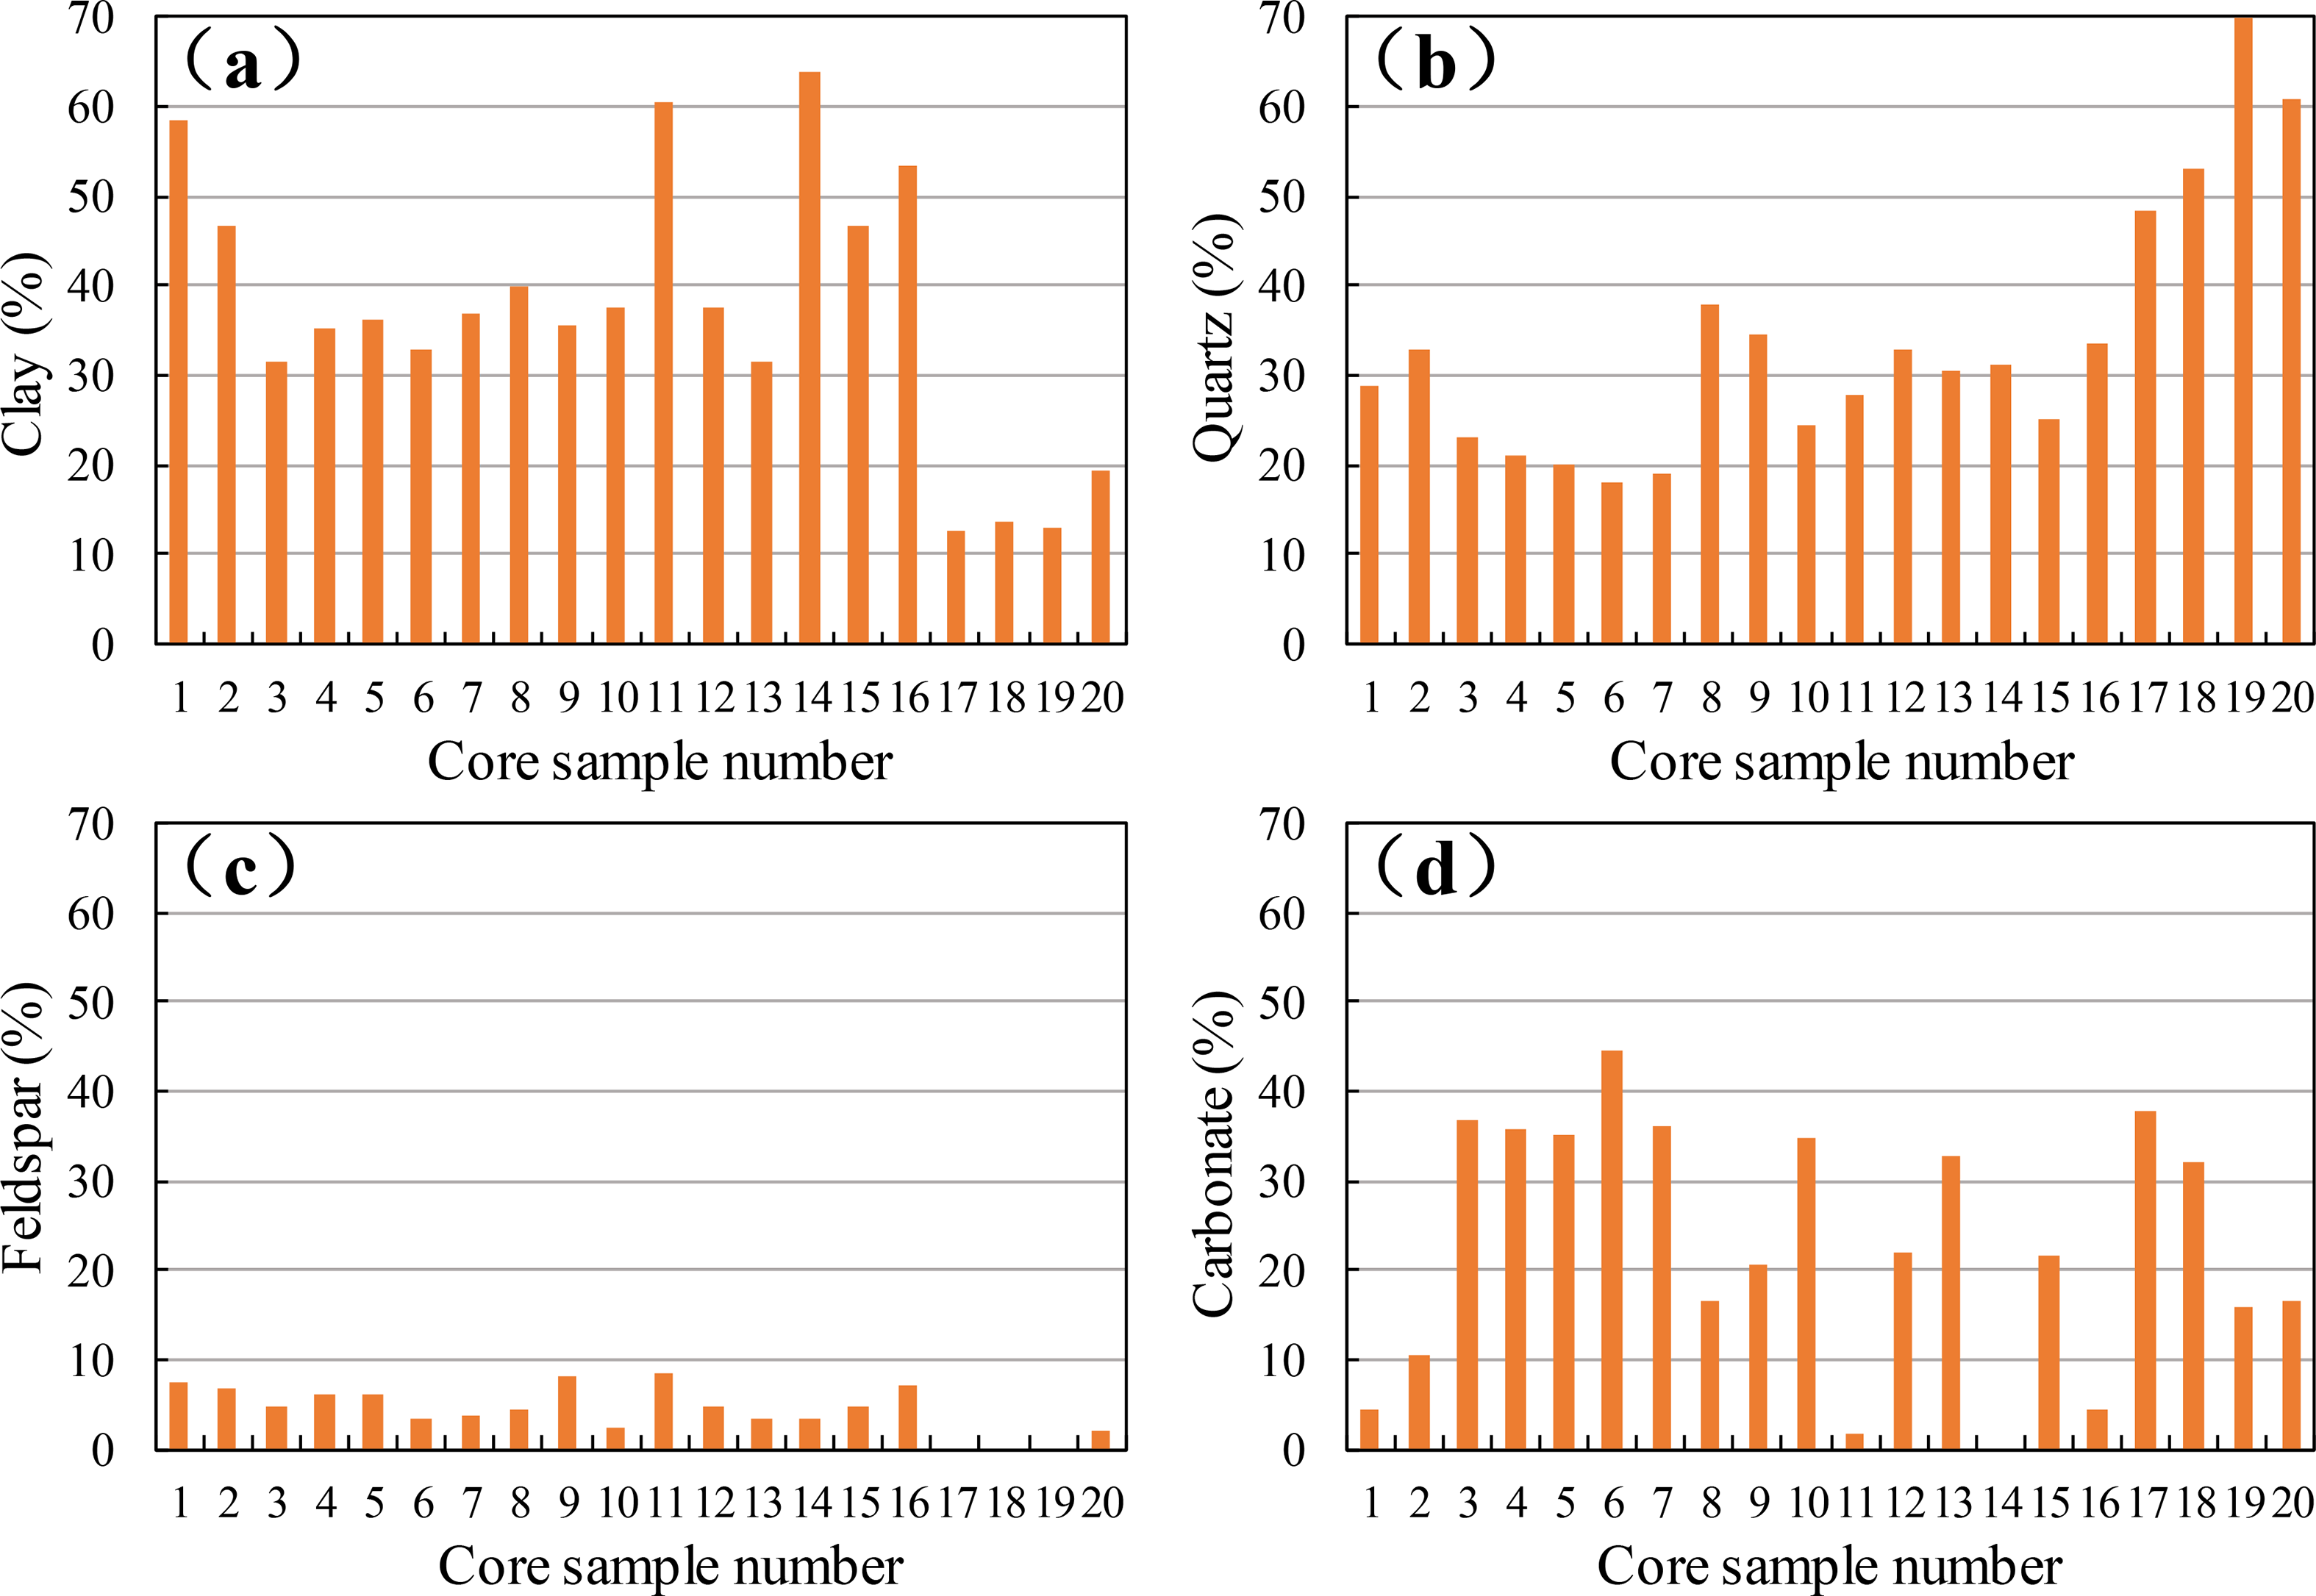
The main mineral content (%) of shale from the Longmaxi Formation as a function of the core sample number: (a) clay, (b) quartz, (c) feldspar, and (d) carbonate mineral contents.
Triaxial mechanical experiments
The 20 shale samples were cut into standard cores (1 inch diameter, 2 inch length) using RTR-1000 type equipment for rock mechanics experiments at reservoir temperature and pressure conditions (confining pressure of 40 MPa, temperature of 70 °C) (Lu et al., 2019b). As shown in Figure 2, the experimental results show that the Young's modulus of shale from the Longmaxi Formation is between 4438.5 and 27,285.1 MPa, with an average value of 16,153.3 MPa, and a Poisson's ratio of 0.124 to 0.446, with an average value of 0.27. The rock mechanics characteristics show strong heterogeneity.
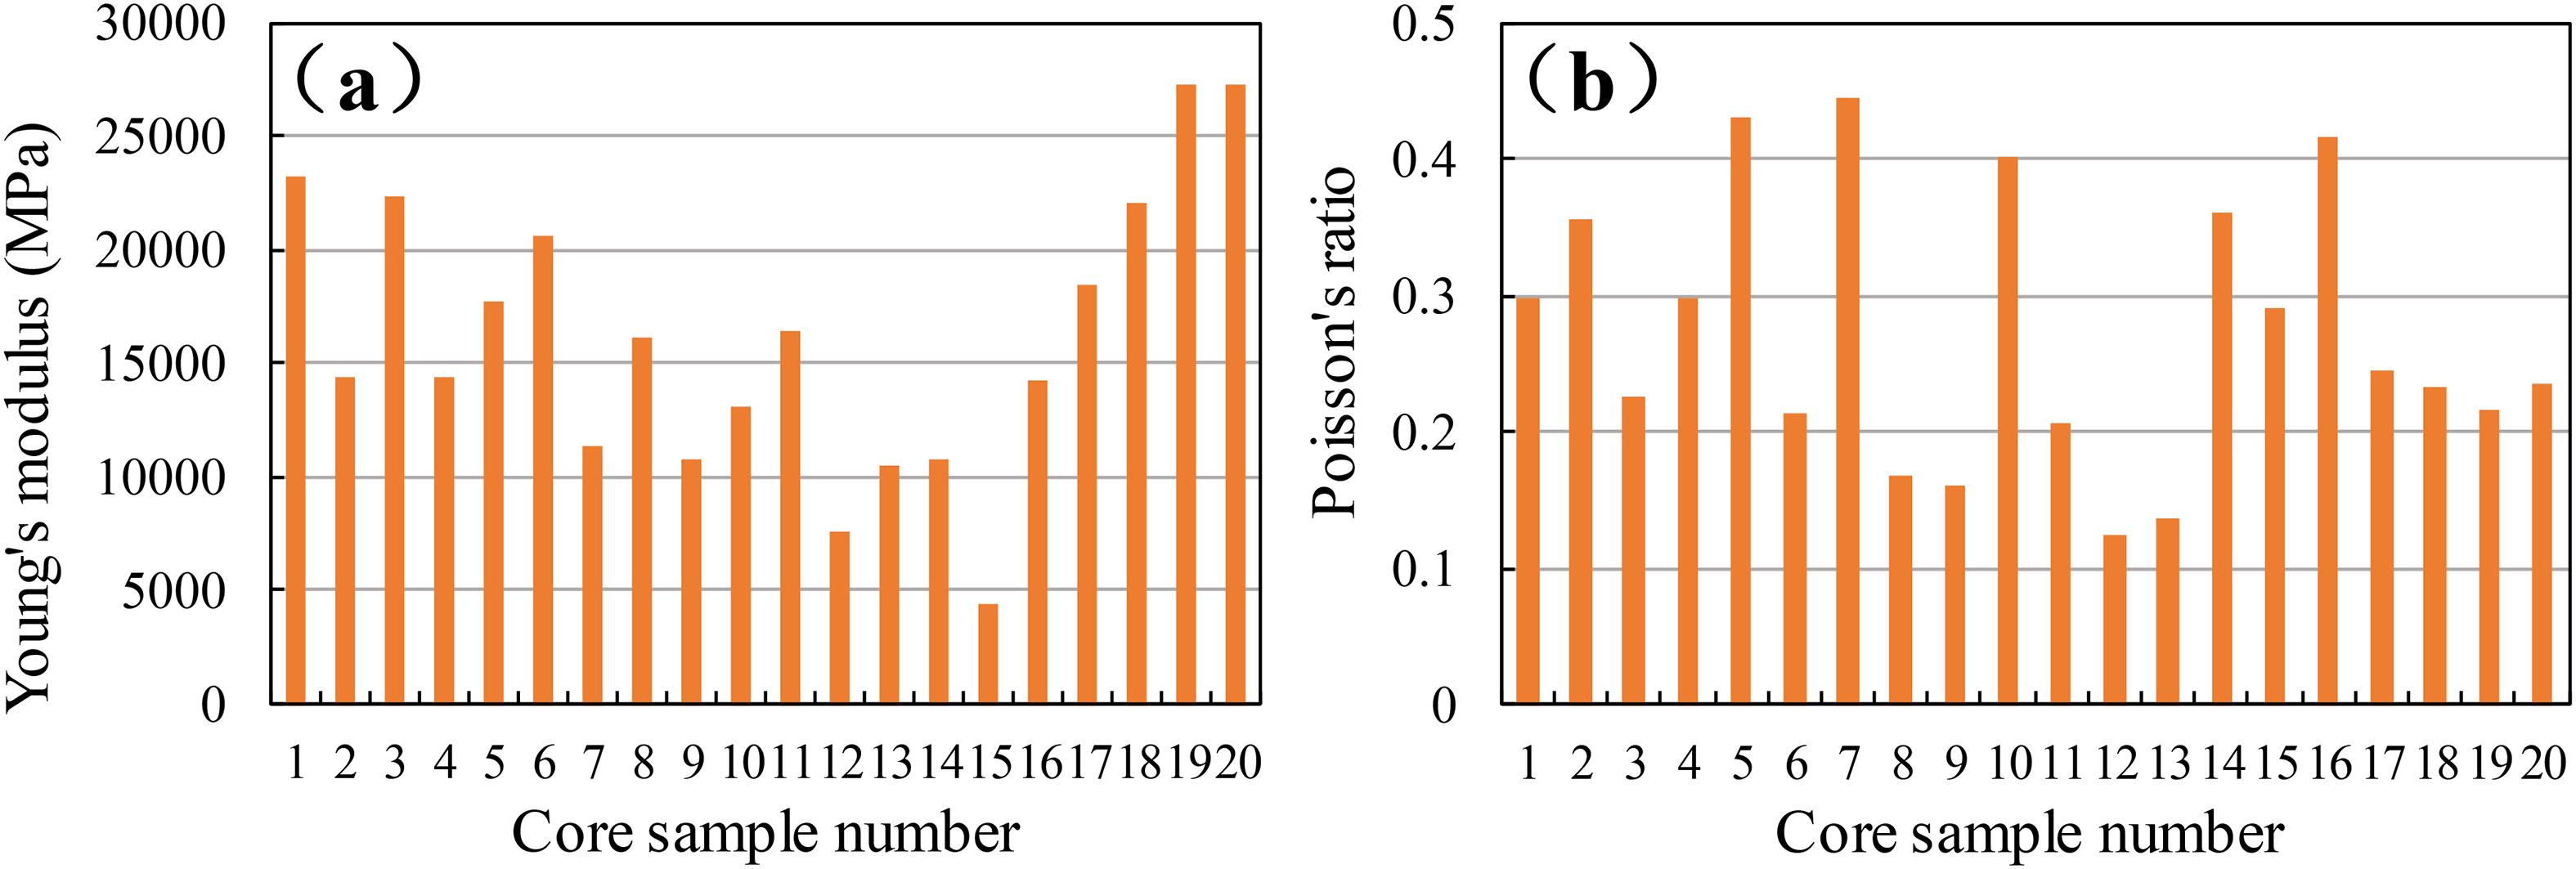
The shale mechanical parameters of the Longmaxi Formation: (a) Young's modulus (MPa) and (b) Poisson’s ratio.
Based on the results of the triaxial mechanics experiments, we obtained the stress–strain curves of the shale samples at different stress stages, as shown in Figure 3. Based on these curves, we can extract the peak stress, peak strain, residual stress, residual strain, and dilatancy angle. Stress and strain are the basis for judging whether brittle fracture occurs in the rock while the dilatancy angle is used to characterize the rate of volume increase due to rock deformation and fracture. The dilatancy angle (

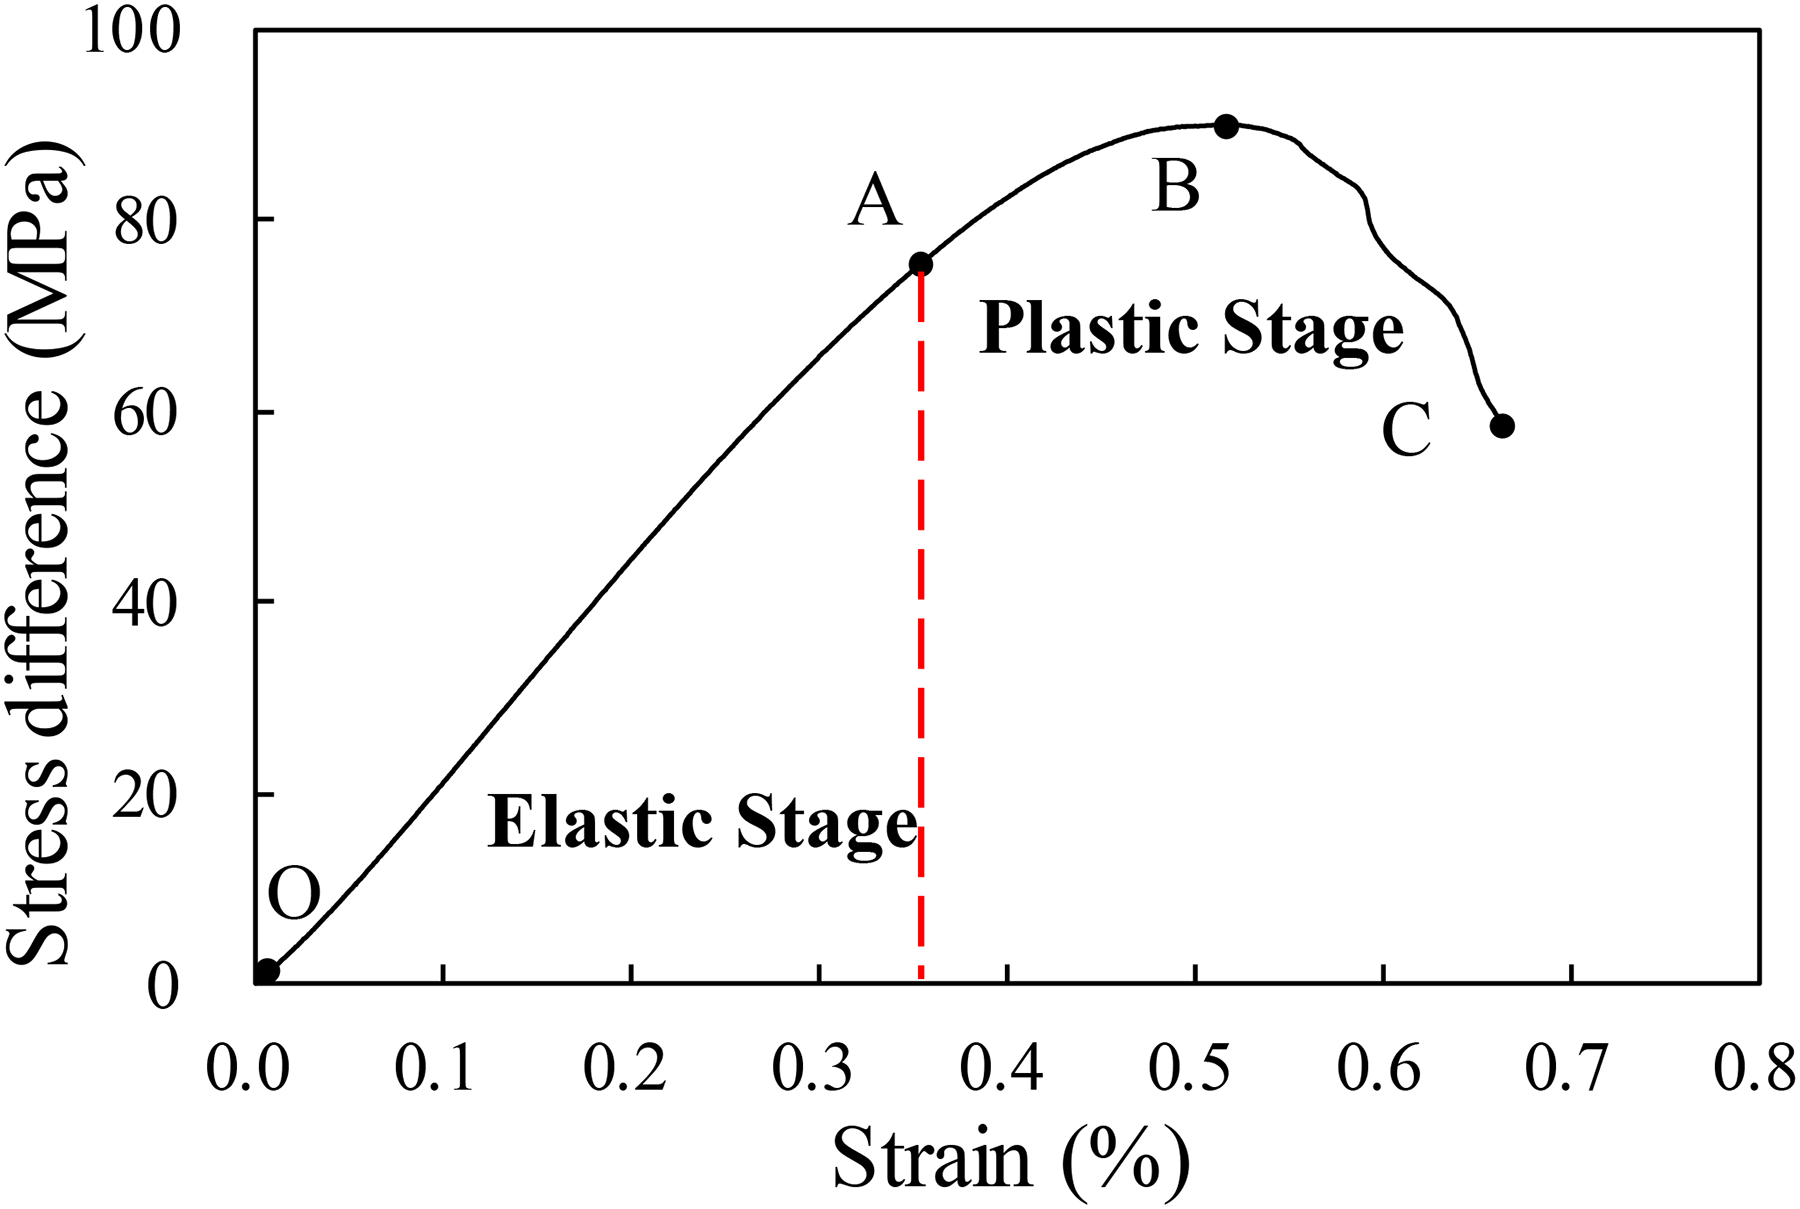
Stress–strain curves of the shale from the Longmaxi Formation. Point A is the turning point of shale from the elastic stage to the plastic stage, and point B is the peak stress point. The OA section and AC section are respectively the elastic stage and the plastic stage, respectively.
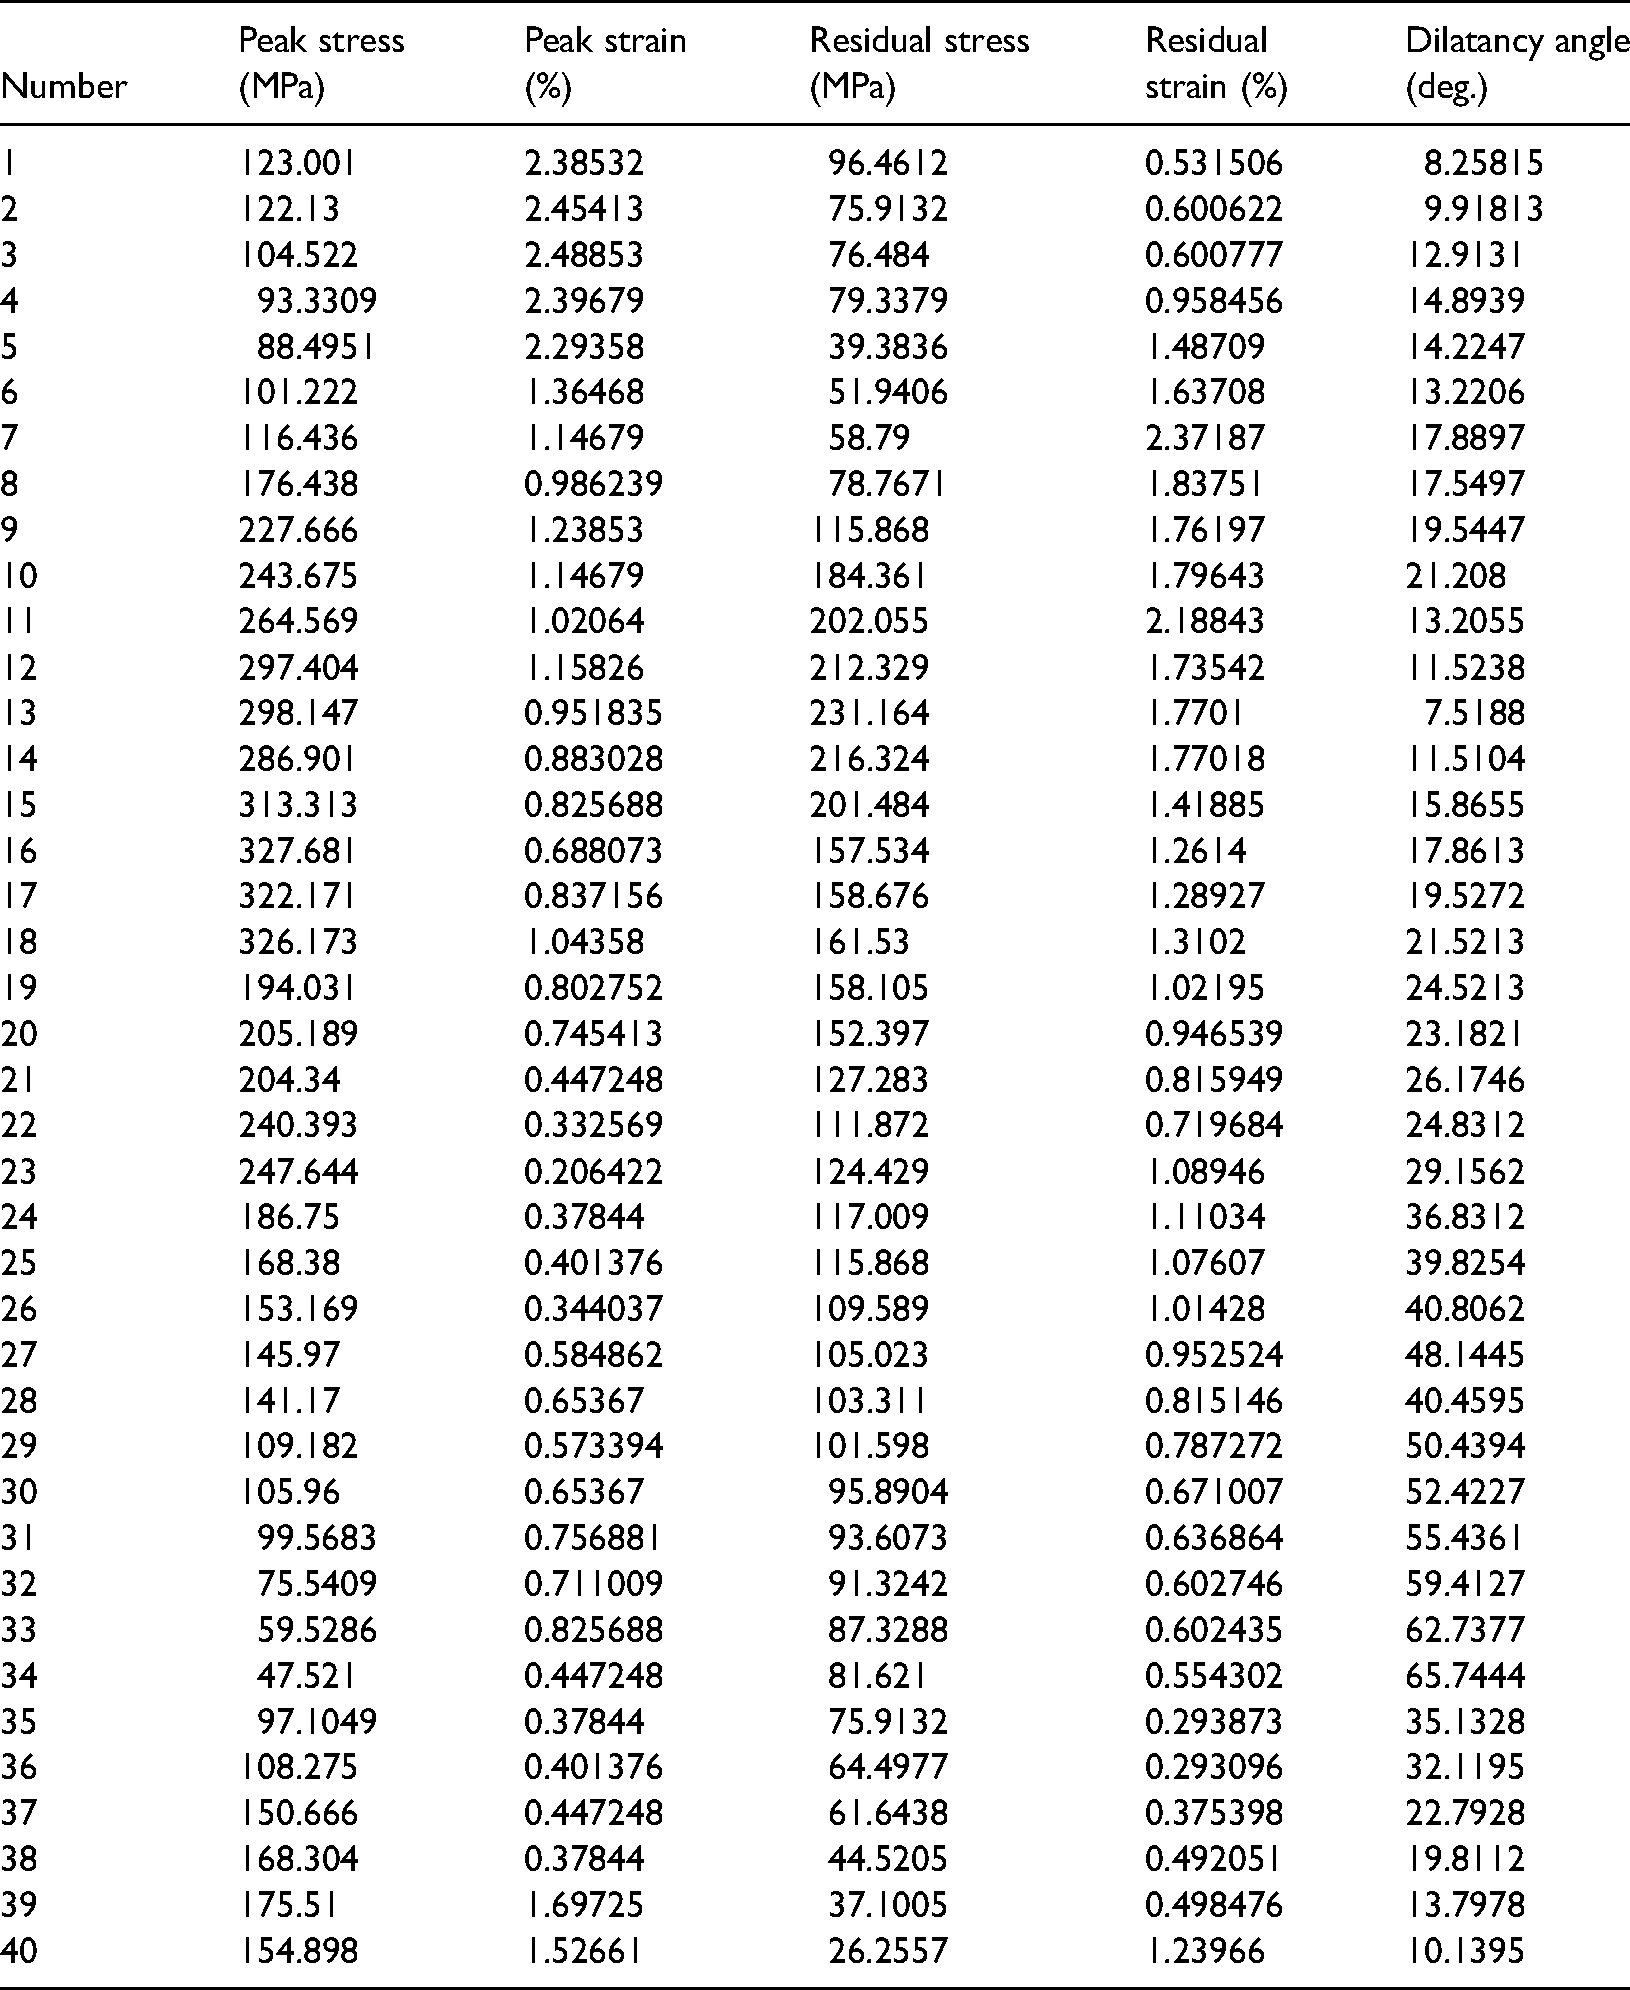
Stress–strain parameter and dilatancy angle.
Analysis of rock fracture morphology
Rock fracture morphology is an important indicator of reservoir fracability. The more complicated the shale fracture morphology, the more complicated the fracture network formed by fracturing transformation, indicating that the reservoir has better fracability. After the triaxial mechanics experiment, the fracture morphology of the shale samples was analyzed. Appendix A supplemental data shows the fracture patterns of these 20 shale samples. The shale fractures generally include three types, i.e., shear fracture, tensile fracture, and composite fracture, as shown in Figure 4.
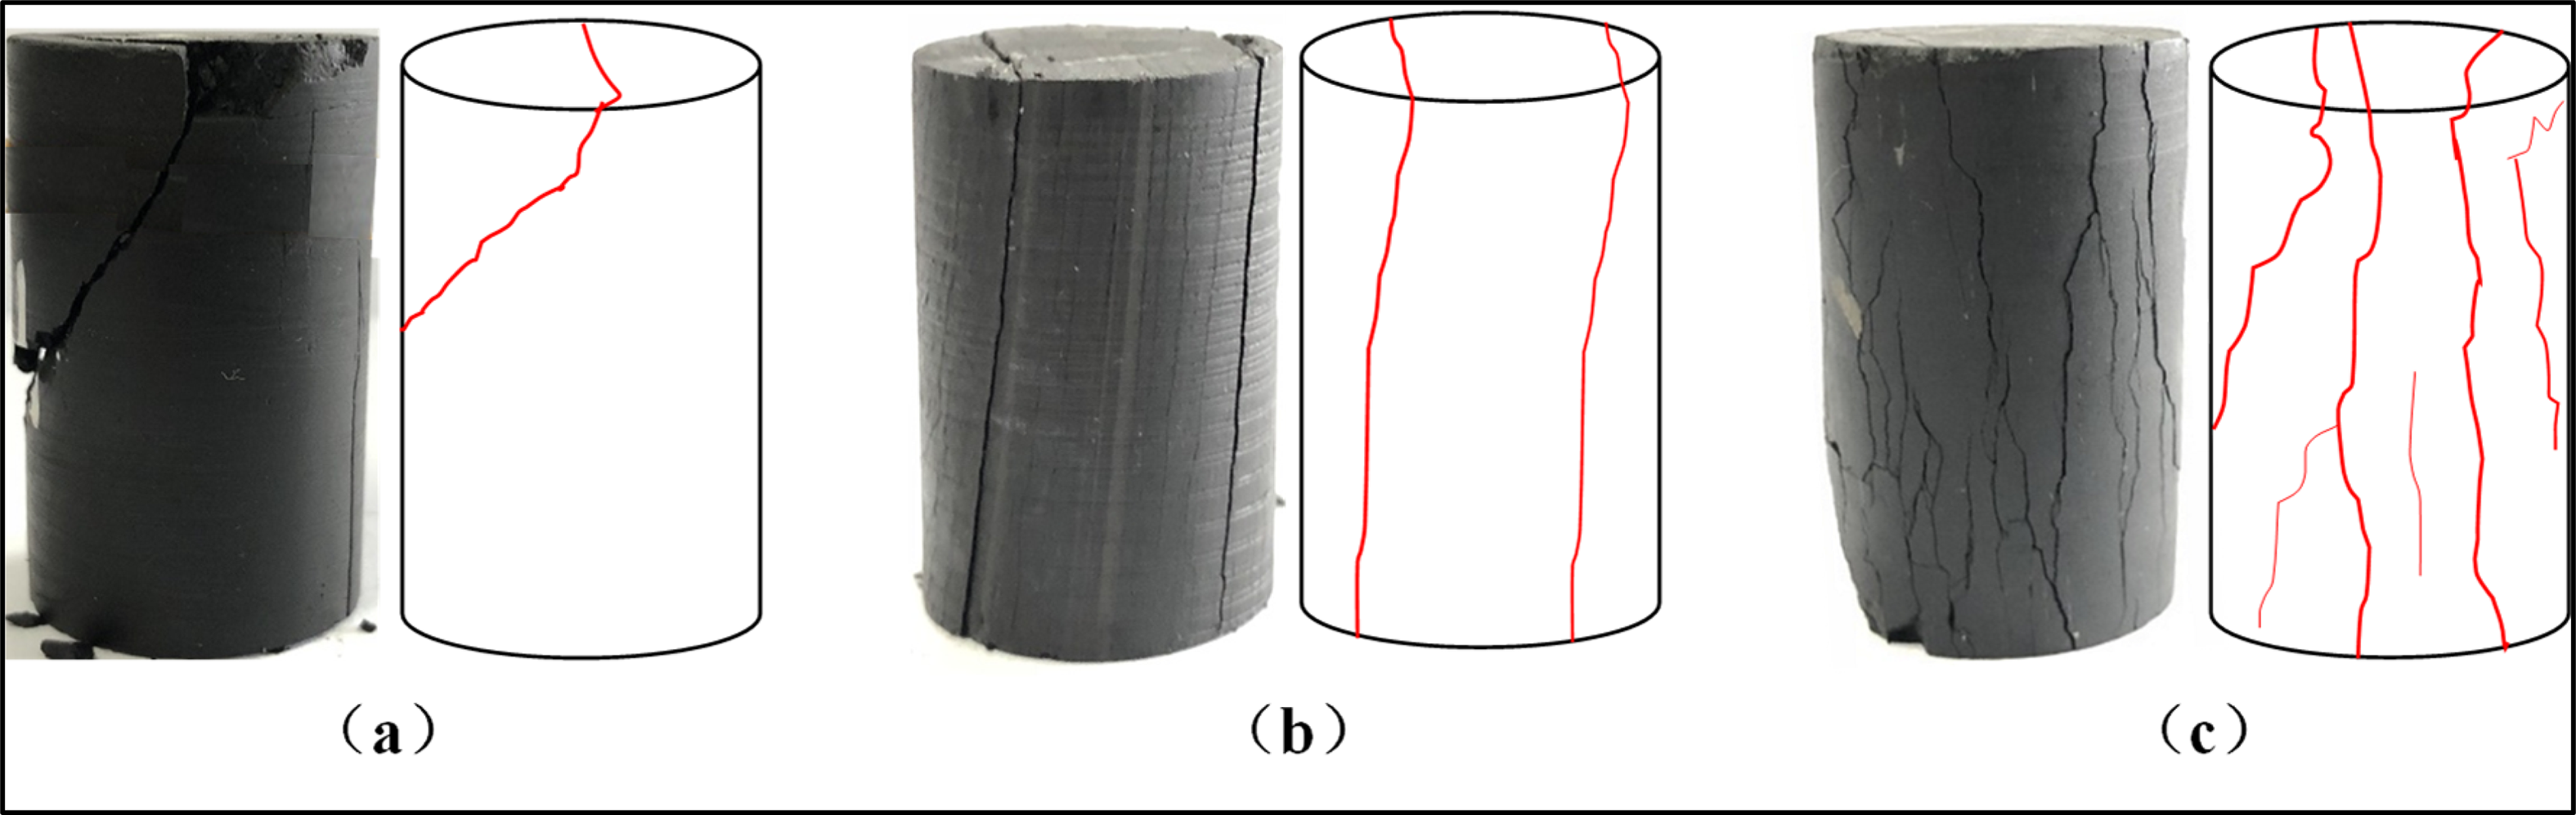
Three basic fracture morphologies of shale, where the red lines represent fractures: (a) shear fracture, (b) tensile fracture, and (c) composite fracture.
Study on rock fracture morphology
Based on the above experimental results, from the two aspects of rock mechanical parameters and mineral composition, the conventional rock brittleness evaluation method was used to analyze the core fracture morphology. The Rickman (Rickman et al., 2008) and Jarvie (Jarvie et al., 2007) brittleness indices of shale were calculated as follows:

As shown in Figure 5, based on the analysis of the influencing factors, the rock mineral composition and mechanical parameters did not have a good correlation with the three fracture forms of the rock. The conventional fracture morphology classification method can only qualitatively describe the rock failure mode, but cannot quantitatively characterize the complexity of the rock fractures. Therefore, it is necessary to recharacterize the shale fracture morphology and analyze the factors affecting rock fracture morphology.
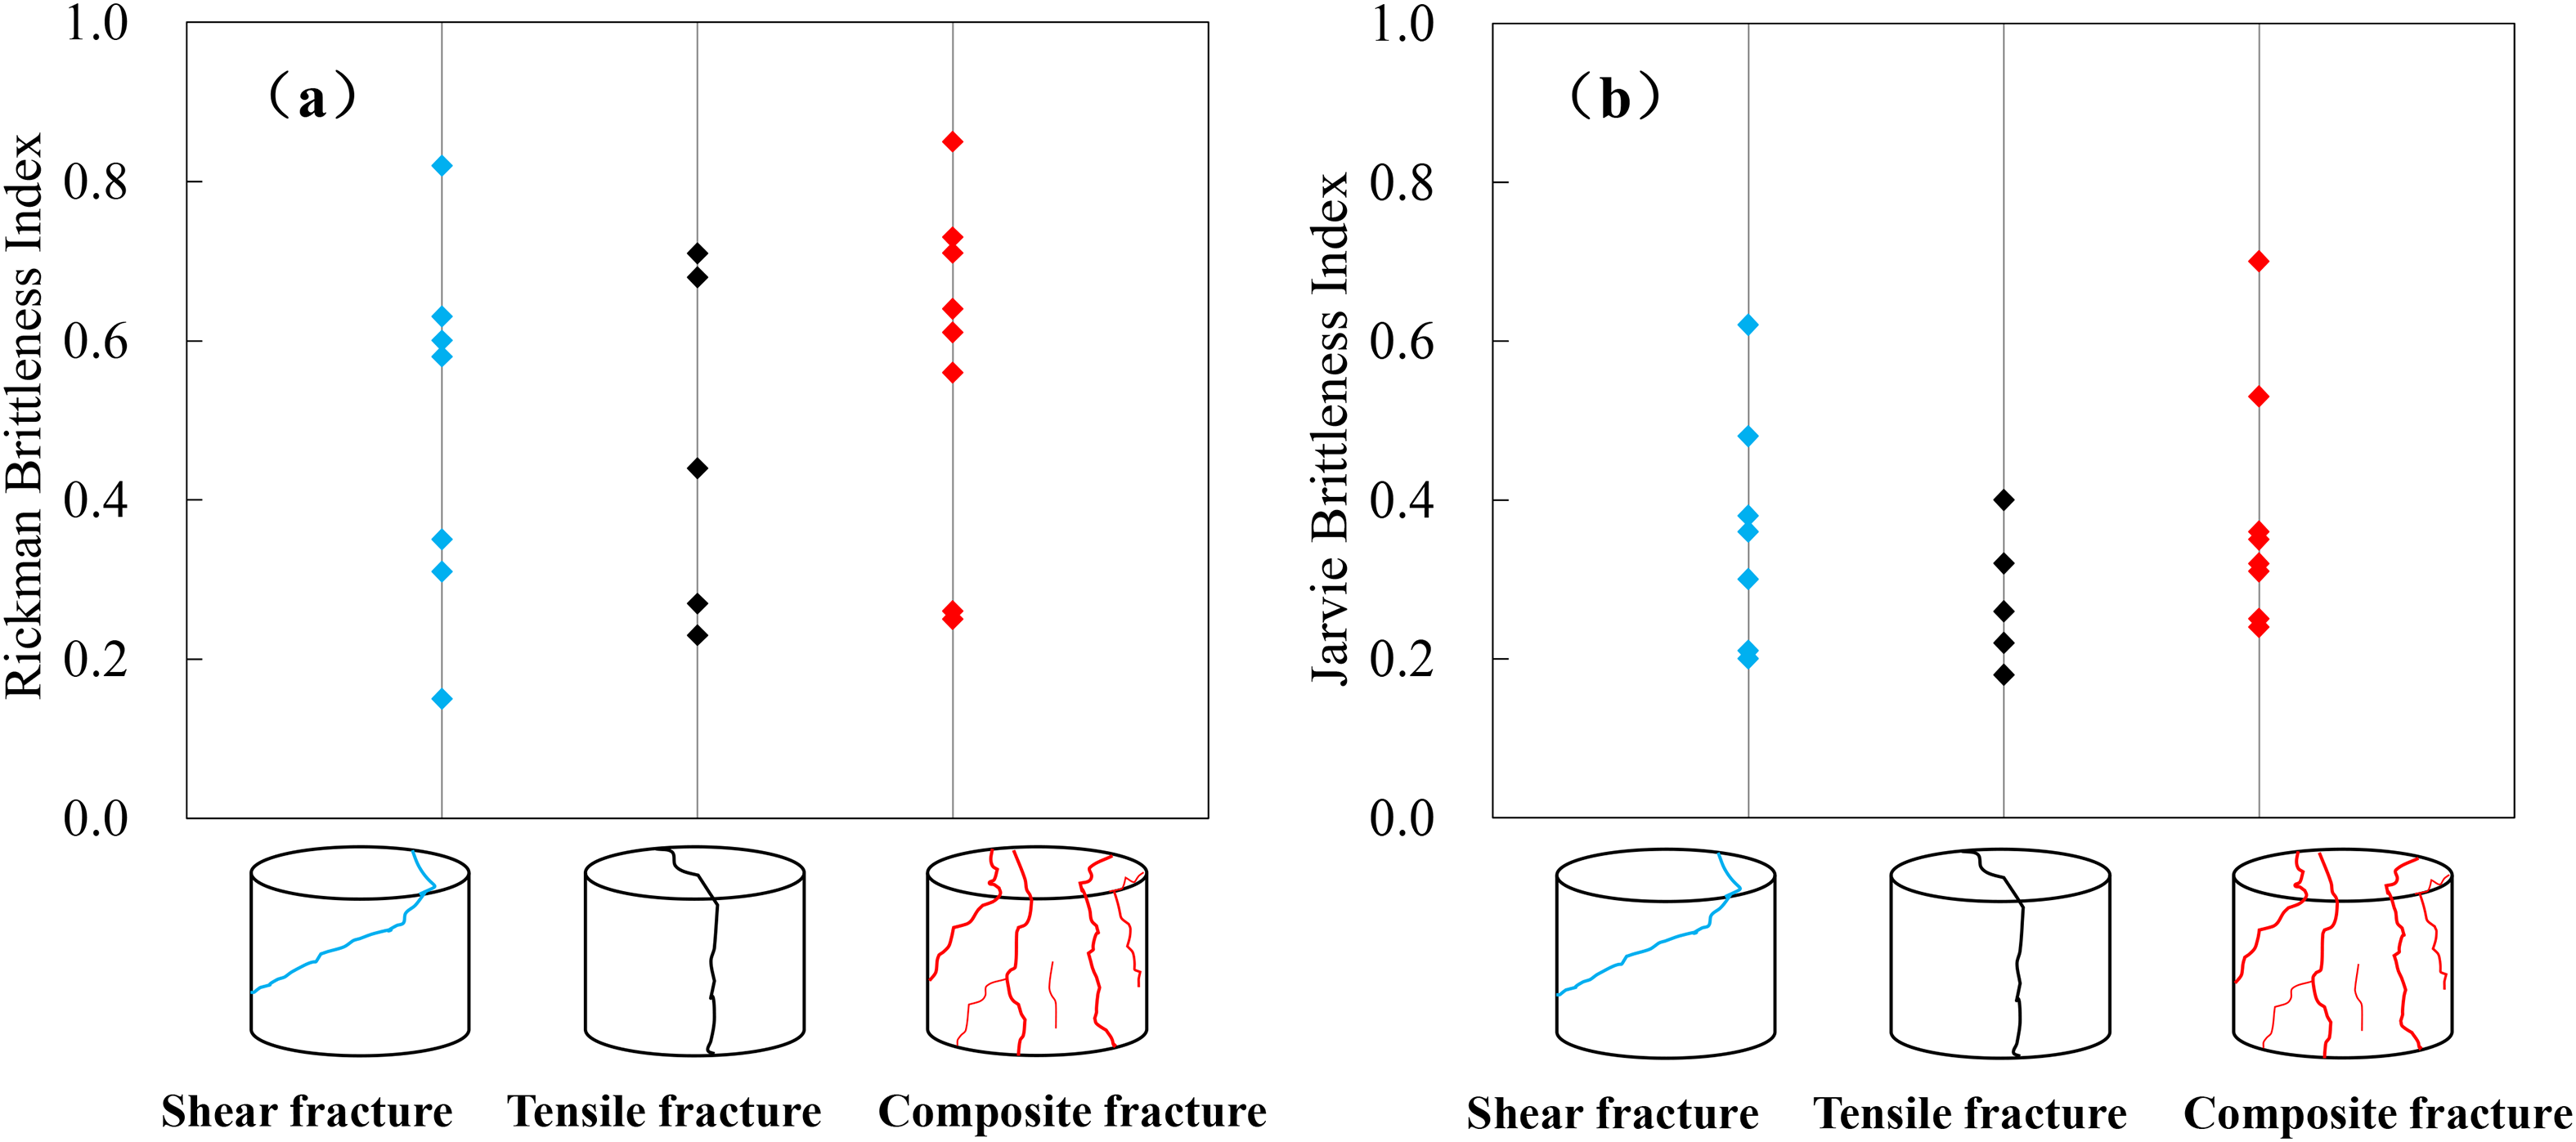
Relationship between the shale fracture morphology and brittleness index. The blue, black, and red lines represent shear fracture, tensile fracture, and composite fracture, respectively; the blue, black, and red diamonds represent the brittleness index under shear fracture, tensile fracture, and composite fracture, respectively. (a) and (b) respectively represent the Rickman brittleness index and Jarvie brittleness index under different shale failure modes.
Expression of rock fracture morphology
Previous studies have shown that the rock fracture process has self-similarity, and the rock fracture mode has notable fractal characteristics (He, 2016). Therefore, fractal theory was used to characterize the rock fracture morphology in this study.
As shown in Figure 6, the fractal dimension of the fractures on the end face of the shale core was calculated by the box number method. The red curve represents the fracture. According to the definition of the fractal dimension, the distribution of the fractures on the end face of the shale cores can be expressed as follows (He, 2016):
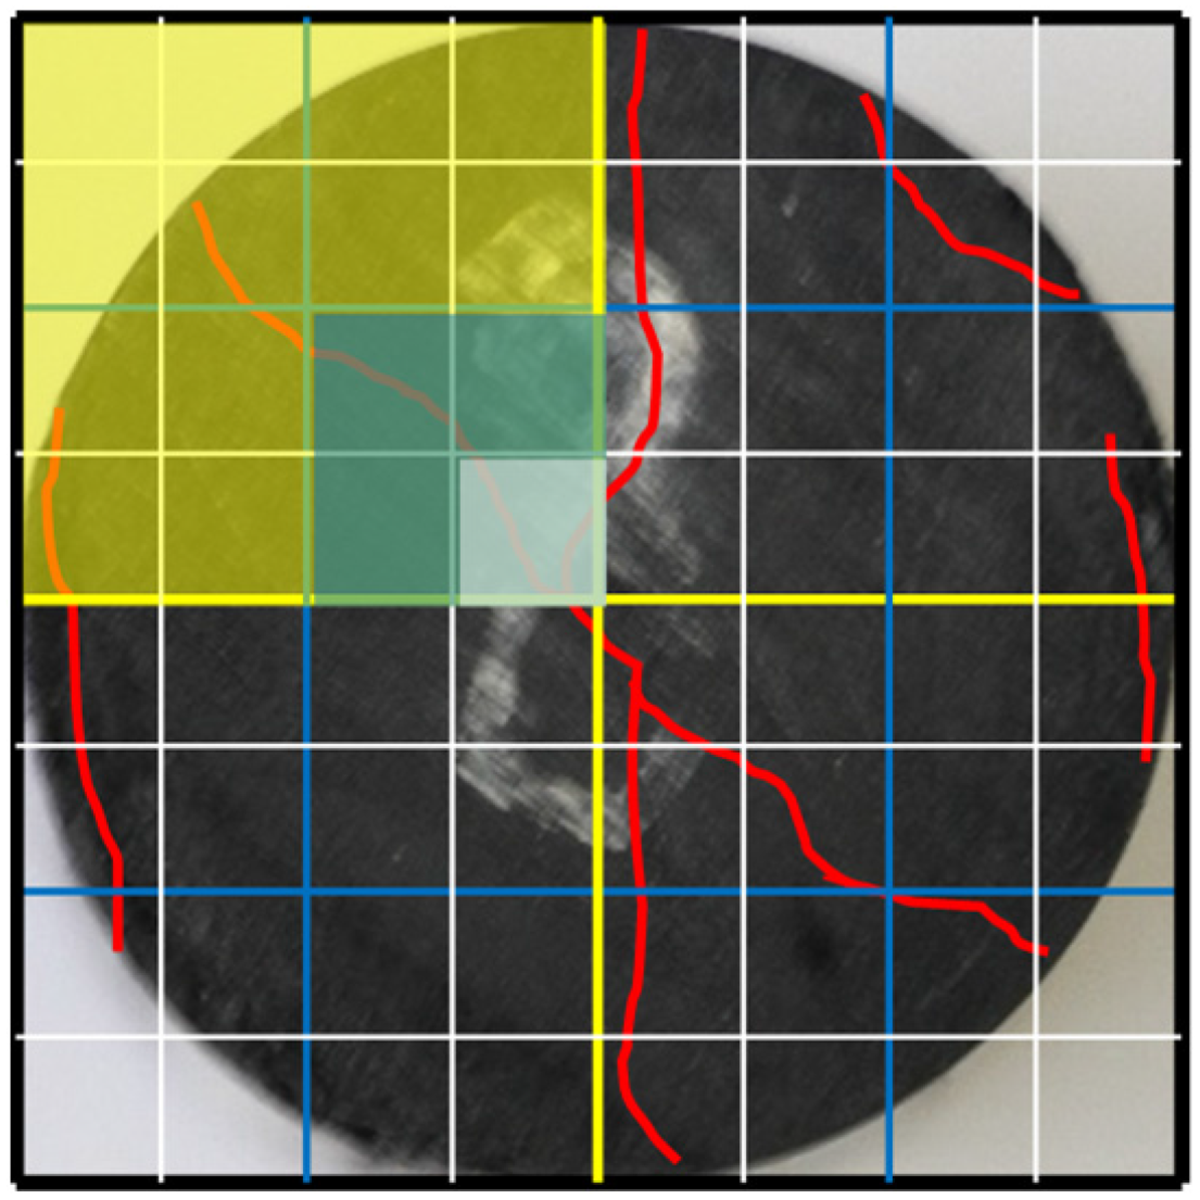
Box number method to calculate the fractal dimension. The black, yellow, blue, and white boxes have side lengths from large to small, representing the results of the first, second, third, and fourth divisions respectively. The red lines represent fractures.
The method to determine the fractal dimension of the rock fracture morphology is as follows:
Place the fractured end face of the shale sample in a square, and divide the square into multiple boxes with sides of length R. By changing the value of R, the number of boxes containing fractures under different side lengths can be obtained. Calculate the fractal dimension, D, using equation (4).
As shown in Figure 7, the rock-side face will show different fractured characteristics with the same fractured end face. Taking the central axis of the shale sample as the reference line, the angle between the main fracture surface and the central axis is defined as the fracture angle, α, of the shale sample. When the included angle was 0°, the shale samples exhibited tensile fracture characteristics. The larger the fracture angle, the more the rock fracture tends to shear fracture.
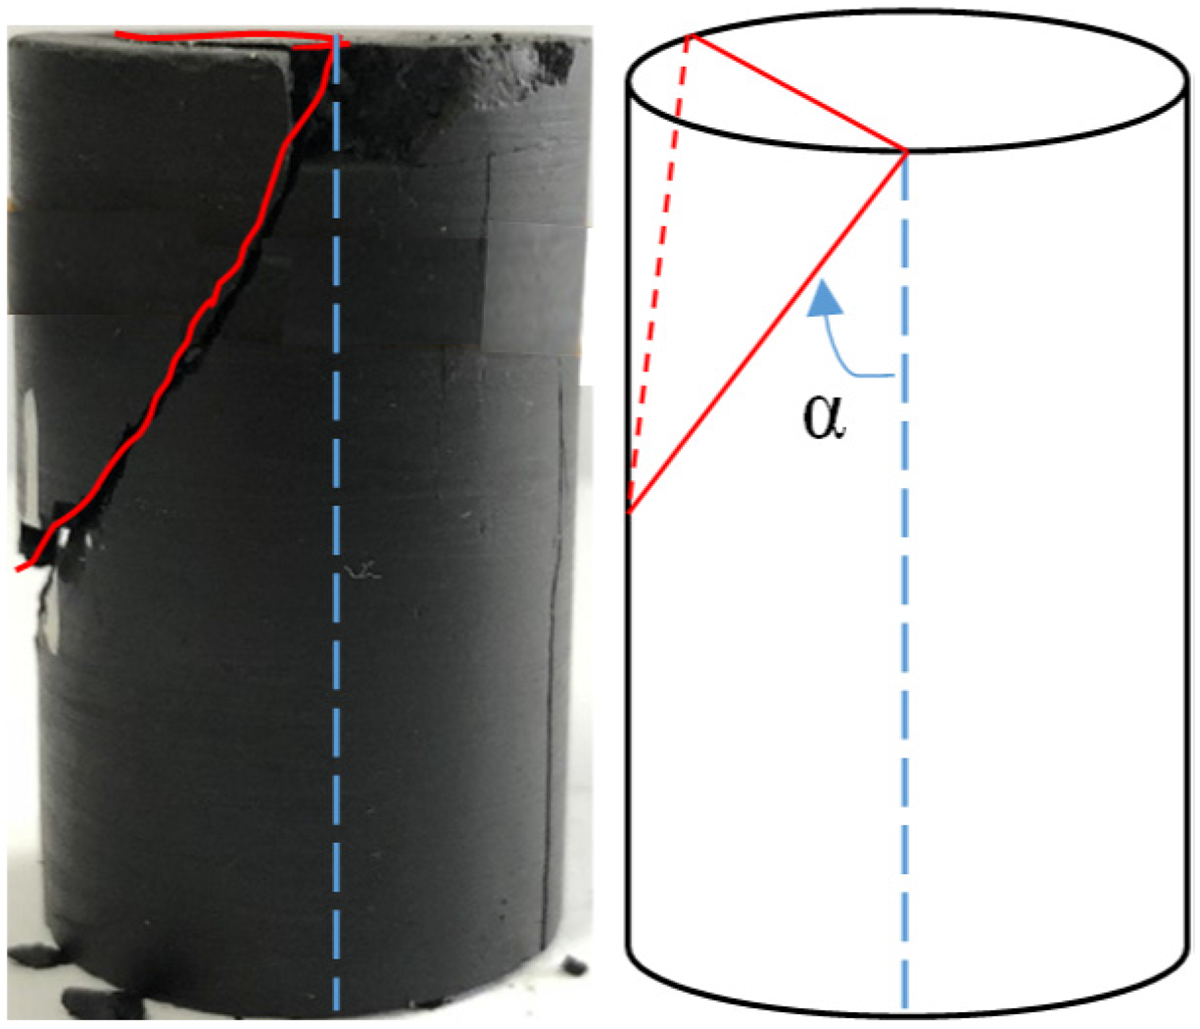
Shale fracture morphology at different fracture angles. The red lines represent fractures. α is the fracture angle.
Based on the fractal dimension of the fractures on the end face of the shale sample and the fracture angle on the side surface of the shale sample, the coefficient 
The rock fracture complexity coefficients of the 20 shale samples were calculated, whose results are shown in Figure 8. As the degree of fracture increases, the fracture complexity coefficient increases. The three fracture modes of the fracture complexity coefficient from large to small are as follows: composite fracture > tensile fracture > shear fracture, which is in accordance with objective facts (He, 2016). According to conventional volume fracturing theory, the more complex the fracture network, the better the hydraulic fracturing effect and the higher the gas well production. Through further analysis, we found that the shale fracture complexity coefficient in the composite fracture mode was >1.2, the fracture complexity coefficient in the tensile fracture mode was between 1 and 1.2, and the fracture complexity coefficient in the shear fracture mode was <1.
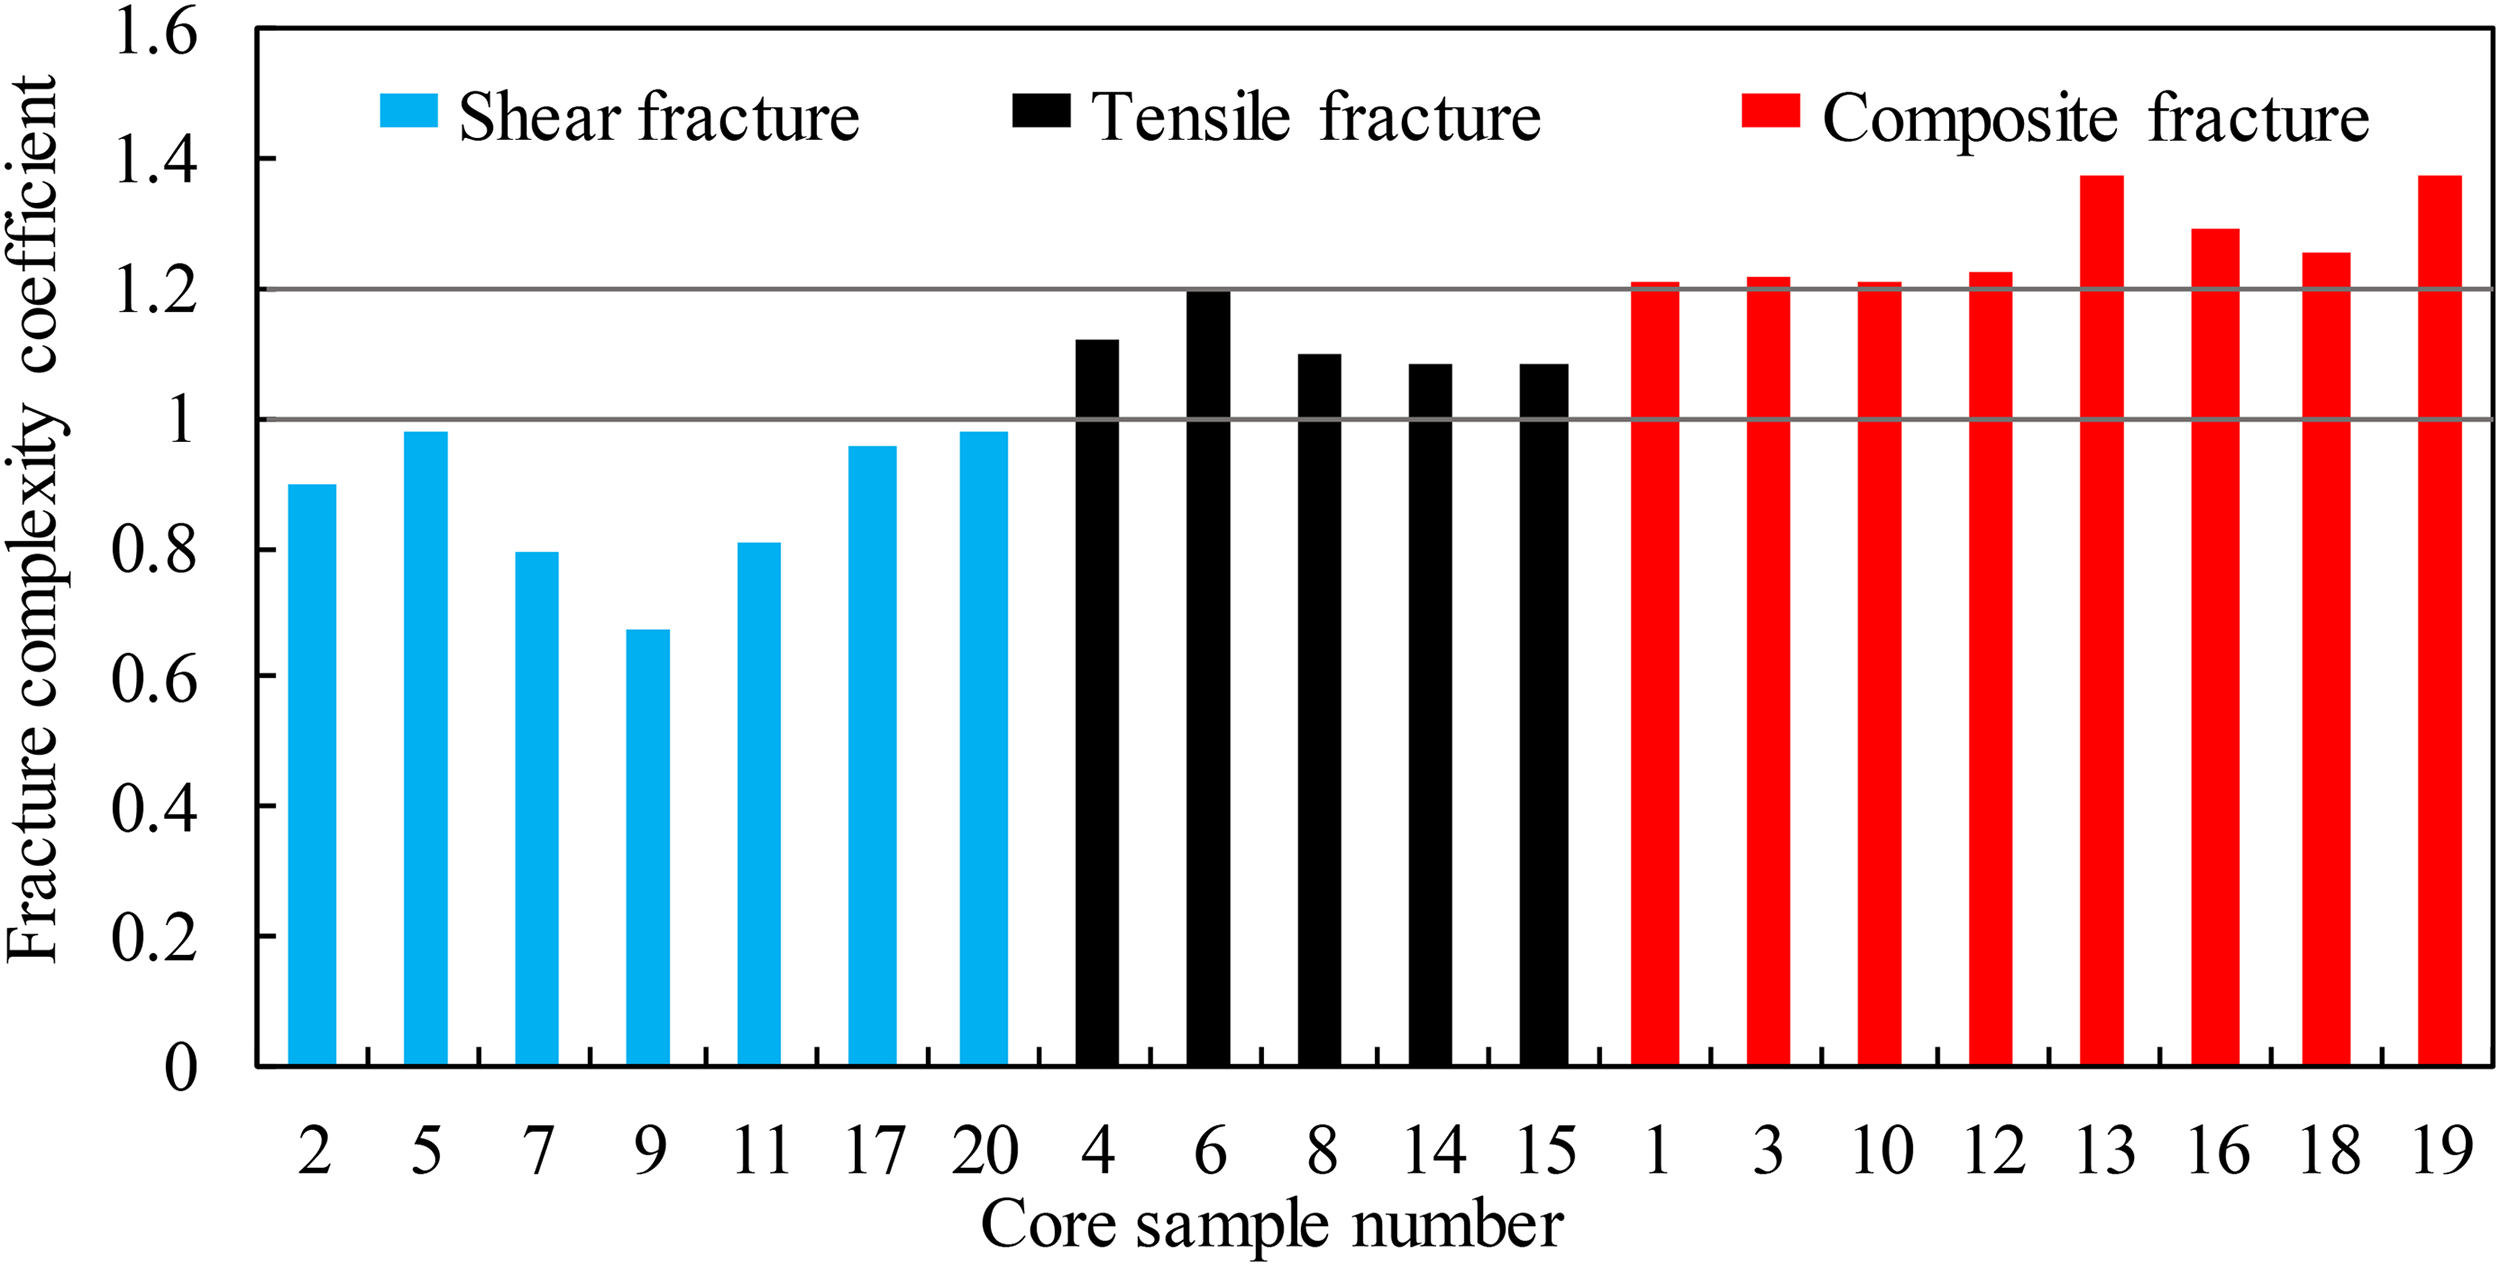
Fracture complexity coefficient of the shale samples from the Longmaxi Formation. The blue, black, and red rectangles represent shear fracture, tension fracture, and coincidence fracture, respectively.
Influence of rock fracture morphology
Based on the 20 sets of experimental data and 20 sets of pre-tested data of the Longmaxi Formation shale (a total of 40 sets), through correlation analysis, the rock fracture morphology was examined from three aspects, i.e., the rock mineral composition, mechanical parameters, and stress–strain characteristics, to determine the main factors affecting shale brittleness.
Mineral composition. Based on the experimental results for the shale mineral composition, we analyzed the relationship between the fracture complexity coefficient and the content of various types of minerals. As shown in Figure 9, the correlation between the content of the four mineral components and the fracture complexity coefficient is poor. As the rock forms by the cementation of minerals, it has a certain mechanical structure. Rock fracturing is accompanied by changes in mechanics. Analyzing the content of various minerals, as well as a lack of an evaluation of the bonding strength between minerals, is not sufficient to reflect the mechanical characteristics of shale fractures.
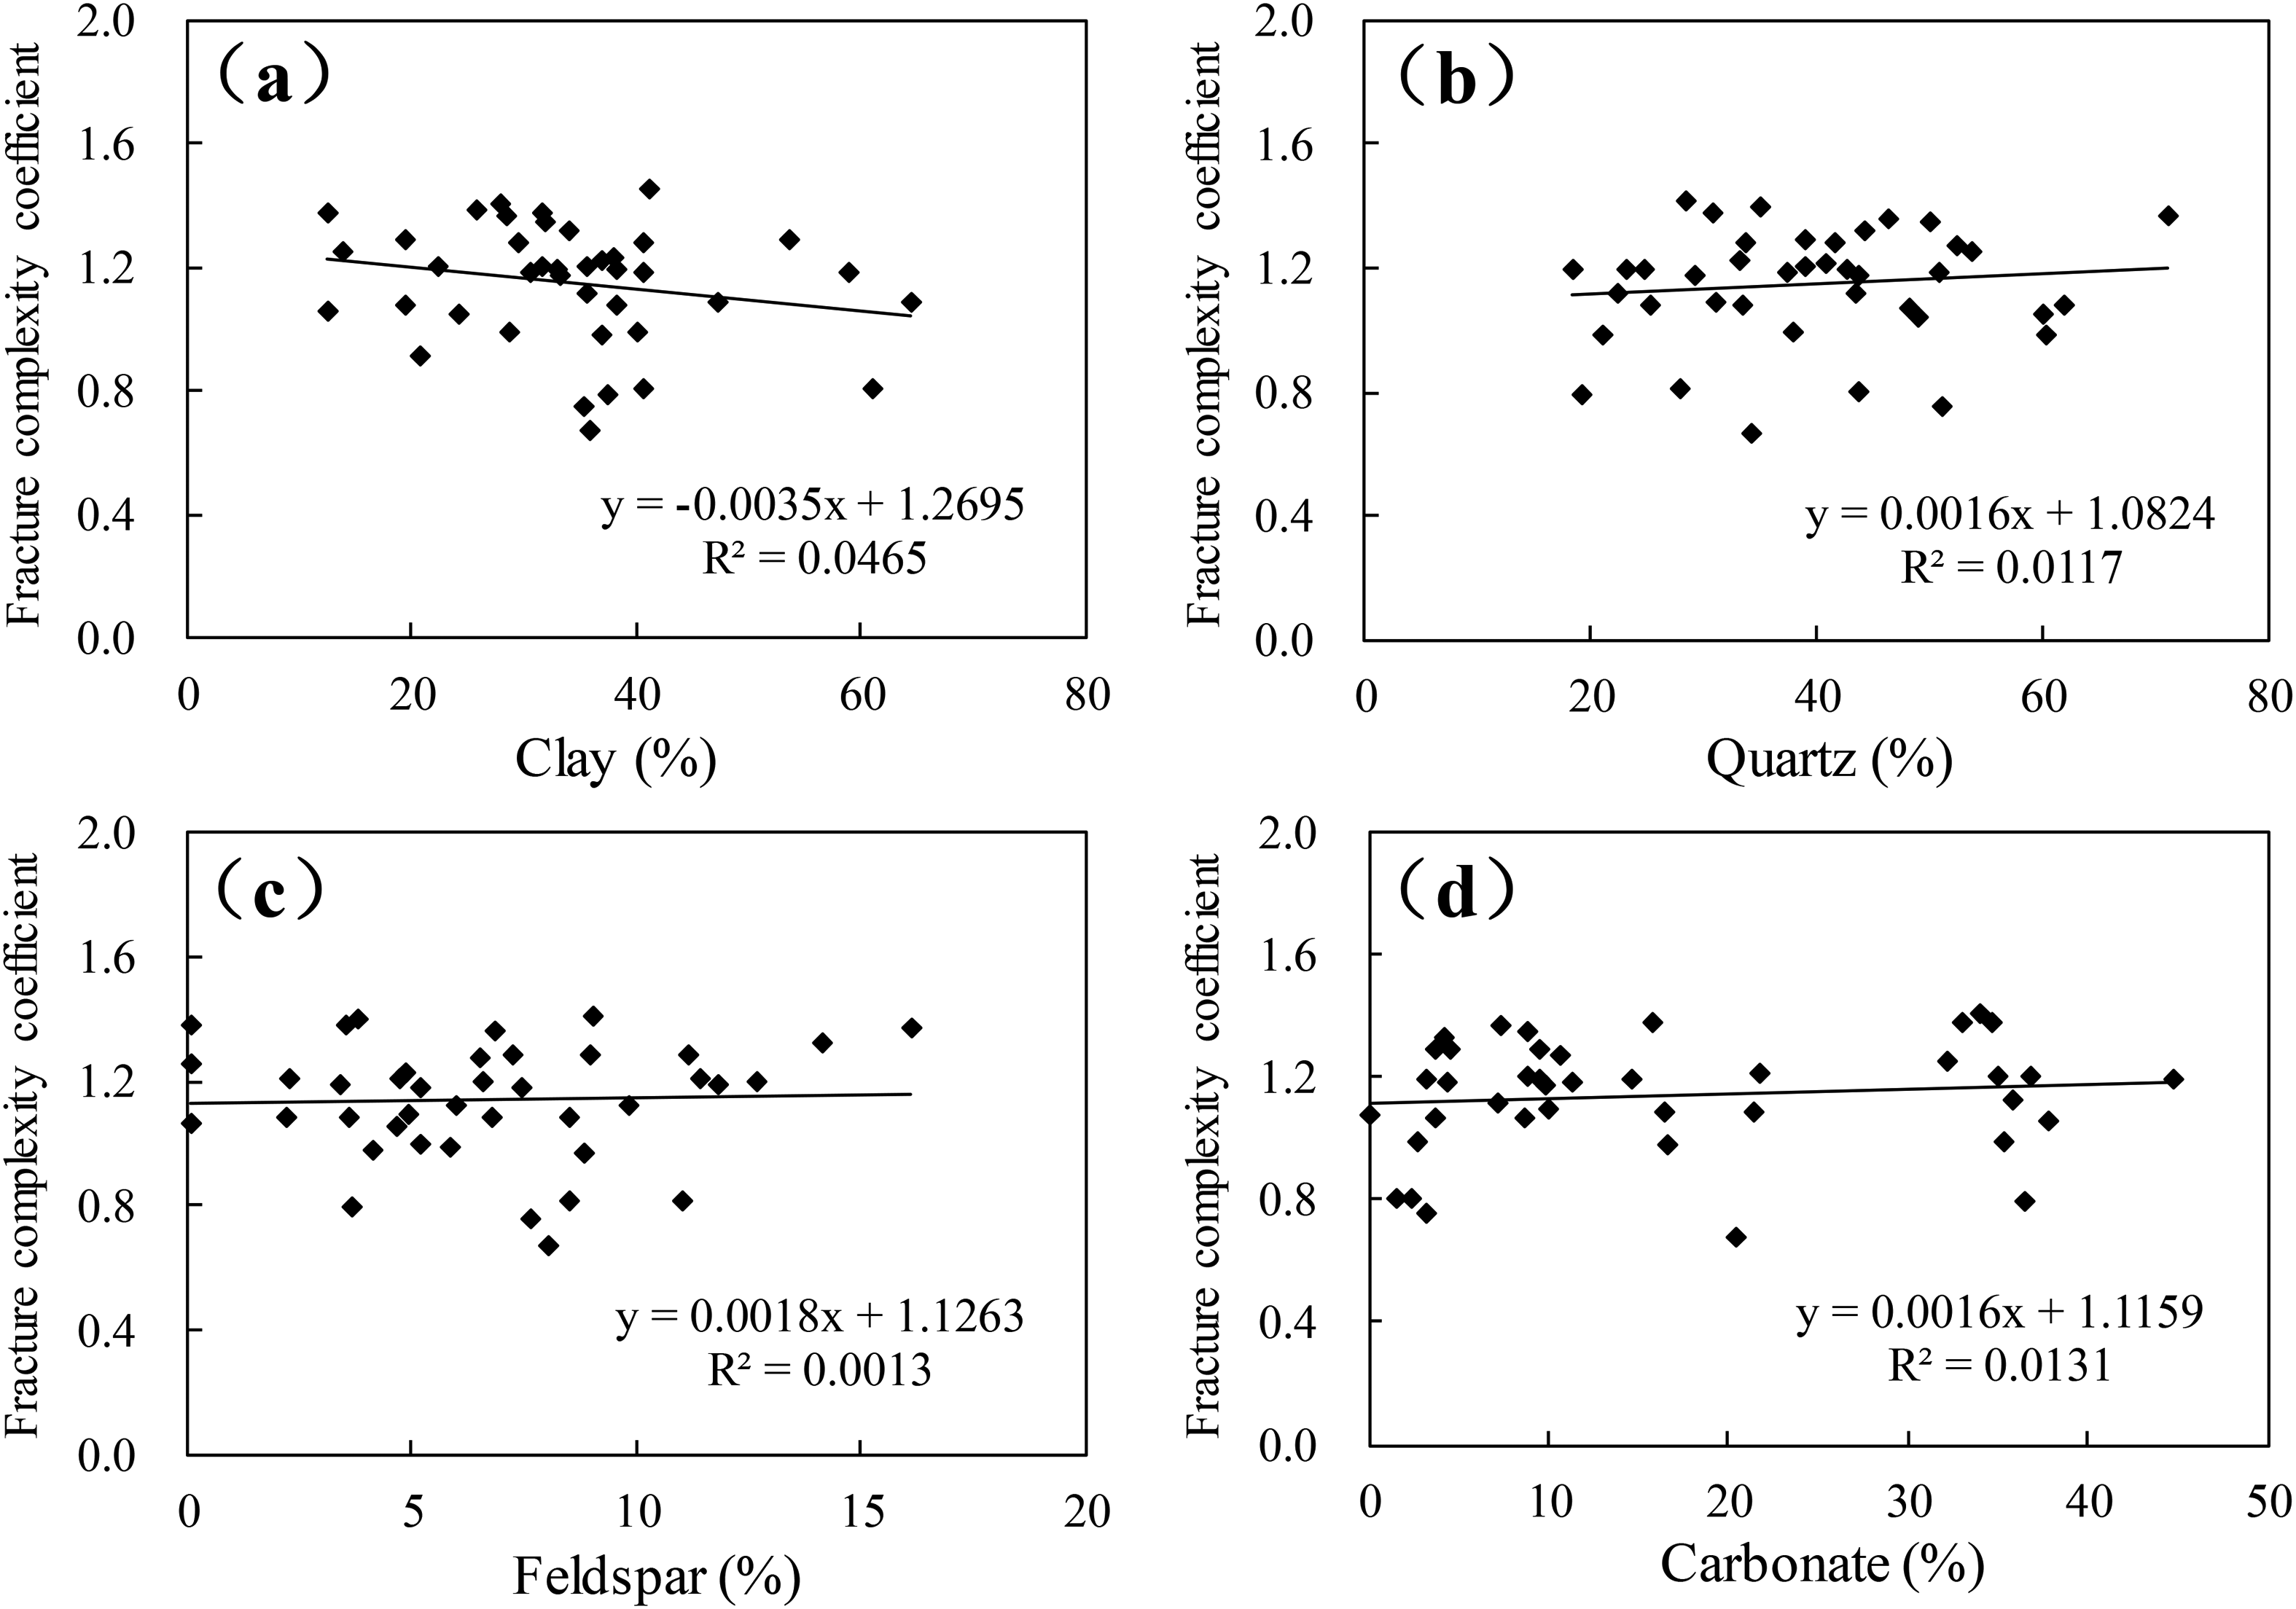
Relationships between the fracture complexity coefficient and mineral composition (%): (a) clay, (b) quartz, (c) feldspar, and (d) carbonate.
Mechanical parameters. Many studies have used Young's modulus and Poisson's ratio as evaluation indices of rock brittleness (Wu, 2015). This study analyzed the relationship between the fracture complexity coefficient of the shale sample and its Young's modulus and Poisson's ratio. As shown in Figure 10, for the overall trend, the Young's modulus has a positive correlation with the fracture complexity coefficient. There is a strong correlation between the fracture complexity coefficient and Young’s modulus (0.367) and a weak correlation with Poisson’s ratio.
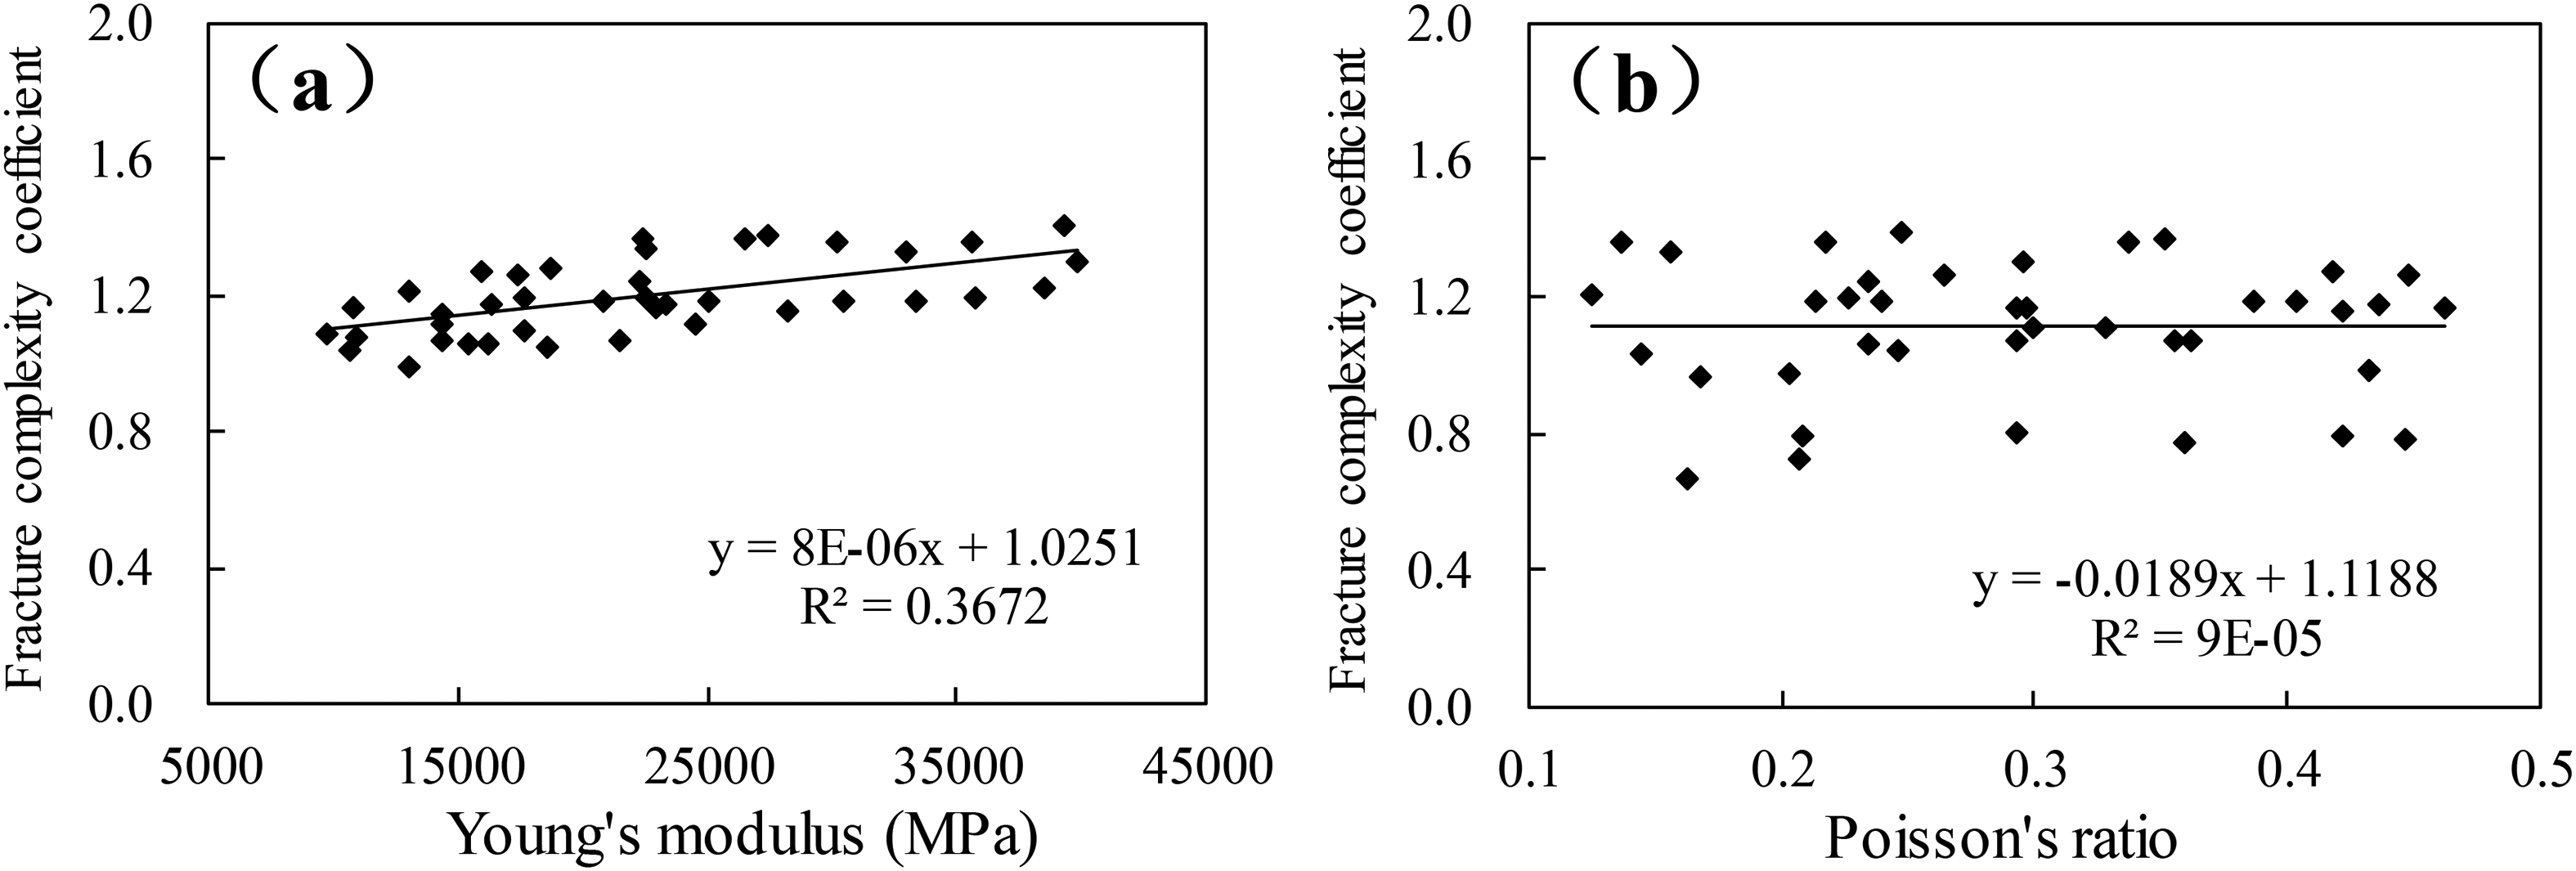
Relationship between the fracture complexity coefficient and mechanical parameters: (a) Young's modulus and (b) Poisson's ratio.
Stress–strain parameters. We analyzed the relationship between the fracture complexity coefficient and different factors from the stress–strain perspective, including the peak stress, peak strain, residual stress, residual strain, and dilatancy angle. As shown in Figure 11, the fracture complexity coefficient is weakly correlated with the peak stress, residual stress, and residual strain, but strongly correlated with the peak strain and dilatancy angle. The peak strain is the maximum strain at the time of rock fracture and is the basis for judging brittle fracture. Smaller peak strain values indicate greater rock brittleness values. The dilatancy angle is a parameter that reflects the volume expansion of the fracturing rock, which can effectively indicate the complexity of the rock fracture.
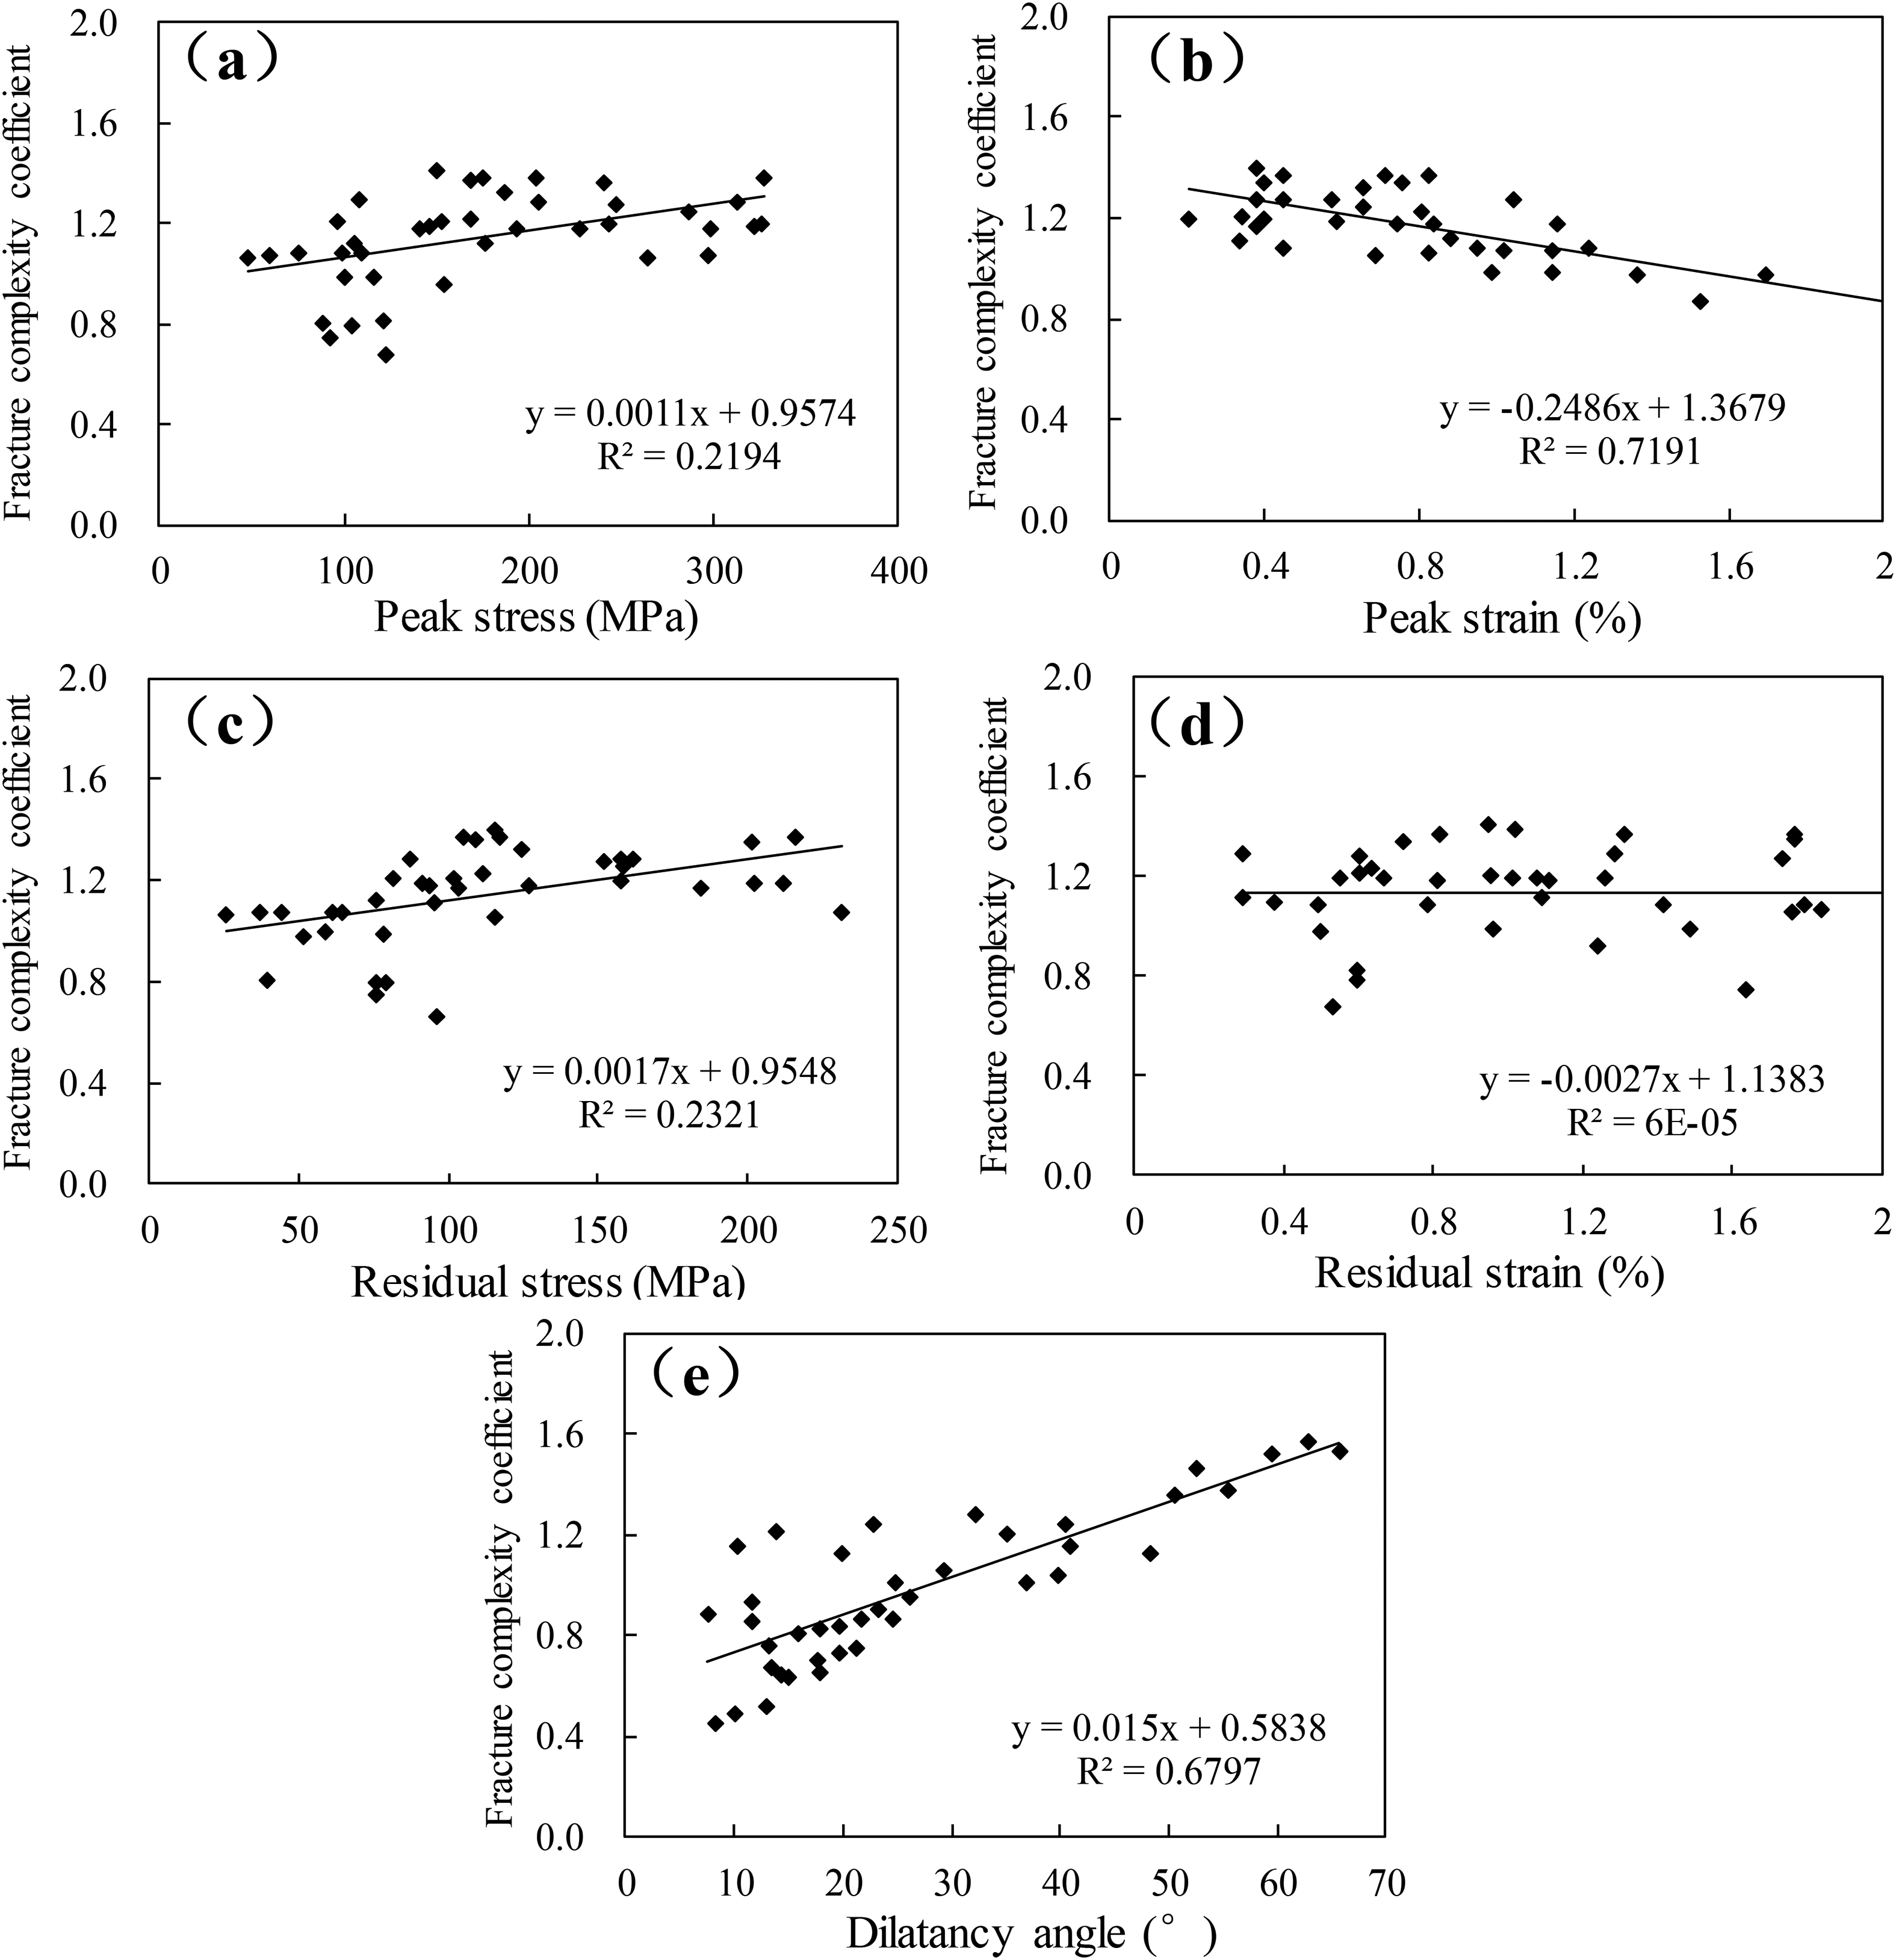
Relationship between the fracture complexity coefficient and stress–strain parameters: (a) peak stress (MPa), (b) peak strain (%), (c) residual stress (MPa), (d) residual strain (%), and (e) dilatancy angle (deg.).
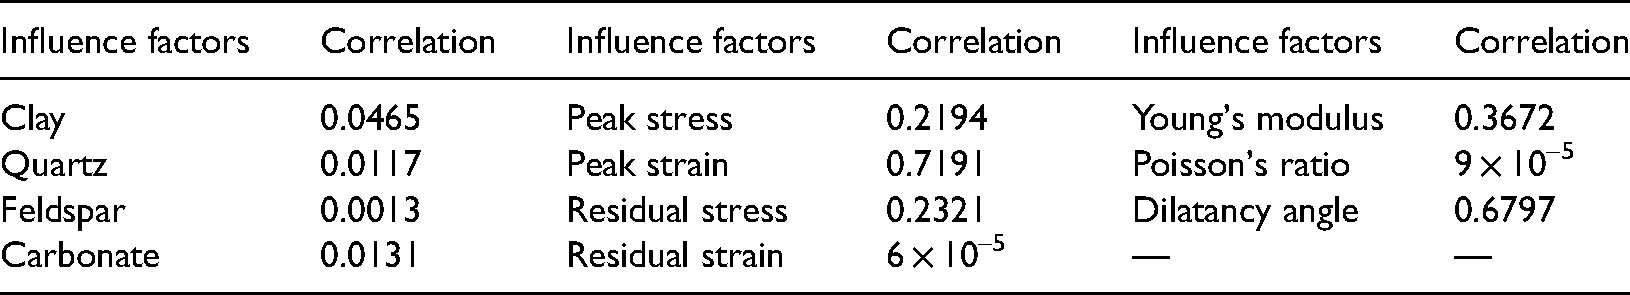
According to the above analysis, we can obtain the relationship between the fracture complexity coefficient and different factors, including the rock mineral composition, mechanical parameters, and stress–strain parameters, as listed in Table 2. Based on the single factor correlation analysis, there are three main factors that affect the fracture complexity coefficient, including the Young's modulus, dilatancy angle, and peak strain.
Correlation analysis results of the impact of rock fracture complexity.
Brittleness index model and fracability evaluation method
Based on the above analysis of the impact of rock fracture morphology, three parameters (the Young's modulus, dilatancy angle, and peak strain), which have the best correlation with the fracture complexity coefficient, were selected as important indicators that affect rock brittleness. The evaluation of the brittleness of deep shale in this area can be calculated as follows:
The normalization formulas for 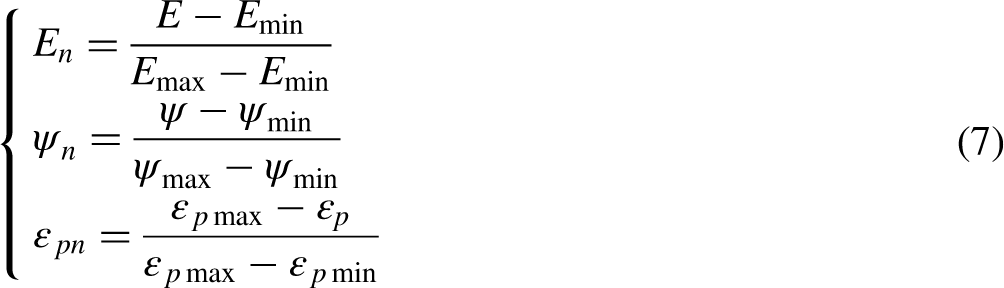
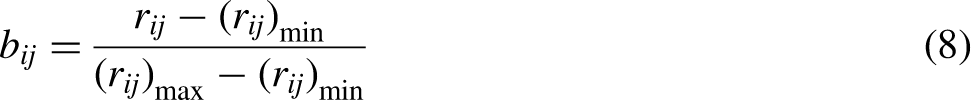
Taking the fracture complexity coefficient as the objective function, gray correlation theory was used to calculate the weight coefficient. The calculation method is as follows:
Determine the sub-series and reference series. Select the normalization function. To eliminate the interference of physical quantity units, a normalization method is used to process the data. For Young's modulus, dilatancy angle and peak strain, the maximum optimal function is used for data processing, and the formula is as follows: Solve the degree of association. Calculate the weighting coefficient.
The calculation results of the weighting coefficients of the influencing parameters were 0.262 (Young's modulus), 0.353 (dilatancy angle), and 0.385 (peak strain).
Based on the brittleness index evaluation model, we propose a fracability evaluation method for deep shale as follows:
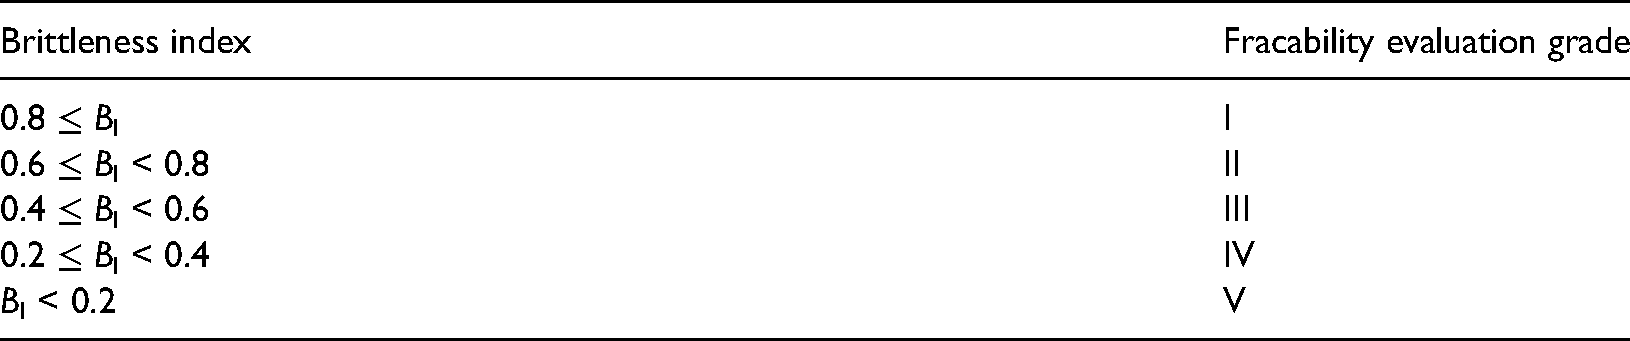
According to the geological data, the corresponding influence parameters were organized, including the Young's modulus, peak strain, and dilatancy angle. The brittleness index of the entire target interval was calculated according to the fracability evaluation model. The fracability of the reservoir was evaluated according to the brittleness index. The evaluation criteria are listed in Table 3, which are mainly based on the distribution range of the brittleness index calculation results and field experience. According to the evaluation results of fracability and the requirements of fracturing clustering, the optimal perforating position of the fracturing interval was selected.
Fracability evaluation criteria.
Engineering case analysis
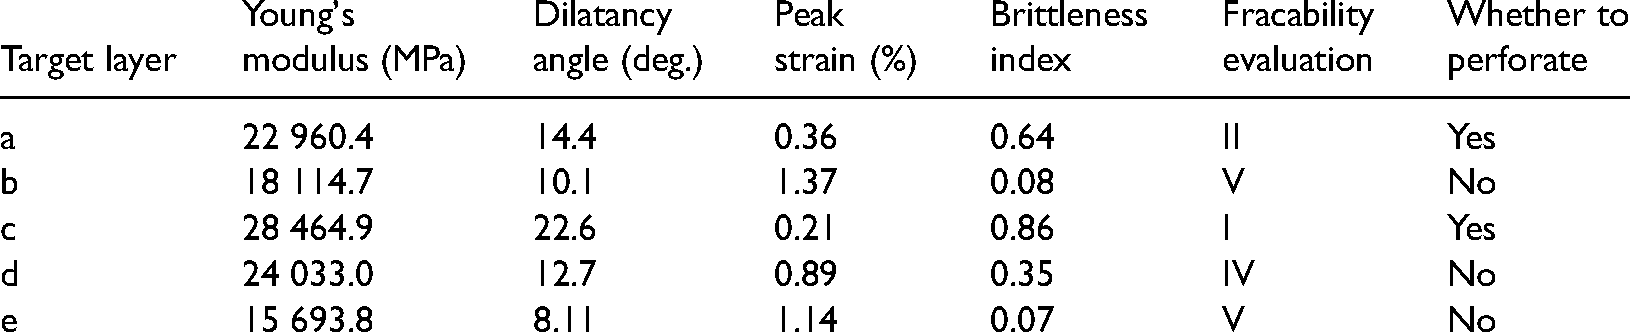
As an example, we analyzed a certain target section of the shale gas well (W1) in the southern Sichuan Basin, which is 60 m in length and has a vertical depth of ∼4000 m. To improve the fracturing effect, the new fracability evaluation model was adopted to accurately select the perforation position. First, the corresponding parameters affecting fracability were organized based on the geological data. Table 4 lists the geological parameters of W1. The fracability index of the entire target section was calculated using the fracability calculation model. The target layers with fracability evaluation results of “I” and “II” were selected as the perforation positions.
Geological parameters of some target layers in W1.
Microseismic monitoring data of certain sections of two wells.
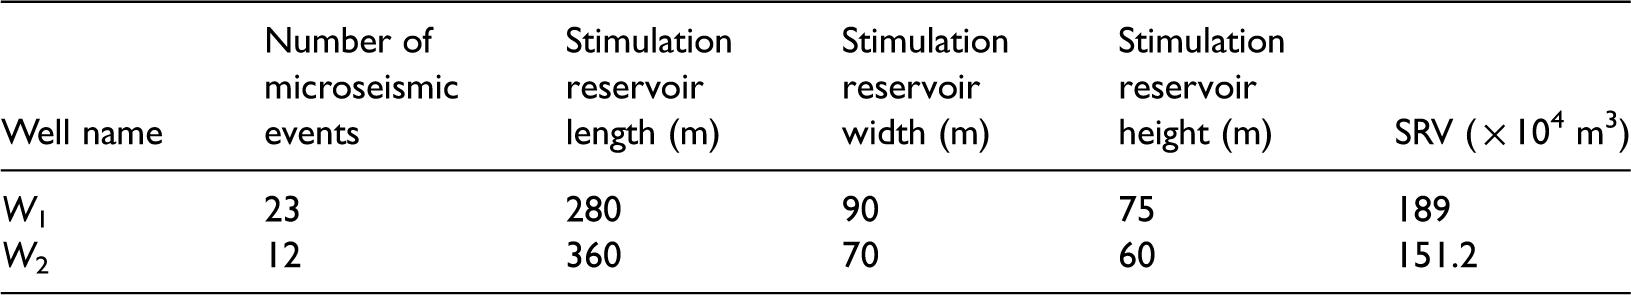
W2 is the well adjacent to W1. The target layers of the two wells are the same, and their reservoir geological characteristics are similar. The perforation position was selected via conventional methods in W2, and the two wells use the same fracturing scale. Comparing the fracturing curve, as shown in Figure 12, the shale interval with a high fracability index has significant brittleness and abundant natural fractures; therefore, W1, which has been optimized for the perforation position, has a lower fracture pressure. From the perspective of the entire fracturing process, the perforation location can significantly reduce the fracturing pressure by 5–10 MPa. At the same fracturing scale, the fracturing pressure of W1 gradually increased during the fracturing process, which may be due to the formation of complex fracture networks connected to natural fractures and increased fluid friction, as shown in Figure 13. As listed in Table 5, the number of microseismic events in a certain section of W1 is significantly more than that of W2, and the stimulation reservoir volume of W1 is larger than that of W2, indicating that W1 has formed a more complex fracture network and its hydraulic fracturing is more effective.
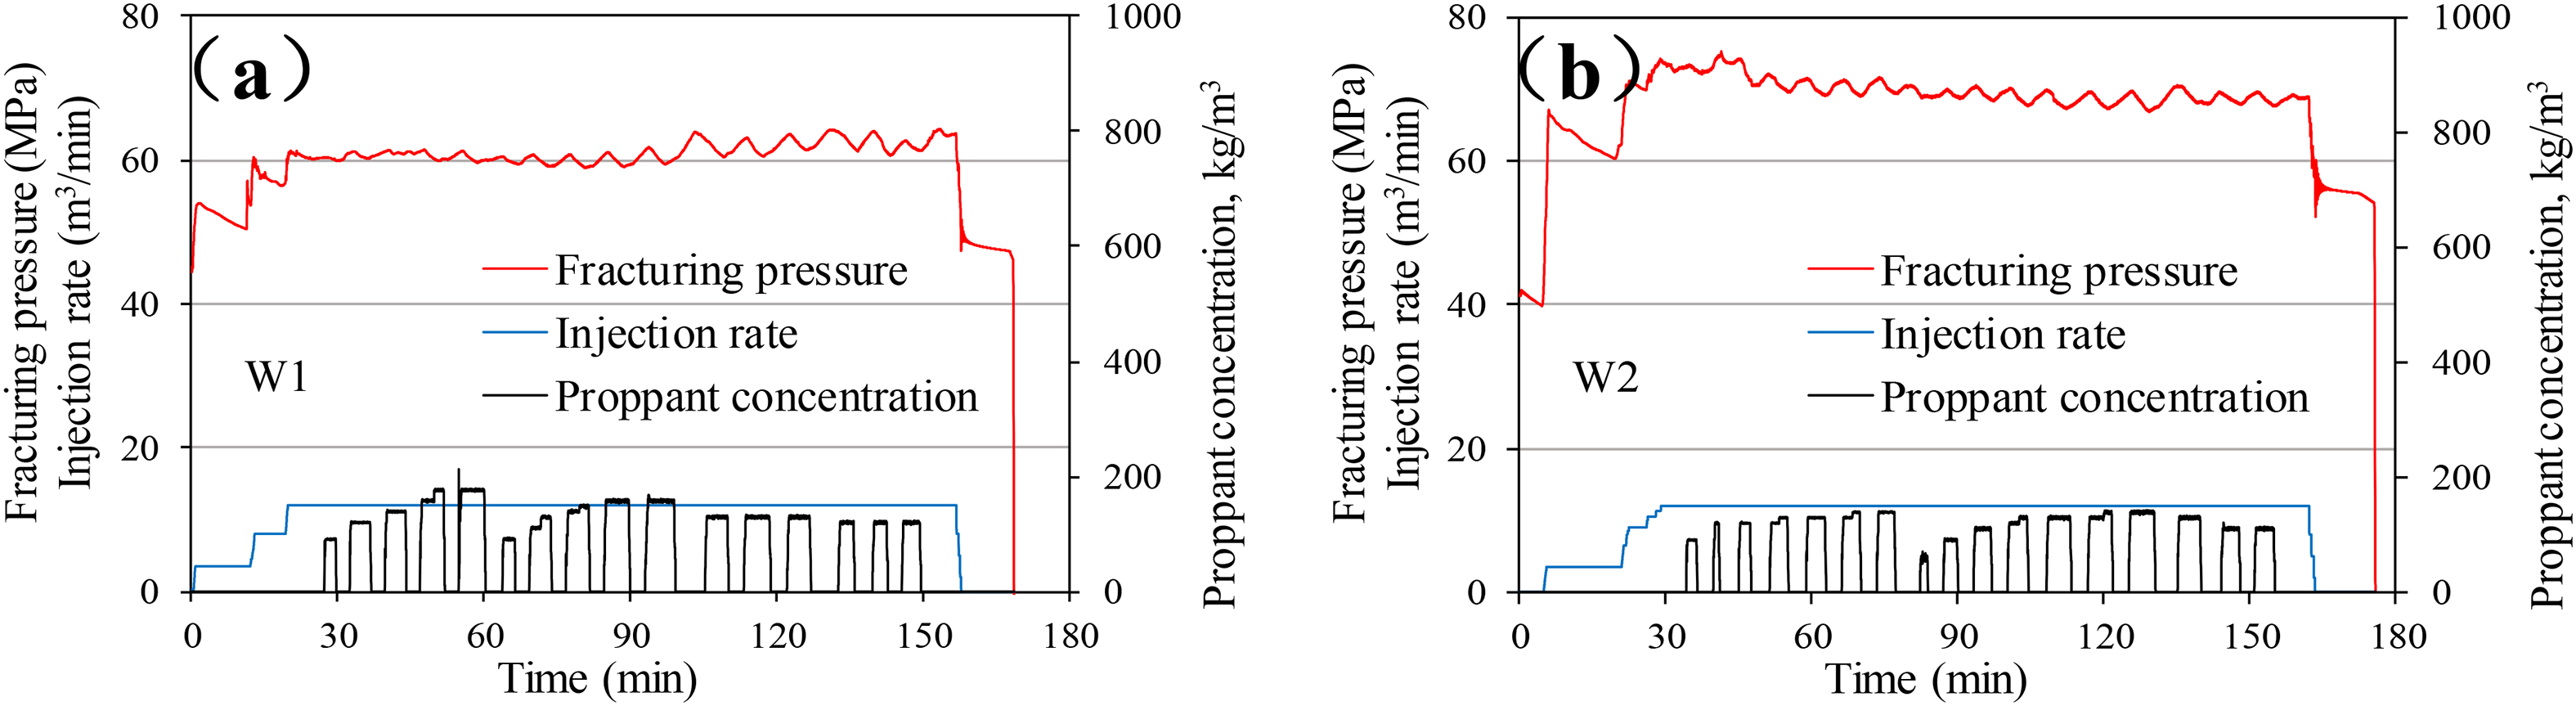
Fracturing curves of (a) W1 and (b) W2. The red, blue, and black lines represent fracturing pressure, injection rate, and proppant concentration, respectively.
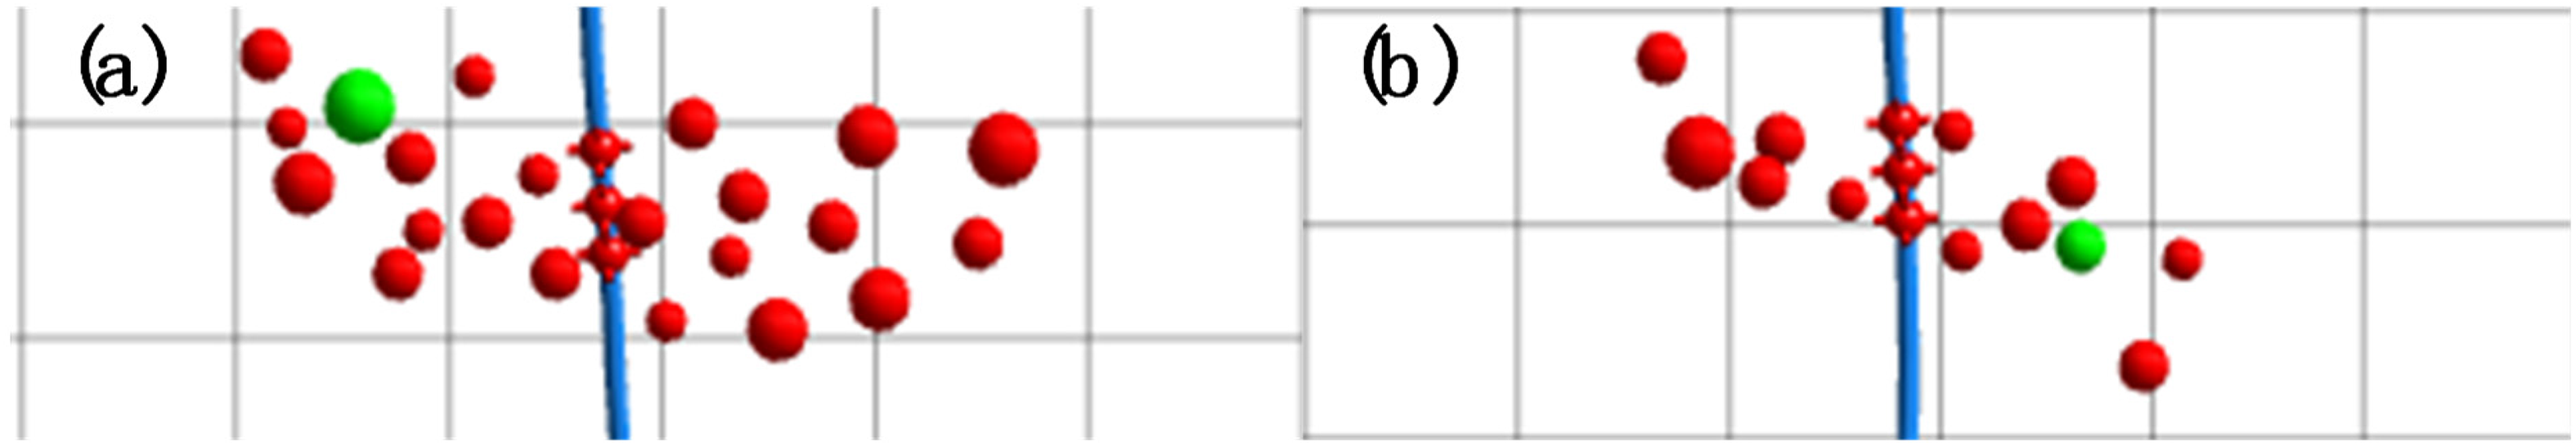
The microseismic monitoring data of (a) W1 and (b) W2. The sphere represents the microseismic event, and the blue line represents the well bore.
As shown in Figure 14, the initial daily gas production of W1 after fracturing at the optimized perforation location was 45.6 × 10⁴ m3, which was an increase of 15.6 × 10⁴ m3/d compared with W2; W1 had a stable production of 40 × 104 m3/d for an extended period. This technology has been successfully used in more than 10 deep shale gas wells in the southern Sichuan Basin. The average daily production of a single well increased by 14.5 × 10⁴ m3, significantly improving the effect of hydraulic fracturing.
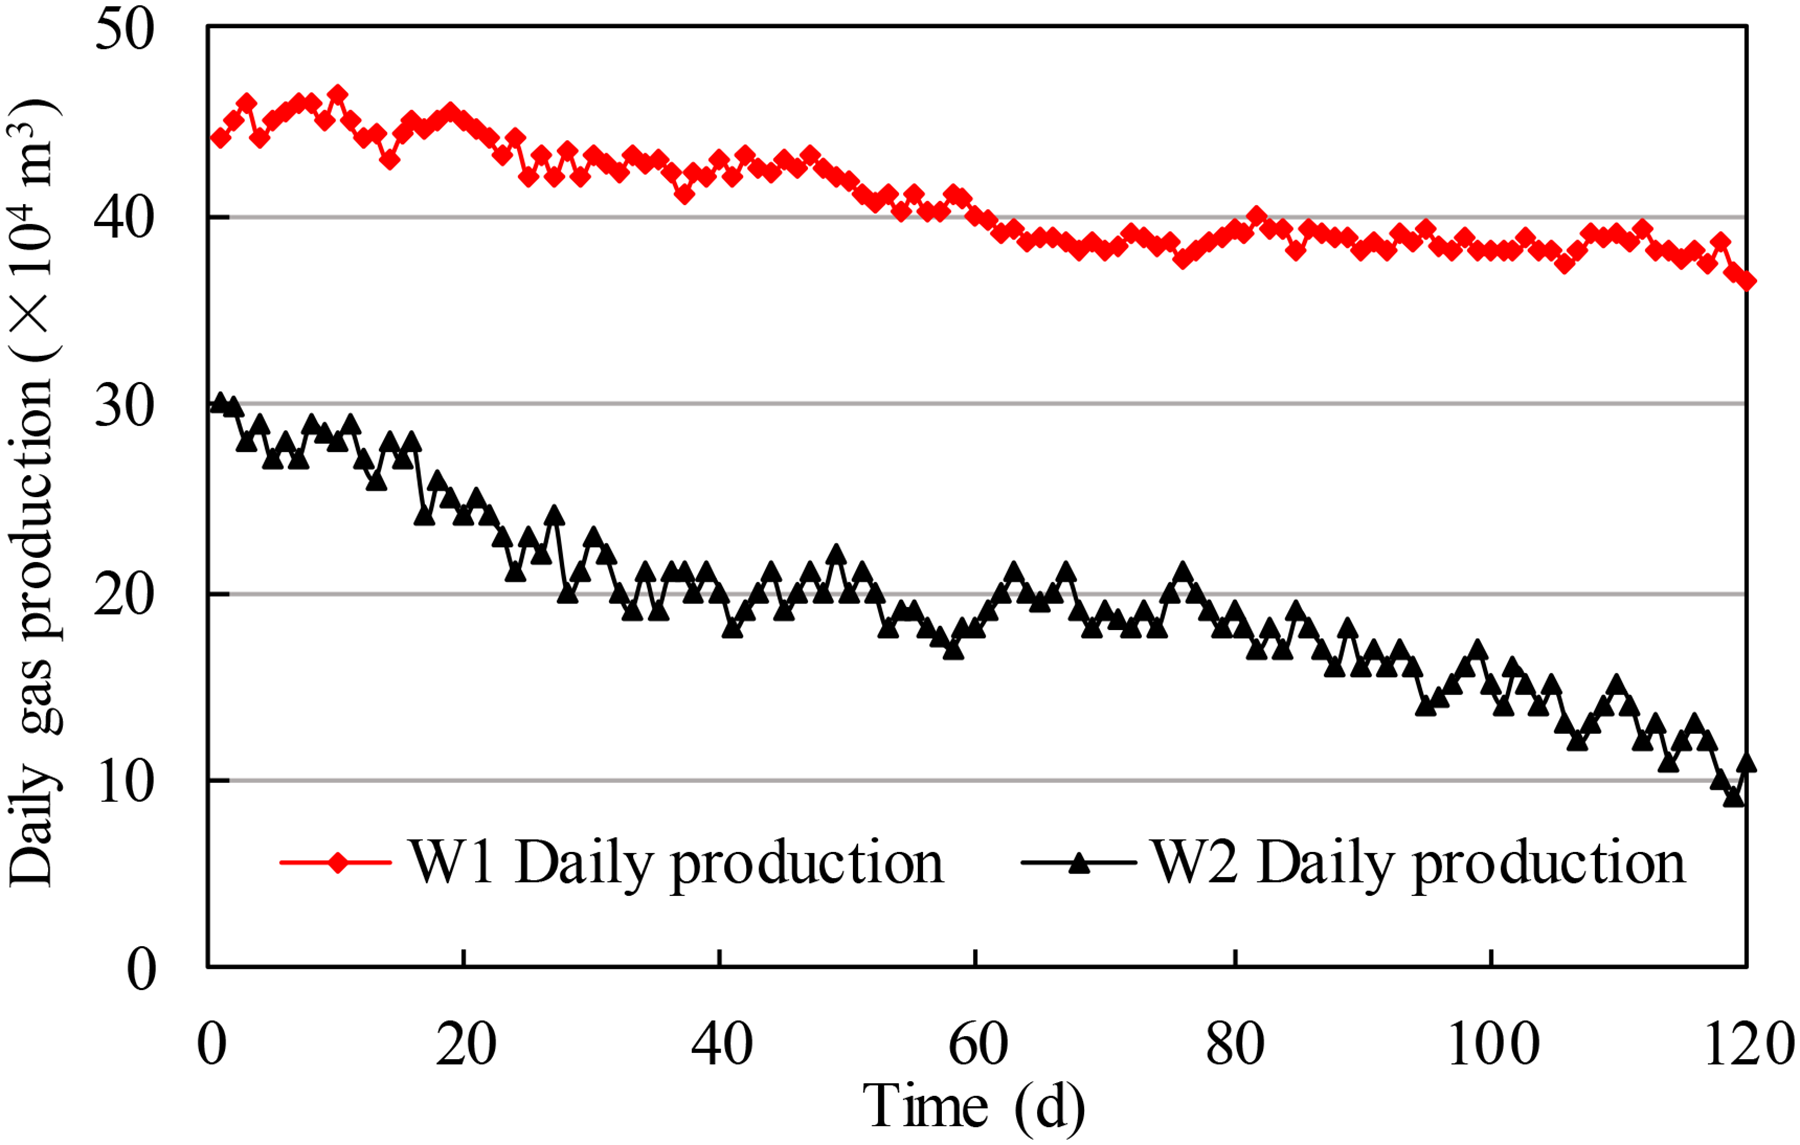
Production curves of the two wells. The red and black lines represent the daily gas production of W1 and W2 after fracturing.
Conclusions
In this paper, the fracability of deep shale is studied through experimental methods. The optimization method of perforation position is proposed and case analysis is carried out. In particular, we have:
The deep shale of the Longmaxi Formation in the southern Sichuan Basin is mainly composed of clay, quartz, feldspar, and carbonate minerals, with average contents of 37.2%, 33.6%, 4.4%, and 23.0%, respectively. The average Young's modulus is 16,153.3 MPa, the average Poisson's ratio is 0.27, and the overall heterogeneity is strong. Based on the fractal dimension and fracture angle, the fracture complexity coefficient was defined to quantitatively characterize the shale fracture morphology. The Young's modulus, peak strain, and dilatancy angle are important factors affecting the fracture morphology of shale from the Longmaxi Formation shale in the southern Sichuan Basin. The mineral composition, Poisson's ratio, peak stress, residual stress, and residual strain have negligible effects on the fracture morphology. In this study, we established a fracability evaluation method for deep shale considering the shale brittleness index. According to the gray correlation theory, the calculation results of the weighting coefficients for the influencing parameters were 0.262 (Young's modulus), 0.353 (dilatancy angle), and 0.385 (peak strain). Based on the brittleness index evaluation model, a fracability evaluation method for deep shale was proposed to optimize the location of the fracturing perforation. This method has been successfully applied in more than 10 deep shale gas wells in the southern Sichuan Basin, effectively reducing the fracturing pressure by 5–10 MPa, increasing the average daily production of a single well by 15.3 × 10⁴ m3, increasing the stable production time, and significantly improving the effect of hydraulic fracturing.
Highlights
Parameters, composition, and stress–strain of shale obtained from Longmaxi shale.
Established a new evaluation model for the deep shale brittleness index.
Proposed a novel method for evaluating deep shale fracability using the brittleness index.
Technology successfully applied to more than 10 wells in southern Sichuan Basin.
Footnotes
Declaration of conflicting interests
The authors declared no potential conflicts of interest with respect to the research, authorship, and/or publication of this article.
Funding
The authors disclosed receipt of the following financial support for the research, authorship, and/or publication of this article: This study was jointly supported by National Natural Science Foundation of China (Item No. 52022087).
Supplemental material
Supplemental material for this article is available online.