
Abstract
Due to the discontinuity and multi-scale of fracture porous media (FPM), fluid transport in the naturally fractured reservoir (NFR) is more complex than in the conventional reservoirs. Based on the embedded discrete fracture model (EDFM), the effect of fracture pattern (i.e. fracture orientation, intersection relationship, numbers and distribution) on fluid transport is investigated, and the paper also conducts research on pressure distribution and flow behavior. A series of fracture models are built to get a detailed analysis of fracture pattern influences. Results show that when the fracture orientation tends to parallel the main stream direction, the seepage flow through the fracture is more distinct and the pressure drop at two sides of fracture becomes larger. As the intersecting fracture cannot serve as part of main-stream channels, the intersection is almost invalid. In the multi-scale fracture model, the pressure drop in the large-scale fractures network is higher than in the small-scale fractures. Thus, the simulation results show that the fracture pattern has a significant impact on the seepage flow and pressure distribution. Also, this model is simulated for M field which has random natural fracture network to study the flow and transport characteristics in fractured porous media. The comprehensive simulation results the fracture patterns have impact effect on production.
Keywords
Introduction
Fractured reservoir represents over 40% of the world’s oil and gas reserves (Allan and Sun, 2003). Unlike the conventional reservoir, the fractured reservoir exists extensive fracture networks, with multi-scales and orientated fractures in a specific region, where permeability anisotropy is high. Therefore, the numerical simulation for fractured reservoir is still a challenge. There are extensive studies over the past twenty years, which have proposed different modeling approaches and numerical strategies to simulate different types of fractures.
In 1960s, it was proposed the dual-porosity model and its extensions for naturally fractured porous media with many naturally small-scale fractures (Kazemi, 1969; Warren and Root, 1963). This method is only suitable for small-scale fractures in the reservoir. Thus, it fails to provide accurate depictions and simulations for various scale and arbitrary orientation fractures.
To obtain more accurate simulation for the multi-scale fractures reservoir, the discrete fracture model (DFM) approach was devised (Hoteit and Firoozabadi, 2008; Karimi-Fard and Firoozabadi, 2003; Noorishad and Mehran, 1982). In this method, geometry and locations of fractures are captured accurately by using complex unstructured gridding techniques. However, numbers of small grids is required to capture fracture geometries which makes the computational cost high. Therefore, the DFM has limited applicability for realistic simulation due to the complex grids.
A new approach EDFM is introduced and the schematic as shown in Figure 1 which can provide accurate solutions for multi-scale fractures reservoir simulation (Hajibeygi et al., 2011; Lee et al., 2001; Li and Lee, 2008). In this model, small-scale fractures are homogenized and treated as a continuous and damaged matrix with effective coefficients. On the other side, large-scale fractures are represented by a coupled discrete fracture model. Moreover, the EFDM model has less degrees of freedom than the DFM, thus, it has sufficient coupling to achieve good convergence rates.
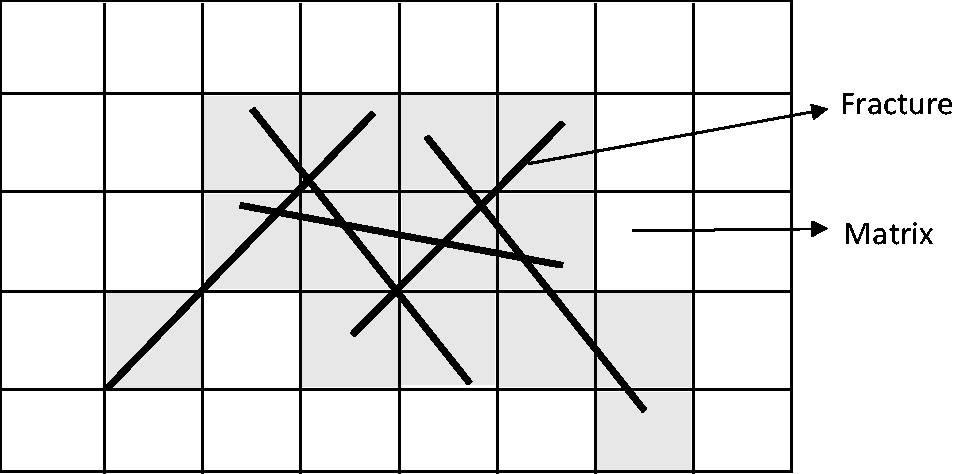
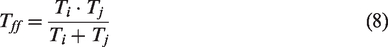
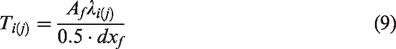
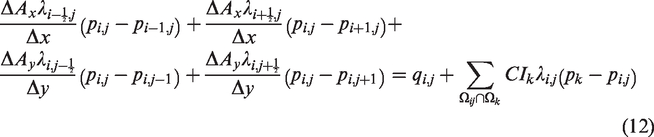
2 D matrix grids with 1 D fracture network of 5 fracture lines connection (The shaded cells are embedded fracture.)
The aim of this research is to study the influence of fracture pattern on fluid transport in the FPM using the EDFM and solved by the FVM. Several fracture models with different pattern (i.e. fracture orientation, intersection, numbers and distribution) are established to investigate the seepage flow and pressure distribution in the FPM. The preliminary simulation results show that the fracture with different patterns have a significant impact on fluid transport in fractured reservoir.
Mathematical model in EDFM
The EDFM uses a structured grid to represent matrix system and introduces additional fractures by computing intersection of fractures with the matrix grids as shown in Figure 1. The modeling approach is organized by governing equations, fracture-matrix transfer equations, fracture-fracture intersection equations and fully coupled simulation process.
Governing equations
The flow in the FPM is often described by the Darcy-law equation for incompressible single-phase flow. We consider the Darcy’s law for incompressible single-phase flow without capillary pressure and gravity effects in this study.
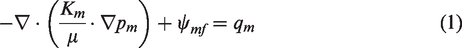
Matrix mass balance equation is written as:
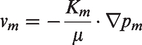
The fluid velocity can be obtained using Darcy-law:
The transport equation in the matrix system is derived to the continuity equation by balancing the components of the transported mass, as:

The fracture mass balance equation is given by:
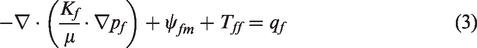
The fracture permeability is assumed by the cubic law which relates to fracture aperture:
Here, the transport equation in fracture system is similar to the transport equation (2) of the matrix system.
Fracture-matrix coupling equations
Transport function is treated as a source term in the mass balance equation between matrix and fracture, which is similar as in classical well models (Peaceman, 1978):
The connectivity index CI is computed based on the position and the properties of matrix grids and fracture segments. It is defined as the area of fracture segment bounded inside grid block over the average distance between matrix and fracture control volumes (Li and Lee, 2008):
Fracture intersection equations
In fact, fractures often intersect other fractures which has a big impact on the flow dynamics in the FPM. In this model, the effect of fracture-fracture coupling was considered. The transmissivity between intersection fractures can be obtained by a similar approach used in electrical engineering for known as star-delta transformation in circuits (Karimi-Fard and Firoozabadi, 2003):
Discretizing the pressure and transport equations
The FVM is used to discretize the pressure and equations for matrix and fracture system. The domain Ω for elliptic pressure equation can be discretized as the integration over finite control volume Ω
ij
. The divergence integral for matrix system can be written as:

The divergence integral also can be expressed as the surface integral to the boundary of the volume by using Gauss’s theorem:

The pressure gradient over the cell boundary is approximated by two points flux approximation scheme with the FVM. The Figure 2 shows the schematic of matrix and fracture grid. The discretized expression for the matrix pressure is given by:
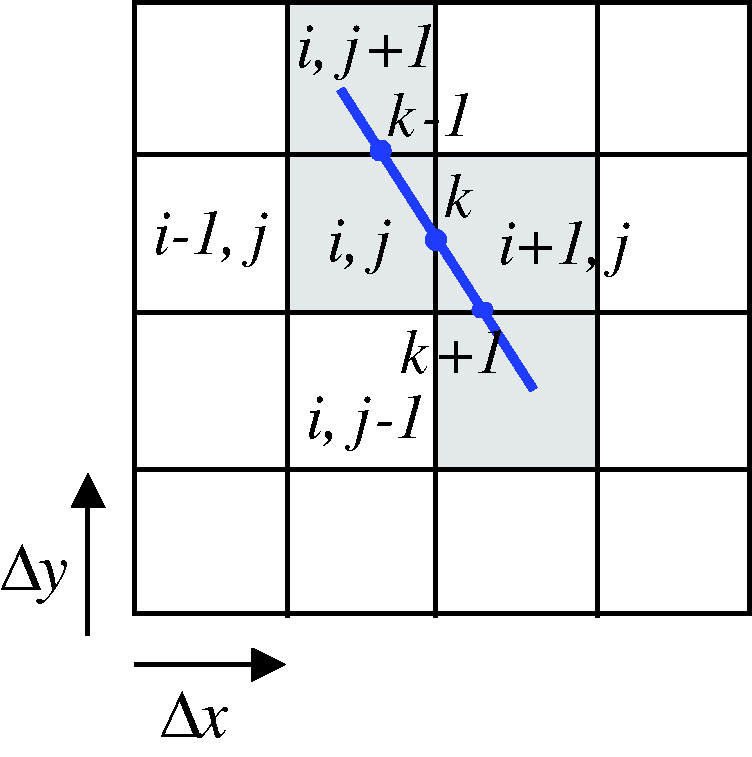
The schematic of matrix grid cell and fracture grid. (The blue line is a fracture. The shaded cells are embedded fracture.).
Similarly, the pressure for the fracture system can be expressed as:

Here, the discretized approach for transport equation is similar to the discretization of pressure equation.
The solving strategy
The FV discretization scheme is used to solve for pressure and transport equations, so they can be assembled respectively as a linear system. The block matrix expressions for both of pressure and transport systems are given by:
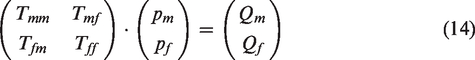
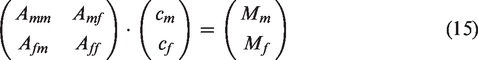
Figure 3 shows a flowchart of calculation procedures. At the initial time (T=t0), the pressure is defined as p0, then start calculating the pressure at time step n. next, the pressure solution is used to solve velocity. Then the concentration at time step n is calculated. If the time step reaches the maximum value, the calculation is end and the results are output; if not, the calculation will be continuing.
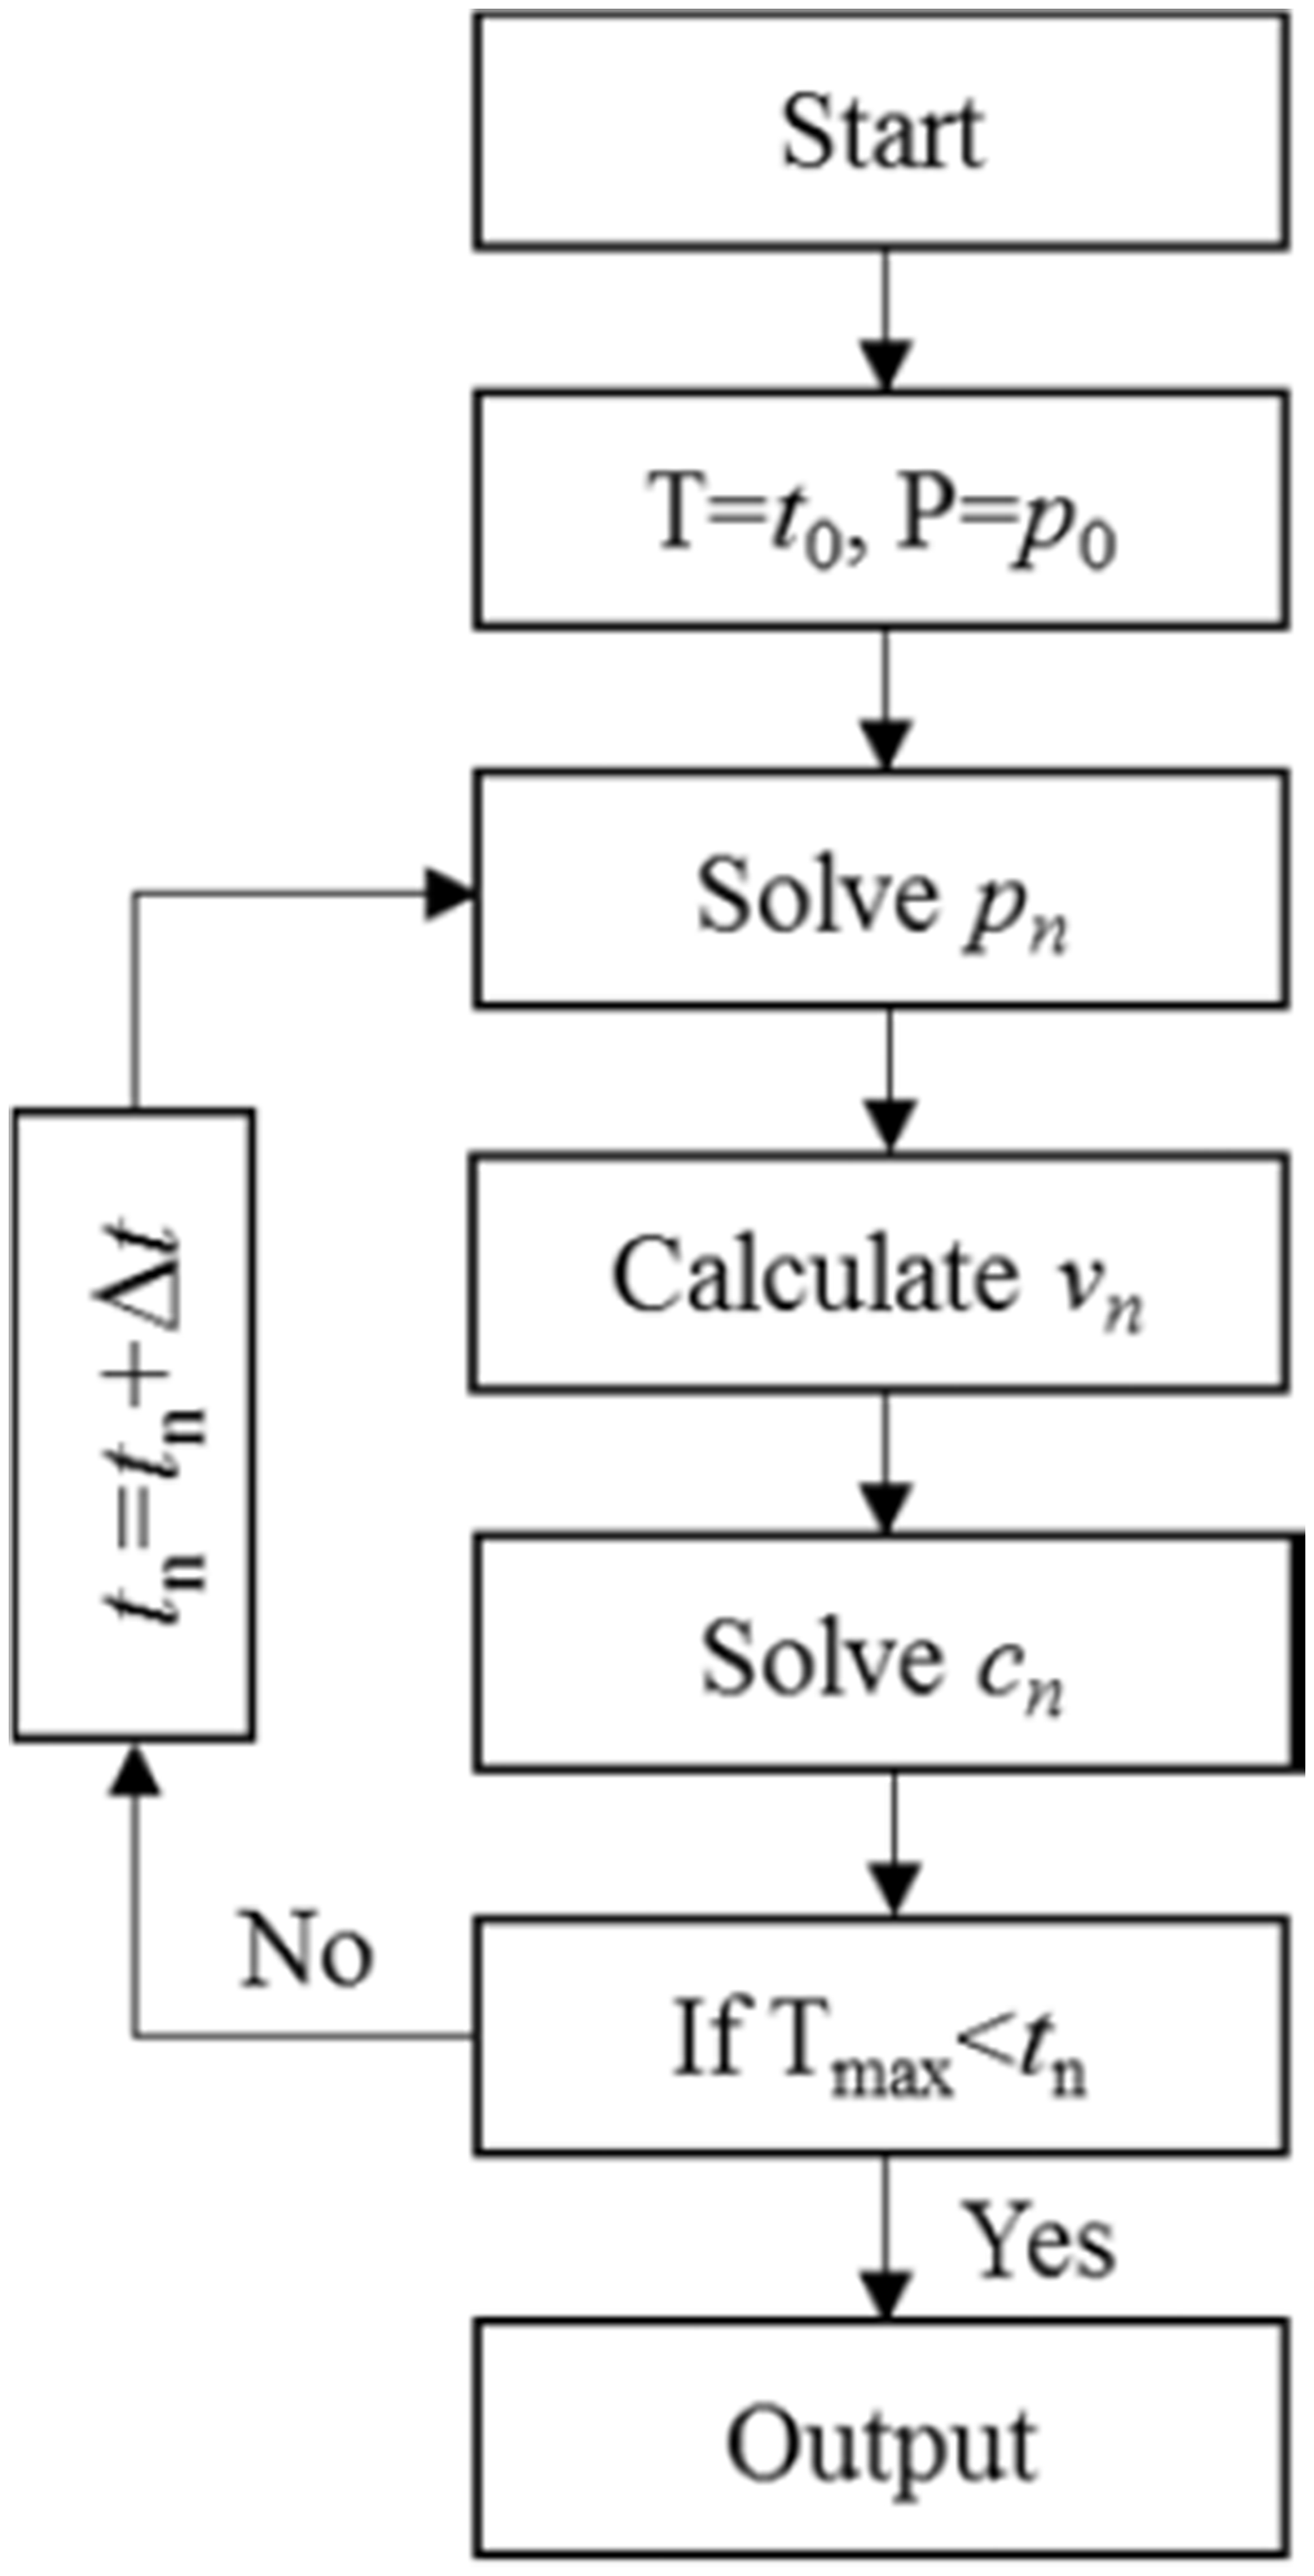
The flowchart of calculation procedures.
Model validation and introduction
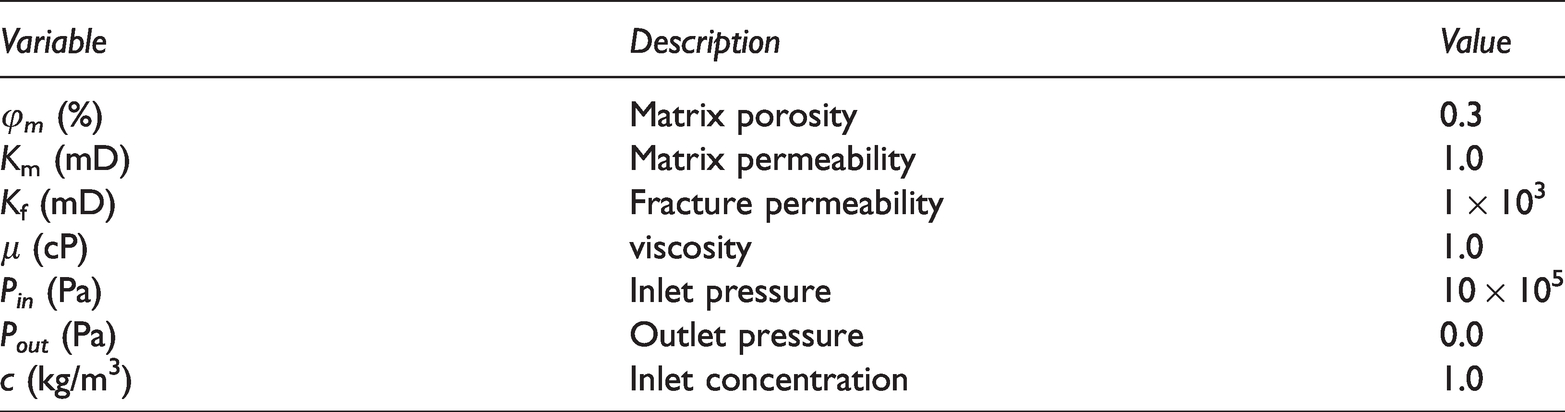
2D geometry of two vertical crossing fractures in base model is considered as shown in Figure 4. The domain of base case is 9 by 9 m and discretized by 99 by 99 cells. The pressure at the inlet (left-hand-side) is 10 × 105 Pa and the outlet pressure (right-hand-side) is zero Pa. The top and bottom boundaries are no flow boundaries. A concentration boundary of 1 kg/m3 is applied at the inlet. The base model parameters are shown in Table 1. The new model is compared with the reference model of DFM (Pluimers, 2015). Figure 5 shows that the comparison of pressure in two systems between the models and the agreement is quite good, despite the different fracture apertures lead to a slight deviation in the comparison. The error of comparison is less than 4%, which indicates the new EDFM is validated. Besides, the new EDFM contains two order of magnitude less degree of freedom (DOF) than the reference model.
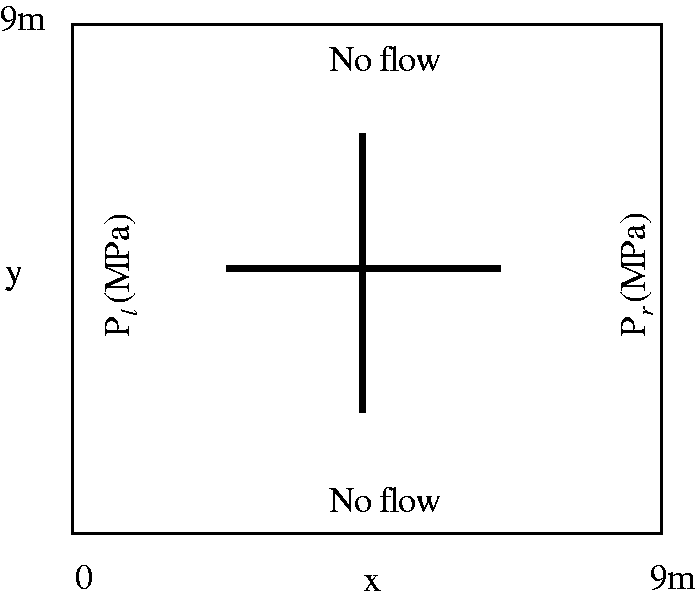
The base model (black lines are fractures).
Parameters of the verified model.
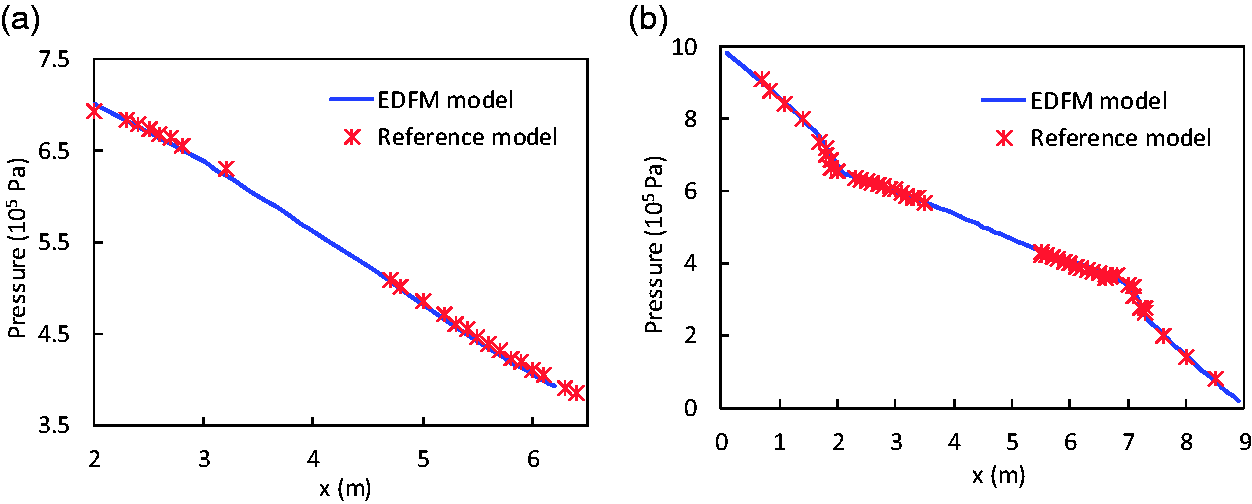
The comparison of pressure between the EDFM and the reference model. (a) Matrix pressure system. (b) Fracture pressure system.
Results and discussion
Based on the previous verified model, the effect of fracture patterns (i.e. Fracture orientation, intersection, numbers and distribution) are systematically studied.
Effect of fracture orientation
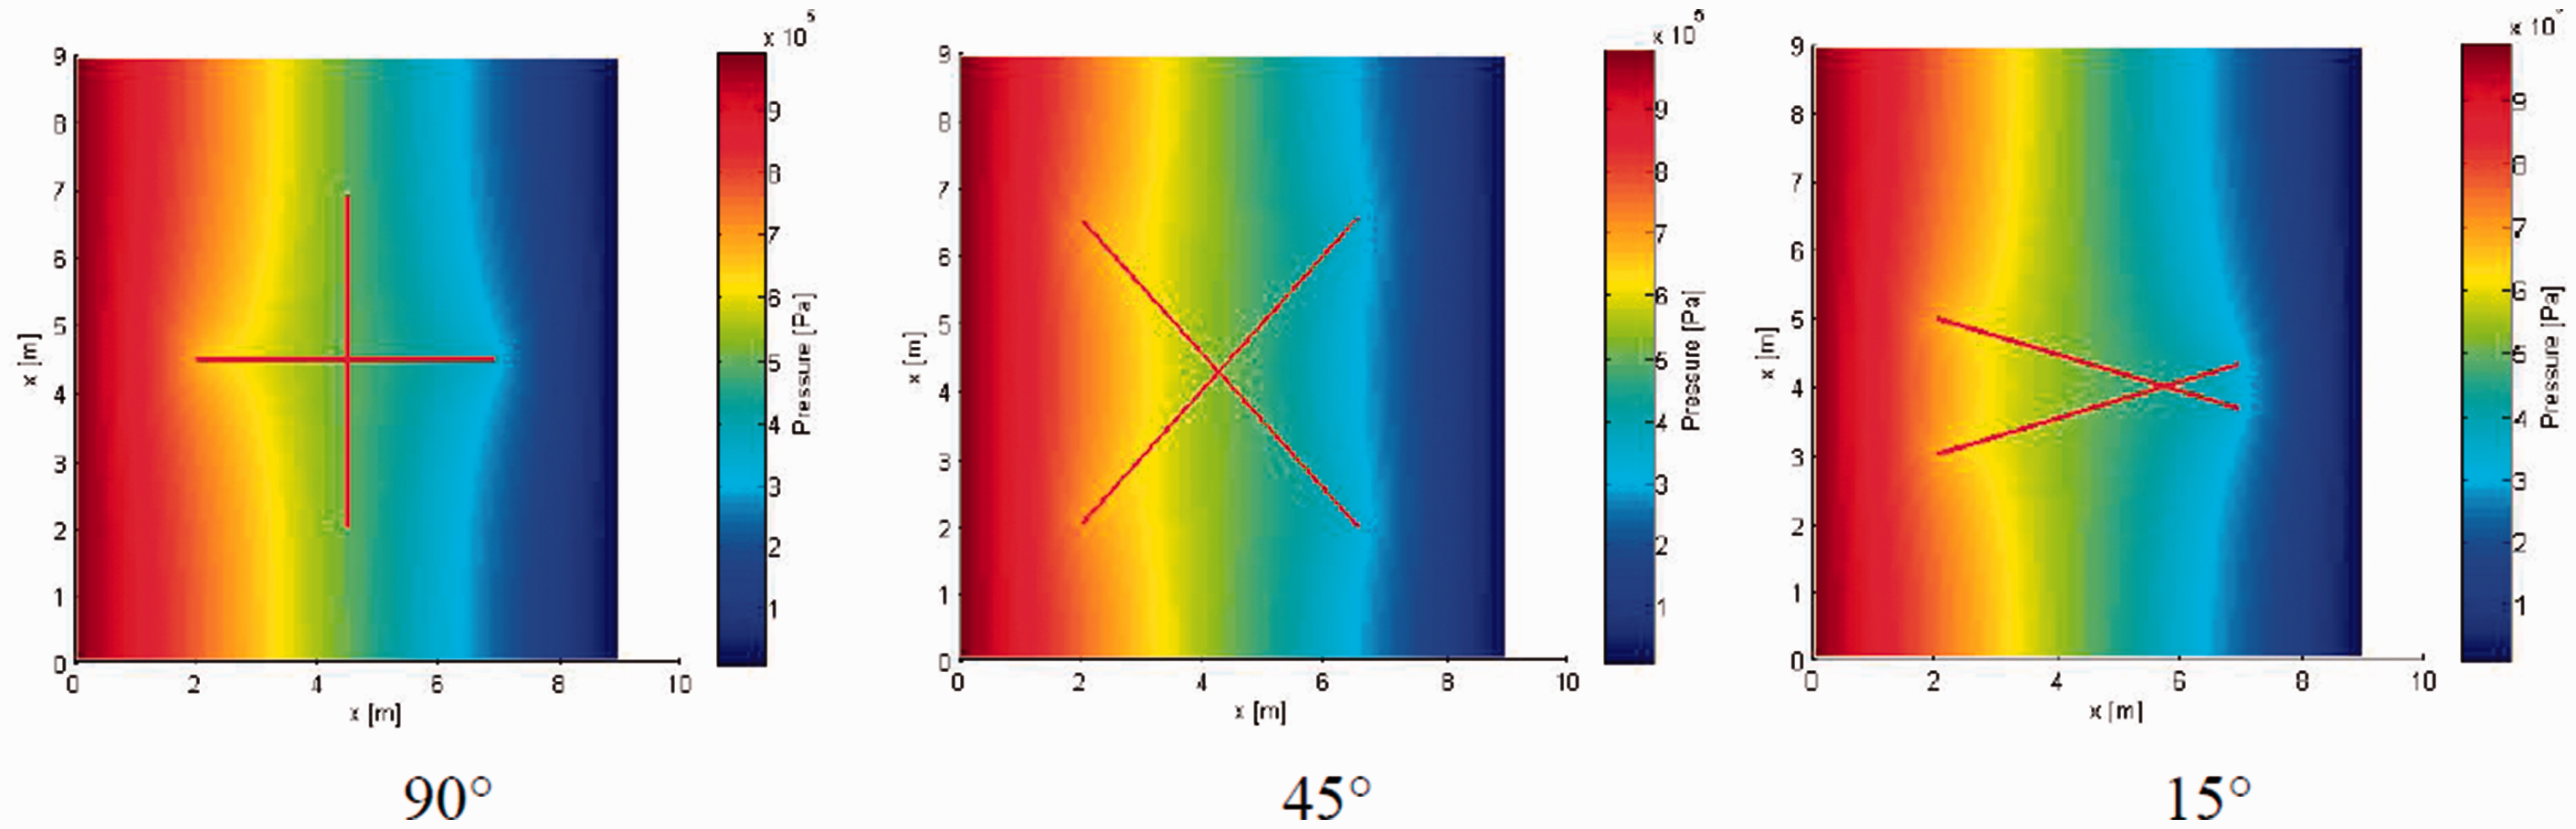
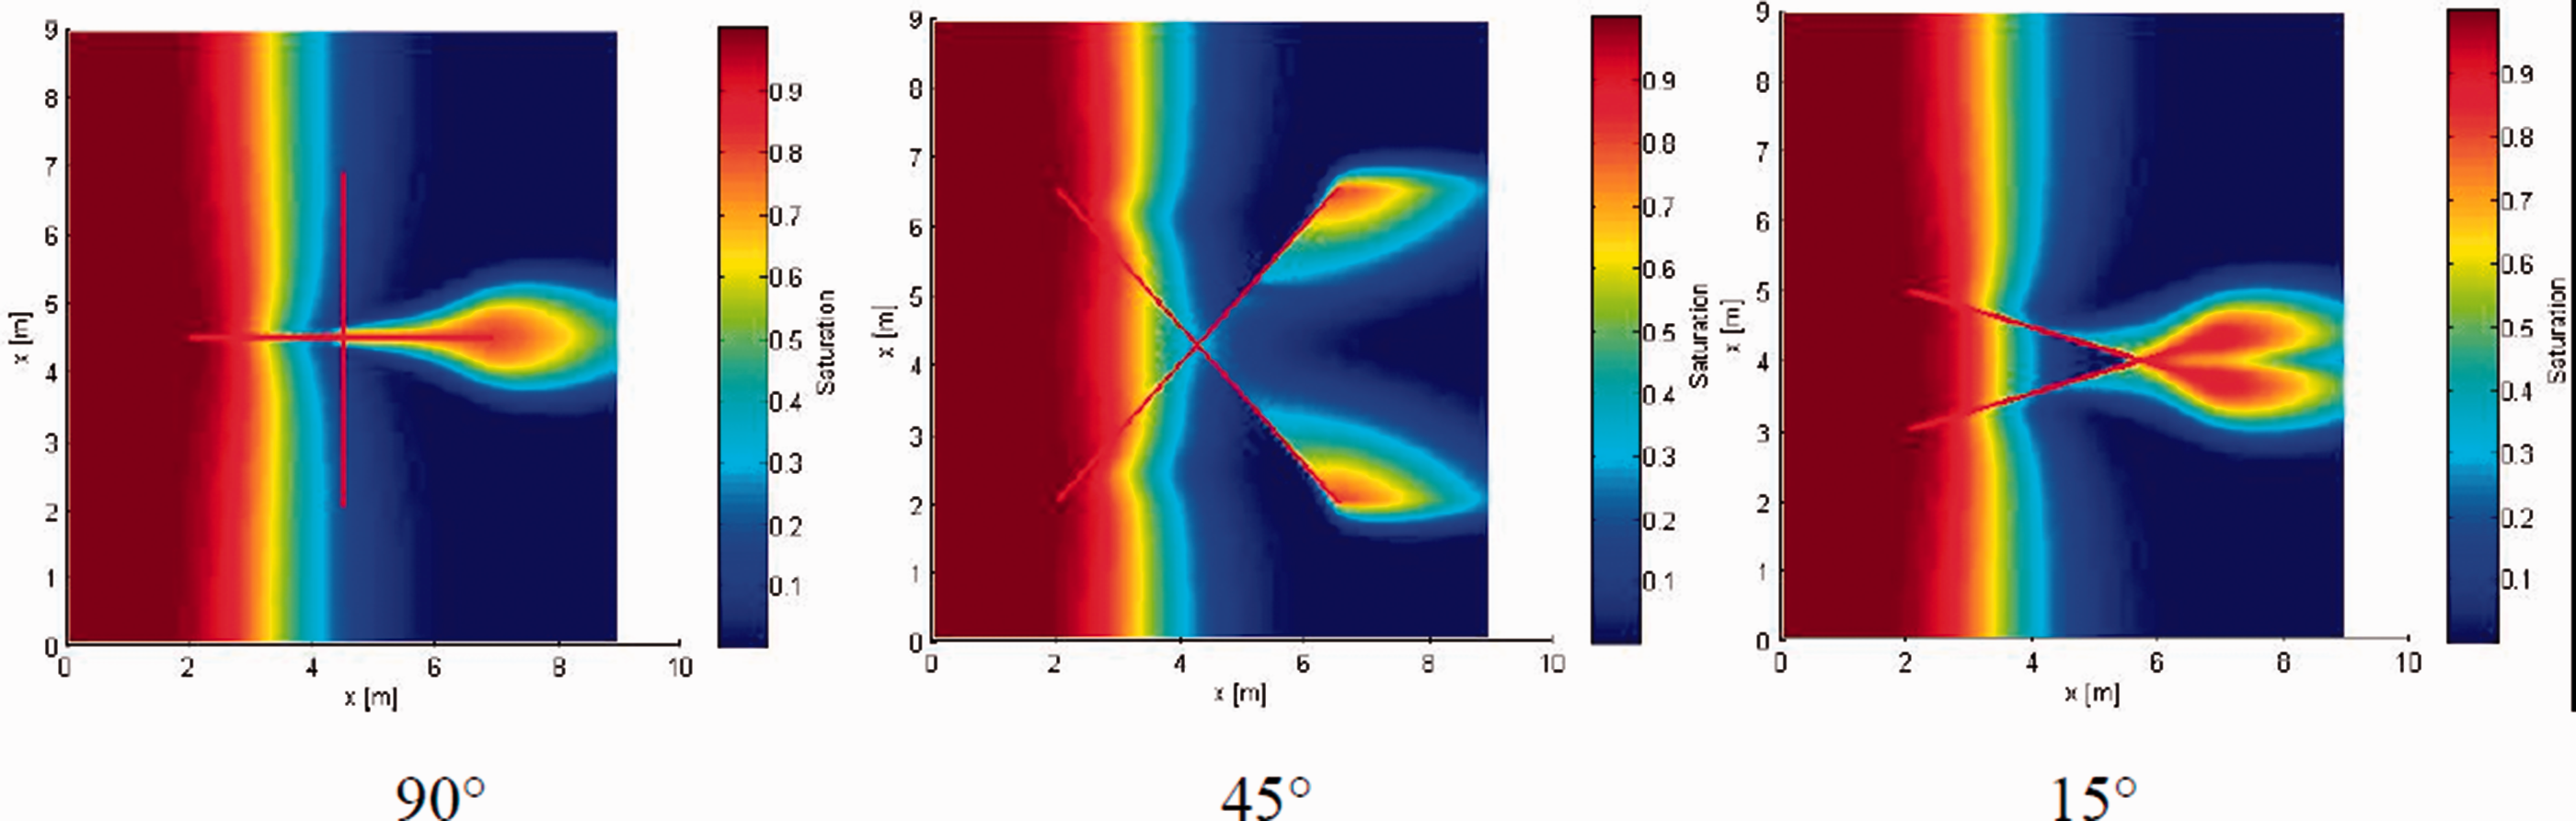
Figures 6 and 7 show the fluid transport and pressure distribution with different fracture orientations. The effect of single fracture orientation (0, 45 and 90 degrees) on seepage field is studied. The changes of fracture orientation have a big influence on fluid transport and pressure distribution. When the fracture orientation is 90 degree, the fracture is perpendicular to the main streamline, the fluid gathers the left side of fracture and flow through the short distance of the fracture then getting into matrix. The distribution of pressure field is more homogenous, which indicates that a fracture perpendicular to the mainstream has less contribution to the fluid transport. While the fracture orientation tends to parallel the mainstream line direction (45 degree), the seepage flow through fracture is more distinct and the pressure drop at two sides of fracture becomes larger. As the fracture is parallel to main streamline direction (0 degree), the fracture will contribute largest conductivity the fluid transport.
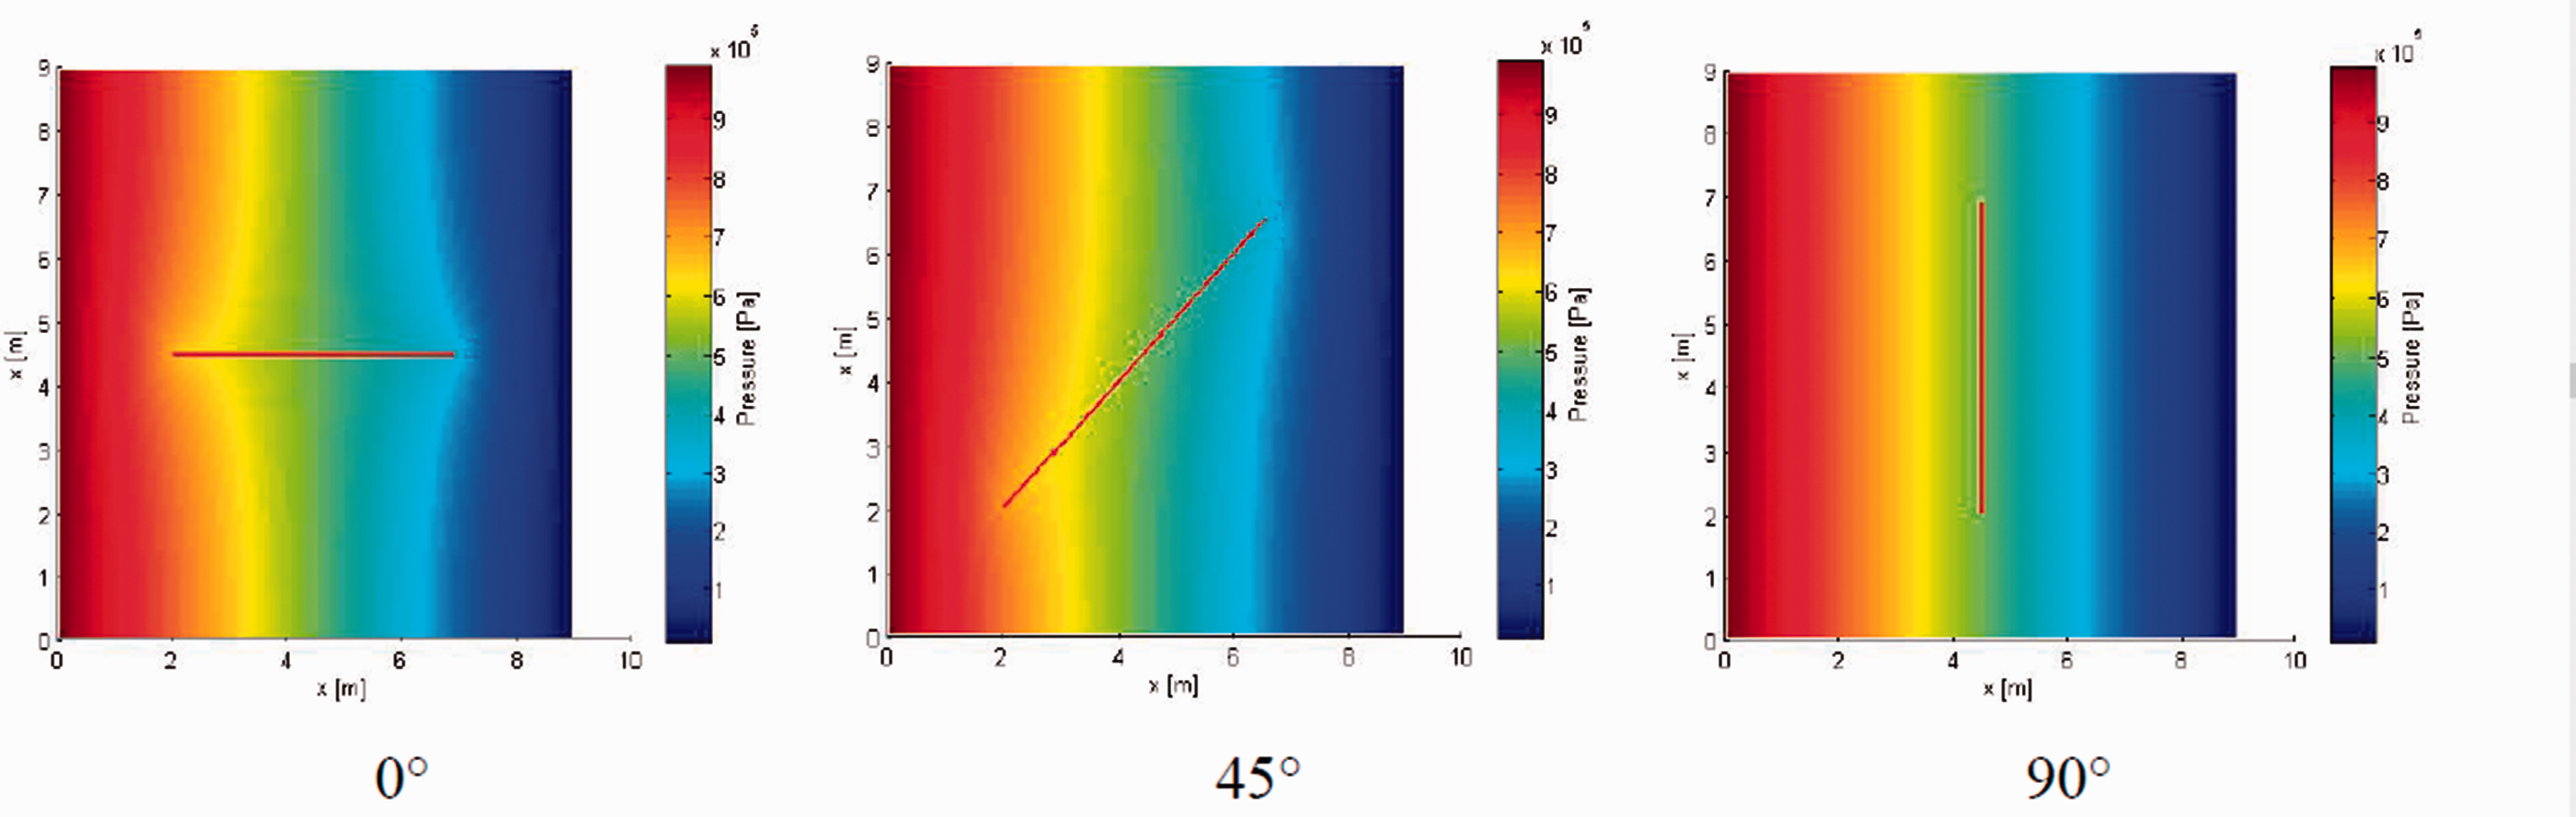
Pressure distribution with different fracture orientations.
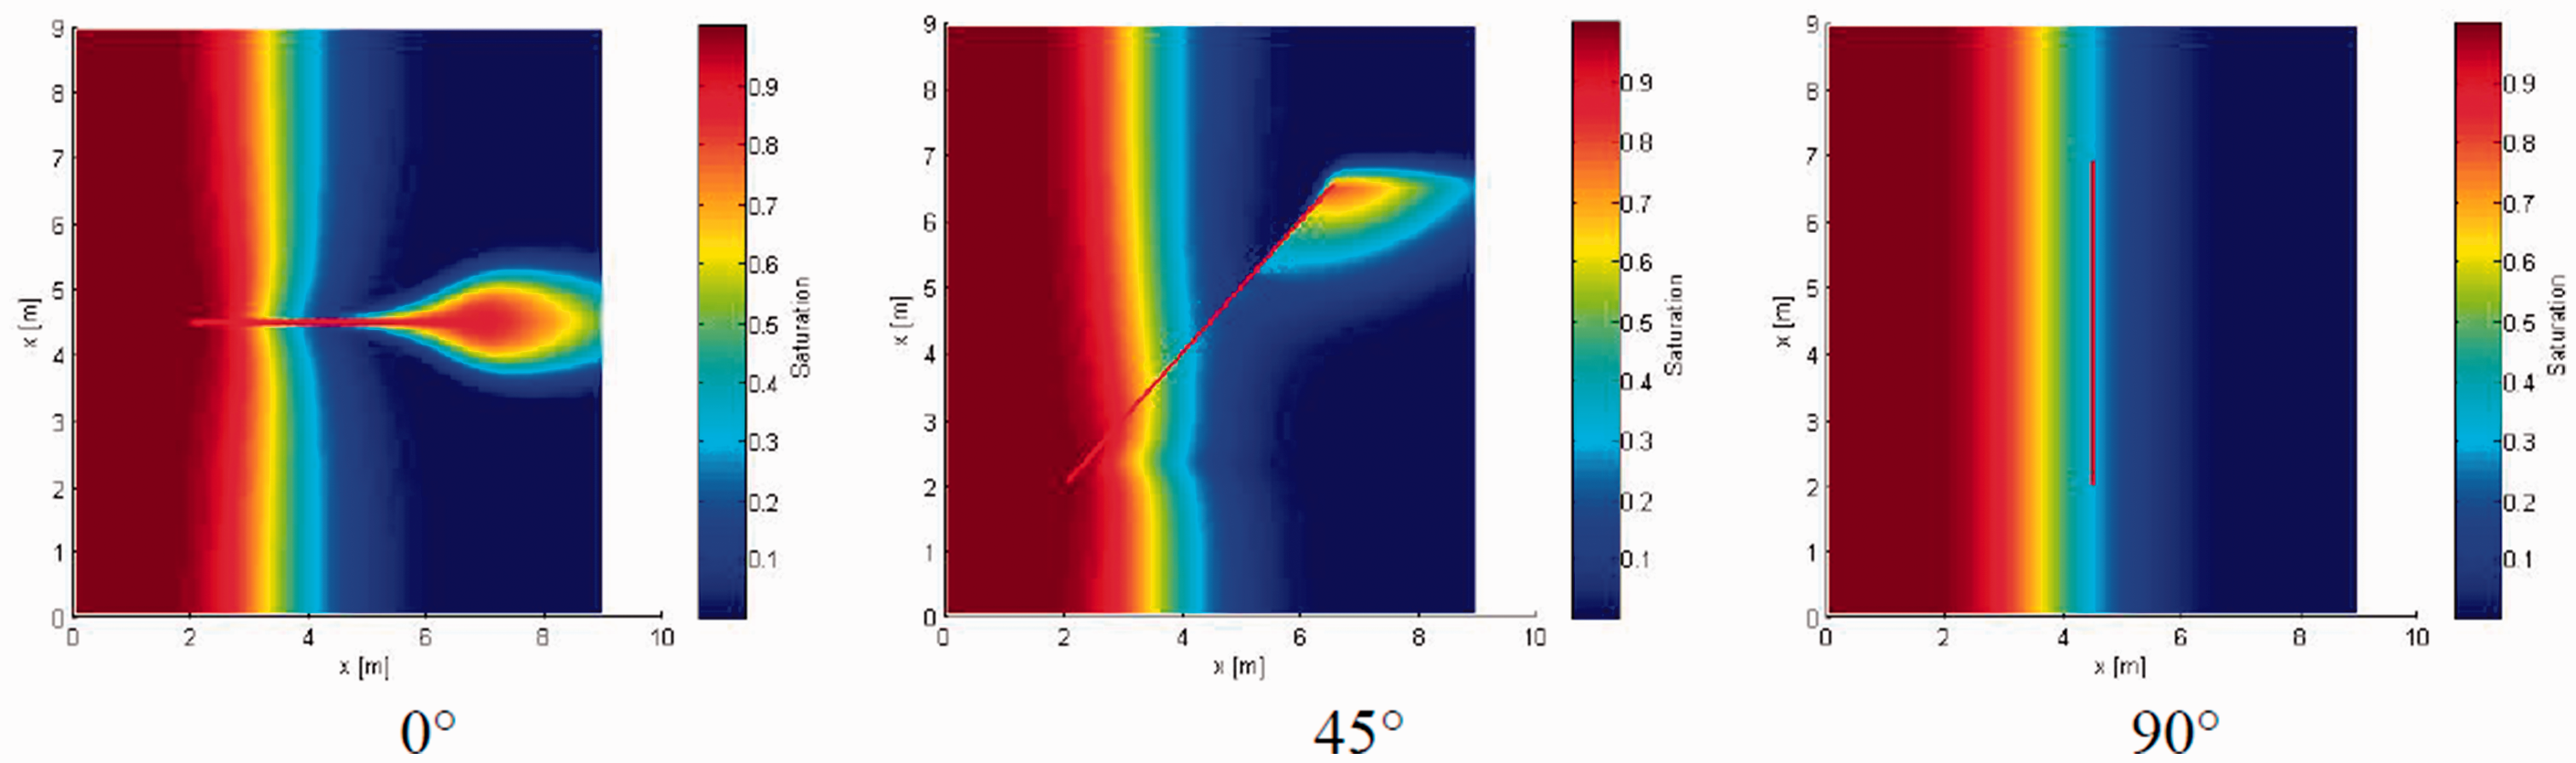
Fluid transport with different fracture orientations.
Effect of fracture intersection
Figures 8 and 9 show that the effect of fracture intersections on fluid transport and pressure distribution. The interference of fracture intersection on pressure field and seepage flow is studied. The fluid transport with different fracture intersections is described as follows. When the two perpendicular intersected fractures are in the middle of the domain, only one fracture which is parallel to streamline has a contribution to the fluid flow and the pressure conduction. It illustrates that the intersection is invalid if one intersecting fracture not served as a part of main-stream channels. As fractures rotate 45 degree intersection in the domain, the pressure distribution becomes more heterogeneous and each fracture begins to contribute the flowing of fluid. With the intersection closes to 15 degree, both fractures gradually parallel to main streamline, the more fluid transport is, the faster pressure conduction rate is.
Pressure distribution with different fracture intersection degrees.
Fluid transport with different fracture intersection degrees.
Multi-scale fractures simulation
Based on the previous verified model, a numerical simulation of the multi-scale complex fracture model is studied. The number of fractures increases to 10 and the domain in a 500 by 500 m domain. The inlet pressure increases to 50 × 105 Pa. The fractures are distributed in arbitrary angles and different scales as shown in Figure 10.
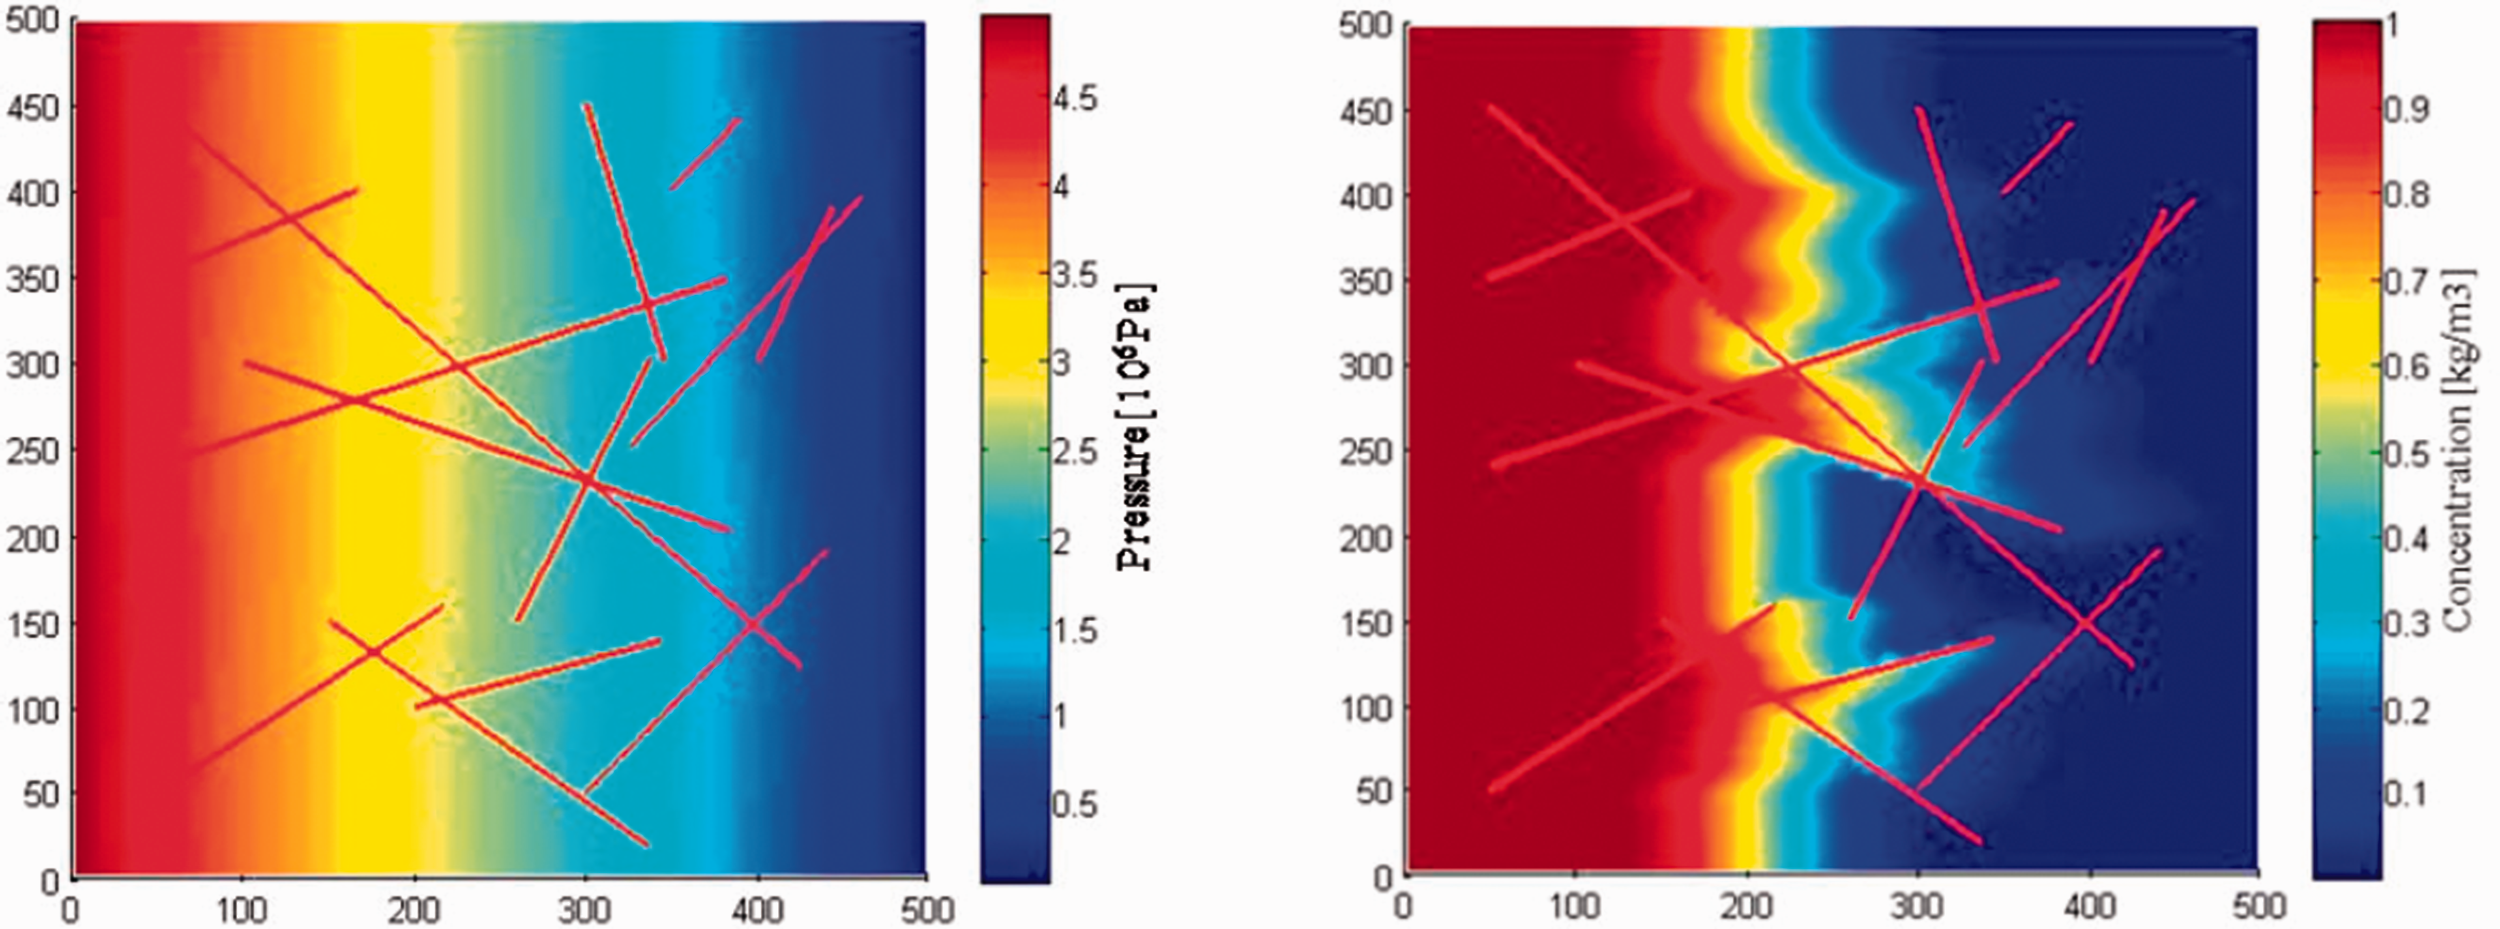
The simulation study of the multi-scale fracture model (500 by 500 m domain): (a) Pressure distribution and (b) Fluid transport.
Figure 10(b) shows that the flow front distributes unevenly, which is caused by the permeability contrast between fracture and matrix. The higher permeable fracture and the effective intersection (which tend to main streamline direction) lead to larger pressure drops and higher flow rate. This is happened because the fracture allows the fluid flow through the domain earlier than the matrix. When the longer scale fracture penetrates into matrix, more fluid gathers into fractures and the flow is enhanced more than the smaller scale fracture. Also, the pressure distribution is more heterogeneity at the two ends of the larger scale fracture as shown in Figure 10(a).
The fracture pattern effect on production in M field
M field, located in West Africa, is a granite fractured reservoir. The net pay is 100 m, drainage radius is 50 m. Fluid viscosity is 4.66 cp. Matrix permeability is about 10∼50 mD and porosity is 3∼11%. Fracture density is 0.7∼2 per meter. Fracture width is 0.16∼0.22 mm. fracture orientation ranges from 20 to 75 degree. The well model and complex fracture network as shown in Figure 11(a) and pressure distribution as shown in Figure 11(b). In this model, the fluid is compressible. Single phase flow. Darcy flow in the matrix, while flow in the fracture system is related to fracture width, so fracture permeability changes accordingly. Fluid flow into the wellbore only through fractures while the matrix contribution is not considered. The simulation result is verified by actual production data, the relative error is less than 5%, as shown in Figure 12.
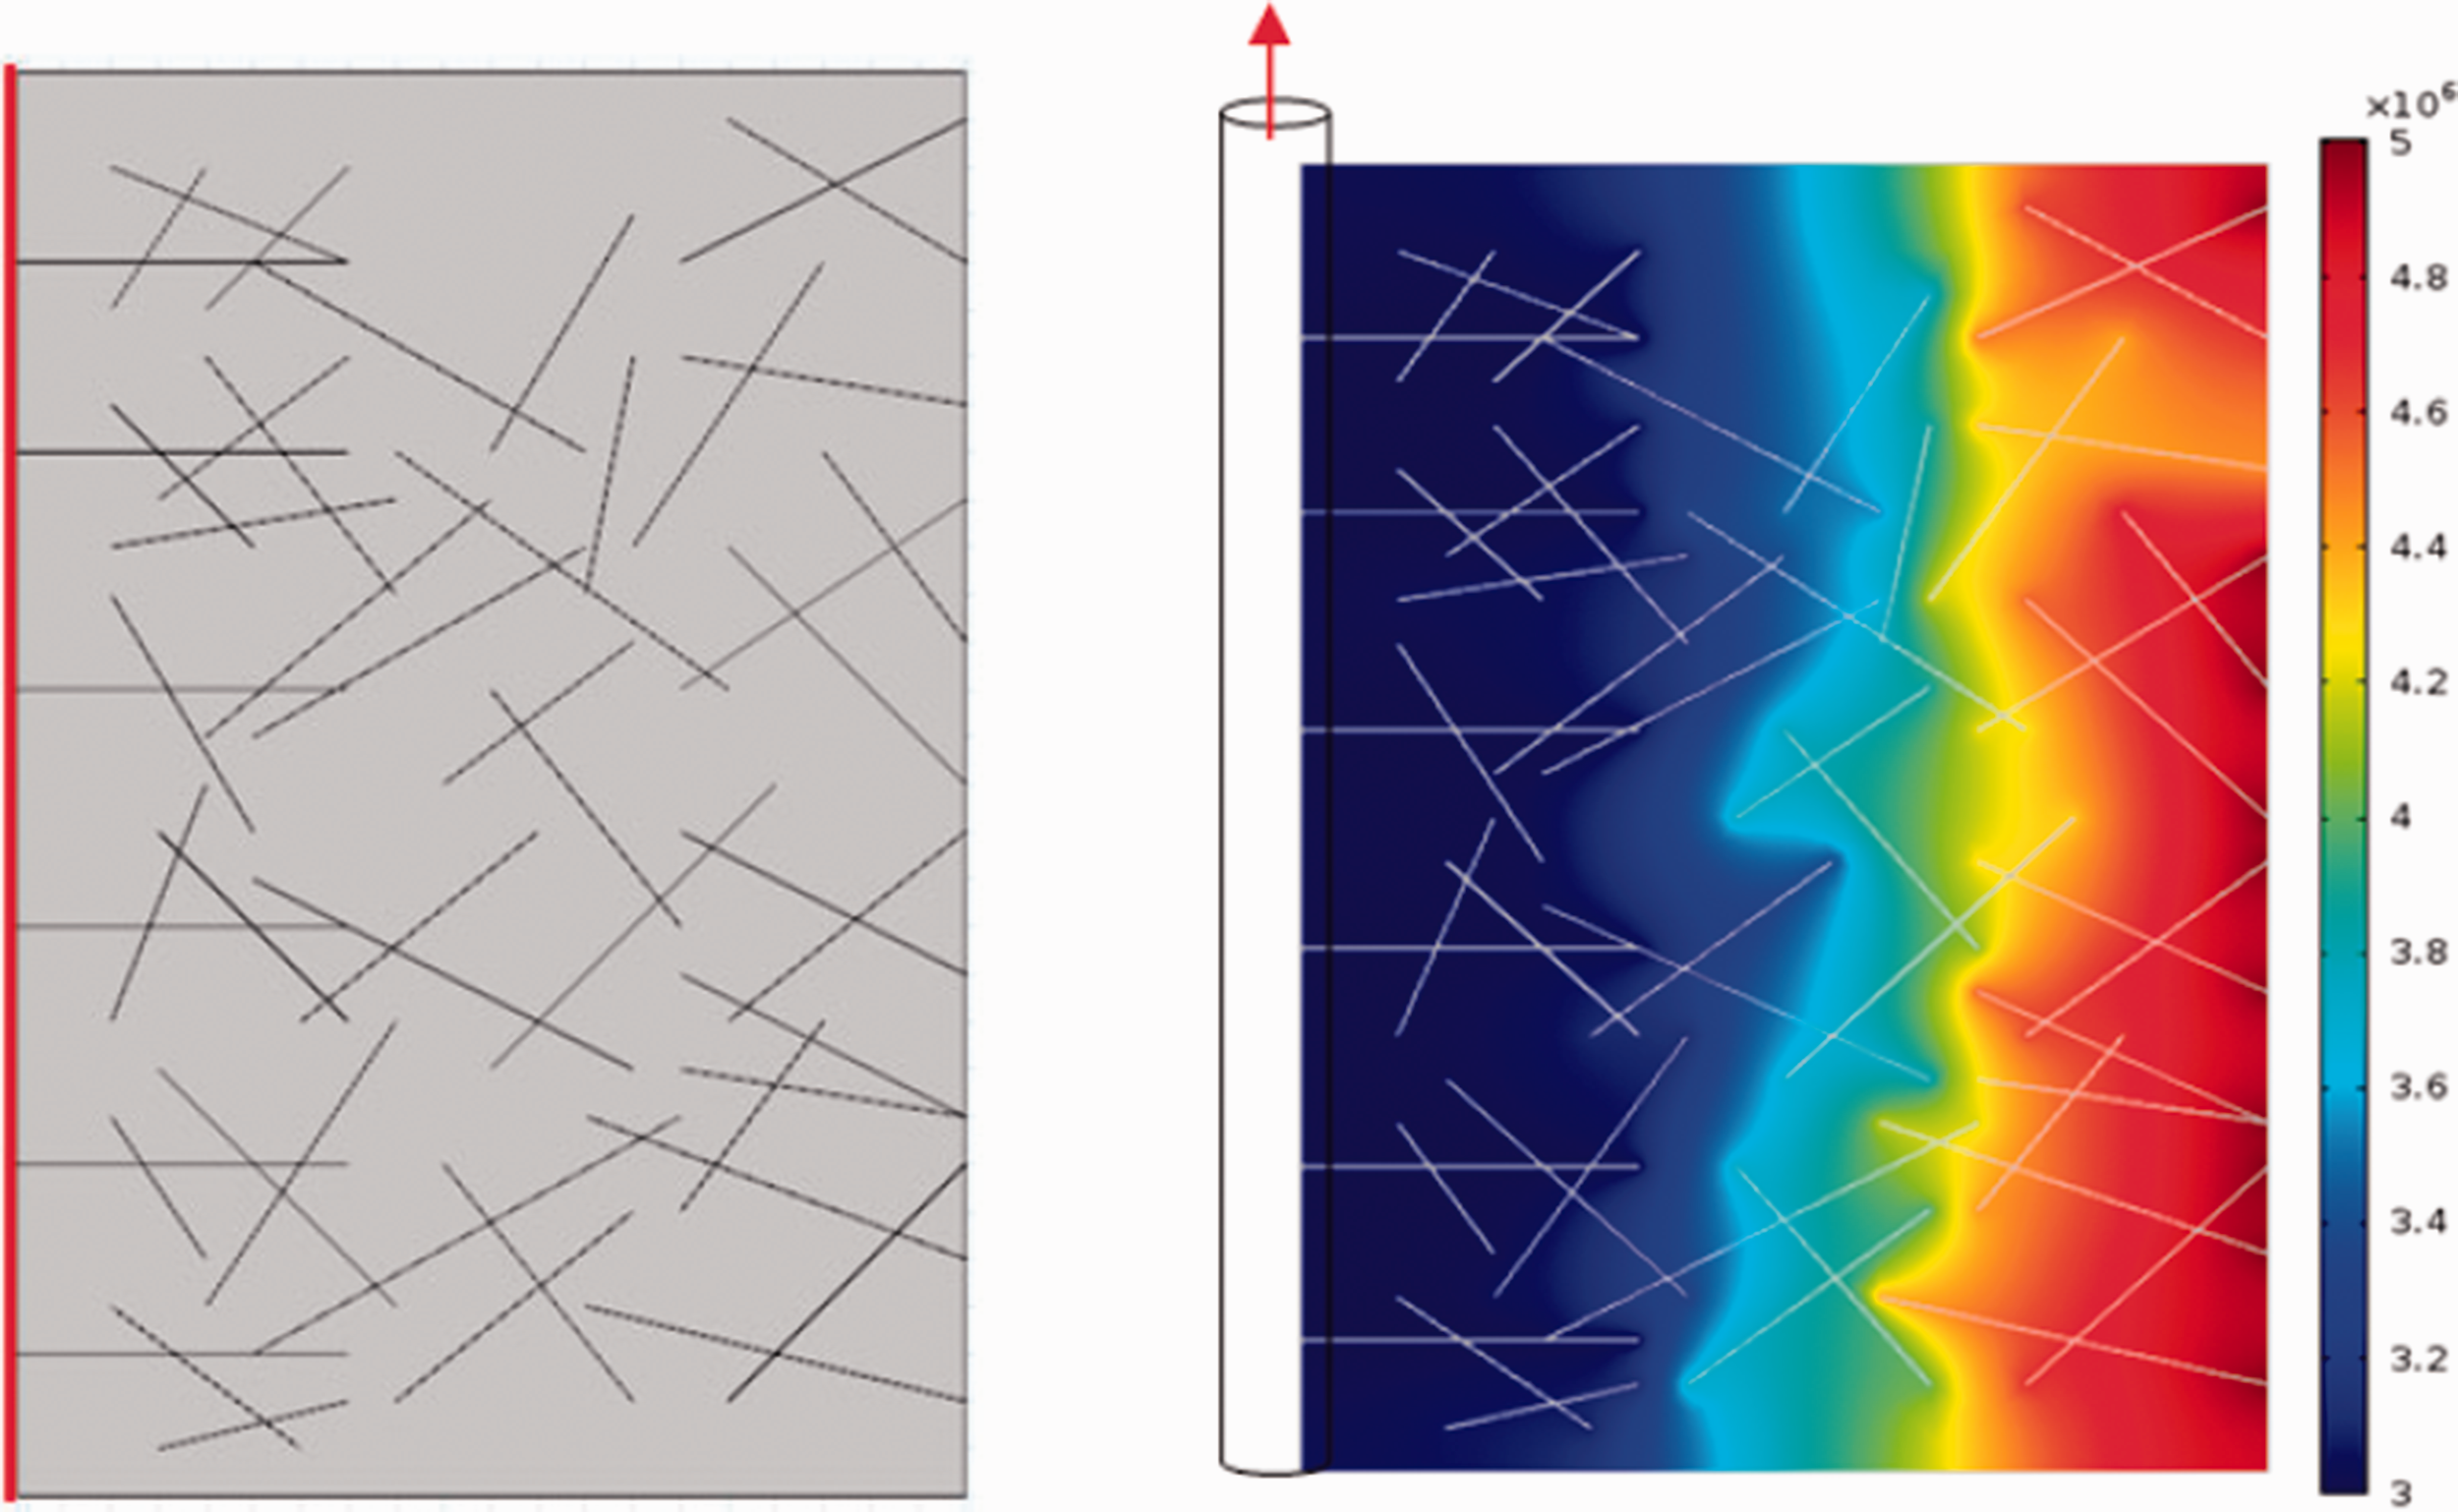
The simulation for a well in M field: (a) Geometry of discrete fracture network near the wellbore and (b) Pressure distribution near the wellbore.
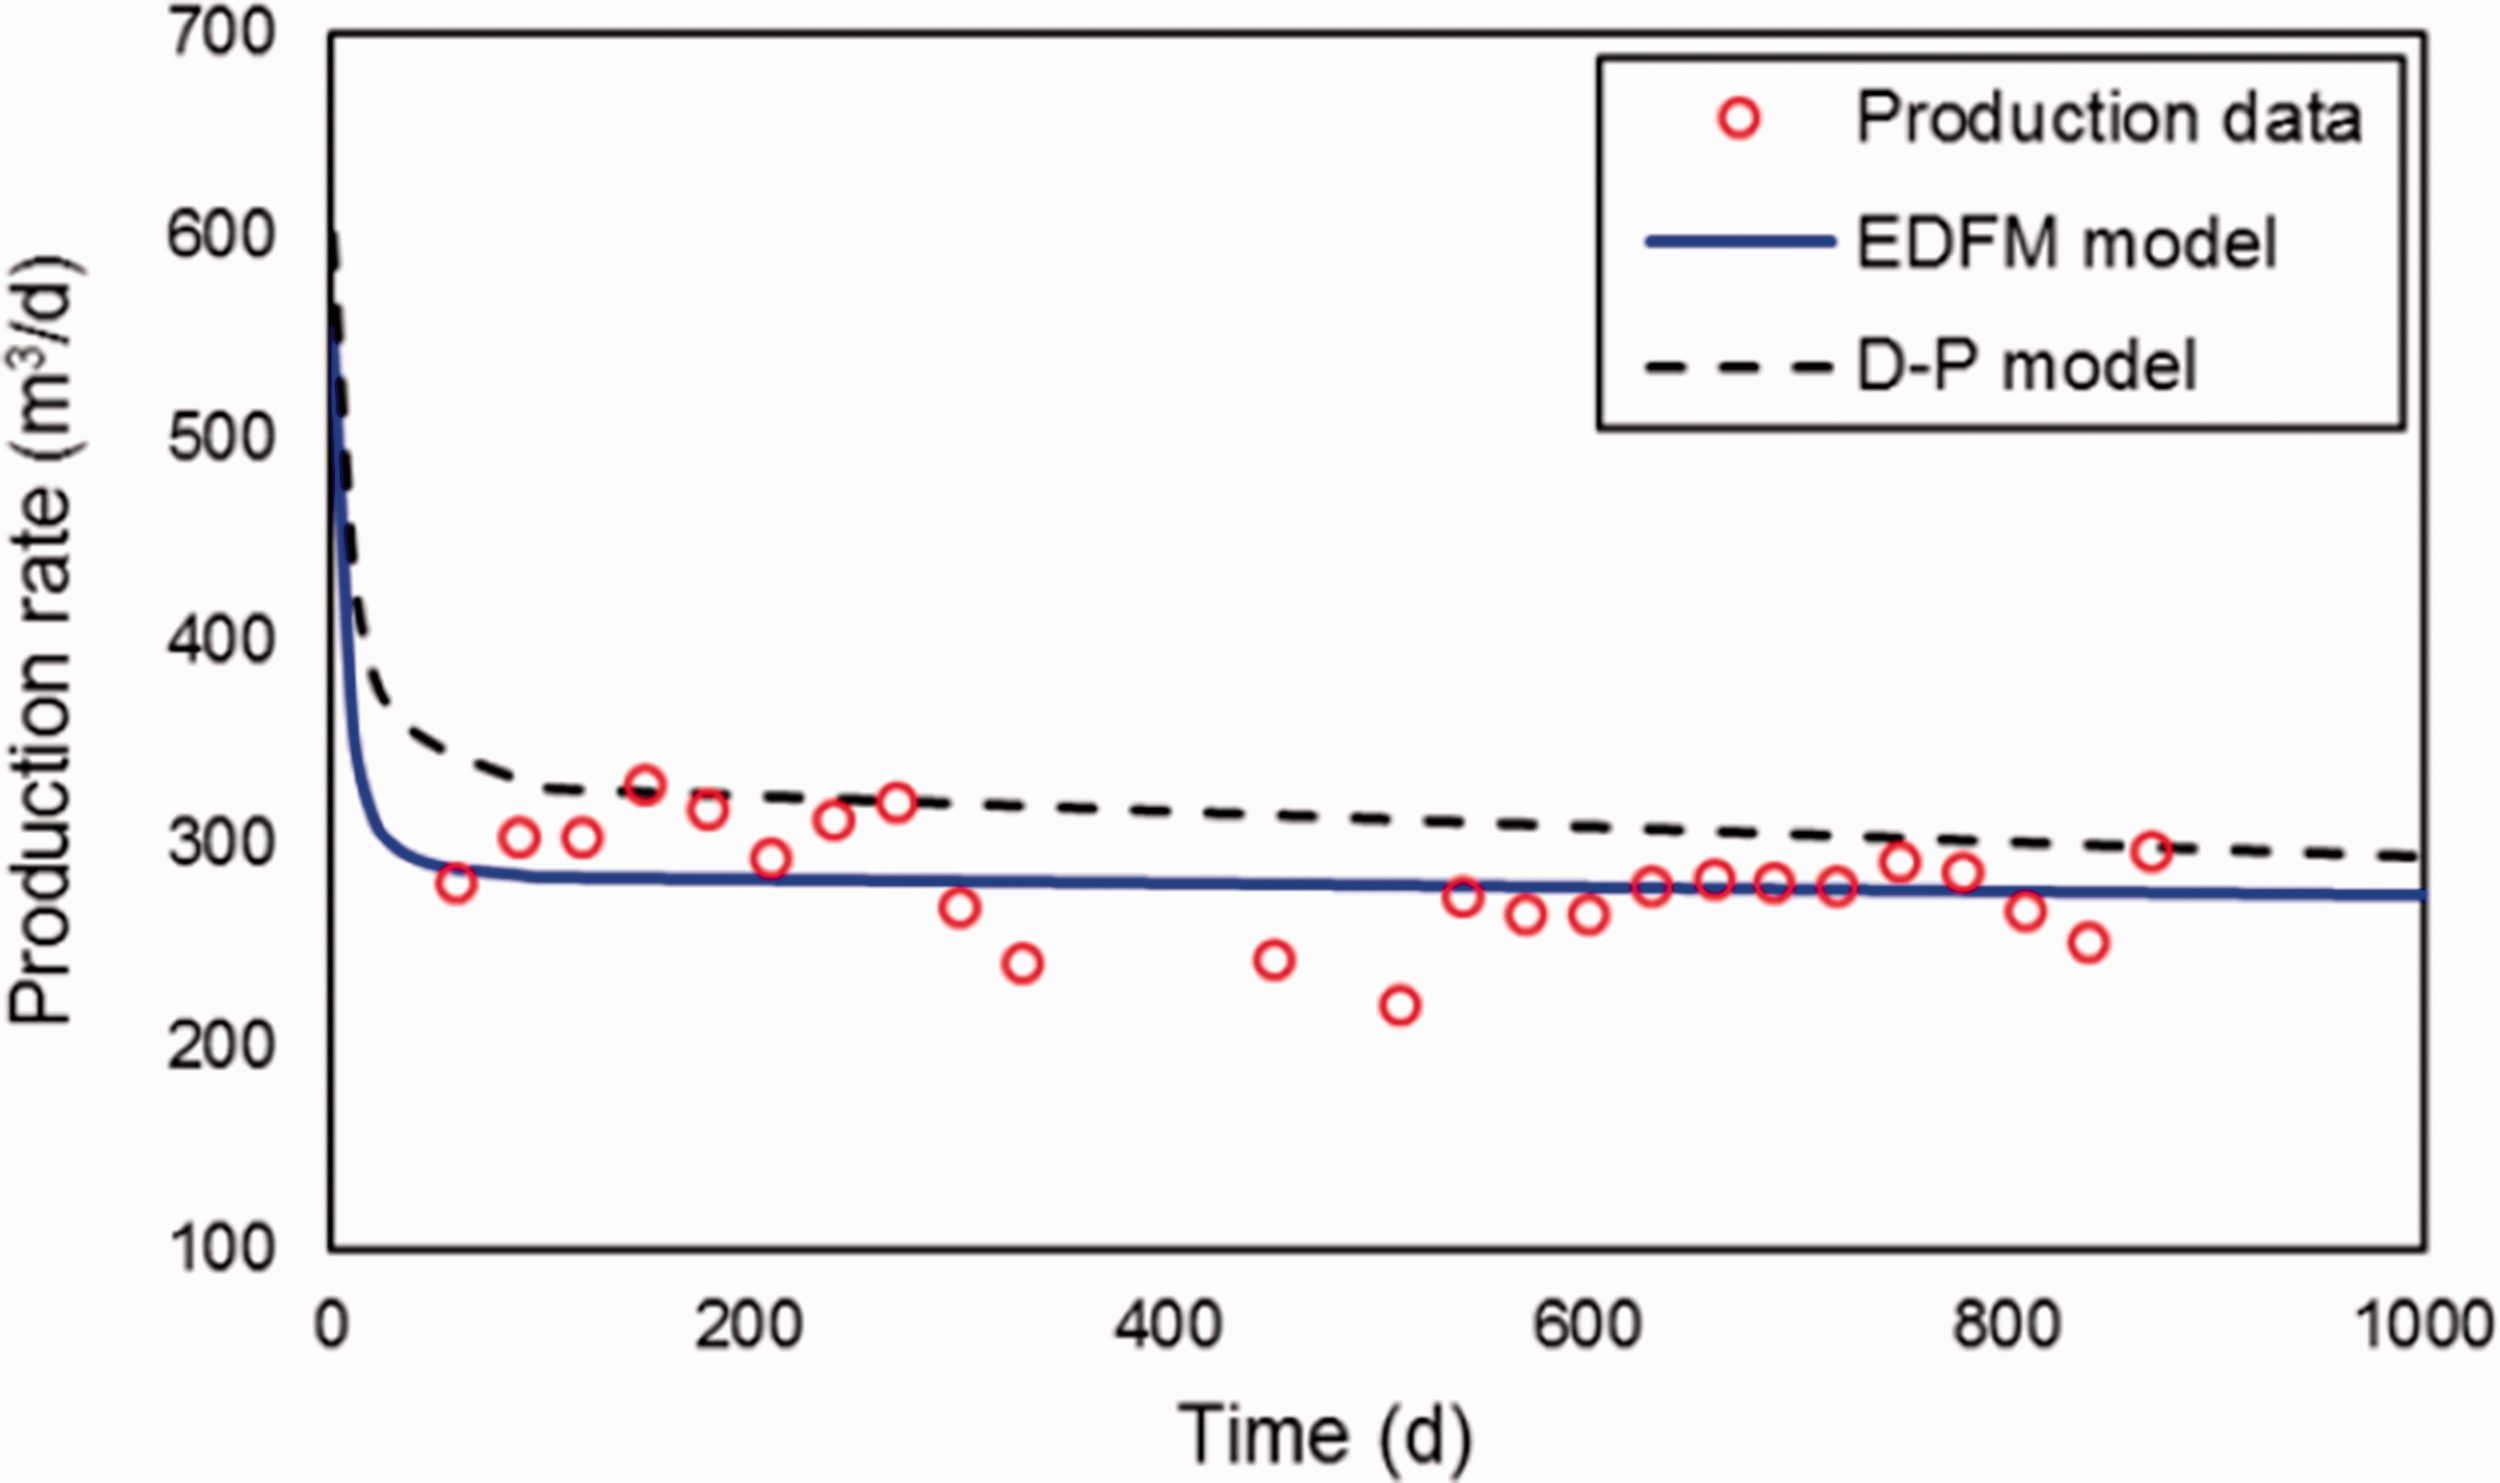
The simulation results related to the comparison of EDFM, D-P model and practical production data.
The effect of the fracture orientation
Figure 13 shows the effect of fracture orientation on well production. As the angle between fracture and wellbore increases, the higher the well production is. When the fracture is perpendicular to the wellbore, which fracture orientation is zero degree, the max production rate will be achieved. This is due to the direction of fluid flow is that of maximum fracture permeability.
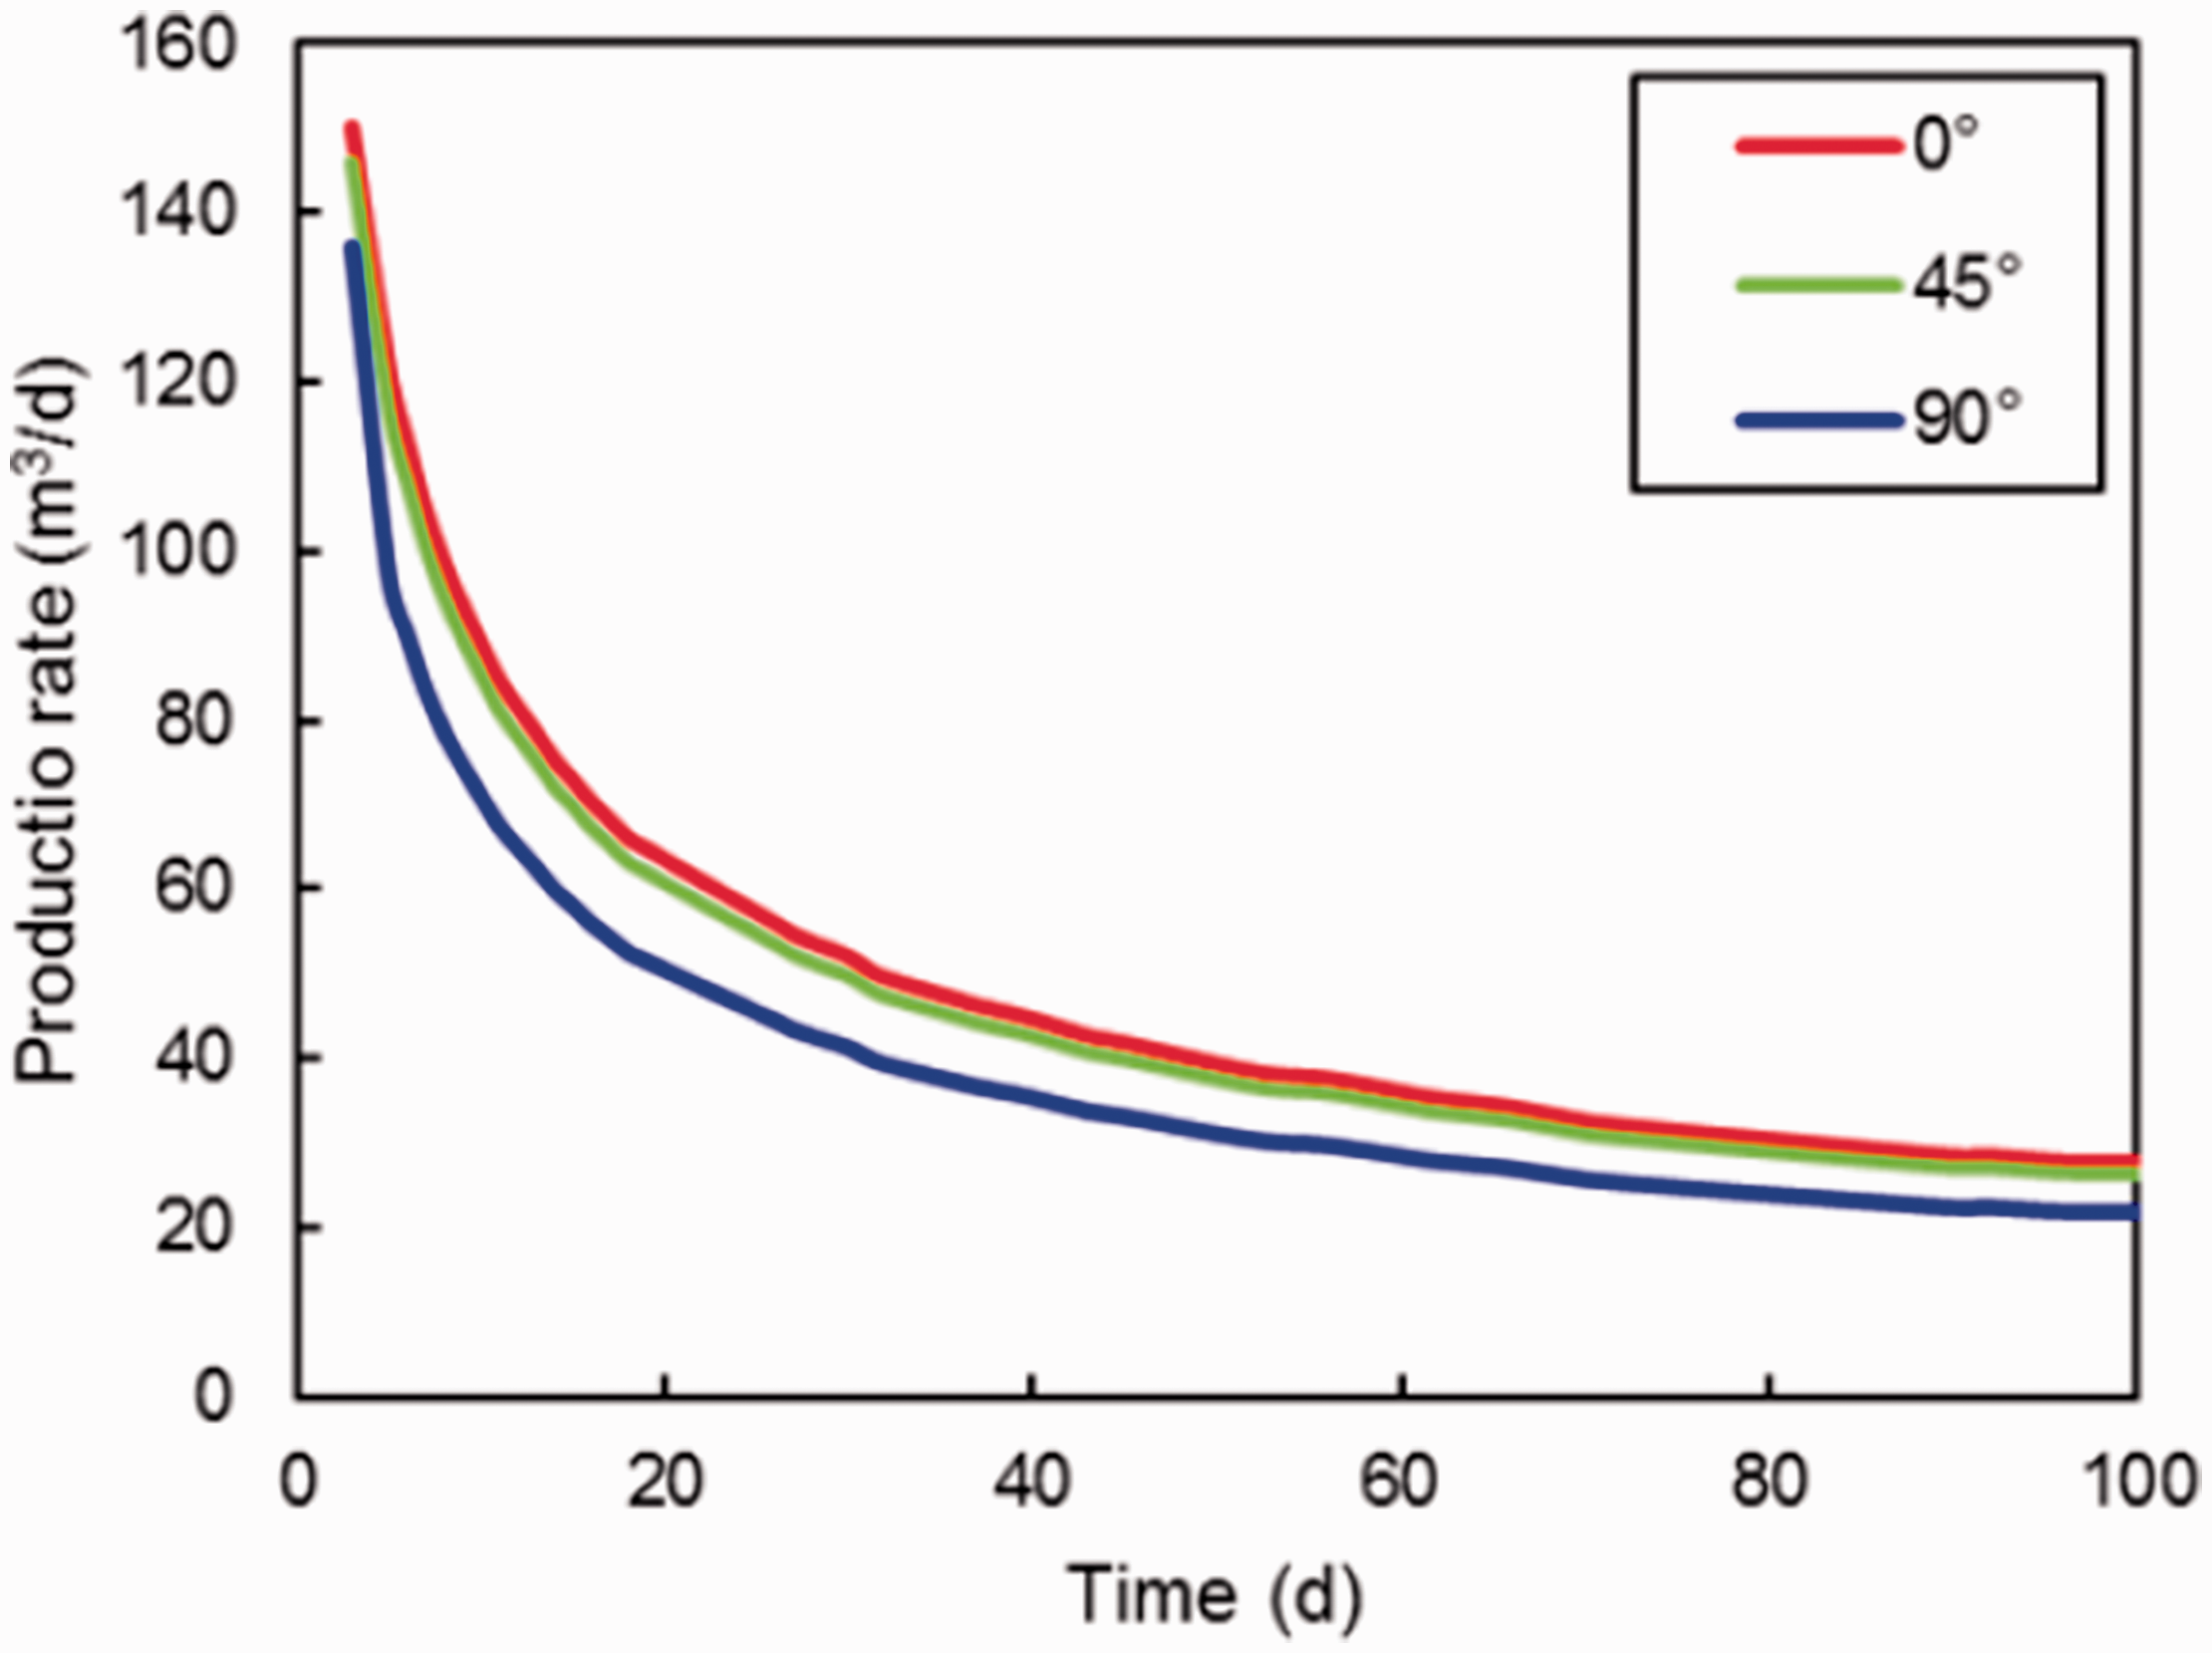
The fracture orientation effect on production in M field.
The effect of the fracture numbers
Figure 14 indicates the effect of fracture numbers on well production. As fracture numbers increase, the well production increases accordingly. Since more fractures were drilled and communicated with wellbore, the flow resistance reduced and pressure sweep area increased so that the production enhanced. With fracture increase continuously, the well production increases slowly. This is due to fracture spacing becoming more compact, the increase of flow interference between fractures.
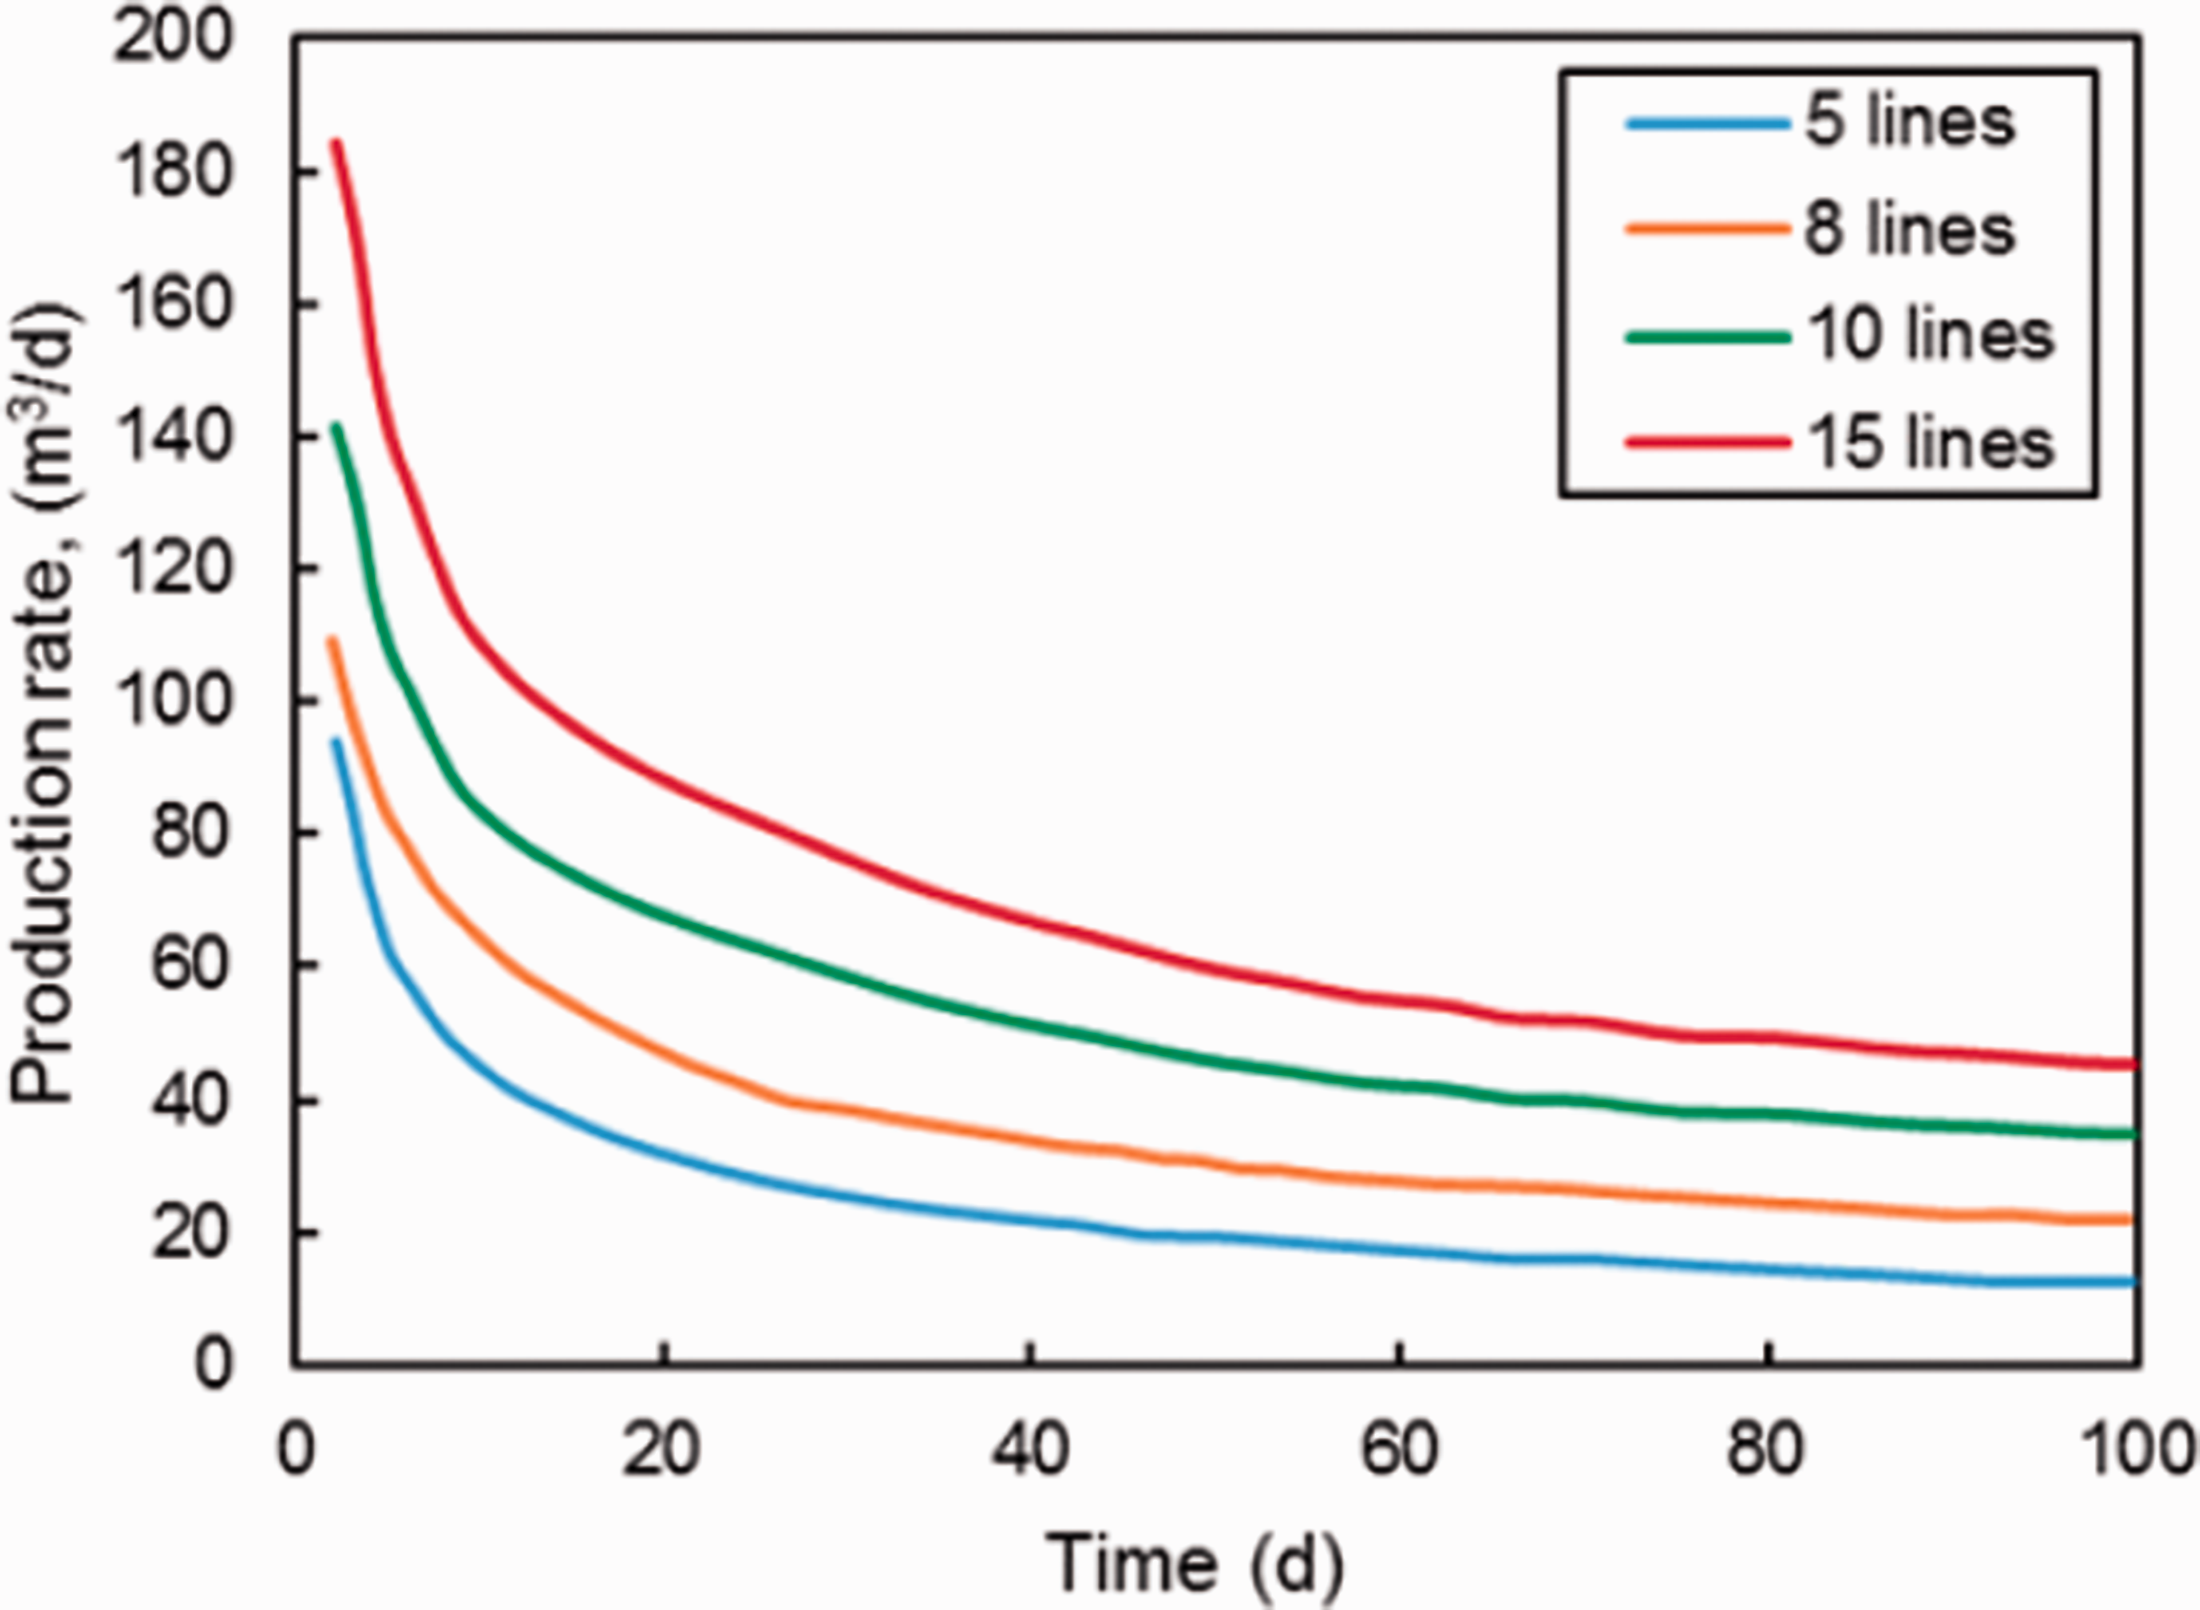
The fracture numbers effect on production in M field.
The effect of the fracture permeability
Figure 15 shows the effect of fracture permeability on well production. As fracture permeability increases, more fluid flows into the wellbore, then the production rate increased by 40%. Furthermore, if the fracture permeability continues to increase from 800 to 1000 mD, the production increase has slowed down. With the fracture permeability increase to 1500 mD, the production rate reaches a certain value. This is due to the capacity of fluid flowing from the matrix to the fracture is limited at the location of the fracture reservoir.
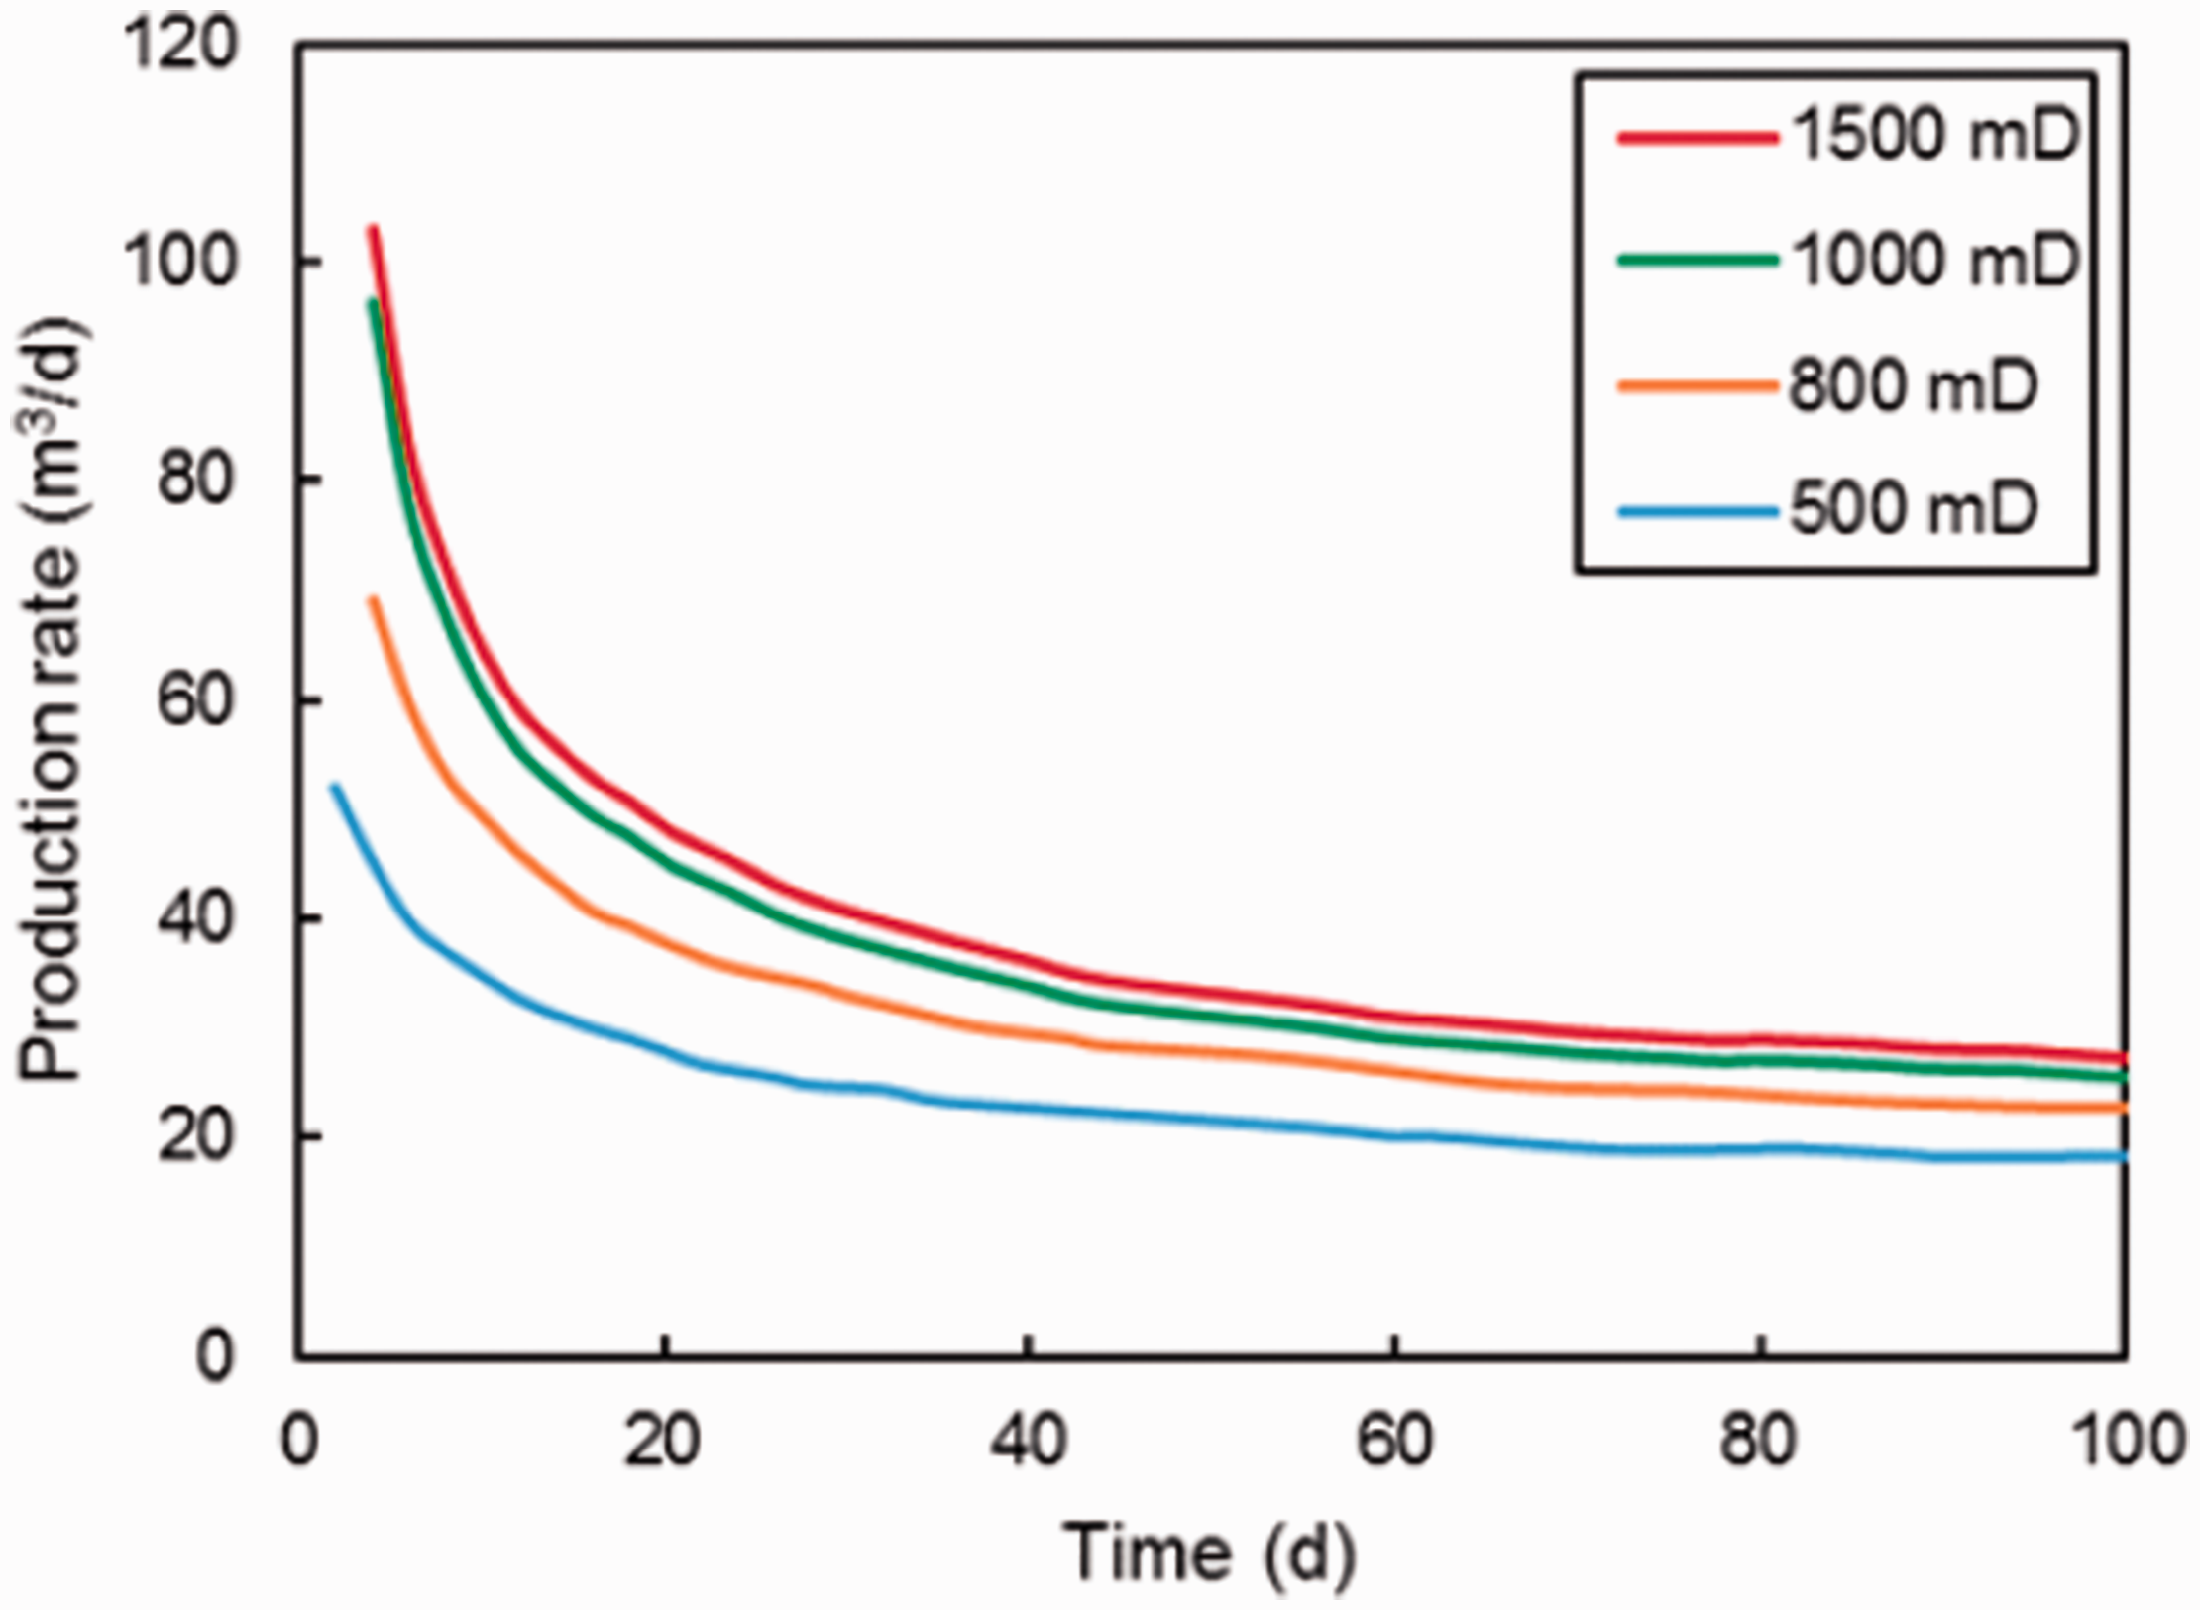
The fracture permeability effect on production in M field.
The effect of fracture to matrix permeability ratio
From the vertical zone in M field, the reservoir divided into weathering and fracture zone. When drilling in different reservoir, the production rates are varying. Based on fracture permeability ranges in 10∼50 mD and matrix permeability are 500 ∼1500 mD in vertical zone. The effect of fracture to matrix permeability ratio on well production is studied, as shown in Figure 16.
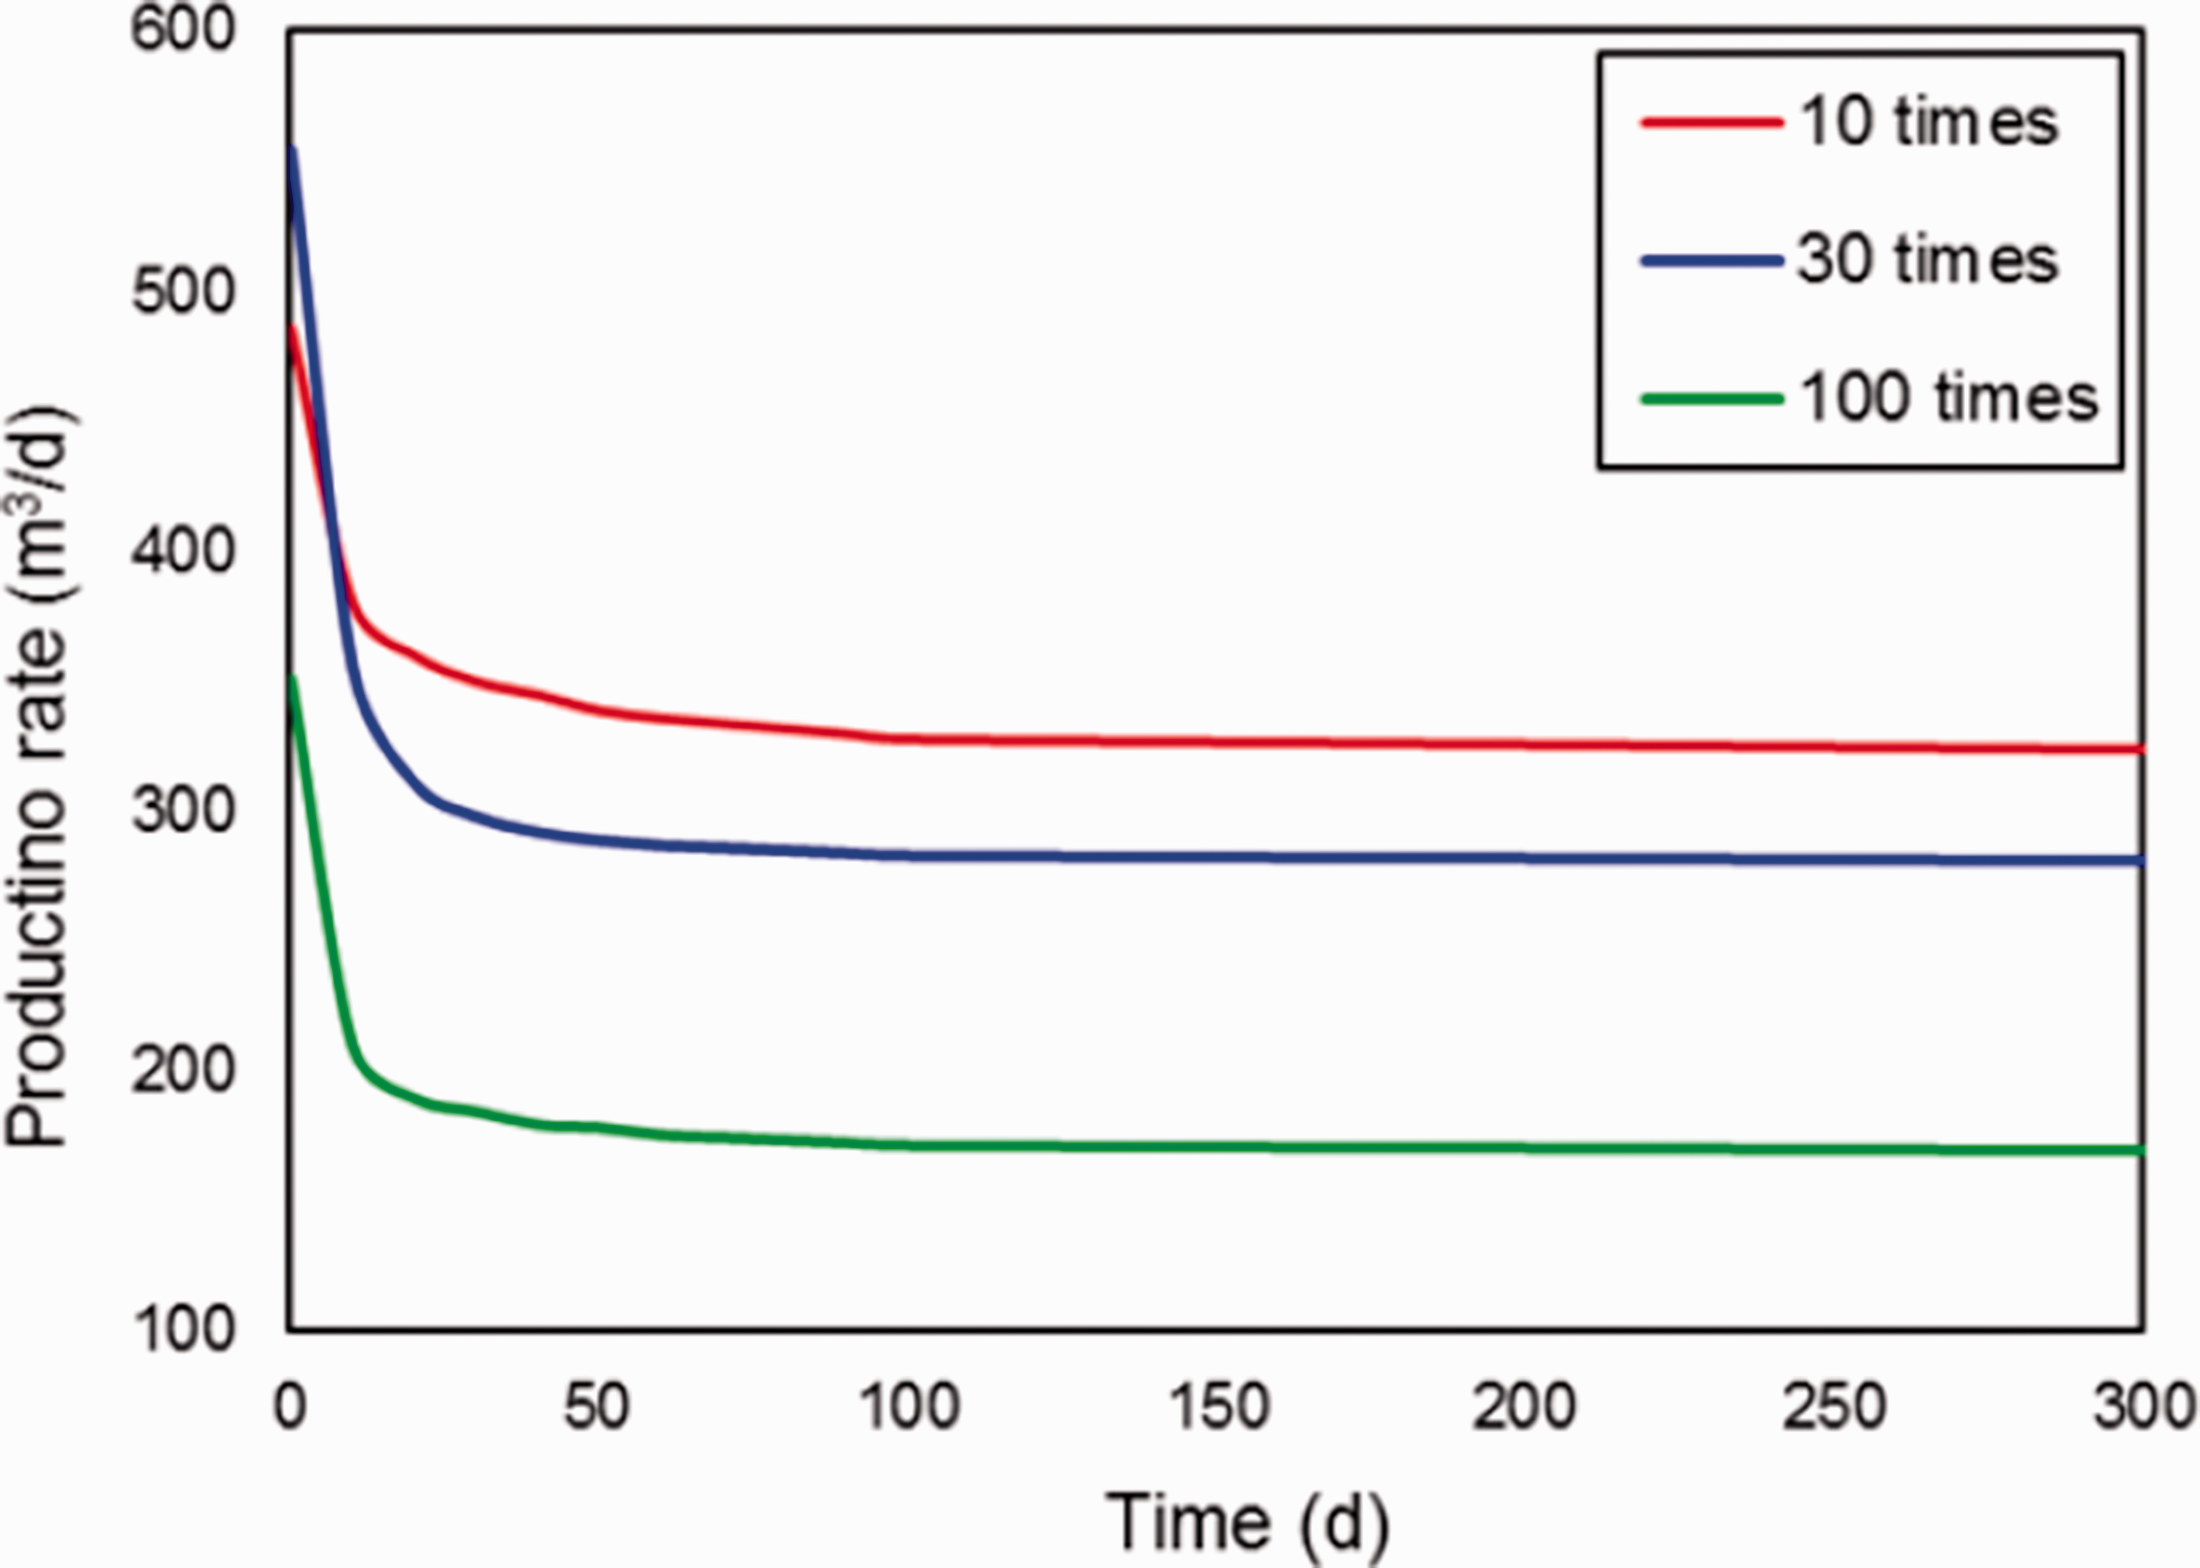
The ratio of fracture to matrix permeability effect on production in M field.
As fracture to matrix permeability ratio is 10 times, the permeability difference between fracture and matrix is little, permeability and pressure distribution near the wellbore is homogenous, the reservoir with good communication, so as to obtain high well production. When the ratio of fracture permeability to matrix permeability gradually increases to 30 times, the more uneven the pressure distribution near the wellbore, the faster the pressure decline, lower well production achieved. Furthermore, if the difference between fracture permeability and matrix permeability increases to 100 times, indicating the fractures are main flow channel. Pressure distribution near the wellbore is extremely uneven, the well pressure and production declined dramatically.
Conclusions
In this study, a new productivity model based on EDFM has been established and the mathematic seepage flow model of both matrix and fracture systems are given. The implementation of new EDFM is validated with the reference model (Pluimers, 2015) and a good agreement is observed. The new model is more efficient than the reference model. When fracture orientation tends to parallel the mainstream line, the pressure drop at two sides of fracture becomes larger and more fluid transport through the fracture. If the intersecting fracture cannot serve as part of main-stream channels, the intersection is meaningless. The simulation of multi-scale fracture model indicates that the heterogeneity of the flow front happens due to the large permeability contrast between fracture and matrix. The pressure drop in large-scale fractures network is higher than in the small-scale fractures. Thus, the fracture pattern has a big impact on fluid transport in the FPM. Several simulation cases are established for production study in M field to study the fractures effect on production. The results show that with increases of fracture to matrix permeability ratio, production decreases and pressure distributes unevenly; With fracture numbers and permeability increase, the growth of production is limited. The study has a potential limitation. The current implementation of the EDFM uses a first order upwind approximation for the advection term, which introduces some artificial numerical diffusion. Multiple approaches will be used to treat the advection term of transport equation.