
Abstract
In order to understand the pore structures of the Middle Jurassic Xishanyao Formation in the Junggar Basin, 11 shale samples from a single well were picked and were subjected to several analyses including mineralogy, (programmed) Rock-Eval pyrolysis for geochemical and N2 adsorption for pore structure analysis. The results showed that the mean value of total organic carbon (TOC) content of these samples is around 1.54% while Tmax varies between 429 to 443°C, indicating they are in the oil window. Mineral assemblages of the samples is mainly quartz and clay (illite, chlorite and kaolinite). Moreover, negative correlations between the K-feldspar/plagioclase and micro-mesopore volume was found, depicting that few of such pore sizes exist in these two abundant minerals. In contrast, micro, meso and macro pores all were detected in clay minerals. Particularly, the pores with radii of around 5.35 nm were abundant in clay minerals and there was not a robust relationship between the organic matter, surface area and pore volume. Finally, fractal analysis was performed to better delineate heterogenous characteristics of pore structures which showed that D2 (representing the larger pores) is greater than D1 (smaller pores). In addition, the differences between the fractal dimensions of the adsorption and desorption (D2d–D2a) branches to better interpret the hysteresis, was defined. The positive correlation between the (D2d–D2a) and the meso-macro pore volume, pointed out that the meso-macro condensation is the main reason for hysteresis that was observed in N2 adsorption experiments in the Xishanyao Shale samples.
Introduction
Organic rich shales have historically been the source rock, but due to recent advancements in technology they are the new target for oil and gas production and have increased in importance (Zou et al., 2019; Liu et al., 2021). Tiny pores in shale formations are the main storage space for gas and oil, however their connectivity could dramatically affect the transport of these resources during production. Considering the extremely low porosity and permeability of such rock types (Clarkson et al., 2013), characterization of their pore structures is more challenging.
Based on what was said above, the International Union of Pure and Applied Chemistry (IUPAC, 1994) divides pores into three categories: micro-pores (<2nm), meso-pores (2-50nm) and macro-pores (>50nm) while several studies have already proven that abundant smaller pores (less than 100 nm) exist in shale gas and oil reservoirs (Clarkson et al., 2013; Liu et al., 2019a, 2020; Loucks et al., 2009; Mastalerz et al., 2012). Technology advancement has made characterization of tight pores possible and can be categorized into two separate groups: 1) fluid invasion methods such as helium, gas adsorption, and high pressure mercury intrusion are used to detect connected pores, some of these methods, such as high pressure mercury intrusion is destructive, 2) image analysis based methods, such as electron microscopy (SEM for 2 D images and focused ion beam- SEM for 3D images), computed tomography (CT), small angle neutron scattering (SANS), and ultra-small angle neutron scattering (USANS). Comparing these two separate methods, shows the latter one exhibits some advantages: for example, SEM images can directly provide us with pore information (pore shape, type and spatial distribution) and their configurations. Another advantage is that some of the images can present and differentiate between both connected and isolated pores, such as CT and SANS (USANS) that can ultimately better characterize the pore structures (Gou and Xu, 2019; Klaver et al., 2015; Labani et al., 2013; Yang et al., 2017; Zhang et al., 2016).
China has a large amount of shale resources and about 35 separate organic rich shale units from Mesoproterozoic through Cenozoic strata with more to be found (Zou et al., 2019). The Middle Jurassic Xishanyao Formation is one of these rock units which is widely distributed in western China and is spread over several basins such as the Junggar Basin, Turpan-Hami Basin, Yili Basin and Santanghu Basin, with abundant resources of coal and coalbed methane as well as hydrocarbons (Feng et al., 2019; Li et al., 2018, 2019; Qin et al., 2020). During the paleo-lake flooding, the Xishanyao Formation, located in the Junggar Basin, was developed by typical gray-black mudstone depositions interbedded with coal (Li et al., 2019). In the Junggar Basin, main studies have been focused on the Lucaogou Formation which is a typical shale oil reservoir in Northwestern China (Liu et al., 2017a) while studies on the Xishanyao Formation are very limited. Feng et al. (2019) carried out the geochemical analysis of the Xishanyao Shale Formation and found that vitrinite is the most abundant maceral in the Xishanyao Formation. However, studies that focus on the pore structures of the Xishanyao Formation are rarely conducted.
When the pore structure of shale is being investigated via adsorption methods the morphology of the isotherms provides us with important information. In this regard, hysteresis is defined as the difference between the adsorption and desorption branch; which can be due to several reasons such as the capillary condensation due to the adsorption metastability or the pore blocking phenomenon such as the existence of ink-bottle pores (Rouquerol et al., 1994). The hysteresis is an important parameter in understanding the gas recovery and CO2 sequestration that has been studied by many researchers (Burgess et al., 1989; Monson, 2012; Wang et al., 2016). However, the hysteresis phenomenon is still limited and poorly understood in the Xishanyao shale which can impact future exploitation from this rock unit. For the samples with the meso-macro pores, during the adsorption process, molecules get adsorbed layer by layer on the surface (filling higher energy sites nearer to the pore wall, then lower energy sites away from the wall). When molecules are accumulated on two opposing walls, and get close enough to each other, they collapse into a thermodynamically lower energy state, which is also called capillary condensation. However, during the desorption, as the adsorption pressure decreases, the molecules that are at a lower energy tend to stay in their place, so a higher gradient of chemical potential (or equivalently pressure drop) would be needed to pull the adsorbed molecules out of their sites. Therefore, under the same adsorption pressure, the number of molecules on the desorption branch will become larger than the adsorption branch, causing an increase in the surface roughness.
In this study, several samples from the Xishanyao Shale Formation are selected to: 1) characterize mineral compositions and geochemical properties, 2) understand the pore structures, 3) correlate the rock compositions to the pore structures.
Geological setting
The Junggar Basin is located in the northern part of the Xinjiang Uygur Autonomous Region and is sandwiched between the Tianshan Orogenic Belt and the Altai Orogenic Belt (Figure 1(a) and (b); Carroll and Bohacs, 2001). The two sides are bound by the eastern and western Junggar structural belts. The plane shape is wide in the south and gets narrower in the north, slightly triangular, with a total area of 1.3 × 10⁵ km2. The southern margin of the Junggar Basin has a foreland nature. In the late Neogene, influenced by the long-range impact of the Indian-Asia-Europe continent collision, the northern Tianshan Mountains were pushed north to form a three-row fold-wrapped belt. The structural strength of the three rows of pleated thrust belts is gradually weakened from south to north, and the structural style is wound into the folds from the base of the first row, and the fault folds of the second row gradually transition to the fault propagation folds of the third row (Zhao et al., 2003).
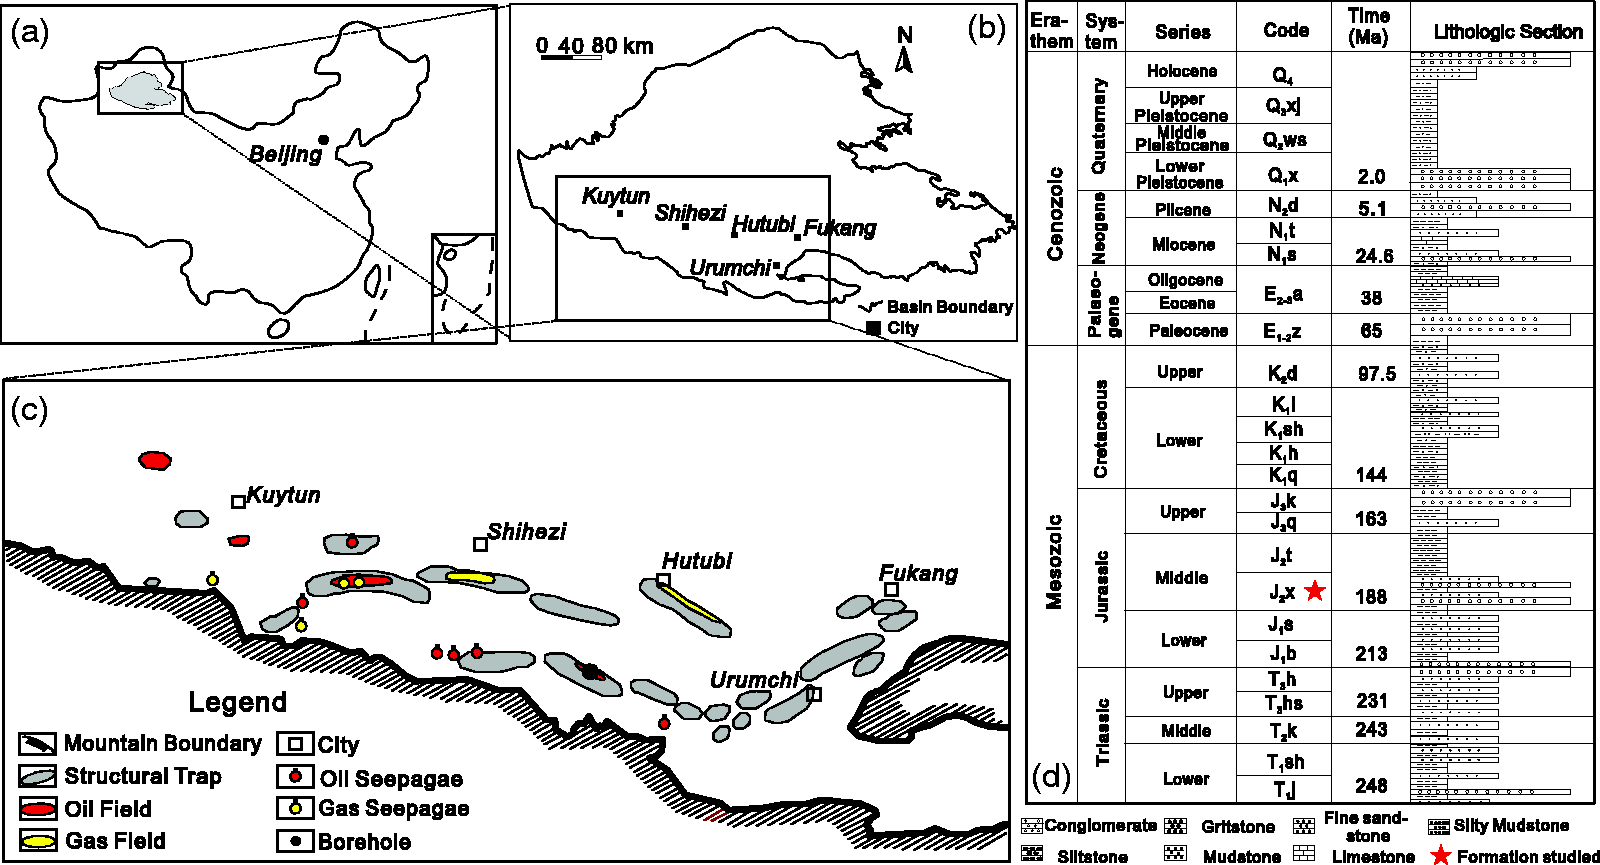
Geological settings of the Junggar Basin.
Since the Mesozoic, the southern margin of the Junggar Basin has continued to settle, and many sets of thick continental source clastic rocks are dominated by lacustrine facies, alluvial fan facies, and braided river delta facies (Yang et al., 2013). Additionally, the formation of lake and marsh phase coal-series mudstones, oxidized broad-shallow lake paste mudstones, and lake-facies mud cover has occurred. From bottom to top, there are the Middle and Upper Triassic Xiaoquangou Group (T2-3xq) (gray-green mudstone), the Lower Jurassic Badaowan Formation (J1b), the Sangonghe Formation (J1s), and the Middle Jurassic Xishanyao Formation (J2x) (gray-black coal-series mudstone), Middle Jurassic Toutunhe Formation (J2t) (purple-red mudstone), Lower Cretaceous Hutubihe Formation (K1h) (reddish-brown mudstone), Paleocene Ziniquanzi Formation (E1-2z) (Purple-red mudstone), and Taxihe Formation (N1t) (light gray creamy mudstone) (Figure 1(d)). Among them, the Middle and Lower Jurassic gray-black coal-series mudstone is an important source rock stratum in this area (Li et al., 2012). The organic matter types of the Jurassic source rocks are mainly type II-III, and the organic carbon content (TOC) varies between 0.5% and 1.6%, which is a medium-excellent source rock with vitrinite reflectance (%VRo) measured between 0.7%∼2.1% (mature and high mature evolution) (Li et al., 2018).
Samples and methods
Samples
Due to limited availability of cores, 11 shale samples that were retrieved from a single borehole (Figure 1(c)) with the depth of 1122 m to 2264 m, from the Middle Jurassic Xishanyao Formation (J2x), were picked to study the pore structures extensively. Samples are taken from the typical gray-black shale facies while some showed evidences of black phytodetritus, with each sample weighing approximately 100 gr.
Mineral compositions
X-ray diffraction (XRD) was used for mineral composition analysis (Liu et al., 2019b) where a total of 11 samples were cleaned from drilling contaminants, and dried using isopropyl alcohol. After being crushed into fine powders (particle size smaller than 6 µm), these samples were moved to the D8 DISCOVER X-ray diffractometer. The scanning was done from 5° to 90° at the rate of 2°/min. Clay composition was determined on clay-size particles (<4 µm ESD) and fractions were obtained through suspension by centrifugation and vacuum deposition of the suspended particles on the silver membrane filters.
Bulk geochemical analysis
The default pyrolysis method was utilized to find the total organic carbon (TOC) content of these samples from Rock-Eval 6 pyrolysis analyzer following the method by Liu et al. (2019a) and geochemical parameters including: S1 (the amount of free hydrocarbons (gas and oil) in the sample), S2 (the amount of hydrocarbons generated through thermal cracking of nonvolatile organic matter) and the Tmax value (the temperature at which the maximum release of hydrocarbons from cracking of kerogen occurs during pyrolysis (top of S2 peak)) are determined accordingly.
N2 adsorption analysis
These 11 samples were crushed into powders (<250 µm) and then degassed for 8 hours at 110°C in order to remove the moisture and volatiles that exist in the sample pores. The Micromeritics® Tristar II apparatus was applied in this study for the low temperature (77 K) nitrogen gas adsorption measurements following Liu et al. (2017b) and Zhou et al. (2018). The adsorption quantity was measured over the equilibrium adsorption pressure (P/P0) range of 0.01–0.99, where P is the gas vapor pressure in the system and P0 is the saturation pressure of nitrogen. The density functional theory was used for the pore size distribution analysis (PSD) from the adsorption branch in this study (Kong et al., 2019).
Results and discussions
Mineral composition
The bulk mineral compositions of the Xishanyao Shale samples in our study are listed in Table 1. Clay and quartz are two main minerals that constitute these shale samples. The quartz content of these samples varies from 38.9 wt.% (Sample 2) to 52.5 wt.% (Sample 6) with an average value of 44.92 wt.%. The clay content of these samples ranges from 13.7 wt.% (Sample 6) to 47.8 wt.% (Sample 1) with the mean value of 34.87 wt.%. The content of plagioclase can be up to 27.8 wt.% (Sample 6). K-feldspar, calcite and siderite only exist in a few of these shale samples. Considering the depth of these samples, the content of the quartz does not change significantly while the clay content changes by a considerable amount. Illite, kaolinite and chlorite coexist in these shale samples while smectite was not detected.
The mineral compositions of the Xishanyao shale.
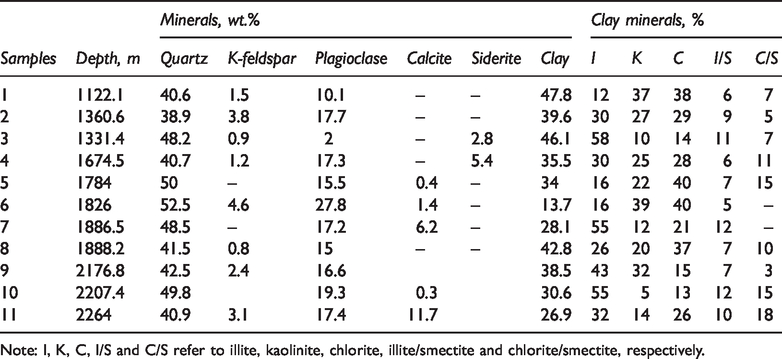
Note: I, K, C, I/S and C/S refer to illite, kaolinite, chlorite, illite/smectite and chlorite/smectite, respectively.
Based on the ternary diagram that was created from the sample’s mineral assemblages, all of the samples reside inside the region classified as siliceous mudstone, showing high relative proportions of whole-rock quartz and feldspar (Figure 2).
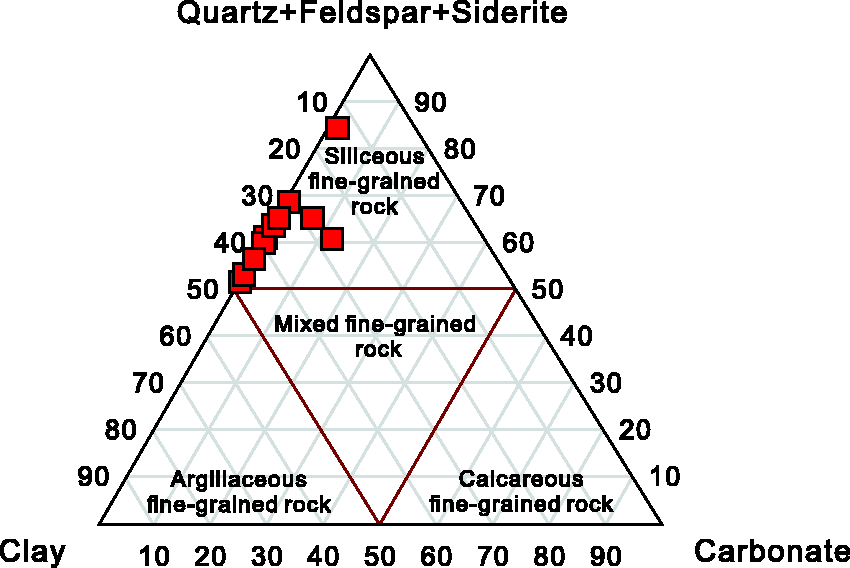
Ternary diagram showing mineral composition and types of fine-grained rock of Xishanyao Formation shale in the Junggar Basin.
Geochemical analysis
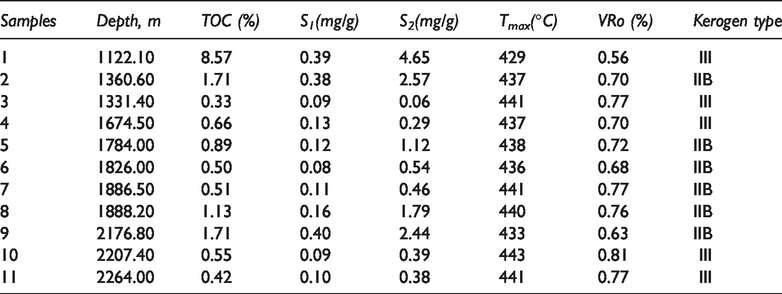
The detailed geochemical analysis of these 11 samples obtained from the RE 6 can be seen in Table 2 where the TOC content of these samples varies from 0.33% (Sample 3) to 8.57% (Sample 1). The average TOC of the samples was measured around 1.54% which indicates these Xishanyao Shale samples are fair (>0.5 wt.%) to excellent (>4 wt.%) source rocks (Liu et al., 2017a). Burial depth has a major impact on the TOC content. HI vs. Tmax (Figure 3(a)) and S2 vs. TOC (Figure 3(b)) cross-plots demonstrate that the kerogen type of these samples is mainly type III or type IIB (Liu et al., 2018). The plot of S2 vs. TOC yields an average HI of about 178 mg HC/g TOC that was calculated from the slope of the linear regression line (Figure 3(b)). The Tmax of these samples was measured between 429°C (Sample 1) to 443°C (Sample 10), depicting that these shale samples are in the oil window, which is in line with the range of production index (PI, i.e. S1/(S1+S2)) (Figure 3(c)). Ultimately, to better understand the thermal maturity level of these samples, Tmax was converted to %VRo values based on the equation proposed by Jarvie et al. (2001). Thus, the %VRo value of these samples was found to vary from 0.56% (Sample 1) to 0.81% (Sample 10), indicating the oil window. No correlations can be found between the burial depth and Tmax which means that for these samples, the sample that is buried deeper, is not necessarily corresponding to a higher thermal maturity. TOC and Rock-Eval data show that most of samples of the Xishanyao Formation contain a fair to very poor petroleum potential for oil (Figure 4(a)), showing gas prone sources (Figure 4(b)) as confirmed by kerogen type III.
Geochemical analysis of the Xishanyao shale samples.
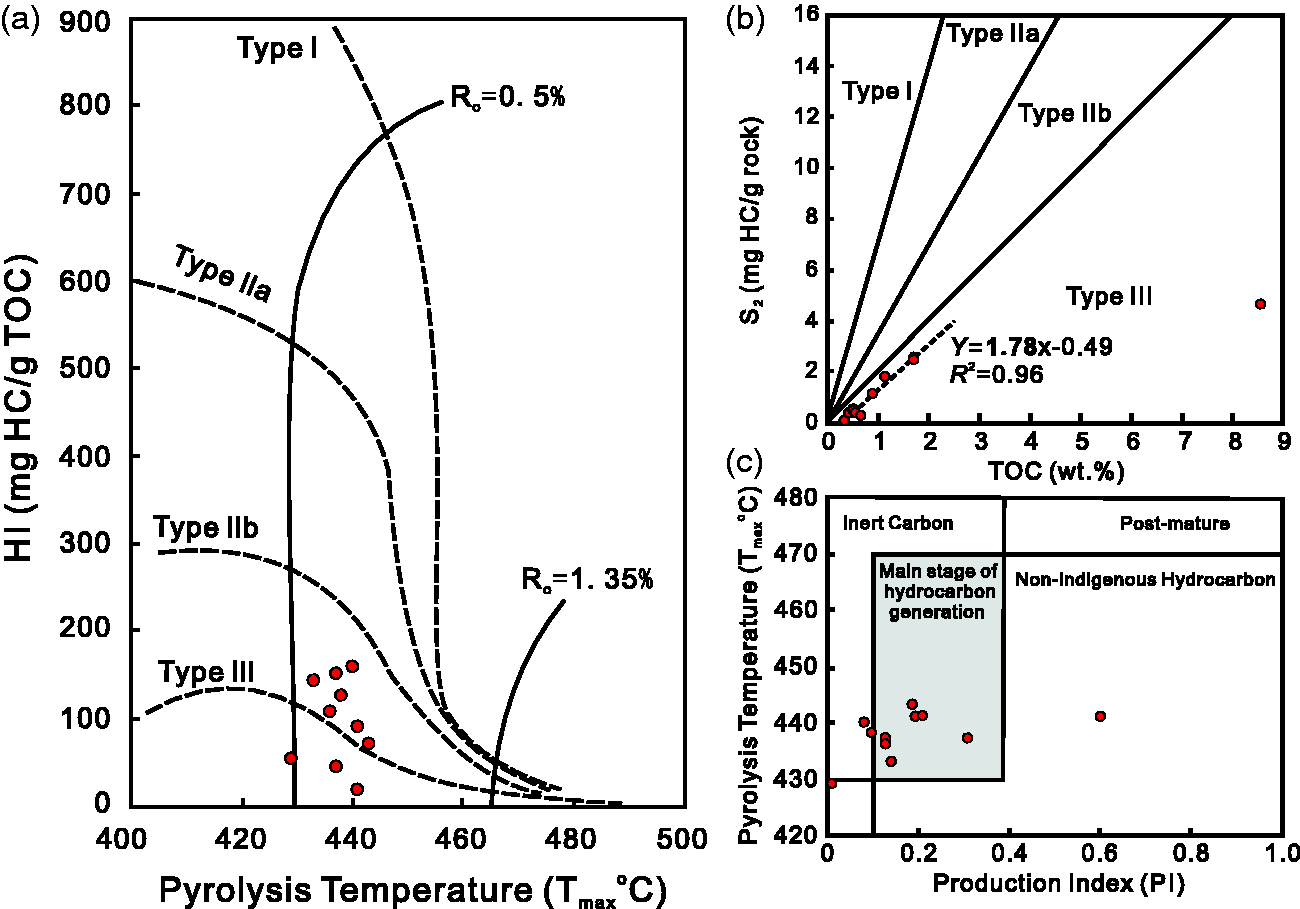
(a) Plot of the temperature of maximum hydrocarbon generation (Tmax) versus hydrogen index (HI) outlining kerogen types and maturity of the Xishanyao Shales. (b) Correlations between total organic carbon (TOC) content and the amount of pyrolyzate released from kerogen (S2), showing kerogen types. (c) Plot of Tmax and production index (PI), showing the maturation and the nature of the hydrocarbon products of the Xishanyao Shales.
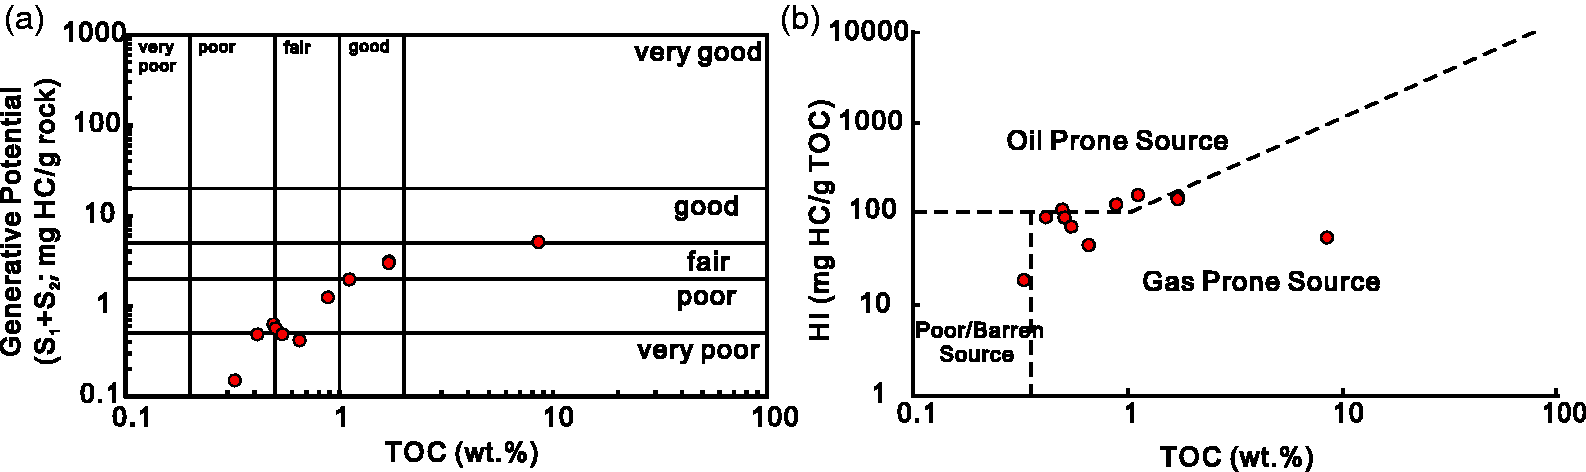
(a) Plot of generative potential (S1+S2) vs. total organic carbon (TOC) content of the Xishanyao Shales. (b) Plot of TOC and hydrogen index (HI) outlining types of hydrocarbon products of the Xishanyao Shales.
Pore structure
N2 adsorption is employed to study the pore structures of the samples and Figure 5 shows the adsorption isotherms of some representative samples. As the relative pressure increases, the single adsorption layer will form and as the increases to a critical value, the multilayer adsorption will happen. The hysteresis loop exists in all of these samples and the shape of the loop exhibits the existence of the slit-shape pores in these shale samples (Rouquerol et al., 1994). We did not observe the flat plateau phenomenon, which is commonly interpreted that there is a presence of larger pores or fractures that are beyond the ability of the N2 adsorption to be detected, in our samples. It’s important to note that the maximum adsorption quantity varies with sample depth, specifying that the pore structures of these samples is a function of depth which can be due to changes in vertical stresses or minute variations in depositional environment conditions.
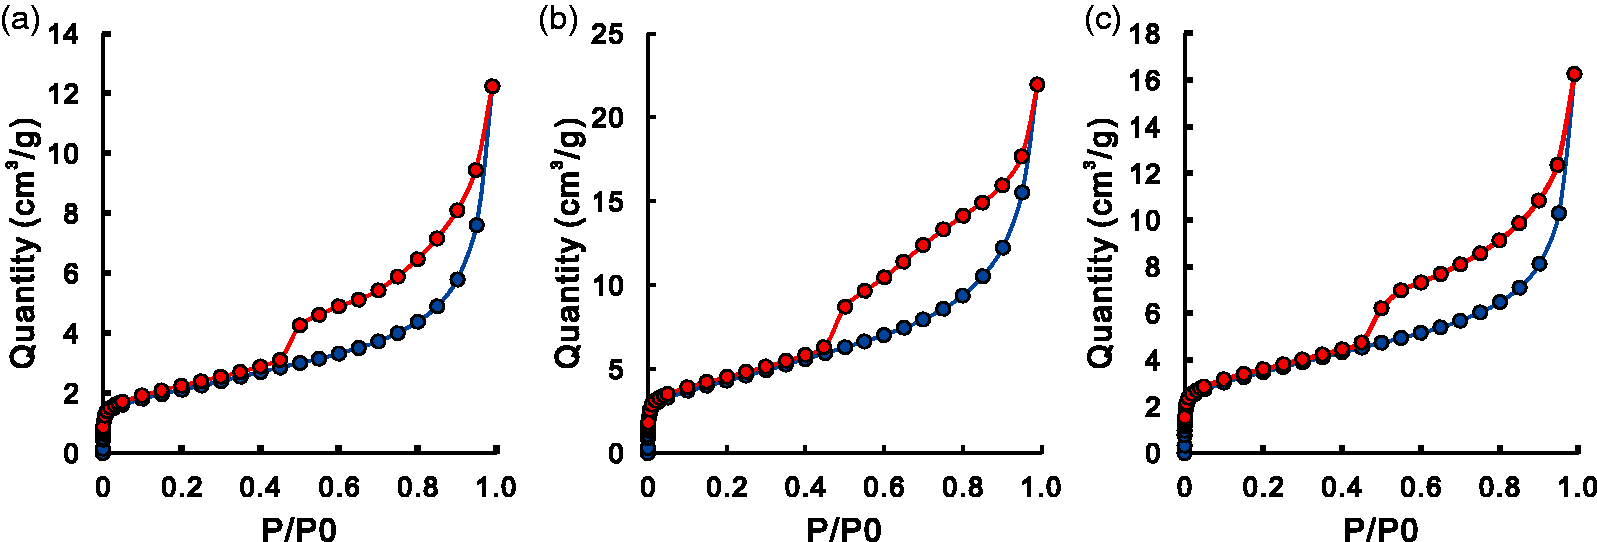
The N2 adsorption isotherms of representative shale samples. (a) Sample 2 (1360.60 m), (b) Sample 5 (1784.00 m); (c) Sample 11 (2264.00 m).
The summary of the pore structure information such as the pore surface area and pore volume (micro pore volume (1–2 nm) and meso-macro pore volume (2–200 nm)) are derived from the adsorption branch as summarized in Table 3. The surface area of these samples varies from 3.711 m2/g (Sample 6) to 20.582 m2/g (Sample 8). Linear correlations exist between the surface area and the pore volume, meaning that the average pore radius of these samples are very close, which also infers that the burial depth does not have a significant impact on the average pore radius of the shale samples. In addition, very good positive correlations were found between the surface area and meso-macro pore volume, demonstrating that the meso-macro pores are the major contributors to the pore surface area.
Summary of the pore structures of the Xishanyao shale.
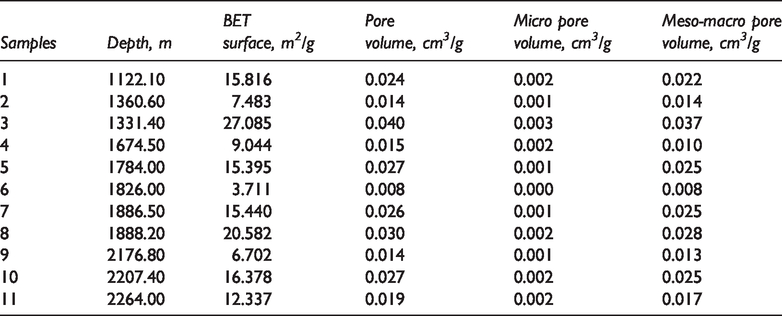
As the burial depth increases, the surface area and pore volume both fluctuate. However, the micropore volume of these shale samples does not change dramatically with depth. Here, it should be emphasized that N2 cannot access all micropores such as the pores with sizes less than 1.7 nm. Hence, under such conditions, the obtained micropore information cannot truly reflect the entire micropore information and be a precise representation of samples’ PSD. The good linear correlation between the total pore volume and the meso-macro pore volume (Figure 6(c)) points out that as the burial depth increases, the total pore volume and the meso-macro pore volume consistently is effected making depth the major factor to control the pore structure, particularly pore surface area and volume. It should be noted that the relationship and impact of major constituent minerals and organic matter on pore structures is explained later in text.
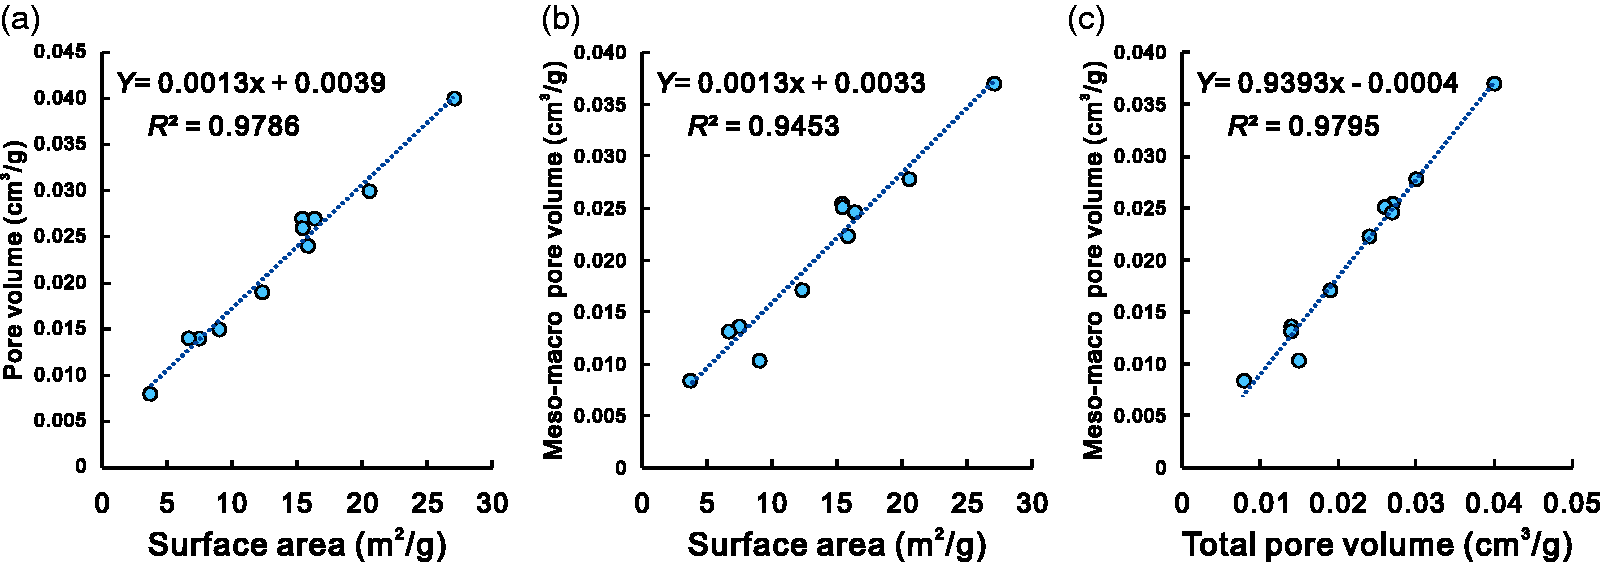
Correlations between the pore surface area and the pore volume. (a) Surface area and total pore volume; (b) Surface area and meso-macropore volume; (c) Total pore volume and meso-macropore volume.
Pore size distributions
The pore size distribution of the representative samples from the adsorption branch (Liu et al., 2018) can be seen in Figure 7 where the y-axis is the differential incremental pore volume. It is clear that most of the pores in theses shale samples have a pore radius less than 10 nm. The three samples that are presented here are showing the peak frequency of pore size of about 5 nm. In order to understand the pore size distributions in detail, we deconvolved the pore size distribution curves based on the Liu et al. (2017b) method and results are shown in Table 4. In this regard, the pore size distribution of all samples are deconvolved into two major frequency peaks with one that appears around 5.35 nm in all samples. Furthermore, the area under the curve in Figure 7 which is also presented in Table 4, corresponds to the DV (the incremental pore volume) under certain pore radii. Considering Sample 1 as an example, the area
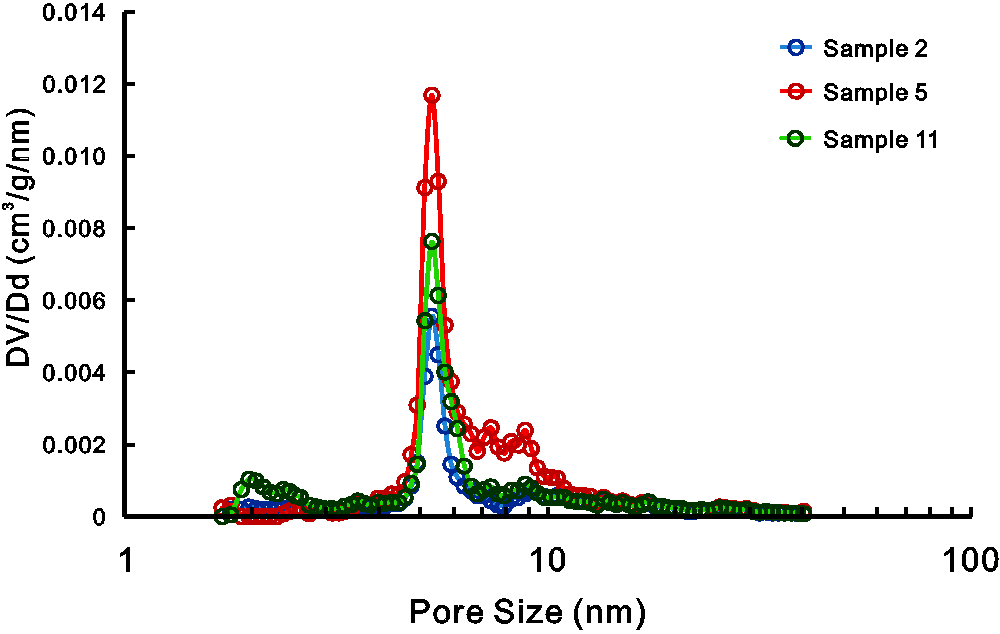
Pore size distributions of some choosing samples.
The deconvolution of the pore size distributions.
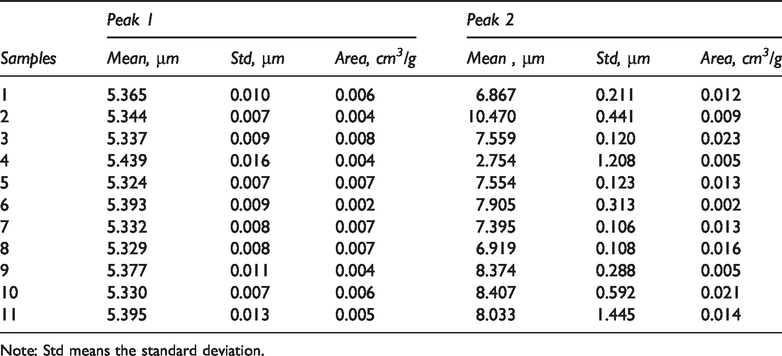
Note: Std means the standard deviation.
Discussions
Relationship between minerals and pore structures
The effects of K-feldspar and plagioclase on the pore structures of the Xishanyao Shale samples can be depicted by regression analysis (Figure 8). Negative correlation exists between the content of K-feldspar and plagioclase with the surface area, micropore volume, and meso-macropore volume, respectively. This can be interpreted that in these shale samples, very limited number of connected pores exist in the feldspar or plagioclase minerals. As the clay content increases, the surface area, micro-pore volume and meso-macropore volume all show an increasing trend (Figure 9), meaning that the micro meso and macropores all can be detected in clay minerals. However, considering quartz, which is a major mineral component in these shales, we could not observe a clear correlation between the quartz content and the pore structures.
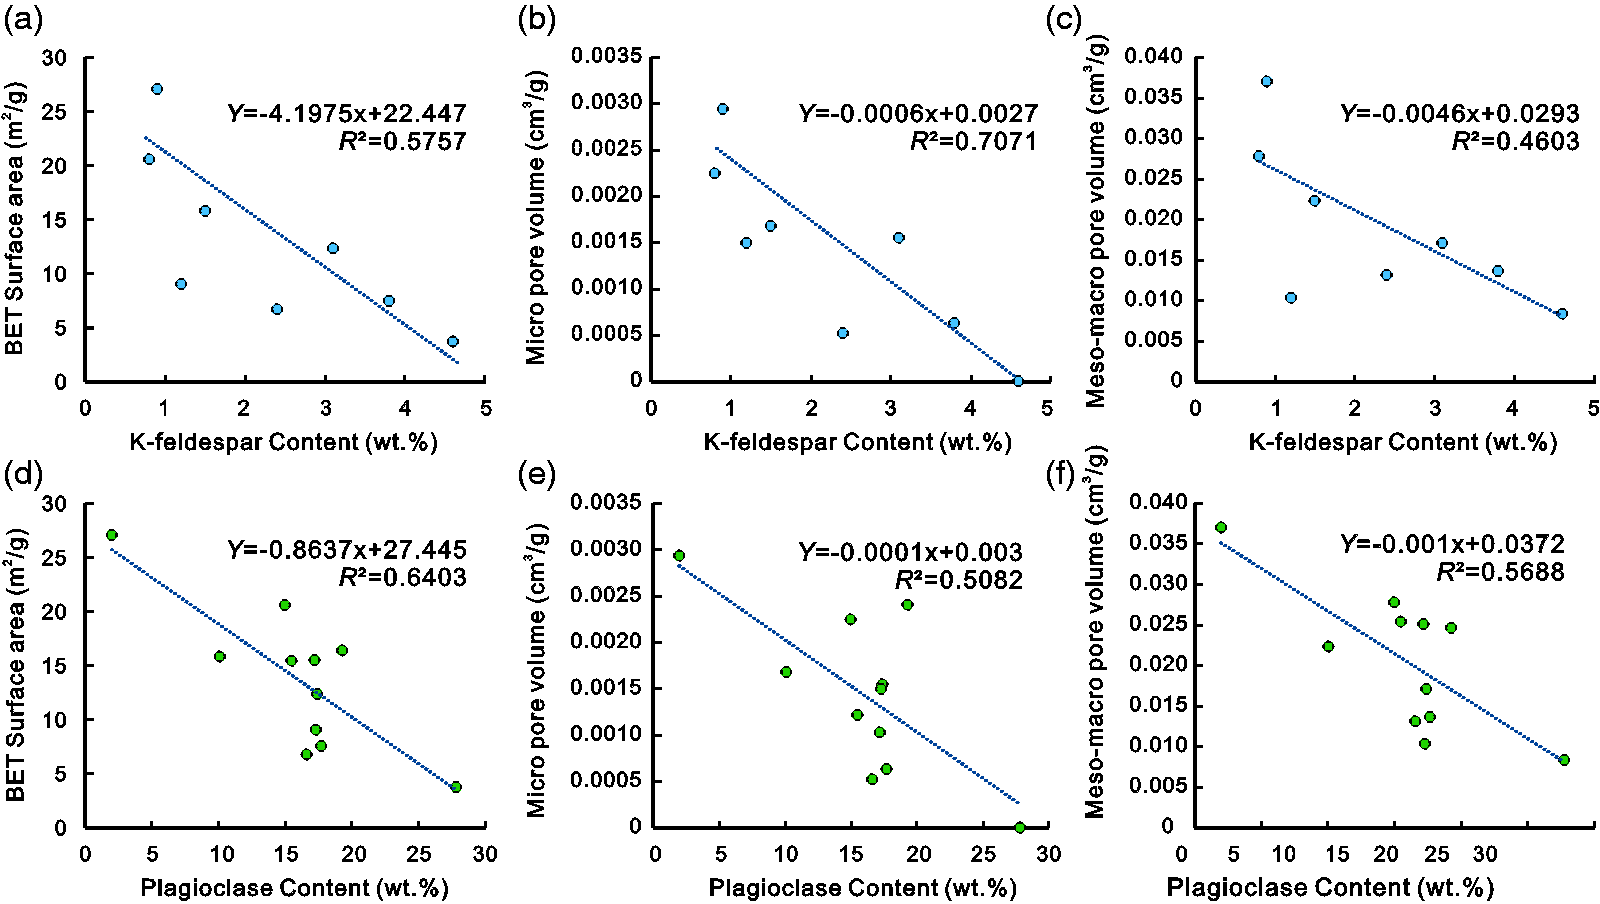
The impact of the K-feldspar and plagioclase on the pore structures. In these figures, (a) to (c) show the impact of the K-feldspar on the surface area, micro pore volume and meso-macro pore volume, respectively; (d) to (f) represent the relationship between the plagioclase and surface area, micro pore volume and meso-macro pore volume, respectively.
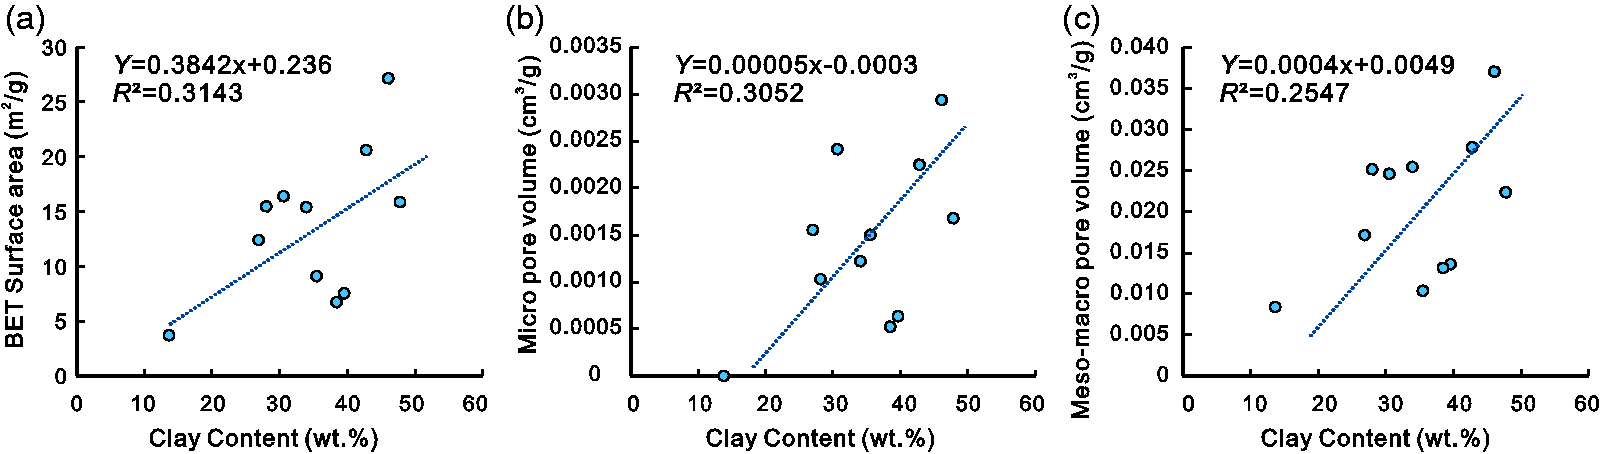
The impact of the clay on the pore structures where (a) to (c) show the impact of the clay content% on the surface area, micro pore volume and meso-macro pore volume, respectively.
The plots of clay content% and the area under the first peak that was obtained from the deconvolution is displayed in Figure 10. As the clay content increases, the area under the first peak shows an increasing trend. As it was explained above, the area under the peak represents the incremental pore volume with a pore radius around 5.35 nm. Overall, this can be interpreted that the pore size around 5.35 nm exists in the clay minerals from the Xishanyao Shales based on this relationship.
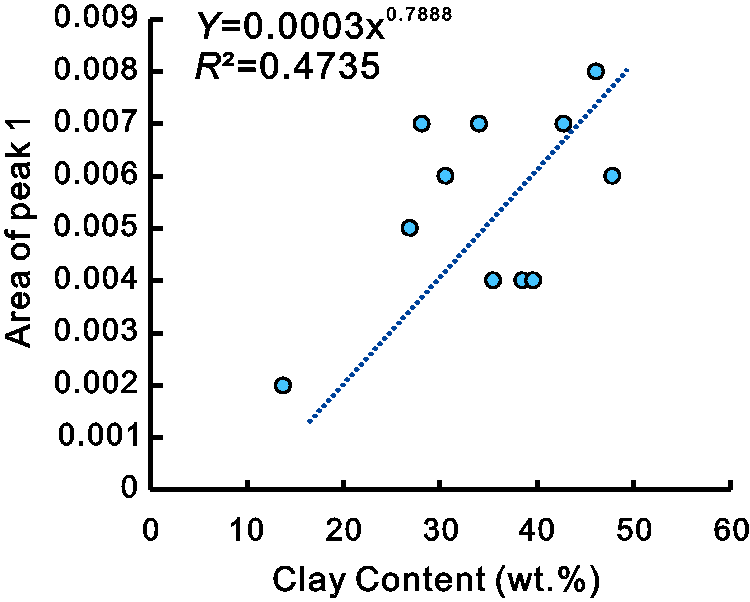
Correlation between the clay content and the area of peak 1.
Relationship between the organic matter and pore structures
Based on Figure 11 we did not find any correlations between the TOC and surface area (Figure 11(a)) and pore volume (Figure 11(b)), which is quite different from other researchers’ findings who studied the effect of organic matter content on pore structures on other shale gas formations. Tang et al. (2018) studied the lacustrine shale in Ordos Basin and found that the porosity increases with the increasing TOC value. Wang et al. (2016) studied the Longmaxi Shale and also found that the pore volume increases with the increasing TOC. This signifies that the impact of organic matter on pore structures in organic rich shale formations, when they are still in the oil window, could be negligible. In this maturity level, the organic pore is not fully developed compared to shale formations that are over mature or at the gas generation stage. Bai et al. (2017) and Ko et al. (2018) reported that during the early stages of the oil window, the cracking of the organic matter into bitumen could even fill some primary pores which could reduce the organic pore volume through precipitation of pyrobitumen in pores and microcracks. Under these scenarios, the mineral–hosted pores will be the major contributors to the total pore structures, which will affect the fluid flow during.
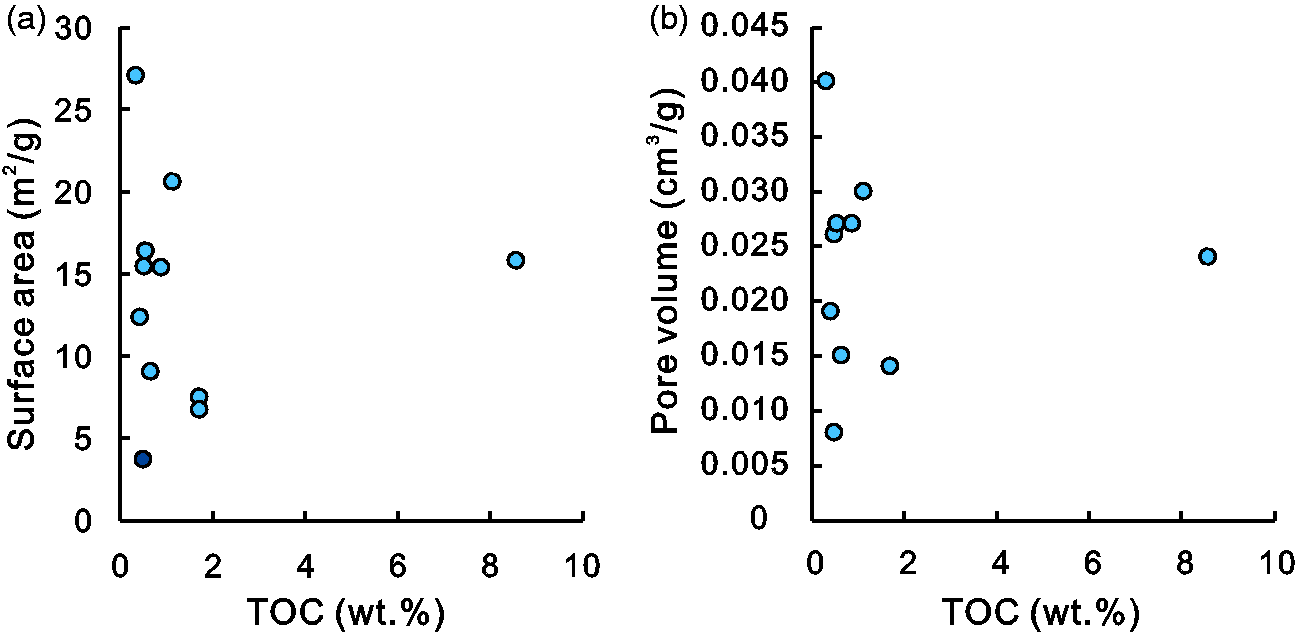
The effect of the TOC on the surface area (a) and pore volume (b).
Pore heterogeneity
Pore heterogeneity can describe the distribution of pores and their corresponding characteristics with different sizes throughout the sample and the interval under study in its entirety. In order to quantify the heterogeneity of the pore structures of the Xishanyao Shale, the fractal analysis on the low pressure N2 gas adsorption was carried out. The FHH model based on the relationship between the adsorption amount and relative pressure can be described by the following equation (Avnir and Jaroniec, 1989):
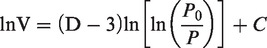
The FHH model is only suitable to define single-layer and multi-layer adsorption, but not for the microporous filling in low P/P0 regions and the capillary condensation in higher P/P0 areas (Cheng et al., 2020; Tang et al., 2003; Wu, 1996). Hence, in this study, the fractal analysis were carried out on the relative pressure ranging around 0.01 to 0.9.
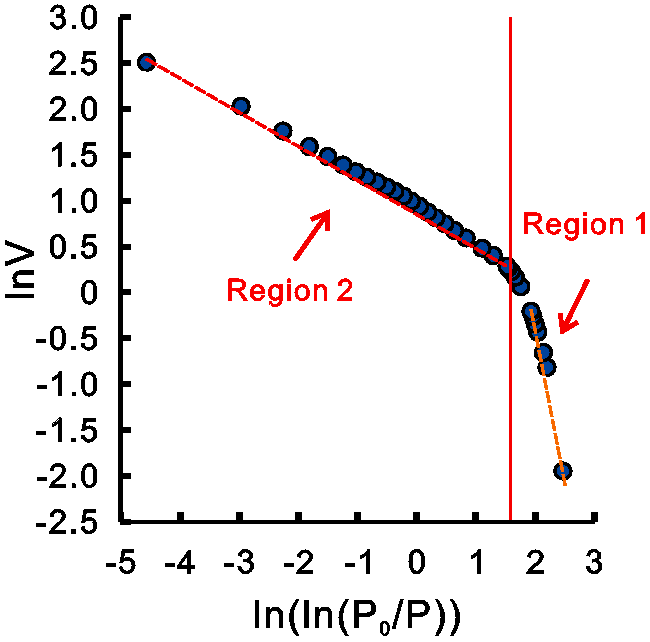
Figure 12 demonstrates the fractal analysis of the adsorption branch of Sample 2, where two distinct segments can be recognized. The fractal dimensions of these two separate segments can be calculated through the slope of two linear parts. D1 is representing region 1 and D2, region 2 where Table 5 summarizes the fractal dimensions of these 11 shale samples. The fractal dimension of D1 of these samples vary from 2.410 (Sample 6) to 2.570 (Sample 10) with the mean value of 2.504 while the D2 varies from 2.620 (Sample 6) to 2.742 (Sample 1) with the mean value of 2.683. In this regard, D1 defines where the relative pressure is low while D2 represents the higher relative pressure ranges during the adsorption experiments. D2 describes the capillary condensation of gas clumps that has occurred in the pores while the D1 value represents the mono-multilayer adsorption. D2 is larger than D1 which can also imply that the pore structures of the shale samples are more complicated than the pore surface.
Fractal dimension analysis of the Sample 2.
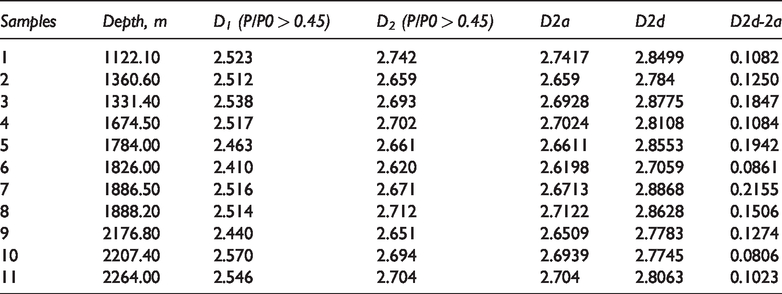
The results of the fractal dimensions of the adsorption and desorption branch.
Adsorption hysteresis
An apparent hysteresis loop is seen when the relative pressure is larger than 0.45 between the adsorption and desorption branches in the Xishanyao Shale samples (Region 2 in Figure 12). The hysteresis can be either due to the capillary condensation or the pore blocking phenomenon (Rouquerol et al., 1994). The shape of the hysteresis loop in Figure 5 reflects that pores in the Xishanyao shale samples are mainly slit-pores and not very many ink-bottle pores exist in these samples. This indicates that the pore blocking phenomenon in these shale samples will be limited. In this study, D2d and D2a are the fractal dimensions of the desorption and adsorption branch (P/P0 > 0.45), respectively. D2d and D2a can reveal the surface roughness of the desorption and adsorption branch (P/P0 > 0.45). We define the difference between the fractal dimension of the desorption branch and the adsorption branch (D2d-D2a) as the hysteresis indicator. In this regard, Table 5 explains that the value of the D2d-D2a is a function of depth. Here, D2d is found larger than D2a which means that the surface roughness of the desorption branch is more than the adsorption branch. Moreover, Figure 13 displays that as the meso-marcopore volume increases, the D2d-D2a increases too (the increasing trend), specifying that in the Xishanyao Shale samples, the meso-macro pore condensation could be the main factor responsible for the hysteresis. Although our preliminary data disclosed such phenomenon, but to make a robust conclusion more samples should be analyzed.
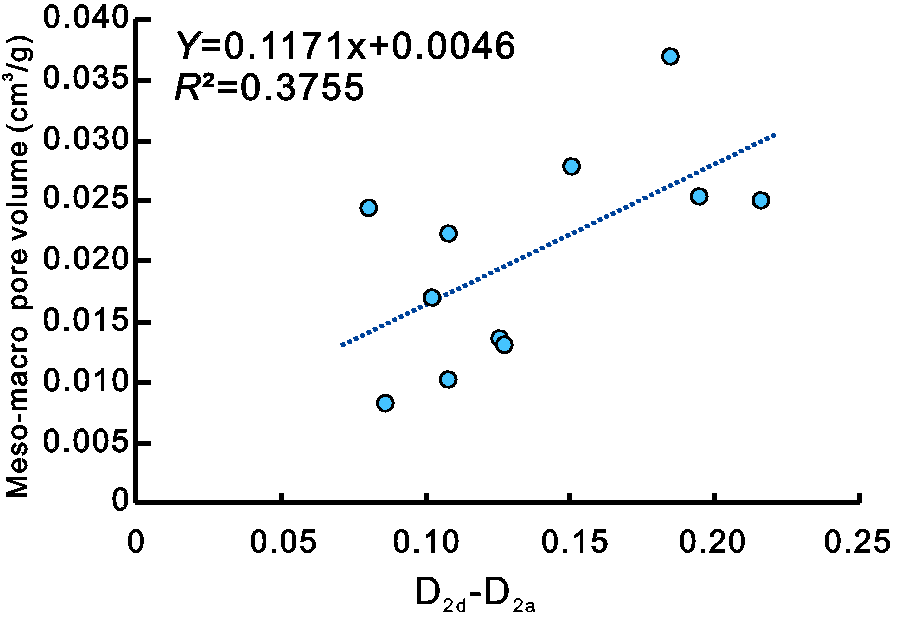
Correlations between D2d-D2a and meso-macro pore volume.
Conclusions
In this study, 11 samples varying in depth from a single well were retrieved from the Xishanyao Shale Formation and were subjected to N2 gas adsorption for the pore structure analysis. Based on the results, the main conclusions from this study are as follows:
Quartz and clay minerals are the major constituent minerals of the Xishanyao Shale samples. The TOC of the Xishanyao samples varies notably with the mean value around 1.54% while the Tmax of the samples indicates that these shale samples are in the oil window. Unlike other shale formations, meso-macro pores are the major contributor to the pore surface area and the pore volume of the Xishanyao Shale. The burial depth does not affect the micropores abundancy but controls the meso-macro pores to some extent. The deconvolution of pore size spectrum illustrates that all of these shale samples have similar pore families with the peak frequency at 5.35 nm. Fewer number of pores exist in the K-feldspar and plagioclase in these shale samples but micro, meso and macro pores were detected in the clay minerals. Pores with a size around 5.35 nm were observed in clay minerals in these shale samples. Finally, D2 was estimated larger than D1 which can also indicate that the pore structures of these shale samples are more complicated than the pore surfaces. In the Xishanyao Shale samples, the meso-macro pore condensation could be the main factor responsible for the hysteresis.
Supplemental Material
sj-pdf-1-eea-10.1177_0144598720985136 - Supplemental material for Pore structure and adsorption hysteresis of the middle Jurassic Xishanyao shale formation in the Southern Junggar Basin, northwest China
Supplemental material, sj-pdf-1-eea-10.1177_0144598720985136 for Pore structure and adsorption hysteresis of the middle Jurassic Xishanyao shale formation in the Southern Junggar Basin, northwest China by Bo Liu, Yifei Gao, Kouqi Liu, Jinzhong Liu, Mehdi Ostadhassan, Tong Wu and Xianli Li in Energy Exploration & Exploitation
Footnotes
Declaration of conflicting interests
The author(s) declared no potential conflicts of interest with respect to the research, authorship, and/or publication of this article.
Funding
The author(s) declared the following potential conflicts of interest with respect to the research, authorship, and/or publication of this article: This study was supported by the National Natural Science Foundation of China (Nos. 41972156, 41673066). Thanks also to the National Basic Research Program of China (2016ZX05003-002, 2017ZX05008-002) for shale samples and lab support.
References
Supplementary Material
Please find the following supplemental material available below.
For Open Access articles published under a Creative Commons License, all supplemental material carries the same license as the article it is associated with.
For non-Open Access articles published, all supplemental material carries a non-exclusive license, and permission requests for re-use of supplemental material or any part of supplemental material shall be sent directly to the copyright owner as specified in the copyright notice associated with the article.