
Abstract
In this study, vermiculite was modified and used in the decolorization of wastewater containing methylene blue. Taguchi experimental design method was applied to the process. An L16 orthogonal array was obtained according to Taguchi design by determining five factors effective on the process (pH, time, concentration, amount, and temperature) and four levels of these factors. Taguchi method determined concentration as the most effective factor. It suggested pH 3, 60 min, 5 mg.L−1, 2 g.L−1 and 50°C as optimum conditions. Equilibrium studies were carried out with Langmuir, Freundlich, Temkin, and Dubinin–Radushkevich isotherm models, and the process was found to be compatible with the Langmuir (R2 = 0.9103) and Dubinin–Radushkevich (R2 = 0.9344) model. It was determined that the material had a maximum capacity of 9.60 mg.g−1. In kinetic studies conducted with pseudo-first-order, pseudo-second-order, and intraparticle diffusion models, the process complied with the pseudo-first-order (R2 = 0.9903) and intraparticle diffusion (R2 = 0.9811) models. The chemical composition was determined, and phase analysis was performed. By Branuer–Teller–Emmet analysis, it was determined that vermiculite exhibited a higher surface area (8.00 m2/g) by modifying it. It was seen as a result of Fourier transform-infrared spectroscopy analysis that the active functional groups were similar for vermiculite and modified vermiculite. Mass losses of both materials were evaluated by thermal analysis.
Introduction
Vermiculite is a natural clay mineral found abundantly in soil (Yang et al., 2024b; Shi et al., 2023). It stands out with its abundant reserves and low prices (Dai et al., 2023). It is a nontoxic, environmentally friendly substance with a specific gravity of approximately 2.2–2.4 and a pH of 7.0–7.5 (Ahmed et al., 2022; Bai et al., 2022; Çelik, 2023). It contains Si, Mg, Al, and Fe (Rehman et al., 2023). Its main structure is regular, consisting of an octahedral magnesium layer between two tetrahedral silica layers (Zhao et al., 2022). It contains exchangeable cations between its layers and contains water molecules and active hydroxyl groups (Qiaofang et al., 2024). Vermiculite has reactive surface regions, large surface area, and stable negative charge (Rind et al., 2024).
It is known that the negativity of clay minerals surfaces provides a high capacity to positive species and interfaces that can be replaced by cations in their structure (Patra et al., 2024). The unique structure of vermiculite provides it with a strong adsorption capacity (Wang et al., 2023). It has excellent cation exchange, expansion, and adsorption properties (Yuan et al., 2024). Based on these properties of vermiculite, researchers have studied neodymium adsorption/desorption using expanded vermiculite (de Vargas Brião et al., 2020), Pb(II) removal from aqueous solution by vermiculite subjected to chemical and thermal expansion (Hou et al., 2023), investigation of the ability of vermiculite modified with manganese oxide to remove Rhodamine B from aqueous solution (Chauke et al., 2024), investigating the adsorption potential of raw vermiculite and MnO2 modified vermiculite in removing Ag+ (Sarı and Tüzen, 2013), preparation of Na+/K+/Mg2+/Ca2+ expansion-modified vermiculite and calcination expansion-vermiculite to control metal emission (Yang et al., 2024a).
A dye is a coloring and ionizing organic substance (Singh et al., 2017). Colorants that originate from nature, such as plants, animals, or minerals, are called natural dyes (Pranta and Rahaman, 2024). Due to the low brightness and stability and fading in the presence of water and light of natural dyes, synthetic dyes, which are better in these areas, have come to the fore (Alegbe and Uthman, 2024). Dyes are generally grouped according to ionization (anionic, cationic, nonionic), dying method (basic, acidic, direct) and functional groups (azo, anthraquinone, indigoid, nitro, thiazine, xanthene, phthalein, etc.) (Sahu and Poler, 2024; Fattahi et al., 2024; Fang et al., 2024). The textile, plastic, cosmetic, and paper industries can be listed as the most common areas of use for dyes (Fideles et al., 2024). Especially after industrial use, the discharging of dye including wastewater into water resources causes serious environmental hazards (Meskel et al., 2024). Since they can be allergenic, carcinogenic, and mutagenic, they can negatively affect human life and threaten health (Balarak et al., 2020). Additionally, dyes including aromatic rings, such as methylene blue, are inert to heat, oxidizers, and light, and thus are difficult to remove from water (Oladipo et al., 2024). Methylene blue stands out especially in the dye industry for coloring silk, wool, cotton, and paper (Yusuf et al., 2024). Methylene blue, a cationic dye frequently used in many industries, has become an environmental problem due to its toxicity and nonbiodegradability (Vaddi et al., 2024; Din et al., 2024; Chouchane et al., 2024). This requires its effective removal (Valentini et al., 2023). Dye contaminants are eliminated from aqueous solutions by reverse osmosis, membrane, adsorption, etc. methods (Gadore et al., 2024).
In experimental studies with many variables and combinations, experimental design can be used to overcome the complexity and time-consuming (Durán et al., 2024). Experimental design methods provide design solutions as well as reduce costs and increase quality (Googerdchian et al., 2018). Taguchi method is a statistical tool for designing experiments (Rahman and Raheem, 2022). It is an easy, efficient, and systematic method to optimize the design in terms of performance, quality, and cost (Yusuff et al., 2021). It provides the ability to predict optimum conditions and results (Lala et al., 2023). It also considers the interaction of factors (Patra et al., 2021). Taguchi method offers orthogonal arrays that allow the design to be executed with less experimentation (Dabagh et al., 2023). One of the main advantages is the use of orthogonal arrays that give equal importance to all levels and parameters (Lasu et al., 2024). They evaluate each factor to provide the output at optimum conditions with the minimum number of experiments for the specified factors, thereby reducing the time and cost required for the experiment (Egbosiuba et al., 2021; Korake and Jadhao, 2021).
The study involves the use of modified vermiculite mineral for effective decolorization of methylene blue mixed water. Vermiculite was prepared for the concentration value and modification conditions that Ren et al. (2022) had previously shown to have the highest adsorption capacity results for the removal of ammonia nitrogen from rare earth wastewater for the vermiculite they modified with NaCl solutions prepared at different concentrations. The novelty of this study is the decolorization of an aqueous solution containing methylene blue dye, which is a widely used and quite harmful component, using one of the frequently used and superior experimental design methods to save time, cost, and labor. Taguchi design was applied for the decolorization of methylene blue-containing water using modified vermiculite. By using Taguchi method, an orthogonal array was obtained for the determined process parameters, and effective factor determination, estimation of the results and optimization studies were carried out with the results of the experimental studies performed according to this array. The process was also considered by the ANOVA method, which statistically interprets the decolorization depending on the factors (Mustapha et al., 2021). The equilibrium state of the process was investigated with Langmuir, Freunlich, Temkin, and Dubinin–Radushkevich isotherms, and its kinetics was explained with pseudo-first-order, pseudo-second-order, and intraparticle diffusion models. pH at zero charge point was determined for modified vermiculite. The properties of vermiculite and modified vermiculite were revealed by XRF, XRD analysis, BET analysis, FTIR, and TGA.
Materials and methods
Experimental
Modification method
About 36 g NaCl (99.0–100.5%, Sigma-Aldrich) was added to 200 mL distilled water and mixed using a magnetic stirrer (IKA C-MAG HS 7). Then, 20 g of vermiculite (Agrenem) was added to the solution and allowed to mix at a constant speed for 24 h under ambient conditions. At the end of 24 h, it was washed four times with distilled water. After the last wash, it was dried in an oven (Mipro MLF 55) at 105°C overnight (Ren et al., 2022).
Method for pH at zero charge point
The determination of pH at the zero-charge point was carried out by rearranging a previous study (Faria et al., 2004). To determine the pH at zero charge point of modified vermiculite, 0.01 M NaCl solution was prepared. By taking 50 mL of this solution, the pH values were adjusted to between 1 and 12 with different concentrations of HCl (≥37%, Fluka) and NaOH (for analysis, Carlo Erba) solutions, and 0.05 g of modified vermiculite was added. After they were covered with parafilm and shaken (Memmert, WNB 22) at 210 rpm for 24 h under ambient conditions, the final pH values were measured.
Decolorization procedure
Taguchi experimental design method was applied for the experimental study of the decolorization of methylene blue-containing water using modified vermiculite. Stock methylene blue (for microscopy, Carlo Erba) solution prepared at a concentration of 2000 mg.L−1 was used in the preparation of dye solutions. Experiments were carried out for 40 mL solution volumes. HCl and NaOH solutions were used to adjust pH. A shaking (Thermal H11960) speed of 210 rpm was used to perform decolorization studies. Before determining the absorbance values, centrifugation (Centurion Scientific, C2 series) was performed at 5000 rpm for 8 min. Determination of concentration values was achieved through ultraviolet-visible spectroscopy (Perkin Elmer, Elmer Analyst 800).
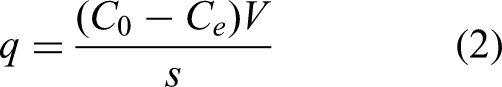
For the decolorization process, decolorization % and q were calculated using the following equations (Zolgharnein et al., 2013; Shokrollahzadeh et al., 2023; Lashgari et al., 2024):

Design of experiments
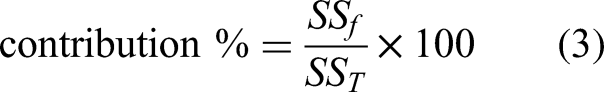
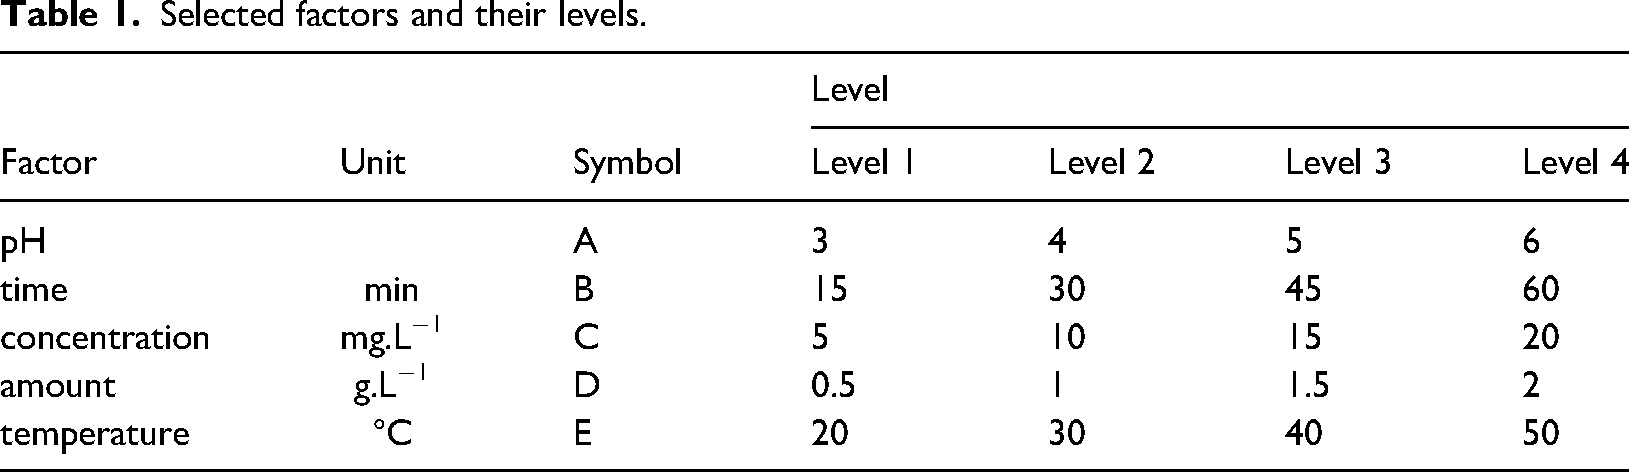
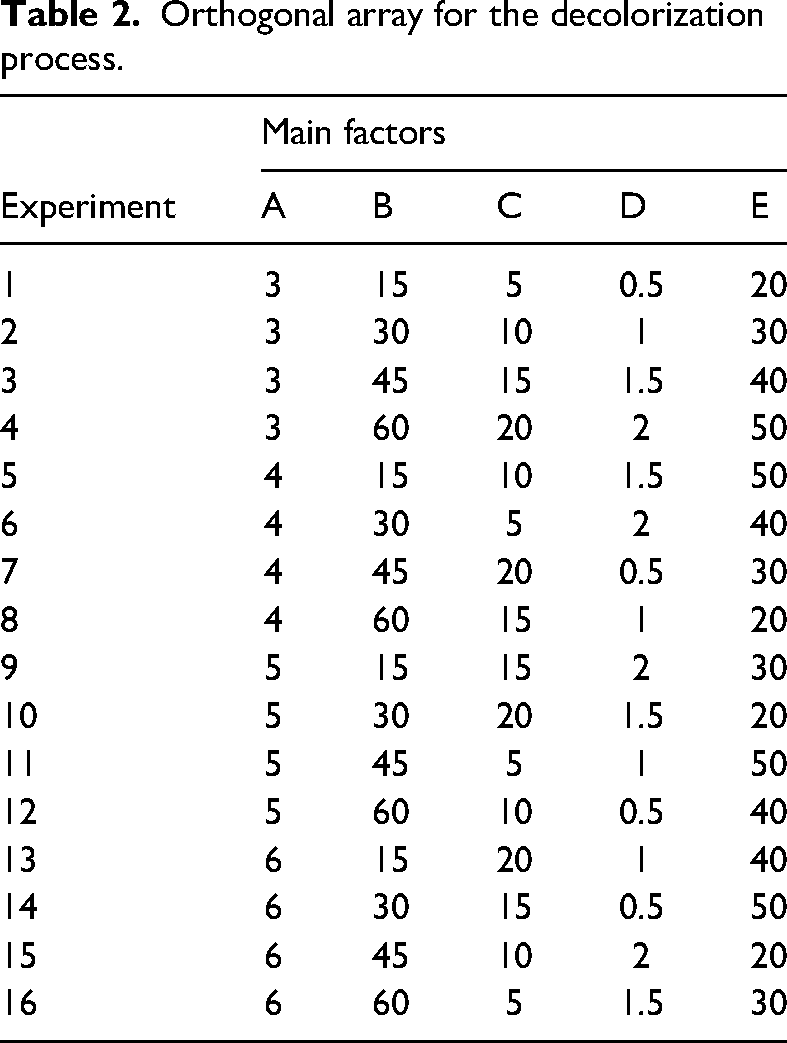
It was studied to determine the effect level of the factors, optimum conditions, and results for the decolorization of methylene blue mixed water using modified vermiculite by Taguchi method. Minitab 17 software was used for Taguchi method. For this process, five factors were determined: pH value of methylene blue solutions, contact time of methylene blue with modified vermiculite, methylene blue concentration, amount of modified vermiculite, and temperature of the experimental environment. Four levels were determined for each factor: pH (3, 4, 5, 6), time (15, 30, 45, 60 min), concentration (5, 10, 15, 20 mg.L−1), amount (0.5, 1, 1.5, 2 g.L−1), and temperature (20, 30, 40, 50°C). Each factor, notation, and level is listed in Table 1. The method provided an orthogonal array depending on the factors and their levels. For the determined factors and levels, 16 experimental studies were carried out according to the L16 (45) orthogonal array obtained in Taguchi design. Table 2 shows the orthogonal array of Taguchi system. The decolorization percentage values determined as a result of the experimental studies were defined as output to Taguchi system, and the evaluations of Taguchi system were obtained for the larger-the-better type of S/N ratio. The contributions of the factors selected for the decolorization process were determined. Contribution percentages were calculated with equation (3) (Shafizah et al., 2022):
Selected factors and their levels.
Orthogonal array for the decolorization process.
Modeling of the decolorization
Equilibrium modeling
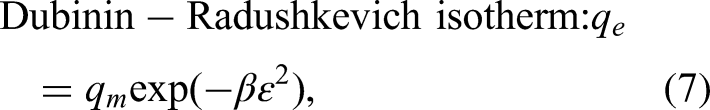
The equilibrium state of the process of using modified vermiculite for the decolorization of methylene blue mixed water was examined with Langmuir, Freundlich, Temkin, and Dubinin–Radushkevich isotherm models. Equilibrium studies were carried out for 5–20 mg.L−1 methylene blue concentrations, at their pH value, for 60 min, 40 mL solution volume and 1 g.L−1 amount. The equations used for Langmuir, Freundlich, Temkin, and Dubinin–Radushkevich isotherm models are listed below (Nizam et al., 2024; Chen, 2015; Qais et al., 2023; Kutluay et al., 2019):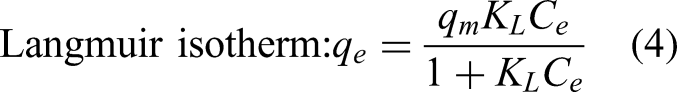


Kinetic modeling
Kinetic examination of the decolorization process using modified vermiculite was carried out with pseudo-first-order, pseudo-second-order, and intraparticle diffusion models. For kinetic studies, the process was monitored for 60 min for 10 mg.L−1 methylene blue concentration, 1 g/L amount, and its pH value. Relevant equations are given below (Ibrahim et al., 2022; Choe et al., 2022; Huang et al., 2023):


Analytical procedure
XRF (Panalytical/Axios) analysis was applied to determine the elemental and oxide state composition of the materials. The crystalline structure was elucidated by XRD (Rigaku, SmartLab) analysis for 6 °/min and between 2 and 60° for 2Θ. BET (Micromeritics Surface Area and Porosity, Tristar II) analyzes were performed for unmodified and modified vermiculite samples. For BET analysis, degas was performed at 50°C for 12 h (Chauke et al., 2024; Long et al., 2014), and BJH pore width was determined by performing multipoint and pore analysis. The presence and types of active groups were determined by FTIR (Perkin Elmer, Spectrum 100) analysis. TGA (Exstar SII TGA/DTA 7200) was carried out similarly to a previous study in a nitrogen atmosphere, 10°C/min for between 30 and 1000°C (Feng et al., 2020).
Results and discussion
Taguchi optimization
It was aimed to determine the optimum conditions and the effectiveness of the selected factors and their levels for the decolorization of methylene blue mixed wastewater using Taguchi design. Experiments are carried out according to the L16 orthogonal array of Taguchi method for five factors and four levels in Table 2. As a result, the decolorization percentage values and S/N ratios in Table 3 are obtained. Taguchi method uses S/N to account for characteristic quality that deviates from the desired value (Duran-Jimenez et al., 2014). There are three types of S/N: nominal is best, smaller is better, and larger is better (Santra et al., 2014). These three types are being investigated depending on the statistically desired quality of responses (Mbachu et al., 2023). Since the highest decolorization was aimed with modified vermiculite, the larger the better option of S/N was chosen for this study (Varala et al., 2016). The S/N ratio plot showing the effectiveness of the determined factors for each level is given in Figure 1. Additionally, Figure 1 illustrates the optimum conditions for the decolorization. According to Figure 1, when modified vermiculite is used for the decolorization of methylene blue mixed water, the optimum conditions for the determined factors and their levels are A1 (pH3), B4 (60 min), C1 (5 mg.L−1), D4 (2 g.L−1), and E4 (50°C) according to the S/N ratios. Confirmation experiments were carried out for the optimum conditions determined by the design. For optimum conditions, 90.62% decolorization was obtained in the experimental study, and the predicted decolorization was found to be 97.61% in the design.

Main effects plot.
Decolorization % and S/N ratios for the orthogonal array.
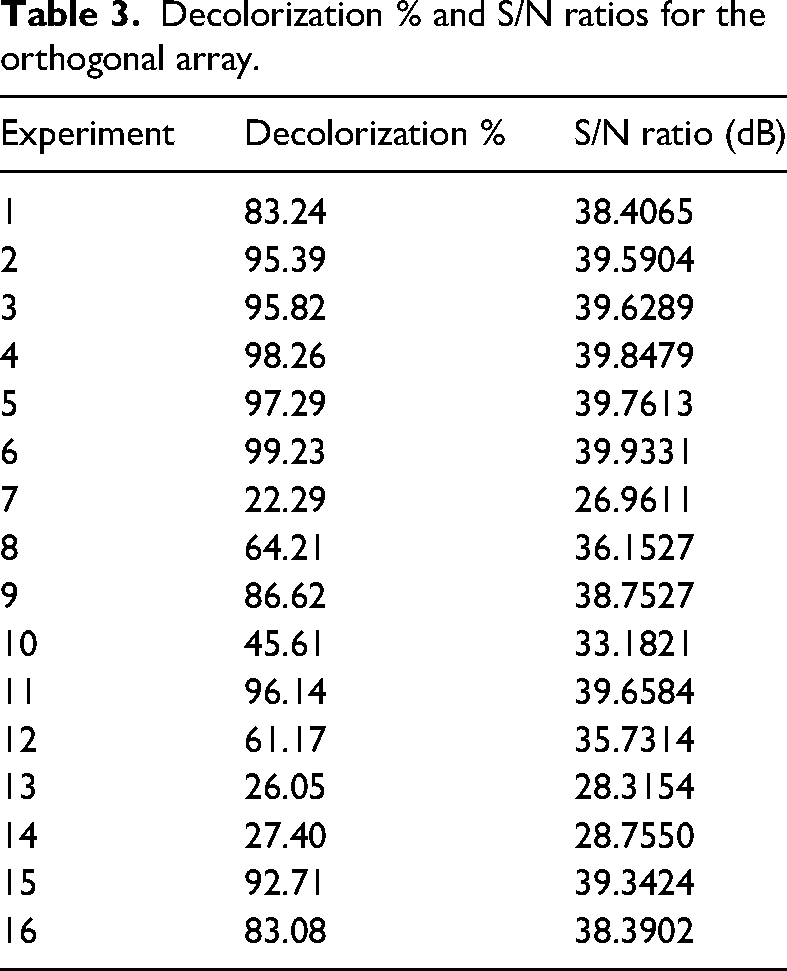
Table 4 represents the response table for S/N ratios. The rank values of decolorization, which show the effect of the factors, are also seen in the table. According to the rank values, it was determined that the initial methylene blue concentration (factor C) with rank level 1 was the most effective factor among the factors. Temperature (factor E) has rank 5 and is seen as the factor with the lowest effect.
Response table for S/N ratios.

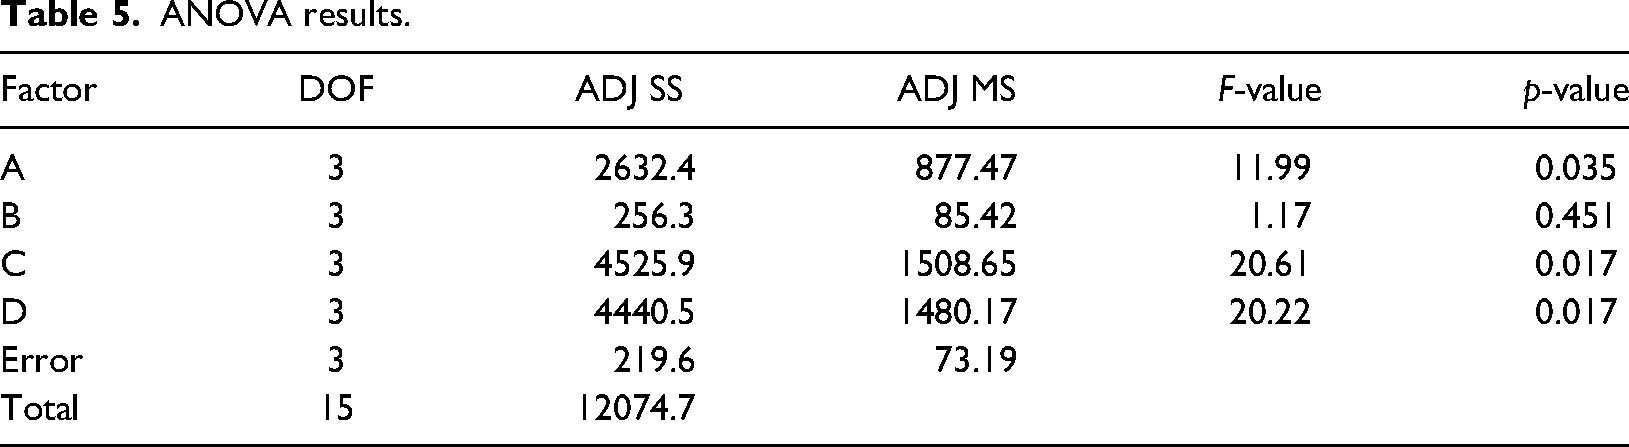
ANOVA was performed to examine the relationship between the factors. A 95% confidence level was taken as the basis for analysis. ANOVA analysis results are given in Table 5. F-value and p-value data in Table 5 indicate the importance of the factors (Hussin et al., 2020). F-value expresses as the ratio of the mean square of the factor to the residual error (Tamang and Paul, 2022). Generally, if the F-value for a factor is above 3.13, the factor is determined to be effective (Abbasi et al., 2020). According to Olubunmi et al., the fit of the model and data or intense noise causes a high F-value, but in addition, if the p-value is below 0.05, it is explained that the F-value is not due to noise and a good fit is achieved (Olubunmi et al., 2020). A large F-value indicates a high contribution of the factor to the response (Baig et al., 2020). A factor is statistically significant when p-value < 0.05 (Rahman et al., 2023). Accordingly, factors A, C, and D seen in Table 5 are statistically significant. Factor C confirms its highest contribution with its maximum F-value and minimum p-value (Karaoglu and Yolcular, 2022).
ANOVA results.
The contributions of factors A, B, C, D, and E on the decolorization process were determined. The percent contributions of the factors are given in Table 6. As seen in Table 6, C provides the largest contribution with 37.48%, while E has the lowest contribution for decolorization with 1.81%.
Contribution of each factor.

pH at zero charge point
pH is a measure of charge density. Attractive or repulsive interactions occur due to electrostatic interaction between charged molecules (Ahmad et al., 2023). Processes exhibit different adsorption behavior for varying pH values of the aqueous medium (Mamman et al., 2024). Since pH provides a charge to the medium, it affects the adhesion of the component in the aqueous medium to the solid material (Aragaw and Alene, 2022). Thus, it has been demonstrated by previous studies that changing capacity and percentage are obtained at varying pH values in adsorption processes (Yadav and Dasgupta, 2022). To present the relationship between pH and adsorption performance more clearly, pH at zero charge point needs to be examined (Agha et al., 2024). Zero charge point is a factor that expresses the pH sensitivity and the type of active centres of the material (Leng et al., 2015). A pH at zero charge point was determined for modified vermiculite. When the change in the difference between the final and initial pH values versus the initial pH values was examined, it was determined that the surface charge of the modified vermiculite was zero at a value of 1.03 (Mubarik et al., 2012). At this point, there is no electrostatic interaction (Liu et al., 2020). If the solution pH is higher than the pH at zero charge point, the material surface is negatively charged and can experience electrostatic attraction with positive charges (Li et al., 2020). Since the surface of the modified vermiculite was negatively charged at the pH values of 3, 4, 5 and 6 determined for the decolorization process, effective interaction with positive methylene blue was achieved.
Equilibrium modeling
The equilibrium dye concentration values and capacity values at varying initial methylene blue concentrations determined for the decolorization process are presented in Figure 2. Figure 3 contains graphs of Langmuir, Freundlich, Temkin, and Dubinin–Radushkevich isotherm models obtained from the equilibrium data of the decolorization process. Parameters of isotherm models that provide information about the equilibrium state are given in Table 7. It is seen that the R2 values presented in Table 7 are higher for the Langmuir isotherm model than Freundlich model. This explains that the decolorization process of methylene blue mixed water using modified vermiculite is compatible with the Langmuir isotherm model. According to the Langmuir isotherm model, methylene blue molecules settle in a monolayer on the surface of modified vermiculite (Mamudu et al., 2023). Arrangement in a monolayer also implies that with the presence of a finite number of active sites, the layer will be saturated at a state and thus equilibrium will be reached (Alizadeh et al., 2024; Li et al., 2018; Syafiuddin et al., 2018). It also emphasizes that there is no lateral interaction between methylene blue molecules (Hung et al., 2023). The qm value belonging to the Langmuir isotherm model determined as 9.60 mg.g−1 represents the maximum capacity of modified vermiculite. As given in Table 7, Dubinin–Radushkevich isotherm model also seems to be compatible with the decolorization process. This model explains that the material surface has heterogeneous energy (Jan et al., 2021). The E value in Dubinin–Radushkevich isotherm model was calculated as 1.73 kJ/mol. The E value is less than 8 kJ/mol indicates the interaction of methylene blue with modified vermiculite through physical forces during the decolorization (Mostafapour et al., 2022).

The equilibrium concentration and capacity values at varying initial concentrations.

Isotherm plots.
Isotherm model parameters.

Kinetic modeling
The progress of decolorization of methylene blue mixed wastewater over time was investigated and shown in Figure 4 in terms of changing methylene blue concentration. The graphs presented in Figure 5 belong to the kinetic models of the decolorization of methylene blue-containing water. Table 8 shows the parameters of the kinetic models. According to the table, the pseudo-first-order model was found to be more suitable for the process as it provided a higher R2 value than the pseudo-second-order model. In addition, the experimental qe value of 8.53 mg.g−1 was found to be closer to the first-order model than the pseudo-second-order model. The pseudo-first-order model provides information about the physical processing of decolorization (Ma et al., 2021). This physical interaction is reversible (Kadiri et al., 2021). It may also show that methylene blue molecules are located in a single layer on the modified vermiculite surface (Alalwan et al., 2021). It is seen from the table that the intraparticle model can explain decolorization. According to the intraparticle diffusion model curve (very close to the origin but does not pass through the origin), intraparticle diffusion is not the only effective step to control the rate (Azad et al., 2021; Zbair et al., 2019).

Progression of the decolarization over time.
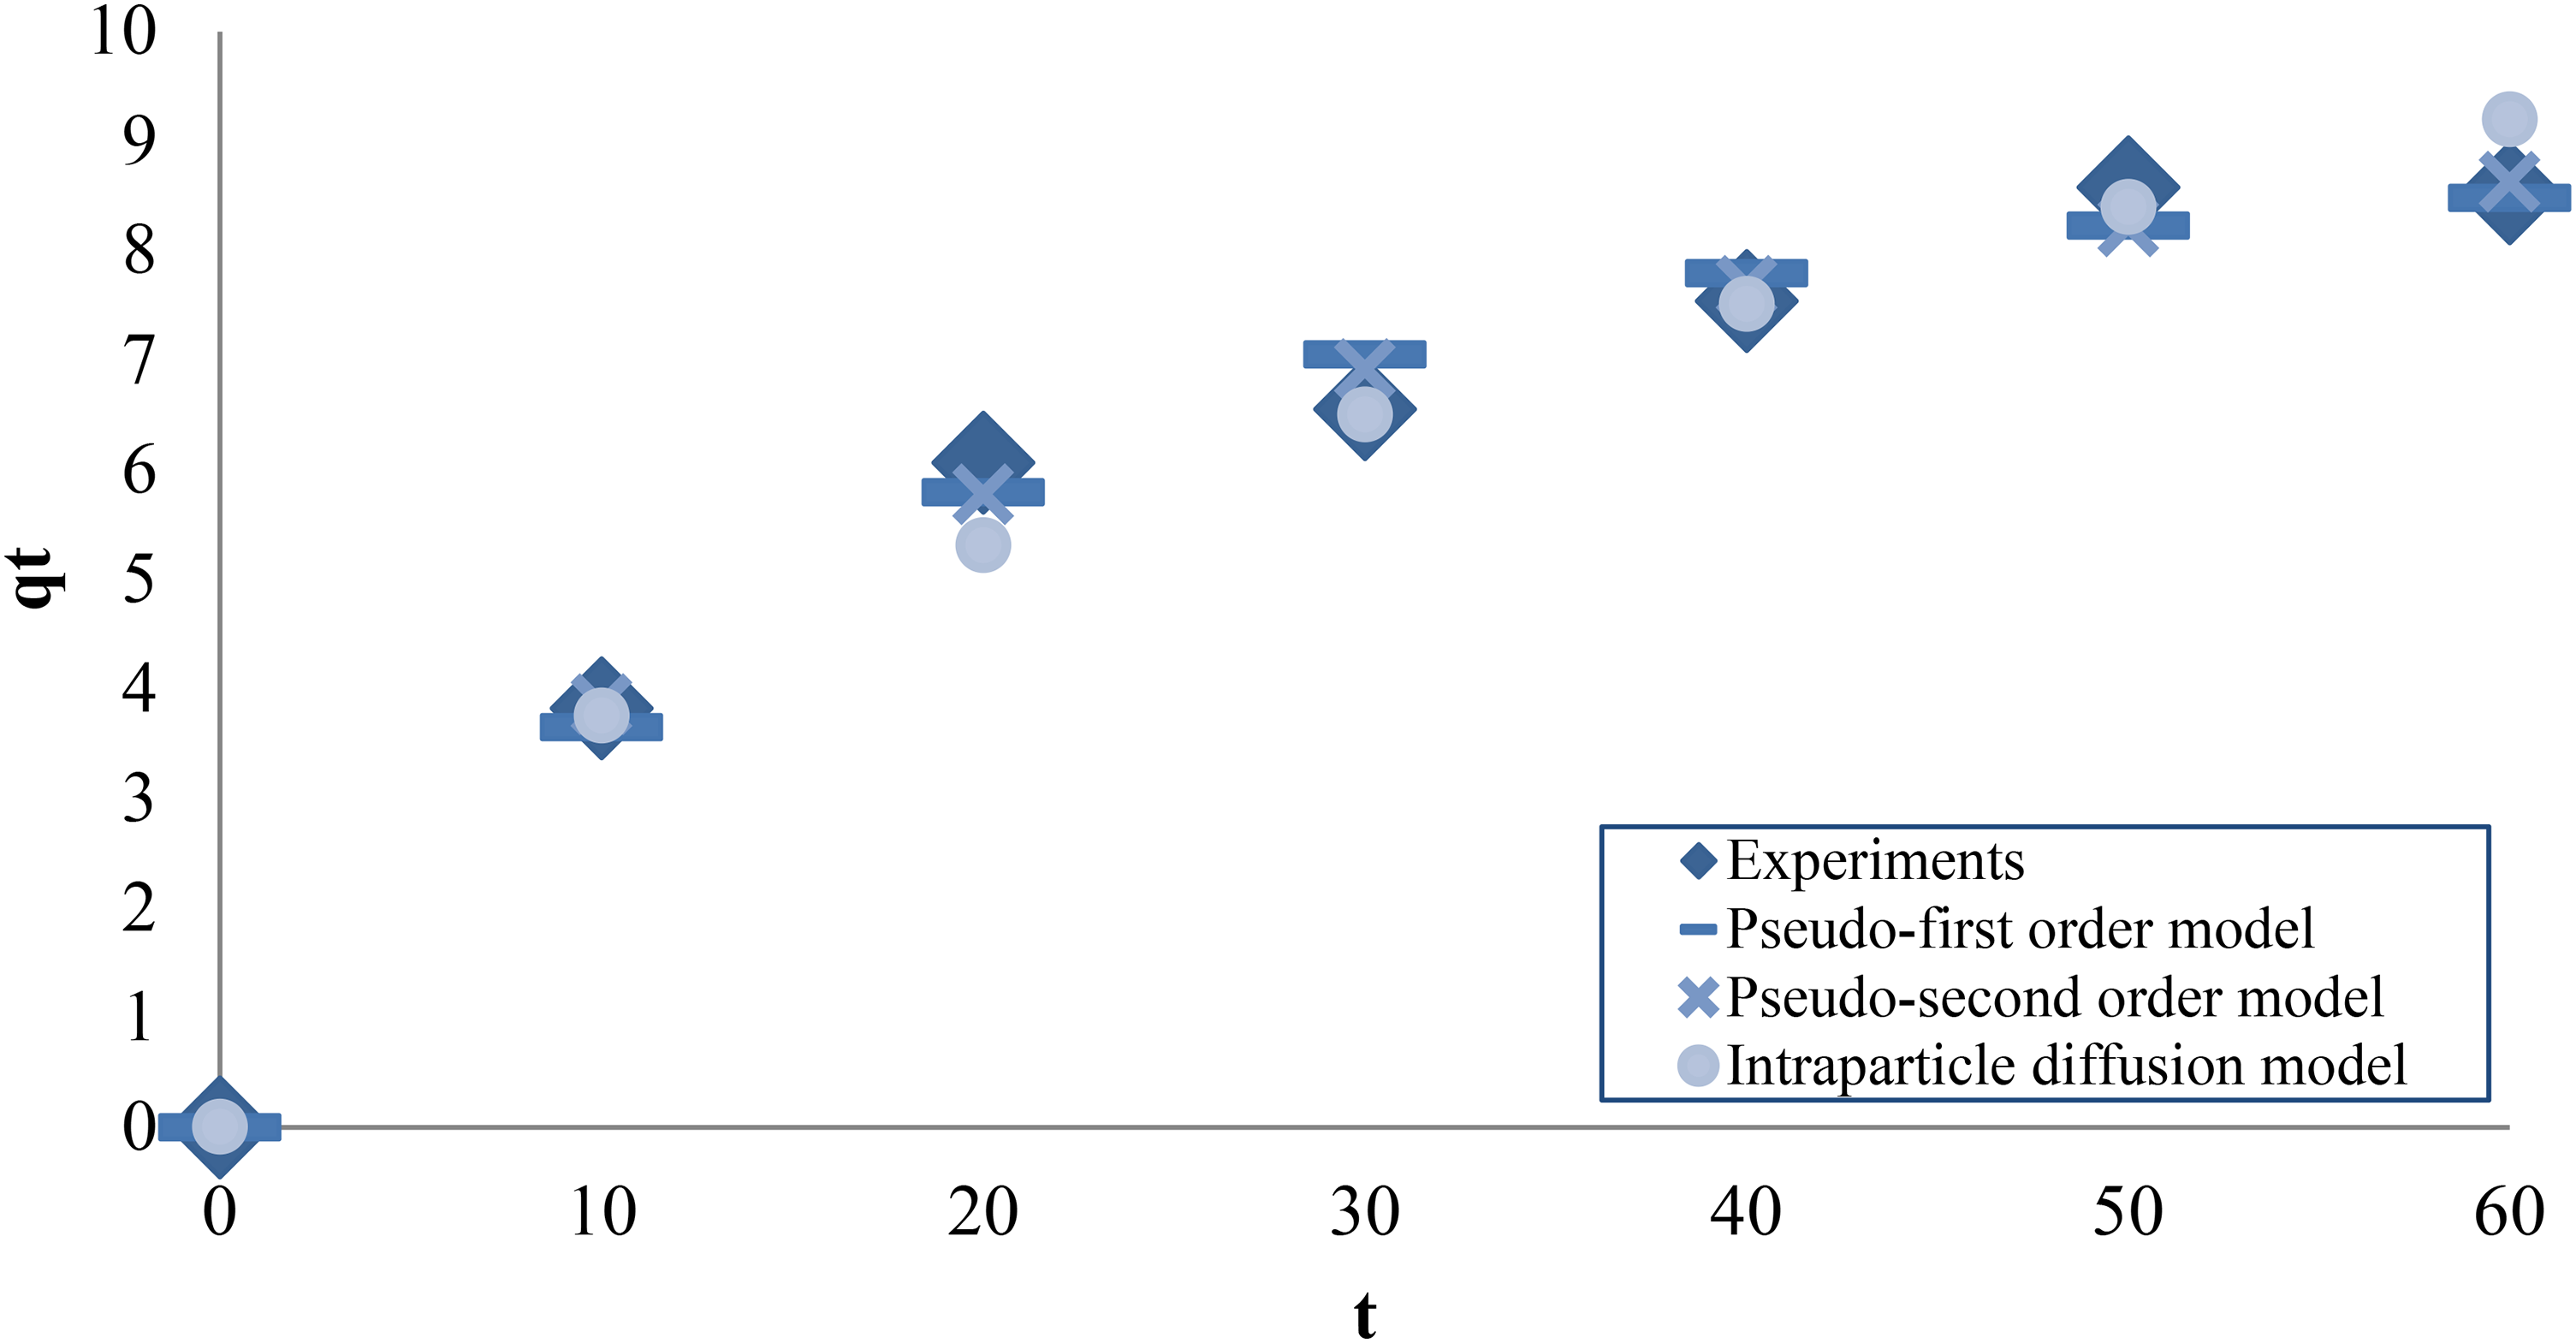
Kinetic model plots.
Kinetic model parameters.

Analytical assessment
Chemical composition
XRF analysis was performed to detect the elemental and oxide composition of vermiculite and its modified form. Table 9 shows the results for elemental and oxidized forms greater than 1%. According to Table 9, it was determined that Si, Mg, Al, and Fe, known as the main elements of vermiculite, were at the highest rates, respectively. It can be seen in the elemental results of modified vermiculite that percentage values for Na and Cl were obtained by modifying it using NaCl. It was determined that the decreasing composition percentage of the elements in oxide form for vermiculite was SiO2, MgO, Al2O3, Fe2O3 and K2O, respectively. For modified vermiculite, SiO2, MgO, Al2O3 and Fe2O3, as well as Na2O originating from the modification agent were found in the composition.
XRF analysis results.

Phase analysis
Crystalline phases for vermiculite and modified vermiculite were identified by XRD analysis (Figure 6). Vermiculite gave peaks at 6.102, 18.438, 24.662, 30.968 and 43.95° for 2Θ. These peaks indicate the characteristic vermiculite (002), hydrophlogopite, vermiculite, augite, and vermiculite, respectively (Luo et al., 2023; Yang et al., 2023; Hou et al., 2022b; Hou et al., 2022a). After modification, it gave peaks at 4.21, 7.211, 8.754, 29.231, 31.13 and 44.38° for 2Θ. The broad peak at 4.21° that appears with the modification indicates the presence of some irregular voids with an amorphous structure (Li et al., 2024). The 7.211° peak is the characteristic vermiculite peak (Rabello and da Conceição Ribeiro, 2021). The 8.754° peak indicates mica (Yang et al., 2023). Augite peak appeared at 29.231, 31.13 and 44. 38° (Hou et al., 2022b; Hou et al., 2022a).

XRD patterns of (a) vermiculite and (b) modified vermiculite.
Textural analysis
BET analysis was performed to investigate the surface area and pore width of vermiculite before and after modification. BET analysis results are listed in Table 10. As seen in Table 10, vermiculite exhibited a higher BET surface area after the modification process was applied. Thus, modified vermiculite has become more suitable for decolorization than raw vermiculite. Additionally, pore width was found to be lower for modified vermiculite. Similar to Liu et al.'s study of biochar modified with CaCl2, this may be due to the Na content in vermiculite modification (Liu et al., 2024).
BET analysis.

Nitrogen adsorption/desorption isotherms of the vermiculite and modified vermiculite are given in Figure 7. Adsorption and desorption curves resulted in type IV isotherms and H3 hysteresis loop for both materials (Pang et al., 2021). Type IV isotherm and H3 hysteresis loop highlight the meso-sized and slit pores of vermiculite and its modified form (Brigante and Schulz, 2012; Behera et al., 2024).
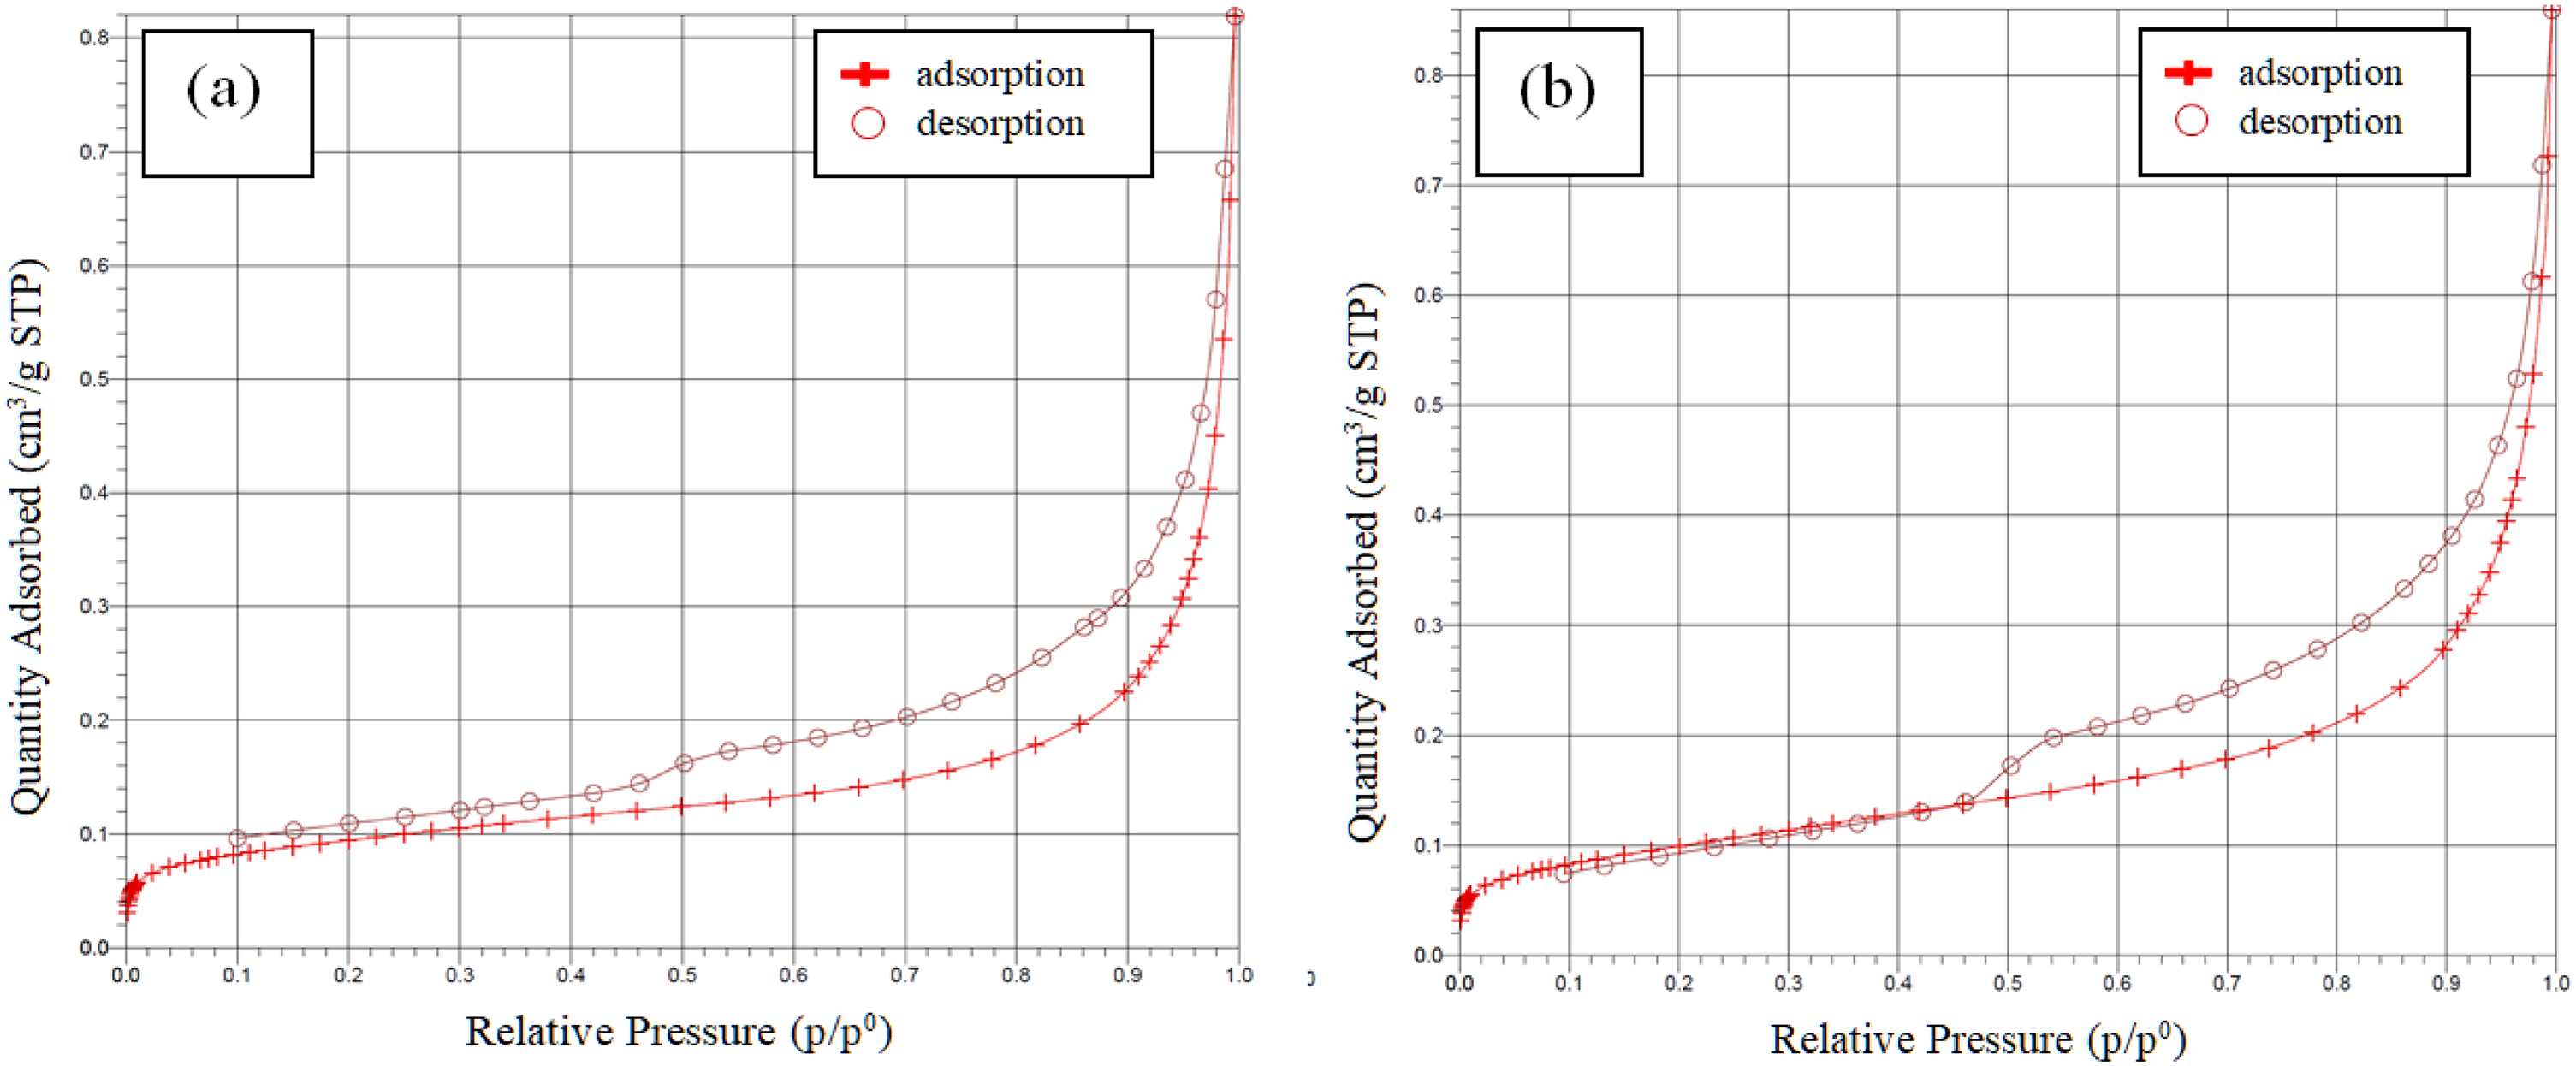
Nitrogen isotherms of (a) vermiculite and (b) modified vermiculite.
Functional group analysis
FTIR spectra for vermiculite and modified vermiculite are seen in Figure 8. As seen in the figure, the FTIR spectra of vermiculite and modified vermiculite almost completely overlapped with very small changes in the locations and intensities of the peaks, and as a result, they were determined to have similar functional groups. In Table 11, the wave numbers at which peaks appear for vermiculite and modified vermiculite are given.

Infrared (IR) spectra.
Functional group analysis.

Thermal analysis
The weight change of vermiculite and modified vermiculite depending on temperature was followed by TGA, and the resulting graph is presented in Figure 9. Both materials exhibited weight loss due primarily to physically adsorbed water and initial hydration of interlayer cations (Marzec et al., 2021). The water remaining bound to the cations in the vermiculite interlayers was also removed by a second weight loss (Ma et al., 2019). Then, in the final stage of vermiculite and also seen in modified vermiculite, weight loss occurs due to dehydroxylation (Rama et al., 2019).

TGA curves.
Conclusion
In this study, decolorization of wastewater containing methylene blue was carried out with vermiculite modified using NaCl. For decolorization, experiments were carried out related to Taguchi method and the L16 (45) orthogonal array obtained according to the design. Taguchi method listed the importance of factors as concentration > amount > pH > time > temperature. It presented that pH 3, 60 min, 5 mg.L−1, 2 g.L−1 and 50°C conditions are optimum for the decolorization process. According to Langmuir isotherm, methylene blue molecules are settled in a single layer on the surface of the modified vermiculite, and Dubinin–Radushkevich isotherm indicates that this surface has heterogeneous energy regions. The pseudo-first-order kinetic model explained the reversible physical processing of decolorization. The intraparticle diffusion model is also involved in the decolorization. Si, Mg, Al, and Fe, the main elements of vermiculite and modified vermiculite, were detected by XRF analysis. Crystalline phases were identified by XRD analysis. BET analysis showed that by modifying vermiculite, the BET surface area increased and the pore size decreased. Nitrogen isotherms revealed meso-sized and slit pores of vermiculite and modified vermiculite. Quite similar functional groups of both materials were demonstrated by FTIR analysis. TGA was used for thermogravimetric examination of materials between 30 and 1000°C, and mass losses were identified.
Footnotes
Declaration of conflicting interests
The author declared no potential conflicts of interest with respect to the research, authorship, and/or publication of this article.
Funding
The author received no financial support for the research, authorship, and/or publication of this article.