
Abstract
Solar photovoltaic (PV) technology has developed rapidly in the past decades and is essential in electricity generation. In this study, we demonstrate the relationship between PV incentive policies, technology innovation and market development in China, Germany, Japan and the United States of America (USA) by conducting a statistical data survey and systematic literature review. This article investigates the key policies affecting the development of PV technology from the perspective of solar PV Research and Development (R&D), industry, and market development. Our study highlights how these different kinds of policies drive the countries to change their role on the global stage. The results show the performance of supply-push policies and demand-pull policies during different periods and their significant impact on PV development, while it presenting future challenges and recommendations for PV development. Our study contributes to improve the understanding of PV technology innovation, its market development, and policy evolution through a multiple-perspective analysis of PV development processes.
Introduction
Since the 1970s, due to the limited supply of fossil energy and increasing pressure regarding environmental protection, numerous countries worldwide have begun to exploit and utilize renewable energy. Among all renewable energy sources, solar photovoltaic (PV) technology has a huge potential in alleviating pollution, reducing CO2 emissions and addressing energy demand pressures (Sen and Ganguly, 2017). Therefore, promoting solar PV technology has become a vital part of sustainable development strategie worldwide. In the last few decades, driven by advanced technology and improved regulations, solar PV technology has experienced grown rapidly (Sovacool and Gilbert, 2013).
The first PV device was invented by Bell Labs in the United States of America (USA) in 1954 and mainly applied to space satellites (Hart and Birson, 2016). From the 1960s to the 1990s, the United States took the lead in PV technology. Platzer et al. (Platzer, 2016) pointed out that the introduced incentive policies were the key factors to affecting the PV deployment and that they helped to initiate the early niche markets in the United States. Since the 1990s, Japan and Germany have become the leading countries in solar PV development. Jacobsson et al. (Jacobsson et al., 2004) examined the development of solar cells in Germany from 1958 to 2000 and emphasized the importance of market formation policies for PV technology development to maintain technological variety. Watanabe et al. (Watanabe et al., 2000) demonstrated the government’s incentive policy creating a “virtuous cycle” between R&D, market growth and price reduction on the basis of an empirical analysis of Japan’s firm-level PV R&D. After 2000, the German PV market grew rapidly and the country was the leader during this period. Blankenberg et al. (Blankenberg and Dewald, 2013) discussed the evolution of PV technology in Germany and explained that the trigger of this development were demand-side policy instruments of feed-in tariff (FiT). In the following years, the successful expansion of the German PV market promoted the diffusion of FiT to other countries; the Chinese PV industry has been significantly affected by the German PV market since 2000. Zhang et al. (Zhang and Sims, 2016) indicated that the main drivers of PV technology transferred from the global innovation system to China were global market changes, formation of policy, international mobilization of talent, and flexibility offered byChinese manufacturing. After 2011, China’s PV market also began to growth rapidly. Zhang et al. (Zhang and He, 2013) pointed out that China relied on the FiT scheme to stimulate local PV market development, whichhelped the domestic PV industry to overcome the difficulties caused by anti-dumping actions in USA and Europe. Muhammad-sukki et al. (Muhammad-Sukki et al., 2014) indicated that Japan through the FiT scheme, achieved rapid growth in the domestic PV market after the Fukushima disaster These studies show that policy instruments have been the key factor driving the global development of PV technologies.
Hoppmann et al. (Hoppmann et al., 2014) used the innovation system approach to analyze the evolution of the FiT, and explained how this policy affected PV development in Germany. The authors confirmed that the policy issues were driven by unforeseen technological developments induced by previous policy interventions. Huang et al. (Huang et al., 2016) focused on understanding the rapid rise of the Chinese PV industry and concluded that the rise of the Chinese PV industry can be explained by the interaction of three factors: the change in Chinese institutions, technology transfer, and its large European selling market. Hart and Birson et al. (Hart and Birson, 2016) traced the history of PV deployment in the USA and found that solar PV with federal subsidies alone, was economically viable. Those studies have determined the importance of policy impact on PV development in the fields of R&D, industry, and market development by examining PV development process in each country.
A comparative study of several countries can also contribute to determining the advantages of PV policies and the results of their implementation. Chowdhury et al. (Chowdhury et al., 2014) showed the impact of policies on the diffusion of PV technology in Germany and Japan and identified that the policies implemented during different periods are the key factors that affected the diffusion of PV in both countries. Grau et al. (Grau et al., 2012) surveyed policies and industrial actors in Germany and China and concluded that incentive policy in the field of PV R&D is weak in Germany. Quitzow (Quitzow, 2015) showed that there were a set of dynamic and mutual interdependencies between Germany and China, which promoted the development and diffusion of PV technology in those countries. Strupeit et al. (Strupeit and Palm, 2015) investigated organizational configurations related to the deployment of customer-oriented PV systems in Germany, Japan and the USA. Their research showedhow the business models in the three countries successfully removed typical barriers to PV adoption. Solangi et al. (Solangi et al., 2011) provided a comprehensive review of solar PV technology in terms of the efficiency of photovoltaic materials in five leading countries and discussed the driving policies, funding, and R&D activities to comprehend the reasons behind the success of the leading countries in adopting PV technologies. The authors found that the FiT, Renewable Portfolio Standard (RPS) are the most beneficial energy policies implemented by several countries worldwide.
In this paper, we present a detailed analysis of the rise of solar PV technology in China, Germany, Japan, and the USA. We demonstrate the effects of different incentive policies implemented over the past decades on PV development in these four leading countries. At different development periods, some special external factors may have guided the introduced policy, and the type of policy implemented may vary across different countries. Therefore, we systematically trace the trajectory of the PV incentive policy from three aspects: R&D, industry and market. The industry refers to the entire supply chain of PV product manufacturing, and the main indicators include the output of PV technology products. The market refers to the PV energy market scale, and the main indicators include the installation capacity of solar PV energy. The role of policy instruments and international factors was investigated. Thereafter, we identify different policies and examine how they have driven PV development in China, Germany, Japan, and the USA; we also try to understand the interaction between government policies and PV technology development. Finally, we present future challenges for PV development in the four mentioned countries and provide some recommendations.
Data source mining and methodology
Data source
In this paper, research data were obtained from publicly available sources and secondary literature, such as academic and professional journals, reports, and websites. This study adopted databases and keyword searches to identify articles related to PV technology and incentive policies. Relevant literature reviews of PV development mainly used multiple databases such as Web of Science and Scopus. We also obtain data from different sources of information to guarantee validity. The first source was the annual report from the International Energy Agency (IEA), Fraunhofer Institute for Solar Energy Systems (Fraunhofer ISE), and REN21. The cost and price data of PV production and PV installed capacity from these reports were used to analyze different fields in the PV industry. The second source was the IEA’s online data services and policy database, and it was used for policy investigation. Other sources were scientific, technical, conference articles, press releases, policy documents, and technical and government reports. We conducted a systematic literature review and used several literature systems to retrieve relevant publications; finally, we identified a combination of keywords as follows: “solar PV development or diffusion”, “solar PV R&D or industry or market”, and “China or Germany or Japan or the United States”.
Methodology
We used a case study approach in this paper, we conducteds an in-depth study of one or more cases (based on the research question) by obtaining reliable historical data (Yin, 2009). In this paper, how policy influencing PV development in different periods is traced by four countries as study cases. The research structure of this study is presented in Figure 1. First, we trace the evolution of PV incentive policies in China, Germany, Japan and the USA. Detailed data were obtained via data mining by investigating PV development in three fields: PV R&D activities, PV industry and PV market. The purpose of this investigation is to clearly identify key incentive policies related to different fields in the PV development process, such as renewable energy targets, R&D funds, net-metering, and feed-in tariffs. These policies can be divided into two main categories, supply-push policies and demand-pull policies (Fabrizio et al., 2017; Nemet, 2009; Nuñez-jimenez et al., 2019). The main difference between of those policies is that supply (technology) push policies are aimed at providing R&D and manufacturing support to industry, while demand-pull policies are aimed at stimulating the market demand for a certain technology (Hansen et al., 2017; Samant et al., 2020). Second, we analyze the role of the push and pull policies in the three fields of PV by investigating on PV R&D activities, PV industry development, and PV market development. We examine the supply-push policies and analyze their impact on PV R&D and industry. The main indicators are public funds for PV R&D, PV module cost reduction, and production share changes. Then, we analyze the impact of demand-push policies on PV market development, in which the main indicator is the change in PV market scale and market share. The three fields of PV technology are relevant under the expectation of internationalization. Global dynamics across the four countries are also accounted for. Finally, we provide an outlook on the future of PV technology in the four countries and present future challenges and policy recommendations based on the current situation.
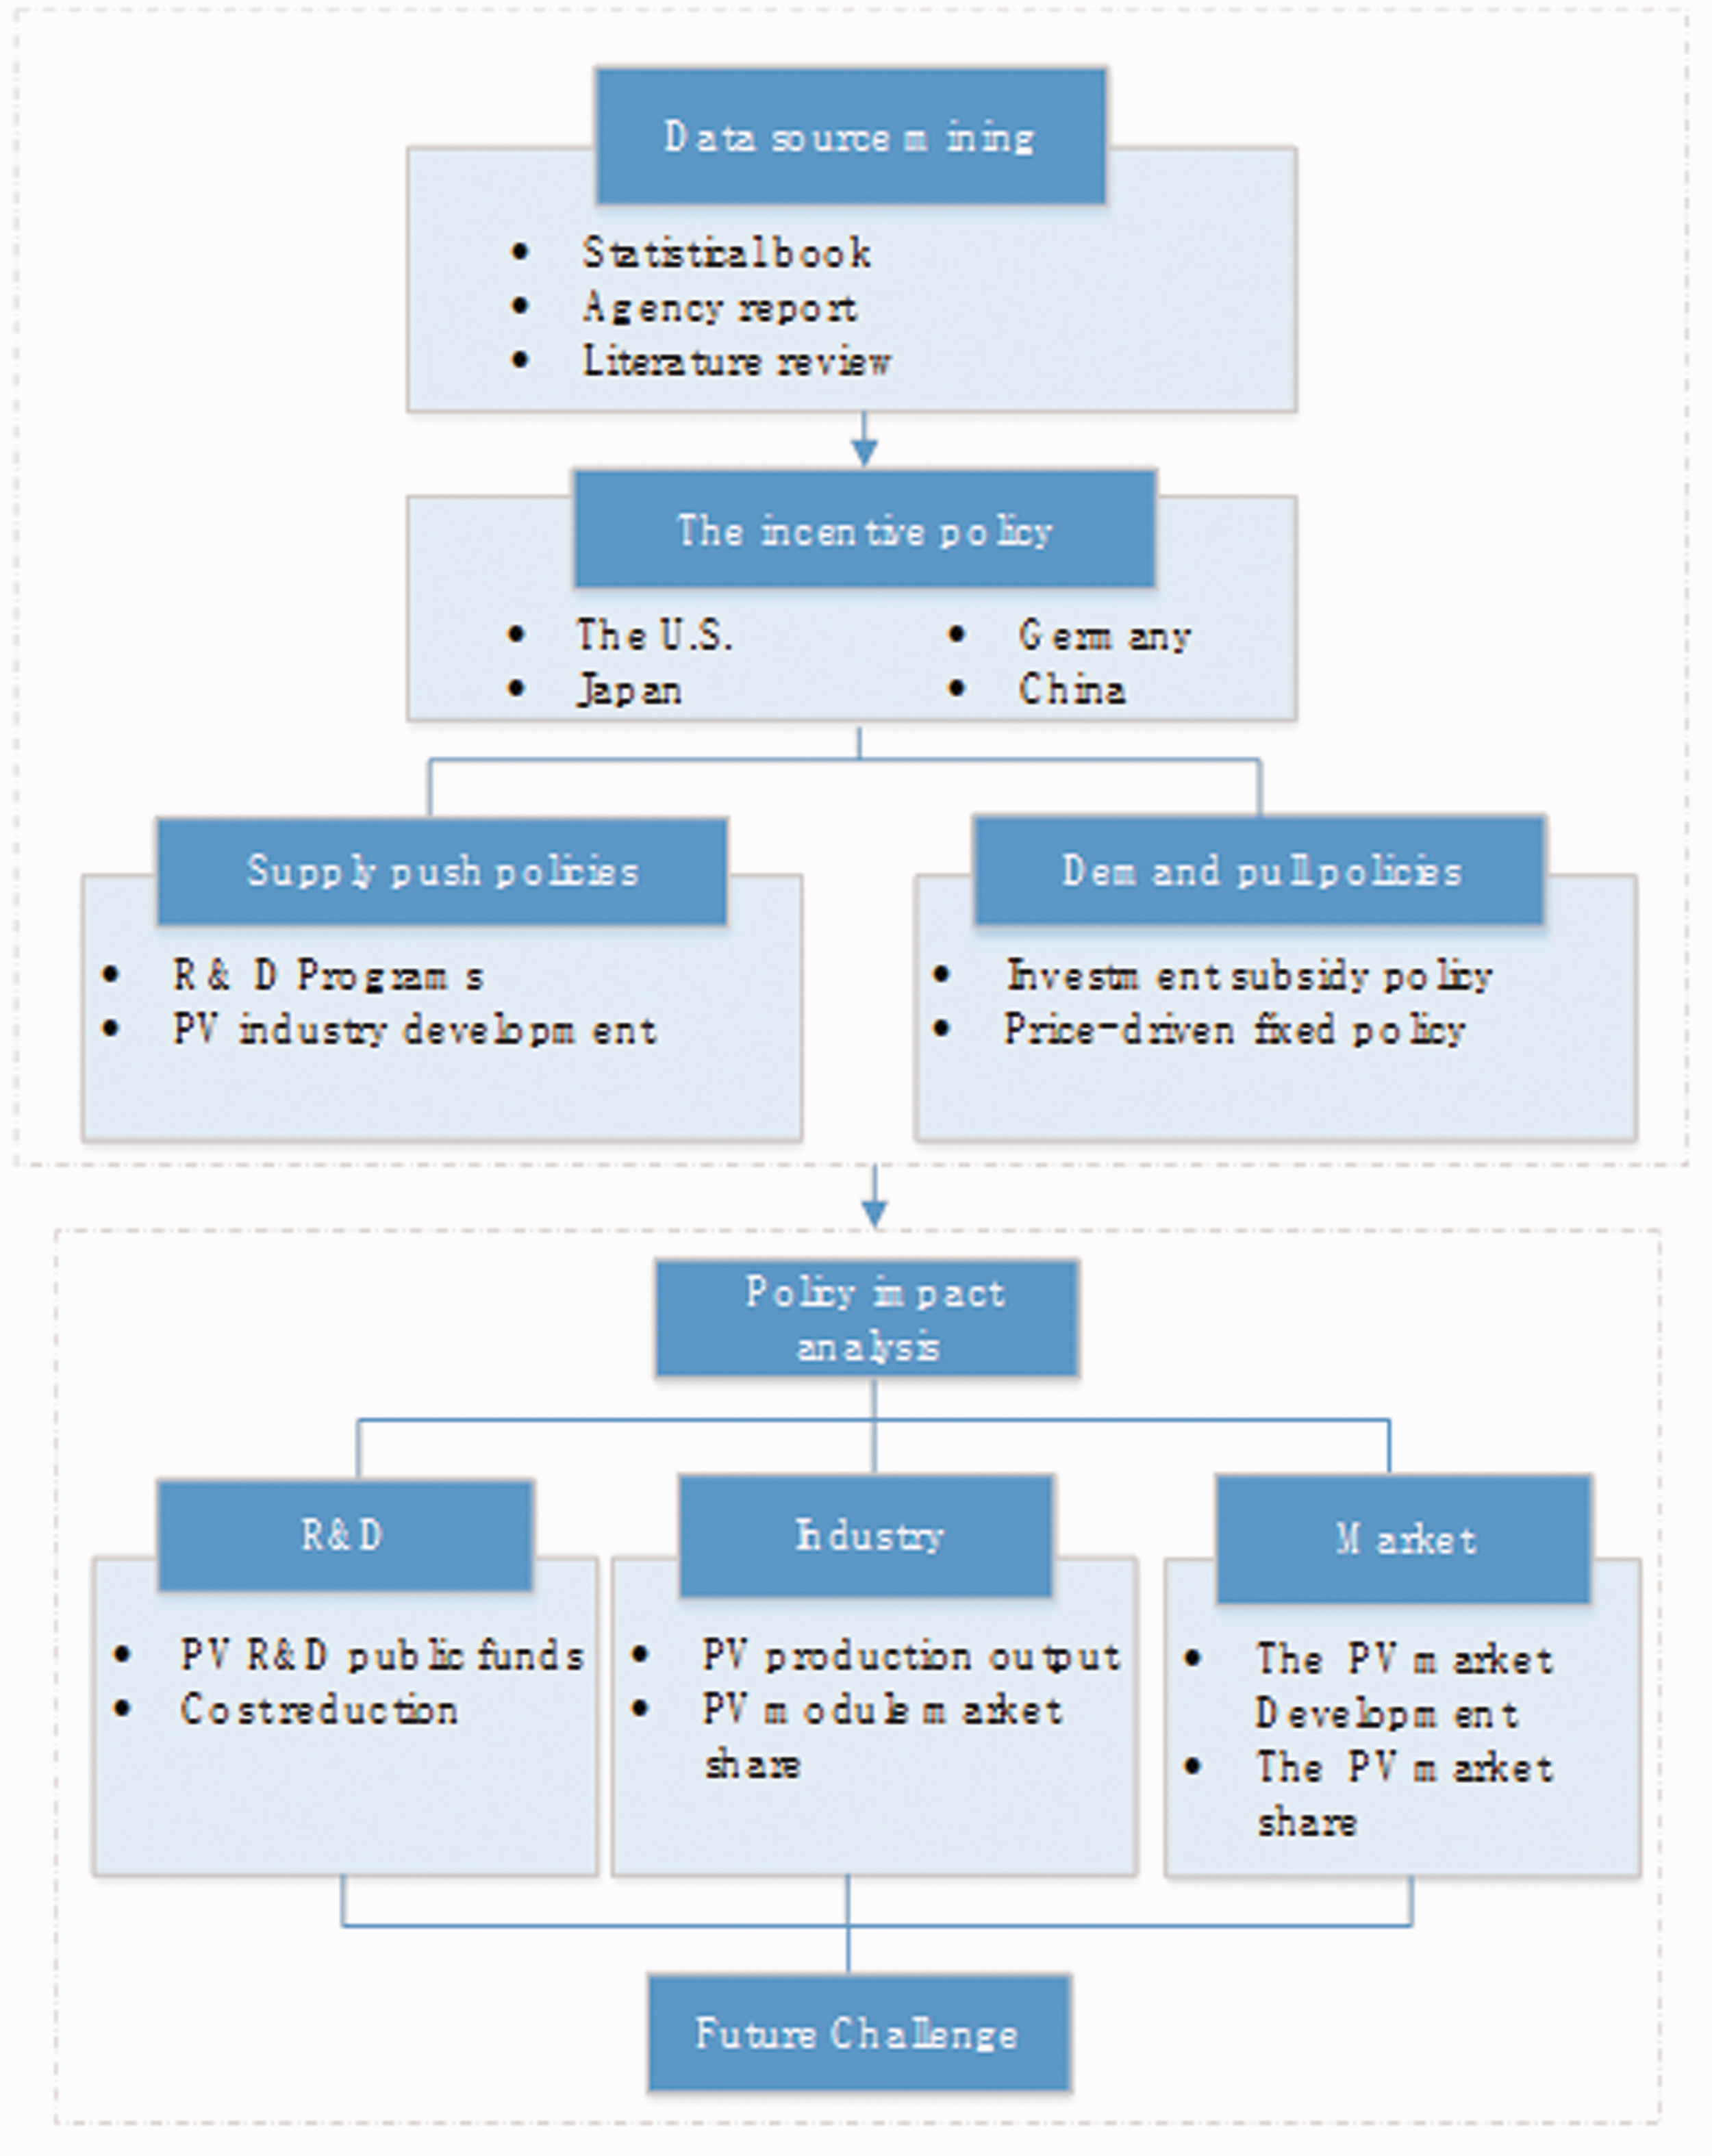
Research structures.
Investigation of PV incentive policy in China, Germany, Japan, and the USA
Investigation of PV incentive policies in China, Germany, Japan, and the USA before 2000
Table 1 shows the history footprint of incentive policies for solar PV technology development in China, Germany, Japan, and the USA. Supply-push policies and demand-pull policies have played important roles during the different periods of development. In the USA, the 1973 oil crisis triggered a serious push to develop PV terrestrial applications. The Electrical Research and Development Association (ERDA) purchased almost 2000 kW of capacity between 1977 and 1980 (Hart and Birson, 2016). The Department of Energy (DOE) began operations in 1977, which directed the USA’s Solar Energy Technologies Program (SETP) through its Office of Solar Energy Technologies (Clark, 2018). The “Public Utility Regulatory Policy Act of 1978” provided tax credits for residents who invested in solar energy in an attempt to initiate a small niche PV market. The demand from these sources stimulated the establishment of PV module factories during the late 1970s (U.S.DOE, 2020). In 1977, the Solar Energy Research Institute (SERI) began operating as a laboratory dedicated to the R&D of renewable energy. Furthermore, the PV R&D program expanded significantly, reaching USD 157 million in 1980 (U.S. DOE, 2010). In 1991, SERI designated a national laboratory to renewable energy and subsequently renamed it the National Renewable Energy Laboratory (NREL). The NREL and Sandia National Laboratories (Sandia) are dedicated to solar PV R&D. The reduced PV investment costs through R&D breakthroughs and manufacturing process improvements as well as incentives facilitated growth of more niche markets (Norberg-Bohm, 2000). However, dropping oil and gas prices have considerably exacerbated the cost reduction challenge and diminished public interest in solar energy.
The PV incentive policies in China, Germany, Japan and the USA.
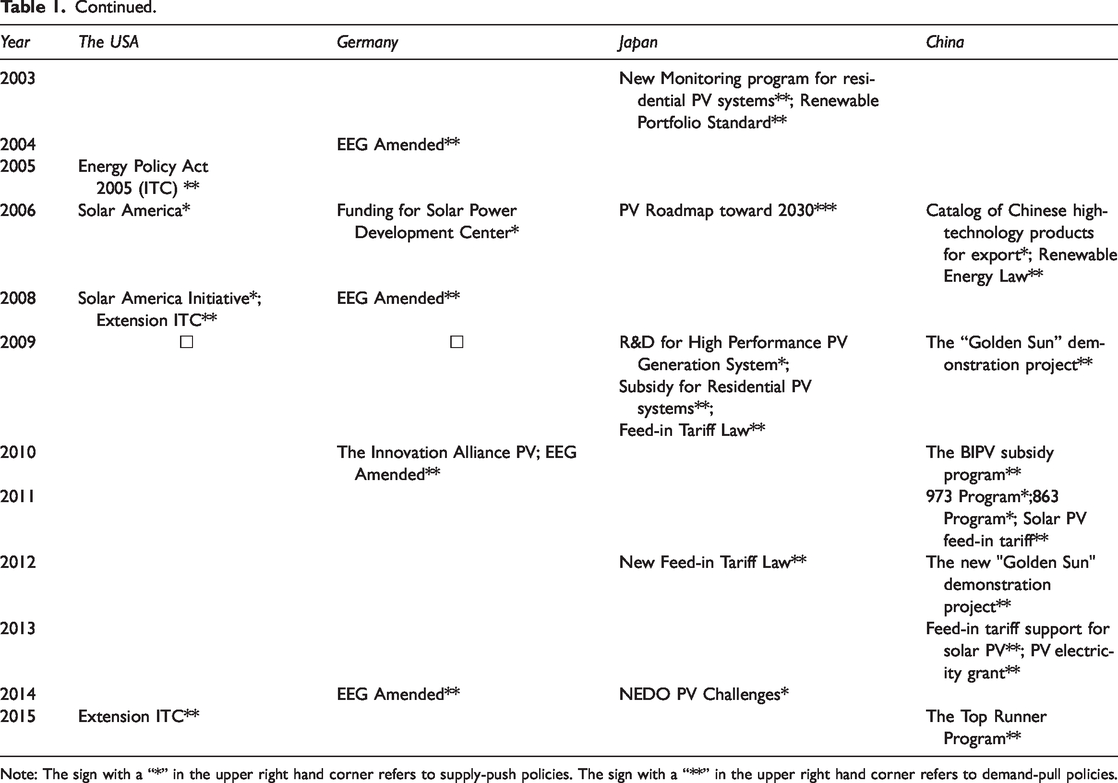
Note: The sign with a “*” in the upper right hand corner refers to supply-push policies. The sign with a “**” in the upper right hand corner refers to demand-pull policies.
In Germany, the Federal Ministry of Economics and Technology (BMWi) was responsible for applied energy research as well as market promotion (Jan Frederik Braun, 2019). In 1977, the government beginning introduced the an “Energy Research and Technology Program” to for facilitating the budget distribution of the budget to the various sectors of PV R&D. In 1990, the German government started a “1000 Rooftops Program” (Mints, 2012). This program was an important attempt to promote the PV market, and it intended to obtain experience in PV system installation and encourage investment in solar energy (NIR, 2018). With thire successful experience in the “1000 Rooftops Program”, the government expanded the program to the “100,000 Rooftops Program” in 1999 (ERGE et al., 2001). These demonstrations created a niche market for solar PVs (Hoppmann et al., 2014). At the same time, the “Feed-in Tariff (FiT) Law”, which was implemented in 1999 was further enhancing German PV market formation (IEA, 2000). With the start of the 4th Federal Program on Energy Research and Energy Technology in 1996, “Way Paving Program Photovoltaic 2005” program was formulated (Hongxing and Yutong, 2007). This long-term program focused on cost reduciton in PVs and their grid-independent system applications. Public R&D funds and demonstration programs encouraged private firms to enter the market as well, such as large electronic or chemical companies,and to invest in PVs. However, the high cost of solar energy limited PV market development, which was not large enough to justify investments in new production facilities. The German PV firms bought U.S. firms and expanded their production in USA and the production of solar cells in Germany dropped to nearly nil (Jacobsson et al., 2004).
In Japan, the Ministry of Economy, Trade and Industry (MITI) has been actively driving promotion measures and policies for R&D for renewable energy in Japan. After the first oil crisis, the Japanese government was aware of the importance of energy security and energy independence (Watanabe, 1999). In 1974, MITI implemented a “New Energy Technology Research and Development Plan” to provide a substantial amount of renewable energy by 2000 (Kimura, 2006). The New Energy and Development Organization (NEDO) was established in 1980 as the central actor responsible for new energy development (Yamazaki, 2016). The NEDO took a four-year demonstration project from 1986 to 1990, which provided a niche market to PV manufactures in the country. Sharp, Sanyo and Kyocera continued to implement the program and became the leading companies in solar PV manufacturing in Japan. These firms established the Japan Photovoltaic Energy Association (JPEA) in 1987, this was a PV industry coalition group that aimed to promote the utilization of solar PV technology(Kimura, 2006). In 1992, the first demand-pull policy called “Net-Metering (Billing) Program” for PV market development was introduced. This program was initiated by 10 domestic electrical enterprises (Suwa and Jupesta, 2012). In the following year, a specific guideline related to grid connection for solar PV called “Monitoring Program for Residential PV Systems” was implemented by the government (Kaizuka, 2012). In 1993, the “Sunshine Program” merged with the “Moonlight Program” and the “R&D Project on Environmental Technology” in the form of the “New Sunshine Project” was implemented, which focused on promoting comprehensive and long-term R&D for PV technology (Tatsuta, 1996). Most PV R&D activities were performed by PV manufacturers, including basic research (IEA, 2017).
In China, the State Scientific and Technological Commission was set up by the China Optics and Electronics Technology Centre in 1980s, which began research of monocrystalline silicon solar cells and polysilicon silicon solar cells (Wang et al., 2018). In the 1990s, apart from importing PV technology, R&D activities were carried out only in a few PV companies and some Chinese universities (Zhao et al., 2013).
PV incentive policy in China, Germany, Japan, and the USA after 2000
Consistent public funding for PV R&D has helped the USA become the technology leader in the solar PV industry. Until 2006, the DOE was appropriated USD 5.8 billion for solar research (U.S. DOE, 2006). The “U.S. Photovoltaics Industry Roadmap”, which was refined in December 2000 and updated in 2004, unifies the long-term (2000–2020) strategies and goals for the PV industry in the country (Farris and Industries, 2003; IEA, 2018). The production targets of the U.S. PV industry roadmap reveal that 70% of the production capacities are aimed for export. This series of efforts by the policy instruments facilitated expansion of the PV industry in the USA (IEA, 2003, 2011). In 2005, the “Energy Policy Act 2005(ITC)” was introduced to promote PV market development, which provided a 30% investment tax credit to those who invested in PV systems. The ITC has proven to be one of the most important federal policy mechanisms to incentivize PV development in the USA. This Act was complemented by accelerated depreciation, which added approximatedly 26% to the tax benefit; thus, reducing the system cost by approximatedly 56% over a six-year period for many investors (IEA, 2009; SEIA, 2016). The residential and commercial ITC has helped the solar PV market to grow significantly since it was implemented, with an average annual growth of 50% over the last decade alone (IEA, 2004). The ITC Act 2005 was implemented until the end of 2007. Thereafter, the ITC Act was extended in 2008 and 2015 to ensure continued growth of the PV market. In 2007, the Solar America Initiative (SAI) funded up to USD 13.7 million for 11 university-led projects that focused on the development of advanced solar PV technology manufacturing processes and products (IEA, 2011). During 2009–2011, public funds for PV R&D exceeded USD 400 million in the USA. In 2011, the “SunShot Initiative” was introduced by the Solar Energy Technologies Office (SETO) of the DOE, which aimed to reduce the total cost of PV solar energy systems by 75% by 2020 (U.S. DOE, 2015). As solar PV technology made rapidly progressed closer to the 2020 targets, the SETO committed to reaching new cost targets for the upcoming decade, supporting greater energy affordability by reducing the cost of solar electricity by an additional 50% between 2020 and 2030. The SunShot 2030 targets were 0.05 USD/kWh for residential PV, 0.04 USD/kWh for commercial PV systmes, and 0.03 USD/kWh for utility-scale PV systems (U.S. DOE, 2017).
In Germany, the “100,000 Rooftops Program” and the EEG (FiT) scheme became an opportunity for rapid growth in the PV market since 2000 (Dewald and Fromhold-Eisebith, 2015). The FiT scheme has driven the rapid growth of the market, which has grown consistently the government targets; the growing PV market has become an opportunity for new companies to enter the PV industry (Ito, 2011). Therefore, the government of Germany reformulated the R&D program emphasizing not only cost reduction but also on the consequent utilization of the R&D results in PV production. Since autumn 2002, the Federal Ministry of Environment (BMU) has been responsible within the federal government for promoting renewable energy development (Altenhöfer-Pflaum, 2003). In 2006, in addition to BMU grants, the Federal Ministry of Education and Research (BMBF) also provided funding for the development of PV technologies (Agency et al., 2007). In 2010, the BMU and BMBF initiated an Innovation Alliance for PV technology. Under this scheme, the R&D projects were funded to support a significant reduction in PV production costs for enhancing the competitiveness of the German PV industry. The BMU and BMBF allocated EUR 100 million to support this initiative. The German PV industry agreed to raise an additional EUR 500 million to accompany the Innovation Alliance (IEA, 2010). To streamline the German energy policies, the responsibility for all energy-related activities was concentrated within BMWi since the end of 2013 (Wehrmann, 2018). The EEG has accelerated the growth of PV market, which has been consistent and has surpassed the government targets. Therefore, the government further fundamentally revised the EEG in 2014 (Wirth, 2017).
In Japan, a new R&D program called “the new 5-year plan for PV power generation technology R&D”, was initiated in 2001. This program focused on four areas: advanced solar cell technologies; comprehensive introduction of common basic PV technologies; innovative next-generation PV power technologies, and advanced manufacturing technology of PV systems. In 2006, the new 5-year plan was completed, and then a 4-year plan was launched based on “PV Roadmap toward 2030 (PV2030)” plan (Kosuke, 2007). The “R&D for high performance PV generation system for the future” and “R&D on innovative solar cells” were initiated in 2009; these plans aimed to make a breakthrough in next-generation solar cells were governed by the Ministry of Education, Culture, Sports, Science, and Technology (MEXT) and were promoted by the Japan Science and Technology Agency (JST). A new guidance for technology development based on the “NEDO PV Challenges,” formulated in 2014 for technology development, set a target to realize a power generation cost of 14 JPY/kWh by 2020 and 7 JPY/kWh by 2030 (Hahn, 2014). Under the new framework of technological research, NEDO shifted its direction from “strategies to promote dissemination of PV power generation” to “strategies to support the society after penetration of PV power” (IEA, 2014a). On the demand-pull policy side, parallel to a new monitoring program for residential PV systems, the government introduced another renewable energy policy known as the “Renewable Portfolio Standard (RPS)” in 2003 (Ito, 2015). In addition, the FiT scheme for residential PV was adopted in November 2009 (Ogimoto et al., 2013). It was estimated that more than 90% of the PV installations were carried out in residential buildings (IEA, 2012b). With the start of the new FiT Act in 2012, the Japanese PV market entered a new growth phase (Kimura, 2017). For residential PV installations, tariffs with 42 JPY/kWh were paid for 10 years. The non-residential sector had a 40 JPY/kWh paid for 20 years (IEA, 2018). The FiT policy has thus, driven the rapid growth of PV market in Japan.
In China, the Ministry of Science and Technology (MOST) supports PV R&D in universities and research institutions, and provides assistance to enterprises for realizing each of the central government’s “Five-Year Plan” (Huang et al., 2016). In the Plan for New Energy and Renewable Energy Industry Development in the 10th Five-Year (2001–2005) plan, renewable energy was viewed as a significant choice to optimize the Chinese energy structure. The public PV R&D funding increased to USD 6 million per year for the 11th Five-Year Plan (2006–2010). Addtionally, three most significant national research programs that have included are “National Basic Research Program of China (973 Program),” the “National High Technology Research and Development Program of China (863 Program),” and the “Plan of National Key Science and Technology.” These three national research programs were regarded as guidelines for the development of key national strategic technologies in China for renewable energy (Huang et al., 2016). During the12th Five-Year Plan (2011–2015), the support for PV fields covered the entire manufacturing chain. The average annual investment in R&D from MOST was approximately USD 75 million during this period. In 2006, China began to enact the “Renewable Energy Law.” The law was a national framework for promoting renewable energy development. This proved to be a huge driving force for the Chinese PV industry. From 2004, China’s PV production invreased remarkably (Zhang and He, 2013). Benefiting from the assistance of the “Catalog of Chinese High-Technology Products for Export” in the form of tax rebates, free land for factories and low-interest government loans, Chinese solar PV product suppliers expanded their production lines rapidly, especially for PV cells and modules (Jia et al., 2016). Since 2009, the government has attached importance to the domestic PV market and adopted a range of policies to support its development, such as special funds for renewable energy, feed-in tariff subsidies, preferential income tax for high and new technology enterprises, financial aid for PV applications, and demonstration projects. “Rooftop Subsidy Program” and “Golden Sun Demonstration Program” were initiated by the MOST and the National Energy Administration (NEA) (Zhao et al., 2015). In July 2011, the National Development and Reform Commission (NDRC) announced a nationwide FiT policy for the development of solar PV energy (IEA/IRENA Renewables Policies Database, 2016). In August 2013, the NDRC issued a “notice on the role of price lever in promoting the healthy development of the PV industry”. PV power generation was categorized into either distributed or centralized systems (IEA, 2012c). Concerning centralized power generation, the whole country was further divided into three regions based on the solar resource distribution. In particular, the FiT is be guaranteed for 20 years. Thus, the FiT policy has driven the rapid growth of the PV market in China. In 2015, “a Top Runner Program” was introduced to encourage Chinese PV companies to invest in PV R&D (IEC, 2018). With the expansion of the domestic PV market, the PV product capacity in China continues to grow. Until now, the Chinese PV product output and market scale still ranks first worldwide.
Sensitive analysis of impacts on PV development in China, Germany, Japan and the USA
Based on the investigation of PV incentive policies mentioned above, their impacts were analyzed from three perspectives. Further, the linkages and interactions between the three fields were also considered.
PV R&D activities
Figure 2 shows a graphical representation of the public funds for PV R&D in Germany, Japan, and the USA from 2000 to 2017. Supply-side push policies have played a major role in promoting PV R&D activities. The most direct manifestation was the investment in public funding. The USA has maintained a high level of investment in PV R&D. In particular, a significant investment in public funds was made from 2008 to 2013. In this period, the SAI was launched to promote close collaboration between universities and industries to accelerate the commercialization of PV technologies, which would ensure that research results can be quickly implemented in manufacturing processes and deliver market ready-products. Until now, the USA is the only country that has invested the most public funds in PV R&D. Japan invested a large amount of government funds for PV R&D during the early 2000s. This could be attributed to implementation of a new five-year R&D plan for PV to the improve the performance and economics of PV power. From 2009, the “R&D for a high performance PV generation system” was started. R&D investment in Japan increased annually from 2009 to 2012. Annual PV R&D funds have remained constant for Germany since 2000. This can be attributed to the stable implementation of the federal government’s Energy Research Program. In China, in addition to the import of technology, the R&D activity comprised the emergence of only a few PV companies before 2000. Since 2006, China has initiated several national R&D programs; the public PV R&D funding increased to a modest USD 6 million per year for the 11th Five-Year Plan (2006–2010). During the 12th Five-Year Plan (2011–2015), the average annual investment for R&D was approximately USD 75 million, with the supported fields covering entire manufacturing chain (IEA, 2014b).
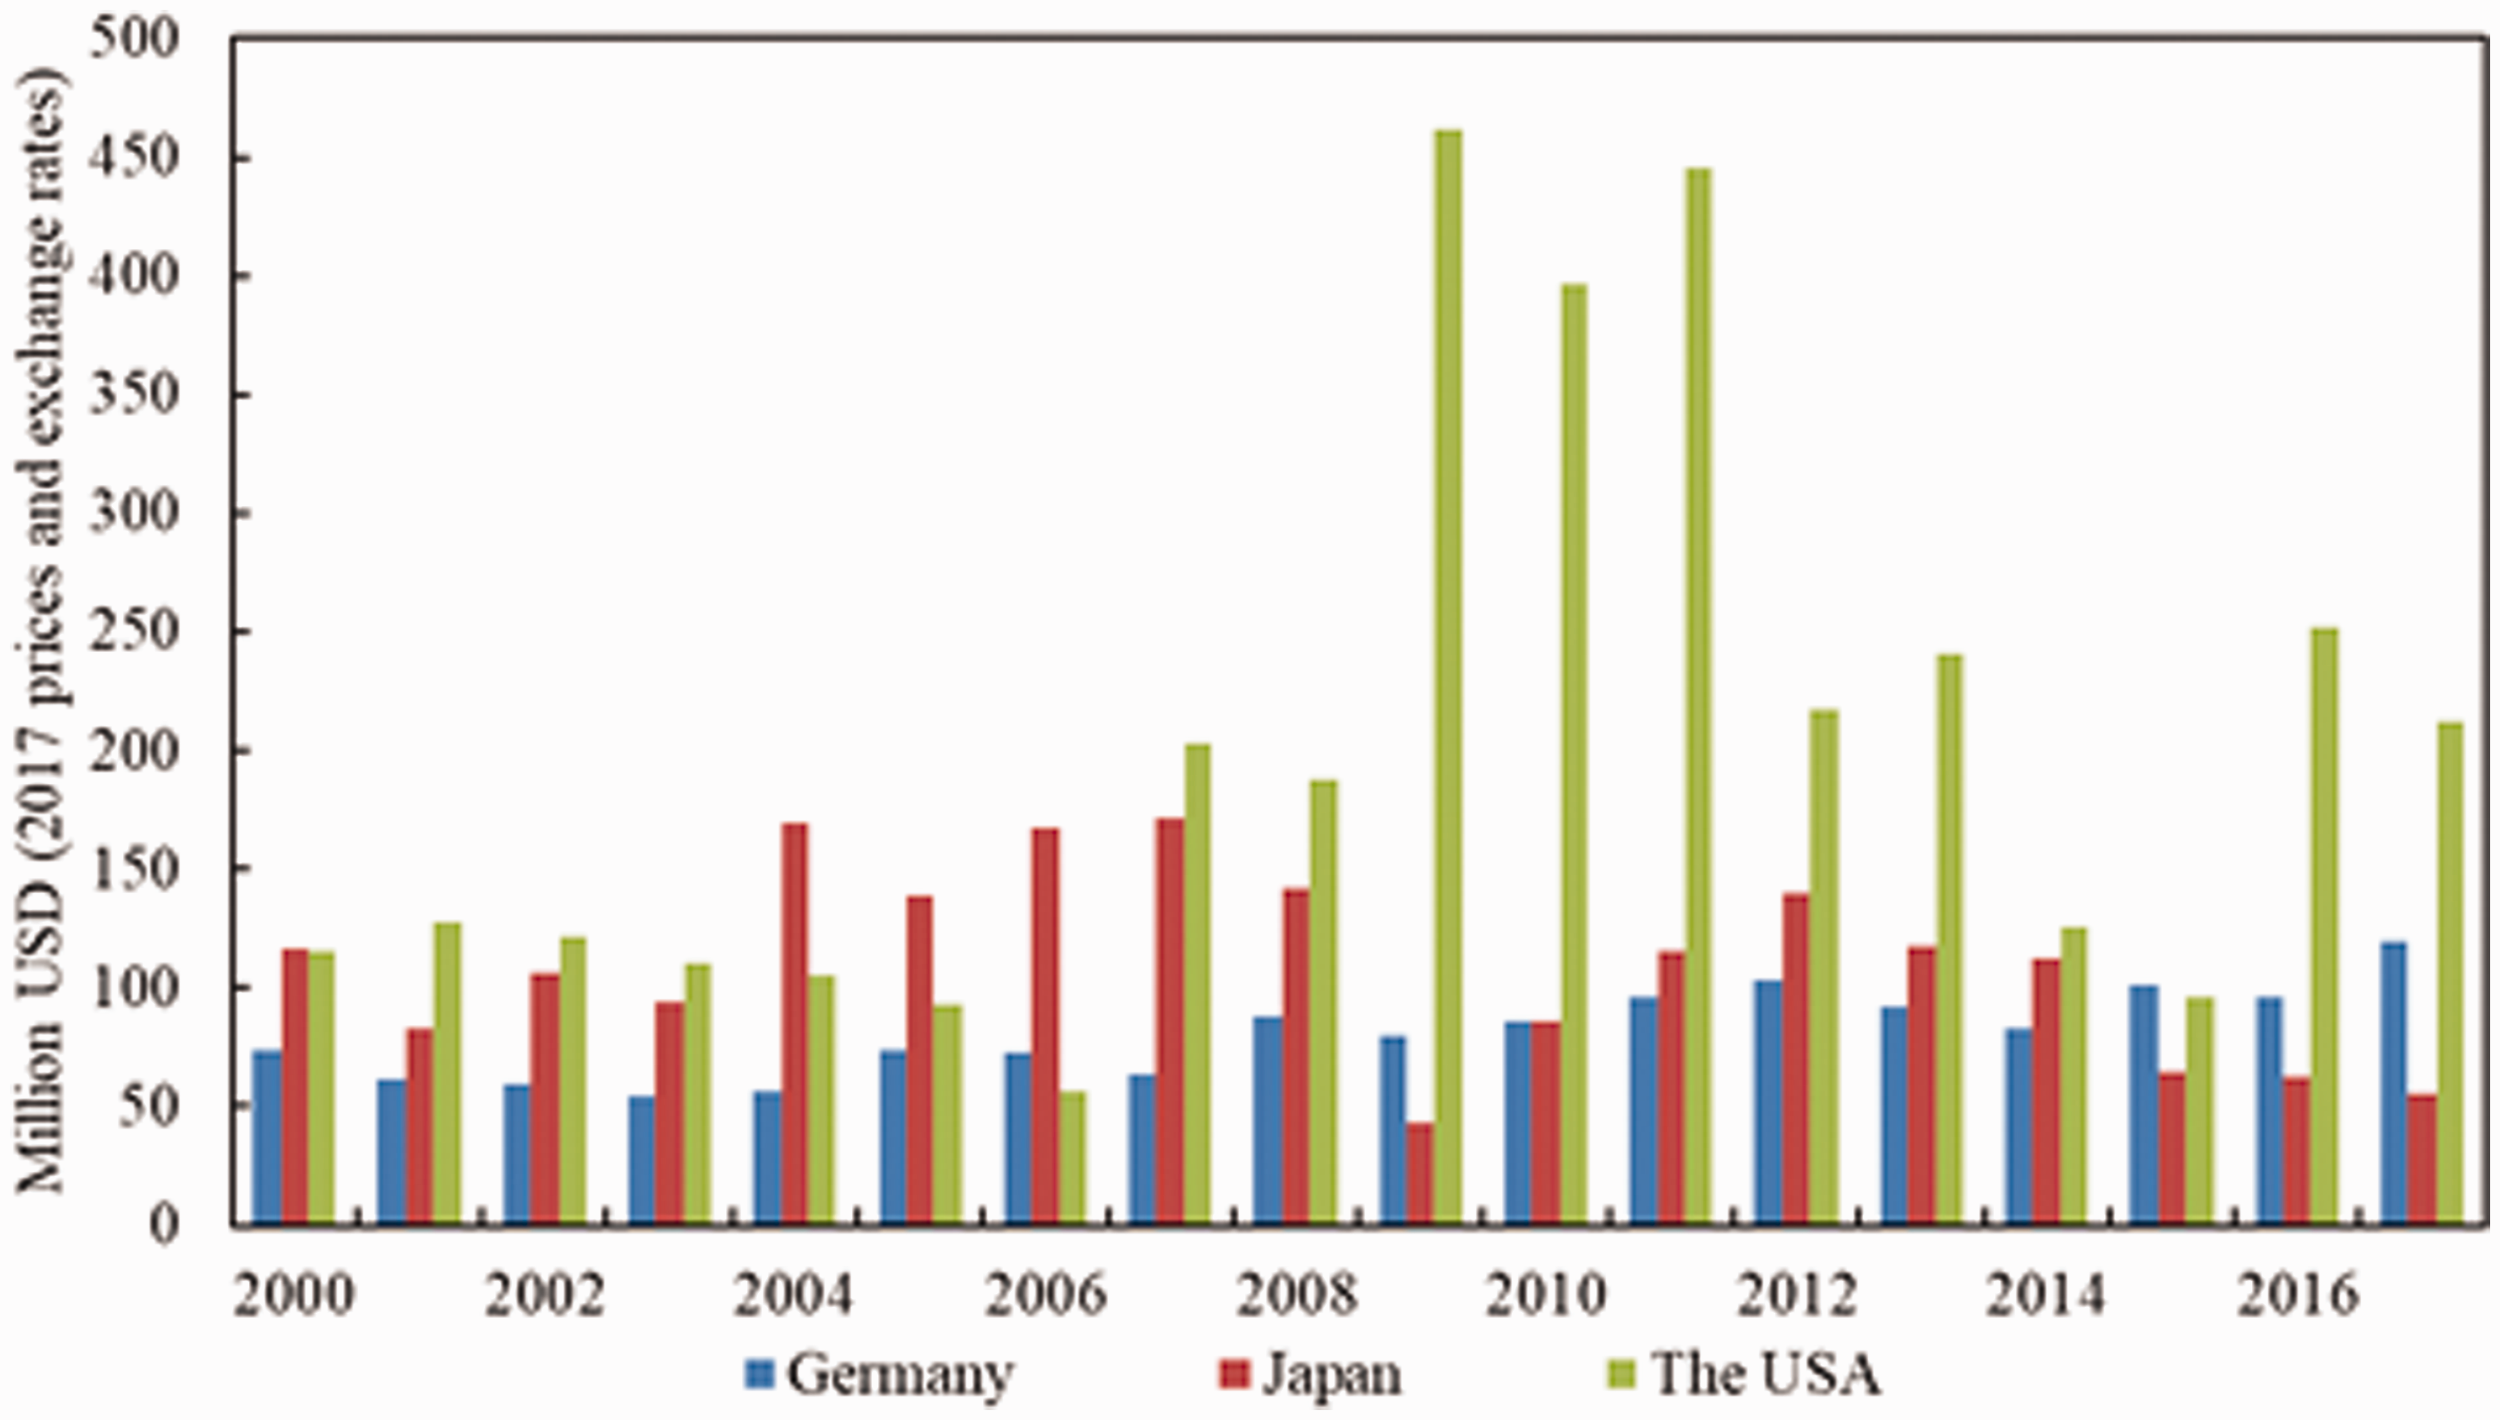
Public funds for photovoltaic(PV) R&D in Germany, Japan, and the USA in Million USD; 2017 prices and exchange rates (Data source: The online IEA data service and IEA, PVPS, National Survey Report of PV Power Applications).
PV R&D activities and product cost reduction
Figure 3 depicts the dramatic change in PV module prices from 2000 to 2016 in the four countries.The PV module prices were influenced by PV R&D activities and the PV industry’s production status. The USA and Japan retained a price advantage regarding the PV module compared with other countries until 2008. Furthermore, before 2010, PV module average prices in the USA were lower than in other countries. This can be explained by the large-scale investment in PV R&D activities over a long period. Beginning in 2008, module prices in the four countries declined rapidly. This is partly due to advances in PV technology and partly due to the expansion of the global PV production capacity. In Japan, the decline in module prices has been slow because of thier high domestic production costs (Myojo and Ohashi, 2018). In Germany, the expansion of the PV industry in eastern Germany (after 2006) has contributed to a decline in the module prices (Brachert and Hornych, 2010). PV industrial research collaborations managed to get support from nationally funded R&D collaboration programs. In China, before 2010, even though the production in the PV industry was large-scale, average module prices were still higher than those in the USA and Germany. This can be explained by the lack of systematic investment in PV R&D in China, considering that the other three countries invest much more public funding in PV R&D than China. From 2012, Chinese PV products were enforced by anti-dumping duties and anti-subsidy countervailing duties in both theUSA and the Europe. Most Chinese manufacturers have increase R&D investment to improve product competitiveness to reduce costs (Zhao et al., 2013). Chinese PV module costs have decreased rapidly as well. In 2010, the PV module price reductions in Germany and China caught up with those in the USA and Japan (Zhang and Sims, 2016). Until now, German and Chinese PV modules have maintained their price advantage among the four countries; China has the lowest module price compared with the other countries. As a developing country, China’s PV industry development trajectory is completely different from that of other developed countries. It is important to note that China’s PV development has not experienced a long basic technology R&D period, and improvements to technology were only achieved via learning-by-doing strategies. For a long time, most of the technology was imported, mainly from western countries. To summarize, we can state that compared with the USA, Germany and Japan, China lacked a long-term PV R&D program and invested less public R&D funds. Addtionally, in China, the PV R&D activities and policies focused on the production-oriented to reduce costs, while in Germany, Japan and the USA, the focus was more on technology improvement.
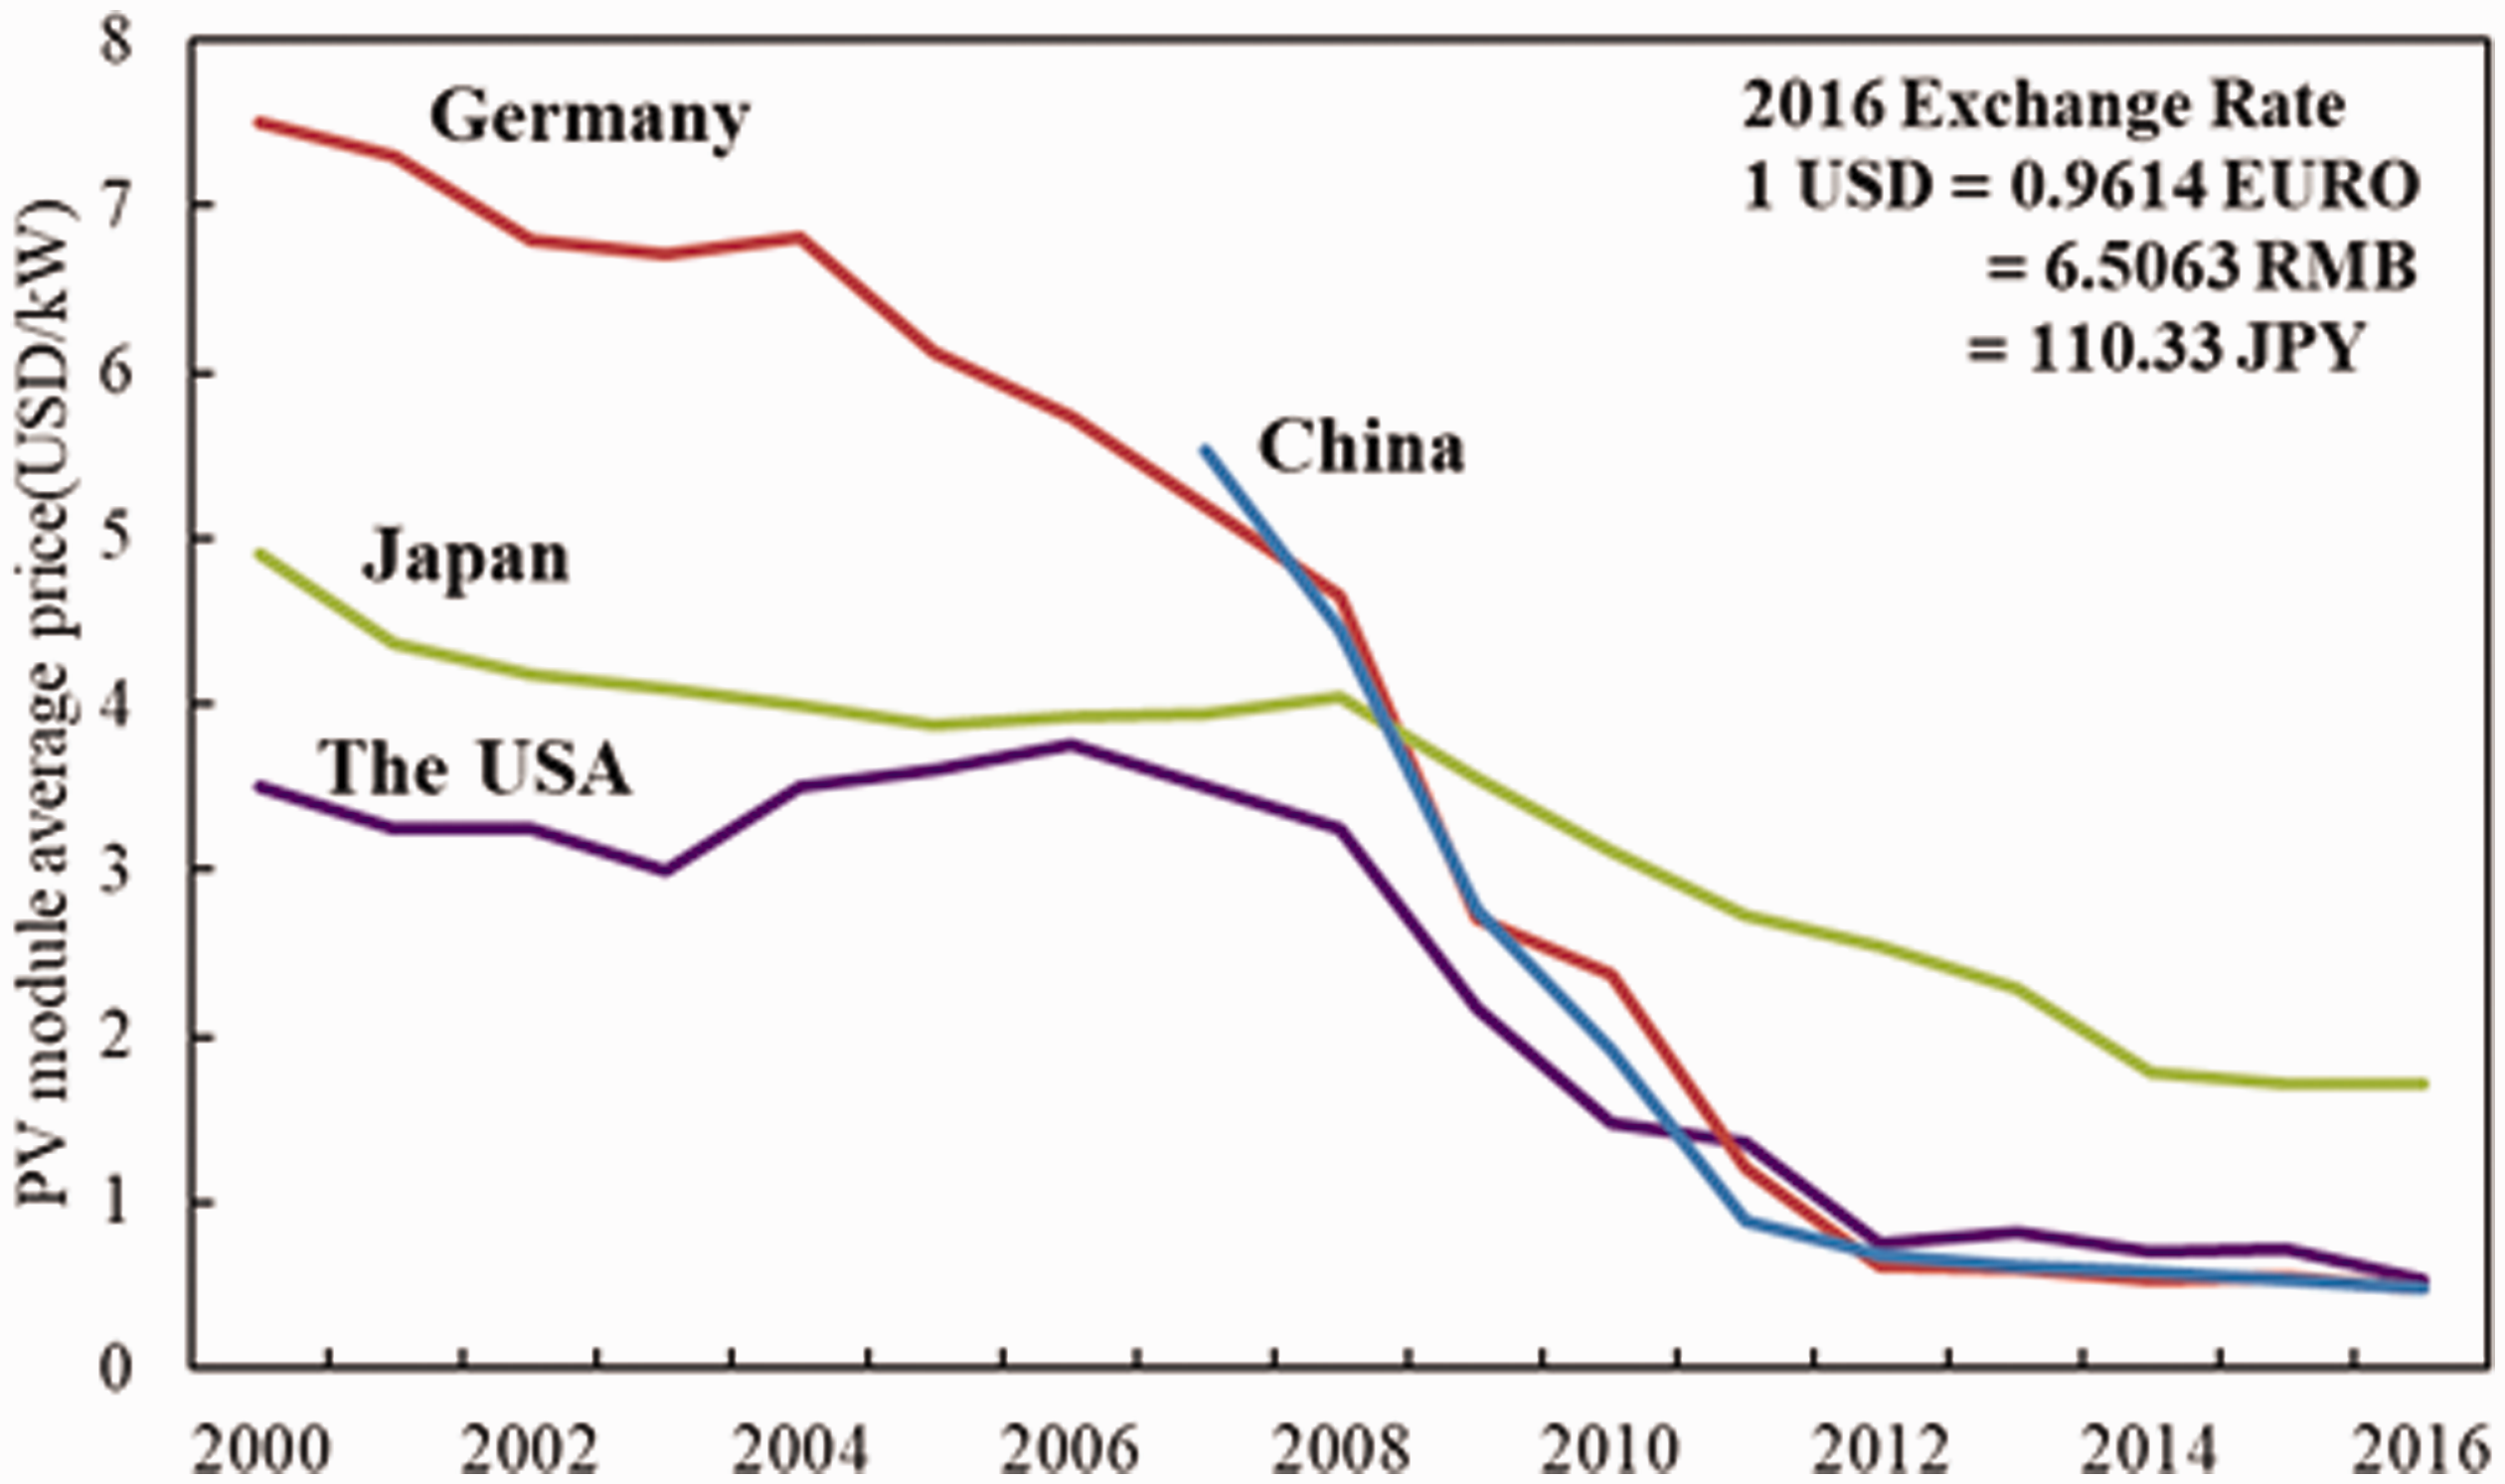
Photovoltaic (PV) module average price in China, Germany, Japan and the USA from 2000 to 2016, 2017 prices and exchange rates (Data source: IEA. PVPS. National Survey Report of PV Power Applications).
Figure 4 shows the trends in average PV module prices with an increase in the cumulative public R&D funding. The USA, Germany and Japan maintained long-term PV R&D programs and invested considerable public funds. The USA has the highest public investment for PV R&D compared with the other two countries. As a result, it gained an early advantage in terms of PV module cost reduction, with Japan following closely behind. Compared with these two countries, Germany’s PV R&D investments are less and have fewer links between institutions, academia, and the PV industry. After 2006, the industrial research collaborations were supported by nationally funded R&D collaboration programs, which contributed to cost reduction. Even though the German cumulative PV R&D investment was lower than that of the other two countries, the PV module cost reductions have been effective. The three countries’ success could be attributed to their long-term stable coordinated public investment in PV technology innovation. And another crucial point is that the policies implement by these countries provide a high level of collaboration between the PV industry, academia and research institute.
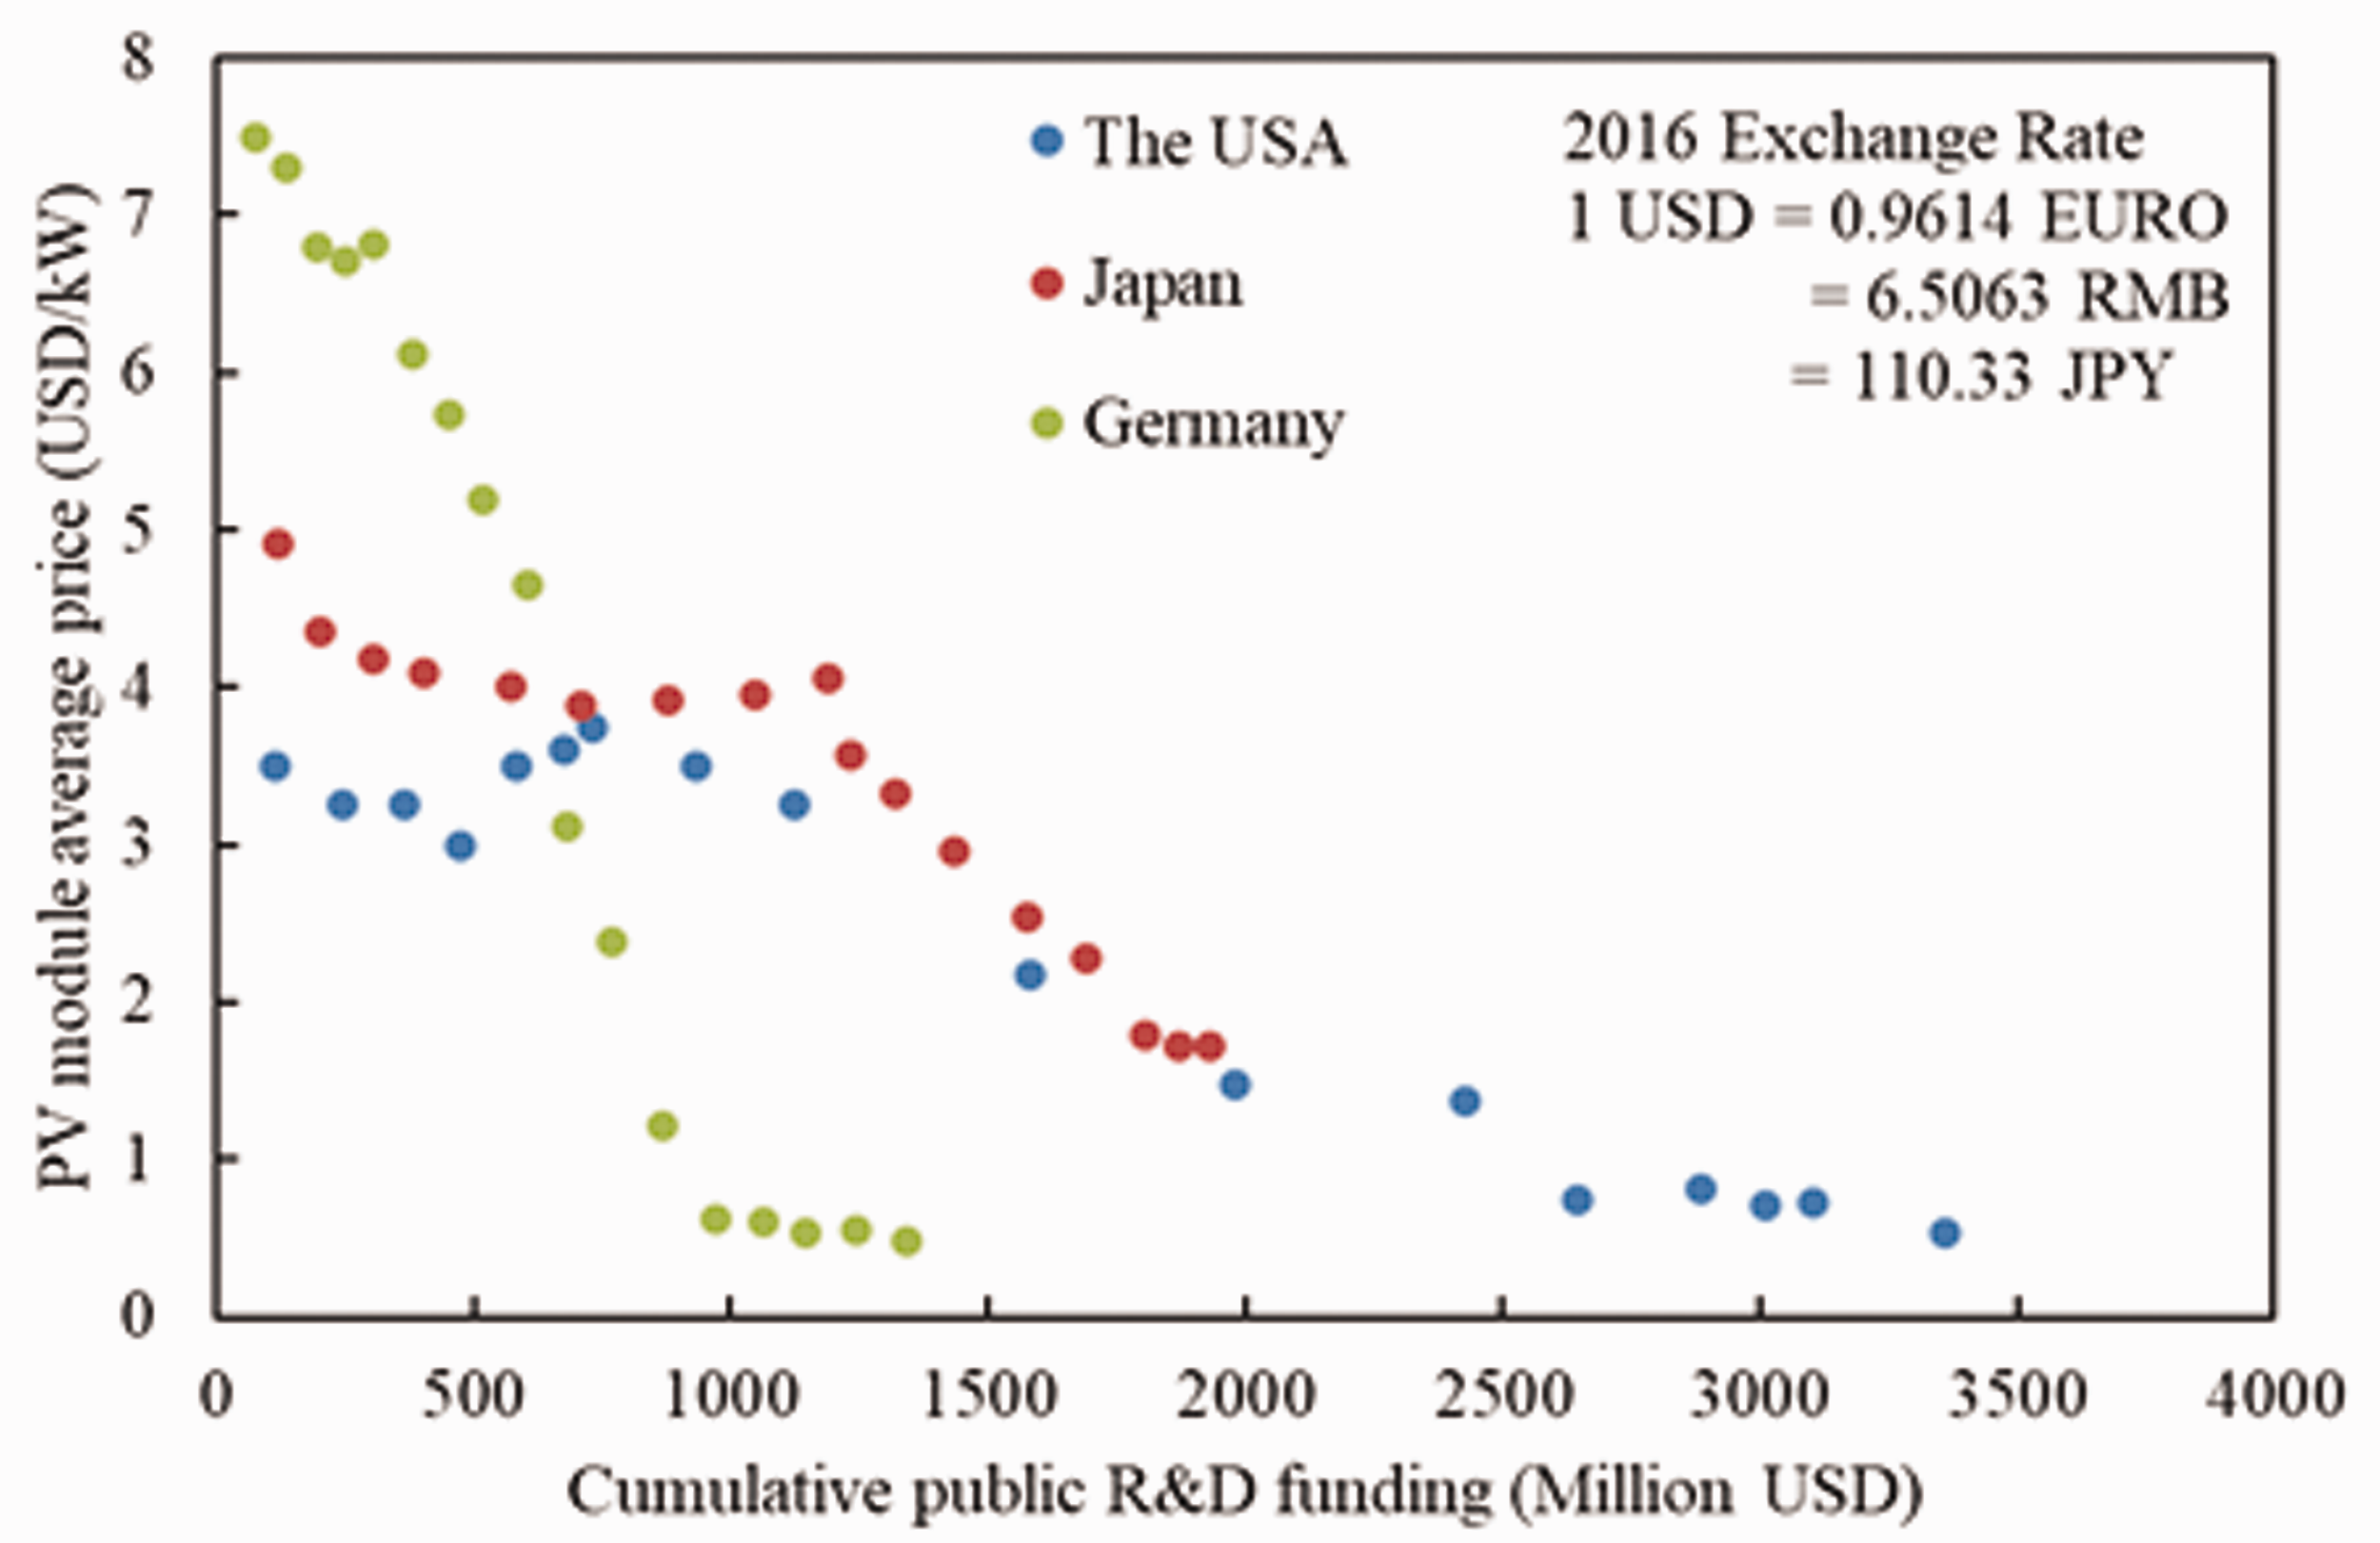
Trends in average photovoltaic (PV) module prices with increase of cumulative public R&D funding (Data source: IEA. PVPS. National Survey Report of PV Power Applications).
PV industry
Figure 5 shows the annual PV cell production in China, Japan, Germany, and the USA from 2000 to 2016. Figure 6 shows the PV production share of the four countries and the rest of world from 2000 to 2016. Due to the massive R&D investment before 2000, the USA and Japanese PV modules achieved technology and price advantages and occupied most of the PV production market (Yu et al., 2014). The PV industry in Japan experienced a period of robust growth, leading to Japan being the leader in the PV industry worldwide. Since 1999, Japan has ranked first in PV production worldwide. Japan dominated the PV cell and module markets and contributed to more than 40% of the world’s PV production capacity until 2006 (Kimura, 2006). Due to the establishment of the PV industry in East Germany, the PV production share in Germany increased rapidly since 2005 (Blankenberg and Dewald, 2013). From 2005 to 2007, Germany and Japan occupied more than 50% of the market for PV products. Then, the rise of China’s PV industry shocked the world. China’s current PV productions is higher than that of any other country. The highly profitable PV market in Europe has attracted many Chinese companies to enter the PV manufacturing sector. German PV companies have played an important role in the rise of China’s PV industry. To find a large PV equipment market, German companies helped China to install PV production lines thereby increasing China’s competitiveness. High-tech capabilities and knowledge were embedded in the production line, and the Chinese PV industry obtained technology for large-scale production (Quitzow, 2015). On the other hand, Chinese PV manufacturers benefited directly from the investment support measures offered by the Chinese central government (Zhao et al., 2013). As the PV industry is one of the strategic emerging industries, the Chinese government has substantially subsidized the PV manufacturing sector along with related research grants, tax rebates, loans, and lands. Among the four countries, China is the only country that implements supply-push policies for promoted PV production (Jia et al., 2016), and thus, the Chinese PV industry quickly gained competitive advantage over other countries. China’s involvement has greatly affected the structure of the global PV industry. Over time, China has started to dominate the worldwide PV production, and the production of Japan, Germany and the USA decreased immediately. In 2011, China’s PV products accounted for more than 66% of the global production. Subsequently, the USA and the European Union launched anti-dumping and countervailing duties on Chinese PV products, forcing Chinese PV companies to struggle (Zou et al., 2017). The restriction on exports caused a decline in Chinese PV cell production in 2012. Therefore, the Chinese government drafted market incentives to improve domestic PV market development. Thereafter, the Chinese domestic market has expanded significantly, and the Chinese PV industry continued to grow. Currently, China’s PV production share accounts for more than 70% of the world’s production (IEA, 2018). China is the leading country in PV production.
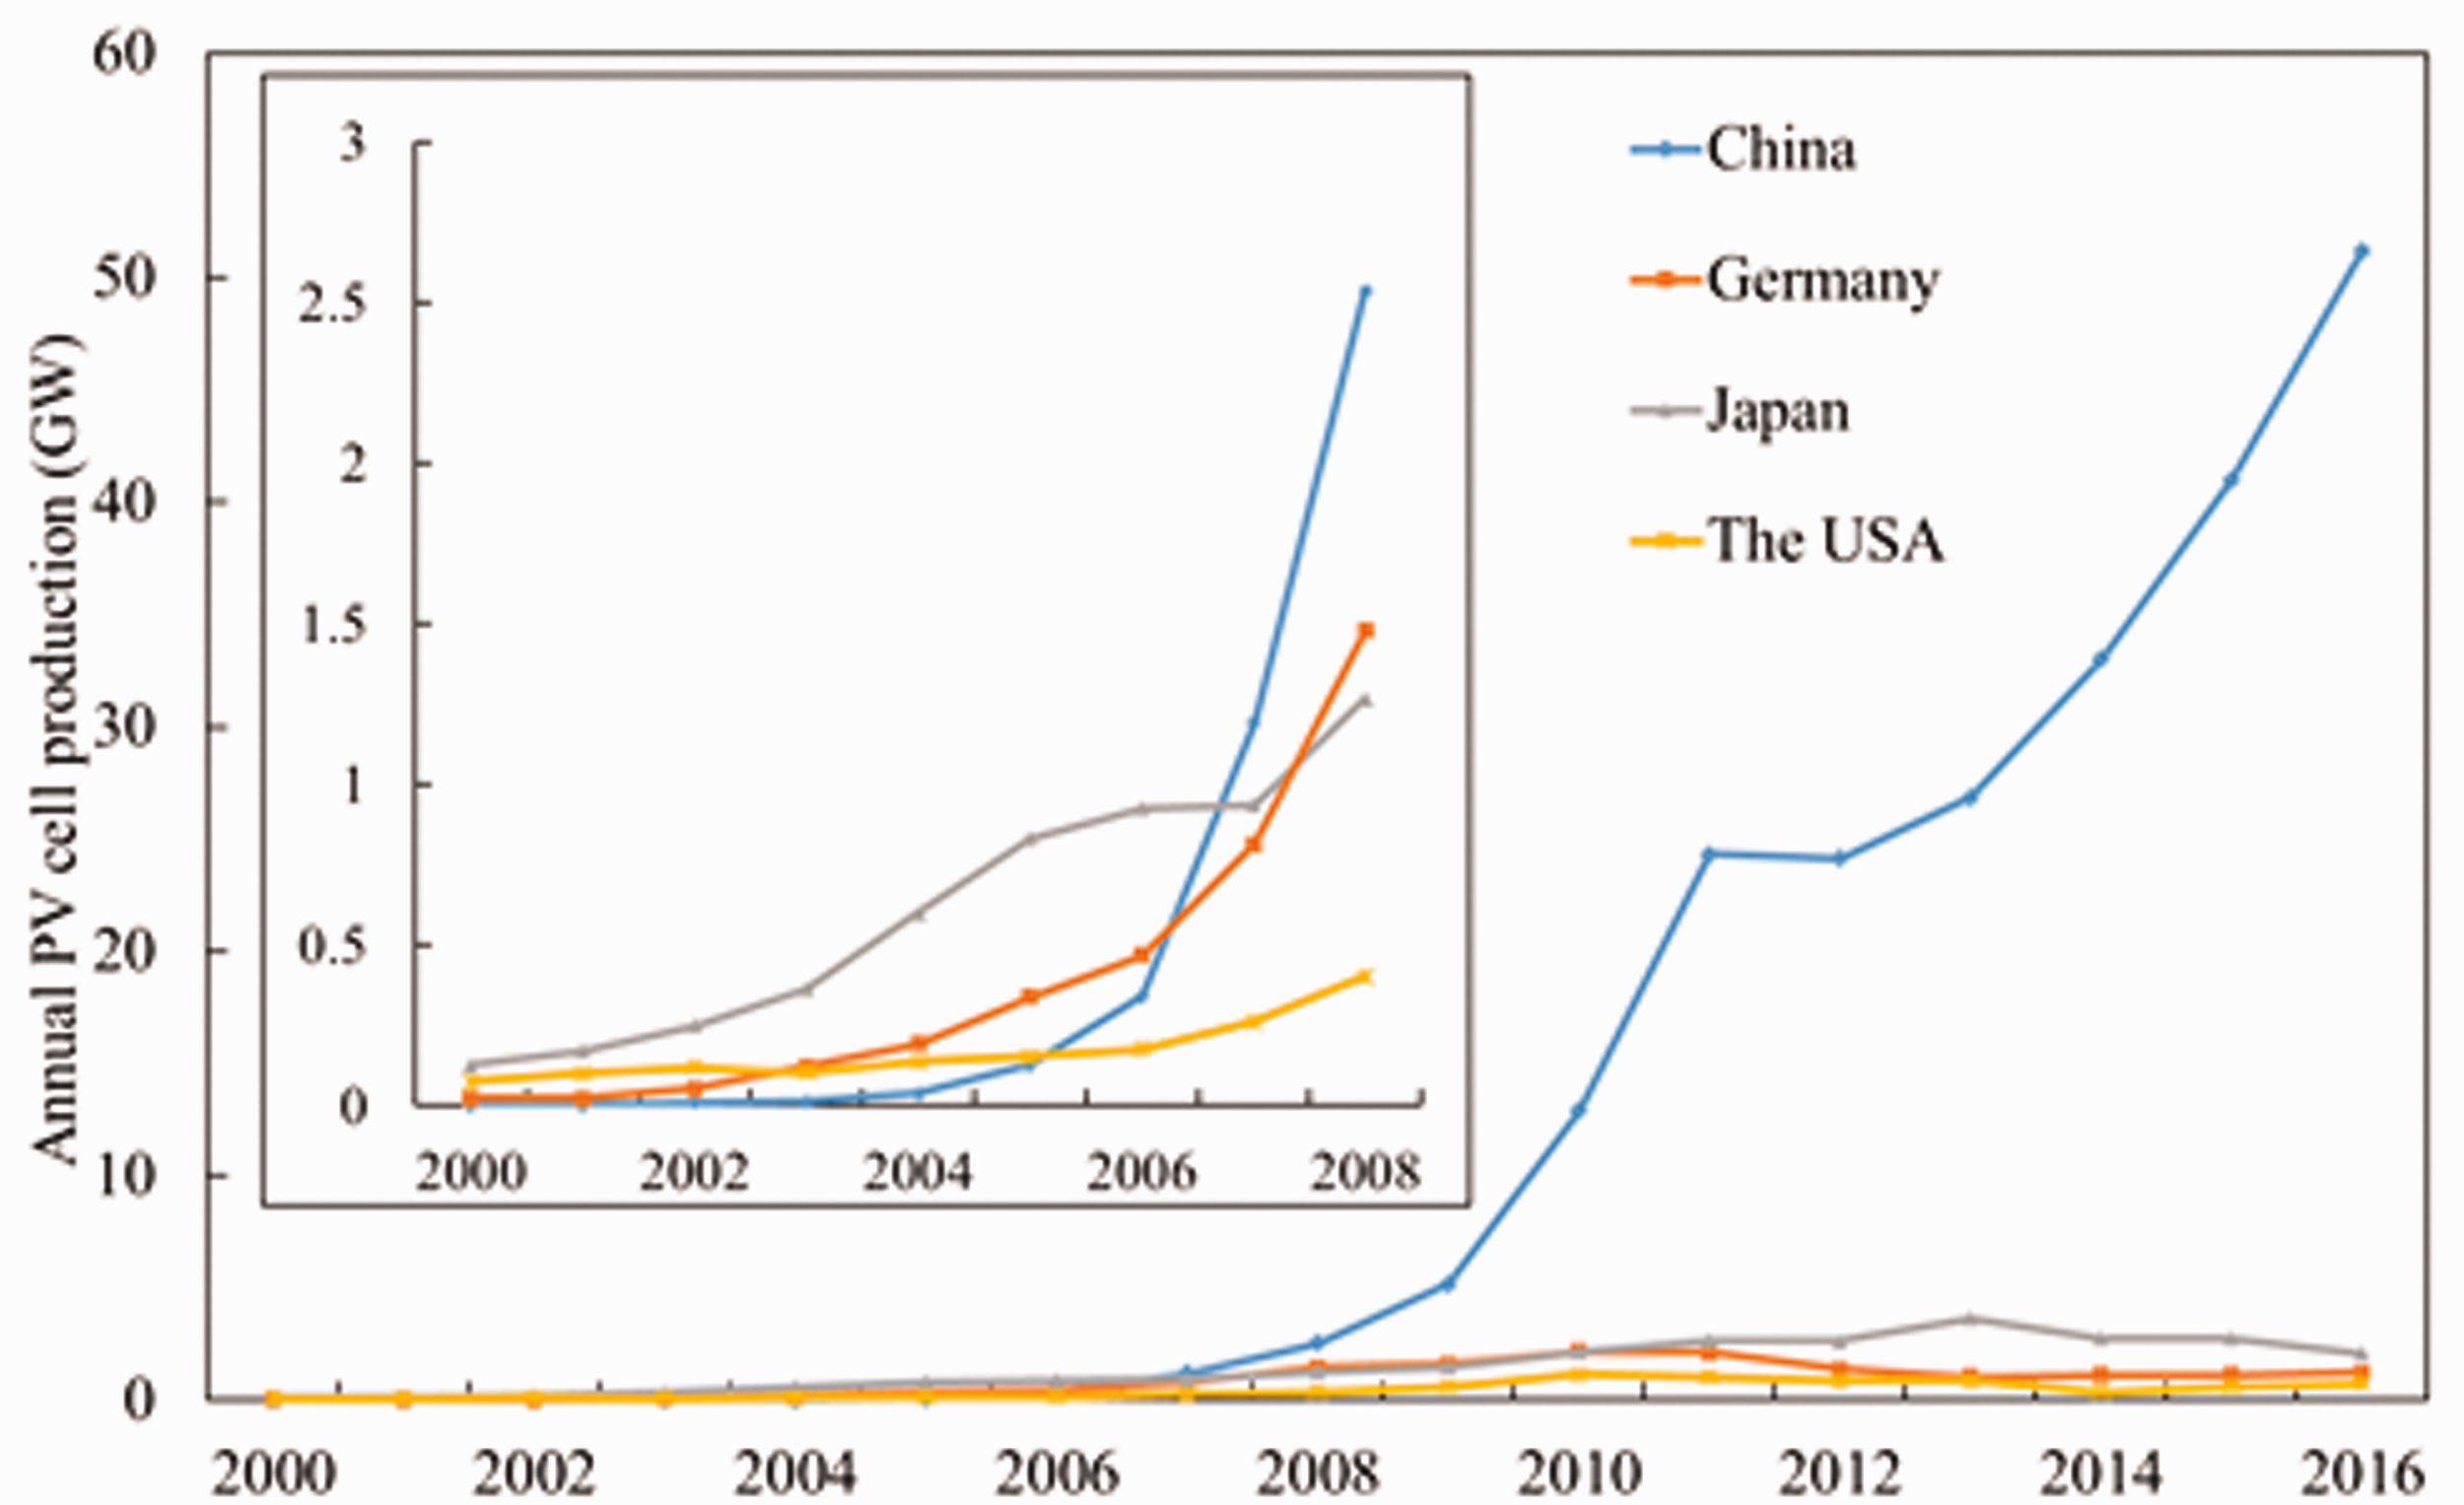
Annual photovoltaic (PV) cell production in China, Japan, Germany and the USA from 2000 to 2016 (Data source: IEA. PVPS. National Survey Report of PV Power Applications).
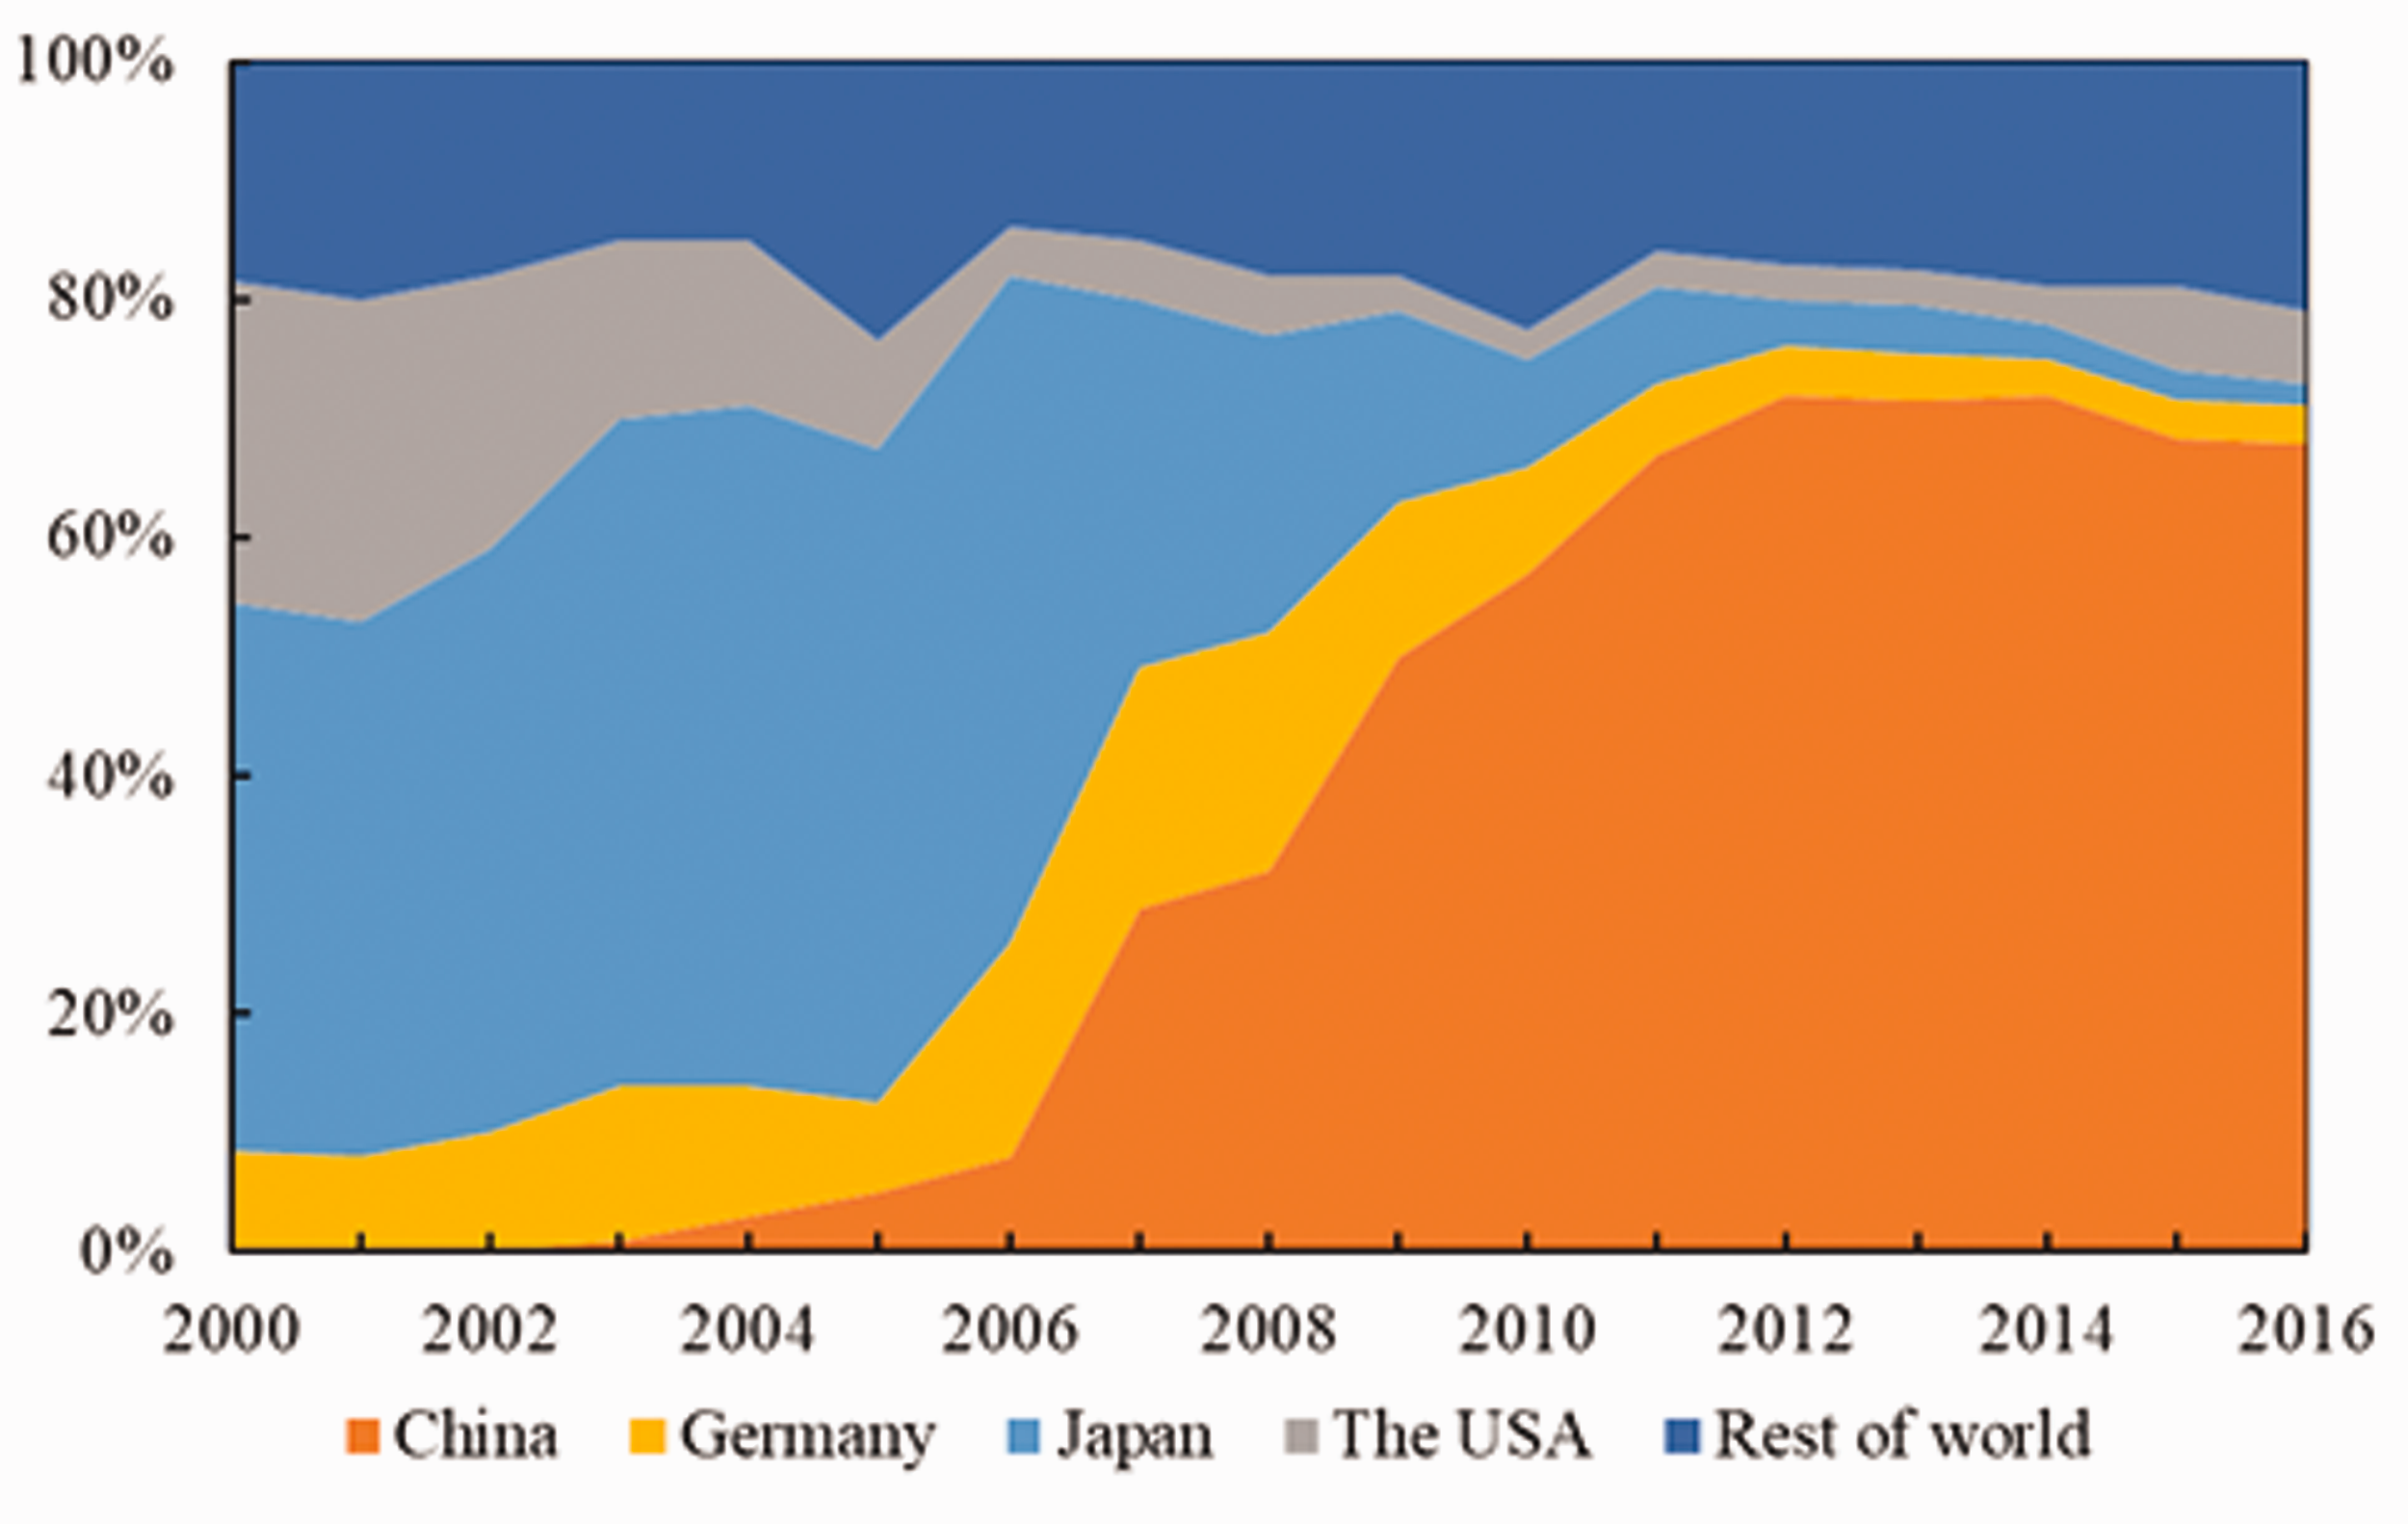
The photovoltaic (PV) production share by countries 2000 –2016 (Data source: IEA data service and Fraunhofer ISE).
PV market
Figure 7 shows the development of PV market in China, Germany, Japan and the USA from 1990 to 2017. From 2001 to 2009, the USA once again became a major player in the global PV development process, with an average PV market growth rate of approximately 60% per annum, the fastest growth of roughly being approximately 100% in 2003 (Haley and Schuler, 2013). In 2000, the PV total installed capacity was 138 MW, but the number increased to 1642 MW by the end of 2009. The ITC has contributed to the tremendous growth of the PV market since its implementation in 2005. In 2010, compared with 2009, the PV market in the USA grew by 92%. The PV installed capacity exceeded 40 GW from 2010 to 2016, with an average annual growth rate of over 70% (SEIA, 2018). In Germany, from 2000, the subsidy program of “100,000 rooftops program” became an opportunity for rapid growth in PV market. The residential PV market continuously increased under stable conditions and modified the “Renewable Energy Sources Act (EEG) program” in the form of a FiT. Since 2008, Germany has proven to be the world’s largest PV market, with its cumulative installed capacity was increased to 34 GW at the end of 2012. In Japan, the annual installed capacity was approximately 290 MW in 2005. The installed capacity grew by more than 200% in 2008, reaching a cumulative capacity of 4.9 GW in 2011.The FiT policy has driven the rapid growth of the PV market in Japan, and the cumulative PV installed capacity increased from 4.9 GW in 2011 to 42.7 GW in 2016.
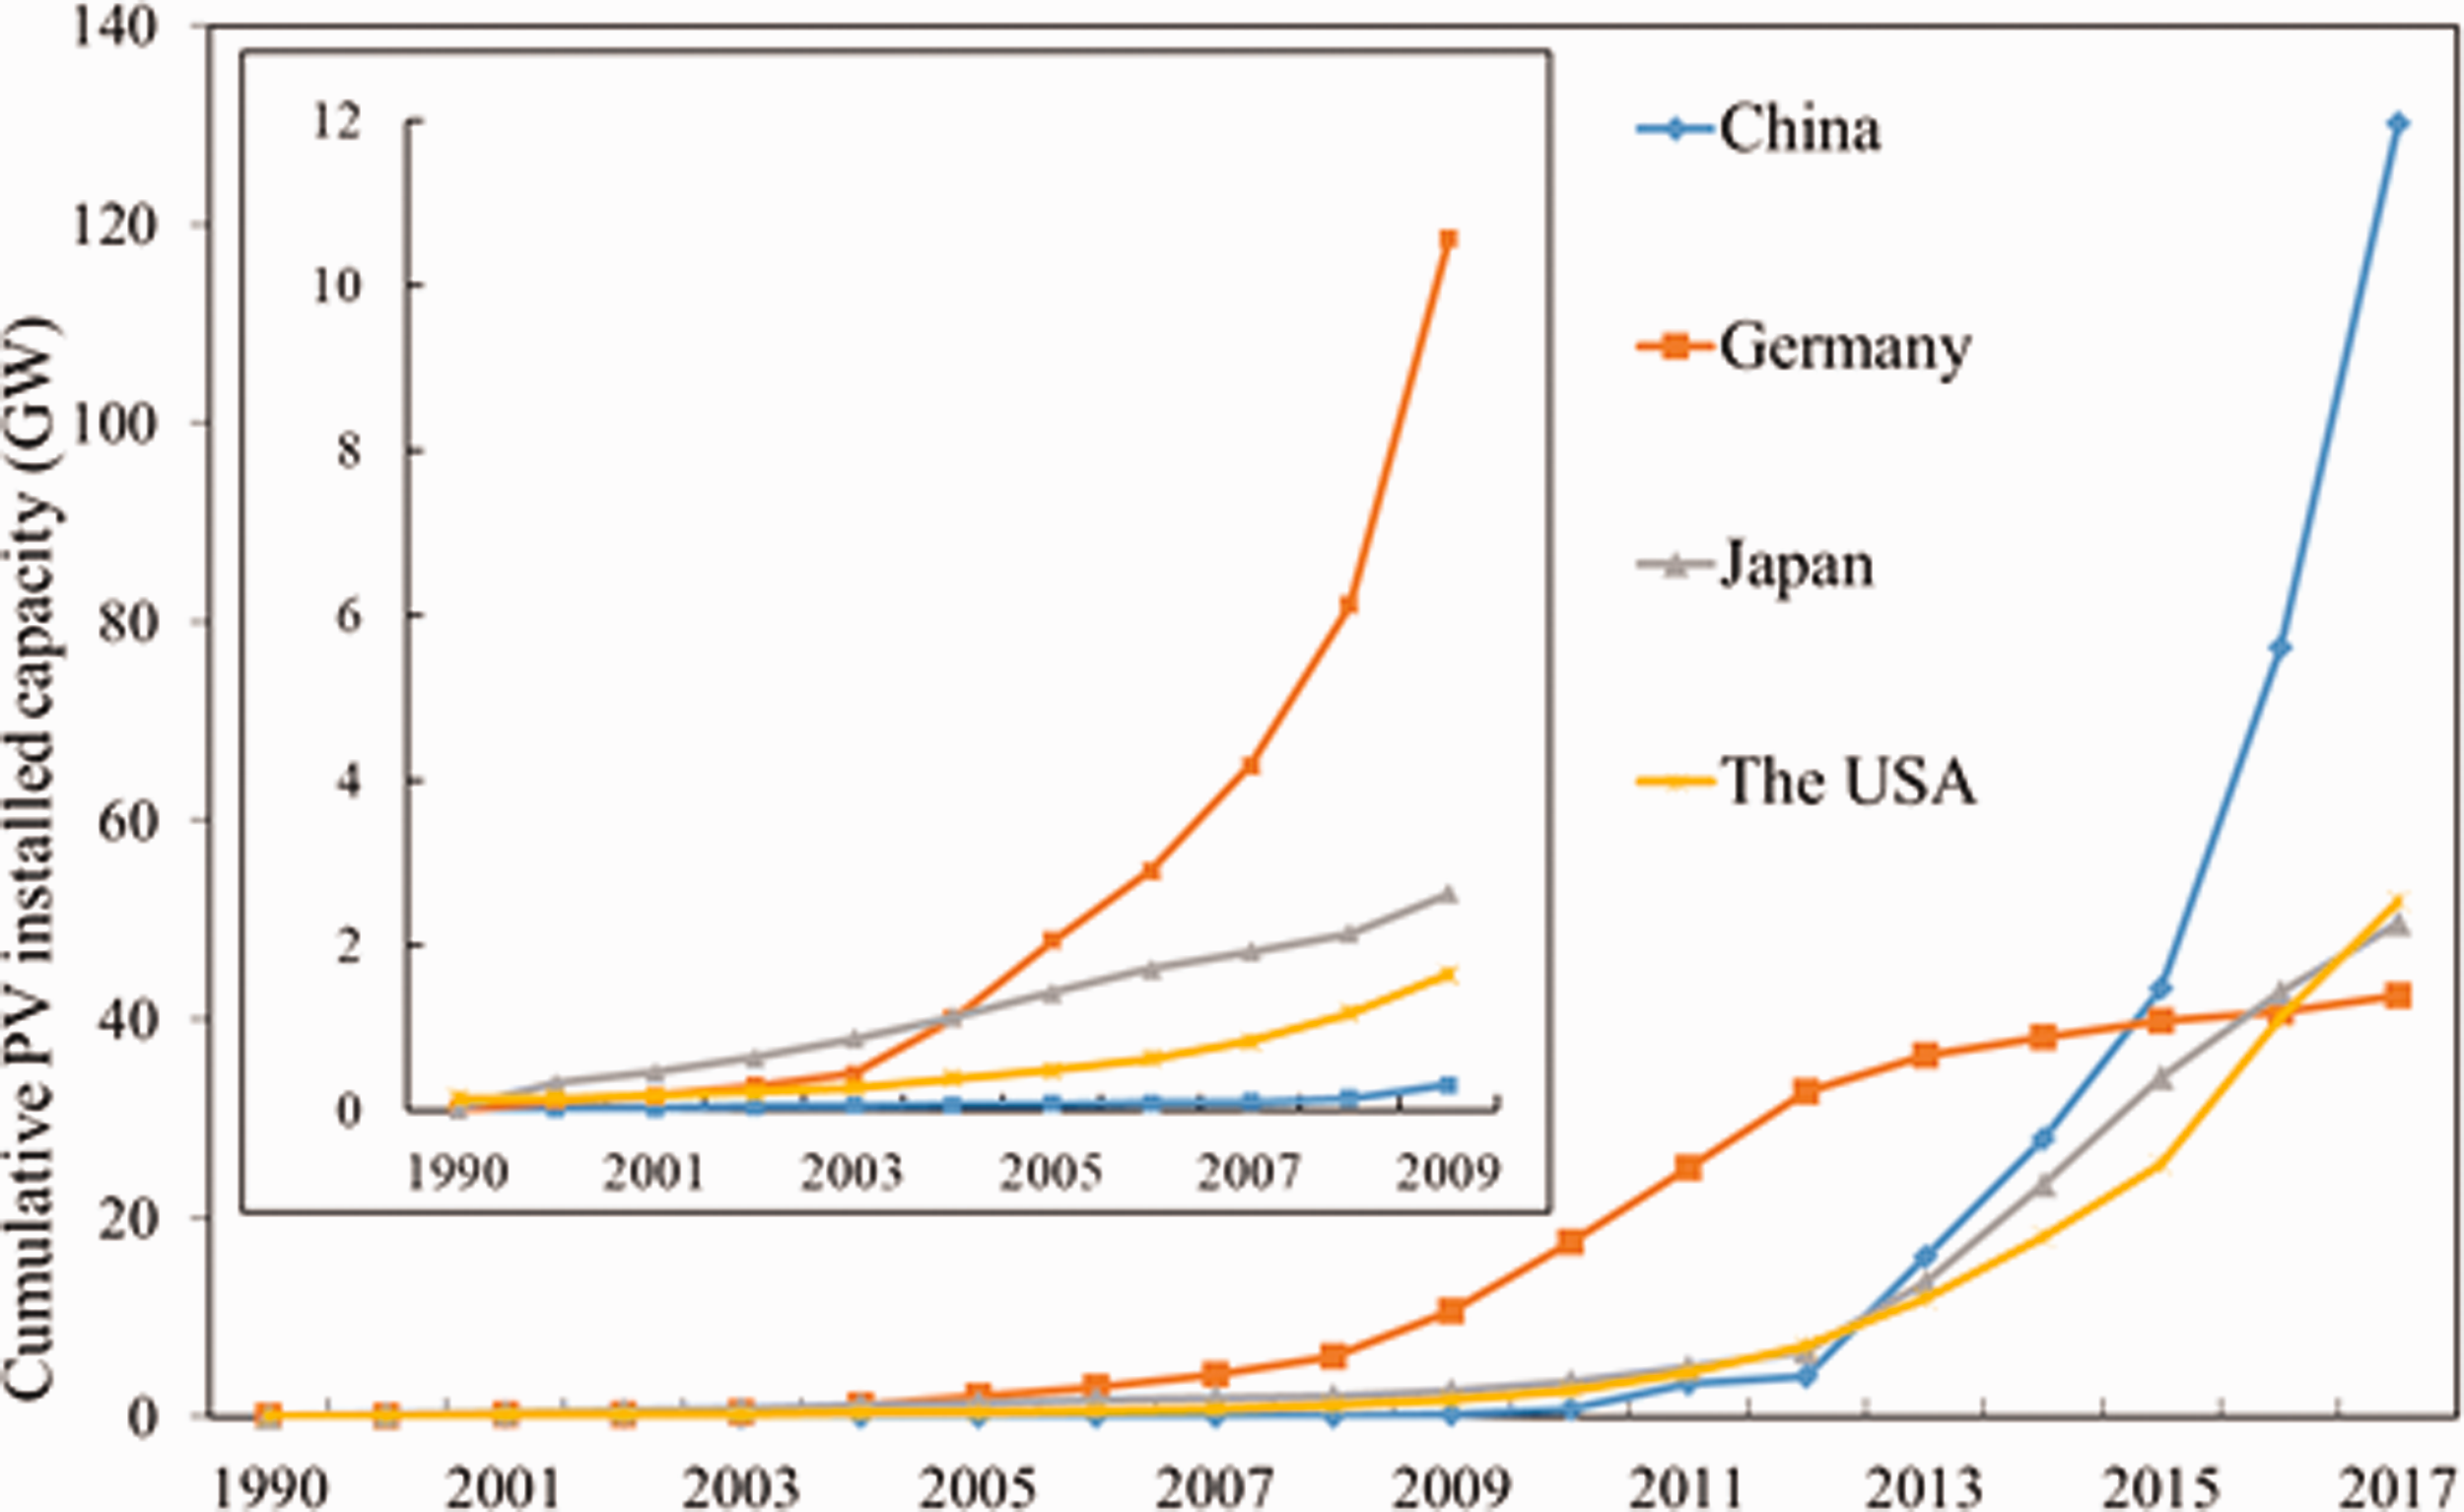
The photovoltaic(PV) market development in China, Germany, Japan and the USA from 1990 to 2017 (Data source: IEA. PVPS. National Survey Report of PV Power Applications).
By the end of 2009, the cumulative PV installed capacity in China was only 300 MW. By 2012, 455 projects with a total capacity of 2872 MW were approved under the Golden Sun demonstration program. The cumulative PV installed capacity reached 3 GW in 2011. In 2015, the NEA proposed the implementation of the “Top-Runner program” for PV power generation. At the end of 2017, 43 projects and 26 GW in total have been approved (Nie et al., 2018). The PV cumulative installed capacity increased from 3.5 GW in 2011 to 77 GW in 2016. In 2017, China added 52.83 GW of new PV installed capacity, accounting for over half of all PVs installed worldwide that year.
Figure 8 shows the changes in the PV market worldwide from 2000 to 2017. In 2000, the PV market in Germany and Japan shared nearly 60% of the world’s PV market. In Japan, the subsidy program for PV deployment ended in 2005. Thus, the expansion of the PV market in Japan was caught during stagnation. Japan lost its position as the world leader of the PV market share in 2005 and Germany began to rule the world PV market. The German PV market accounted for more than 60% of the world PV installed capacity. In 2012, a new EEG was implemented and the growth of the German PV market slowed down. In the USA, Congress passed the “Energy Policy Act (ITC)” in 2005 and the PV market has grown rapidly across the country. In China, the Chinese government introduced the first significant measures in 2009, which is “the Golden Sun demonstration program,” to promote the development of domestic PV market. The market grew by over 300% in 2010 and 500% in 2011 (Zhang and Sims, 2016). In 2011, China began implementing the FiT scheme, followed by Japan in the following year; corresponding to this scheme, the PV markets in China and Japan expanded significantly. The Chinese PV market ranked first worldwide and accounted for more than 50% of the world PV market in 2017.
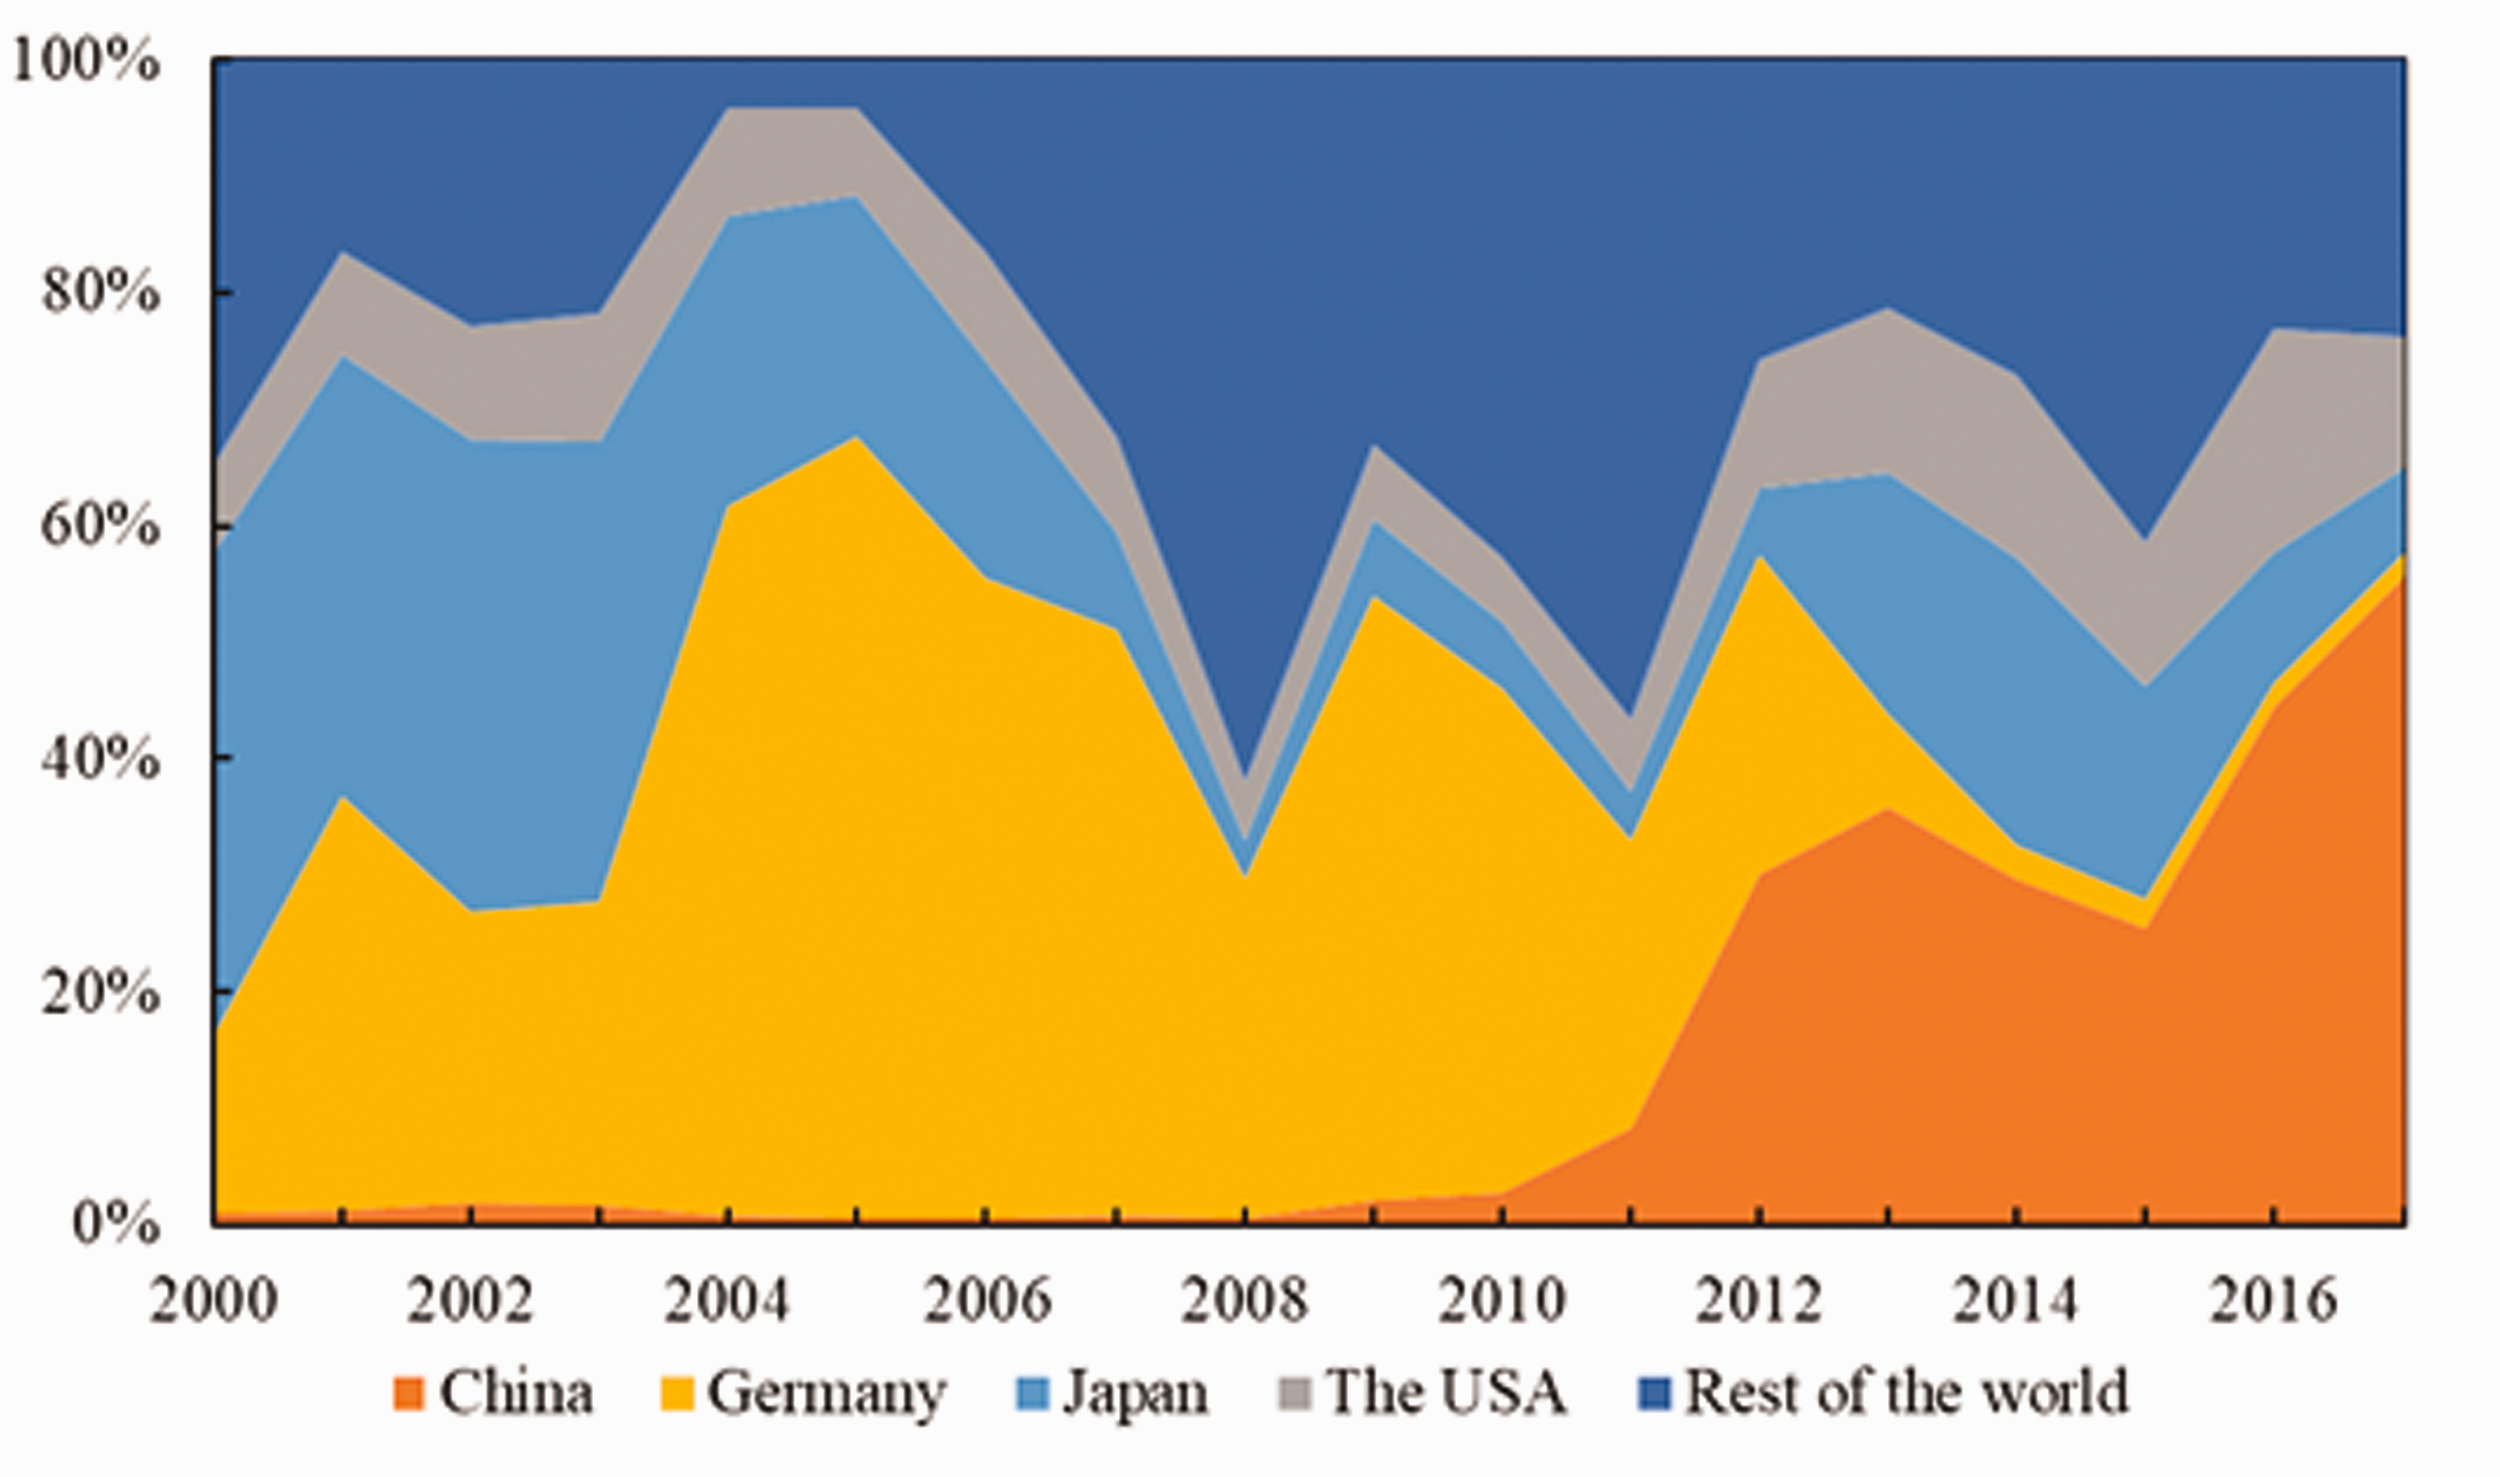
Photovoltaic (PV) market share by countries 2000–2017 (Data source: IEA. PVPS. National Survey Report of PV Power Applications).
PV industry and market
Figure 9 shows the relationship between PV production and the PV market share in the four countries. The governments in all the four countries have used policy regulations to promote PV market development. The expansion of the PV market in Japan provided a boost for the Japanese PV industry, and the Japanese PV products occupied more than 40% of the global PV production market until 2006. Due to the rise of the photovoltaic industry in East Germany, Germany started producing more PV products than Japan. Subsequently, PV products in China have increased dramatically. China’s PV module production accounted for more than 70% in 2017.
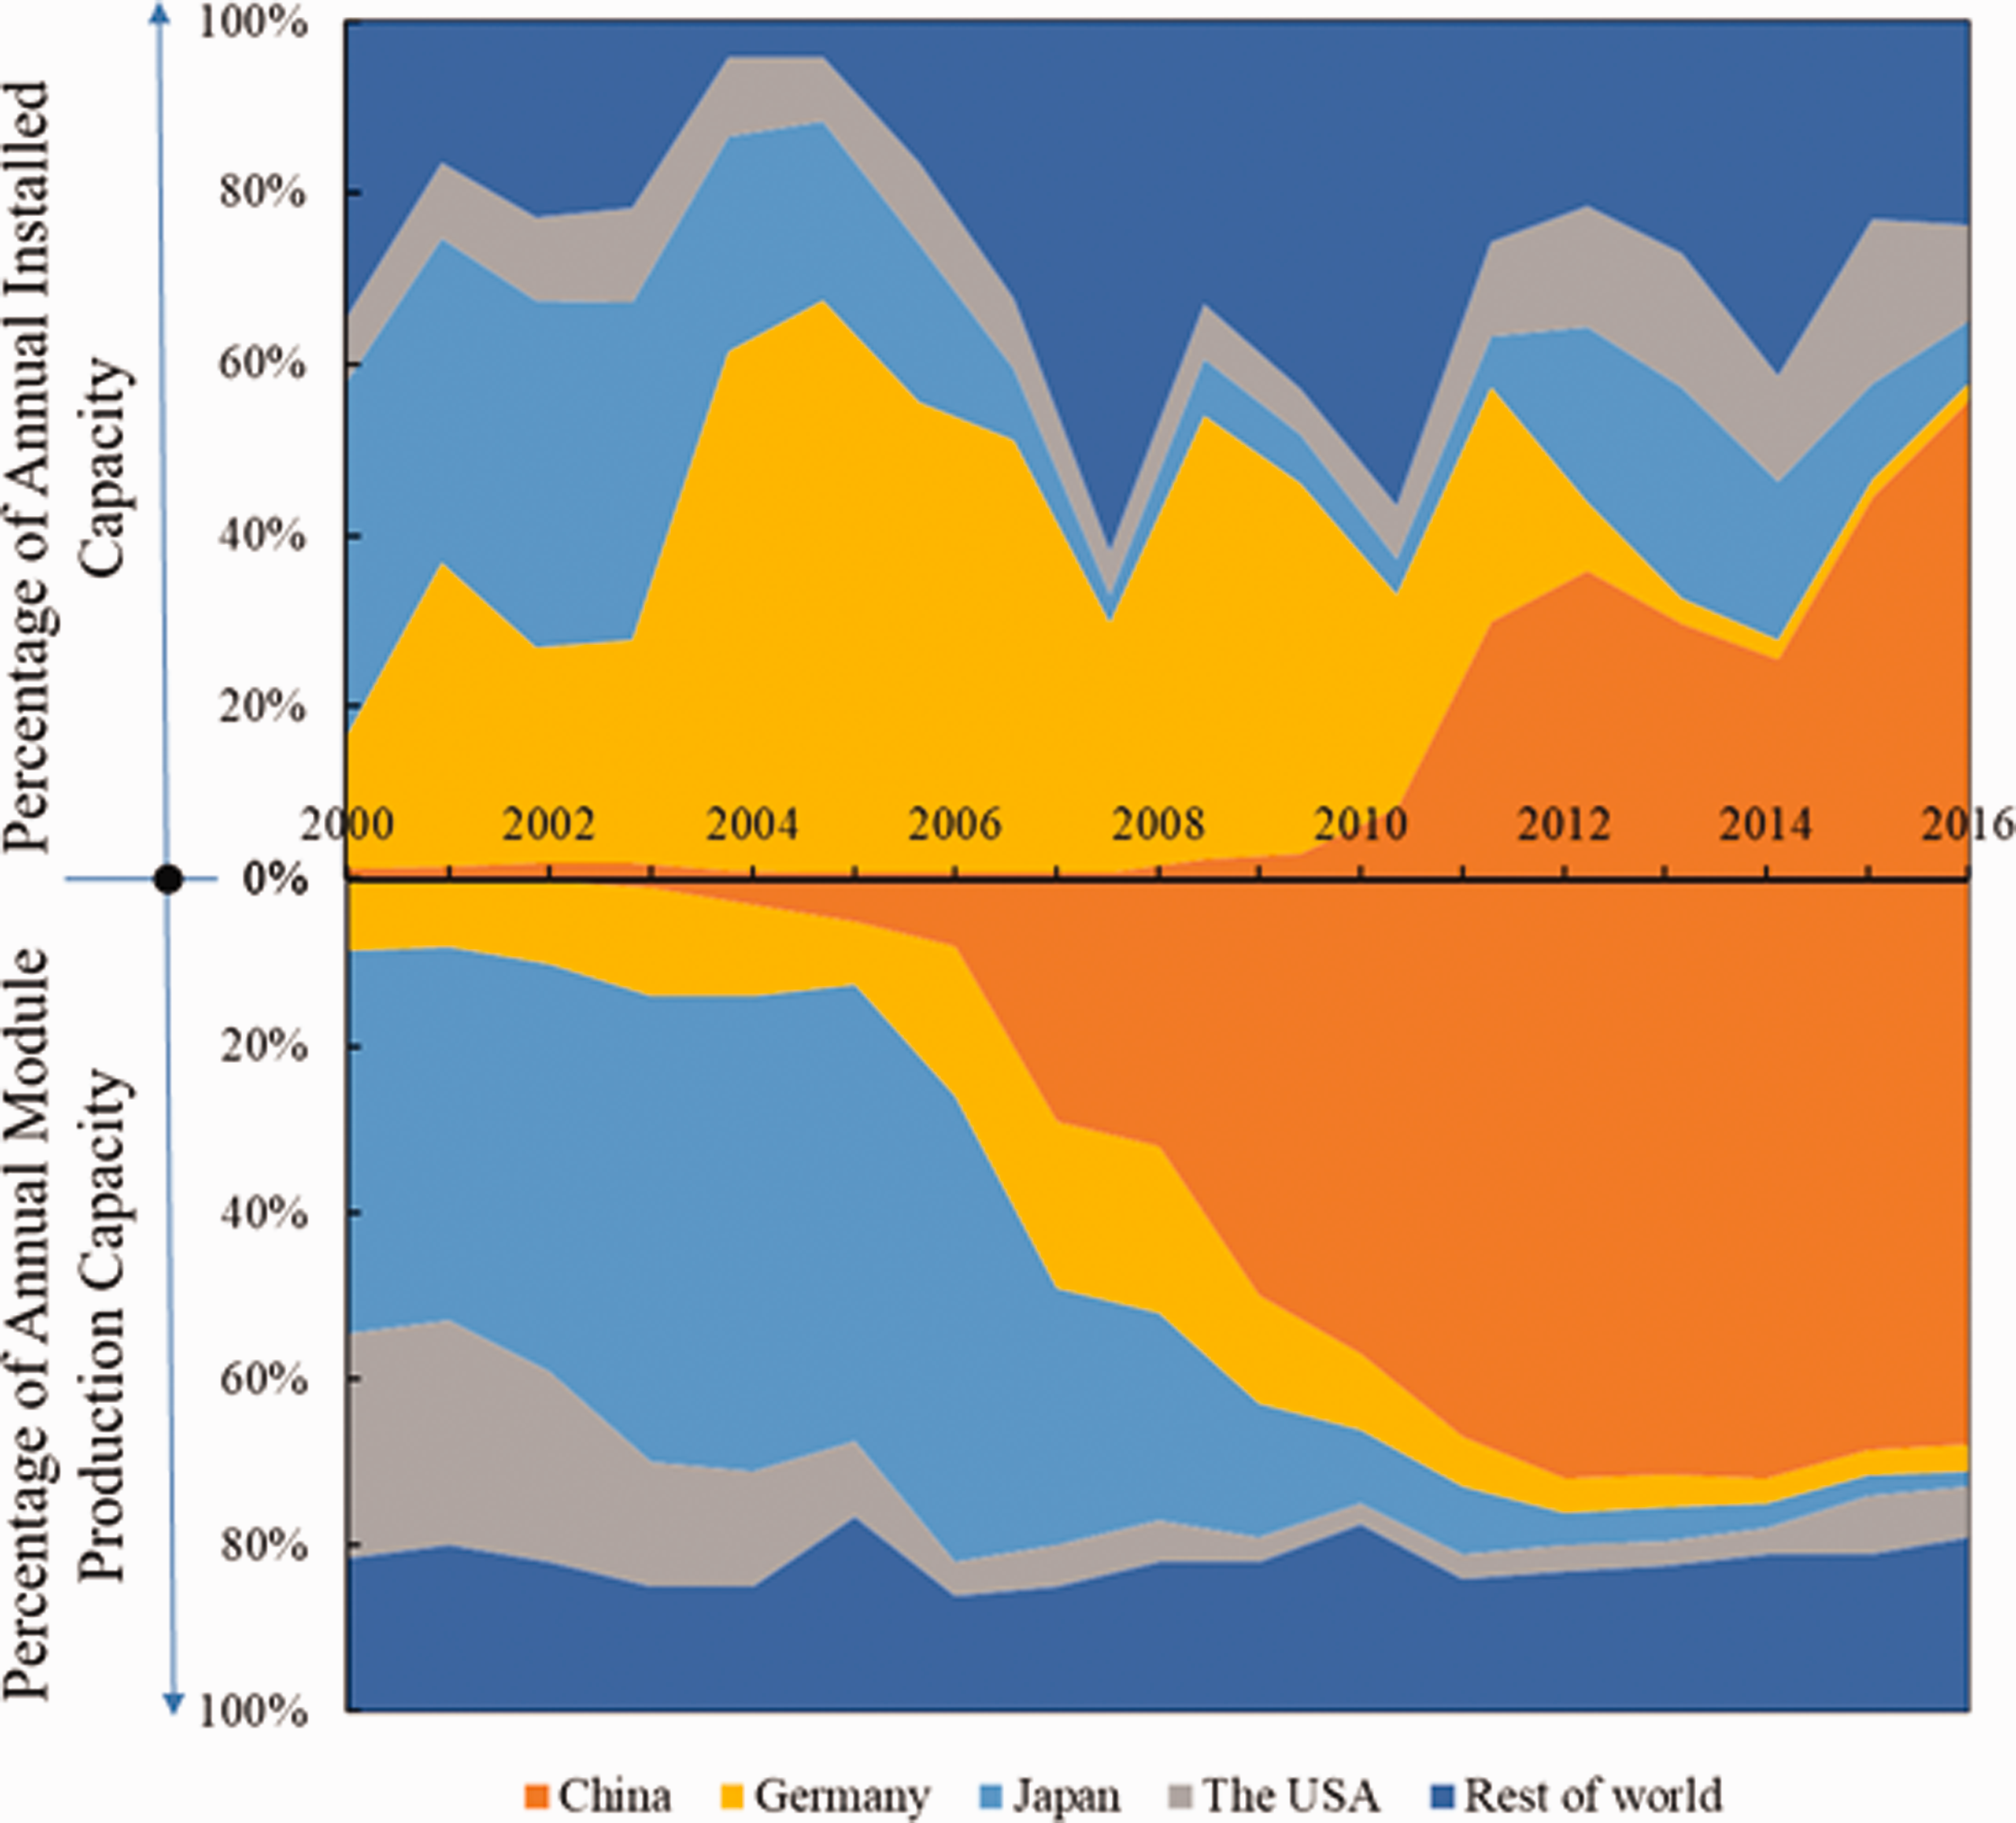
Share of annual photovoltaic (PV) module production and installed capacity (Data source: EPI data base; IEA. PVPS. National Survey Report of PV Power Applications).
In terms of PV installed capacity, until 2012, Germany was the leader. With the start of the FiT in 2012, the Japanese PV market has entered a new phase of growth and Japan maintained an increased PV installed capacity of more than 7000 MW per year. After 2014, the USA also maintained a capacity of more than 7000 MW per year. Regarding the PV products, the Chinese PV market was delayed until 2013. The PV cumulative capacity in China was only 300 MW at the end of 2009, and the domestic PV market accounted for less than 5% of the PV production (IEC, 2018). More than 90% of the PV products in China were export to the USA and Europe. From 2012, demand-side pull policies have boosted China’s PV market development. Since 2015, PV installed capacity in China maintained rapid growth, accounting for nearly more than 50% of the global PV installed capacity. Japan has been an importer of PV modules since 2013 and the USA has been an importer since 2011. The gap between PV module production and domestic PV installed capacity has continued to widen. The overcapacity of China’s PV industry has expanded along with the increasing imbalance between production and demand in the international market. Although the government expected to reduce this imbalance by tapping into the domestic market in 2013, the results were not ideal, and China’s PV production capacity remains significantly over the capacity.
Key incentive policies and PV market development
As shown in Figure 10, all four countries implemented investment subsidies to push the PV market expanded in the early stage of PV development, including rooftop programs in Germany, subsidy programs in Japan, the Golden Sun program in China and the Energy Policy Act 1992 in the USA.
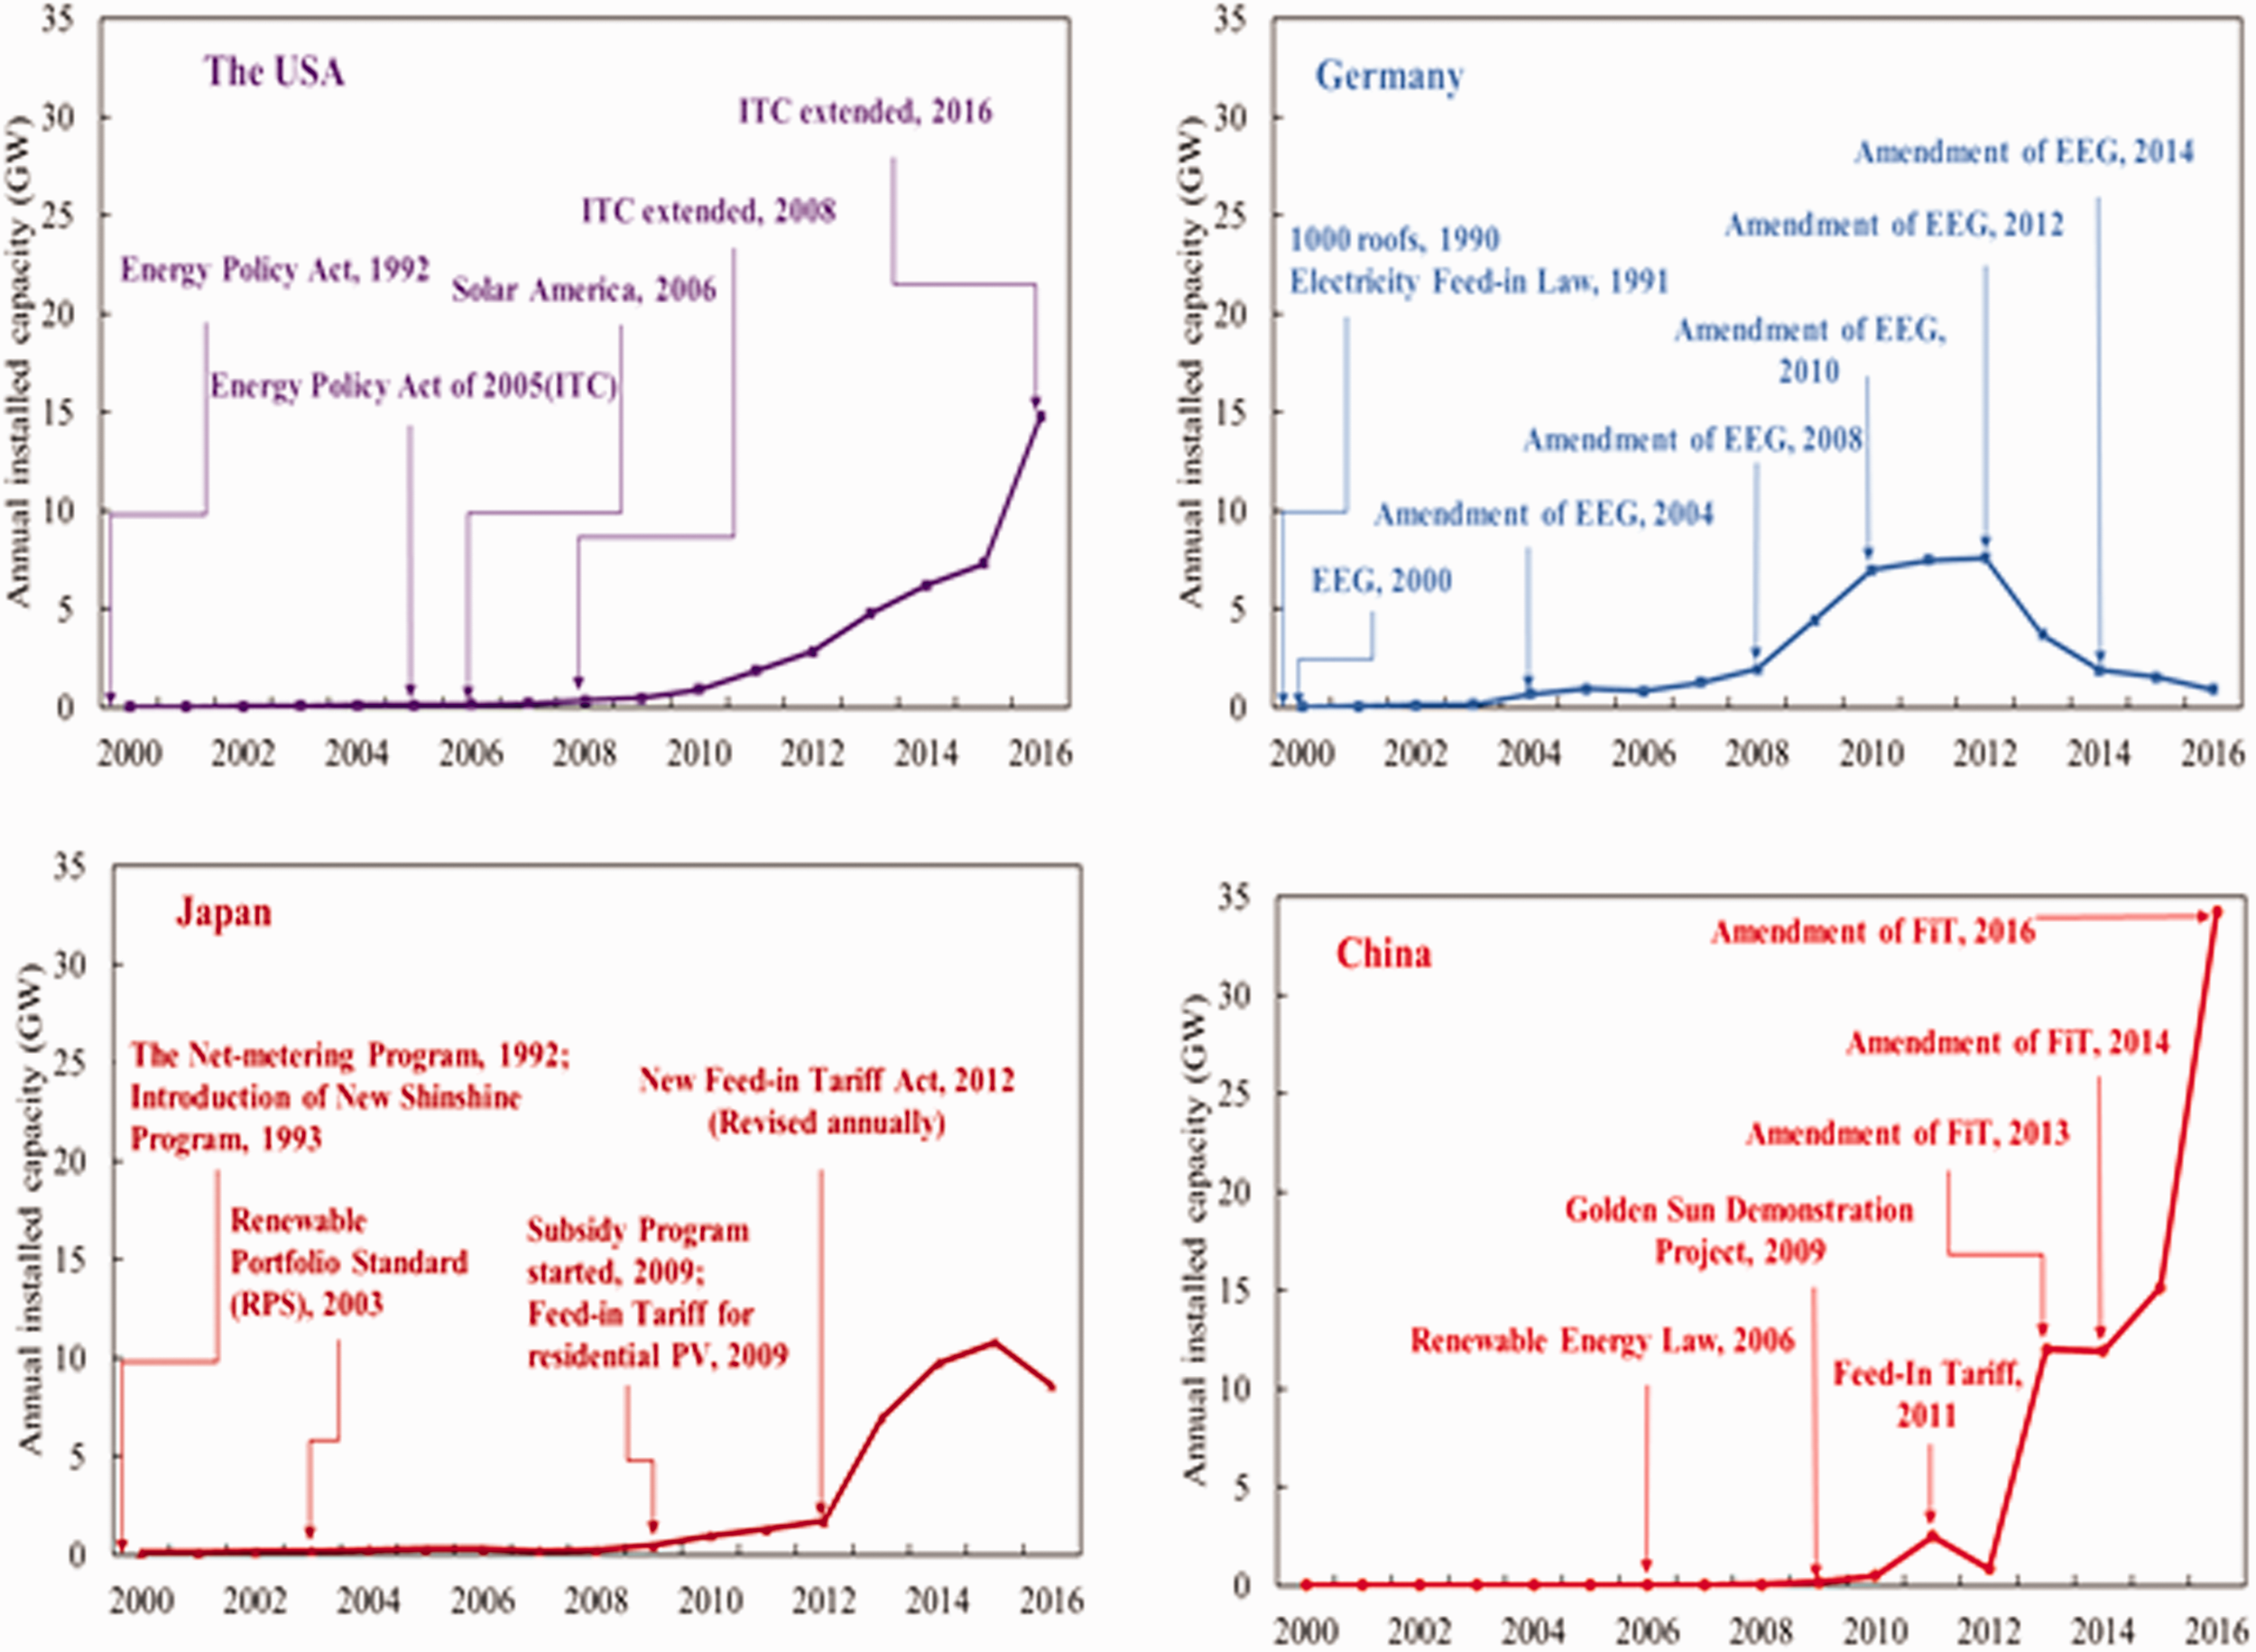
Annual photovoltaic (PV) market development and incentive policy in China, Germany, Japan and the United States (Data source: IEA policy database).
Except for the USA, all other three countries launched national-scale FiT schemes. Figure 10 shows the annual PV market and incentive policy in China, Germany, Japan, and the USA from 1990 to 2016. We find that the FiT policy significantly affected the global PV market development. Germany introduced the FiT scheme in 1991, which drove the formation of the German PV market. The PV market continuously increased under a stable “EEG” in 2000. Since 2008, Germany has been the largest PV market. However, with the expansion of PV deployment, the cost of electricity borne by consumers has increased dramatically. In response to these challenges, a new EEG was implemented in 2010, which included specific measures such as limited market development, limited additional costs for consumers, and reduced profitability. The EEG was amended in 2012, which introduced a monthly adapted digression rate limited to 52 GW of the total installed PV capacity. In 2014, the government further fundamentally revised the EEG. The annual PV installed capacity decreased from 8200 MW in 2012 to 1200 MW in 20,141,300 MW in 2015, and 1500 MW in 2016. The PV market expansion in Germany has been relatively stable.
With the reduction of the initial investment in PV energy in recent years, the FiT has replaced the investment incentive policy to become an essential energy policy. The success of the FiT in Germany proves that this Act is a highly effective policy framework for accelerating the deployment of PV energy. China and Japan have begun to follow the German approach. Japan implemented FITs in 2012 and offered the most attractive tariffs of 0.36 USD/kWh (Kimura, 2017). China started implementing FITs in 2011 and had the lowest financial incentives of 0.146 to 0.163 USD/kWh (Zhang and Chang, 2016). Since 2013, China has ranked first in the worldwide PV market and Japan was the world’s second-largest market for solar PV growth in 2013 and 2014. The feed-in tariff helps Germany, Japan and China to occupy three of the world’s top four positions in PV the market. In the USA, the ITC has proven to be one of the most important federal policy mechanisms for driving PV energy deployment since 2005. The residential and commercial ITC have helped the solar PV market to grow significantly since it was implemented in 2006, with an average annual installed capacity growth rate of 50% over the last decade alone. However, this support mechanism also has certain limitations. The ITC is geared toward investment only and does not improve the long-term operating performance of PV power plants. Several states in the USA implemented the FiT scheme on a local scale, which is also a great push for PV deployment (Office of Energy Efficiency & Renewable Energy, 2019). Therefore, the FiT has proven to be more effective than tax and investment incentive policies in PV development.
Future challenges of PV development in China, Germany, Japan and the USA
In 2018, renewable energy shared more than 17% of the total power generation in the USA and the PV shared 1.5%. In the field of R&D, the SunShot Initiative in 2016 aimed to reduce the cost of solar power by 50% between 2020 and 2030. The DOE provided amounts of funding to further drive down the cost and accelerate PV deployment. SunShot 2030 was set up a new target for PV generation cost, and the cost has the great potential to further decrease. In 2020, the ITC Act will reduce the PV generation cost to 26%, and 22% in 2021, to 10% for utility and commercial-scale projects, to 0% for residential projects. This change will significantly impact the USA’s PV deployments, which can be predicted to slow down over the next few years. However, the general trend is still increasing due to the rapid decline in PV generation costs. The IRENA projected that the PV market in the USA will reach 393 GW by 2030, making it the world’s second-largest PV market (IRENA, 2019).
In 2018, renewable energy generation in Germany accounted for 43% of the total energy supply, including 8% for solar PV. In the same year, Germany introduced the Climate Protection Act 2030, with the goal of renewable energy reaching more than 65% of the total energy supply by 2030 (Enkhardt, 2019). Therefore, there is a need to increase the contribution of renewable resources such as PVs. In R&D, in the 7th Energy Research Program launched in 2018, the federal government earmarked around EUR 6.4 billion for innovation activities, which targeted the PV system to have a 35% increase in efficiency and reduction of 50% in cost by 2030 (BMWi, 2018). In the PV industry, PV production has continuously declined in the recent years. However, the PV specialist group reported that PV production will increase again in 2020 (VDMA, 2019). The German government has set a target of the PV installed capacity to 98 GW by 2030 (Xinhua, 2018). In 2019, the cumulative PV installed capacity was 49.27 GW; when the 52 GW cap was reached, the government ceased the application of FiT to new solar PV projects. The abolition of FiT means that the profit of the solar PV will decrease significantly, which indicates that the PV deployment will be reduced. Although the government has set the 98 GW target for solar PV, there is no assurace that this target will be achieved, showing the uncertainty in the future of solar PV deployment in Germany.
In 2015, the Japanese government set a target to reach 22–24% of the total energy from renewable energy by 2030, including 7% (67 GW) of solar PV by 2030 (METI, 2018b). In the “5th Strategic Energy Plan,” the renewable energy was defined as a major power supply source. For PV R&D, the NEDO changed R&D strategies from the enhanced PV efficiency and reduced the cost to improve the reliability and safety of PV power generation. METI projected the generation cost to achieve 0.065 USD/kWh for residential PV and 0.047 USD/kWh for large-scale PV in 2030 (METI, 2018a). In the PV industry, local PV production is affected by the price advantage of foreign manufacturers. The major PV firms in Japan changed the strategies from “manufacturing of individual equipment” to the provision of “comprehensive solution services,” and enhanced competitiveness through cooperation with Chinese companies in manufacturing (IEA, 2020). Mitsubishi has shut down the PV manufacturing business, and Panasonic transferred the PV manufacturing business to Chinese companies. In 2018, overseas PV production shared more than 74% of the domestic market. It is expected that the majority of PV manufacturing in Japan will be gradually replaced by foreign manufacturers in the future. In 2018, the cumulative installed capacity of solar PV was 56 GW, which means that the 2030 target of 67 GW would be surpassed within 2019 or 2020. At present, the Japanese government has not set a new target for PV installation capacity. The JPEA forecasts that solar PV installed capacity in Japan will reach 100 GW in 2030 and 300 GW in 2050 (JPEA, 2020). Considering the national burdens, the FiT still needs continuous reform.
In 2018, China’s renewable energy share more than 26% of the total electricity generation, and the solar PV shared 2.5%. In the field of R&D, the PV R&D leads by the “Top Runner Program,” which greatly enhanced the average PV cell and module efficiency. The 13th Solar Energy Development Five-year Plan (2016 –2020) was launched by NEA, establishing targets for solar energy deployment of at least 105 GW by 2020 (IEA, 2017). The solar PV cumulative installed capacity reached more than 175 GW in 2018 under the FiT, which has far surpassed the government’s target. Therefore, the Chinese government has adopted a series of policies to reduce the FiT subsidy, aiming to rapidly realize grid parity and gradually remove the subsidy. These policies have a great influence on the PV market and industry. The annual PV installed capacity decreased by 32% in 2018. Another problem is the solar energy oversupply. The Chinese government has launched an action plan to reduce the PV curtailment rate by setting mandatory caps on curtailment and minimum consumption targets. The PV curtailment rate decreased from 10% in 2015 to 3.8% in 2018. In the report of China’s renewable energy outlook 2019, the government expected a solar PV installed capacity of 532 GW in the 14th Five-Year (2021–2026) plan and 1109 GW in 15th Five-Year (2026–2030) plan (CNREC, 2019).
Based on the above, we found that solar PV energy in the four leading countries could compete with traditional energy and will continue to deploy on a large scale in the next ten years. Despite all the countries’ optimism of future trends, solar PV power is still facing serious challenges. The existing challenges in different fields of PV could hinder PV development in the coming decades.
First, except for Germany, governments in the other three countries lacked new long-term goals for PV deployment. Long-term goals can greatly impact the future of PV development. Long-term targets, update planning and stable measures are needed to meet the challenges and maintain healthy PV development. Currently, Germany and China are scaling back or eliminating subsidies for PV power generation, which increases uncertainty in terms of policy form and market risk. Governments in four countries should rapidly upgrade their long-term policies, including R&D, and supply-push and demand-pull policies, in line with the current state of PV development.
Second, it is expected that PV deployment in the four countries will continue to grow at a high rate over the next decade. With the expansion of PV power generation, daily or seasonal demand-supply balance will be a problem (Li et al., 2018). The resulting high PV penetration will be a major issue in the limited expansion of PV power generation. The continuous scaling-up of PV deployment would be a great challenge for the government to reduce PV curtailment and maintain grid balance. Policymakers should consider reorienting policies to overcome grid constraints and promote flexibility.
Third, China dominates the PV production market. However, overproduction is a serious problem. The promotion of a competitive environment and strengthening value creation from the development of the PV industry has become a huge challenge for the Chinese government. At the same time, as the growth rate of the domestic PV market gradually decreases, the heavy dependence on international markets will once again become a huge risk for China’s PV industry. In addition, to maintain the competitiveness of PV products in the international market, the Chinese government should increase basic R&D investment to promote the progress of PV technology.
Finally, driven by policies and supportive measure changes in recent years, the distributed PV installations will be increasing more rapidly. However, the high initial investment cost and long payback periods of distributed PV are barrier to private investors. The effective adoption of a systemic approach to support the deployment of distributed energy, including business model innovation and various renewable energy sources integration, would be a great challenge in these four leading countries.
Conclusion
Solar PV technology is an inevitable choice for countries around the world to ensure energy security and promote greenhouse gas emission reductions. PV technology has made tremendous progress over the past few decades, with strong support from governments. Governments in various countries have designed different kinds of incentive policies based on the characteristics of different market development phases, including supply push policies for R&D and industry and demand pull policies for market development.
This paper provides an overview of solar PV development in the top four leading countries and highlightes the policy instruments that influenced PV development processes. It inspected PV development processes from three perspectives: PV R&D, industry and market development. These four cases highlight the significant role of government policy in supporting PV development.
The main findings of this study can be concluded as follows:
The success of PV technology development in the USA, Germany and Japan in the early stages could be attributed to the long-term stable coordinated public funds received in PV technology innovation, and another crucial point is that those policies provide a high level of collaboration between industry, academia and research institutes. As a developing country, China has improved PV technology achieved via learning-by-doing strategies and not technological innovation. The technology mainly transfers from Western countries. High-tech capabilities and knowledge are embedded in the production line, which is an import from western countries, mainly from Germany. China lacked a long-term PV R&D program, and invested less public R&D funds than the other three developed countries. In China, R&D activities and policies focus on prodcution oriented to reduce costs. In Germany, Japan and the USA, which focus is more on technology improvements. In those four countries, China was the only country with production push policies. The Chinese government has substantially subsidized the PV manufacturing sector with producer subsidies, research grants, tax rebates, loans and lower price lands. The incentive policy supports enable China to establish a complete PV industry supply chain. Large-scale production also promotes cost reduction. Although China’s PV industry was the largest player worldwide, the overcapacity of China’s PV industry has expanded along with the increasing imbalance between production and demand in the international market. In Japan and the United States, a large party of PV modules relies on imports, mainly from China. The tax and investment subsidy policy is more in line with the implementation of PV development to reduce the investment threshold. The cases of the four countries all prove that investment subsidies could help the PV market to realize rapid formation. However, the subsidy is not assessed on the basis of the quantities of power generated, which adds a lot of uncertainty to the subsequent power supply. This confirms that tax and investment incentives should be used as supplementary support instruments but not as the major policy. Except for the USA, all of the other three countries launched a nationwide FiT scheme. The success of PV development in three countries has proved that FiT is a highly effective policy framework for accelerating the deployment of solar PV energy. The FiT could provide price certainty and offer long-term contracts to PV energy producers, and encourages the transmission of all the PV electricity generated to the grid. With the reduction of the initial investment in PV energy in recent years, FiT has replaced the investment incentive policy to become an essential energy policy.
This article can be used as a reference for the diffusion of renewable energy technologies, especially solar PV, in other countries.
Footnotes
Declaration of conflicting interests
The author(s) declared no potential conflicts of interest with respect to the research, authorship, and/or publication of this article.
Funding
The author(s) disclosed receipt of the following financial support for the research, authorship, and/or publication of this article: The part of this research received support from iSMART, Qingdao University of Technology and the fund from the University of Kitakyushu.