
Abstract
In the waiting zones of airports, train stations, and other transportation hubs, poor indoor environment is primarily caused by human body-related factors in conjunction with the high density of people. Existing ventilation systems cannot effectively remove the waste heat and pollutants generated by dense crowds. In this paper, a guardrail-based air supply terminal is proposed. Two indices, the velocity target value and temperature target value, were introduced to facilitate the evaluation of the guardrail-based air supply terminal. The jet air velocity, penetration air velocity and width of the unventilated strip are optimized based on CFD numerical simulations; the values obtained were V1 = 0.25 m/s, V2 = 0.15 m/s, and W = 290 mm. The guardrail-based air supply terminal was found to create a homogeneous air velocity of 0.3 m/s to avoid draft sensations. The uniformity and effectiveness of the air supply via the optimized guardrails are verified by full-scale experiments and visual experiments. The temperature of the working area was maintained at 26°C in the summer, creating a comfortable environment. Compared with other existing air distribution systems in high and large spaces, the velocity target value, air age, and temperature target value with the proposed air supply terminal were the smallest. The energy consumption of the guardrail-based air supply terminal was 61% less than that of the vertical wall jets. The results indicate that the guardrail-based air supply terminal not only meets the thermal comfort requirements but also saves energy.
Introduction
In the waiting areas of airports, railway stations, bus stations, subway stations and other transportation hubs, the main reasons for poor indoor environment are the thermal pollution and gas pollution caused by overcrowding (Liu et al., 2017a, 2017b, 2017c). Good ventilation is very important to improve the indoor environment (Nematchou et al., 2018). However, the existing ventilation systems are difficult to effectively improve the indoor environment of large space public areas. The air supply terminals are the last link between the ventilation or air conditioning system and the indoor environment. It plays a major role in the distribution of air around the human body, determines occupants’ thermal comfort and perceived air quality (Zhai and Metzger, 2019).Therefore, finding better air supply terminal to improve the indoor environment has become an urgent technical problem that must be solved.
The technological innovations for air distribution are closely related to the air supply terminal. The air supply at swirl tuyeres involves the use of rotating fans to cover a larger air supply area (Liu et al., 2016). A seat air supply was designed based on the combination of an outlet and a personal seat (Li et al., 2013; Zhao et al., 2002). Air distribution via air curtain ventilation with a linear slot diffuser combines the advantages of displacement ventilation and mixed ventilation (Yin and Li, 2014; Yin et al., 2016, 2017). These air supply modes combine the properties of the indoor space and achieve multiple functions; moreover, they can improve the ventilation efficiency and air quality in different types of buildings. Guardrails are installed to guide passenger flow in railway stations, passenger stations and other crowded places, as shown in Figure 1. These guardrails are made of hollow steel or plastic. Thus, the following question arises: can these guardrails be used as a new type of air supply terminal? The goal of this paper is to answer this question.
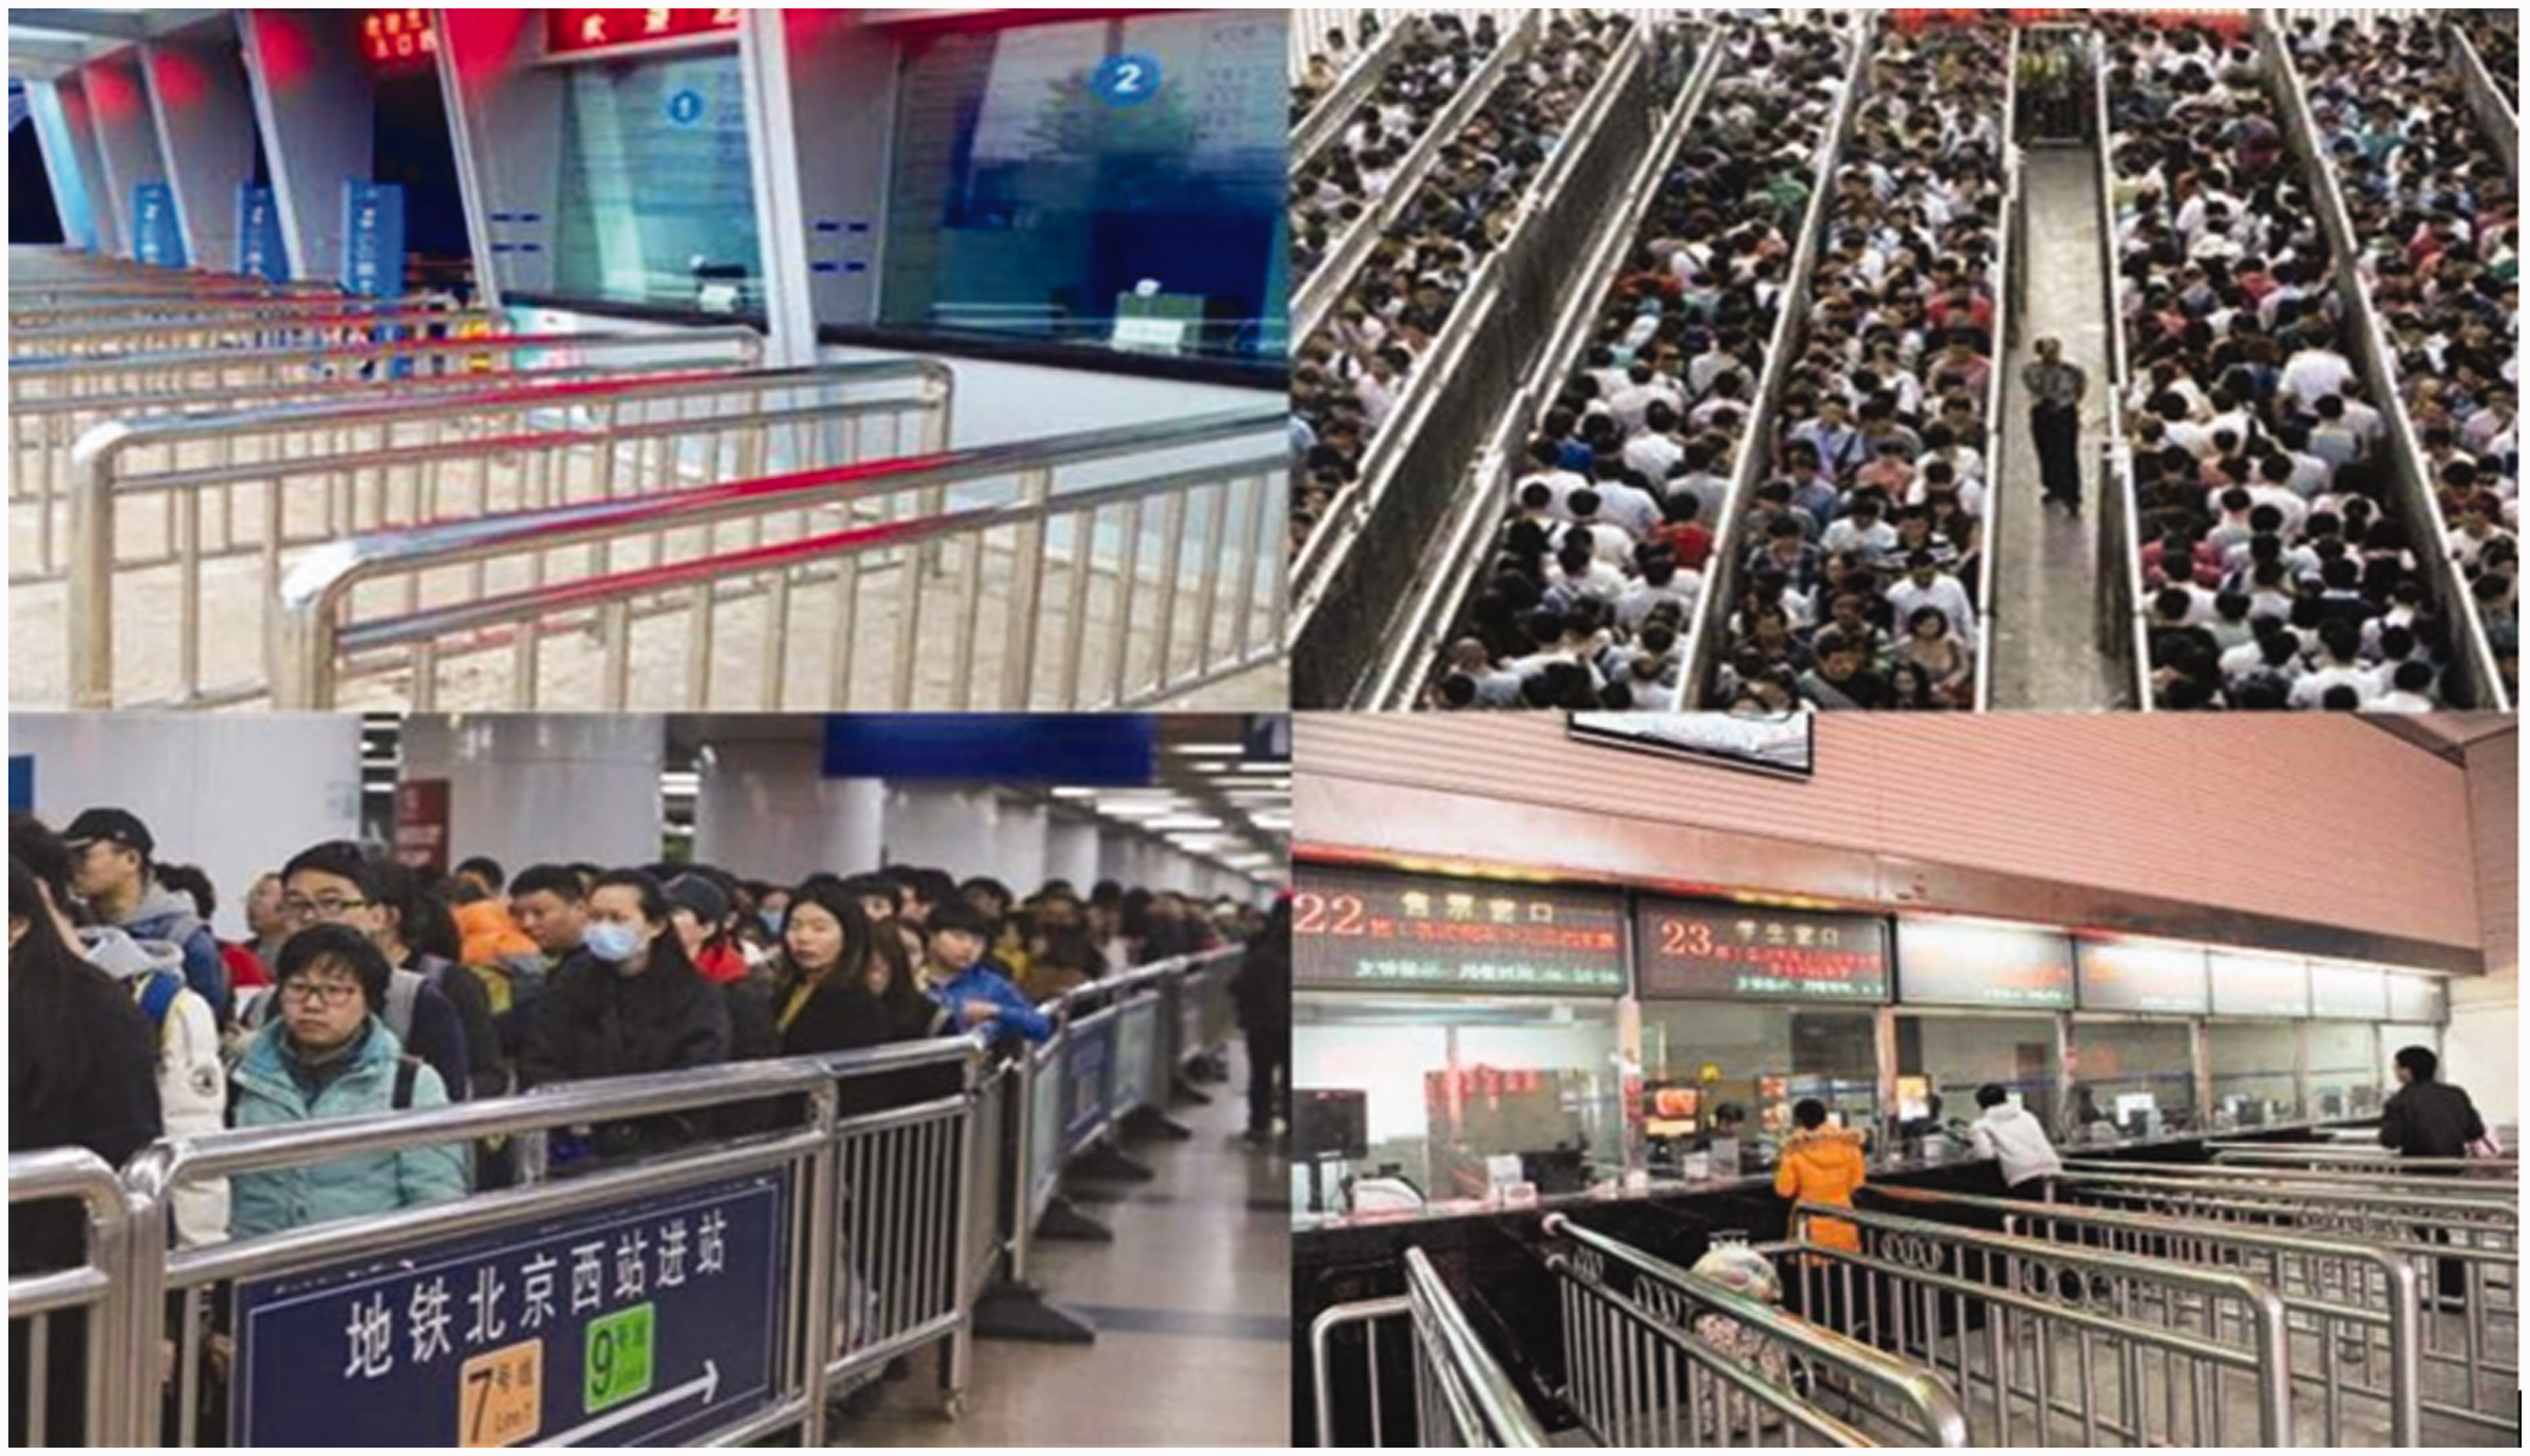
Photographs of guardrails.
Existing air distribution patterns, especially those in large-space buildings such as train stations and bus stations, mainly include stratified ventilation (Tian et al., 2019; Zhang et al., 2015), displacement ventilation (Liu et al., 2017a, 2017b, 2017c), and middle sidewall level air supply (Gil-Lopez et al., 2017; Wang et al., 2018). However, in the most existing air distributions, the cold air dumping in the waiting zone generates a localized draught and discomfort for passengers in slightly cool-to-neutral thermal states. To avoid this draft sensation, the maximum air velocity must not be too large. To meet the requirements of indoor cooling, the air velocity should also not be too small. How to realize an effective air supply terminal form with appropriate air velocity to balance the relationship between energy saving and ventilation effectiveness? Thus, further research is required to develop a method of ensuring that the air parameters in waiting zones meet the requirements of thermal comfort and energy saving through providing a reasonable air supply terminal.
Currently, the most frequently used air distribution evaluation methods are field indexes that evaluate thermal comfort and draft sensations, such as the Predicted Mean Vote and Predicted Percentage Dissatisfied (PMV-PPD) index proposed by Fanger (Fanger, 1972), which comprehensively considers six elements: the air temperature, air humidity, air flow velocity, mean radiative temperature, clothing thermal resistance and human activity level (Cheng et al., 2014; Gao et al., 2017; Gilani et al., 2016). The air diffuser performance index (ADPI), PMV and actual mean thermal sensation vote (ATS) were used by another study to evaluate the thermal environment (Fang et al., 2019; Nasrollahi et al., 2017; Shan et al., 2019). However, these field indexes are only applicable for individual fields, such as the temperature field, velocity field and PMV field, and fail to elucidate the difference between the required environment and the actual environment. If we want to compare transversely different air distributions, many parameters are coupled, and comparisons among PMV values obtained by interaction is obscure. These field indexes are also unfavorable for the optimization of air distributions or quantitative analyses of designated areas. Therefore, to optimize the air distribution, further research is required to identify a method of obtaining a quantitative index that reflects how well the air distribution is meeting user requirements.
In this paper, an air supply terminal based on guardrails is proposed. The blowing speed, nozzle penetration speed and air supply bandwidth of the guardrail-based air supply terminal were optimized by CFD simulations. The effectiveness of the optimized guardrail-based air supply terminal was validated by a full-scale test and visualization test. Two indices were introduced to evaluate the ventilation effectiveness in a local area. The guardrail-based air supply terminal fully utilizes the features of a particular space without changing the original spatial distribution. This approach effectively improves the thermal comfort environment of working areas and avoids the draft sensations.
Proposal of the guardrail-based air supply terminal
Guardrails for air supply
To avoid disorder and inefficient operations, train stations and bus stations often use guardrails to channel passengers. Considering both practicality and economic efficiency, guardrails are usually hollow. Can we use these guardrails as air supply terminals to deliver air in areas with large numbers of people?
This study introduces a guardrail-based air supply terminal that integrates the functions of guardrails and air supply terminal. As shown in Figure 2(a), air treated by the air conditioning unit is transported to the ticket lobby via the guardrail-based air supply terminal. Such guardrail-based air supply terminals are made of fireproof fiber cloth. Moreover, the fabric in penetration mode is an effective air ventilation terminal composed of polymer material, from which accumulated microorganisms can easily be removed through routine cleanings (Chen et al., 2011). Compared with previous air distribution strategies, e.g., roof and sidewall air supplies, the fiber cloth features a level of penetrability in crowed areas and provides stratified ventilation, displacement ventilation and personalized ventilation (Ahmed et al., 2017; Assaad et al., 2018; Huang et al., 2017; Li et al., 2013; Lin et al., 2017).
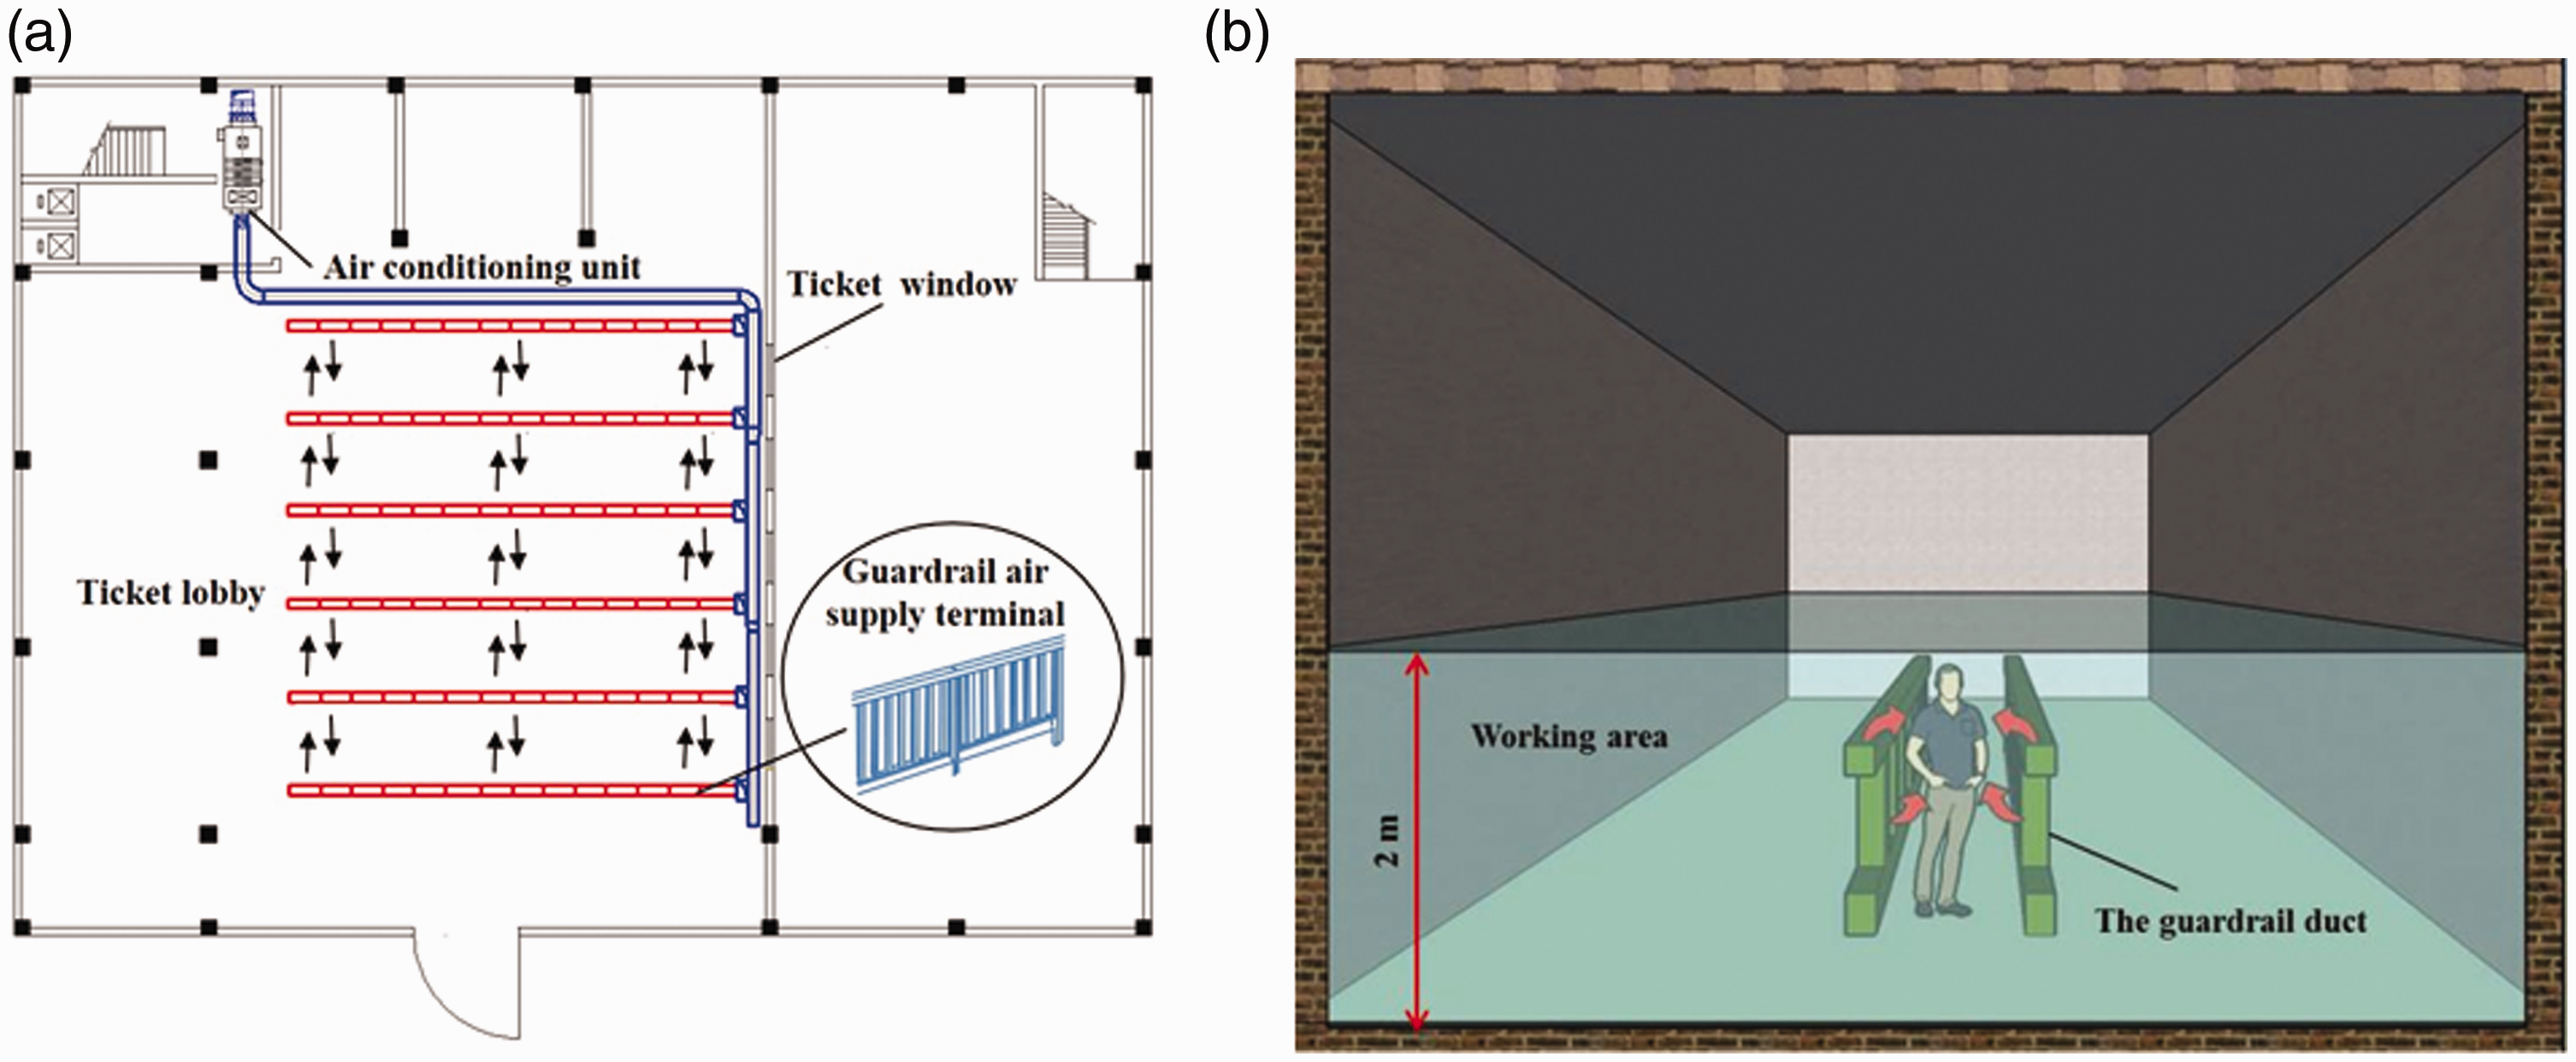
The guardrail-based air supply terminal: (a) Arrangement of the guardrail-based air supply terminal; (b) Working sketch of the guardrail-based air supply terminal.
As shown in Figure 2(b), this system only conditions the air at the lower part of a building and directly supplies treated air to the working areas (below 2 m), thereby reducing the cooling load of the entire air conditioning system, the required capacity of the air conditioning equipment, the investments in equipment and the operational expenses.
In addition, the air conditioning area of the waiting zone changes throughout the entire year. The number of people in train stations and bus stations during the offseason is usually much lower than that during the peak season. The air conditioning load in waiting zones increases when the station is crowded. Accordingly, the guardrails in the guardrail-based air supply terminal can be conveniently divided into segments, and the number of segments used can be reduced during the offseason to reduce operating costs.
In general, from a thermal comfort perspective, guardrail-based air supply terminal can create a clean, healthy, and comfortable indoor environment with a low air velocity and a uniform temperature. Economically, this approach reduces the initial investment, simplifies the maintenance of the air supply system and saves energy.
Concept of a target value
An ideal air supply system not only avoids draft sensations but also meets the indoor cooling capacity. To obtain the expected flow field of a waiting zone, the guardrail air supply terminals should be accurately optimized. To evaluate the effectiveness of the air supply terminal, we propose the concept of a target value, e.g., when a cannon is firing, certain targets are hit and others are not hit or are hit repeatedly, as shown in Figure 3(a) and (b). This concept is introduced to describe the air distribution in an indoor working area. The air flow is analogous to a cannonball, and the working area is analogous to the target of the cannon attack. Thus, the target hits or misses that are used to determine whether an air distribution is good or bad are regarded as indexes of the air supply effectiveness. The air supply that hits the target via the jet flow (the jet flow section covers the target) is used as an index of the air supply effectiveness, and an air supply that fails to hit the target is used as an index of air supply ineffectiveness.
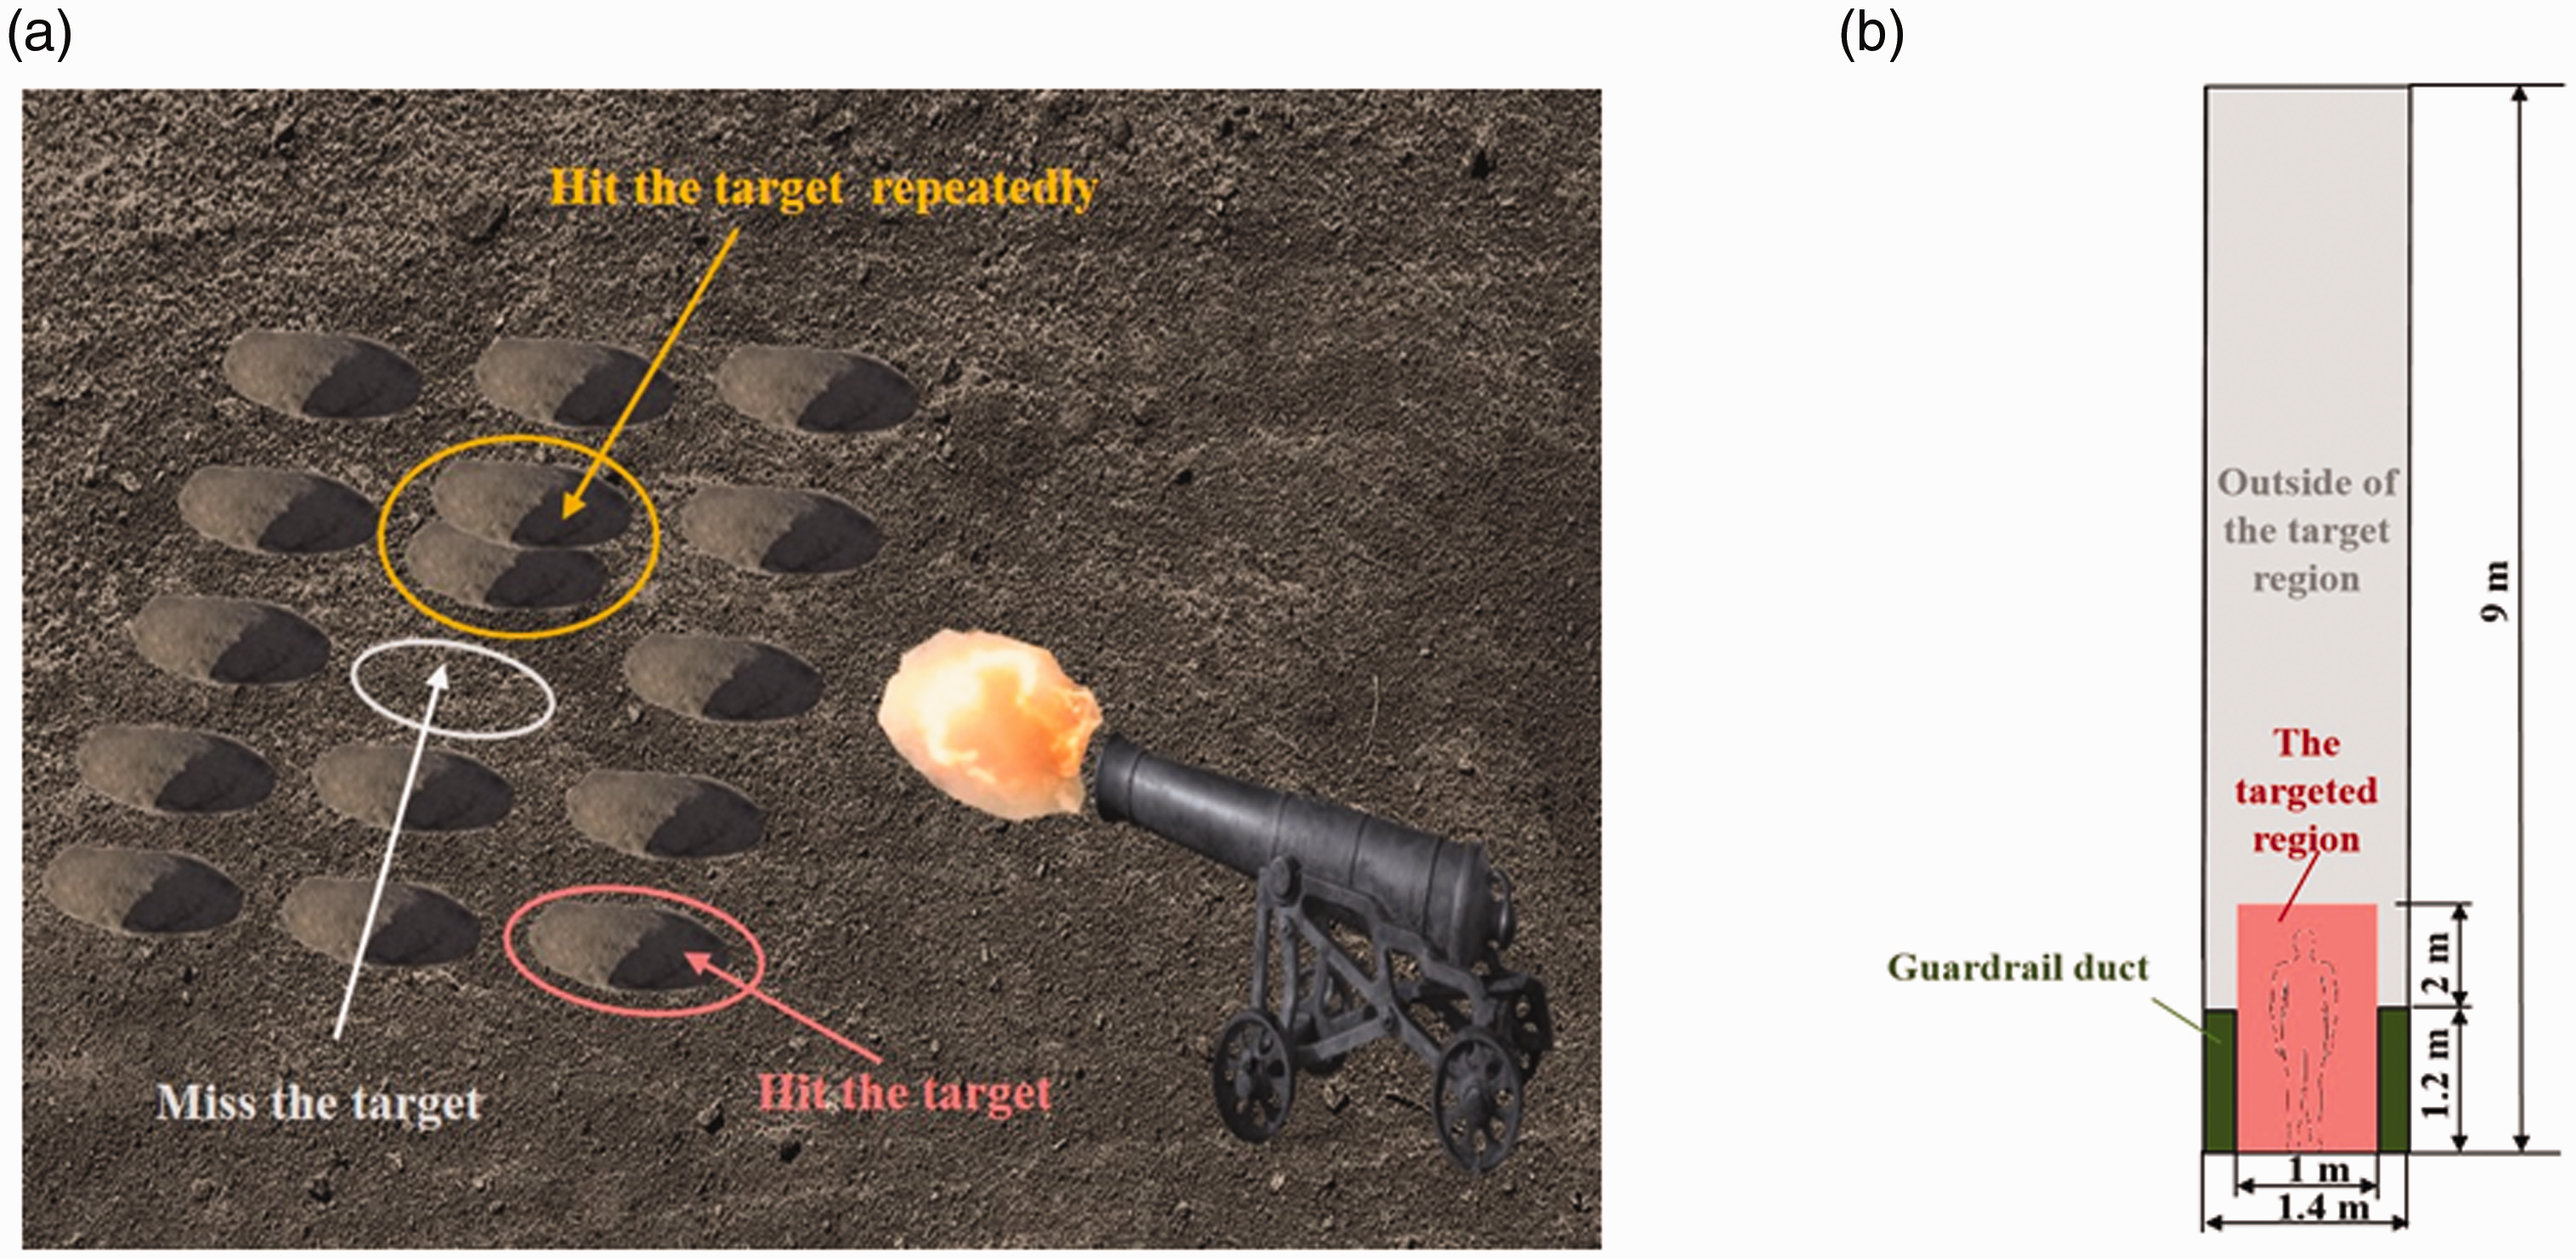
The concept of the target value: (a) The target shooting diagram; (b) The targeted air supply region.
Velocity target value
The velocity target value is defined in this section. Many recent studies in the literature have indicated that when the air velocity is lower than 0.3 m/s (ANSI/ASHRAE Standard 55-2010 (2010)), a draft sensation is difficult to perceive. To create a comfortable working area for people, 0.3 m/s is selected as the target air supply value. However, when the air velocity in the air supply area is 0 m/s, the air supply is considered ineffective. Thus, the definition of the velocity target value is as follows:
Temperature target value
Research method
To study the effect of the guardrail-based air supply terminal, full-scale experiments and numerical simulations were conducted. Additionally, the implementation effects of different air distributions (upper supply and bottom return, displacement ventilation, and vertical wall jets) and guardrail-based ventilation were compared.
3.1 Experimental research
Physical model
According to the typical dimensions of a guardrail, the size of a guardrail section is 0.2 m (length, X) × 2.0 m (width, Y) × 1.2 m (height, Z). There are 10 circular nozzles with a diameter of 2 cm on the horizontal plane of the guardrail and three strip nozzles with widths of 240 to 320 mm on the side, as shown in Figure 4 and Figure 8(a). The guardrail was placed in a large space of 1.0 m (length, X) × 2.0 m (width, Y) × 9.0 m (height, Z).
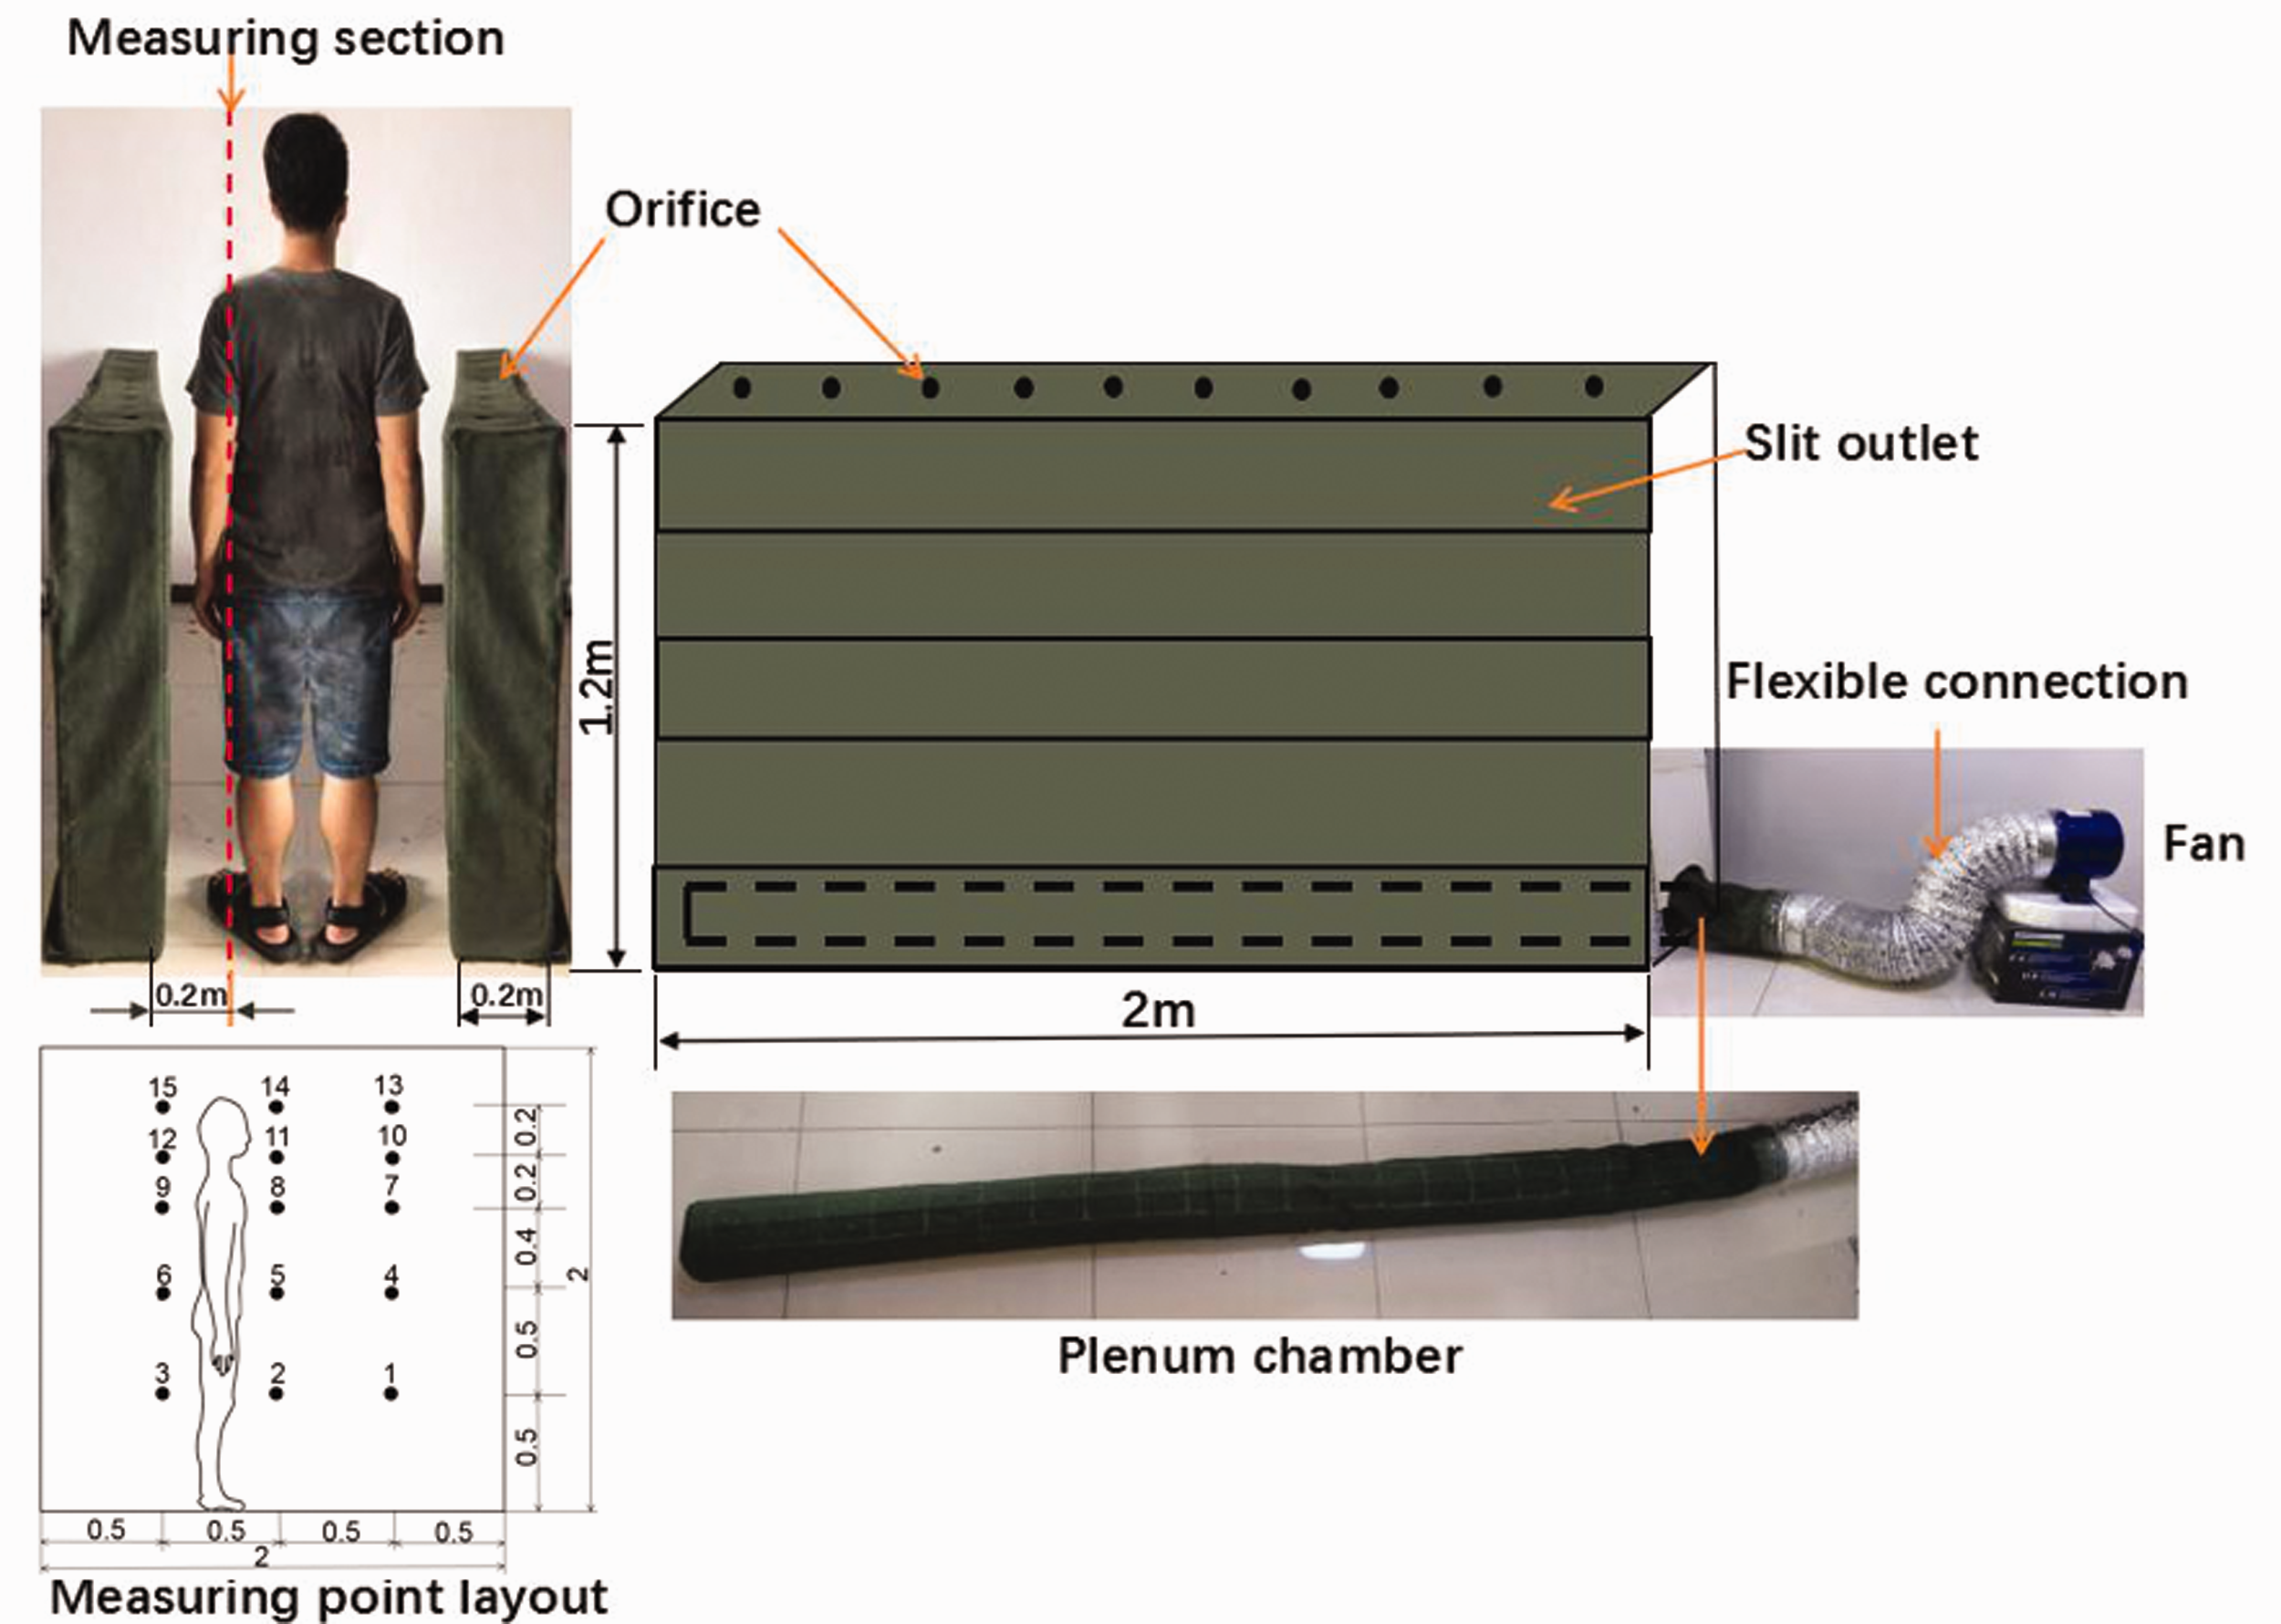
Physical measurements bench.
Test table
This study adopted a full-scale experiment. As shown in Figure 4, the experimental system was composed of a centrifugal fan, variable speed controller, flexible connection, plenum chamber and fiber cloth air duct. The centrifugal fan and the guardrail fiber air supply terminal were connected with a flexible aluminum foil duct. The plenum chamber, which was composed of the same material as the fiber cloth air duct, was set on the bottom of the guardrail to ensure an evenly penetrating air supply at the nozzles. To adjust the width of the strip penetration nozzles, paperboard was used to seal the air supply nozzles inside the guardrails per the width (the shadowed part of Figure 4 is the area of the penetration-type air supply, and the other area has no penetration). The air volume was controlled with a variable-speed controller.
Measuring instrumentation and procedure
In accordance with Human Dimensions of Chinese Adults GB10000-88 and the estimated measurements for adults aged 19–65 by Pheasant (Pheasant and Haslegrave, 2005), this study selected 5 points at the positions of the shins, thighs, abdomen, chest and head (per a real human body model), corresponding to heights of 0.5 m, 1.0 m, 1.4 m, 1.6 m, and 1.8 m, respectively (0–2 m from the ground) (ASHRAE Standard 22-2010, 2010). Considering the actual horizontal distance from the human body to the guardrail, the air velocities at 15 measurement points at a horizontal distance of 0.2 m (x) from the guardrail were measured.
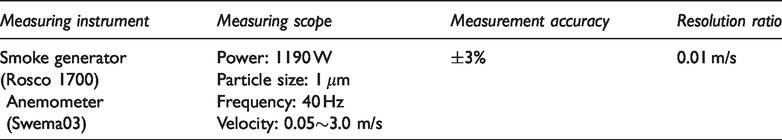
A visualization experiment was designed to observe the air movement of the guardrail-based air supply terminal with a diethyl ether generator and a laser chip light source. The air velocity was measured using the Swema03 omnidirectional anemometer system. The measurement scope and accuracy are given in Table 1. During the experiment, the Swema03 anemometer was fixed on an adjustable bracket. Each time the anemometer changed position, a ruler and a T-square were used for positional correction. The air volume reached the designated working condition based on the variable-speed controller, and the Swema03 anemometer was used to measure and record the working conditions after the fan reached stable operation (Liu et al., 2019).
Equipment parameters.
CFD numerical simulation research
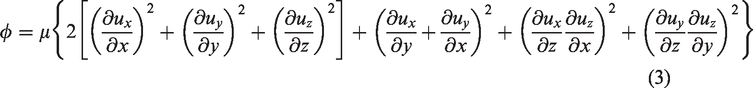
Grid refinement
This research adopted ICEM-CFD17.0 for the grid division in the model. An unstructured grid was adopted in this study because it can handle a variety of complex shapes, such as the combination of a circular nozzle and guardrail, and optimize the angle transformation of the nozzles on the guardrails. The grid must be denser at locations with high velocity gradients (Reid et al., 2014). This study introduces a dissipation function that involves a velocity gradient to determine where to densify the grid (see Figure 4) (Gao et al., 2018b; Schobeiri, 2010). The dissipation function can be expressed as follows:
After the iteration was completed, the simulation results for the different mesh numbers were compared based on equation (4) in terms of the velocity distribution differences (Huang et al., 2016). Figure 6 shows that continuing the mesh refinement process will not greatly affect the velocity distribution when the grid quantity is 531 k, and the average error at the monitoring points is controlled below 4%.
Validation of turbulence models
Given the air supply flow characteristics, many turbulence models have been used to perform air distribution simulations (Babich et al., 2017; Cheng et al., 2014; Gao and Li, 2012; Gao et al., 2018b; Rohdin and Moshfegh, 2007; Shirzadi et al., 2017; Van et al., 2013; Wu et al., 2018b). Among these turbulence models, the k-ε Realizable model has been effectively used in flow simulation experiments of various types, including shear flow featuring uniform rotation, jet-based free flow and mixed flow, flow in ducts, boundary layer flow and flow with separation. The velocity error can be expressed as follows:
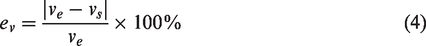
Where
Figure 7 shows a comparison of the average errors among the different models. In this study, the k-ε Realizable model is ultimately adopted. In addition, the Boussinesq hypothesis was introduced to address the buoyancy caused by temperature increases and consider the effect of air density variations on the air motion (Ye et al., 2016).
Solution settings
A standard wall function was adopted to model the turbulent flow in the near-wall region. To ensure that the first near-wall grid point is located in the logarithmic region, the non-dimensional wall distance, y+, should be at least 11.225 (ANSYS, 2013), and the value in this study is within the prescribed scope. The difference scheme applied was a second-order upwind scheme. The momentum equations were solved based on non-uniform staggered grids with a SIMPLE algorithm. The convergence criterion is that the residual of the discretization conservation equation is less than 10−4.
Boundary conditions
To simplify the model, the guardrail and flow field were both divided by symmetry planes, as shown in Figure 5; therefore, symmetric boundary conditions were established. The air inlets were defined as velocity inlets with a uniform velocity to simulate the half of the guardrail that is related to the flow field in half the target area. In addition, the outlet was set as an outflow.
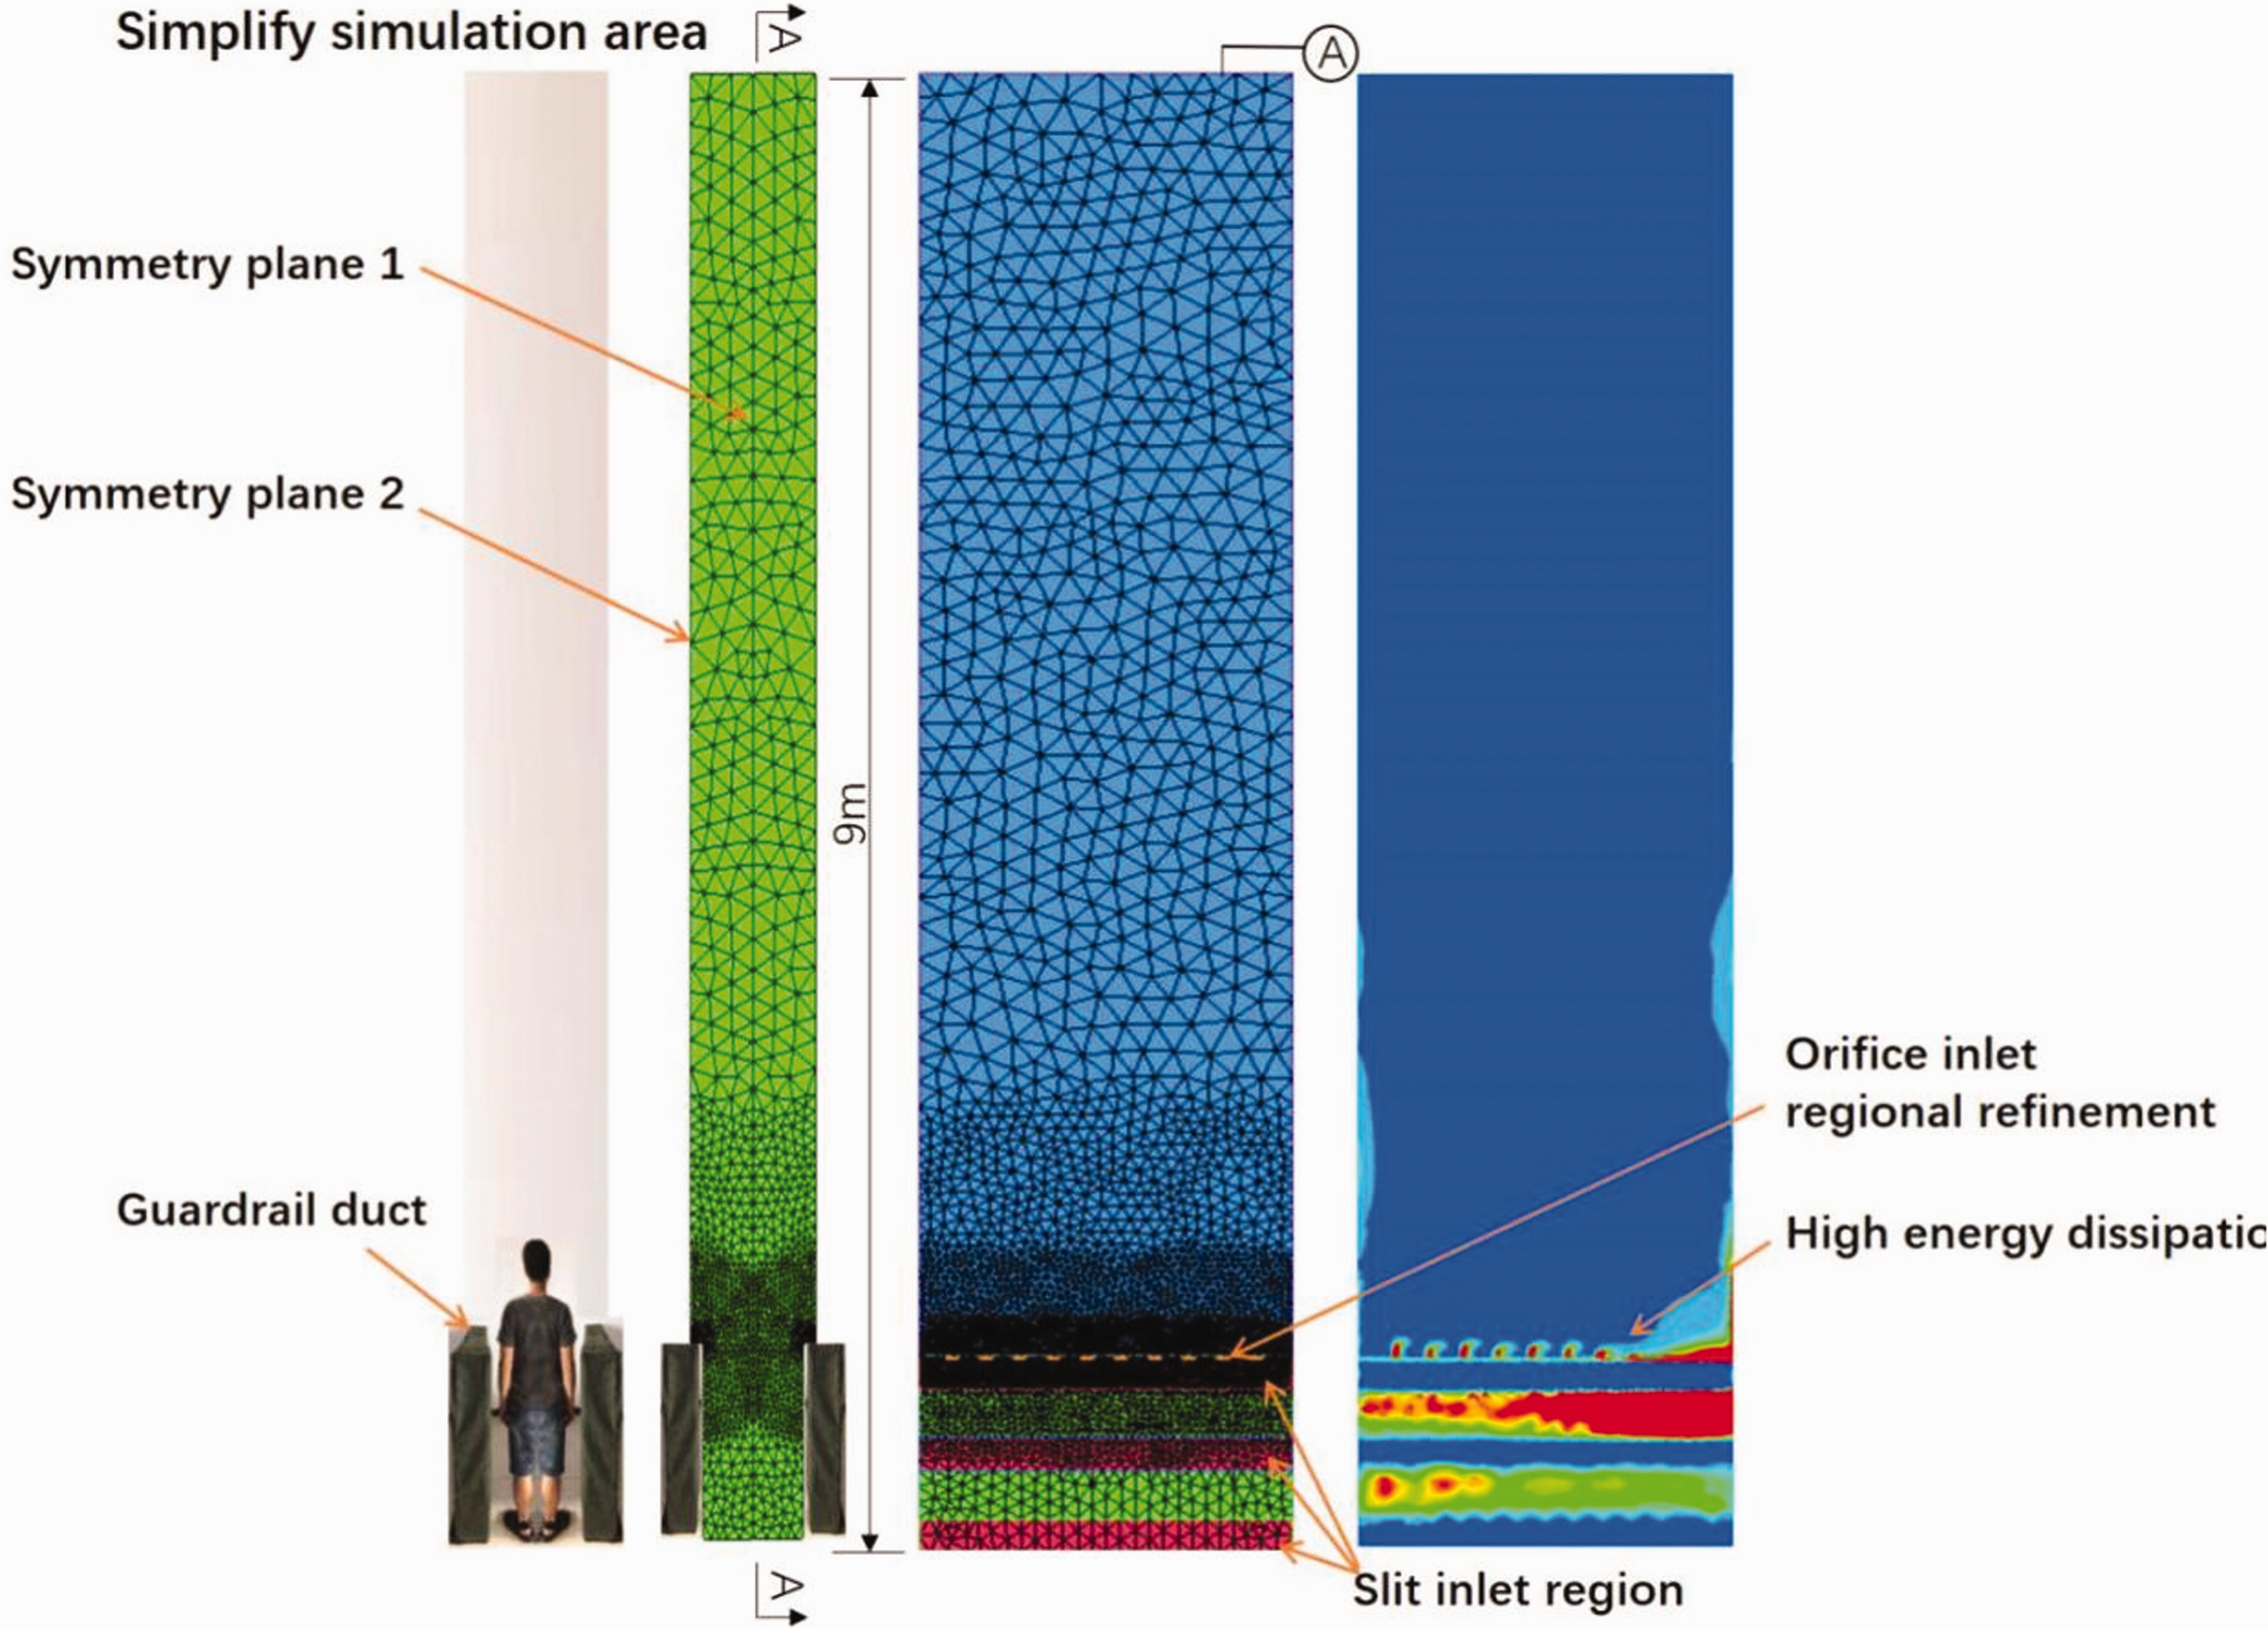
Regional refinement of the grids.
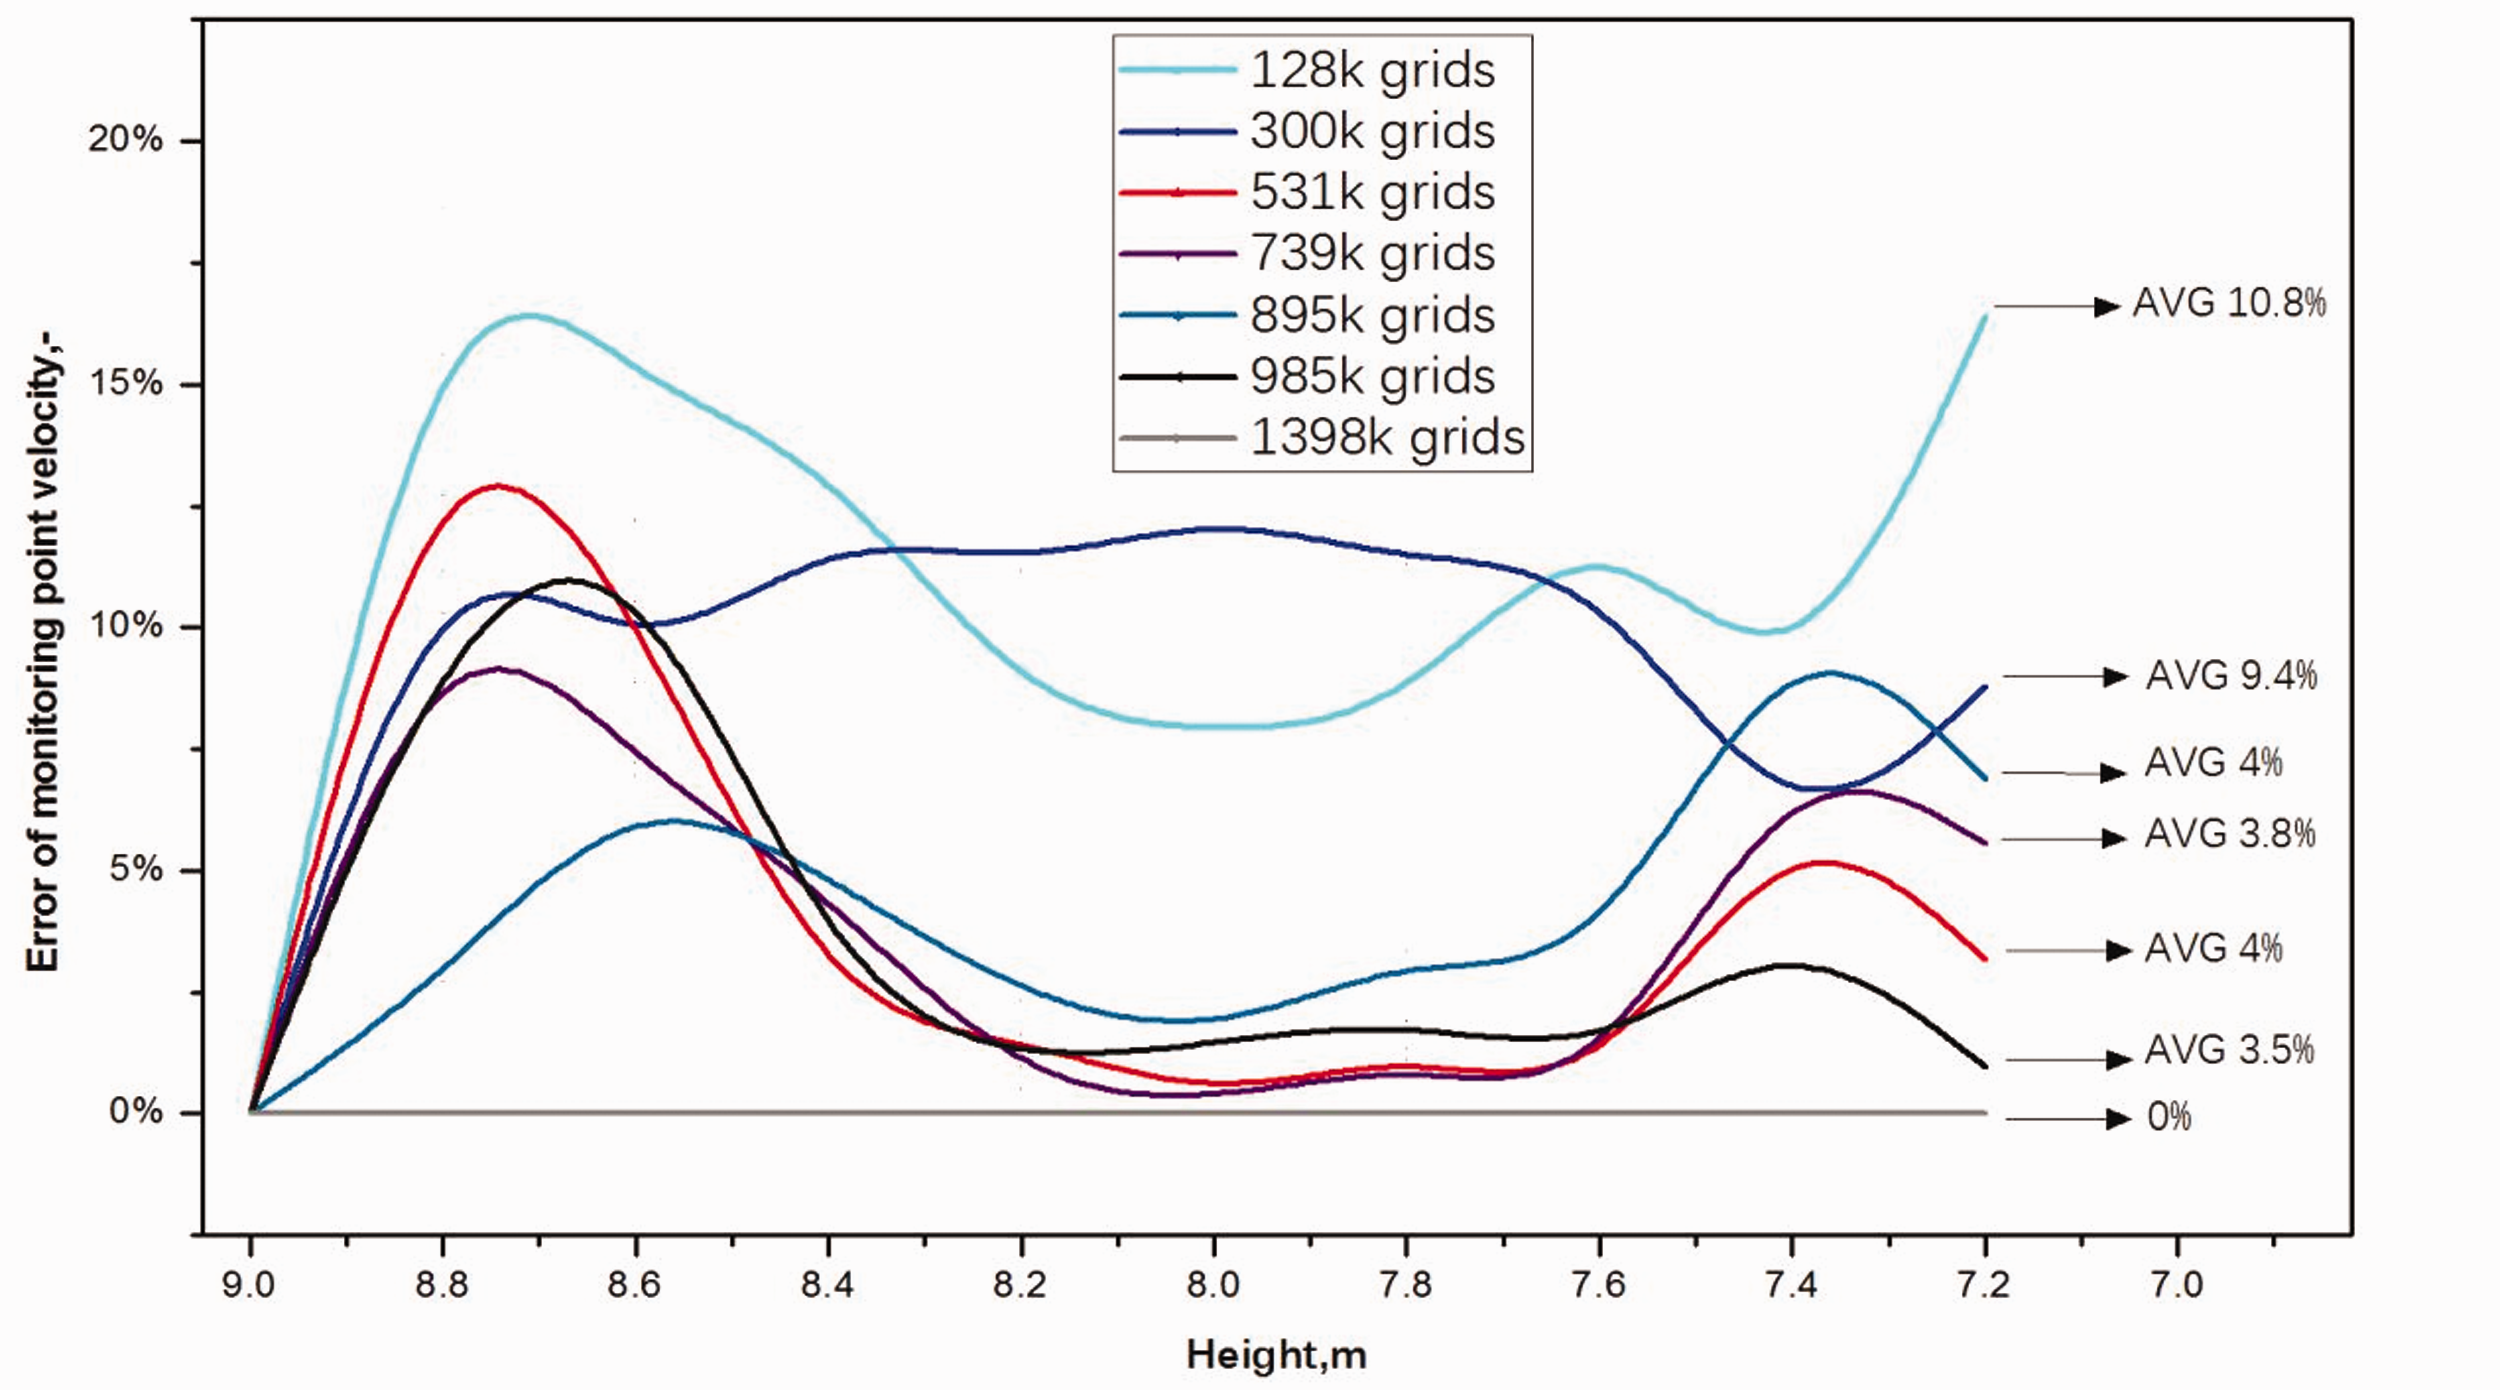
Velocity distributions for different grids.
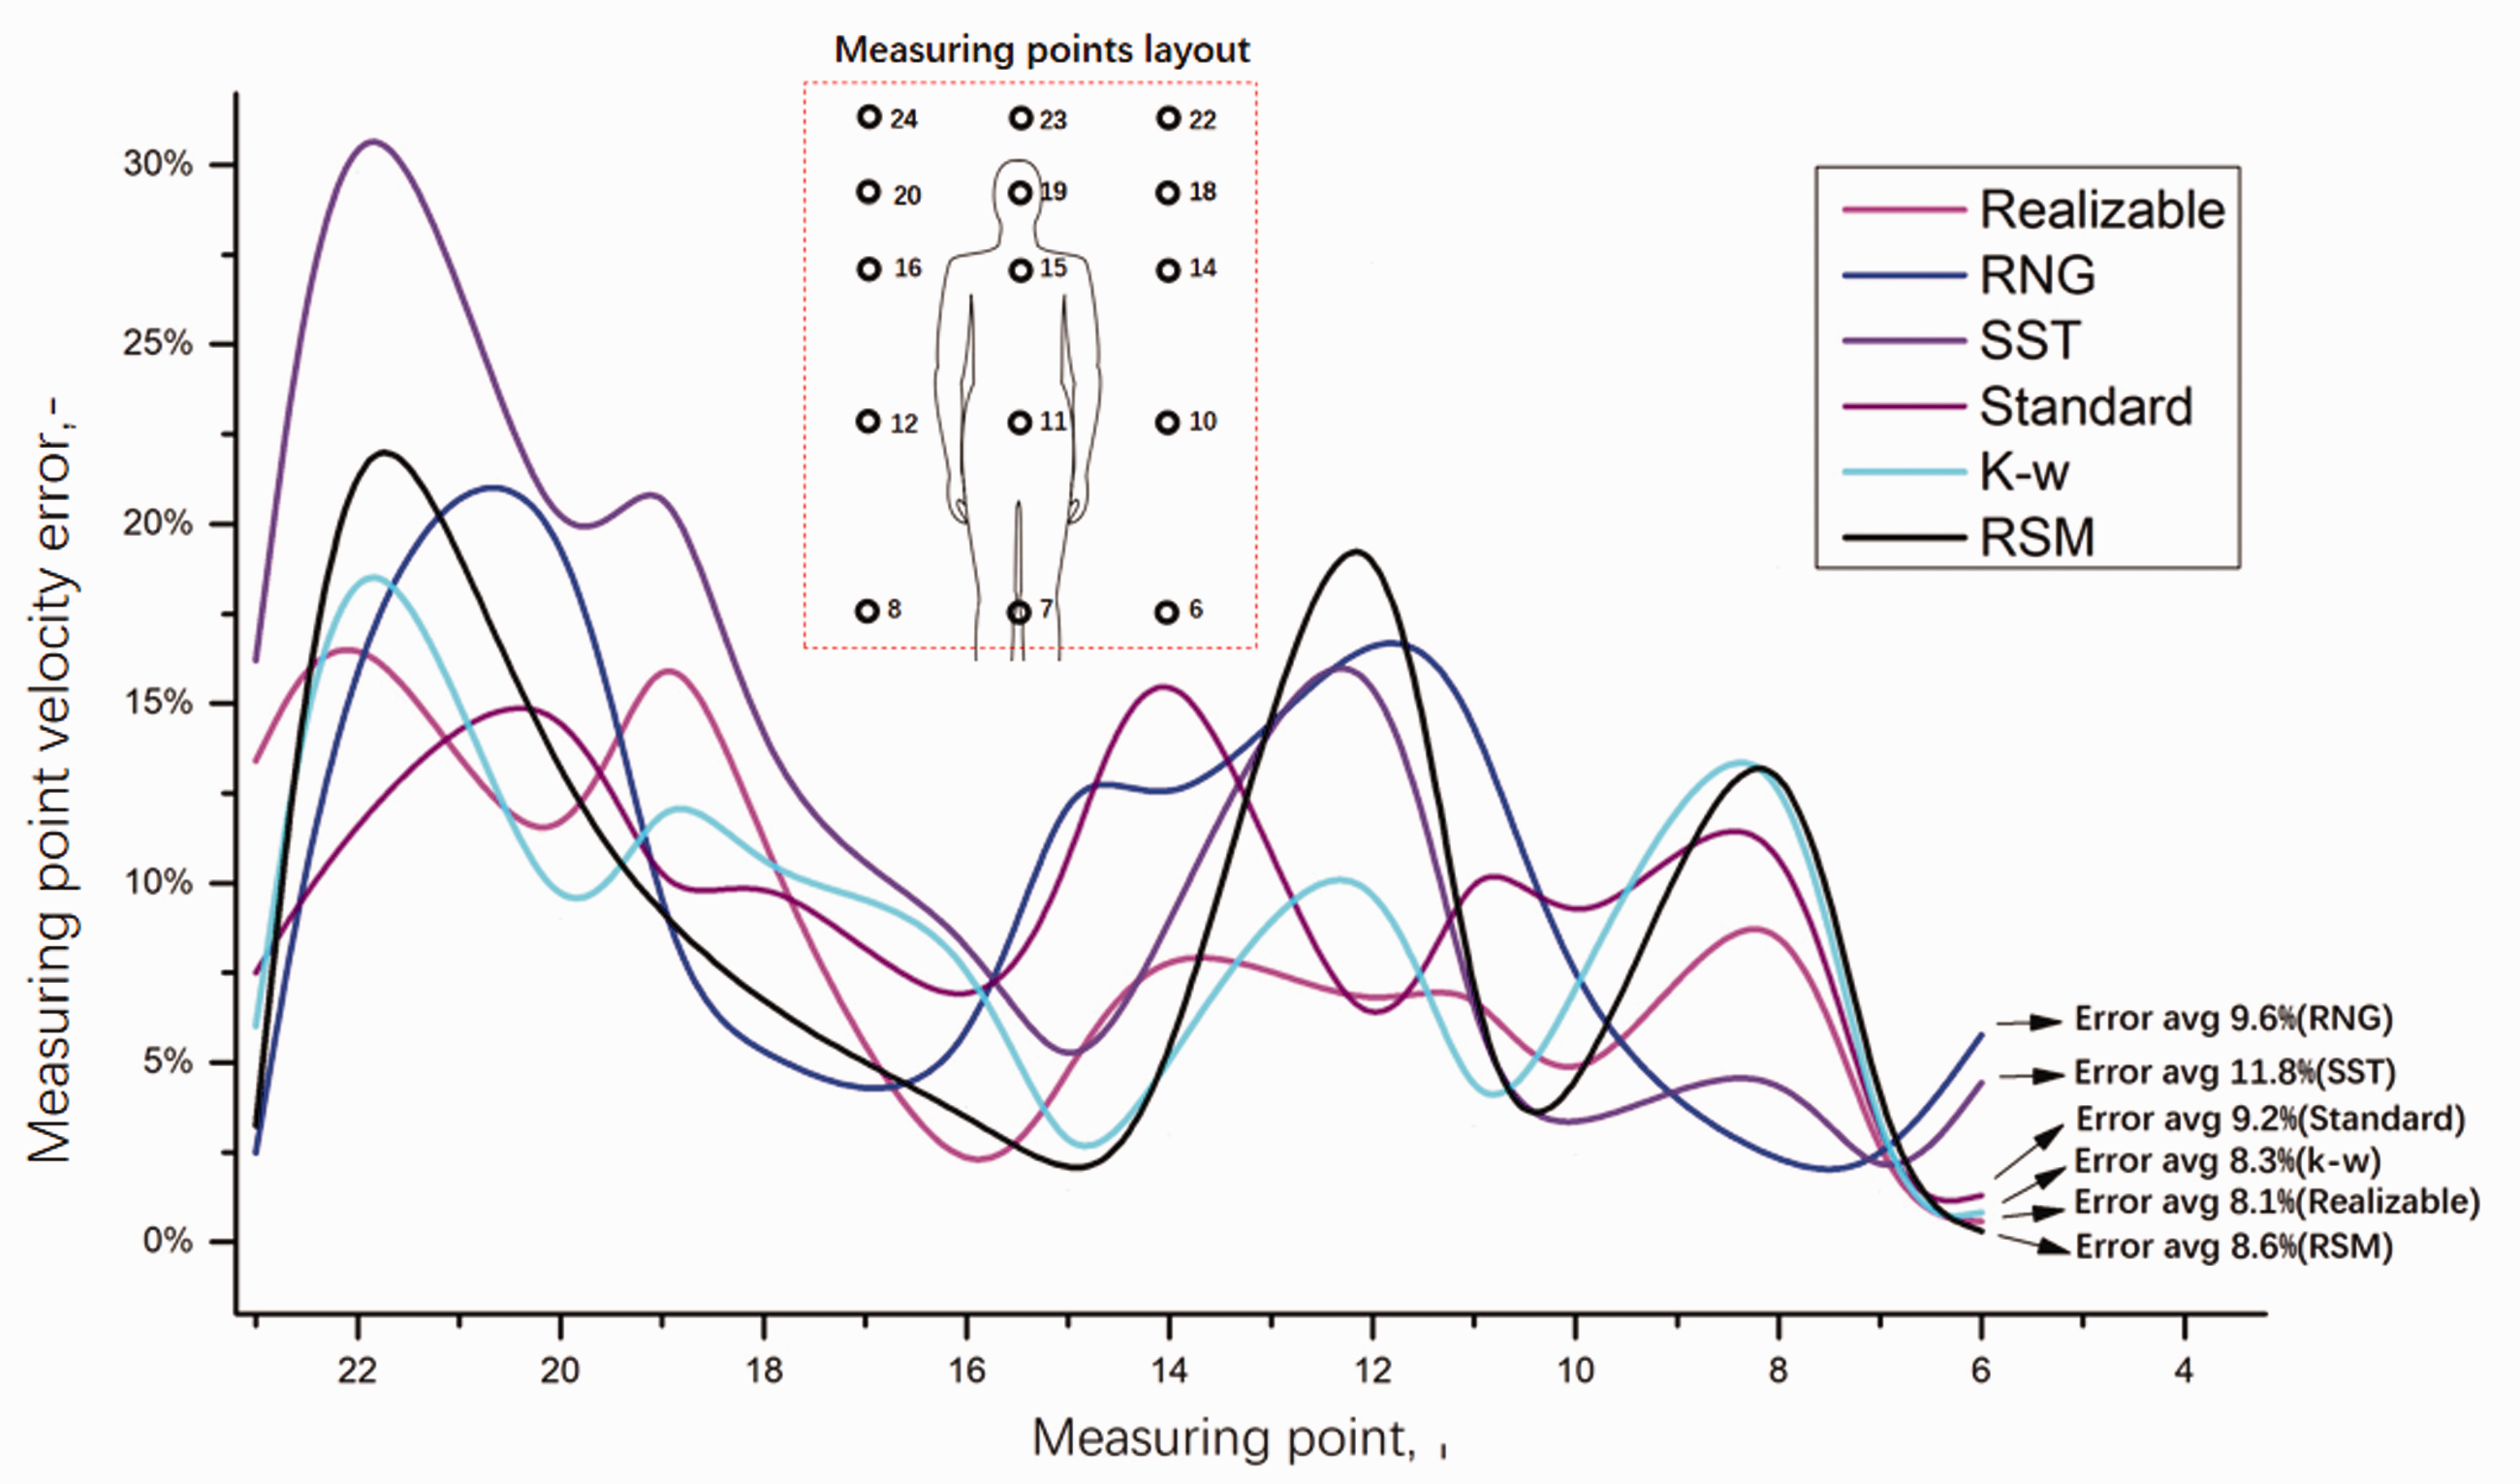
Validation of the turbulence model with 531 k meshes.
Results and discussion
Orthogonal test
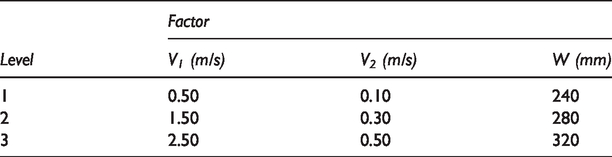
The orthogonal test was used to quantitatively evaluate the effects of various factors and the corresponding magnitudes of these effects, and it was selected based on past research (ANSYS Fluent Theory Guide, Canonsburg, PA, 2010; Li and Hao, 2018; Ni et al., 2018; Xia et al., 2016; Zhong et al., 2008). In this study, the following parameters were selected as the three main factors for the guardrail-based air supply terminal: the air velocity V1 (A) at the circular nozzles, the air velocity V2 (B) at the strip nozzles, and the width of the unventilated strip W (C).The levels of factors are shown in Table 2.
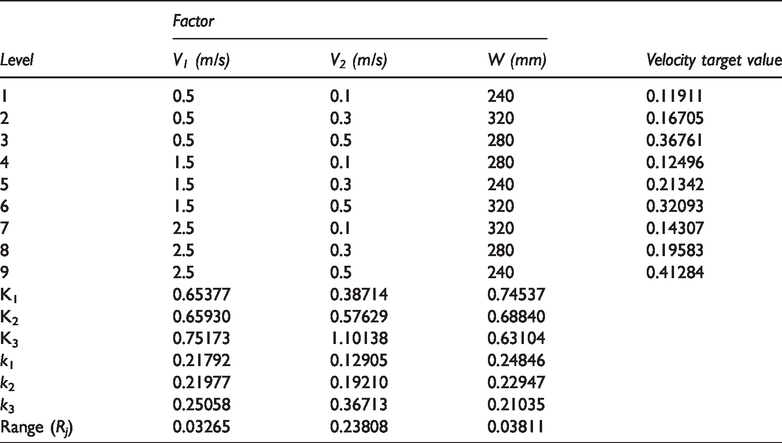
Factors and levels of the orthogonal test.
Nine representative test cases were selected based on the orthogonal table L9 (34). According to Figure 8(b), each line also had a test point, presenting evenly dispersed and comparable characteristics (Zhang et al., 2014). Taking the velocity target value as an evaluation index, the velocity target values of the nine schemes based on the numerical simulations are shown in Table 3 and Figure 9(a).
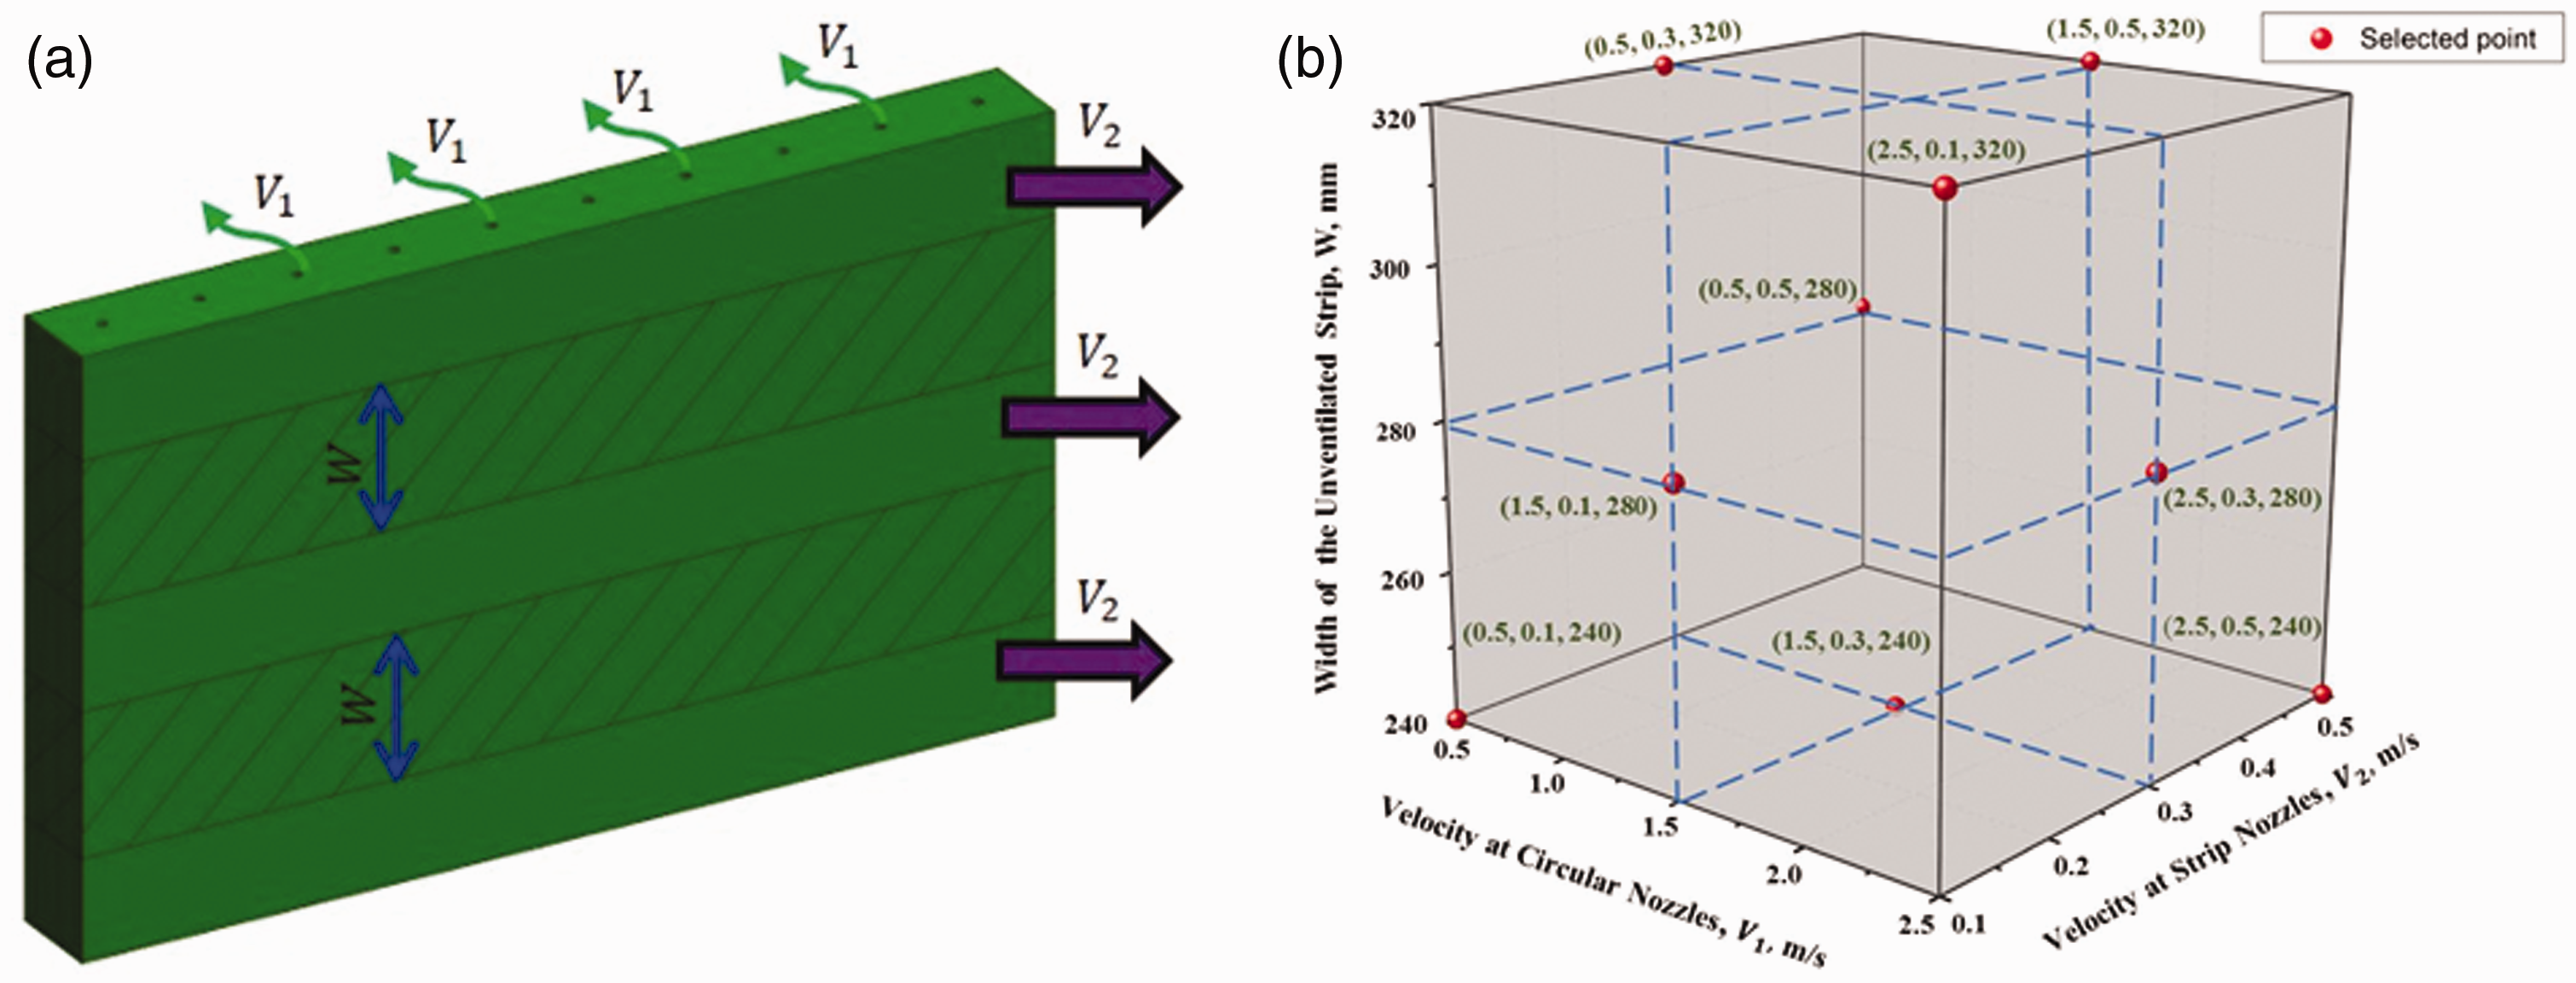
Model and orthogonal test points of the guardrail-based air supply terminal: (a) Model of the guardrail-based air supply terminal. (b) Distribution of the nine test points in a cube selected by the orthogonal table L9 (34) in a cube.
Results of the orthogonal test for the velocity target values.
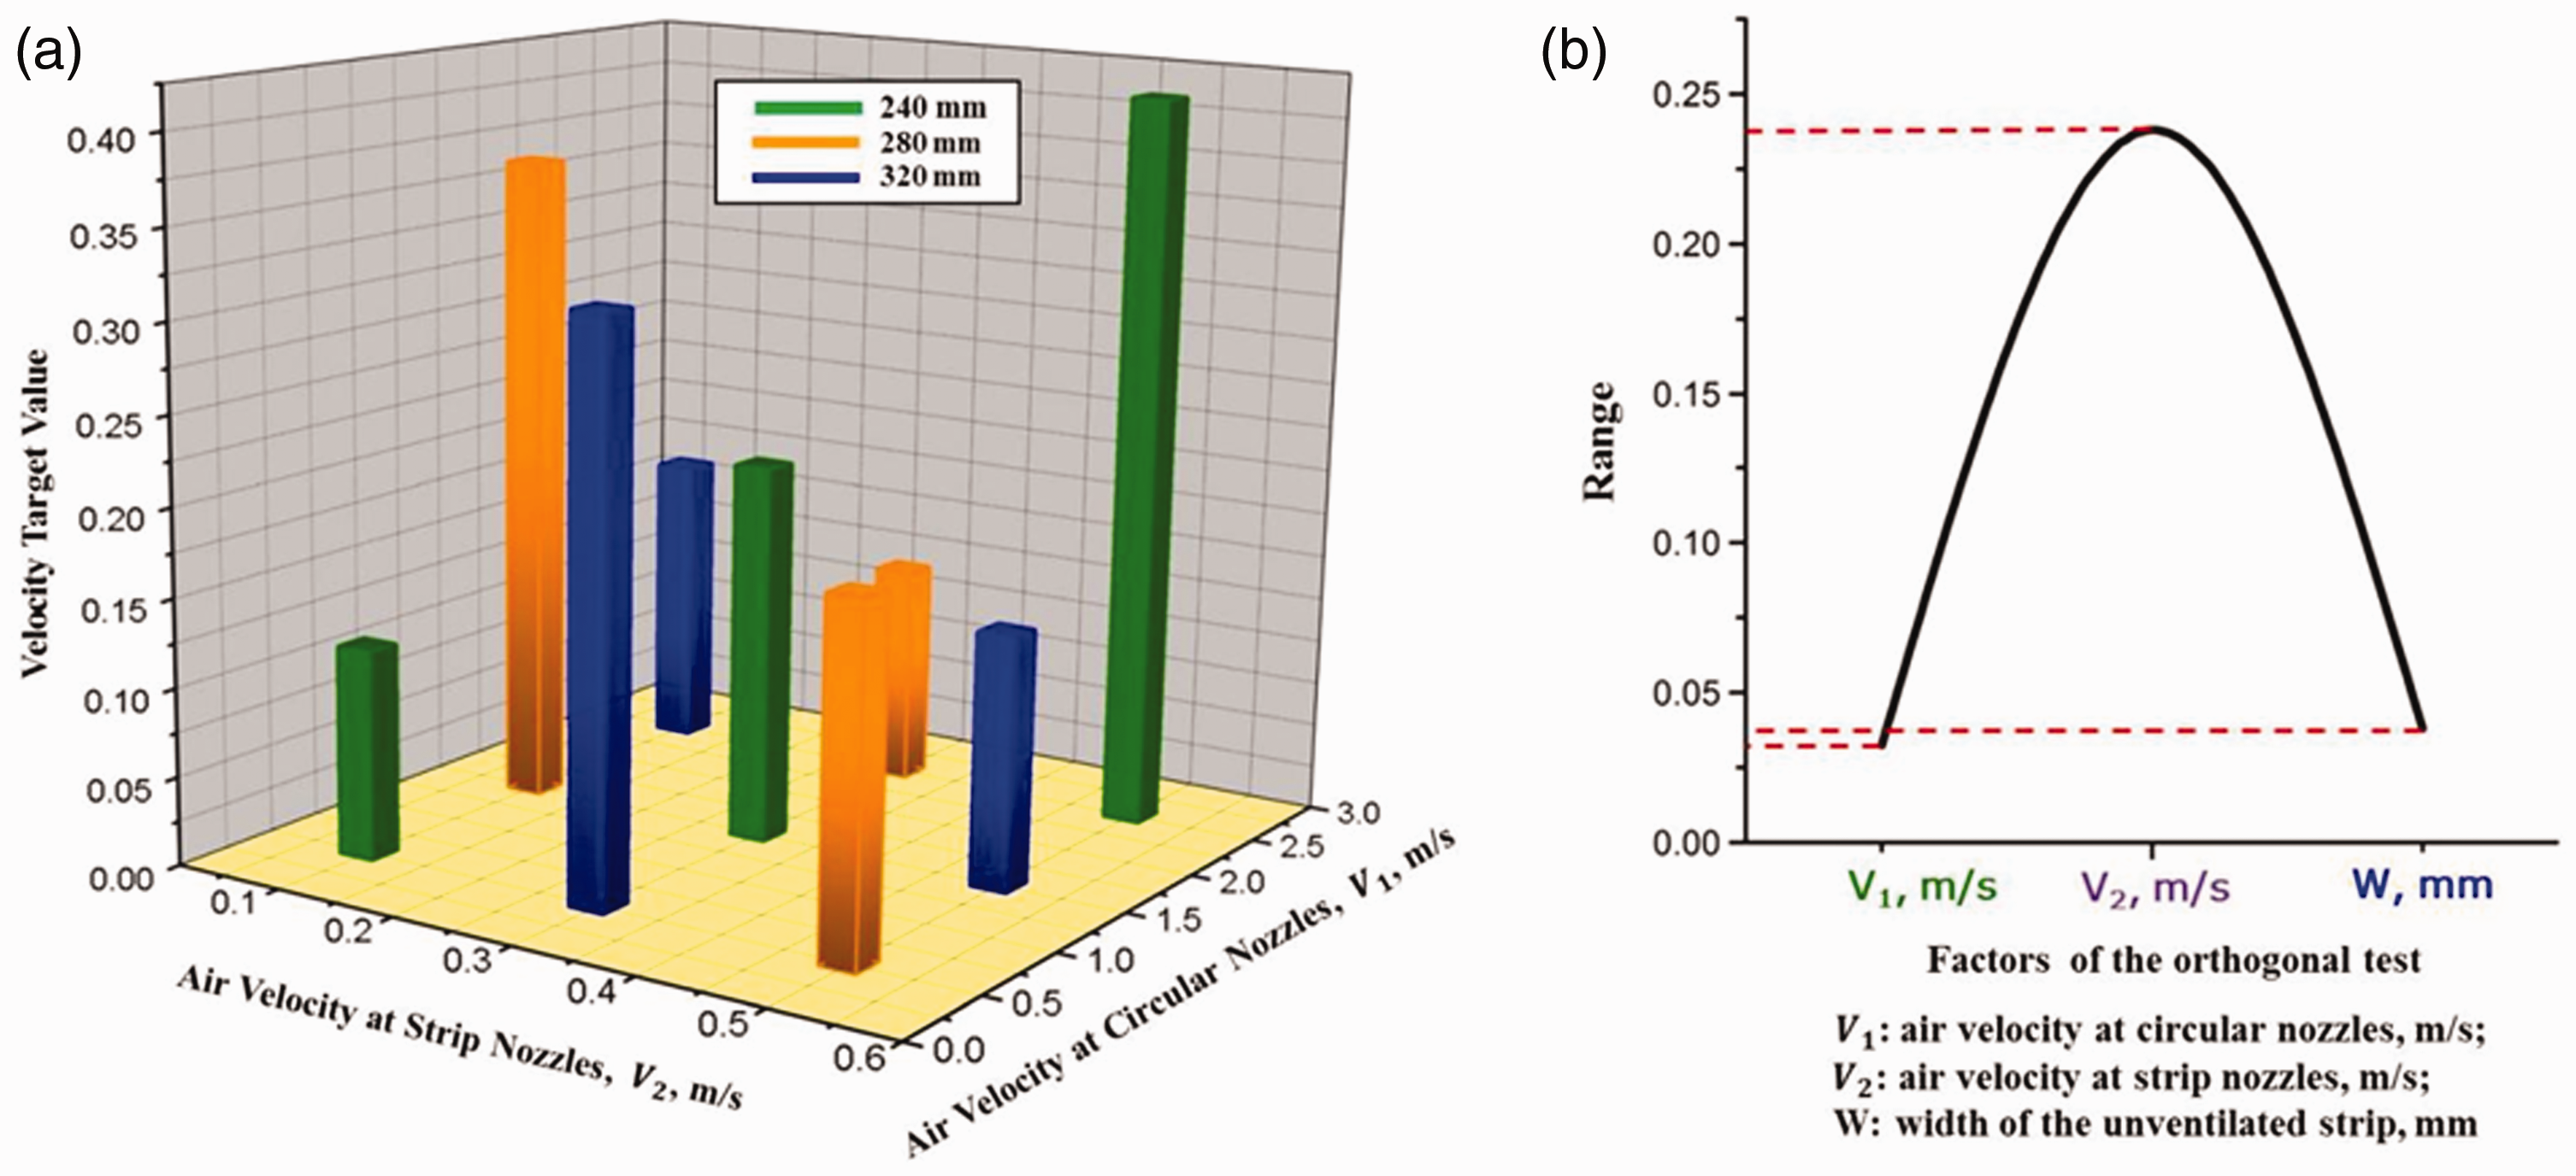
Range analysis of three factors in the orthogonal test with CFD simulations: (a) Velocity target values of different test points; (b) Ranges of three factors.
Parameter refinement results with the k-ε Realizable model.
A range analysis is a statistical method typically used to determine the sensitivity of a factor to the results of the orthogonal test. Rj denotes the difference between the maximum and minimum average values for different factor levels in the j column, and the corresponding computational formula is as follows:

The results of the orthogonal test are presented in Table 3, which shows that each factor has a different impact on the target value index. By comparing the three ranges of each factor in Figure 9(b), the magnitudes of the effects of the factors are as follows: B >C >A. Based on the K value, the optimal factors are ordered as follows: B1, C3, and A1, i.e., V1 = 0.5 m/s, V2 = 0.1 m/s and W = 320.
Further refinement of the parameters
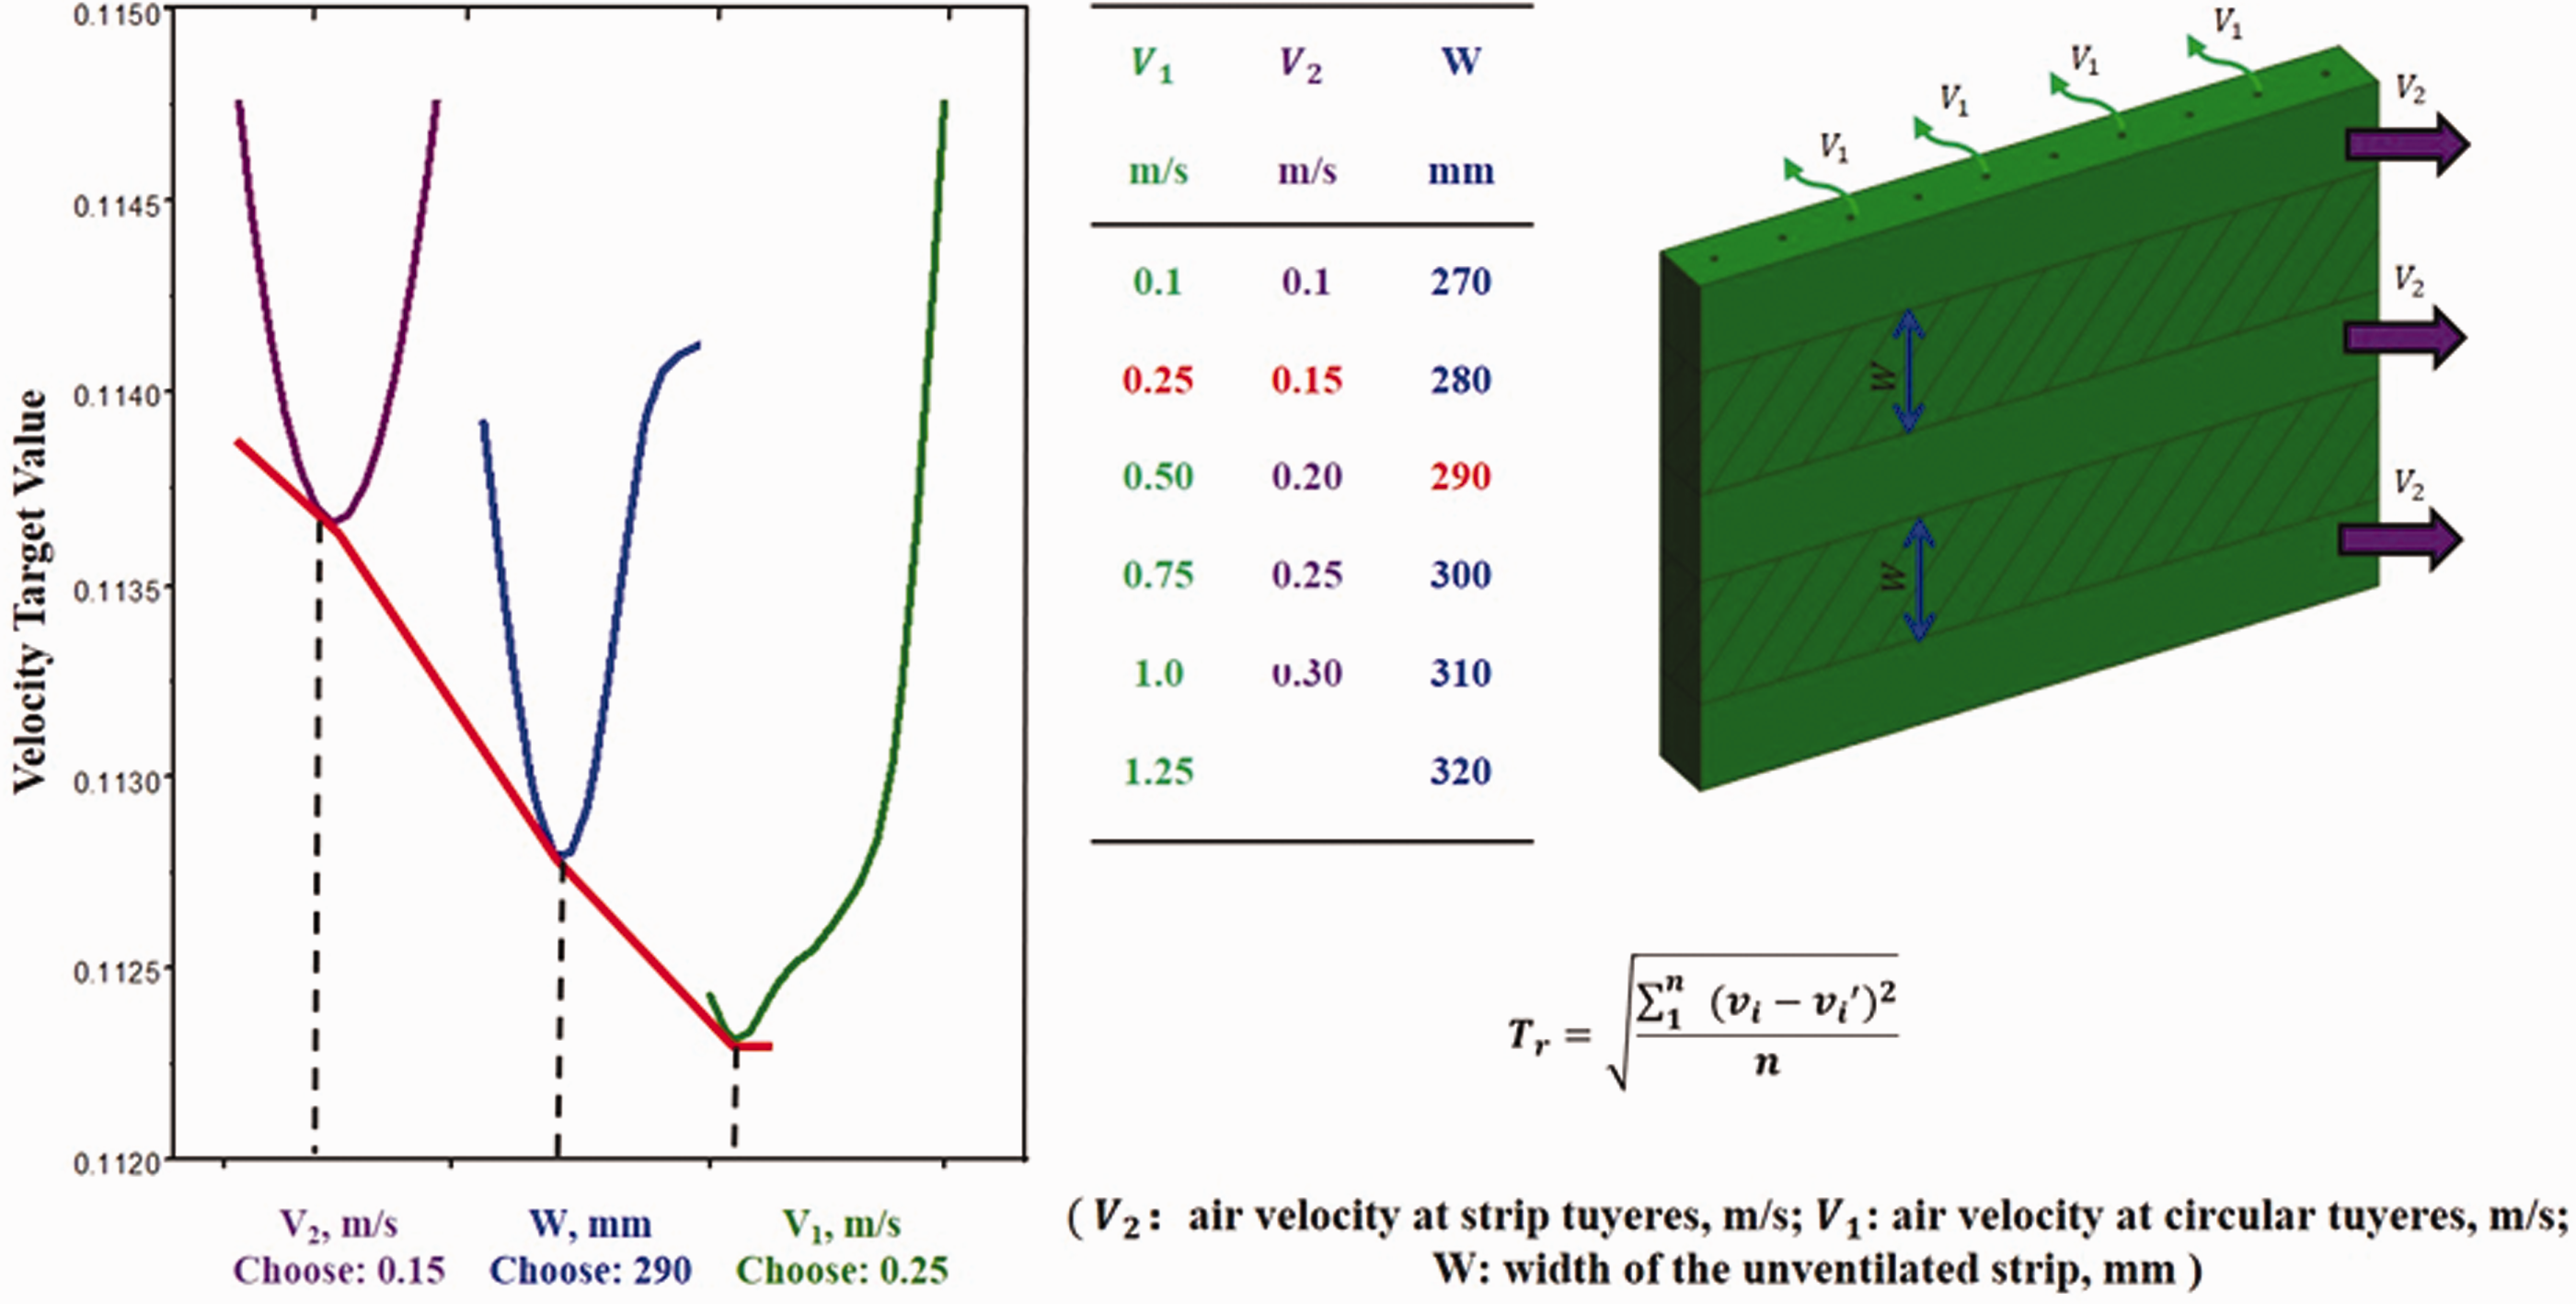
This study has preliminarily obtained an optimal scheme using the orthogonal test. However, significant differences (Figure 9) can be observed among the range values of the different factors, and these differences might be caused by significant variations in the selected levels (Gao et al., 2017; Wu et al., 2018a). To obtain an accurate optimized design, the interval level of each factor should be further narrowed. Thus, the further refinement of the parameters is implemented by using CFD numerical simulations (Gao et al., 2018a, 2018b, 2018c, 2018d).
From the range analysis of the orthogonal test, the air velocity V2 at the strip nozzles has the greatest impact on the velocity target value. The width of the unventilated strip is the factor with the second largest influence on the results. The air velocity V1 at the circular nozzles was then optimized. Finally, accurate optimized parameters of the guardrail-based air supply terminals, i.e., the air velocity (V1) at the circular nozzles is 0.25 m/s, the width of the unventilated strip (W) is 290 mm, and the air velocity (V2) at the strip nozzles is 0.15 m/s, as shown in Figure 10.
Effect of the implementation of the guardrail-based air supply terminal
To further verify the effectiveness of the guardrail-based air supply terminal, the device was compared with common existing air distribution (upper supply and bottom return, displacement ventilation, and vertical wall jets). A simplified model of 20.0 m × 13.0 m × 9.0 m (L × W × H) railway station was established. Flow field uniformity, velocity target value, air age, flow field effectiveness and temperature target value were mainly considered [41].
Comparison of the velocity fields based on different air distributions
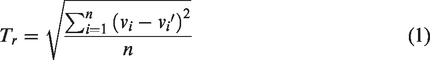
Similar to the optimization of this guardrail-based air supply terminal, the velocities of the three common air distributions were also optimized. When the calculation finished, data obtained from each air distributions were substituted into formula (1) to calculate the velocity target value.
As Figure 11 shows, the optimized upper supply and bottom return (b), displacement ventilation (b), and vertical wall jets still cannot completely cover the human work area, and the non-uniform flow field and high local velocity problems remained. However, the flow field of the guardrail-based air supply terminal was more homogeneous, and the maximum velocity was controlled at 0.3 m/s, thus minimizing the uncomfortable draft sensation.
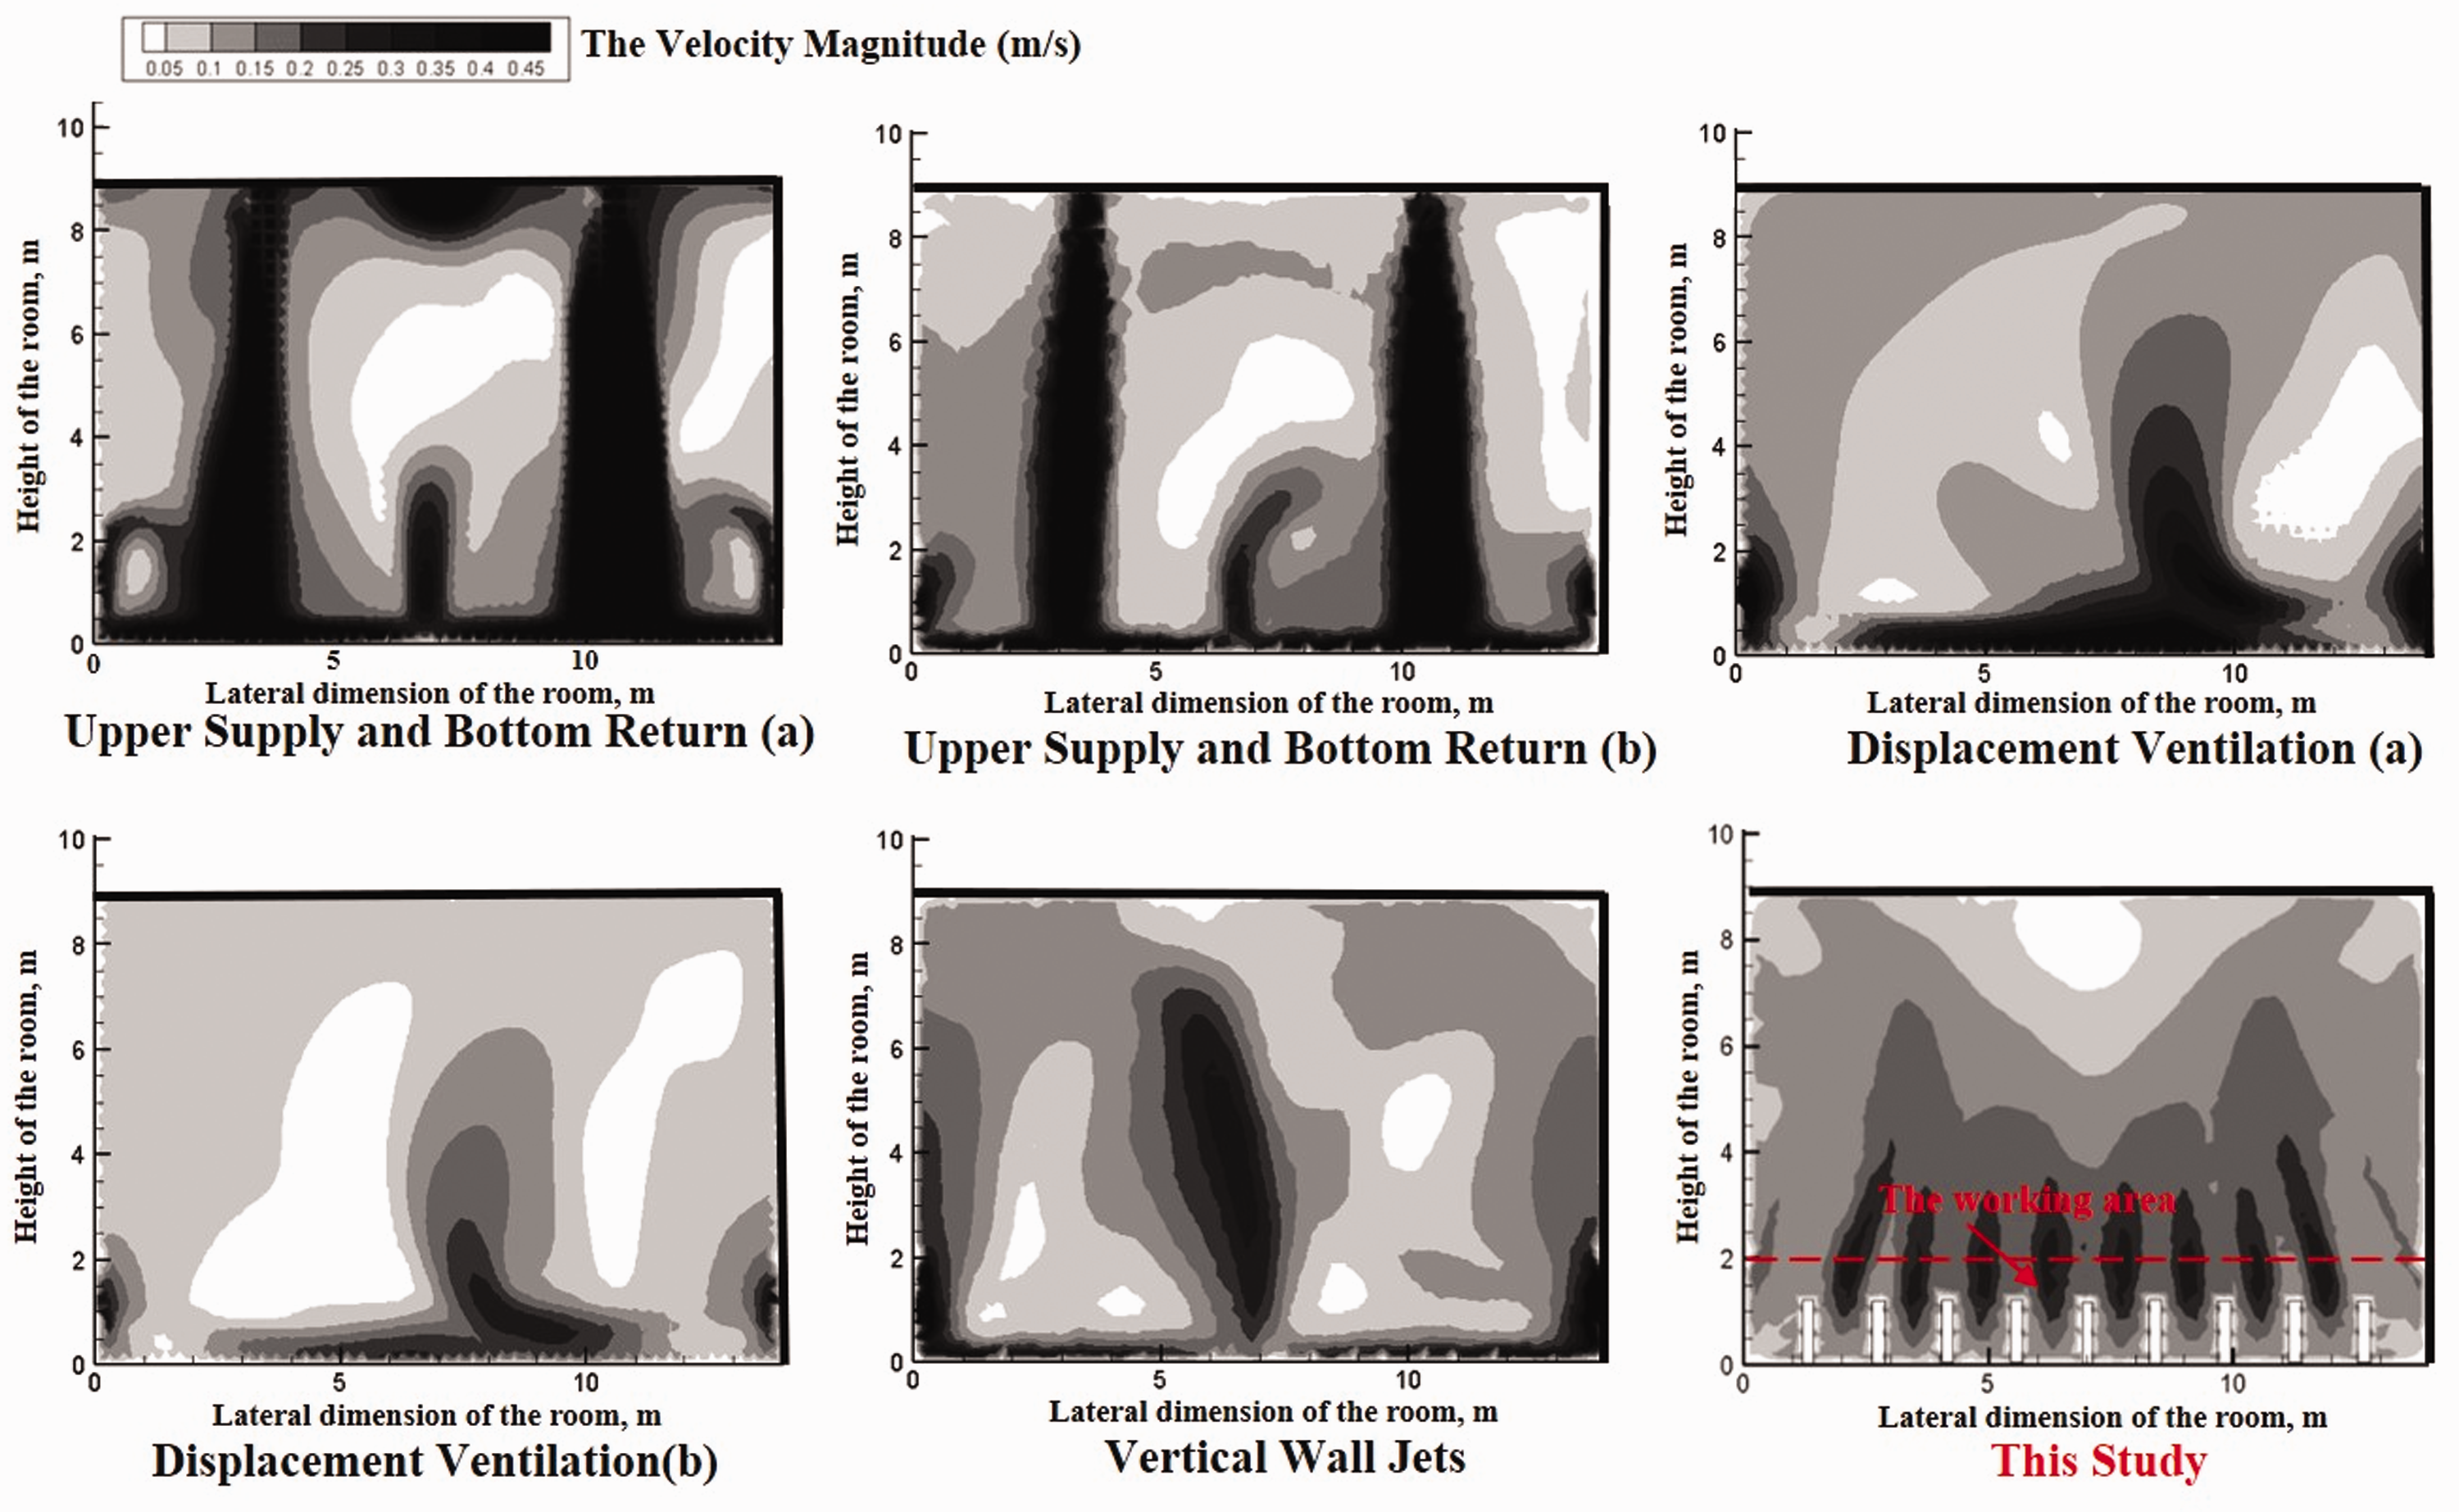
Comparison of the velocity fields of different air distribution based on the k-ε Realizable model at Y = 5.0 m: The velocity field of upper supply and bottom return (a) at a nozzle velocity of 3 m/s; The velocity field of upper supply and bottom return (b) at a nozzle velocity of 2 m/s; The velocity field of displacement ventilation (a) at a nozzle velocity of 2 m/s; The velocity field of displacement ventilation (b) at a nozzle velocity of 1 m/s; The velocity field of vertical wall jets at a nozzle velocity of 1.50 m/s; The velocity field of the guardrail-based air supply terminal at V1 = 0.25 m/s, V2 = 0.15 m/s W = 290 mm.
Figure 12 clearly shows that the velocity target value of the device proposed in this study was the smallest, 33.6% less than that of the vertical wall jets. Moreover, the flow field of the guardrail-based air supply terminal not only completely covered the working zone (below 2 m in the room) but also has the potential for further energy conservation.
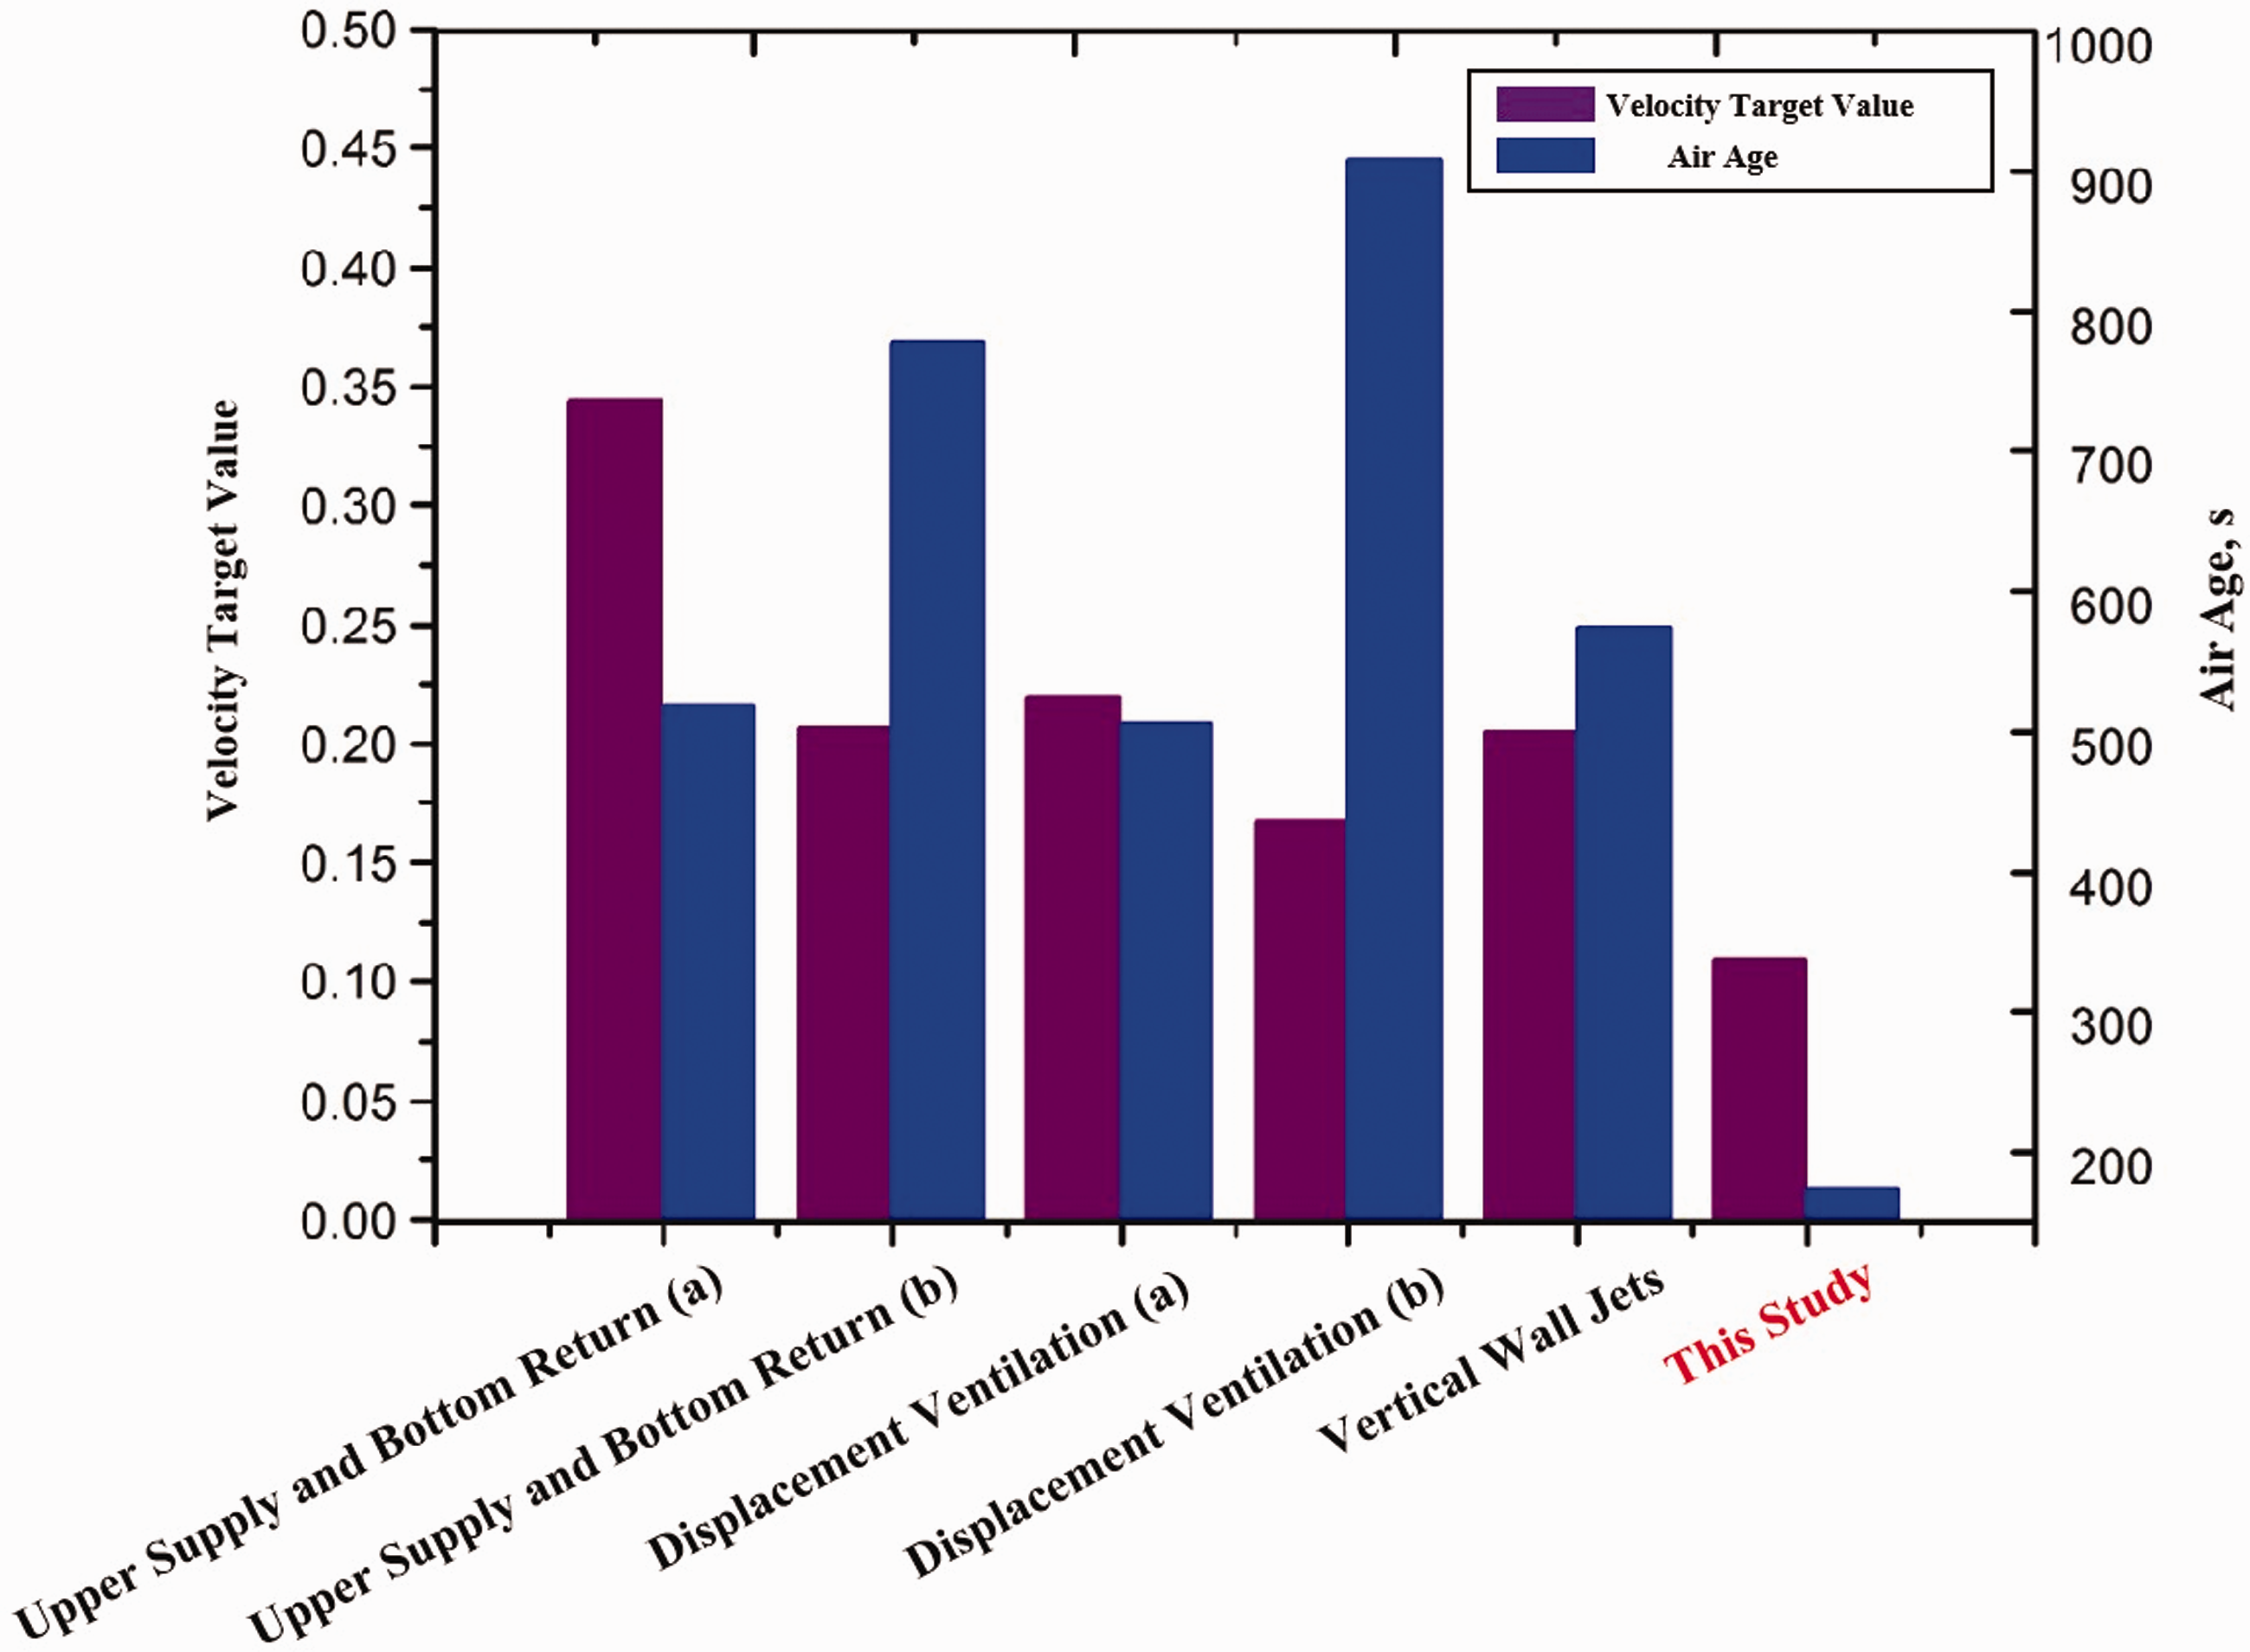
Comparison of the velocity target values and air ages of different air distributions based on the k-ε Realizable model.
In addition, the air ages of different air distributions are presented in Figure 12. The results reveal that the indoor air in the common existing air distribution (upper supply and bottom return, displacement ventilation, and vertical wall jets) remained in the bus stations longer (more than 500 s), thus indicating a poor air quality for the passengers. The corresponding time for the guardrail-based air supply terminal was less than 200 s. This result can be partially attributed to the efficient air supply, which ensured that aged air was vented from the platform within an appropriate time.
Comparison of different air distributions for the temperature field
To further verify the effectiveness of the guardrail-based air supply terminal on the temperature field, we compared the cooling effects of different air distributions in the high space under the same outdoor meteorological conditions.
Considering the high summer temperatures, to create a comfortable indoor environment, based on the optimized velocity, this study additionally optimized the temperature fields of these four air distributions. As shown in Figure 13, compared with the three traditional air distributions, the guardrail-based air supply terminal can generate a cool working zone with a higher temperature. Moreover, the cooler air remains in the lower space of the building, whereas hot air remains in the upper space.
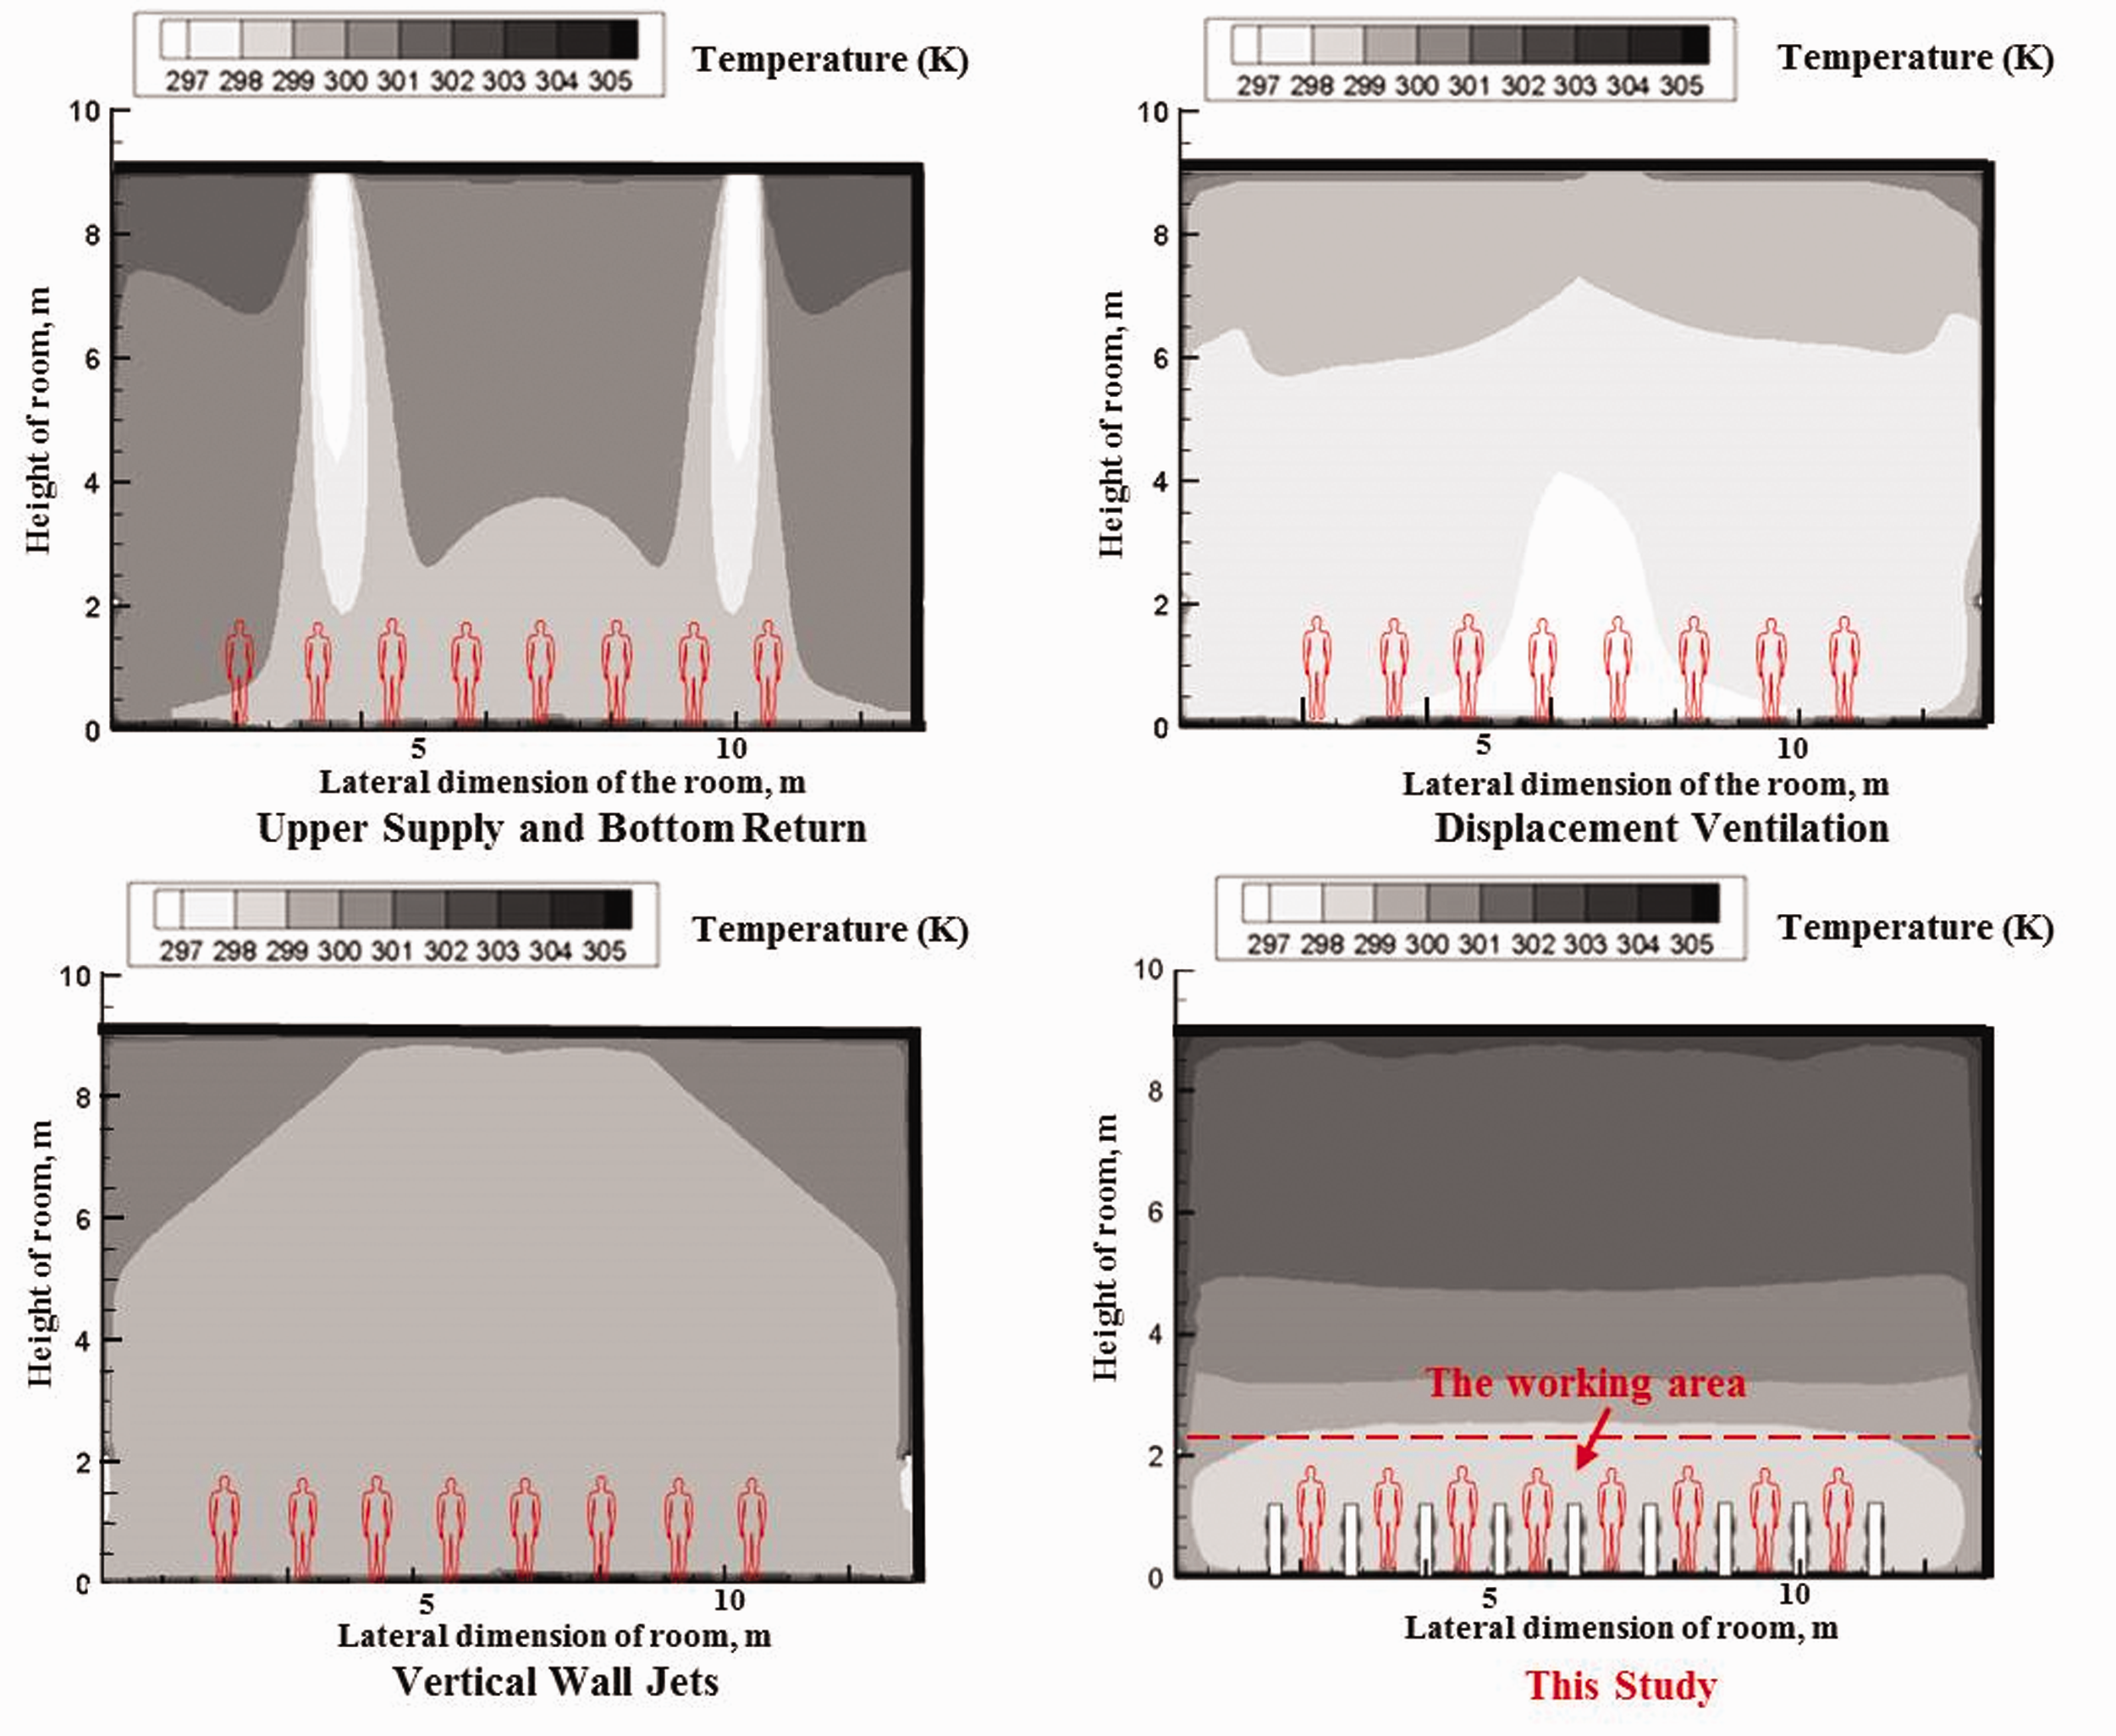
Comparison of the temperature fields of different air distributions with the k-ε Realizable model at Y = 5.0 m based on the optimal velocity field: The temperature field of upper supply and bottom return at 22°C supply air temperature; The temperature field of displacement ventilation at 23°C supply air temperature; The temperature field of vertical wall jets at 23°C supply air temperature; The temperature field of the guardrail-based air supply terminal at 25°C supply air temperature.
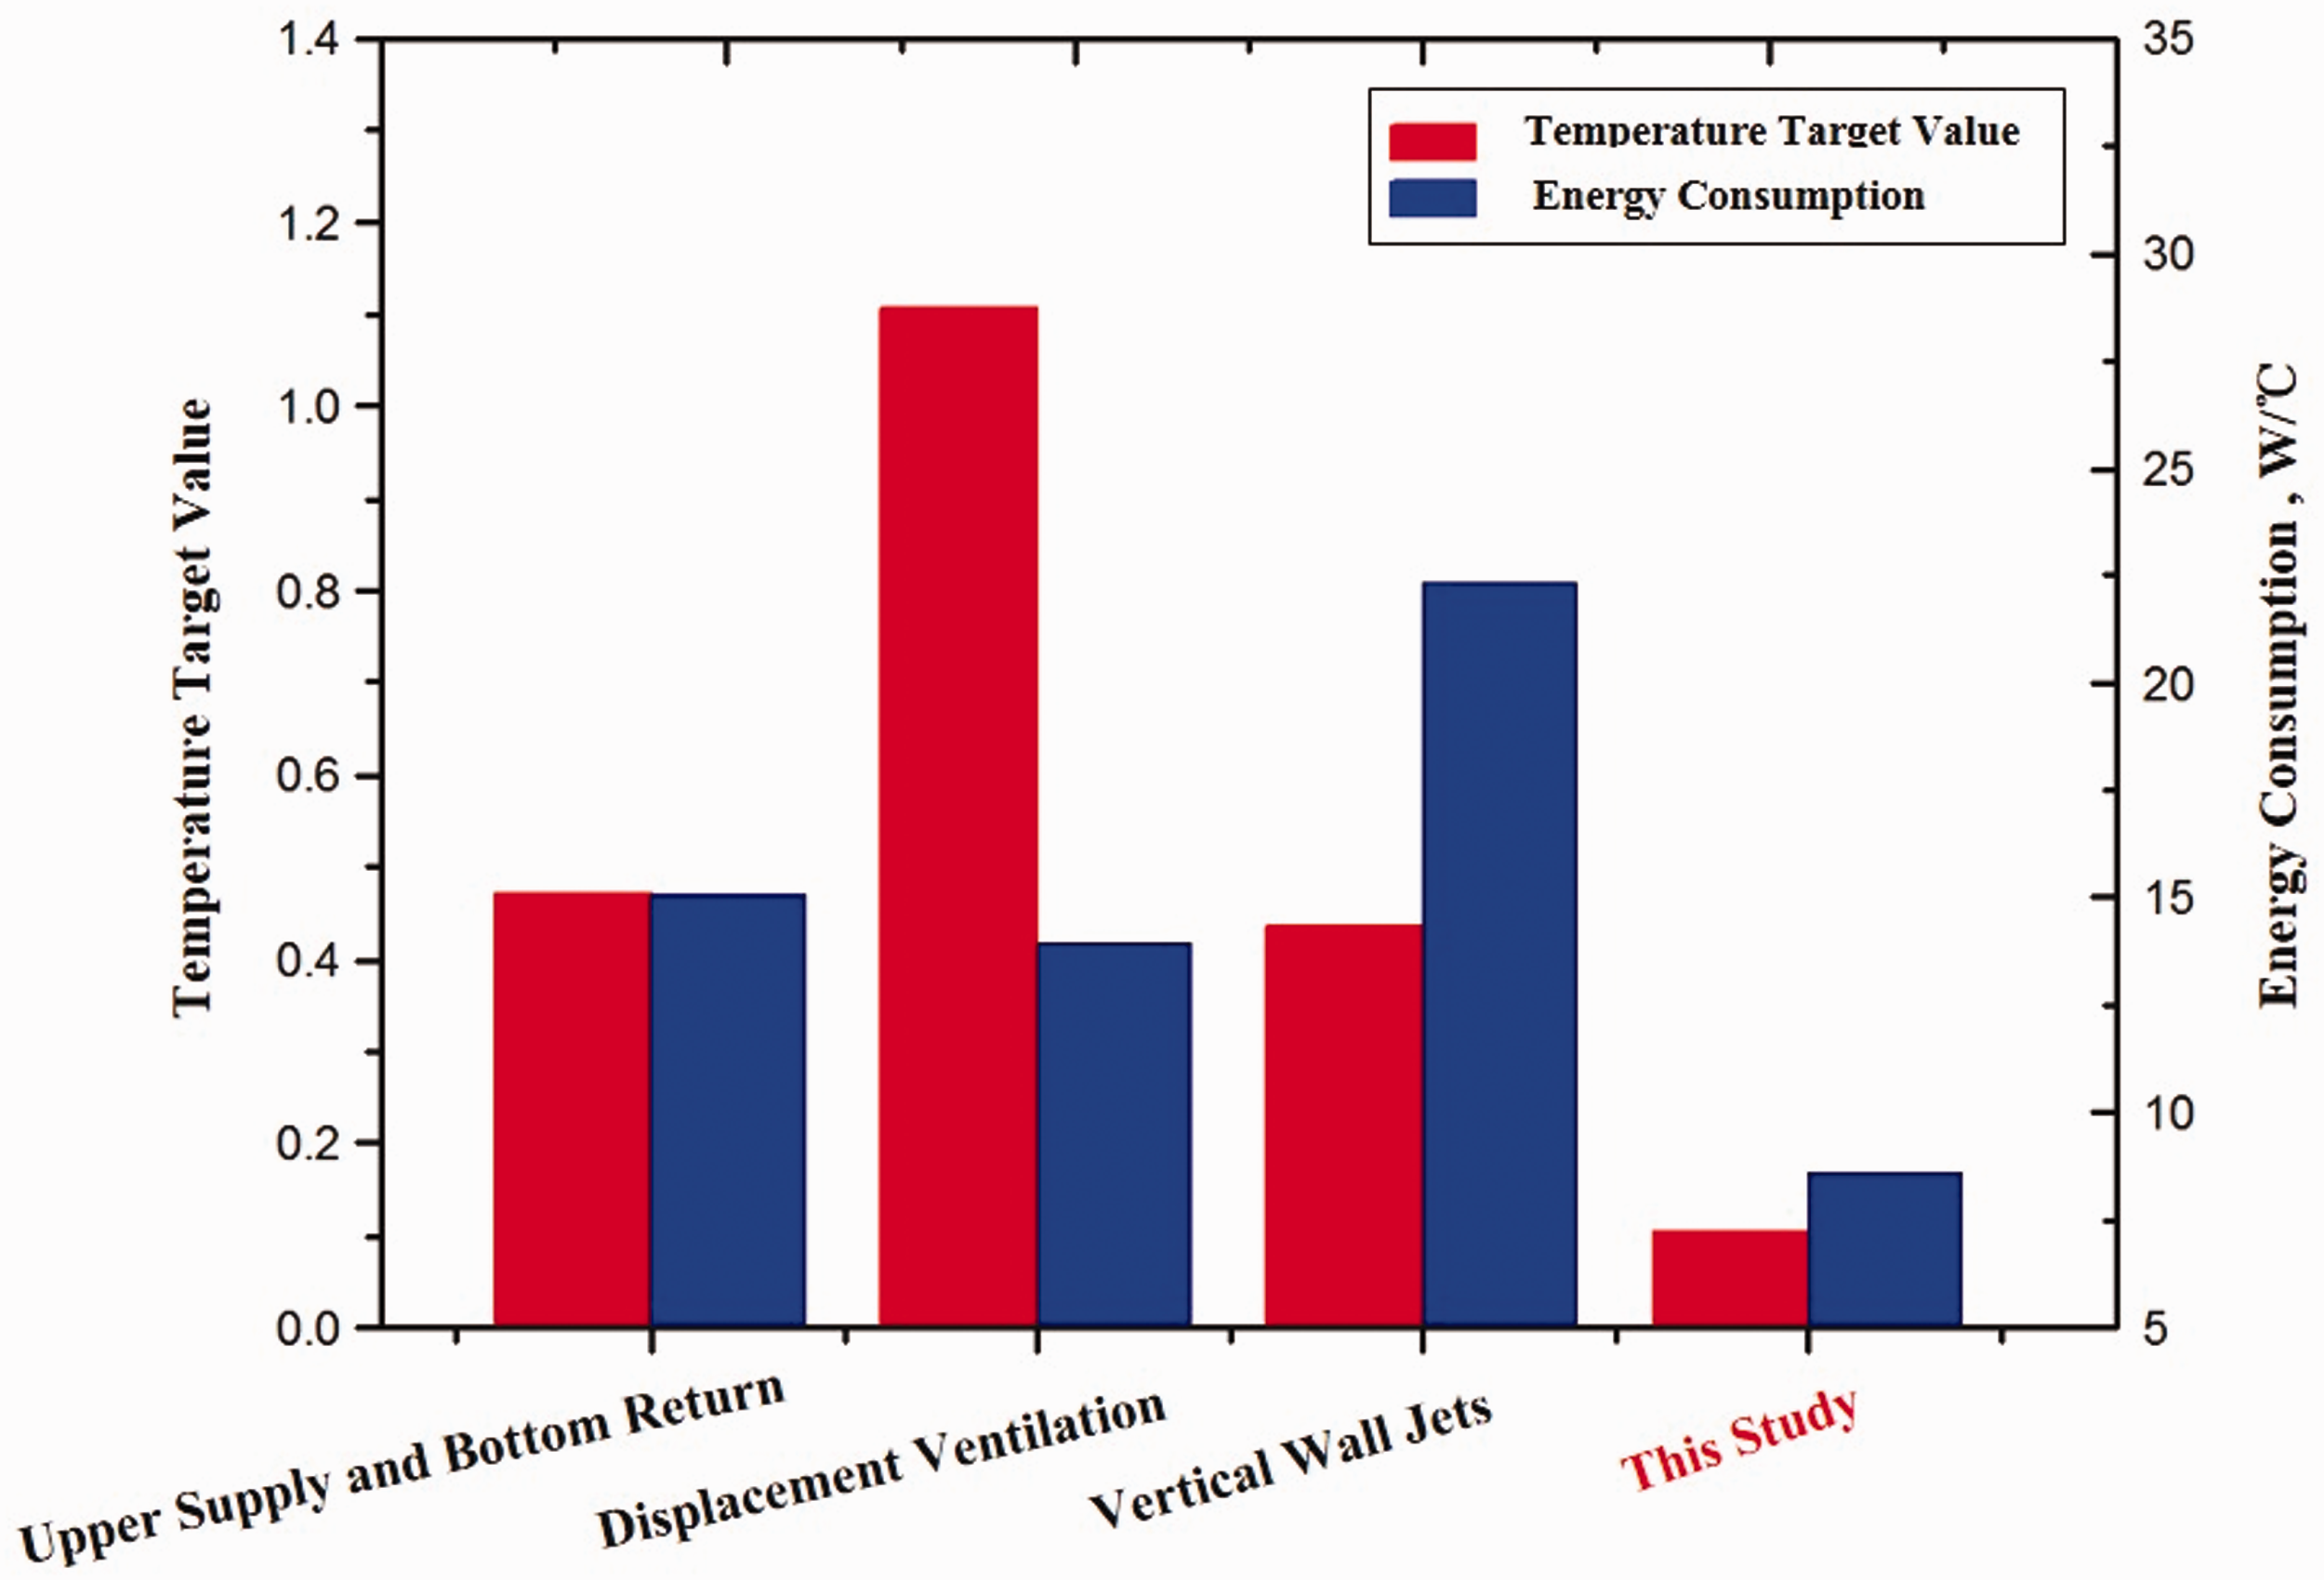
Finally, the data obtained from each air distributions were substituted into formula (2) to calculate the corresponding temperature target values. In addition, the energy consumption levels of the 4 types of air distributions were calculated from formula (6) [41]. The formula for calculating the energy consumption is as follows:

The temperature target values and energy consumptions of the different air distributions are presented in Figure 14. Clearly, the temperature target value of the device proposed in this study was the smallest, and the energy consumption was 61% less than that for vertical wall jets, indicating that the guardrail-based ventilation scheme can not only meet the thermal comfort requirements of the space but also save energy.
Comparison of the temperature target values and energy consumption levels of different air distributions based on the k-ε Realizable model.
Experimental verification of the guardrail-based air supply terminal
To verify the effectiveness of the guardrail-based air supply terminal, based on the final results of the optimization, the width of the unventilated strip and the air velocity at the circle nozzles and strip nozzles were defined, and the velocity field of the guardrail-based air supply terminal was analyzed in a visualization experiment and a full-scale experiment.
Figure 15 clearly shows that the supplied air generated by the optimized guardrail-based air supply terminal can cover the human working area (including at the head, chest, abdomen and thigh heights), and achieve a satisfactory air supply. Figure 13 shows the measured velocity field of the guardrail-based air supply terminal device in the experiment. It founds that the air velocity at the head is about 0.15 m/s, which effectively avoided the draft sensations. The maximum error of the air velocity is about 2%. The simulated and experimental values of the velocities at each point were consistent inside and outside the flow field. These results indicate that the guardrail-based air supply terminal has a high air supply efficiency, as shown in Figure 16.
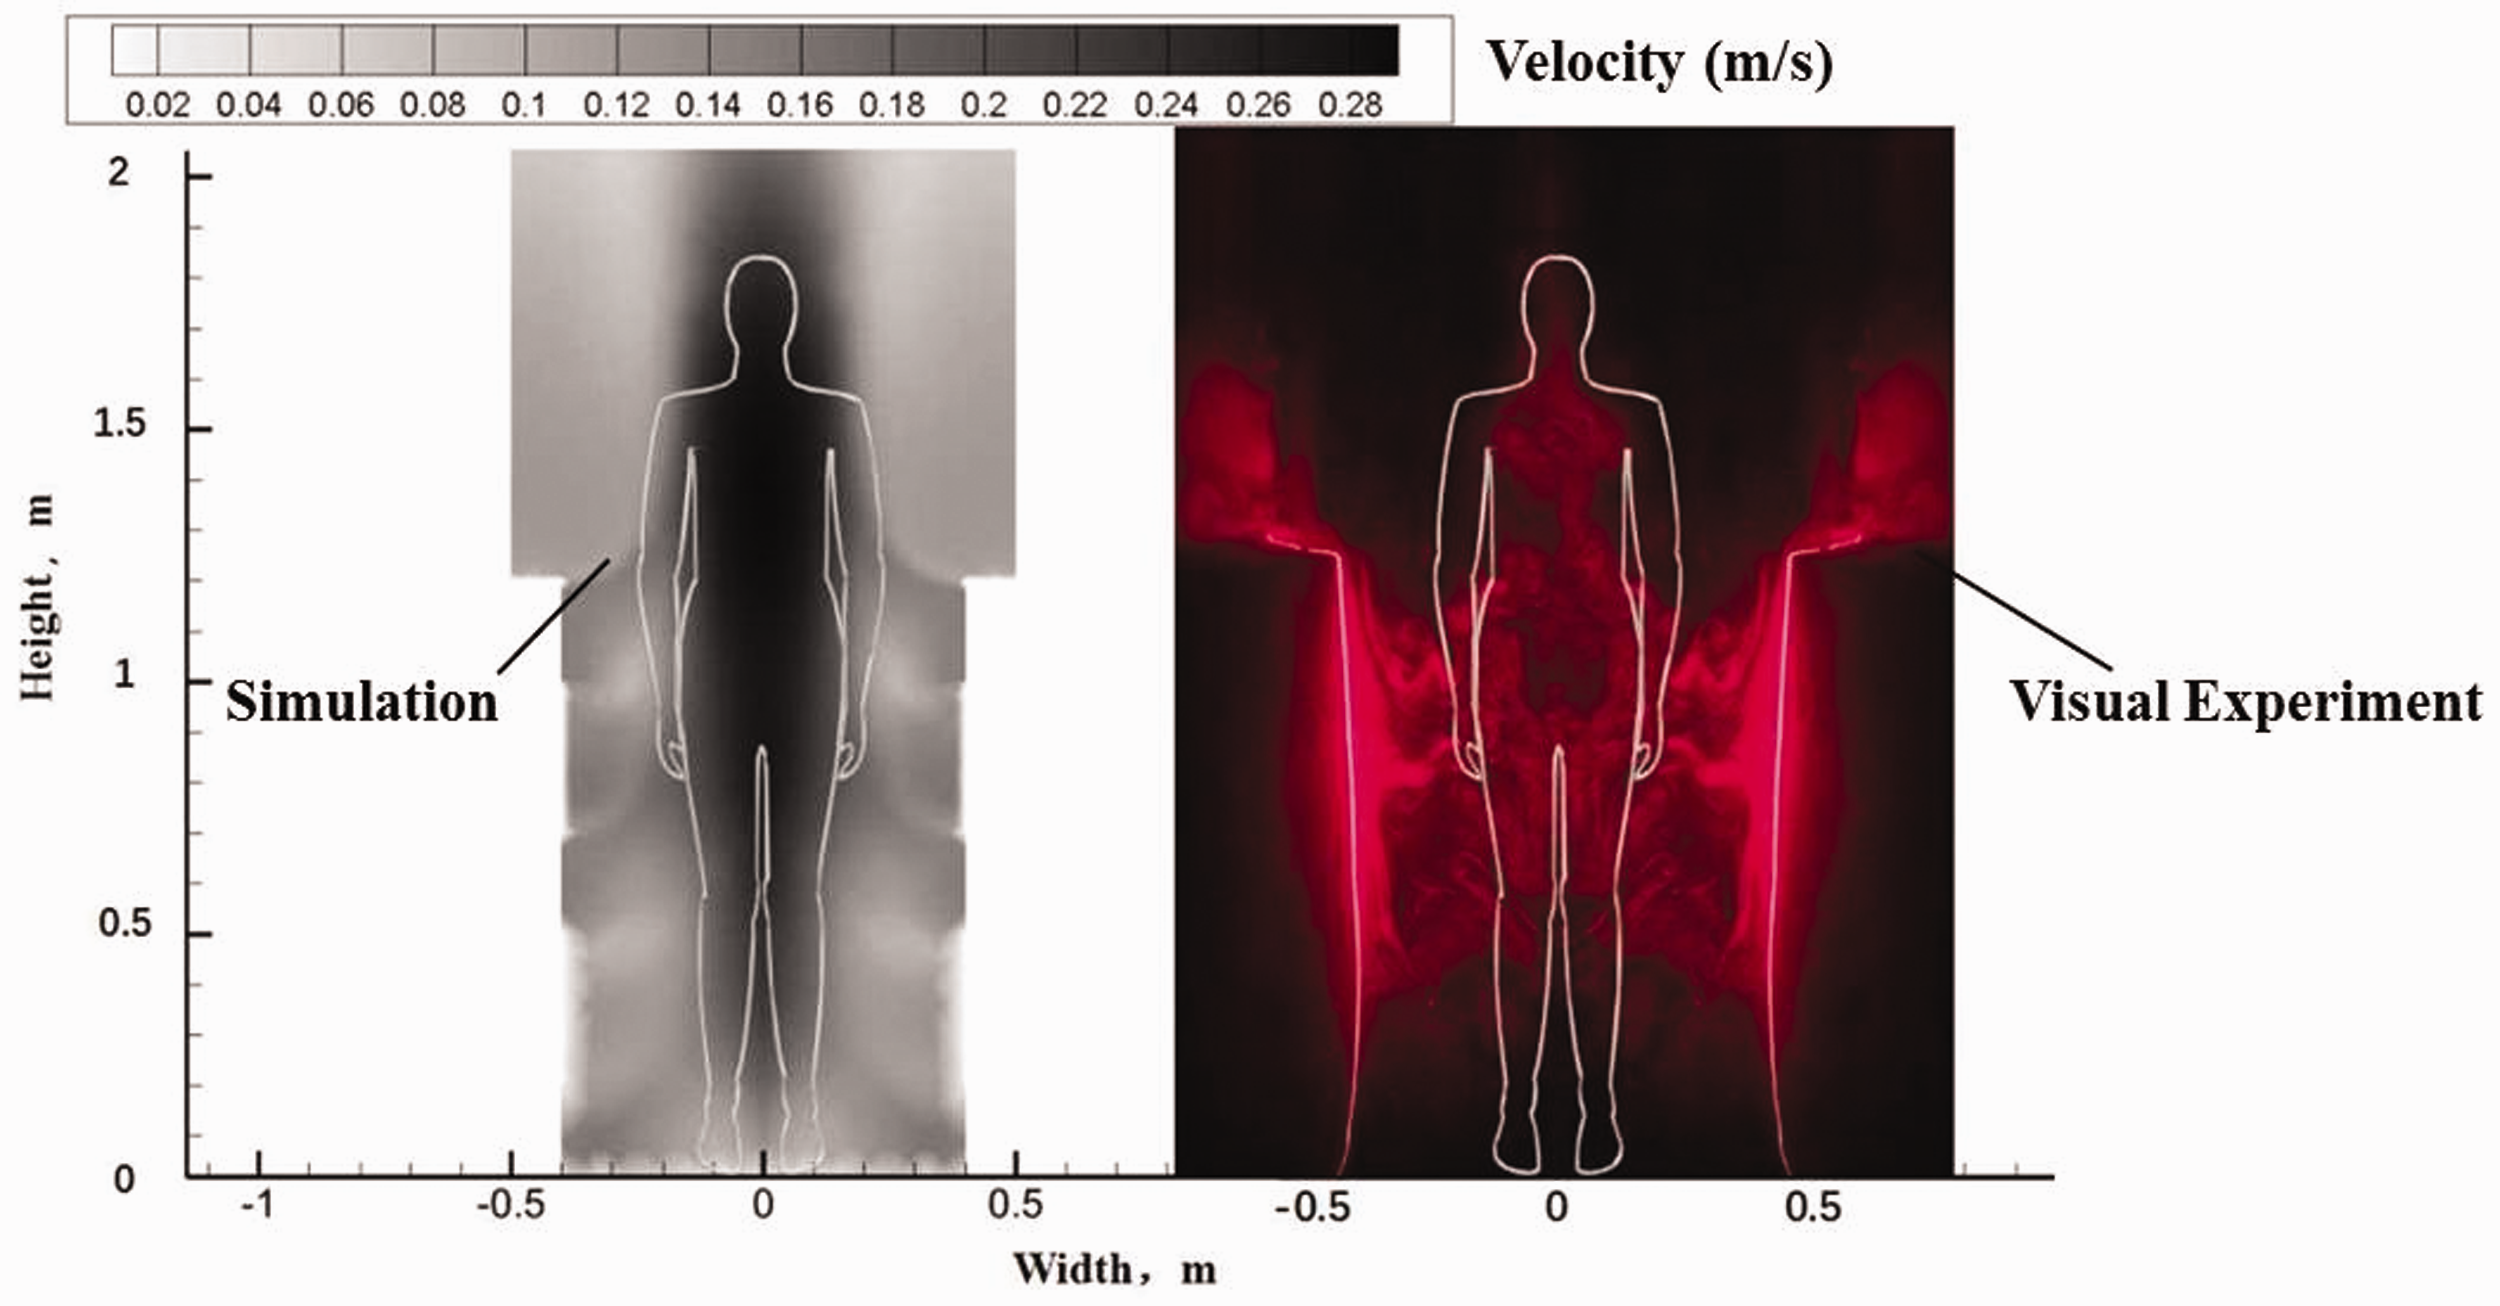
Comparison of the results of a visual experiment and simulations at X = 0.2 m.
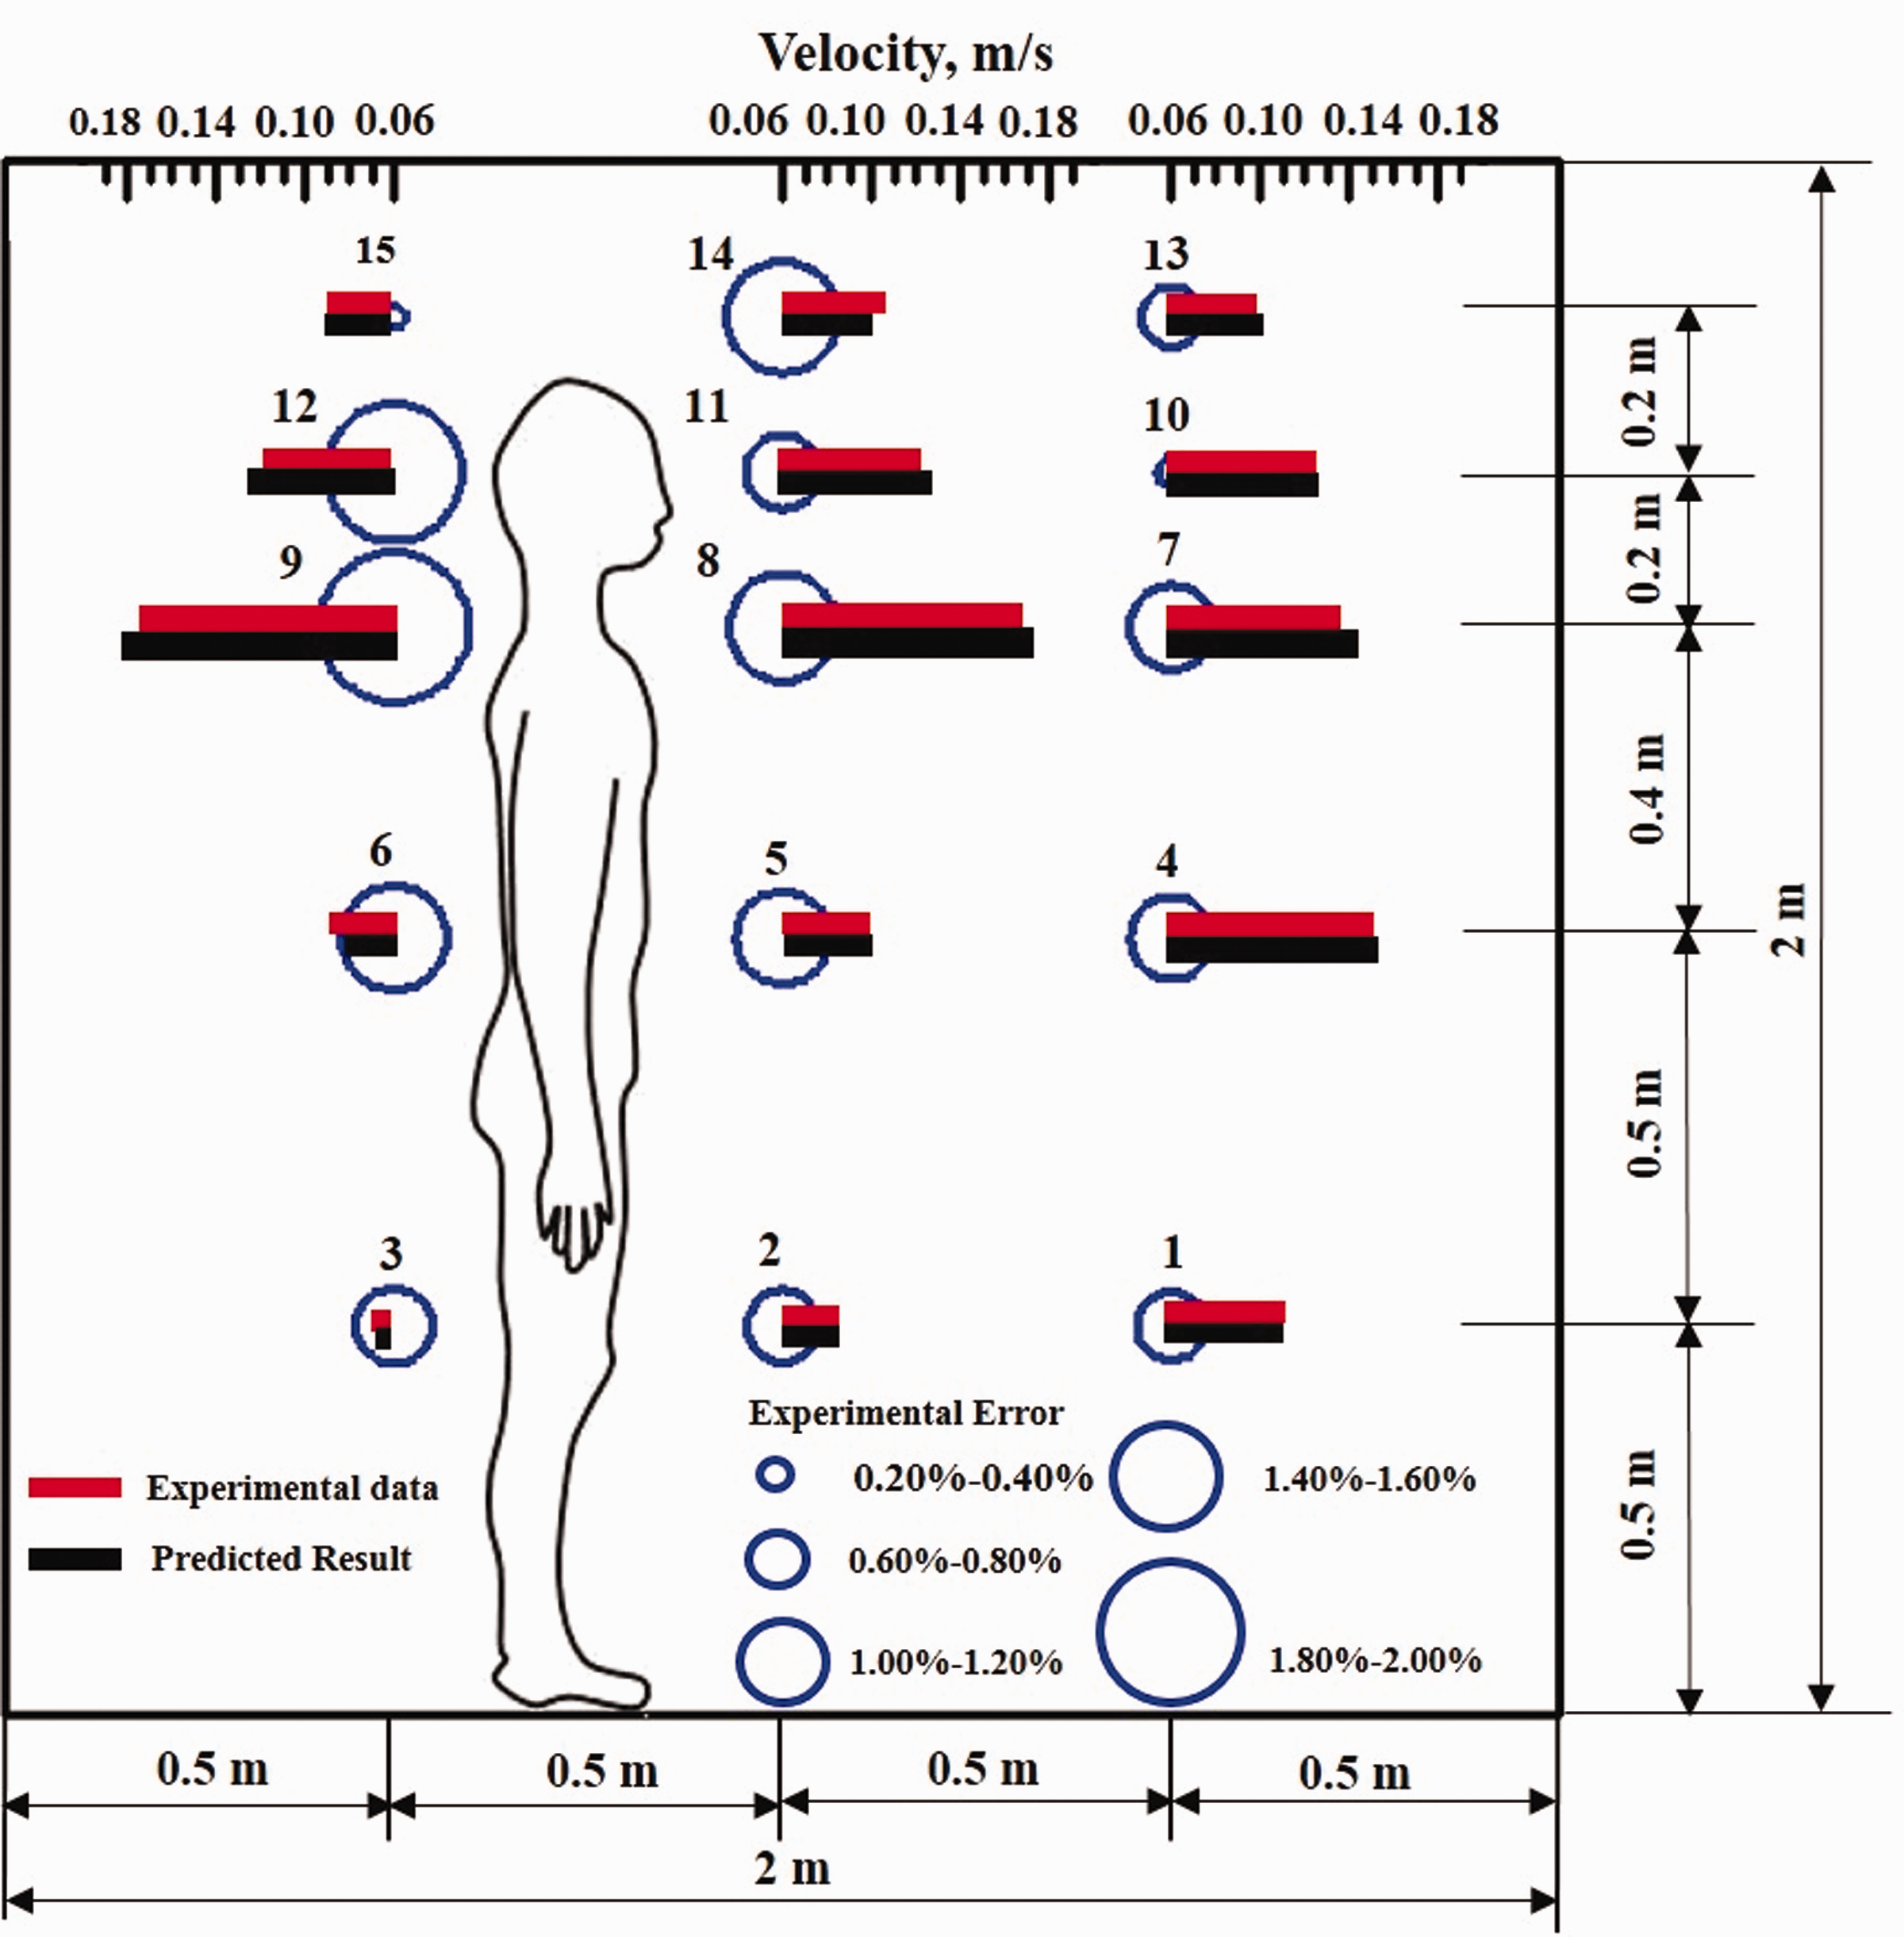
Experimental verification of the predicted velocity field based on the k-ε Realizable model at X = 0.2 m, Z = 0.5, 1.0, 1.4, 1.6, 1.8 m.
Conclusions
This study was inspired by observing the distribution of passenger flows in densely populated areas with guardrails and air supply terminals. This paper used the velocity target value and temperature target value to evaluate the effect of a proposed guardrail-based air supply terminal. The primary conclusions based on the study results are as follows.
This study proposed a guardrail-based air supply terminal device that integrates guardrails and air terminals, thus reducing the initial investment. This device only regulates the air in the lower part of a building, and it directly supplies treated air to working areas (below 2 m), providing stratified ventilation, displacement ventilation and personalized ventilation.
The optimal values of the air velocity at the circular nozzles, the penetration air velocity at the strip nozzles, and the width of the unventilated strip (V1 = 0.25 m/s, V2 = 0.15 m/s, and 290 mm, respectively) were obtained using an orthogonal test and further parameter refinement. Next, the ventilation effectiveness of these optimized nozzles was verified by a full-scale experiment and visualization experiments.
The guardrail-based air supply terminal device controlled the maximum velocity at 0.3 m/s, thus effectively avoiding draft sensations. In addition, the temperature of the working area was maintained at 26°C in the summer, creating a comfortable environment. Compared with other air distribution modes in high and large spaces, the air age of the guardrail-based air supply terminal was the smallest (less than 200 s), which indicated that aged air was vented out of the platform in an appropriate time. In addition, the velocity target value and temperature target value of the proposed air supply terminal were the smallest among all of the studied systems, and the energy consumption of the guardrail-based air supply terminal was 61% less than that of the vertical wall jets, indicating that the guardrail-based air supply terminal not only meets the relevant thermal comfort requirements but also saves energy.
Footnotes
Declaration of conflicting interests
The author(s) declared no potential conflicts of interest with respect to the research, authorship, and/or publication of this article.
Funding
The author(s) disclosed receipt of the following financial support for the research, authorship, and/or publication of this article: This research project was sponsored by the Opening Funds of State Key Laboratory of Building Safety and Built Environment and National Engineering Research Center of Building Technology (GrantNo.BSBE2019-08), the National Key R&D Program of China (Grant No. 2017YFC0702800), the National Natural Science Foundation of China (Grant no. 51878533, 51508442),and the Youth Support Program of Shaanxi Association for Science & Technology (Grant no. 20170515).