
Abstract
This work compares the efficiency of historically used Weibull parameters estimation methods with newly developed method. Newly developed method has been termed as Combined Linearized Moment Method (CLMM). Five-year wind data at five locations namely Chaghi, Lehri, Badin, Hyderabad and Nankana Sahib (Pakistan) was used for the calculation of Weibull parameters. Efficiency was assessed and compared using R-Squared(R2), MSE, RMSE, wind error (WE), MAPE and Chi-test (
Keywords
Introduction
Weibull probability density function (PDF) is used in various fields to model different phenomena like water level prediction, estimation of rainfall, lifetime analysis of material strength, hydrology, reliability, material and structures failure prediction, solar resource assessment and wind resource assessment (WRA) (Sumair et al., 2020e; Teimouri et al., 2013). Even today, this distribution has been introduced in Wind Atlas Analysis and Application Program (WAsP) for the estimation of wind power potential (Carta et al., 2009; Werapun et al., 2015).
In WRA, it is not only the mean wind speed but also its distribution that affects wind potential (Ramírez and Carta, 2006; Sumair et al., 2020a). Therefore, wind data must be modelled using some statistical frequency distribution. It is the Weibull distribution which is mostly applied to analyze wind statistical characteristics (Sumair et al., 2020g). (Bahrami et al., 2019a) assessed wind potential and wind energy harvesting opportunity at 18 locations in Turkmenistan. Hourly recorded wind data for these sites was used with two-parameter Weibull distribution. Similarly, wind resource estimation at seventeen locations in Uzbekistan was performed (Bahrami et al., 2019b) using two-parameter Weibull distribution. Furthermore, this distribution was used to determine wind potential at Izmir (Ozay and Celiktas, 2016). Many other researchers also made use of Weibull distribution for WRA, as presented in (Akdağ and Dinler, 2009; Shami et al., 2016; Shoaib et al., 2017; 2019; Sumair et al., 2020b, 2020d, 2020f, 2020g).
The efficiency of estimation methods used for Weibull parameters estimation (shape and scale) decides the efficiency of Weibull distribution (Sumair et al., 2020e); many such methods have been given in literature (Andrade et al., 2014; Dorvlo, 2002; Khalid Saeed et al., 2019; Saleh et al., 2012). A comparison of four statistical methods with WAsP algorithm was conducted using wind data collected over five years period and at different heights. Results showed that at all heights, scale parameter is found to be proportional to wind speed with proportionality constant varying from location to location (Bagiorgas et al., 2011).
Another work (Ahmed, 2013) compared Maximum Likelihood Method (MLM), Graphical Method (GM), Empirical Method of Justus (EMJ) and Power Density Method (PDM) using four-years monthly data at a representative site in Iraq. RMSE and R-squared were used to compare these methods and it was found that MLM and PDM were suitable for the estimation of shape and scale parameters.
Wind potential at Zarrineh (Iran) was estimated using Weibull distribution along with the comparison of two methods i.e. EMJ and PDM (Mohammadi and Mostafaeipour, 2013). Six-year wind data was collected at 10 m height and mean wind speed at the investigated location was found to be 4.07 m/s. Comparison showed that PDM is more accurate than EMJ and the site was found suitable for small scale wind energy applications. Similarly, (Cook, 2001) compared traditional methods i.e. EMJ and GM with modern methods i.e. MLM and Modified Maximum Likelihood Method (MMLM) and it was found that MLM and MMLM give better estimation than traditional methods while traditional methods were found to underestimate Weibull parameters.
As it has been found that various methods available for Weibull parameters estimation give different accuracies; GM and EMJ methods giving poor performance while PDM, MLM and MMLM giving good performance. The novelty of this work is to develop a new method which has been termed as Combined Linearized Moment Method (CLMM) along with comparing it with seven traditional methods available in literature. Sample data used for the calculation of Weibull parameters is five years (2014–2018) wind data at a hub height of 50 m at five locations i.e. Chaghi, Lehri, Badin, Hyderabad and Nankana Sahib (Pakistan)
Materials and methods
Sites description
Five sites, as shown in Figure 1, have been studied to verify the validity of new method. Chaghi (28.9804° N, 62.4504° E) is characterized as desert area located in the Balochistan province of Pakistan. It is characterized by extreme weather conditions i.e. summers are extremely hot and winters are extremely cold. The average minimum temperature is 2.4 °C in January and the average maximum temperature is 42.5 °C in July. Annual average rainfall is 102 mm and wind blows with an average speed of 6.36 m/s. Hyderabad (25.367°N, 68.367°E) is located in Sindh province of Pakistan on the east bank of the Indus River. Due to the closeness of Indus River, location is characterized by high winds and humid conditions. Summers are unpleasantly humid while, winters are comparatively comfortable, and dry; and it is mostly clear year round. Maximum average temperature is observed as 41.6 °C in May while average lowest temperature is 11.1 °C in January. Average rain per year is observed as 177 mm. Wind blows with an average speed of 6.06 m/s.
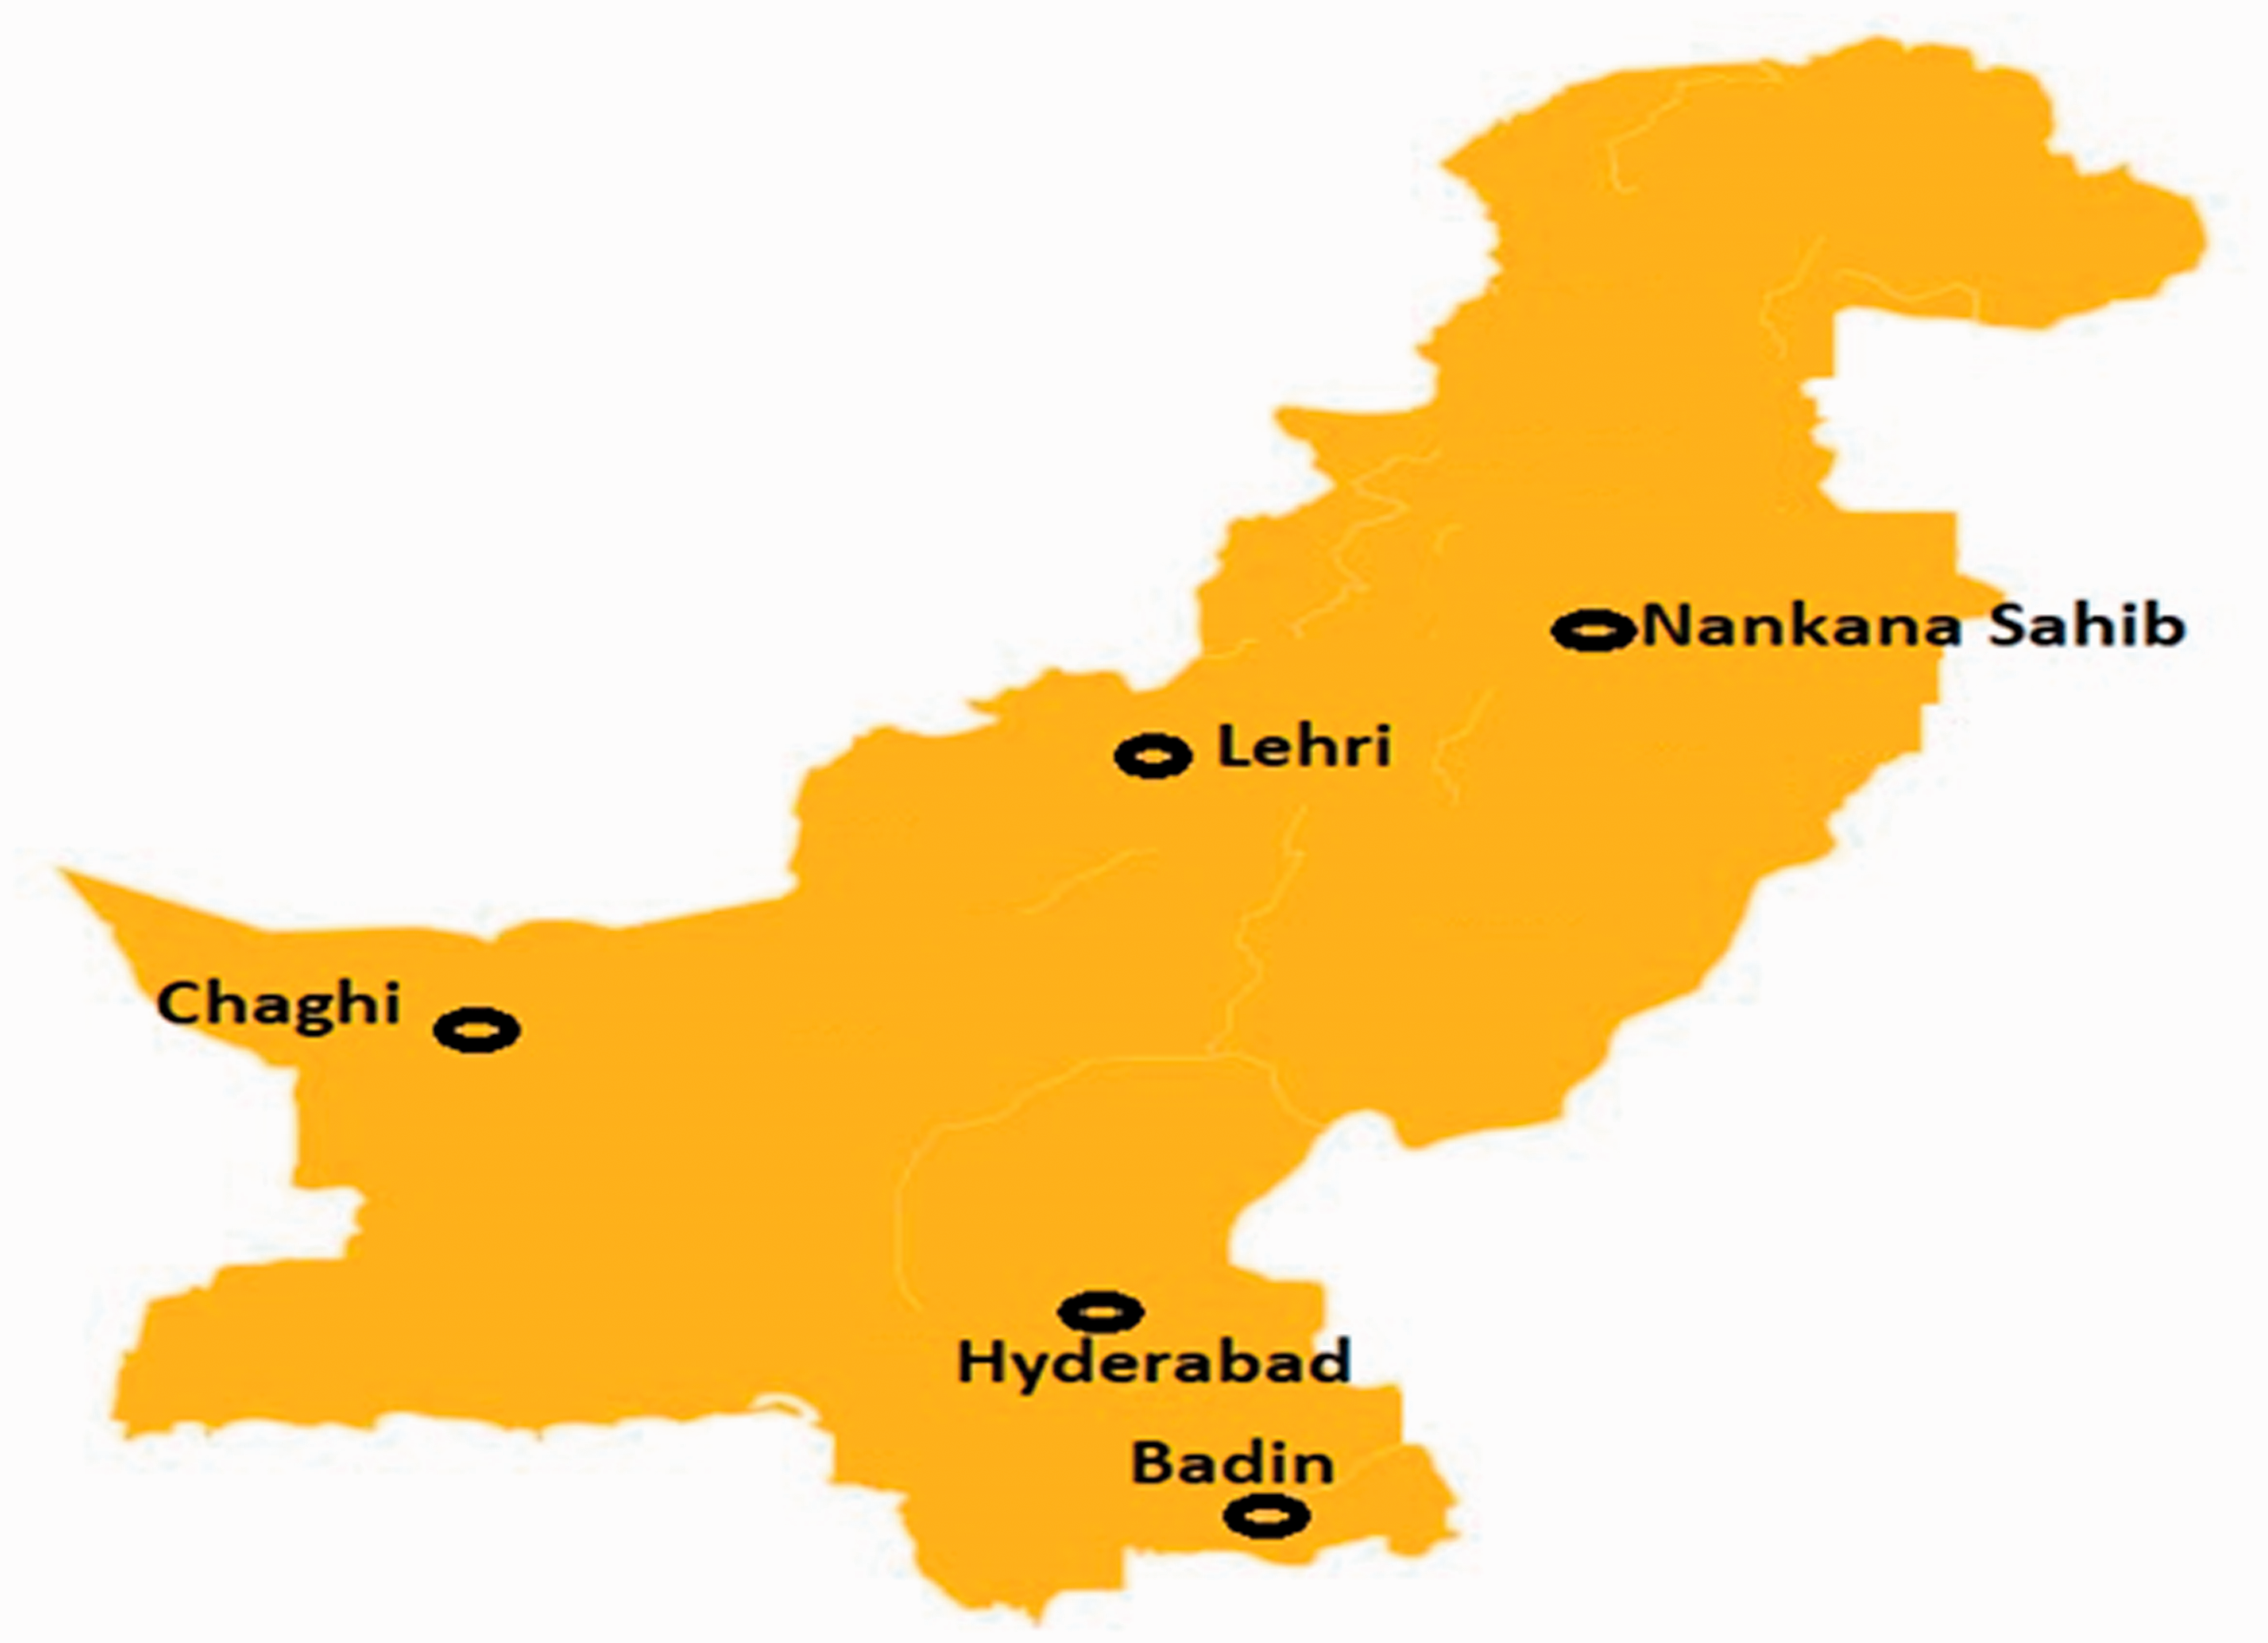
Geographical map of five sites under investigation.
Badin (24.6459° N, 68.8467° E) is also located to the east of the Indus River near Hyderabad (with 94 km distance apart).Meteorological and weather conditions are very similar to those observed at Hyderabad. Maximum average temperature is observed as 39.8 °C in May while average lowest temperature is 8.7 °C in January. Average rain per year is observed as 222 mm. Wind blows with an average speed of 6.02 m/s.
Lehri (29.0828° N, 68.0954° E) is located in Balochistan province of Pakistan. Summers are extremely hot and sweltering with maximum average temperature as 36.9 °C observed in June while minimum average temperature of 15.1 °C in January. Mostly the weather is dry year round with average rainfall of about 50 mm. Wind blows with an average speed of 5.13 m/s. Finally, Nankana Sahib (31.4492° N, 73.7125° E) is located in Punjab province of Pakistan. It is characterized by plain lands and clear weather conditions throughout the year. Average Maximum temperature is observed as 40 C°C in July while average minimum as 8 °C in January. Mostly the weather is dry year round with average rainfall of about 40 mm and wind blows with an average speed of 3.47 m/s.
Weibull distribution
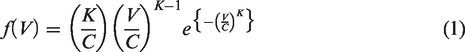
The Weibull function (f(V)) with shape (K) and scale (C) parameters used to model various phenomenon; especially wind data is given as follows equation (1) (Akpinar and Akpinar, 2005; Carta and Ramirez, 2007; Chang, 2011; Khahro et al., 2014; Mathew et al., 2002; Sumair et al., 2020b, 2020c, 2020d, 2020g, 2020h)
Calculation methods for Weibull parameters
Seven historical methods with one new method developed in this study are given below:
Empirical method of Justus (EMJ)
Also termed as standard deviation (σ) method along with mean of wind speed data (
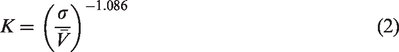
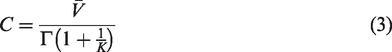
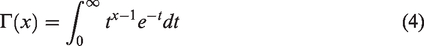
Γ(x) is a gamma function given below (Jowder, 2009)
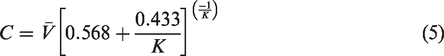
Empirical method of Lysen (EML)
This method is the modification of EMJ, in which K is calculated the same way as is calculated in EMJ; however, C is evaluated using equation (5) (Chaurasiya et al., 2018).
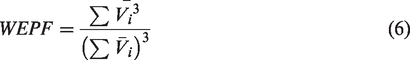
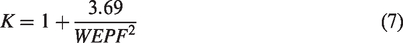
Energy pattern factor method (EPFM)
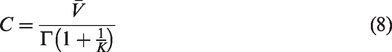
According to EPFM, Weibull parameters estimation using equations (7) and (8) is preceded by the estimation of wind energy pattern factor (WEPF) using equation (6) (Sumair et al., 2020e, 2020g)
Power density method (PDM)
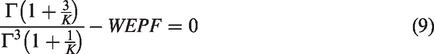
A variation in EPFM in which K is calculated while making use of numerical iteration of equation (9)
Once K is estimated, C is then calculated using equation (8)
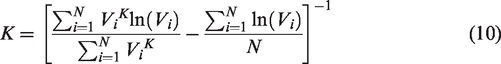
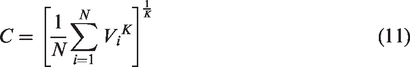
Maximum likelihood method (MLM)
In this method, K & C are calculated while making use of equations (10) and (11) respectively (Sumair et al., 2020f)
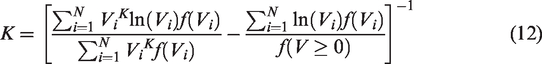
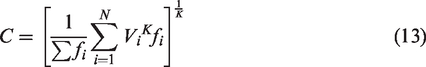
Modified maximum likelihood method (MMLM)
Privided that the wind data is avilable in bins form with Vi as central value to each wind bin, f(Vi) as frequency of observing a ceratin wind speed range, MMLM is applied for the determination of K and C while employing equations (12) and (13) respectively (Sumair et al., 2020f)
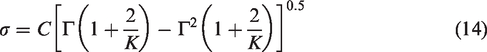
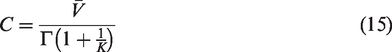
Method of moment (MOM)
In Method of Moment (MOM), K and C are calculated by the numerical iterative solution of equations (14) and (15) (Chang, 2011; Chaurasiya et al., 2018)
Combined linearized moment method (CLMM)
Using the principles of statistics and probability theory, following method has been developed which relies on the linearization of derivative of Weibull function and moment of wind velocity taken as variable, as discussed below:
First moment of velocity (M (V)), by statistical definition, is given below:
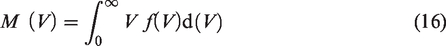
Putting

Simplifying equation (17) gives

Assume
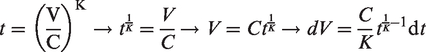
Putting in equation (18)

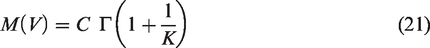
Simplification gives
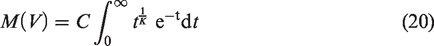
Comparing equation (20) with equation (4), we get
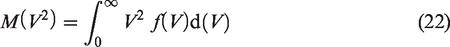
Taking the second moment (M (V2)) as follows:
Solving as first moment


From basis definition, Variance is given as follows

Differentiating f(V) w.r.t V, we get Q(V) i.e. cumulative distribution and if Weibull distribution gives the perfect fit to actual wind data so that Q(v) taken equal to the actual cumulative distribution

Using linearization of equation


Solving equations (25) and (28) simultaneously, we get K and C
Measure of goodness of fit
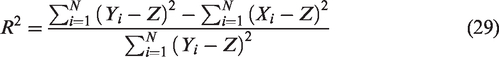
R-Squared (R2)
A measure of goodness of fit between actual probability (Xi) and predicted probability based on weibull methods (Yi) with Z as average of actual probability values, R2 is calculated as follows:
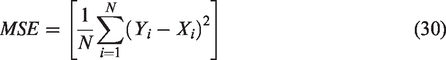
Mean square error (MSE)/root mean square error (RMSE)
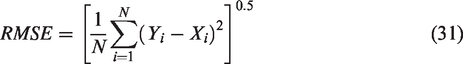
Difference between predicted probability values (Yi) and actual probability values (Xi) is described in term of MSE, given as equation (30)
However for very samll values of MSE, it is convinenet to take squatre root of MSE (called RMSE) as the square root of very smnall number (very less than 1) is a comparatively large nnumber.
Wind error (WE)
As the main purpose of weibull parameters in wind field is to estimate wind power densities, therefore, relative difference of actual wind power densities (WPDact) and predicted wind power densities based on certain weibull parameters estimation method (WPDW) needs to be quantified to assess the efficieny of that estimation method. WE is used to quantify this difference; with lower values implying more accuracy
Mean absolute percentage error (MAPE)
This parameter quantifies the relative difference bewtween actual Pact and weibull probabilities PW of wind data, given by equation (33)

5. Chi- Test (
Ideally, if actual and predicted values are identical, this test would give a value of 1. However, in actual practice, due to a certain difference between actual (Pact) and predicted values (PW), the result of this test would be less than 1.
Results and discussions
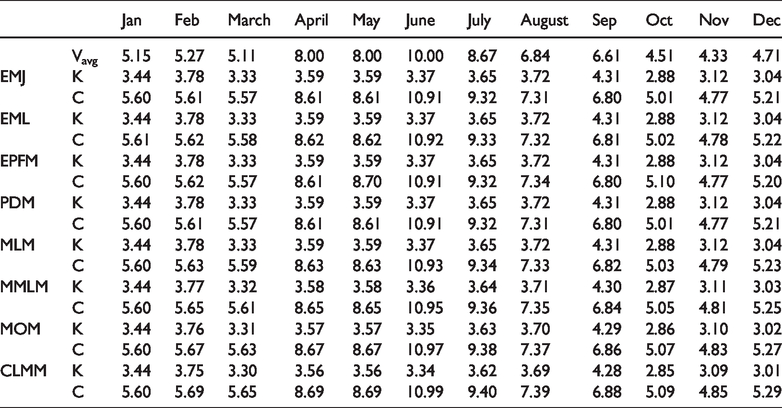
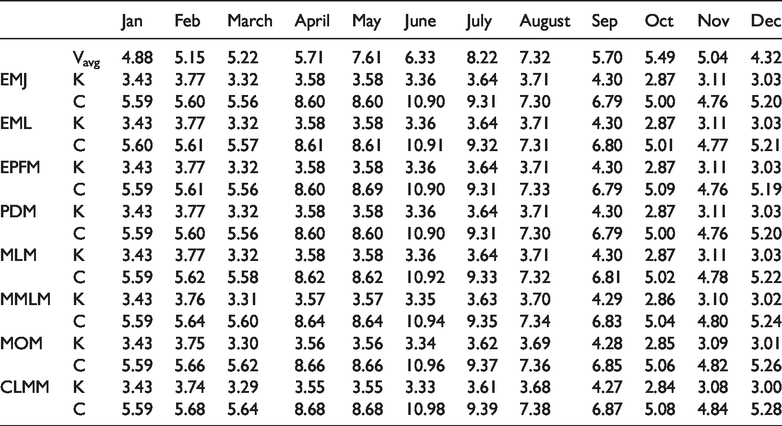
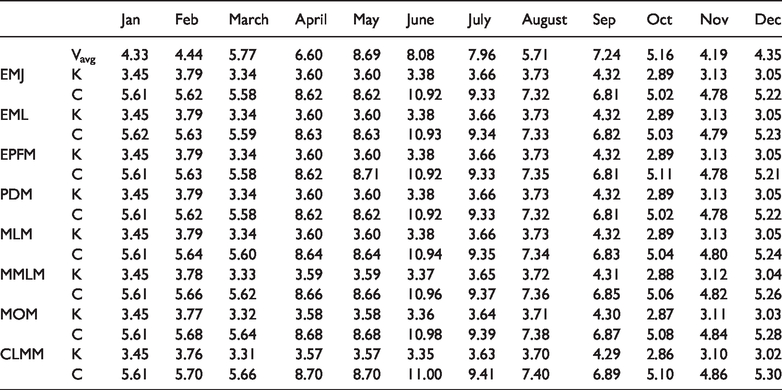
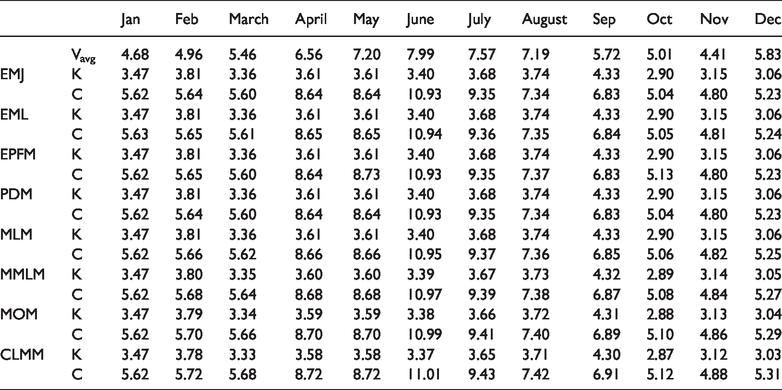
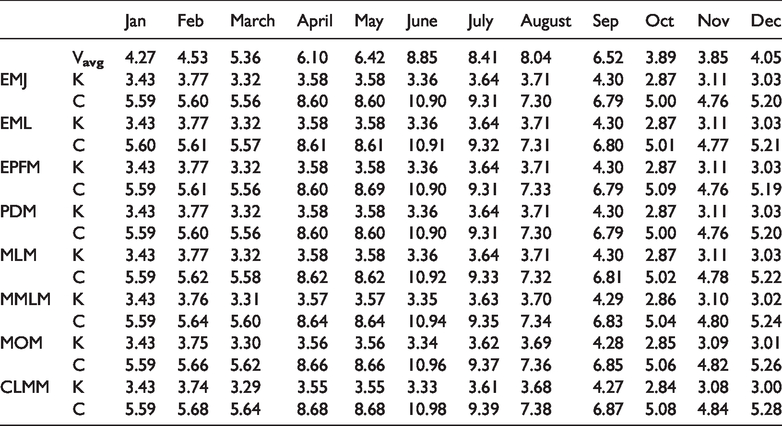
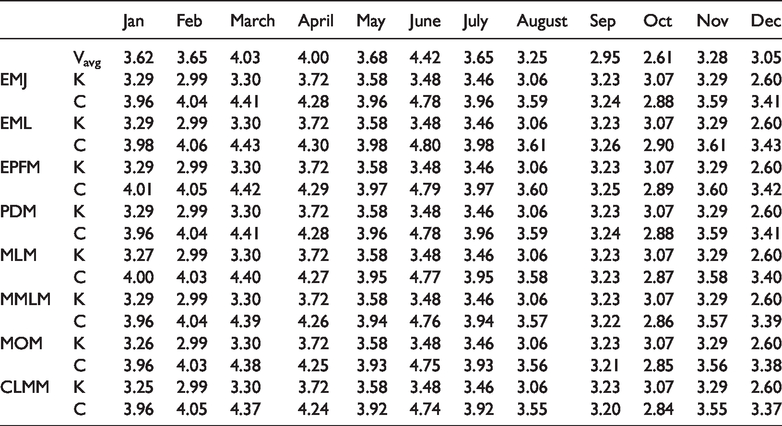
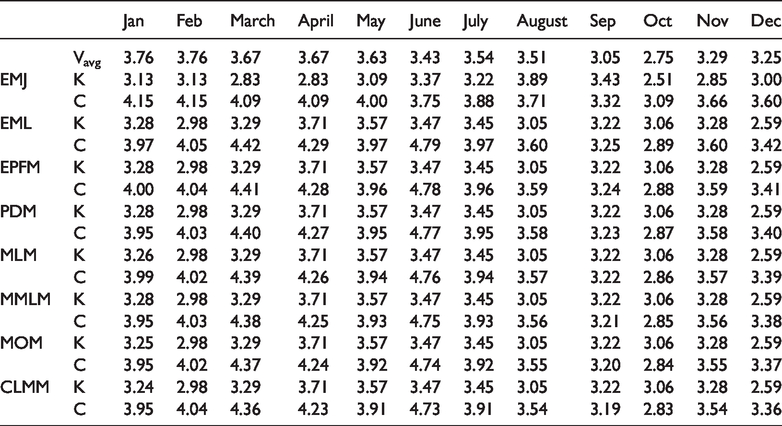
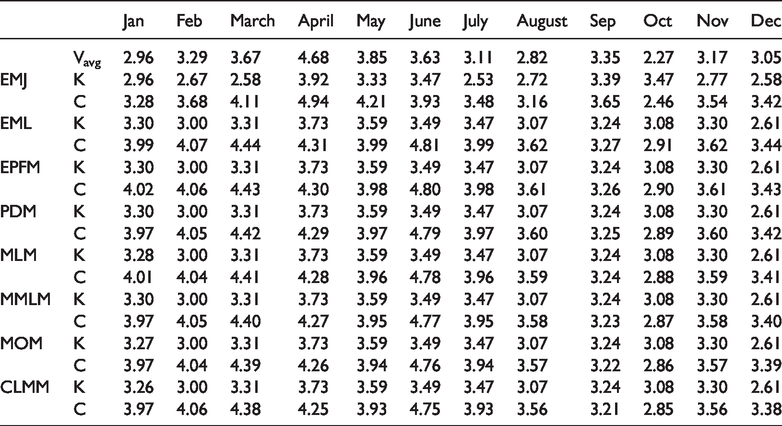
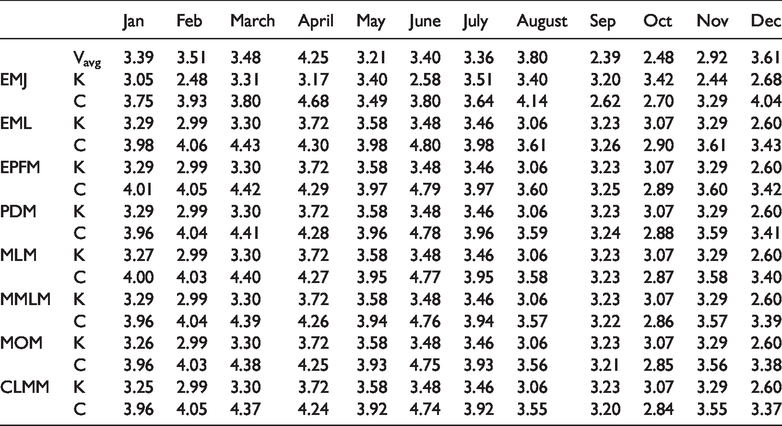
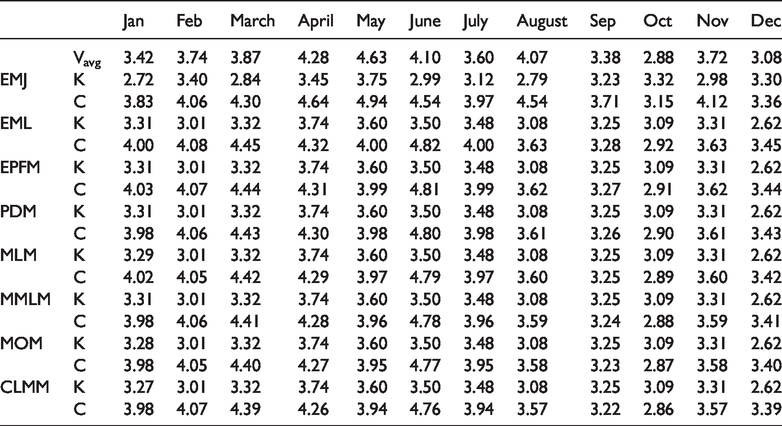
Wind speed data at five locations has been used; average values of wind speed for two representative locations, Hyderabad and Nankana Sahib (whose metrological conditions; especially the wind speeds widely differ from rest of others) out of five locations have been shown in Figures 2 and 3 respectively. In this study, Weibull parameters have been estimated using eight different methods; seven traditional methods with one newly developed method. Results of year-wise monthly calculated Weibull parameters from all these methods have been listed in Tables 1 to 10 for all two locations respectively.
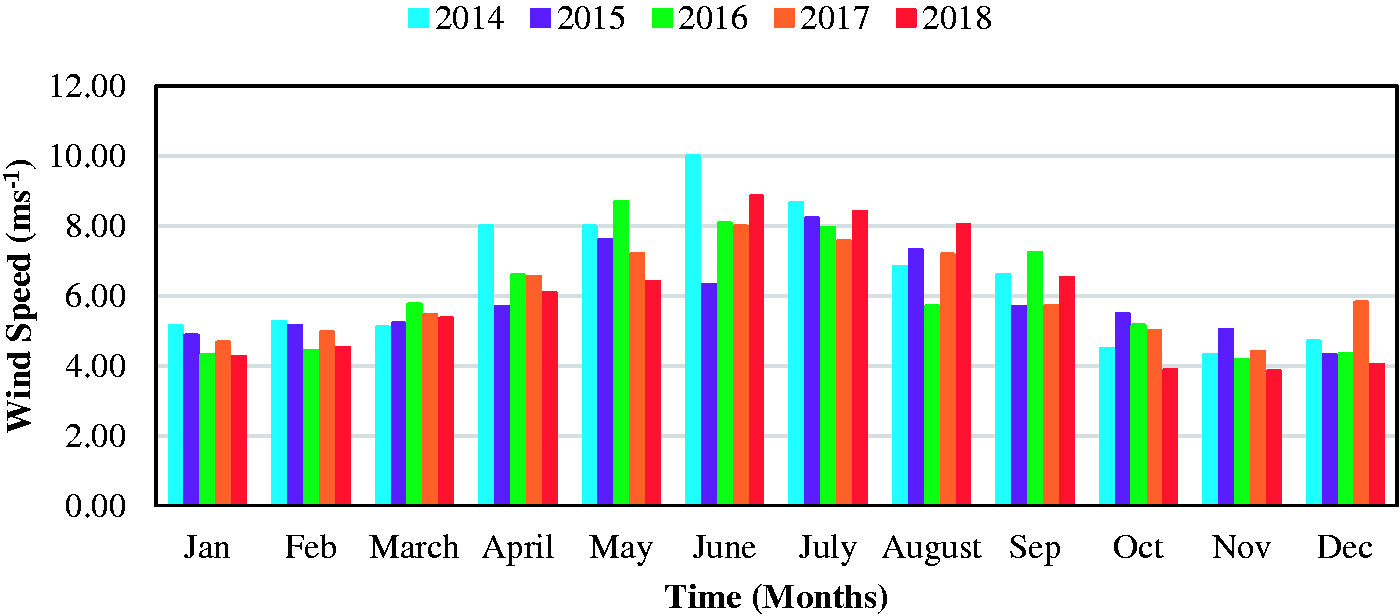
Variation in monthly average wind speed at Hyderabad.
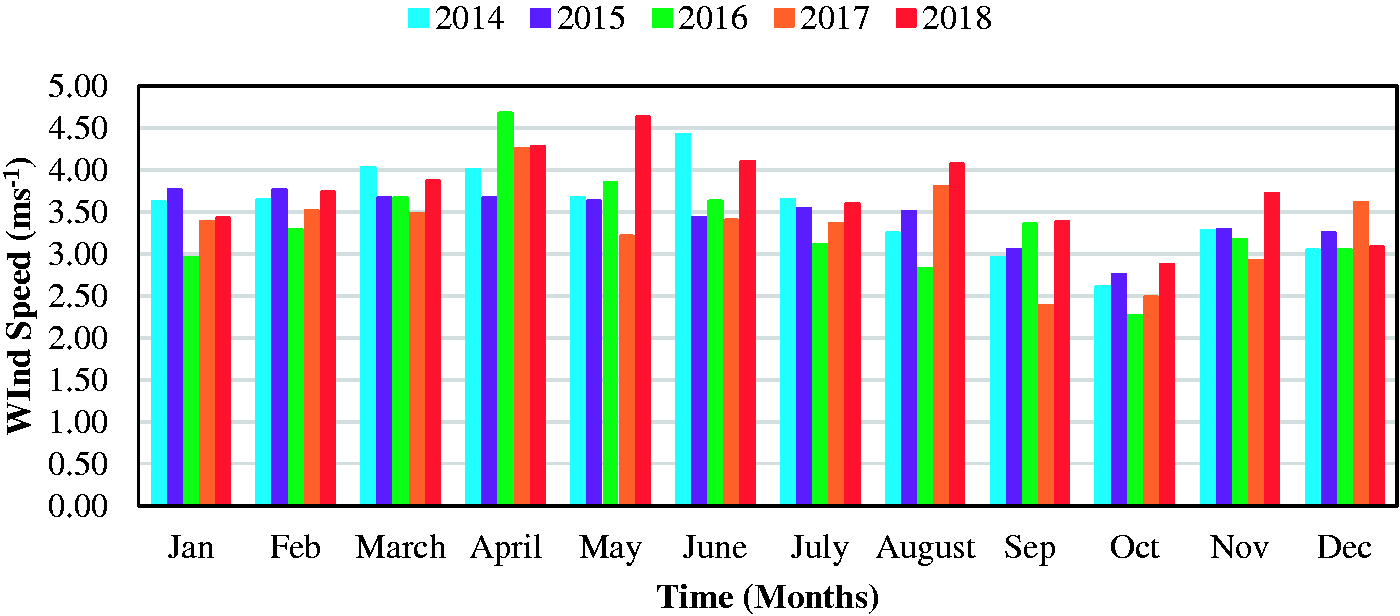
Variation in monthly average wind speed at Nankana sahib.
Monthly average wind speeds (ms−1), K and C (ms−1) calculated from various methods in 2014 at Hyderabad.
Monthly average wind speeds (ms−1), K and C (ms−1) calculated from various methods in 2015 at Hyderabad.
Monthly average wind speeds (ms−1), K and C (ms−1) calculated from various methods in 2016 at Hyderabad.
Monthly average wind speeds (ms−1), K and C (ms−1) calculated from various methods in 2017 at Hyderabad.
Monthly average wind speeds (ms−1), K and C (ms−1) calculated from various methods in 2018 at Hyderabad.
Monthly average wind speeds (ms−1), K and C (ms−1) calculated from various methods in 2014 at Nankana Sahib.
Monthly average wind speeds (ms−1), K and C (ms−1) calculated from various methods in 2015 at Nankana Sahib.
Monthly average wind speeds (ms−1), K and C (ms−1) calculated from various methods in 2016 at Nankana Sahib.
Monthly average wind speeds (ms−1), K and C (ms−1) calculated from various methods in 2017 at Nankana Sahib.
Monthly average wind speeds (ms−1), K and C (ms−1) calculated from various methods in 2018 at Nankana Sahib.
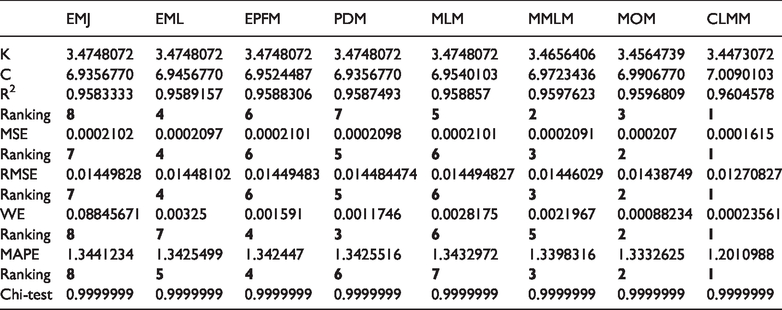
It has been observed that the values of Weibull parameters calculated from each method are different and this difference affects the efficiency of each method. Efficiency of these methods has been estimated using six statistical tests. i.e. R2, MSE, RMSE, WE, MAPE, Chi-test for goodness of fit, and the results for two sites have been listed in Table 11 and 12 respectively. For a detailed comparison purpose of all methods, these values have been listed up to 7 decimal points. Each method has been ranked against each performance evaluation criteria on a scale from 1–8 (with 1 being the most efficient and 8 as the least efficient method). It has been observed that CLMM is the most efficient while EMJ is the least efficient with respect to (w.r.t) R2. Similarly, the other methods have been ranked between these two extremes.
Comparative analysis of all Weibull parameters estimation methods at Hyderabad.
Comparative analysis of all Weibull parameters estimation methods at Nankana Sahib.
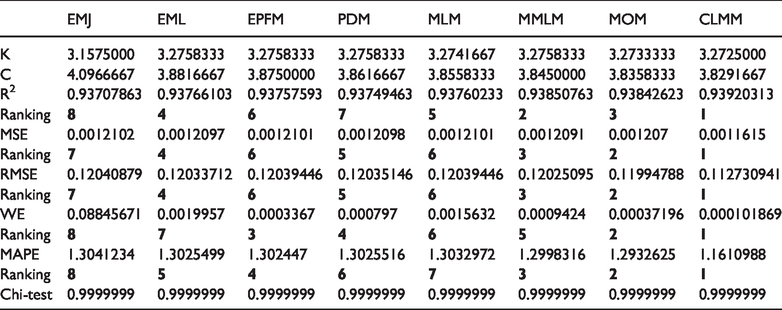
Ranking w.r.t MSE also declares CLMM as the most efficient while EMJ as the least efficient. Same ranking has been observed when ranked w.r.t RMSE. Similarly, CLMM has been found the most efficient method w.r.t WE, MAPE and Chi-test while EMJ as the least efficient w.r.t all these criteria. Chi-test has been reported to give the same result of all methods i.e. no method has been found to be either superior or inferior to the other w.r.t this criterion. Overall, based on all evaluation criteria, CLMM has been found the most efficient while EMJ as the least efficient.
However, the efficiency of other methods has been found to vary as the method of ranking changes, for example, MMLM has been found the second most efficient w.r.t R2 while third most efficient w.r.t MSE and RMSE. Therefore, an overall ranking of these methods is required which has been done based on the average of individual ranking, as listed in Table 13.
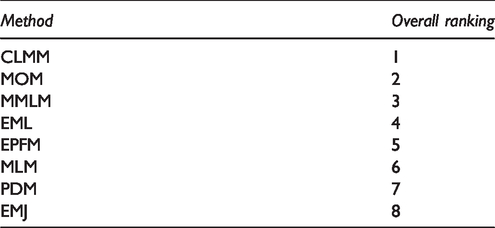
Overall ranking of Weibull parameters estimation methods.
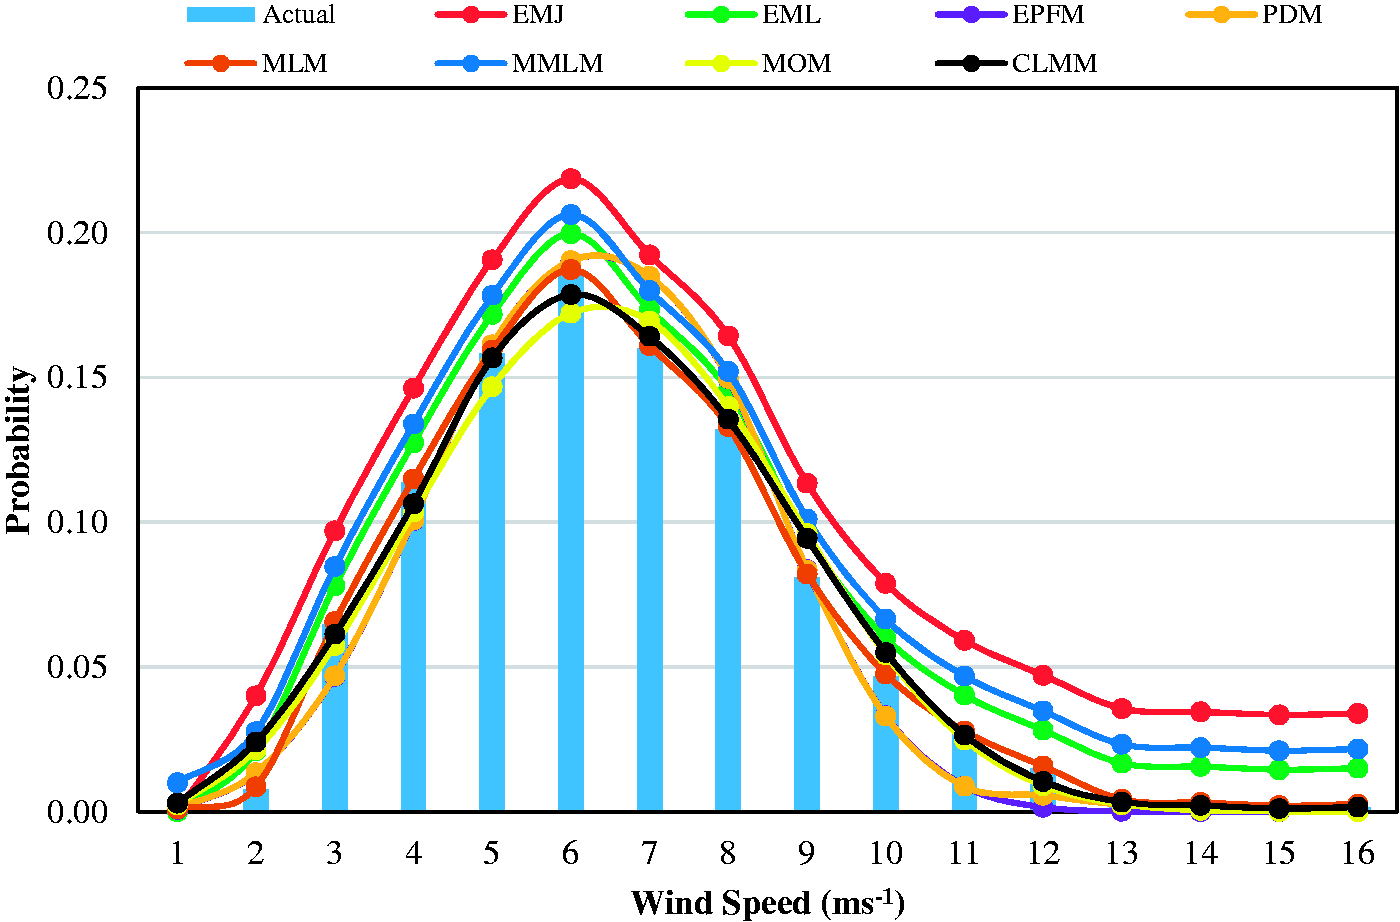
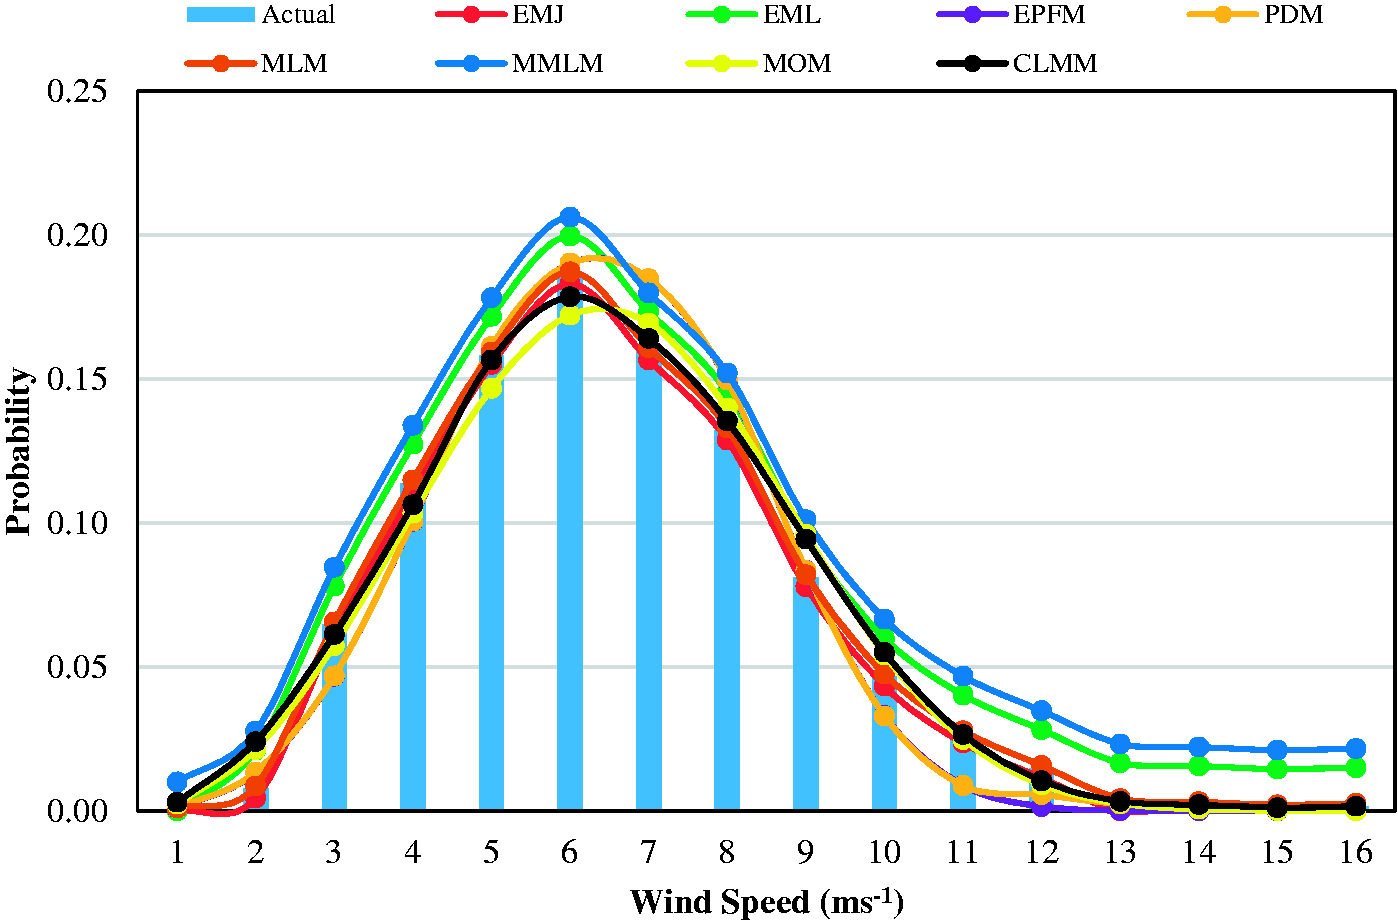
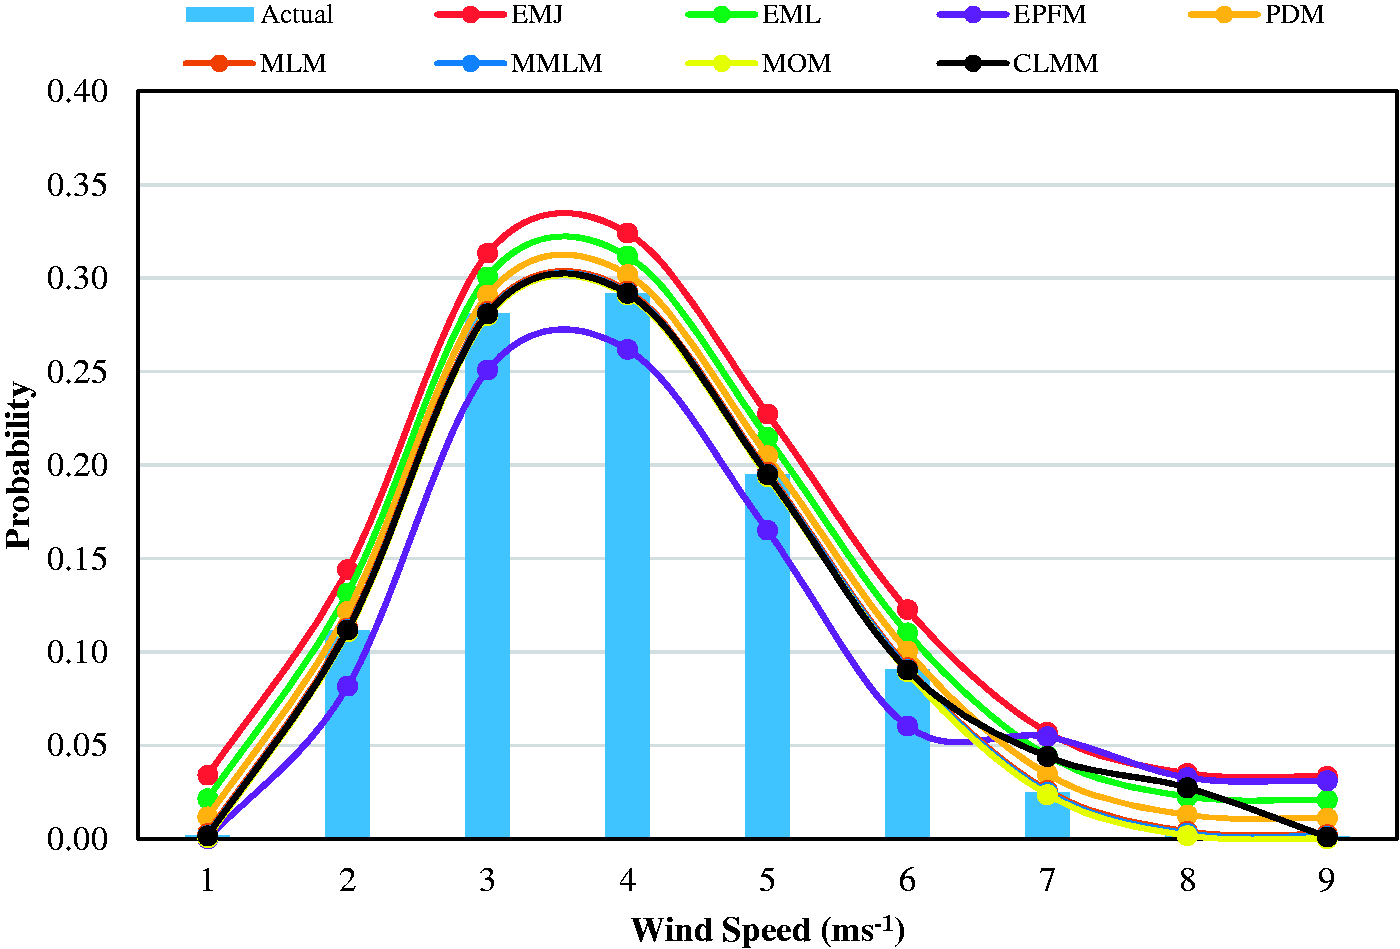
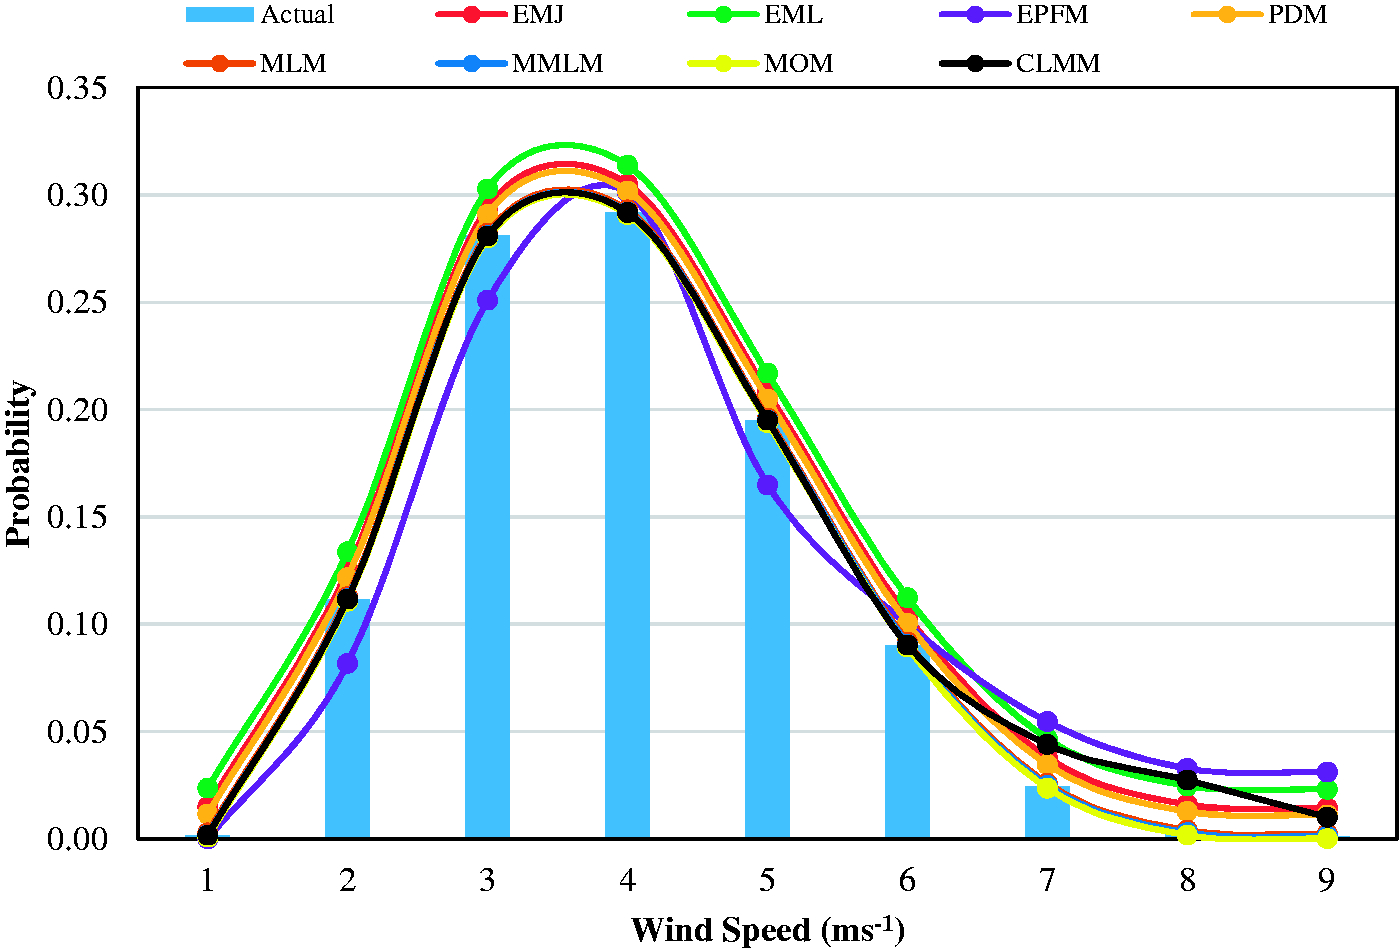
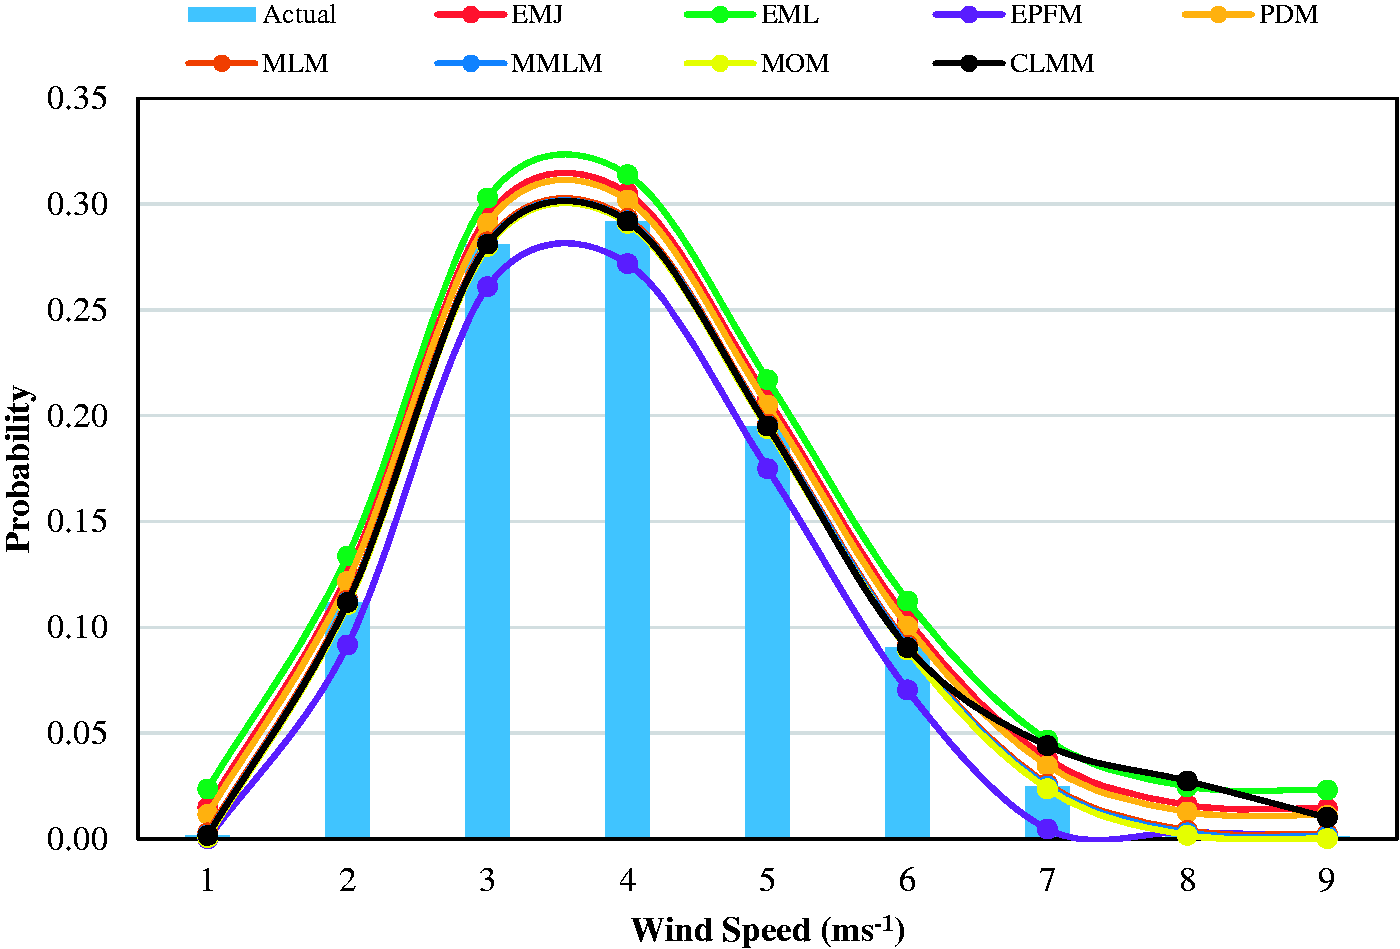
Also, distribution diagrams with actual wind data probability and the probabilities predicted by various methods for two representative locations have been shown in Figures 4 to 13 respectively against the years of 2014–2018 respectively. These diagrams also clearly represent that CLMM gives the best fit to actual wind data for all locations against all years.
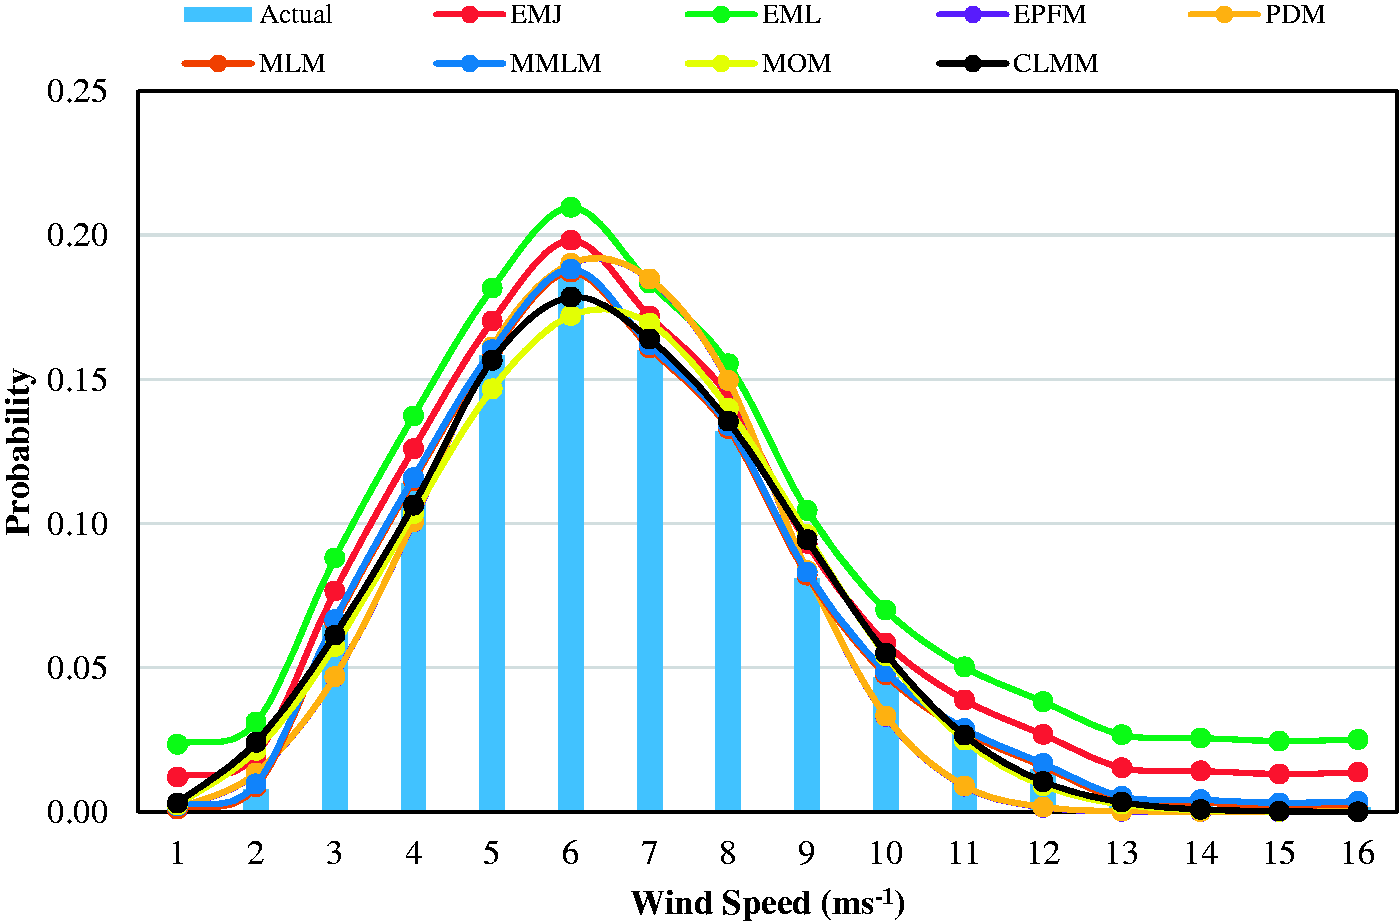
Weibull distribution based on K and C calculated from various methods in 2014 at Hyderabad.
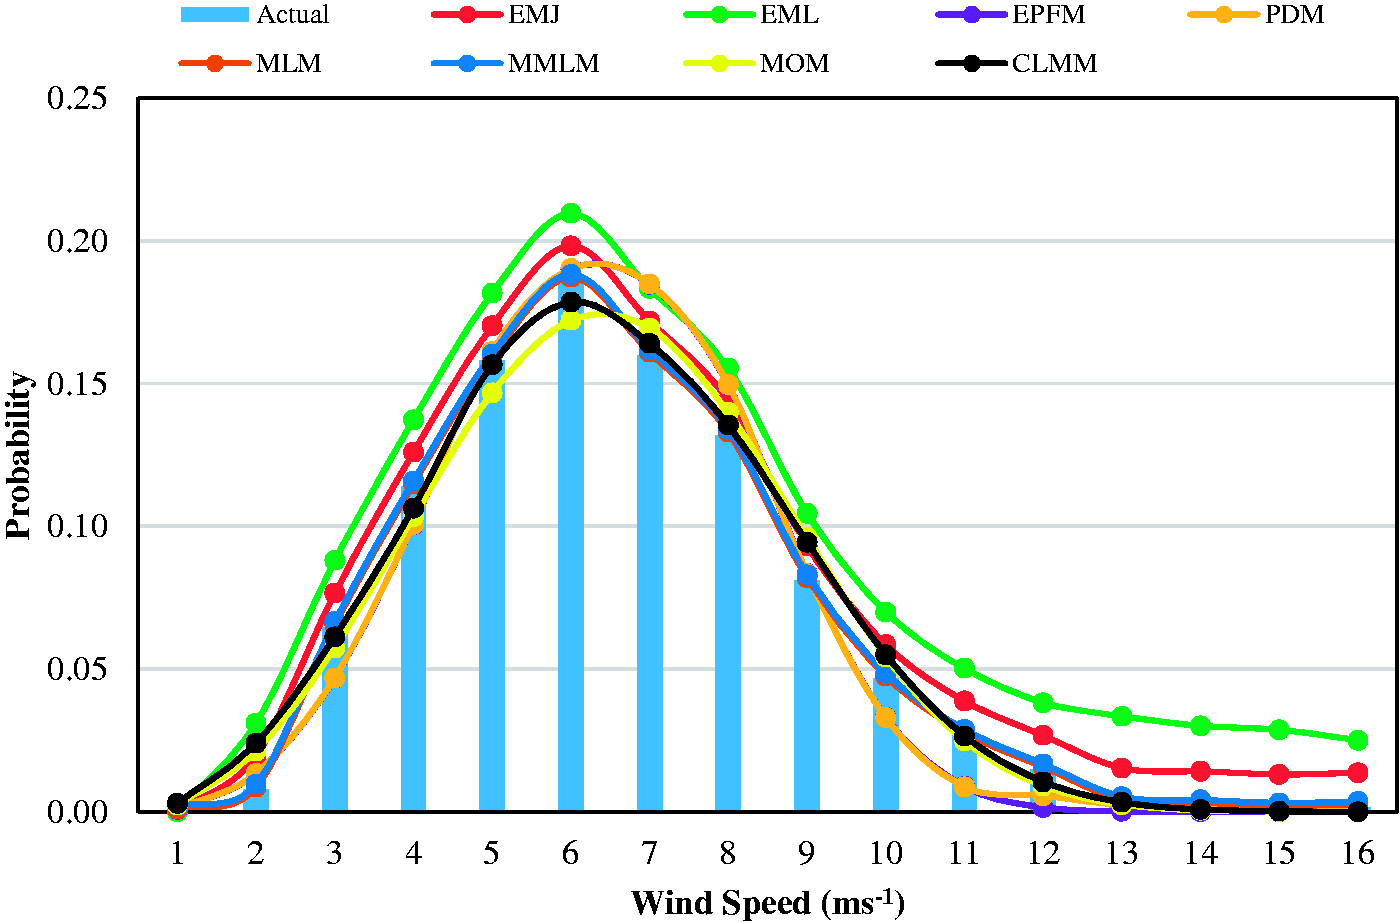
Weibull distribution based on K and C calculated from various methods in 2015 at Hyderabad.
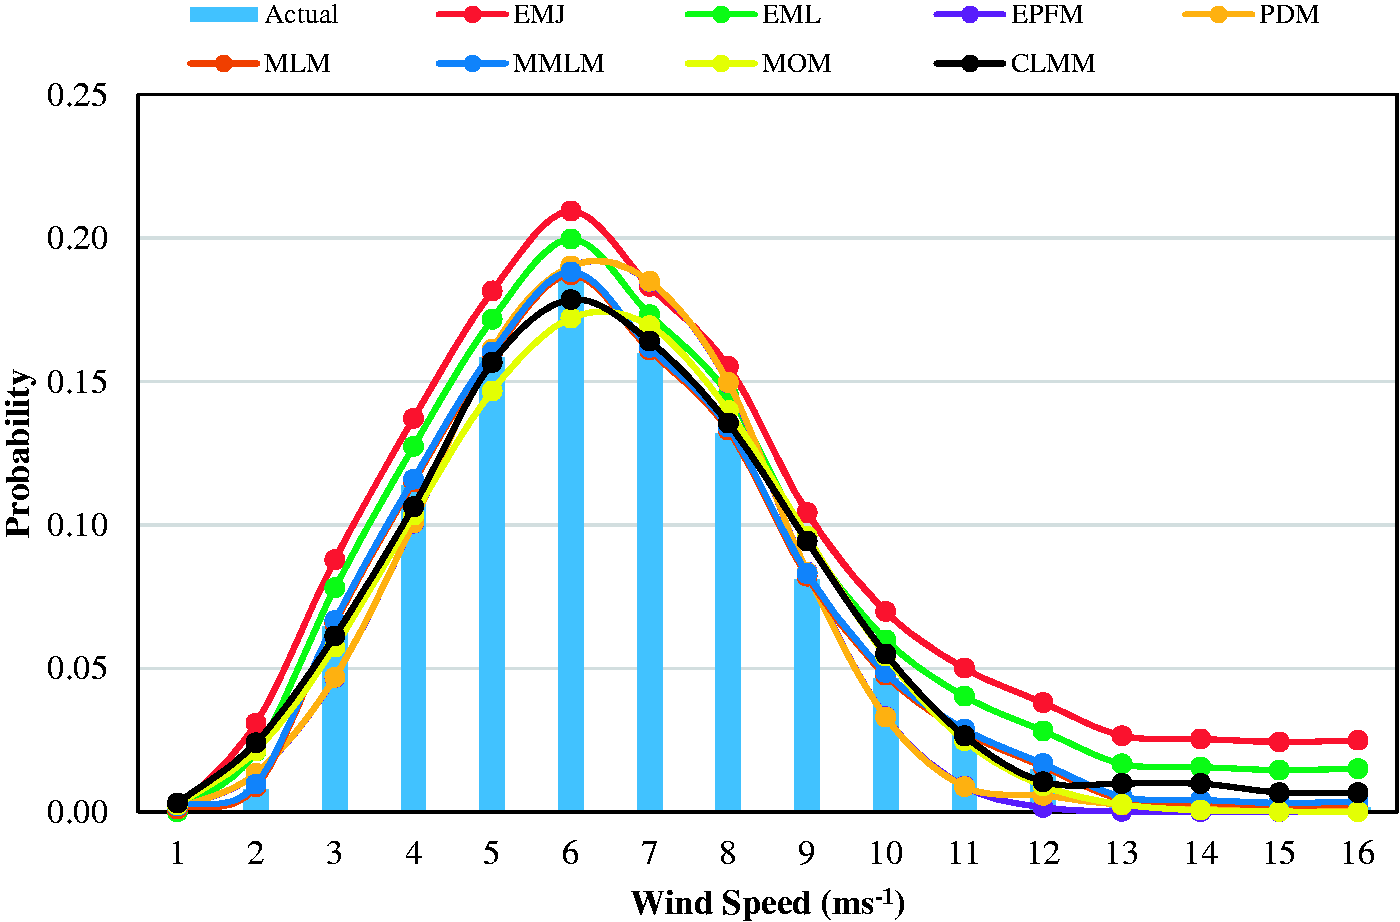
Weibull distribution based on K and C calculated from various methods in 2016 at Hyderabad.
Weibull distribution based on K and C calculated from various methods in 2017 at Hyderabad.
Weibull distribution based on K and C calculated from various methods in 2018 at Hyderabad.
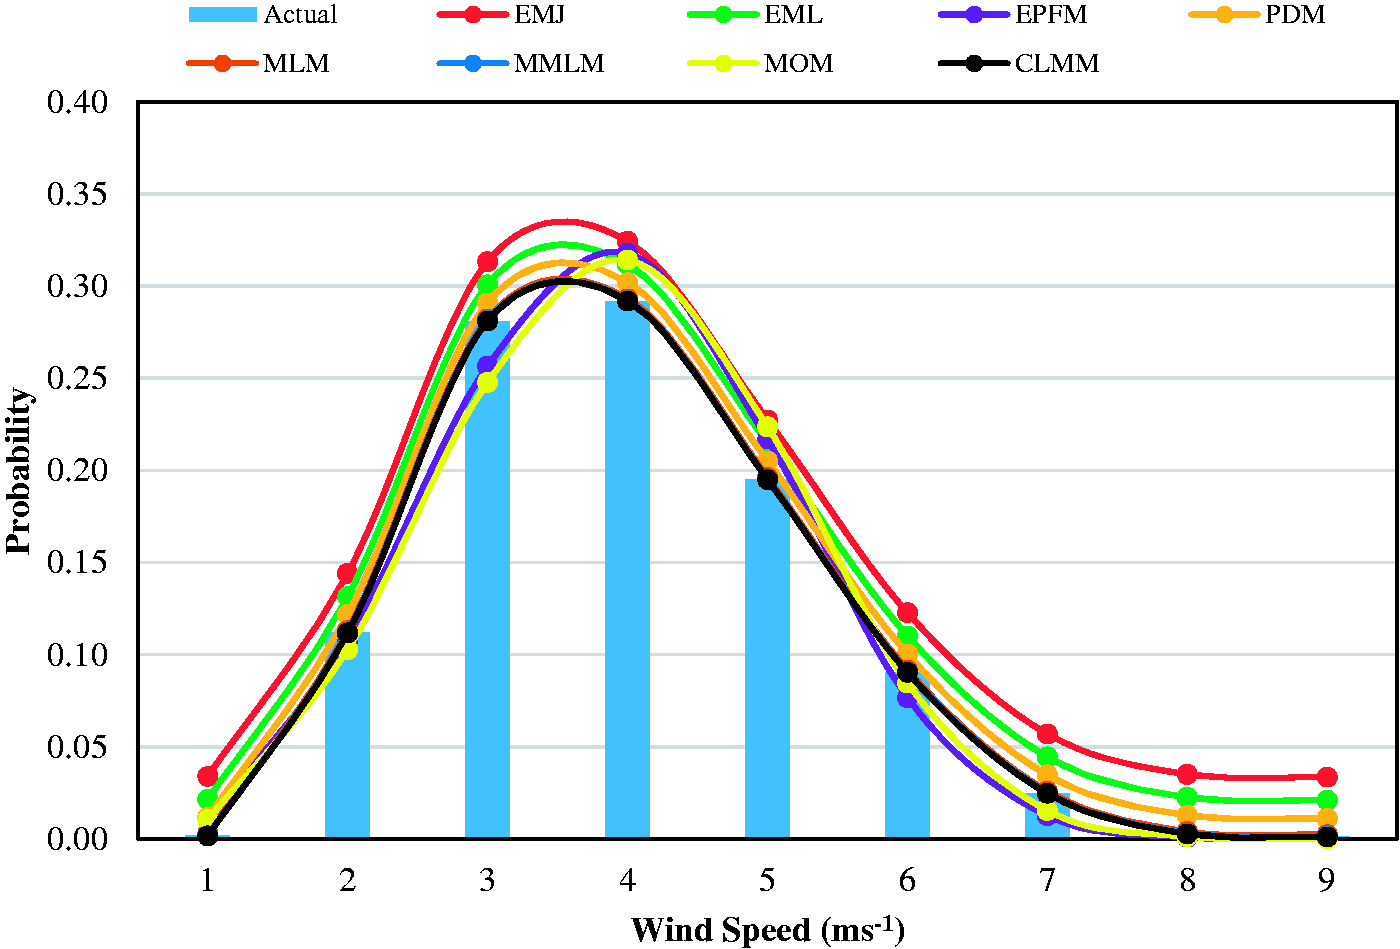
Weibull distribution based on K and C calculated from various methods in 2014 at Nankana Sahib.
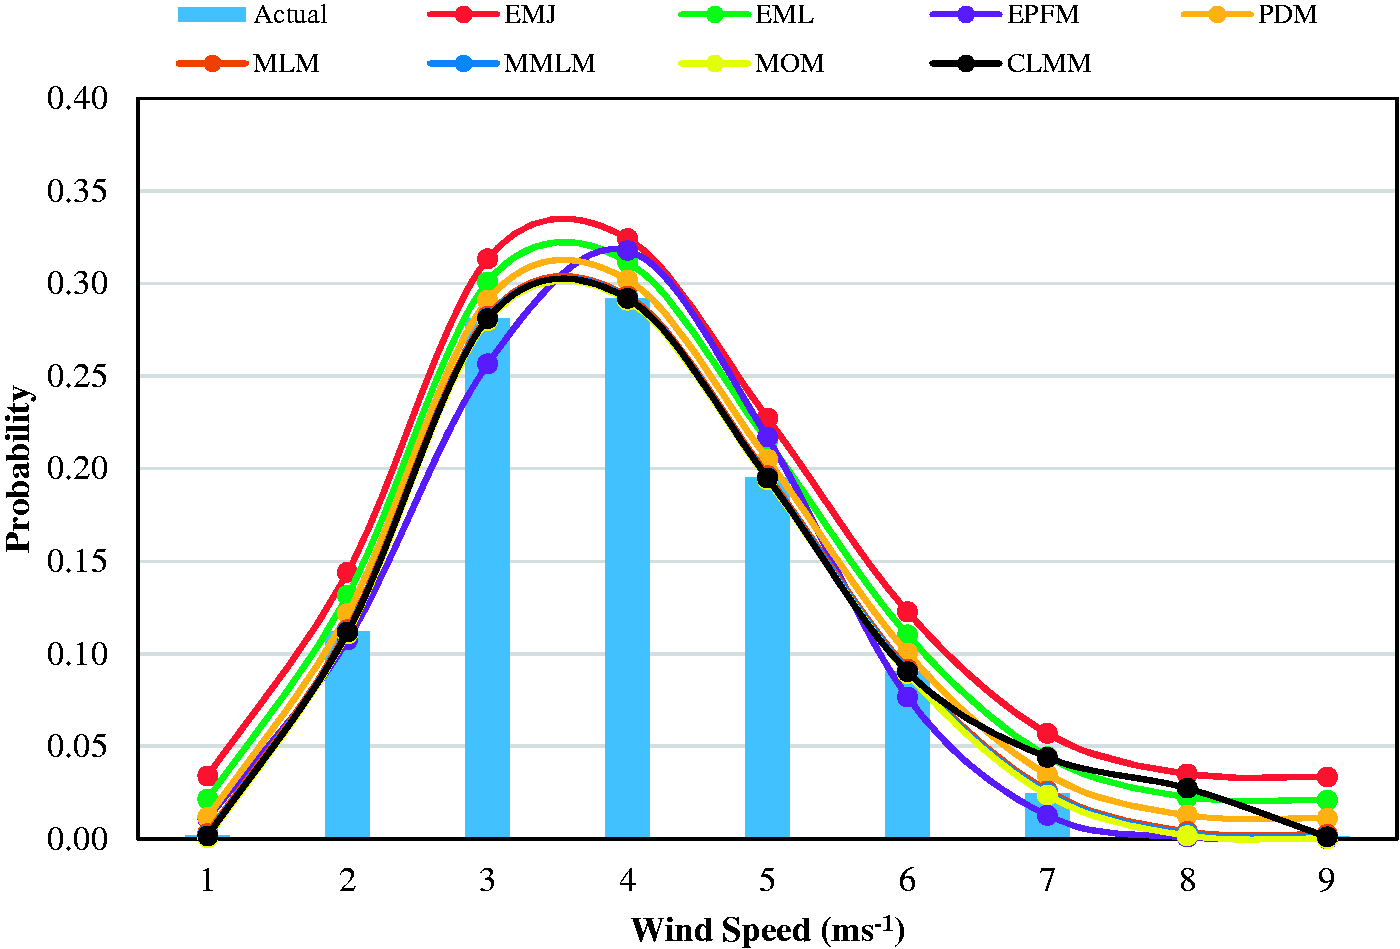
Weibull distribution based on K and C calculated from various methods in 2015 at Nankana Sahib.
Weibull distribution based on K and C calculated from various methods in 2016 at Nankana Sahib.
Weibull distribution based on K and C calculated from various methods in 2017 at Nankana Sahib.
Weibull distribution based on K and C calculated from various methods in 2018 at Nankana Sahib.
Here the results have been discussed for two representative locations only, however, it has been found from the analysis that these results are also validated for other three locations also.
Conclusion
Comparison of CLMM with seven traditional methods was carried out using wind data at five locations against six criteria i.e. R2, MSE, RMSE, P.E., MAPE and Chi-test for goodness of fit. For all investigated locations, CLMM has been found the best method against all performance evaluation criterion while EMJ as the least accurate method. Detailed results have been presented for two locations i.e. Hyderabad and Nankana Sahib only in the form of tabulated data and charts; however, it has been found that these results are also validated for other locations also. Hence, CLMM can be used to estimate parameters of Weibull distribution with significant accuracy.
Footnotes
Declaration of conflicting interests
The author(s) declared no potential conflicts of interest with respect to the research, authorship, and/or publication of this article.
Funding
The author(s) received no financial support for the research, authorship, and/or publication of this article.