
Abstract
Energy is essential for any country’s economic growth and is inevitable in improving the standard of life of its citizens. Since independence, India has spent considerable resources on increasing its energy capacity. As a result, the country’s energy generation capacity has increased considerably. Wind energy is a clean and eco-friendly energy source and is increasingly being accepted as a major complementary energy source for securing a sustainable and clean energy for future in India. The appropriate wind speed distribution is the key to assess the wind resource at a particular location. In this paper, the three-parameter Weibull distribution is used to estimate the capacity factor at different heights. This research provides information of wind characteristics of potential sites and helps in selecting suitable wind turbines.
Keywords
Introduction
The development of wind power in India started in the 1990s, which has grown significantly over the years. Inspite of India coming new to the wind power sector, it still ranks fourth in the world in terms of wind power generation. For such long simulations, the availability of renewable energy generators may be represented either by repetitive historical weather records or by a time series model that can generate a new synthetic data indefinitely. Renewable energy is accepted as the key to clean energy sources for the future, not only for India, but for the whole world. According to the clean energy mission of India, by 2030 the nation’s renewable energy capacity is to be doubled. Nearly 4% of the global electricity demand in 2017 was sufficed by electricity generated by wind power systems.
On a global scale, the long-term energy potential of wind is believed to be five times the current total energy production, or 40 times the current electricity demand, assuming all practical barriers are overcome. This would demand that wind turbines be installed over large areas, especially in areas of higher wind resources. India is the first country in the world to set up a ministry of nonconventional energy resources in the 1980s. Of the total renewable power produced, wind energy contributed to 61% while 19% came from solar energy (Owusu et al., 2016).
The ministry of power has announced that no addition of any coal-based energy capacity is required for 10 years to come. The government of India’s intention is to achieve 40% cumulative electric power capacity from nonfossil fuel sources by 2030. Such ambitious targets would aid India in becoming one of the leading green energy producers in the world, surpassing numerous developed countries. Figure 1 shows the amount of wind energy produced in some states of India during the year 2018 (Source: Central Electricity Authority).
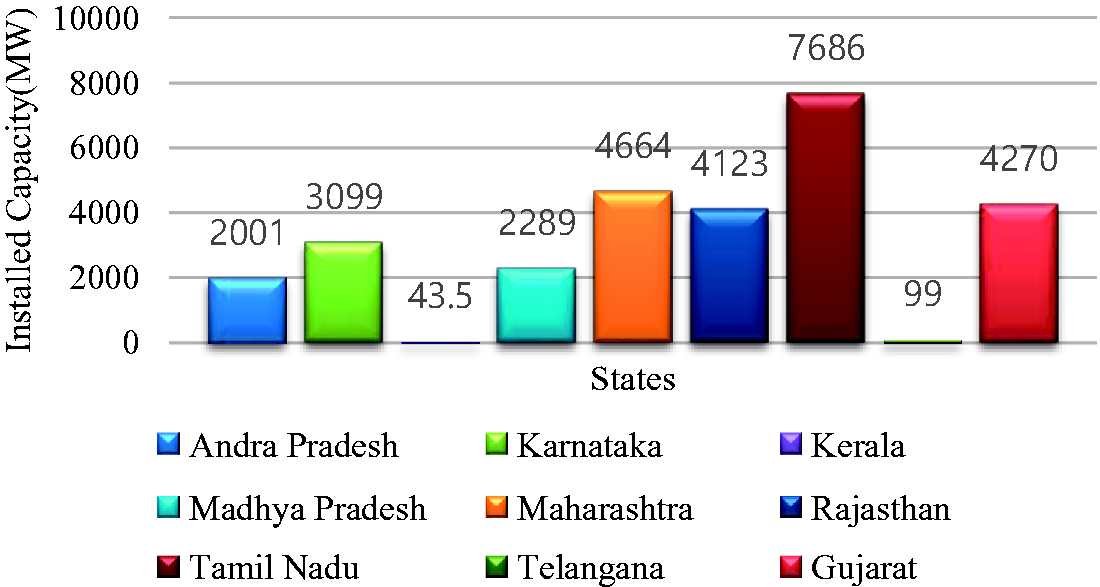
Installed wind power capacity of major windy states in India.
Growth of wind power generation in Tamil Nadu
Tamil Nadu is pioneer of wind energy in India. Due to its encouraging policies for wind energy, this state has always been preferred by the wind energy industry for installing projects since the commencement of Indian wind energy program. Wind farm developed by M/s. Pandian Chemicals at Kanyakumari on 28 March 1990 with 250 kW wind turbine had been the first wind farm developed by any private company in India. Not only wind farm development, but also manufacturing of wind turbines was started in this state. Since then, a number of renowned manufactures such as Vestas, Gamesa, Suzlon, and RRB have set up their manufacturing facilities in the state.
Muppandal wind farm of the state, which is located on Aralvaimozhi mountain pass, is the largest wind farm in Asia with a generation capacity of 1500 MW. It has large number of wind turbines of various sizes from 200 kW to 1650 kW. Tamil Nadu is the leading producer of wind energy with a total installed capacity of 7276 MW, accounting for 34% of India’s total wind capacity. Except 2007, Tamil Nadu’s annual capacity addition has been the highest among all the states since 2002. In 2011, Tamil Nadu achieved another success by installing 1083 MW wind energy in a single year, which is the highest annual installation by any Indian state in a single year. In the recent past, districts of Coimbatore, Tirupur, and Theni are the locations where the maximum numbers of wind turbines are getting installed. The spectacular growth of wind energy in Tamil Nadu is attributed to the consistent effort of government to assess wind resource potential and set up conductive policies to attract private investment, which was described by Sangroya and Nayak (2015).
The wind power capacity in Tamil Nadu is the maximum in India. Kethanoor, Gudimangalam, Chittipalayam, Poolavadi, Sunkaramudaku, Kongal Nagaram, Murungappatti, Gomangalam, and Anthiur are the places in Tamil Nadu with the maximum wind generating capacity. To continue this, wind data analysis and accurate wind energy potential assessment are critical in suitably developing wind power applications at a particular location. This study examines wind speed distribution to apply the three-parameter Weibull method that will provide accurate and efficient estimation of energy output for Wind Energy Conversion System. Estimation of the amount of energy that a wind turbine will generate in a year is a crucial factor in determining the viability of any wind development project. To do that correctly, it is important to understand wind characteristics, especially its variable nature. This paper outlines the issues and describes how we address those issues. When it comes to generating electricity, the single most important characteristic of wind that matters is its speed. Wind is observed and the data collected are generally in the form of very large number of points. It is remarkable that a wide range of wind characters can be summarized by specifying just the two parameters, shape k and scale c. These two parameters are sufficient to specify the available wind and subsequently to assess and evaluate the wind power.
The probability distribution that is most often used to characterize a wind speed distribution is the Weibull distribution. Hundreds of papers have been written on the “Weibull distribution”, which has been attracting the attention of statisticians for about half a century now. Despite the ongoing research and the other distributions like normal and exponential, Weibull is the most sought after model in statistics. The challenge addressed here is partially about how to calculate, for future electricity network scenario and whether the proposed combination of such approaches would be sufficient to maintain the acceptable levels of reliability. This study reviews the developmental aspects of wind energy in India.
Bhattacharya and Bhattacharjee (2010) suggested the two-parameter Weibull distribution to fit the observed wind data and have presented two analytical methods for estimating the Weibull parameters namely the maximum likelihood and the least squares method. They concluded that these two analyses will help scientists and technocrats to select locations for wind turbine generators. Sarkar et al. (2011) determined the technique for finding the range of wind speed until which the Weibull model is found to be appropriate and also to fit the upper wind speed data in a suitable statistical distribution like the extreme value distribution of type I (Gumbel) and the three-parameter Weibull distribution. The hourly mean wind speed data of Ahmedabad has been used to justify the procedure.
Tuller and Brett (1984) proposed a three-parameter Weibull function in their research paper “The Characteristics of Wind Velocity that Favor the Fitting of a Weibull Distribution in Wind Speed Analysis” and found that the same showed better fitness and flexibility than the two-parameter Weibull function. Initially, the two-parameter Weibull function was used owing to its wide array of applicability, flexibility, and usefulness for describing the frequency of occurrence of high wind speeds. But some authors have indicated that the two-parameter Weibull function should not be used in a generalized way, as it is unable to represent some wind regimes. A three-parameter Weibull function has also been utilized in some studies and was found to dispense improved fitness and flexibility than the classical two-parameter Weibull function. So there is an opportunity for bettering the three-parameter Weibull distribution in the field of wind resource assessment (Amirinia et al., 2017).
Asumadu-Sarkodie and Owusu (2016) conferred a study at Ghana where the potentiality and economic feasibility of wind farm project were evaluated in 11 locations in Ghana. The study employed wind-speed data using Meteonorm 7 software in a Typical Meteorological Year 2 format and analyzed with RET Screen Clean Energy Project Analysis modeling software. 10 MW of VESTAS V90 wind turbine model with a rated power of 2000 kW was proposed, which, when developed and harnessed, will drastically boost productivity of businesses, industries, and the transport sector in Ghana whilst making significant contribution to the export earnings of the country.
The survey of literature as presented in the above clearly depicts that a large number of studies have been published presenting the use of a variety of probability density functions to describe wind speed frequency distributions. The Weibull distribution function is comprehensively used for delineating the wind power potential at a destined site. The two-parameter Weibull function is the most widely used and accepted function in the specialized literature on wind energy. Initially, the two-parameter Weibull function was used owing to its wide array of applicability, flexibility, and usefulness for describing the frequency of occurrence of high wind speeds. But some authors have indicated that the Weibull function should not be used in a generalized way, as it is unable to represent some wind regimes.
A three-parameter Weibull function has also been utilized in some studies and was found to dispense improved fitness and flexibility than the classical two-parameter Weibull function. So there is an opportunity for bettering the three-parameter Weibull distribution in the field of wind resource assessment. Of all the researchers who have worked in the field of wind energy assessment, only few have used the three-parameter Weibull distribution considering the value of
The challenge addressed here is partially about how to calculate, for future electricity network scenario and whether the proposed combination of such approaches would be sufficient to maintain the acceptable levels of reliability. This study reviews the developmental aspects of wind energy in India. The developed techniques and results obtained provide useful insight to wind power developers for re-assessment of wind resource at a site and for re-powering the existing wind farms. In the sections to follow, a mathematical model achieving the above requirements is proposed.
Probabilistic model of wind speed Weibull distribution
The three-parameter Weibull distribution can be expressed as
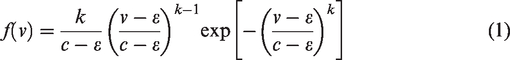
The Weibull distribution with parameters
Data source
Selection of wind site depends on many factors like wind resource, wind regime, geographical location, topography, forest or private land, accessibility, nearness to grid, etc. The first step in every wind energy project is the identification of suitable sites and prediction of the economic viability of the wind project (Mo et al., 2015).
The Ministry of New and Renewable energy (MNRE) beneath the government of Republic of India, in association with other agencies encourages the development of wind power producing sector in India. The government has facilitated the growth of the wind sector through financial aids and several policies. With data provided by the MNRE in hand, the government of Tamil Nadu started a wind power plant at Ennore on 23 March 1992, which functioned up to 20 April 1995 that measured the wind speed at an altitude of 20 m. The value of the average wind speed measured was nearly 5.46 m/s with the mean wind power as 139 W/m2 at 20 m and 243 W/m2 at 50 m. It was declared that the power gained would not be sufficient and hence, the generation of wind power was dropped at Ennore. All the above said details about the Ennore station can be found in the webpage: http://globalenergyobservatory.org/geoid/6508.
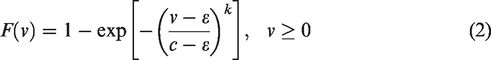
This paper deals with data recorded for the years 2012 and 2013 at Ennore station with an average wind speed data of 5.5529 m/s. This study suggests the government to install wind turbines at their prescribed height considering the capacity factor and economic analysis. The paramount reason as to why we chose the Ennore station for this project analysis is that it was the only station one could find neighboring the state’s capital and the only metropolitan city in Tamil Nadu, Chennai. We believe “A state is only as good as its capital”. Table 1 provides the geographical co-ordinates of the Ennore station and Figures 2 and 3 provide the monthly mean wind speed data for the years 2012 and 2013 and sample wind gust, respectively.
Geographical coordinates of the meteorological station, Ennore.
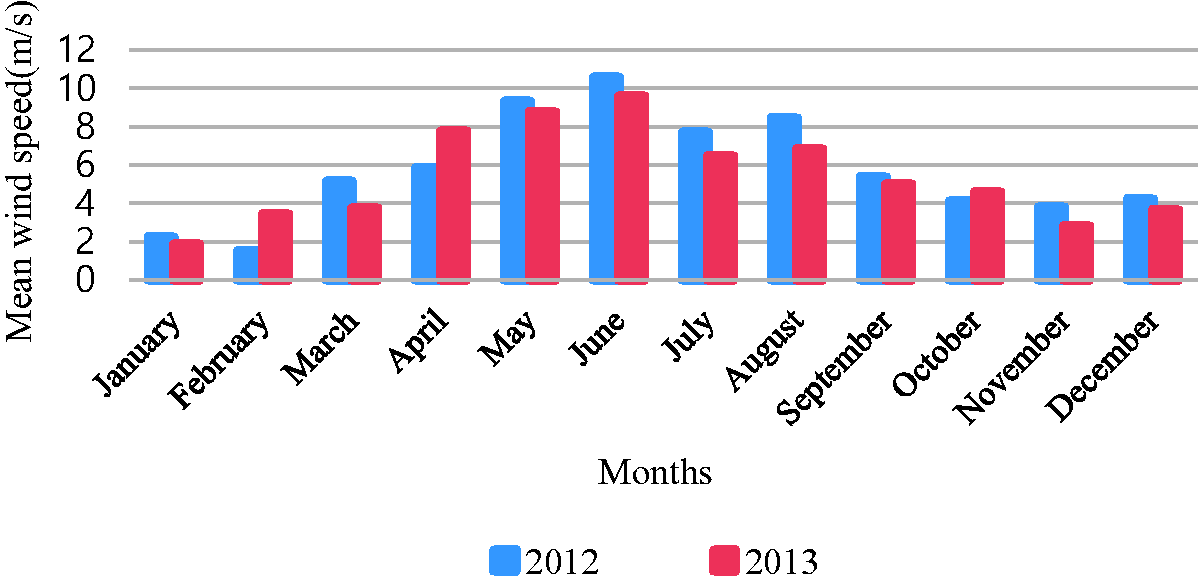
Monthly mean wind speed data for the years 2012 and 2013.
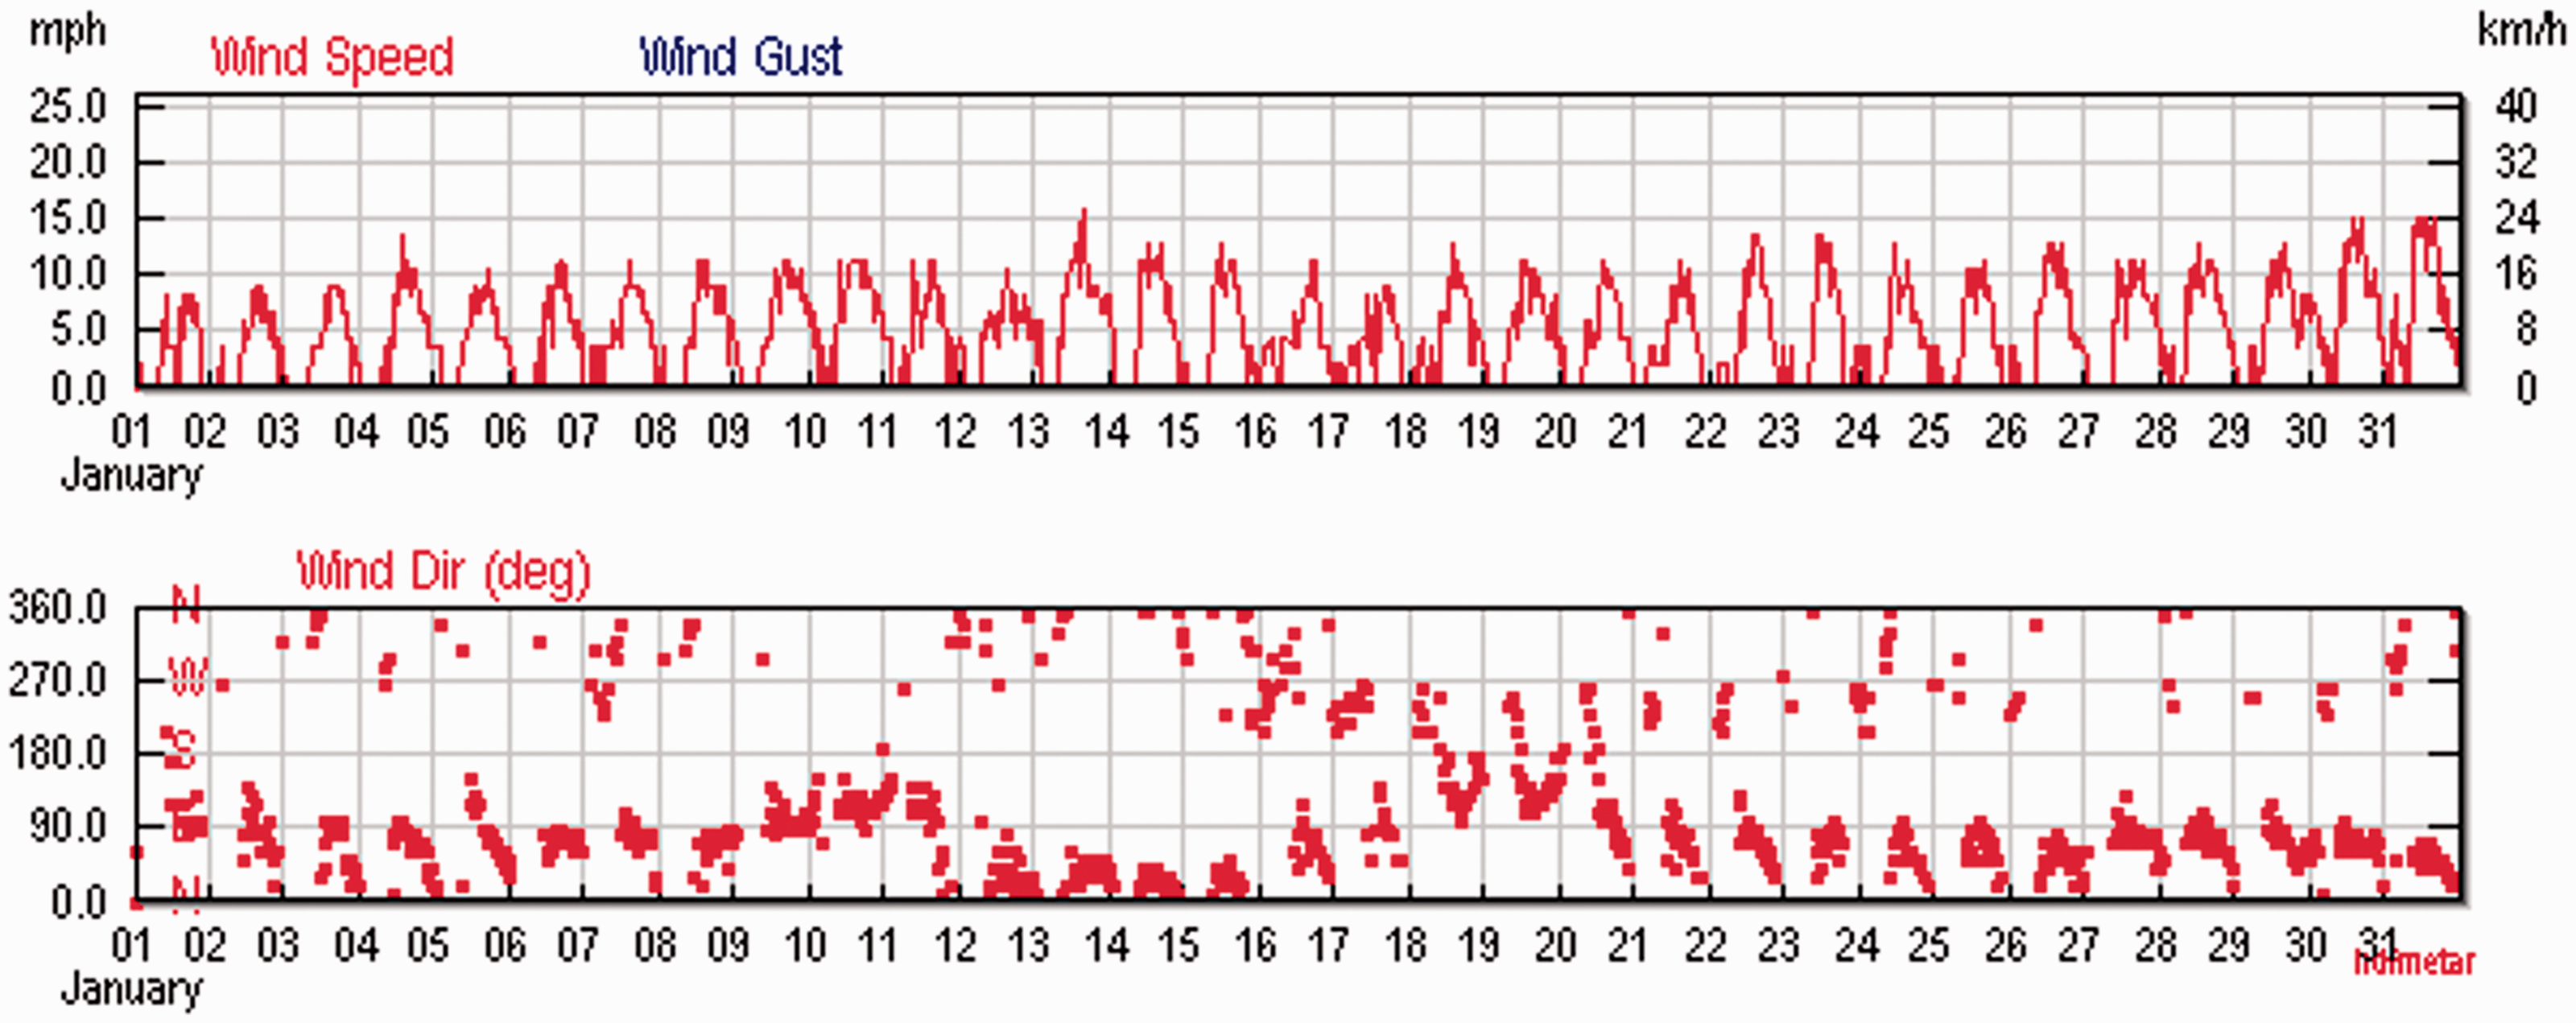
Sample wind gust and wind direction for the year 2012.
Estimation of Weibull parameters
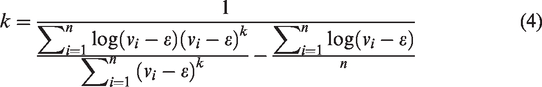
Several attempts have been made by different scientists at different locations for the determination of Weibull parameters. Reckoning the parameters of the selected distribution using data samples is termed as the parameter estimation. Wind distribution, used to model wind speed distribution at a particular location in turn helps in the assessment of wind resource at that location. The key to compute wind turbine and wind farm energy is to calculate the shape and scale parameters for Weibull distribution, which also gives us the wind speed frequency curve. Several methods for the estimation of parameters are available. This was detailed by Bassyouni et al.’s (2015) article. The frequently used methods to determine Weibull parameters available in literary sources are maximum likelihood method (MLM), least squares method (LSM), and moment method (MM). This chapter aims at selecting an accurate method to estimate the Weibull parameters at Ennore station for reducing uncertainties related to the calculation of wind energy output from any wind energy conversion systems.
Maximum likelihood method
The maximum likelihood method may be a mathematical expression referred to as a chance perform of the wind speed knowledge in the statistics format. It was used by Alexandre et al. (2012) in their study for the estimation of parameters of the Weibull wind speed distribution for wind energy’s utilization. The MLM is solved through numerical iterations to determine the parameters of the Weibull distribution. The method of maximum likelihood was used by several researchers, since it had very desirable properties.

The shape factor k and the scale factor c are estimated using an iterative procedure (
Least squares method
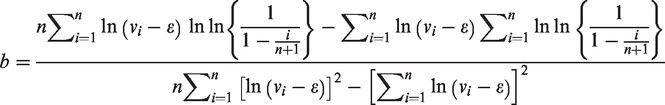
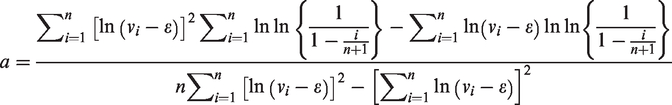
The least squares method, standing second in line has found a high frequency of applications in Engineering and Mathematics. Wind speed data represented in a cumulative frequency distribution would satisfy the requirement of this method. In this distribution method, the wind speed data are interpolated by a straight line, using the concept of least squares regression (Dieudonne et al., 2014).
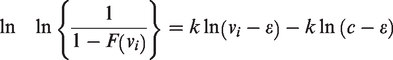
The above is a linear equation where
Rewriting the above equation as 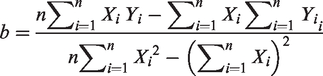
Therefore
Moment method
Moment method is a common technique used in the field of parameter determination. The Weibull factors k and c for this method are estimated from the mean wind speed 
Statistical tests
Statistical tests are used to measure the deviation between the predicted data using theoretical probability function and the observed data. Here, two statistical tests namely root mean square error (RMSE) and R2 test are considered as judgment criteria to evaluate the fitness of probability density function. Statistical tests are discussed below, in order to evaluate the performance of the three-parameter Weibull distribution.
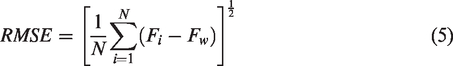
Root mean square error
RMSE is statistically defined as
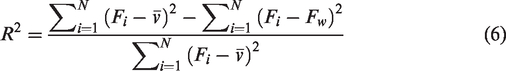
test
R2 is defined as
Discussions
The recorded wind speed data at Ennore station are fitted to the three-parameter Weibull distribution. The parameters involved in the distributions are estimated by the methods described in the previous sections, and the validity of the methods was verified using statistical methods. Using equations (5) and (6), the values of statistical tests of the two distributions are determined and listed in Table 2. The Weibull shape parameter k, indicates the breadth of a distribution of wind speeds and a lower k values, indicate that wind tends to vary over a large range of speeds while higher k values correspond to wind speeds staying within a narrow range. Here, k values range from 1.6281 to 2.7541 for the three-parameter Weibull distribution (Sarkar et al., 2011).
Estimated values of k and c and statistical analysis.
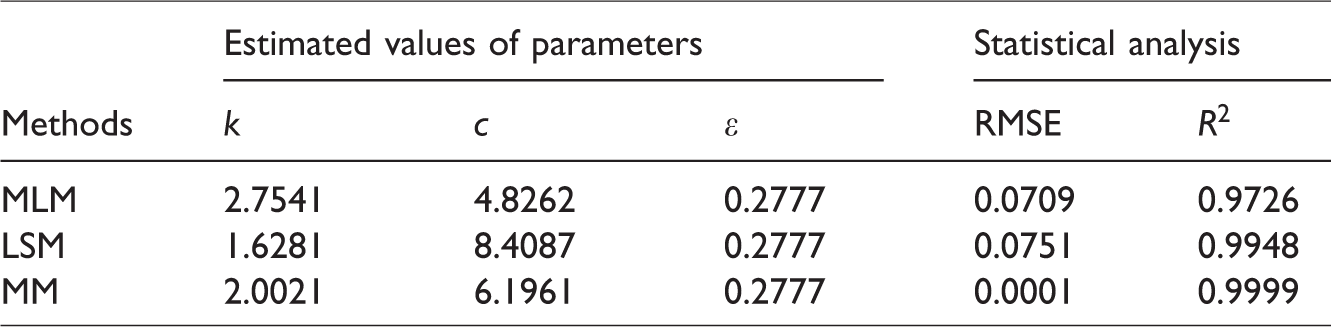
On the other hand, the Weibull scale parameter c, shows how “windy” a location is or, in other words, how high the annual mean wind speed is. Here, c values range from 4.8262 to 8.4087 for the mean wind speed at Ennore station. The value of the minimum wind speed
Interestingly enough, while the MLM gives the least value of c, least squares method gives its highest value. Also, values obtained from the moment method for both k and c lie between that of these obtained from the other two methods. This can be referred to, from Table 2. The performances of the proposed three methods were tested using statistical tests namely, root mean square error and R2 test.
Successful estimate corresponds to low values of RMSE, while higher estimate reveal deviations. Since RMSE should be as close to zero as possible, it is inferred that for the available data, the results reveal that the best fitting Weibull distribution methods are ranked as follows with the moment method ranking first, least squares method second, and the MLM being the third (Piotr, 2017).
The most accurate parameter estimation’s output value of R2 is the highest. The highest value of R2 is one, while the lowest is zero. The statistical tests summarized in Table 2 shows that moment method has the highest value in R2 test, in comparison with other two methods. From Figure 4, it is observed that the probability density curve by moment method is closer to the histogram of the wind speed data, where the other two estimation methods have slight deviation with the observed wind speed, which again confirms that MM performs better than the other methods. This is due to the variation in the k, c, and
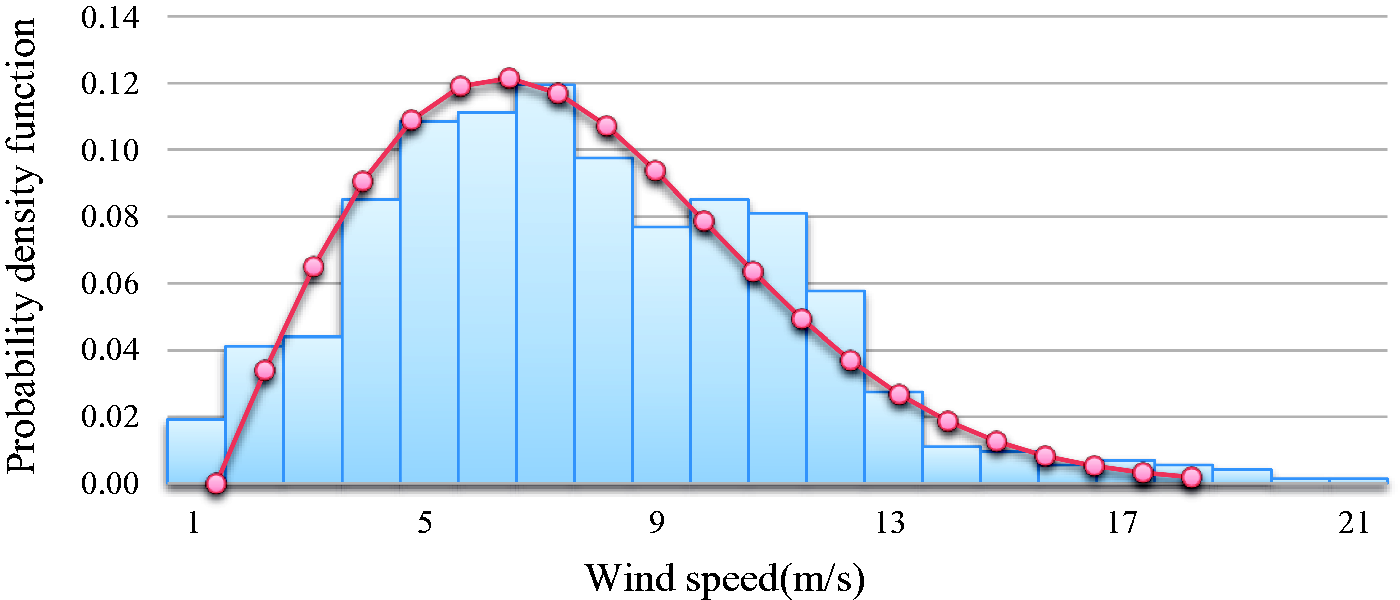
Three-parameter Weibull probability density function curve by the moment method and histogram of the observed wind speed.
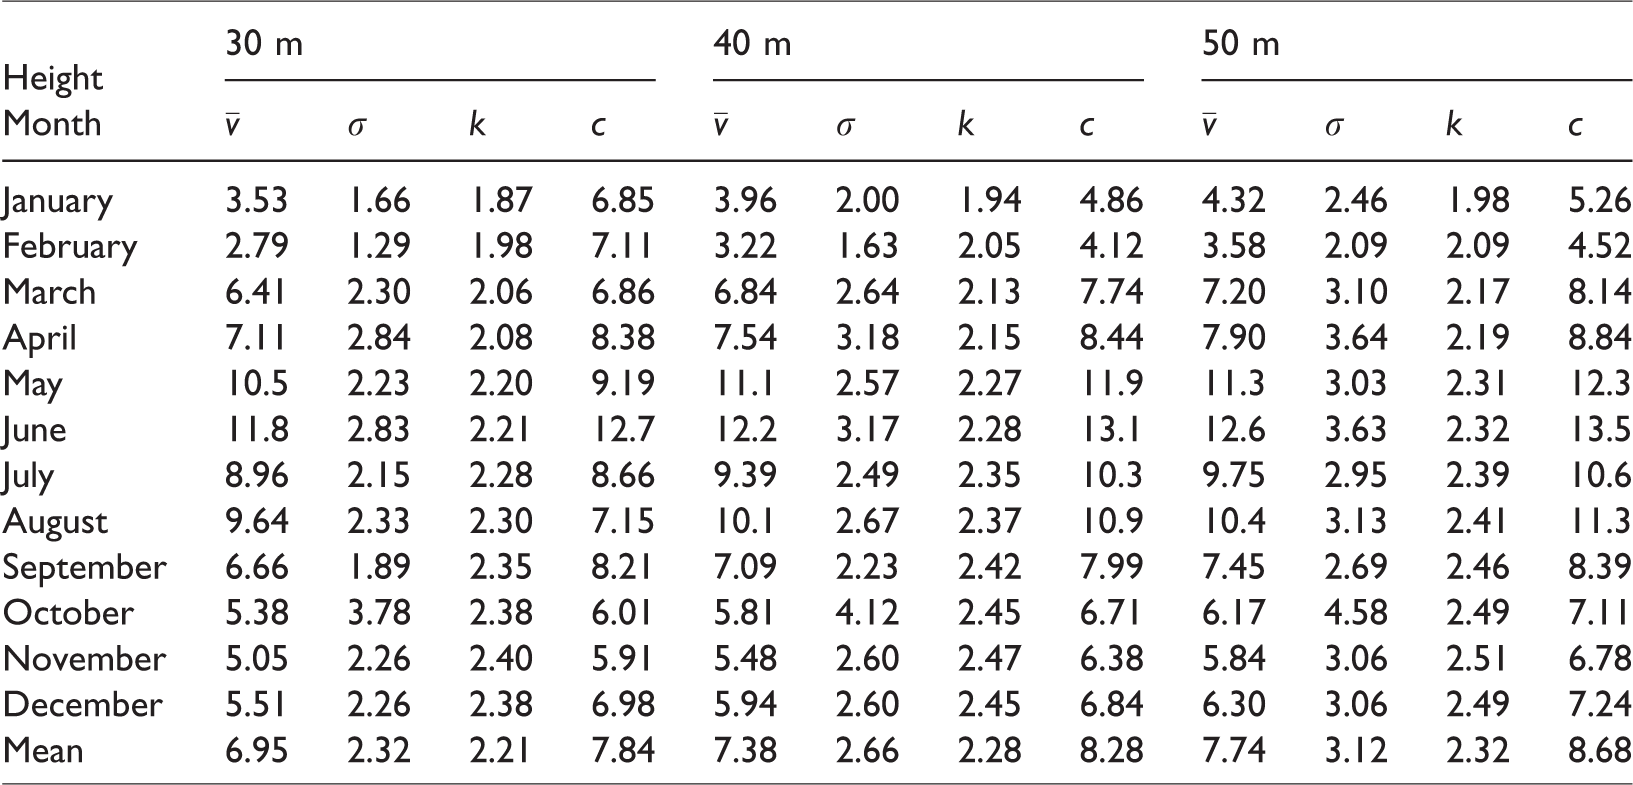
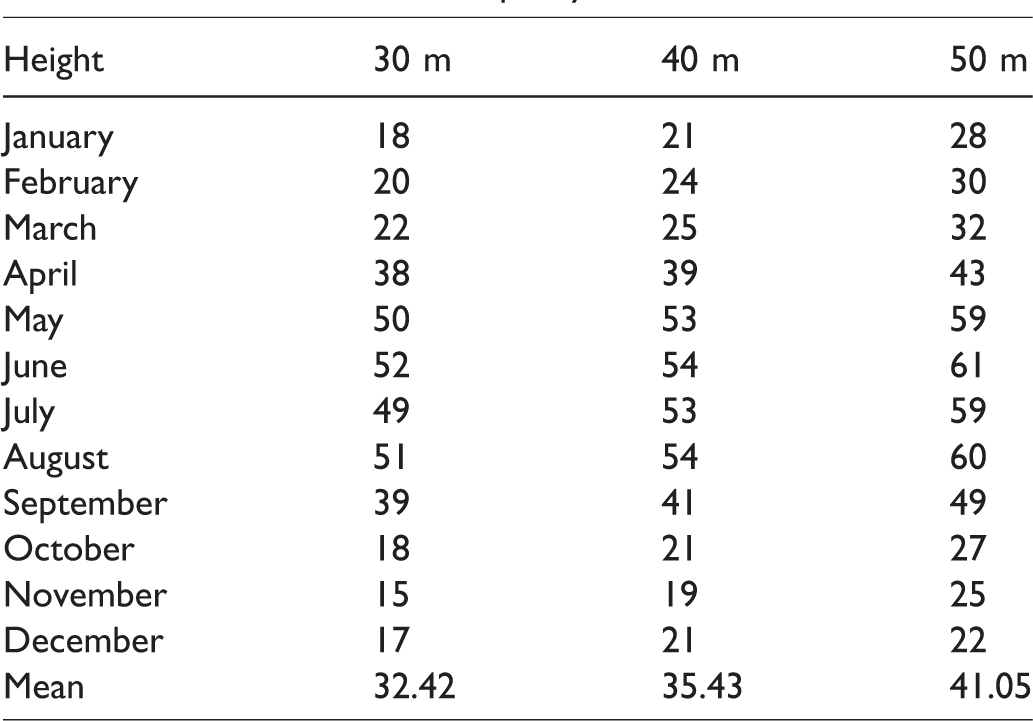
The above comparisons and discussions indicate that the moment method fits the three-parameter Weibull distribution more satisfactorily than the least squares method and the MLM. The focus is set on the moment method here from, to calculate the wind speed and Weibull parameters for hub heights 30 m, 40 m, and 50 m (Table 3). Figure 5 shows a comparison of the cumulative probability densities of the three-parameter Weibull distribution estimated by the MLM, least squares method, and moment method (Katinas et al., 2017).
Wind speed, standard deviation, and Weibull parameters for different hub heights.
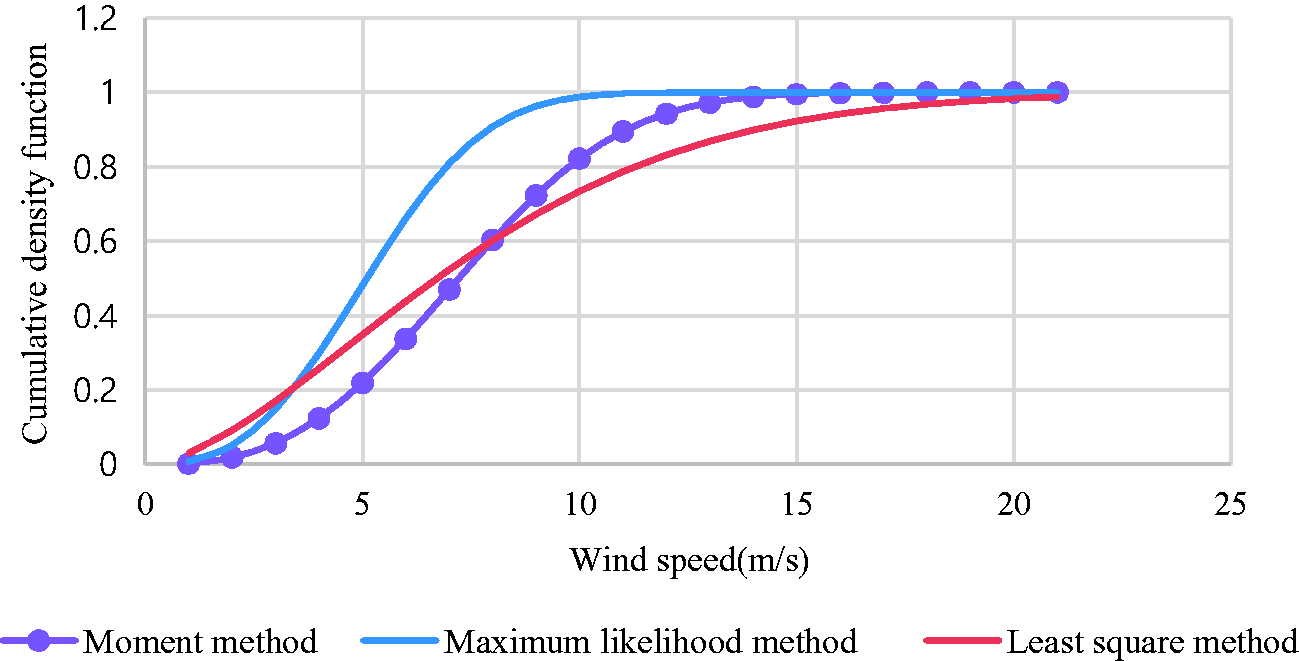
Comparison between the estimated cumulative density function by maximum likelihood method, least squares method, and moment method for the three-parameter Weibull distribution for the observed wind speed.
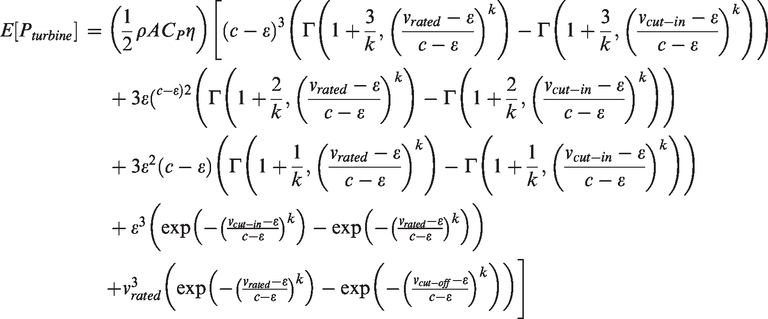
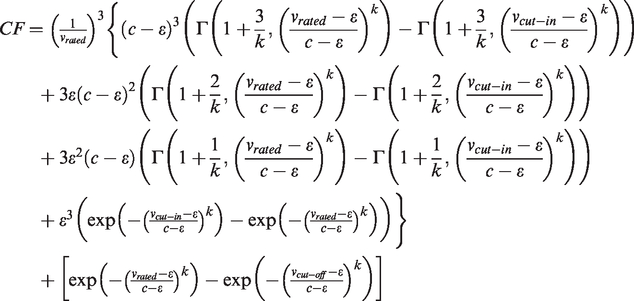
Estimation of capacity factor
The quantity of energy produced by a turbine depends on the characteristics of both the available wind speed at the site and the turbine’s power–performance curve. Power systems are planned in such a way that they have the required energy generation capacity to meet the load, according to a defined reliability target. The increase in wind power generation in recent years has led to a number of challenges in planning and operation of power systems (Shonhiwa and Mukumba, 2015).
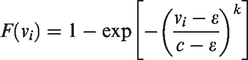
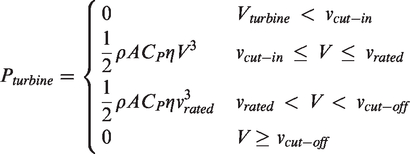
As discussed by Chang (2011), wind speed at a potential wind project site is characterized by the parameters of the Weibull probability distribution function. The turbine’s power–performance curve can be described by three parameters namely, the cut-in, rated, and the cut-off speeds. The cut-in speed is the speed in which the turbine starts to rotate and generate power. The wind speed at which it reaches the limit is called the rated output wind speed. The wind speed at which the wind turbine shuts down is called the cut-off speed.
Probabilistic model of wind turbine output power
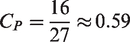
A wind turbine converts the totality of the kinetic energy of wind into mechanical energy. There exists a technical limit to the amount of kinetic energy the Betz turbine can extract from the wind. This quantity
Estimation of capacity factor
Estimated values of capacity factor.
Economic analysis
Economic issues of wind energy systems are common nowadays. Unit cost of electricity produced by a wind turbine is affected by several factors. Economic merit of a wind powered generation plant depends on local conditions, which may vary from place to place. The economic assessment is essential while investing huge amount in the installation of utility scale wind turbines for wind power generation. At initial stage, the site-specific wind characteristic analysis is carried out and then selection of wind turbines is examined while considering the mechanical configuration of turbine suited to the site. When the capital investment is high while assessing the initial investment for the project, investment for essential requirements like land, transmission lines, power conditioning systems should also be accounted for a wind turbine. The estimation of the present value cost analysis based on net present value is as described in the following section (Hulio et al., 2017).
Let the initial investment of the project be Iv and the operation and maintenance cost be Mc, which is p% of the initial investment. Let DOM be the discounted costs of operation and maintenance costs for lifetime t of the wind turbine for an initial year
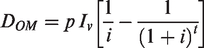
The net present value of all costs including the initial investment Iv is
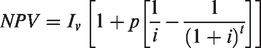
Therefore, yearly cost of operation for the turbine is
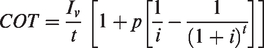
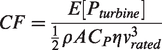
If Pr is the rated power of the turbine and CF is the capacity factor, the energy generated (EI) by the turbine in a year is
Thus, the cost of 1 kWh wind generated electricity is given by
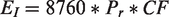
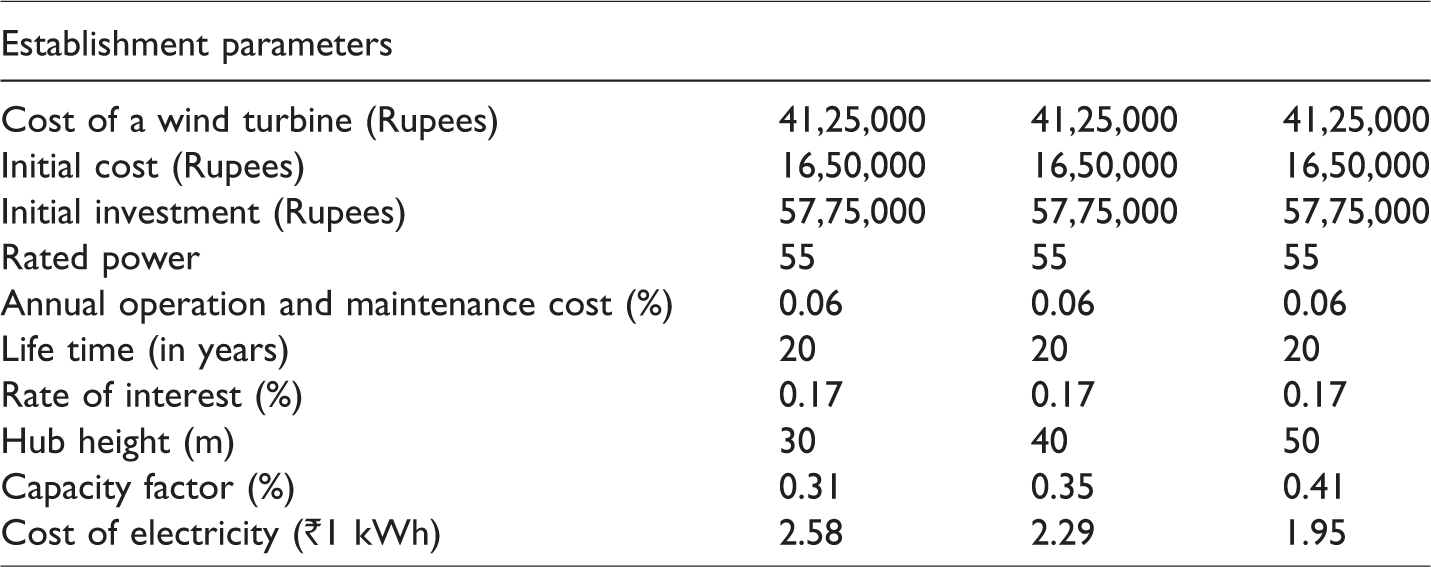
Here, the installation cost is taken as 40% of the turbine cost. Also, the custom fee, operation and the annual maintenance cost is taken as 6% of the wind turbine cost. The estimated wind turbine life is considered as 20 years and a real interest rate of 17%. The wind turbine has been selected with 55 kW and analyzed, according to their technical specification. Table 5 summarizes the technical specifications of the chosen turbine with rated power of 55 kW and hub heights 30 m, 40 m, and 50 m.
Technical specifications.
Presently, the Government of Tamil Nadu is selling electricity at the rate ₹3/kWh to people. Based upon the above calculations, at 50 m height the cost of 1 kWh is ₹1.95 in which the power can be supplied for icebox, washer, water pump, TV, lighting, electric fan, charger, and air condition for small houses. The cost ₹3 for 1 kWh, which is ₹0.42, ₹0.71, and ₹1.05 per kWh is more than the market price at 30 m, 40 m, and 50 m height, respectively. It is concluded that the site has potential to install utility wind turbines to generate energy at the lowest cost per kilowatt-hour at a height of 50 m. According to the results, the wind turbine 55 kW is capable of producing wind energy at the lowest value of ₹1.95/kWh at hub height 50 m as given in Table 6.
Economic analysis.
Conclusion
The computation of wind resources is leading a portfolio of wind farm projects that will help the industry understand how to dependably integrate large quantities of wind energy into system operations, as well as to advance capabilities that will enable these new wind installation systems to actively improve the quality of electric grids. In a long-term perspective, research and development can be undoubtedly depended on, to increase on-shore technical potential. To decide if an investment is to be made for a planned wind plant, it takes the assistance of the wind speed data of that region. Therefore, the wind distribution of the said region is analyzed for many years. Since wind speed is a variable factor, it is expected to fit a probability distribution, for which the distribution to which the wind speed fits is investigated.
Innumerable studies from around the world have made sure that the two-parameter Weibull distribution gives a good fit to wind data for wind energy applications. However, at some specific locations, the wind regime is in such a way that it demands the use of the three-parameter Weibull probability density function, since the use of the two-parameter Weibull distribution would yield highly uncertain results. In this study, wind characteristics and the wind energy potential of the Ennore region is investigated. For that the wind data of Ennore from January to December 2012 and 2013 are to be collected and sorted in sequence in appropriate frequency.
Wind energy conversion systems are important for assessing any wind project. The generated power can be supplied to plants, schools, or community houses using a power inverter and electrical meter, which will change the type of current to alternating current. The accurate estimation of capacity factor assists the manufacturer in installing wind turbines with the appropriate capacity factor. Overestimating or underestimating the capacity factor may lead to a serious economic cataclysm for the person installing wind turbines in a farm under lease.
The economic analysis is examined for different hub heights with a turbine capacity of 55 kW. Based on the net present value analysis, it is found that the cost of 1 kWh electricity ranges between ₹1.95 and ₹2.58, with various percent yearly net real rates of return in 20 years, which depends on the location. Consequently, this wind farm project is suitable and feasible for further consideration. These calculations are of utmost importance at the time of installation of turbines. As said earlier, it was declared that the power gained at this site would not be sufficient and hence, the generation of wind power was dropped at Ennore. The government has thus underestimated the capacity factor of the Ennore station and stopped wind monitoring at that location after the period 1992–1995. This underestimation leads to a loss in the production of power. It is concluded that the site has potential to install utility wind turbines to generate energy at the lowest cost of ₹1.95 per kWh at a height of 50 m.
Footnotes
Declaration of conflicting interests
The author(s) declared no potential conflicts of interest with respect to the research, authorship, and/or publication of this article.
Funding
The author(s) disclosed receipt of the following financial support for the research, authorship, and/or publication of this article: This research is supported by Modelling and simulation laboratory of Nano Science and Technology and Research Centre of Sri Ramakrishna Engineering College, Coimbatore, India.