
Abstract
Continuous probability distributions have long been used to model the wind data. No single distribution can be declared accurate for all locations. Therefore, a comparison of different distributions before actual wind resource assessment should be carried out. Current work focuses on the application of three probability distributions, i.e. Weibull, Rayleigh, and lognormal for wind resource estimation at six sites along the coastal belt of Pakistan. Four years’ (2015–2018) wind data measured each 60-minutes at 50 m height for six locations were collected from Pakistan Meteorological Department. Comparison of these distributions was done based on coefficient of determination (R2), root mean square error, and mean absolute percentage deviation. Comparison showed that Weibull distribution is the most accurate followed by lognormal and Rayleigh, respectively. Wind power density (PD) was evaluated and it was found that Karachi has the highest wind speed and PD as 5.82 m/s and 162.69 W/m2, respectively, while Jiwani has the lowest wind speed and PD as 4.62 m/s and 76.76 W/m2, respectively. Furthermore, feasibility of annual energy production (AEP) was determined using six turbines. It was found that Vestas V42 shows the worst performance while Bonus 1300/62 is the best with respect to annual energy production and Bonus 600/44 is the most economical. Finally, sensitivity analysis was carried out.
Keywords
Introduction
In view of energy crisis, limited fossil fuel reserves, and deteriorated environmental impacts owing to the usage of fossil fuels (Sumair et al., 2020b; Baloch et al., 2016; Shoaib et al., 2017), harnessing of clean and renewable energy sources (RESs) is the need of hour. Wind energy is one of those (Valinejad et al., 2018). Pakistan, being an energy deficit country, is progressing in wind energy utilization (Shakeel et al., 2016). As Government of Pakistan (GOP) develops a plan to meet 30% of its total energy by RESs by 2030 (out of which 5% share is planned to be obtained by wind) (WWEA, 2019), therefore, there is a need to develop wind power projects, especially in those areas of the country where there is appreciable wind potential and land available for the development of wind farms.
In Pakistan, according to statistical studies conducted by Pakistan Meteorological Department (PMD), Alternative Energy Development Board (AEDB), and National Renewable Energy Laboratory, total theoretical installable wind power capacity is about 346 GW (Sumair et al., 2020a; Aized et al., 2019; Bhutto et al., 2013). To utilize this huge wind potential, site-specific wind resource assessment (WRA) is crucial. Wind potential of some sites in Pakistan has been investigated so far. A wind potential of Nooriabad (Pakistan) was determined (Hulio et al., 2017) using Weibull and Rayleigh distribution and comparison showed that Weibull is better than Rayleigh.
Similarly, wind potential at Jhimpir (Sindh, Pakistan) was determined (Shoaib et al., 2019) using Weibull distribution which was found to be significantly accurate by calculating R squared (R2).
Wind potential at Hawke’s Bay was estimated (Hulio et al., 2019b) with the help of Weibull distribution with various estimation methods and site was found to have good potential with power density values of 307.5 W/m2 at 80 m height.
Wind energy investigation analysis of Baburband (Sindh, Pakistan) was performed by Khahro et al. (2014b). Wind power potential was found at four different mast heights using five different Weibull parameter estimation methods. Therefore, along with wind profile development, various numerical methods available for Weibull parameter estimation were also compared. Annual average wind speed at the considered site has been found as 6.71 m/s with WPD as 310 W/m2 at a hub height of 80 m. Seasonal variation was also observed. The maximum wind potential availability was observed from April to August with May having the peak values of WPD as 732 W/m2. Along with WRA, an economic survey was also performed to find the economic feasibility of installing wind turbines at that particular location. From this analysis, the probable cost per kW h of electrical energy produced was found as US$0.0262. Shoaib et al. (2017) also investigated Baburband and proved it to be a potential site.
Khahro et al. (2014a) compared the performance of different wind turbines at Gharo (Sindh, Pakistan). It was found that GE45.7 wind turbine is the most efficient turbine producing about 11.220 GW h per year with a capacity factor of 0.56. Moreover, economic analysis using these wind turbines was also carried out which showed that GE45.7 wind turbine produces kW h of energy at an estimated cost of US$0.0255.
Because of wind’s fluctuating nature, it is the dire need to model this widely varying wind data so that a confidence maybe established in the estimated energy generation. Two-parameter Weibull distribution is the most widely used distribution throughout the world to estimate wind potential with significant accuracy (Manwell et al., 2010; Rajapaksha and Perera, 2016). Many researchers used this distribution for WRA (Bilir et al., 2015; Khahro et al., 2014b; Shami et al., 2016). For some wind climates, Rayleigh distribution was found a better fit than Weibull distribution (Lackner et al., 2008).Comparison of four probability distributions, i.e. three-parameter Weibull distribution, two-parameter Weibull distribution, two-parameter gamma distribution, and two-parameter lognormal distribution, was made (Pobočíková et al., 2017) using wind data recorded at Dolny Hricov and it was found that three-parameter Weibull distribution is the best and gamma distribution is the worst in modeling wind data at that location. Similarly, Rajapaksha and Perera (2016) studied Weibull, gamma, and lognormal distribution along with the mixture of these distributions for wind potential estimation in Sri Lanka and found that mixture distributions gave better result than any of the single distribution.
According to an estimate, about 9.06% of Pakistan’s land area is suitable for wind energy utilization (Hulio et al., 2019a), with 43 GW theoretical potential existing in wind corridor of Pakistan (Shoaib et al., 2017). Coastal belt of Pakistan is one of those suitable areas which is planned to be utilized for wind power projects’ installation by GOP. The novelty of the work lies in estimating the wind potential of this coastal area which has been untouched so far. Significance of this work is twofold: first, it compares three probability distributions, i.e. two-parameter Weibull distribution, Rayleigh distribution, and lognormal distribution to model the wind data at all locations, and second it explores the wind potential of coastal belt of Pakistan using the best distribution found followed by economic feasibility analysis of wind energy harvesting.
Materials and methods
Site description and data collection
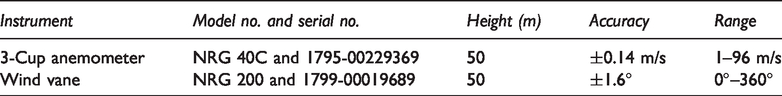
Gwadar (25.2460°N, 62.2861°E), Jiwani (25.0538°N, 61.7707°E), Pasni (25.2510°N, 63.4154°E), Ormara (25.2666°N, 64.6096°E), and Sonmiani bay (25.1689°N, 66.7248°E) are located in Balochistan and Karachi (24.8607°N, 67.0011°E) in Sindh. Wind data were recorded on 1 h interval basis. Technical specification of wind data measurement sensors is given in Table 1.
Technical specifications of wind data measuring instruments for all stations.
Methodology
Three probability distributions were compared to estimate wind potential along the coastal belt of Pakistan. Four years’ wind speed data measured at 50 m height and 1 h interval were used. The data were measured by PMD and AEDB using cup-anemometer. Parameters of Weibull and lognormal distributions were calculated using MLM. Comparison of these distributions was made based on correlation coefficient (R2), RMSE, and mean absolute percentage deviation (MAPD). Following the results of this comparison, the most accurate distribution was identified and techno-economic analysis of wind energy generation on six locations along coastal belt of Pakistan shown in Figure 1 was carried out using that distribution. Wind power density (PD) and annual energy production (AEP) using six different turbine models were estimated. To evaluate economic feasibility, payback period (PP) and unit cost of energy (Cunit) were estimated. Finally, a sensitivity analysis was carried out to investigate the effect of wind speed variation on other parameters.
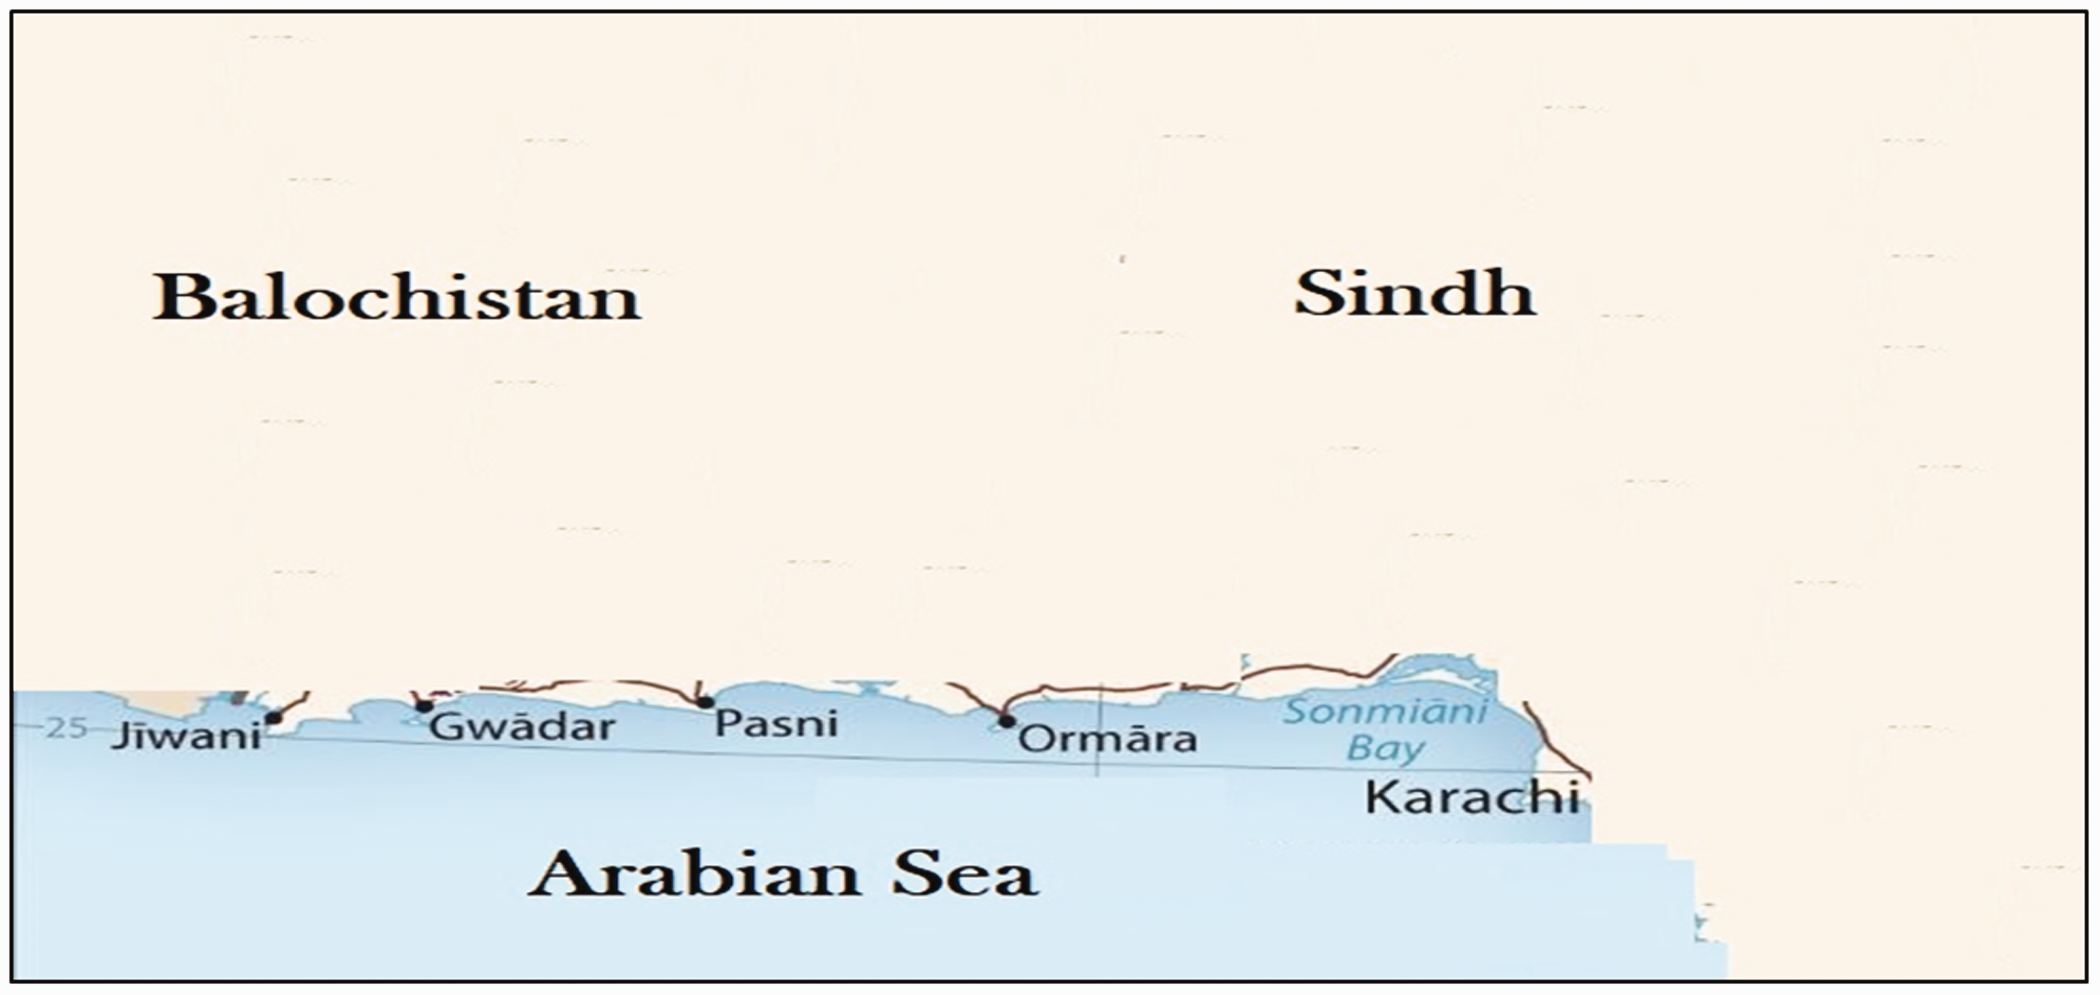
Coastal belt of Pakistan showing six representative locations.
A brief of mathematical treatment is given below.
Two-parameter Weibull distribution
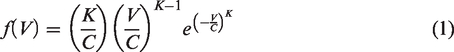
where
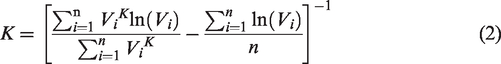
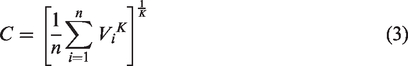
According to MLM, iterative solution of equations (2) and (3) leads to the estimation of Weibull shape and scale parameters (Chaurasiya et al., 2018; Khahro et al., 2014b; Shoaib et al., 2017)
Rayleigh distribution
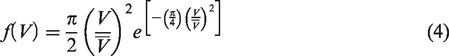
It is a special case of Weibull distribution (with K = 2 and scale parameter being equal the mean wind speed). With these modifications in equation (1), Rayleigh probability density function assumes the form given in equation (4)
Two-parameter lognormal distribution
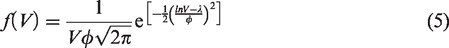
This distribution is based on the assumption that logarithmic of data assumes a normal (bell) distribution. According to this distribution, probability density function is given as follows (Pobočíková et al., 2017; Rajapaksha and Perera, 2016)
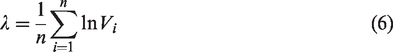
MLM estimates of λ and ϕ are given as follows
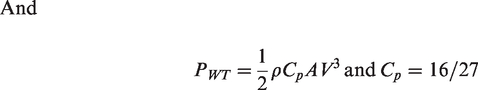
Wind power density (PD) is calculated using any probability density function as follows

Testing of goodness of fit
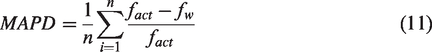
In order to measure the goodness of fit of three distributions to actual data, correlation coefficient (R2), RMSE, and MAPD were used. R2, RMSE, and MAPD were calculated using the following relationships, respectively
Z = mean of actual data
fact = actual wind probability
fw = wind probability from any distribution
AEP
AEP by a particular turbine depends not only on wind characteristics but also on turbine characteristics. As ideal conditions are never met, hence the actual power (Pact) produced by a turbine is less than PR. The ratio of Pact to PR is described as capacity factor (CF) given as equation (12)

To calculate AEP, it is required to estimate average wind power produced by a turbine at a specific wind speed (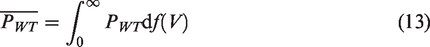
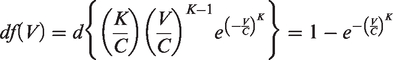
Putting in equation (13) and replacing integral sign with summation over N (number of bins), we get the following relationship for 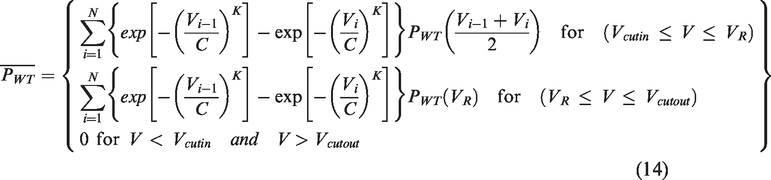
where Vcutin is the speed below which wind turbine would not extract any power from wind, VR is the rated speed at which a certain turbine would produce its rated power, and Vcutout is the speed at which turbine is shut down to prevent any structural damage.
AEP is finally evaluated using equation (15)

Economic feasibility analysis
Although wind energy harvesting does not require a continuous supply of fuel, yet huge initial investment (turbines’ purchase and installation, I) and operation and maintenance cost (Copm) is required. Today, most commercially available turbines cost from $1.3 to 2.2/W (Khahro et al., 2014a, 2014b; Windustry) ($1.5/W is assumed in this study). Unit cost (Cunit), being an important economic feasibility evaluation parameter is estimated using following relationship (Khahro et al., 2014a, 2014b)

Where net present worth is calculated using equation (17)
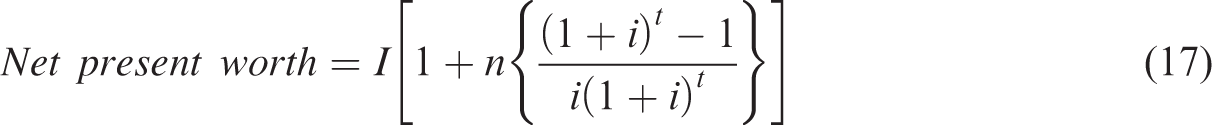
where I is total initial investment which is taken 1.3 times the cost of turbine, i is the interest rate (taken as 10%), n is the percentage of I which equals the operation and maintenance cost (taken as 15%), and t is the turbine life which has been assumed 20 years.
And

where PR is the rated power of turbine and CF is the annual capacity factor.
PP
The length of time (normally measured in years) required to recover the cost of an investment is termed as PP. It is given as follows

Results and discussions
Comparison of probability distributions
It is logical and necessary to estimate wind potential of untouched sites using pre-established methods. Parameters of Weibull, lognormal, and Rayleigh distribution have been calculated using MLM and listed in Tables 2 to 4, respectively. Comparison of these distributions has been carried out based on R2, RMSE, and MAPD and listed in Table 5. For the sake of in-depth comparison, these values have been listed up to five decimal points. Analysis of Table 5 shows that Weibull distribution is the best distribution followed by lognormal and Rayleigh, respectively, for all investigated locations. Probability distribution diagrams for all six locations have been shown in Figures 2 to 7, respectively.
Monthly calculated values of Weibull distribution parameters for six locations.

Monthly calculated values of lognormal distribution parameters for six locations.

Monthly calculated values of Rayleigh distribution (mean wind speed) parameters for six locations.
Comparison of three probability distributions based on R2, RMSE, and MAPD.
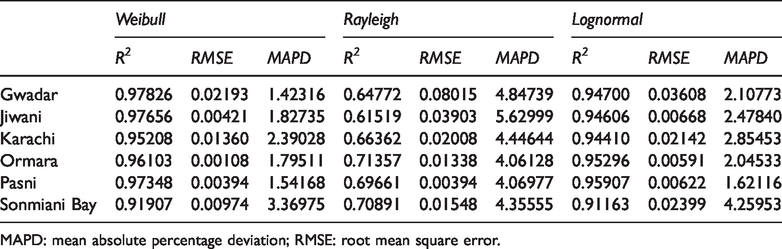
MAPD: mean absolute percentage deviation; RMSE: root mean square error.
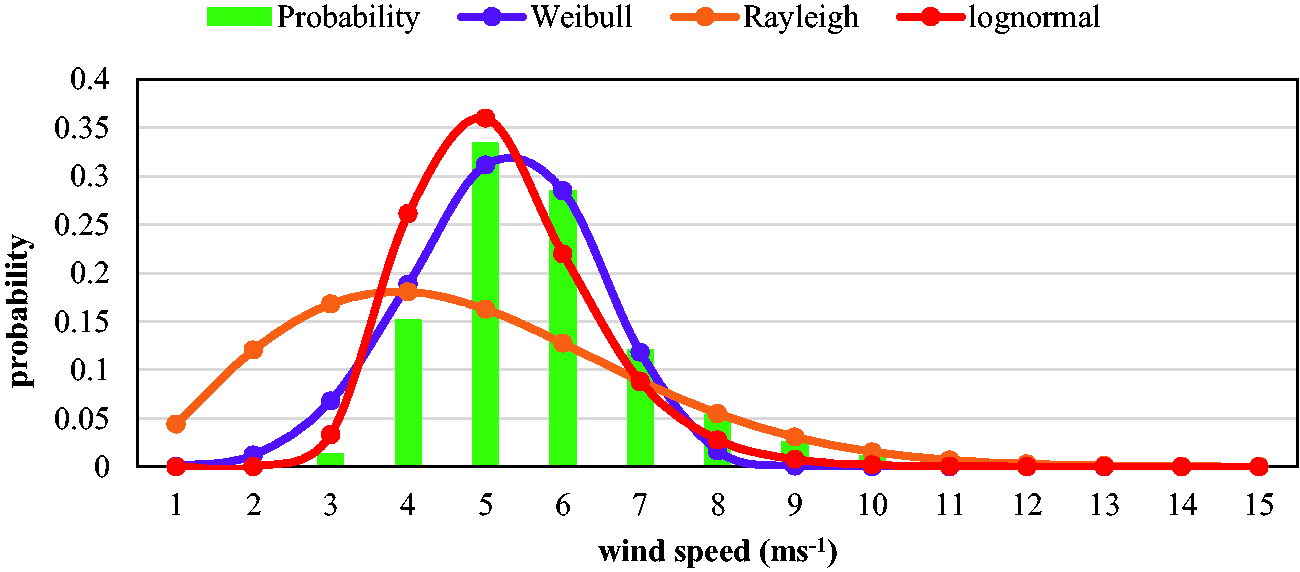
Comparison of three probability distributions at Gwadar.
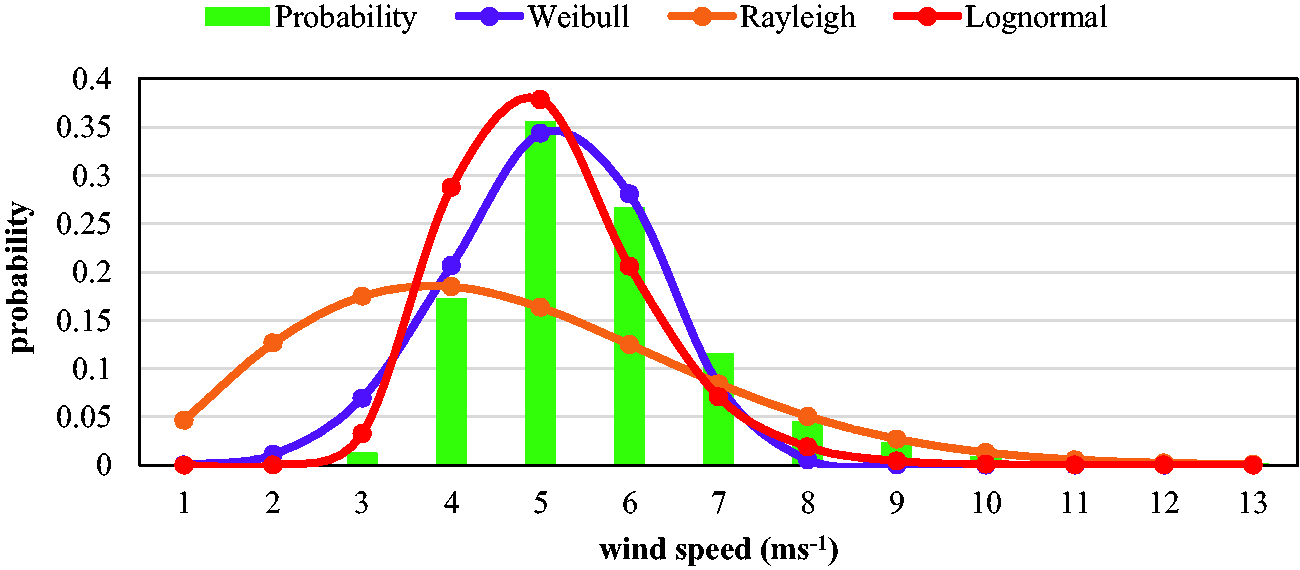
Comparison of three probability distributions at Jiwani.
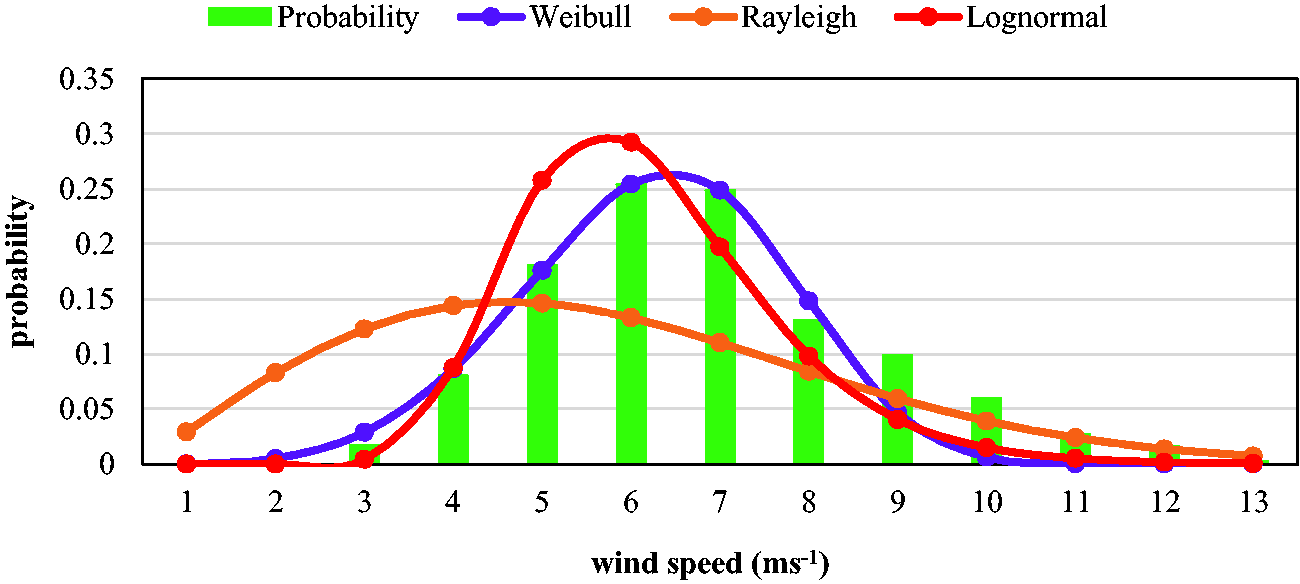
Comparison of three probability distributions at Karachi.
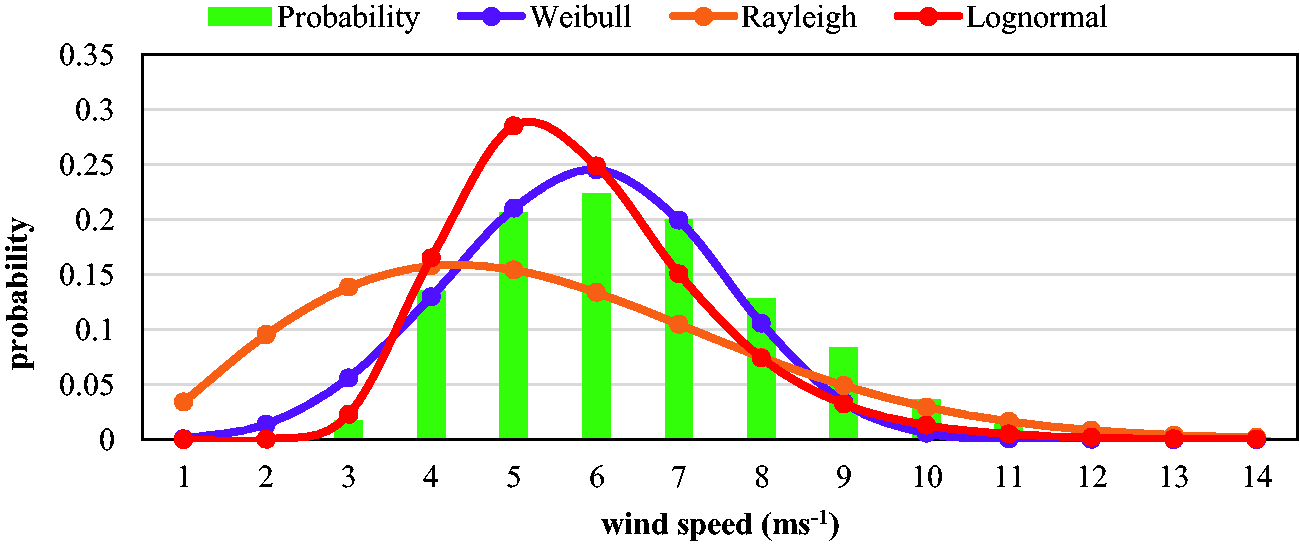
Comparison of three probability distributions at Ormara.
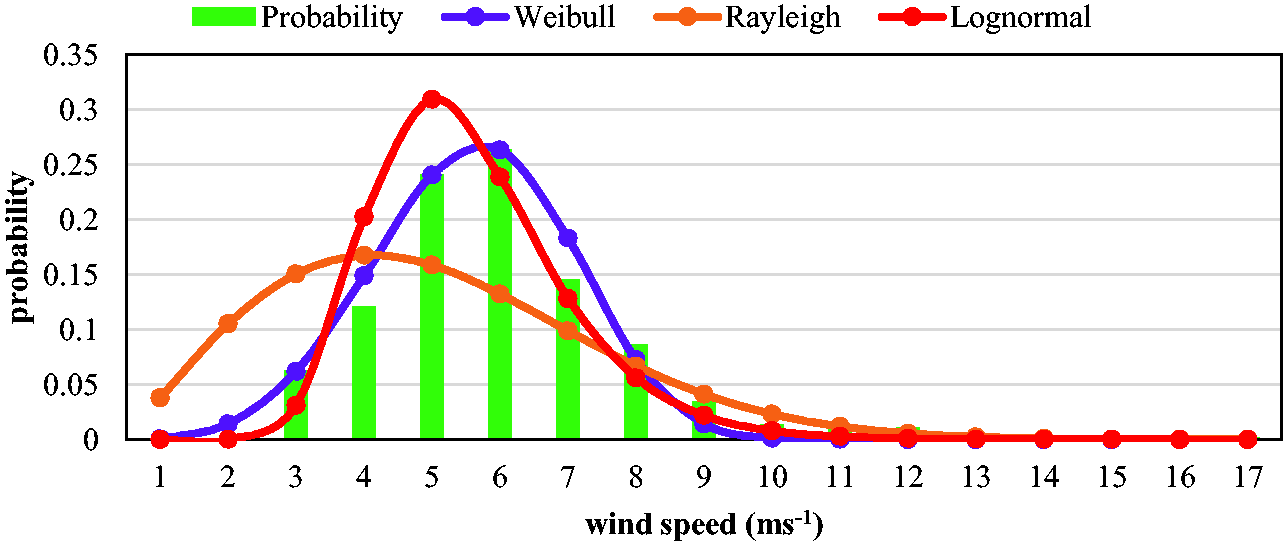
Comparison of three probability distributions at Pasni.
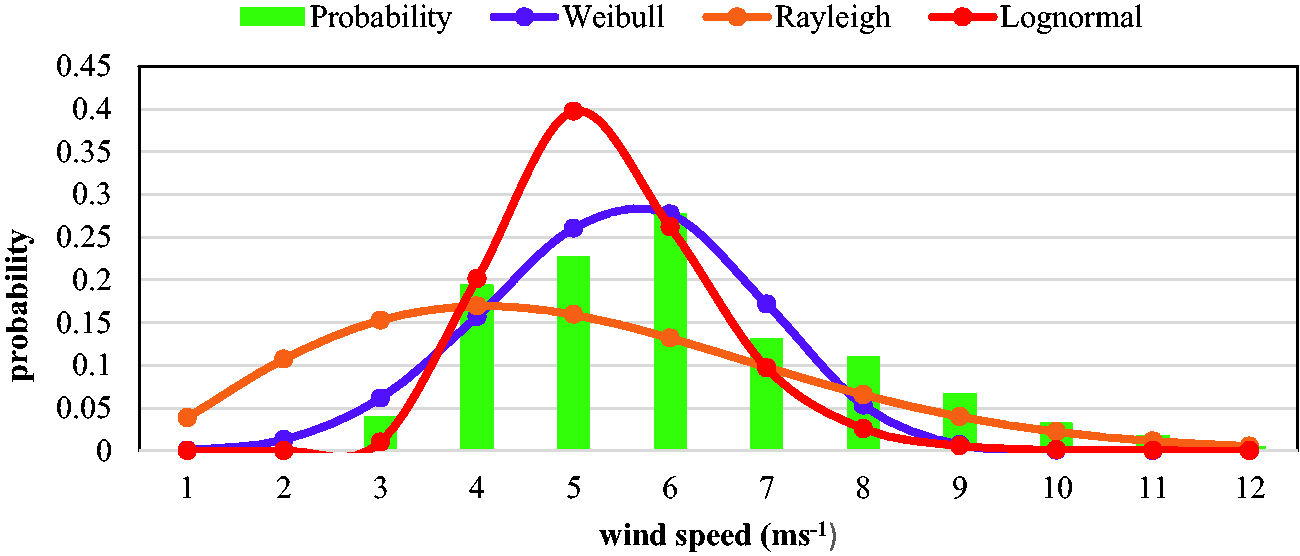
Comparison of three probability distributions at Sonmiani Bay.
Wind power potential
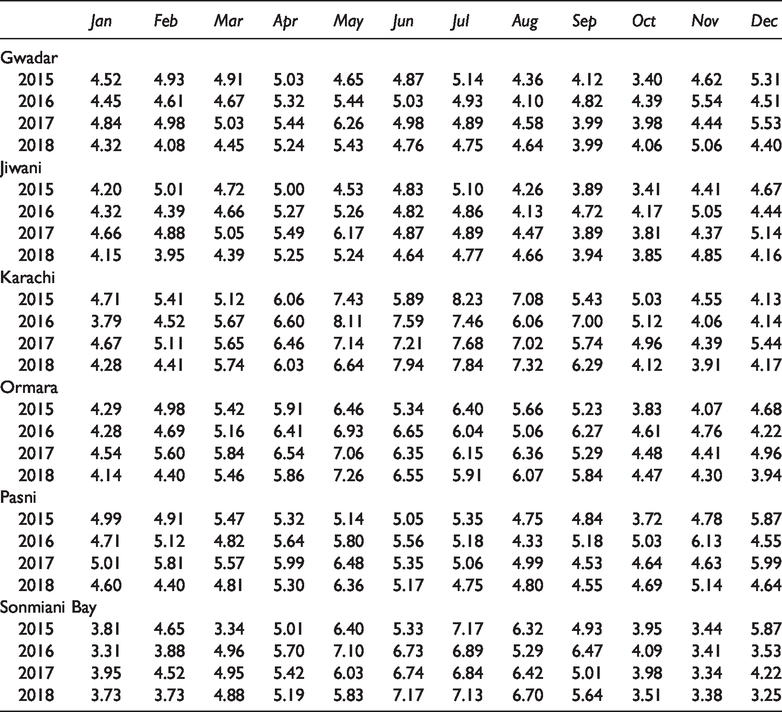
Monthly and annual average wind speed and wind power density (PD) at six locations have been listed in Tables 4 and 6 and shown graphically in Figures 8 to 11, respectively. Analysis shows that Karachi has the highest wind speed and wind power density (PD) followed by Ormara, Pasni, Sonmiani Bay, Gwadar, and Jiwani, respectively.
Monthly average wind power density (PD) values based on Weibull distribution for six locations.
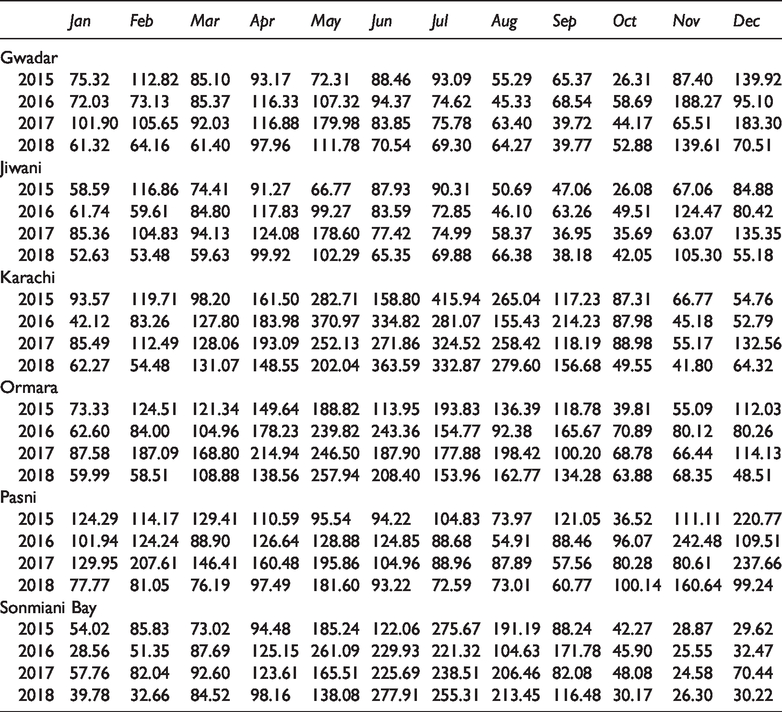
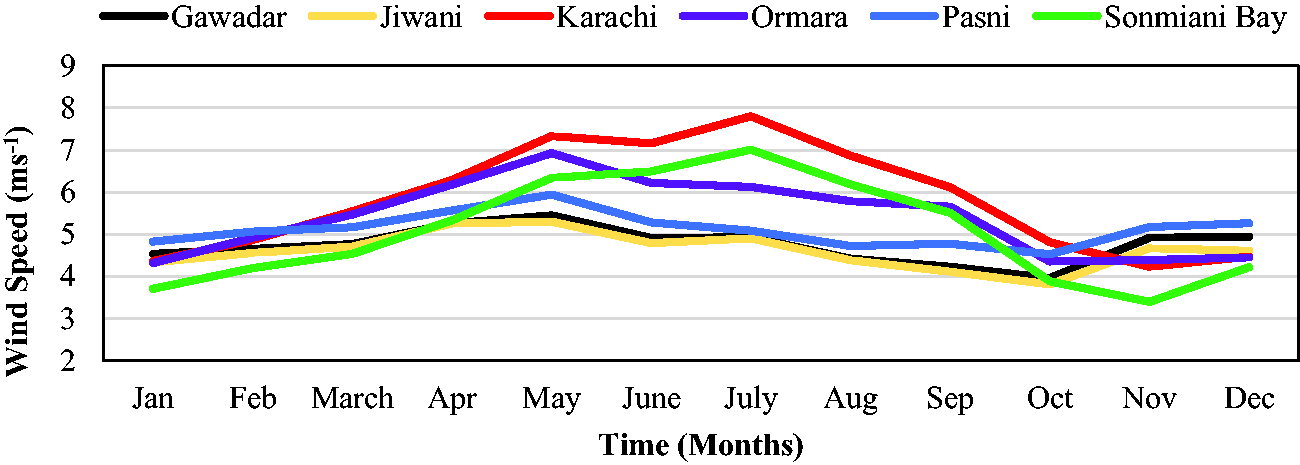
Four years’ monthly average wind speed at six locations.
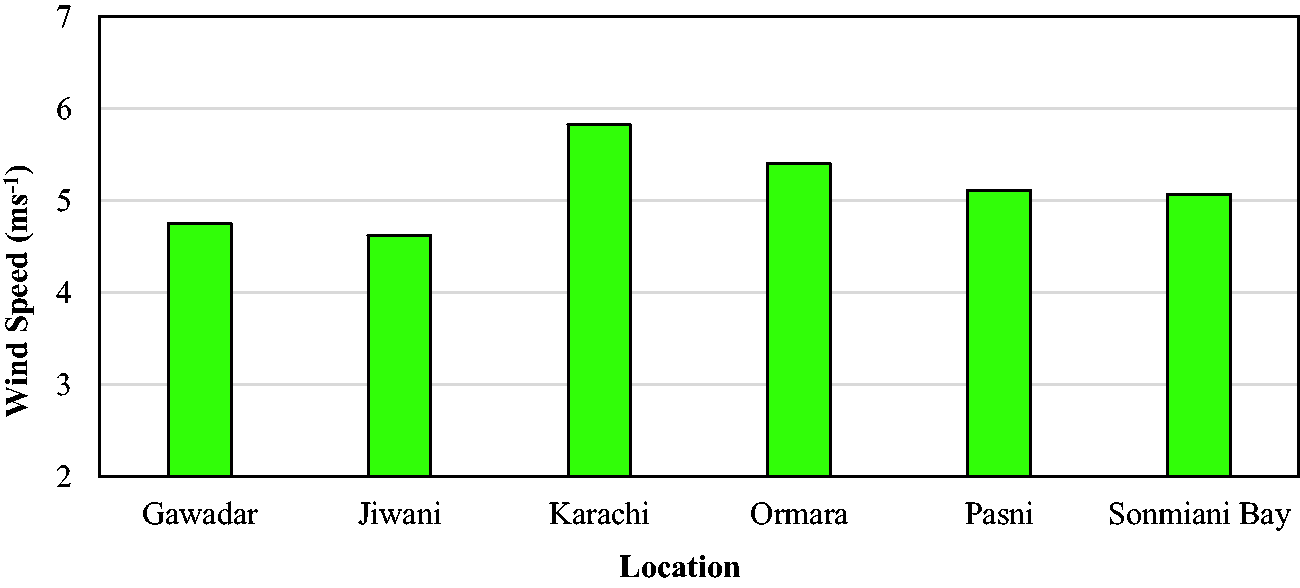
Four years’ average wind speed at six locations.
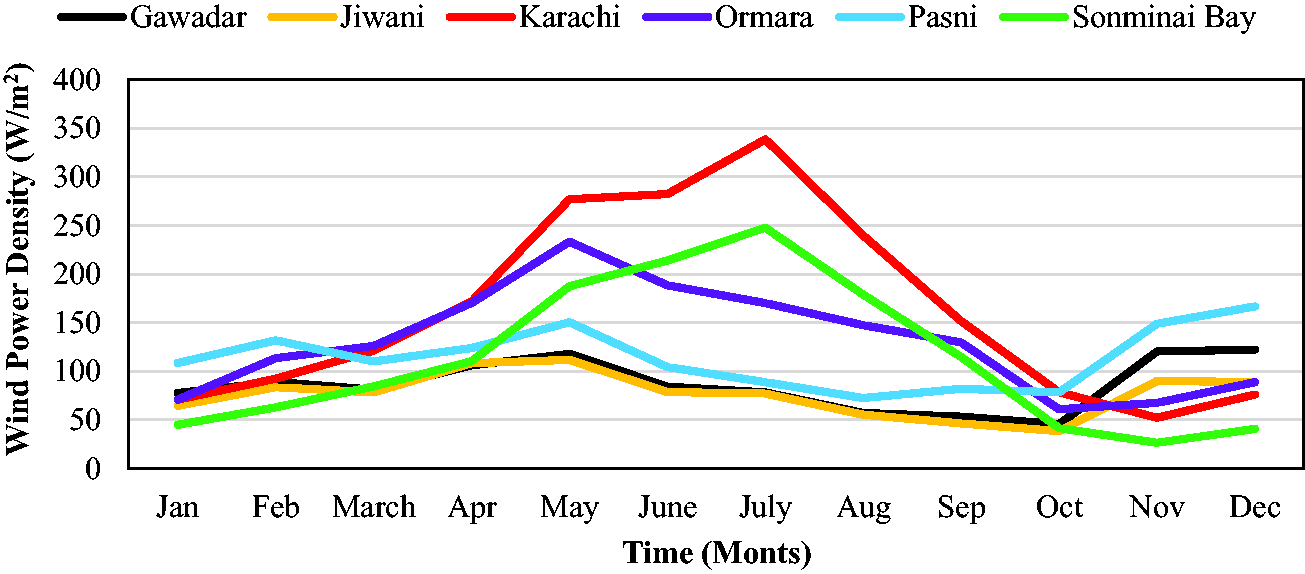
Four years’ monthly average wind power density at six locations.
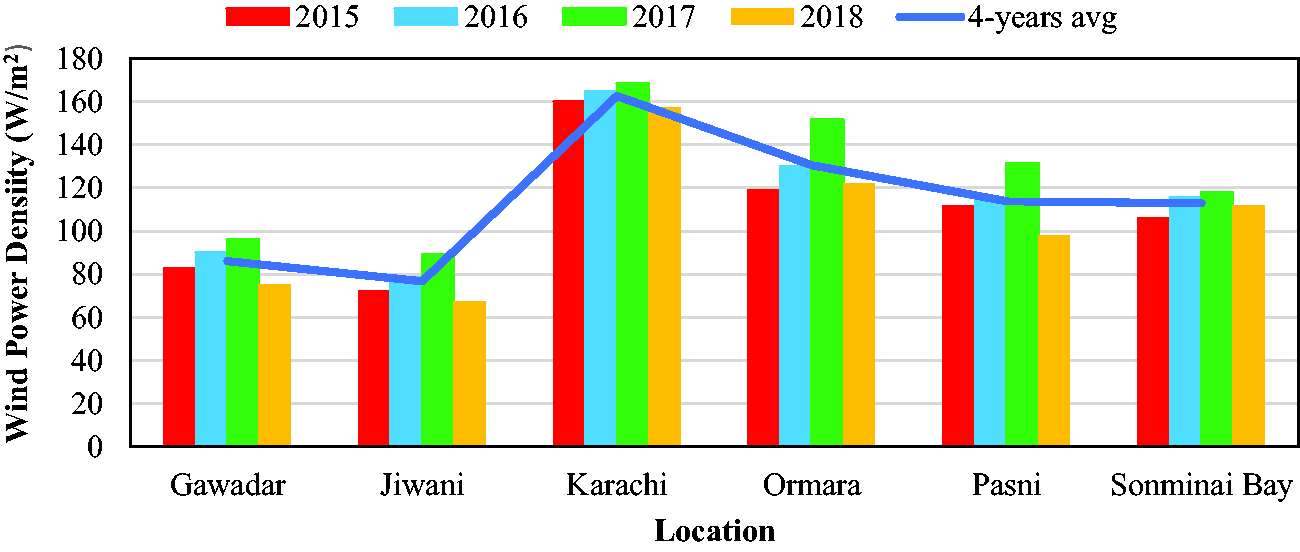
Four years’ average wind power density at six locations.
AEP analysis
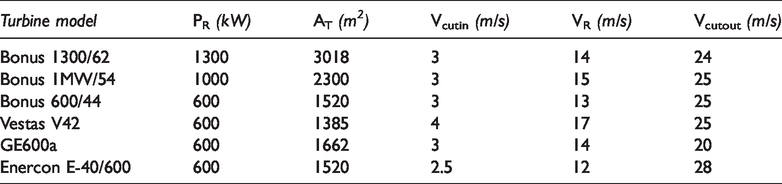
Using six turbine models (which are most commonly used in Pakistan and are available at same hub height as is used in this study, i.e. 50 m, following the guidelines of ICE) listed in Table 7, AEP has been estimated along with capacity factors (CF) evaluation and listed in Table 8. It has been found that Bonus 1300/62 produces maximum AEP at Karachi while Vestas V42 produces the minimum at Jiwani. On the other side, GE600a model has the highest CF at Karachi while Vestas V42 has the lowest at Jiwani.
Specifications of various turbine models commonly used in Pakistan.
AEP and CF evaluation using six turbine models at six investigated locations.
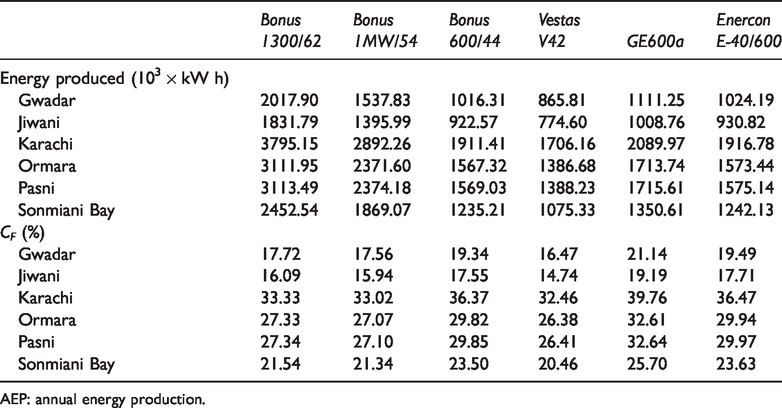
AEP: annual energy production.
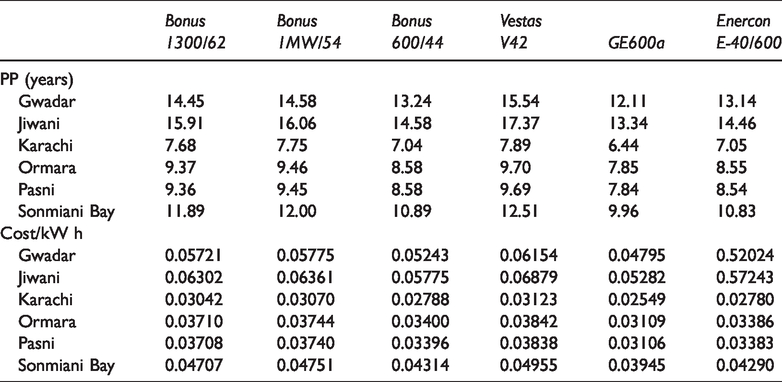
Economic assessment
An economic analysis of energy production has been carried out and listed in Table 9. Unit cost of energy (Cunit) and PPs were evaluated. It has been found that minimum PP is at Karachi with Bonus 1300/62 while maximum is observed at Jiwani with Vestas V42. This is so as Bonus 1300/62 produces the highest annual energy among all and Vestas V42 produces the least. Similarly, Cunit is minimum for Karachi with GE600a as this turbine has the highest CF and maximum at Jiwani with Vestas V42 as this model produces the lowest energy and has lowest CF.
Economic feasibility analysis with the estimation of payback period (PP) and unit cost of energy (Cunit).
Wind direction
Because of wind’s characteristic fluctuating nature, not only its magnitude but also its direction varies continuously. Wind turbine will capture maximum energy from wind if it is installed in such a way that its blades are facing the incoming wind. Therefore, it is necessary to determine optimum direction at each location before installing a wind turbine. Wind roses drawn for each of six investigated locations have been shown in Figure 12 which shows the percentage of time per year the wind blows in particular direction. It has been observed that at all locations wind mainly blows ranging from southwest (SW) to west (W), i.e. 225° to 280°.
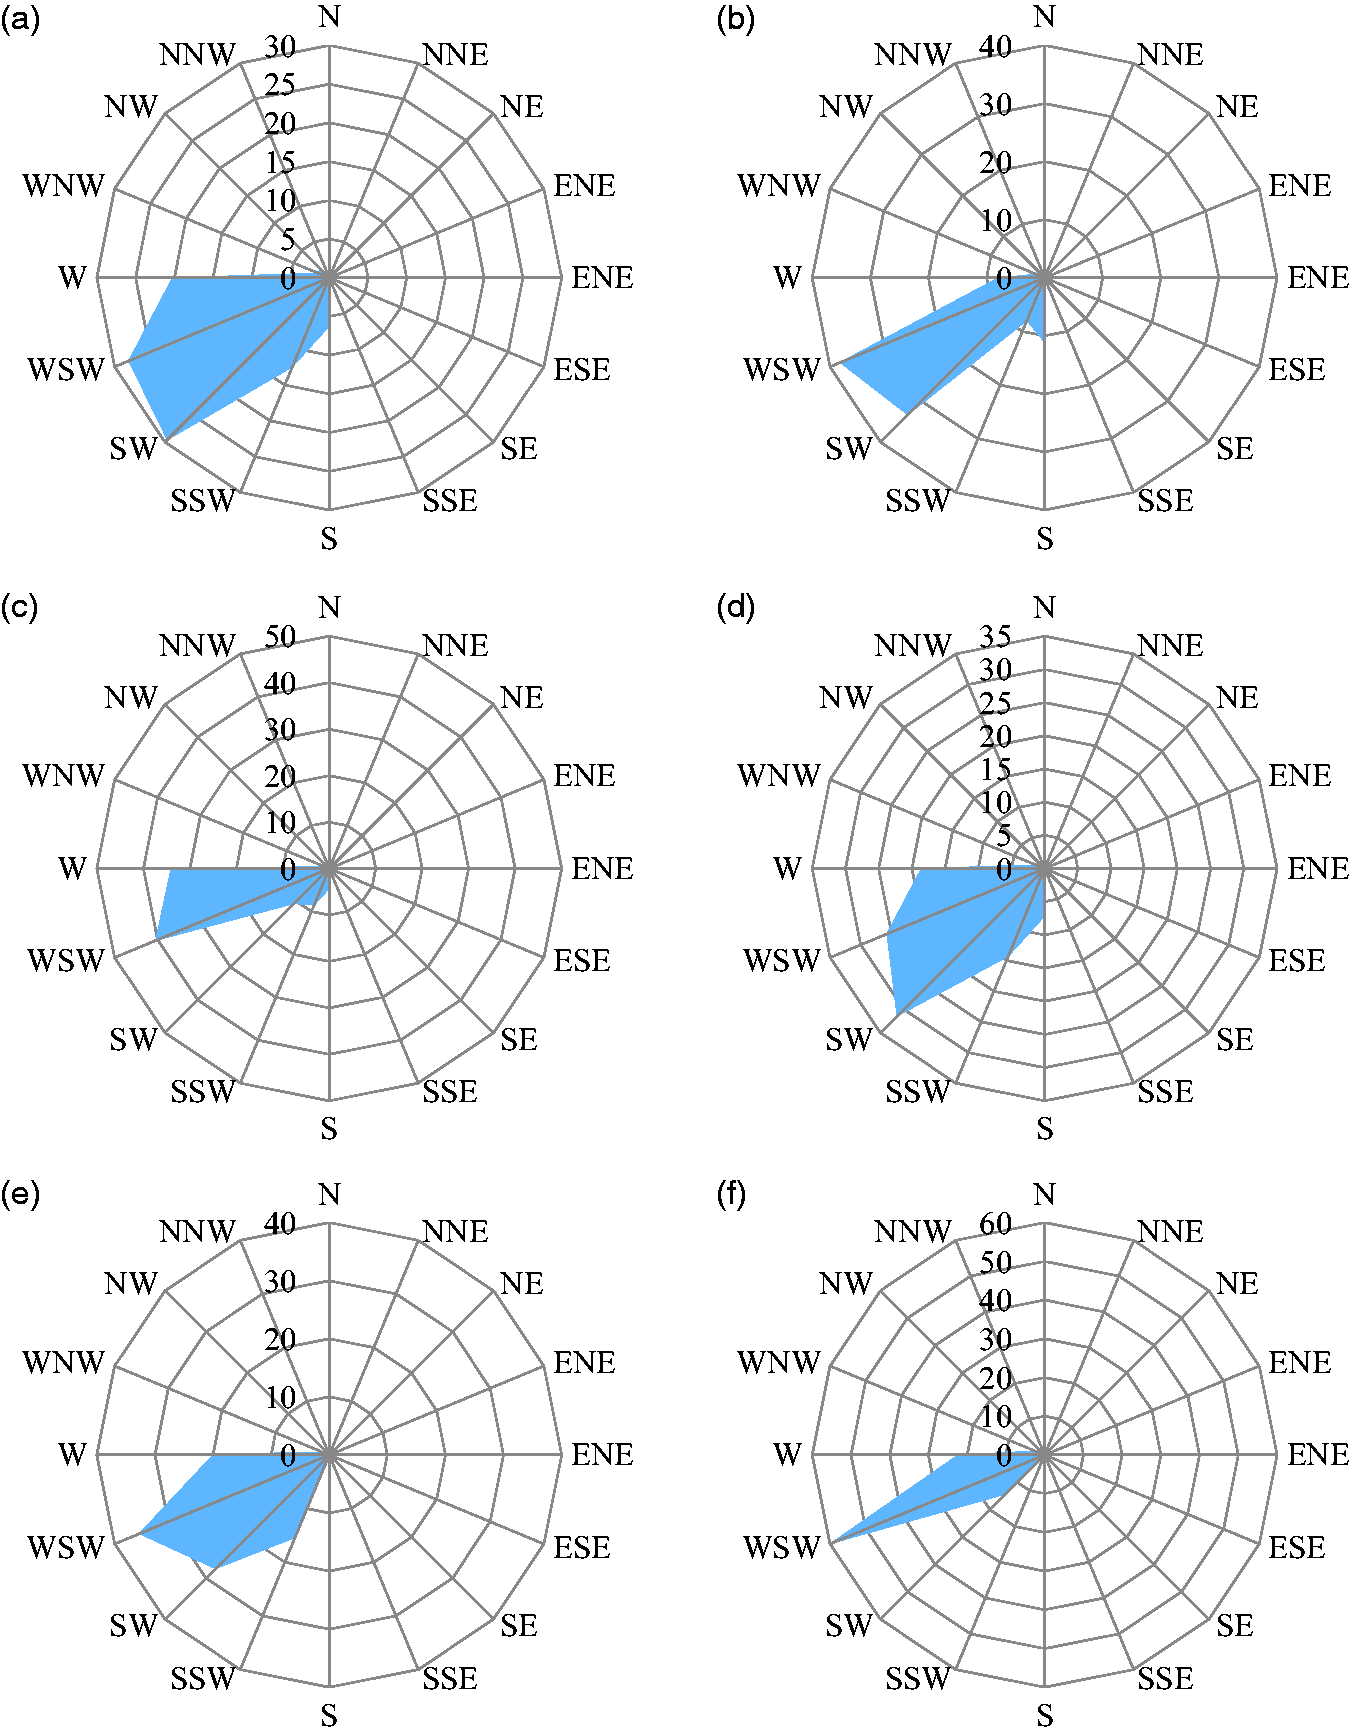
Wind rose diagrams for (a) Gwadar, (b) Jiwani, (c) Karachi, (d) Ormara, (e) Pasni, and (f) Sonmiani Bay.
Sensitivity analysis
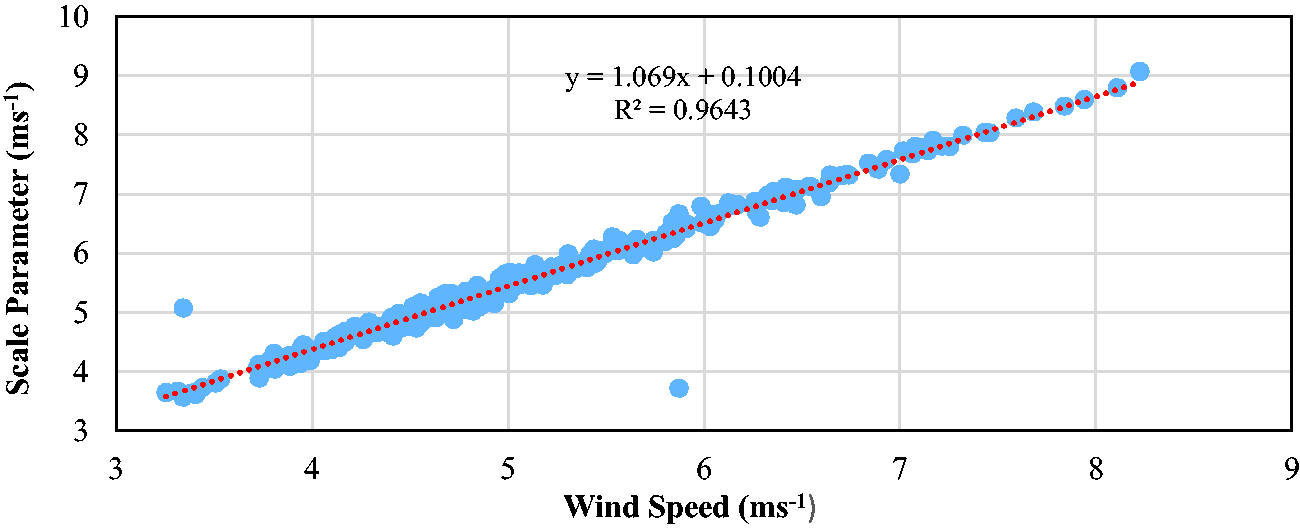
Investigating the effect of one parameter over others is important. In foregoing study, wind speed data are the main input data; Weibull parameters, lognormal parameters, and wind power density (PD) were calculated using these input data. Therefore, the effect of variation in wind speed on all these parameters is required to be analyzed. A graph between wind speed and Weibull shape parameter is shown in Figure 13 which shows that there is very weak correlation between these two parameters. Moreover, the nature of relationship (either positive or negative) is not obvious. Figure 14 shows a plot of wind speed versus Weibull scale parameter. It can be observed that there is very strong positive linear correlation between these two.
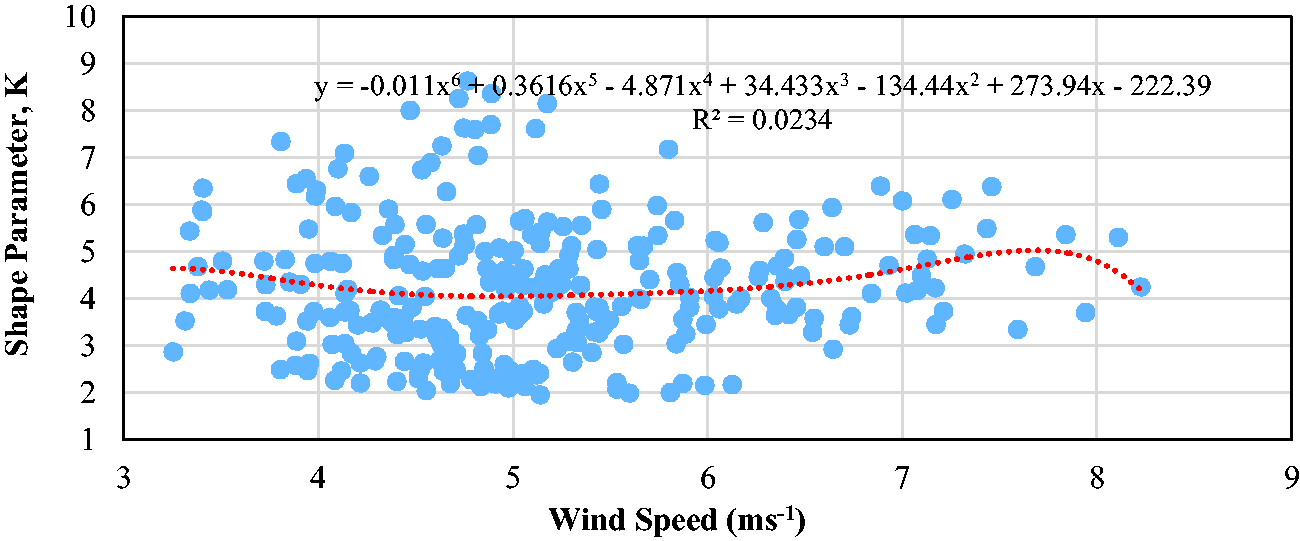
Effect of wind speed on Weibull shape parameter.
Effect of wind speed on Weibull scale parameter.
Lognormal scale parameter has been plotted against wind speed in Figure 15. Analysis shows that there is a very weak correlation between these two. Furthermore, the nature of correlation is not obvious. However, lognormal location parameter has been found to vary with wind speed positively. A very strong positive correlation of second degree has been observed between these two parameters as shown in Figure 16.
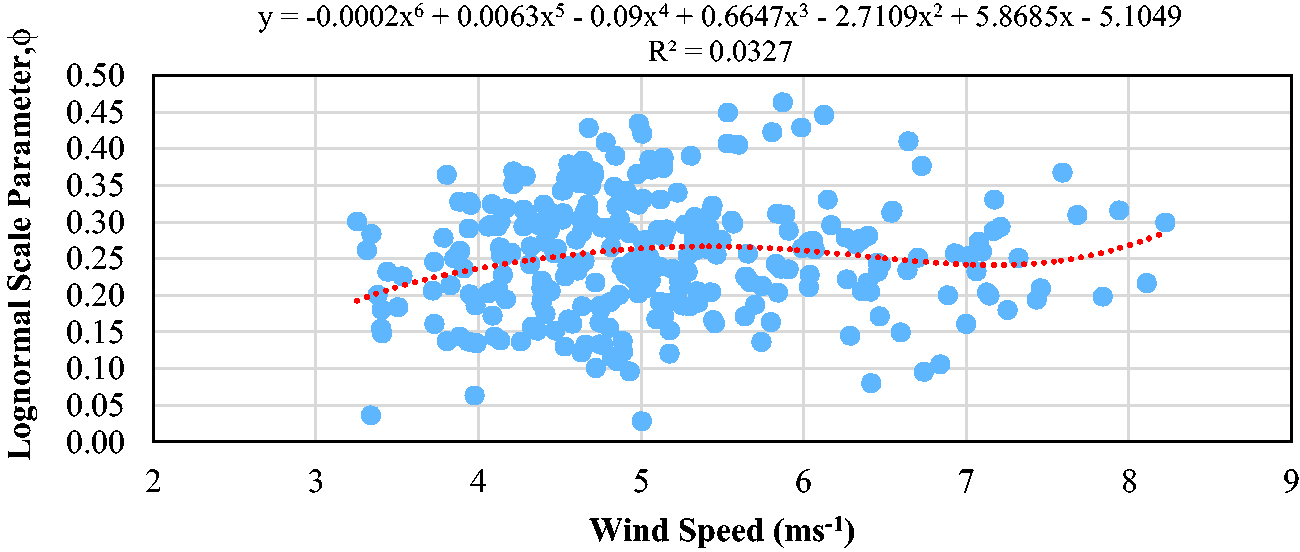
Effect of wind speed on lognormal scale parameter.
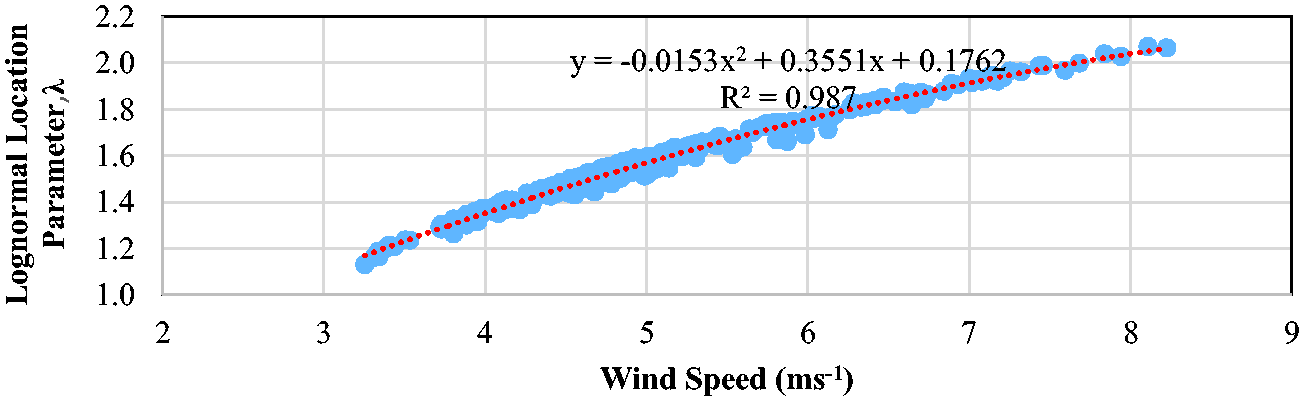
Effect of wind speed on lognormal location parameter.
As wind power density (PD) depends on both Weibull shape and scale parameters, therefore, in order to analyze the effect of one parameter, the other is kept constant. Figure 17 shows a plot of PD versus C for three different values of K. It has been observed that PD varies to the third power of scale parameter with positive correlation. Furthermore, with increase in the value of K, PD decreases. Similarly, the effect of Weibull shape parameter on PD has been shown in Figure 18. It has been observed that there is a negative correlation between K and PD. Moreover, with increase in C, PD increases.
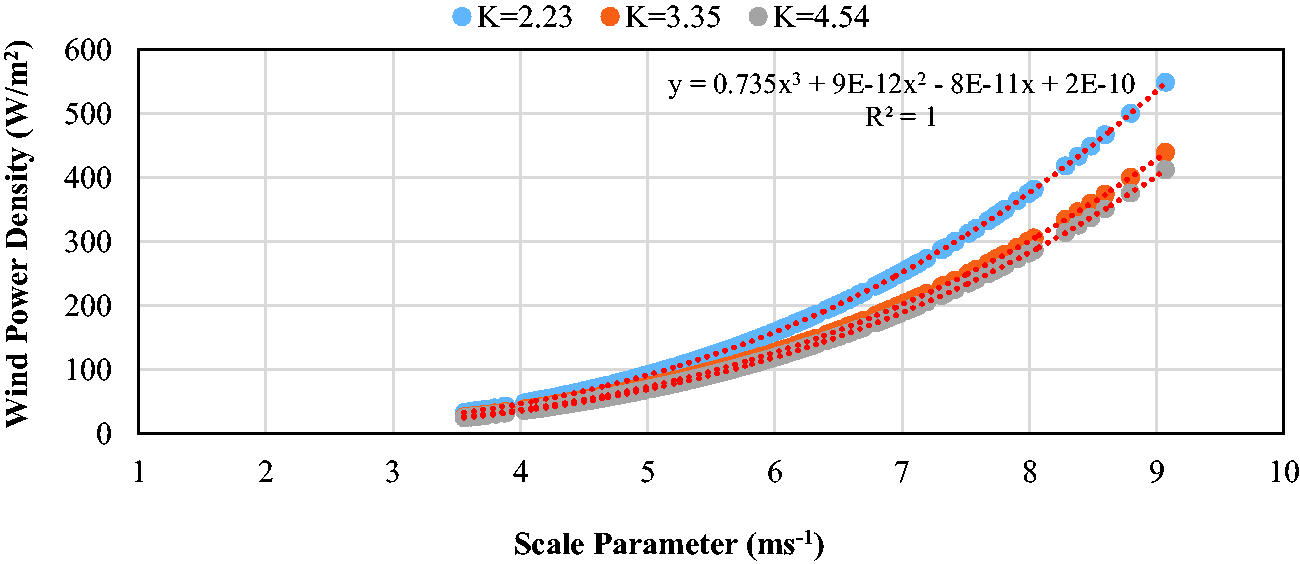
Effect of Weibull scale parameter on wind power density (PD).
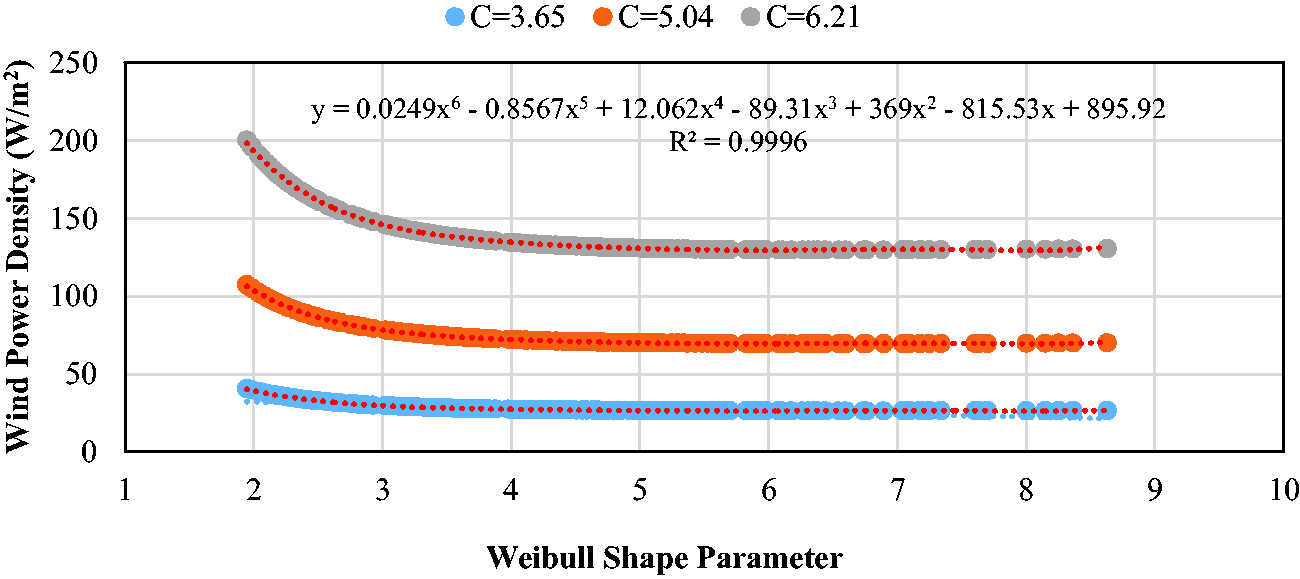
Effect of Weibull shape parameter on wind power density (PD).
Validation of results
Three distributions have been used to estimate wind potential and literature data has been used to validate the results of this particular work (Bilir et al., 2015; Carta et al., 2009; Chang, 2011; Chaurasiya et al., 2018; Indhumathy et al., 2014; Khahro et al., 2014b; Khan and Tariq, 2018; Mirhosseini et al., 2011; Rehman et al., 2012, 2020; Safari and Gasore, 2010).
Conclusion
Following conclusions are drawn from this study:
At all locations, Weibull distribution has been found the most accurate and Rayleigh distribution as the least. Among all investigated locations, Karachi has the highest wind potential while Jiwani carries the least. Highest AEP is at Karachi with Bonus 1300/62 while lowest is at Jiwani with Vestas V42. Similarly, highest CF is observed at Karachi with Bonus 600/44 while lowest is observed at Jiwani with Vestas V42. Economic analysis shows that lowest PP is at Karachi with Bonus 600/44 while highest is at Jiwani with Vestas V42. In terms of unit cost of energy, the minimum cost is at Karachi with Bonus 600/44 and maximum is at Jiwani with Vestas V42. Overall, Vestas V42 has been found the worst performance while Bonus 1300/62 produces maximum energy and Bonus 600/44 is the most economical. Optimum direction along the coastal belt has been found to be SW to W.
Footnotes
Declaration of conflicting interests
The author(s) declared no potential conflicts of interest with respect to the research, authorship, and/or publication of this article.
Funding
The author(s) received no financial support for the research, authorship, and/or publication of this article.