
Abstract
Ten-year hourly recorded wind meteorological data at six sites along the coastline of Pakistan at two heights (10 and 50 m) were extrapolated to two higher heights (80 and 100 m). Monthly and seasonal analysis of variation in air density (ρ), wind speed, Weibull parameters (K and C), wind power density, and wind energy density with height was investigated. Analysis shows that wind shear coefficient is highest in winter and lowest in summer. ρ, wind speed, wind power density, and wind energy density all increase with increasing hub height, with the most prominent increment in winter and the lowest in summer. With increasing height, K has been found to decrease slightly while C increases. Techno-economic feasibility analysis of annual energy production using 15 turbines was carried out which shows that capacity factor alone cannot render a turbine feasible but also economic assessment is mandatory to evaluate the feasibility of turbines. G1 and G2 turbines have been found the best options while B5 and V2 as the worst. Comparison among sites shows that Karachi is the most potential site with cost of energy of $0.017/kW h while Jiwani is the worst site with cost of energy of $0.039/kW h both at 100 m height.
Keywords
Introduction
Substantial increase in energy demand owing to huge increase in global population, limited conventional fossil fuel resources and a thirst to mitigate hazardous environmental impacts associated with the usage of fossil fuels make it necessary to utilize renewable energy sources which have minimum carbon emission (Khahro et al., 2014a, 2014b). Current exploitable renewable energy potential in Pakistan has been estimated as 167.7 GW—significantly above its actual electrical energy requirement (Rafique and Rehman, 2017). Wind energy with its low environmental impacts is seeking global attention continuously (Shoaib et al., 2017). According to Global Wind Energy Council report 2019, global wind installed capacity has reached about 651 GW at the end of 2019 (Council GWE, 2020) which was about 597 GW at the end of 2018 (WWEA, 2019). This shows a huge increase in global tendency toward wind energy utilization.
Pakistan, an energy deficient country, has always been facing acute energy shortage since the day it got independence (Hulio et al., 2019a). Like global inclination toward wind energy utilization, Pakistan is also developing wind projects. For the first time in its history, wind installed capacity in Pakistan reached about 106 MW (Khahro et al., 2014b) at the end of 2014, which increased to 1186 MW (IRENA, 2019) and 1236 MW (IRENA, 2020) at the end of 2018 and 2019, respectively. According to Pakistan Renewable Energy Policy 2019, Pakistan sets a target to obtain 25 and 30% of its total energy generation capacity from Alternative and Renewable Energy Technologies by 2025 and 2030, respectively (Ali, 2019). According to an estimate, about 9.06% of Pakistan’s land area is suitable for wind energy utilization (Hulio et al., 2019a); coastline of Pakistan is one of those suitable areas which is planned to be utilized for wind power projects installation by Government of Pakistan (GOP). However, this area remains untouched so far as far as wind potential exploration is concerned.
Accurate wind speed (WS) estimation is crucial as an error of about 1% in WS estimation leads to an error of 2% in wind energy (Azad et al., 2011). Wind power potential assessment has widely been made using Weibull density function with various methods (Sumair et al., 2020). Wind power assessment in Timimoun region was made using Wind Atlas Analysis and Application Program (Himri et al., 2016). Wind data recorded over a period of three years (2001–2003), measured at 17 m height, were collected from Société Nationale de l’Electricité et du Gaz R&D Office. Weibull parameters, mean WS, wind power density (PD), and optimum wind blowing direction were determined followed by the energy yield estimation using various wind turbines. Many other researchers employed Weibull distribution with various methods to estimate Weibull parameters (Fırtın et al., 2011; Hulio et al., 2019b; Ilinca et al., 2003; Indhumathy et al., 2014; Islam et al., 2011; Milanese et al., 2019; Mohammadi and Mostafaeipour, 2013; Ouammi et al., 2010; Oyedepo et al., 2012; Pishgar-Komleh et al., 2015; Rafique et al., 2018; Rehman et al., 2018, 2020).
Amount of wind energy depends upon WS and air density (Azad et al., 2011; Hulio et al., 2019a). The denser the air, the more energy it carries. Similarly, higher WS carries more wind potential. Even at a site, both parameters vary throughout the year depending upon the local atmospheric meteorological conditions. Along with monthly and seasonal variation, these parameters also vary with elevation above ground level (AGL). Therefore, wind power estimation must be made using height specific local wind and other meteorological data.
WS measurements are generally conducted at a height less than the actual hub height; otherwise measurement itself may be very costly (Fırtın et al., 2011). In order to estimate the WS at the required hub height, measured data are extrapolated using wind power law. Normally, in the application of wind power law, wind shear coefficient (WSC) is assumed constant (0.143) which can result in substantial underestimation or overestimation of estimated wind energy (Fırtın et al., 2011; Rehman and Al-Abbadi, 2008). Therefore, wind shear must be treated as variable (not constant) for an accurate estimation of extrapolated WS. Many researchers have studied the variation of WSC and its effect on energy generation.
WSC for Dholum (Saudi Arabia) was estimated and presented in Rehman and Al-Abbadi (2008). It was found that WSC is 0.255 (significantly higher than 0.143). Further, it was concluded that energy generation per year is 10–20% higher than estimated using constant WSC. Another work (Fırtın et al., 2011) also analyzed the effect of WSC on estimated wind energy generation for Balikesir and found that a substantial difference (up to 49.6%) can occur due to error in extrapolation of wind data assuming constant WSC.
WSCs using WS data at three heights of 20, 30, and 40 m at Gulf region (Saudi Arabia) were estimated (Rehman and Al-Abbadi, 2005). Air density was also evaluated considering the variation of pressure and temperature with height followed by the estimation of energy generation at various heights. Three-year wind data (1995–1998) were used and mean WSC and air density were found to be 0.194 and 1.18 kg/m3, respectively. Moreover, monthly and seasonal variation analysis was also carried out which showed that wind shear coefficient (WSC) and air density are greatly influenced by the time of the year, thereby influencing the energy production.
Similarly, WSCs at Dhahran (Saudi Arabia) were evaluated using measured wind data at 20, 30, and 40 m heights AGL (Rehman and Al-Abbadi, 2007). Five-year wind data (1995–2000) were used in this analysis. Air density values were estimated using temperature and surface pressure values. It was found that mean WSC and air density were 0.189 and 1.18 kg/m3, respectively. Energy production from a hypothetical 60 MW wind farm was estimated and it was found that actual WSC yields about 11–12% more energy when compared with 1/7th power law. Similarly, capacity factors (CFs) were found to be about 2–3% higher. Another such work has been presented in Islam et al. (2017).
WSC at Malta was evaluated (Farrugia, 2003) using wind data measured at two heights of 10 and 20 m, respectively. This study concluded that WSC varied a lot with season—being maximum in January and minimum in August as 0.45 and 0.29, respectively. Another study presented in Sisterson et al. (1983) stated that WSC may be as high as 0.5 up to a height of 150 m AGL and in extreme irregular cases, it may go up to 1.0. Seventeen sites in Texas, USA were analyzed (Bailey, 1981) to investigate the variation in WSC. Study concluded that WSC may vary ranging from 0.15 to 0.36 for all the investigated locations. Wind power potential assessment at Borj-Cedria, Tunisia was made using wind data at three heights of 10, 20, and 30 m, respectively, followed by the investigation of effect of WSC on proposed energy production (Dahmouni et al., 2011). Similarly, wind potential estimation at South Banat (Serbia) was made using wind data measured at four different mast heights of 10, 40, 50, and 60 m, respectively (Đurišić and Mikulović, 2012). Moreover, according to Wind Resource Analysis Program report (Fırtın et al., 2011), 7082 WSCs were evaluated with 91.9% values above 0.14.
As previously mentioned, Pakistan has about 9.06% land area suitable for wind energy harvesting and coastline is one of those. To take advantage of higher WSs at higher hub heights, GOP plans to install wind turbines at higher hub heights. Two proposed heights for this purpose are 80 and 100 m, respectively. No literature is found for wind potential estimation of these sites. Moreover, long-term wind data over these sites have not been measured at proposed hub heights (except for one year of 2015). Therefore, investigation of WSCs along with the wind potential estimation needs to be evaluated. Current work focuses on the evaluation of WSC followed by the extrapolation of wind data to required hub heights at six sites along the coastline of Pakistan, shown in Figure 1 to carry out this study, Ten-year hourly recorded wind data (at 10 and 50 m heights) and local atmospheric temperature and pressure data (measured at 10 m height) have been used.
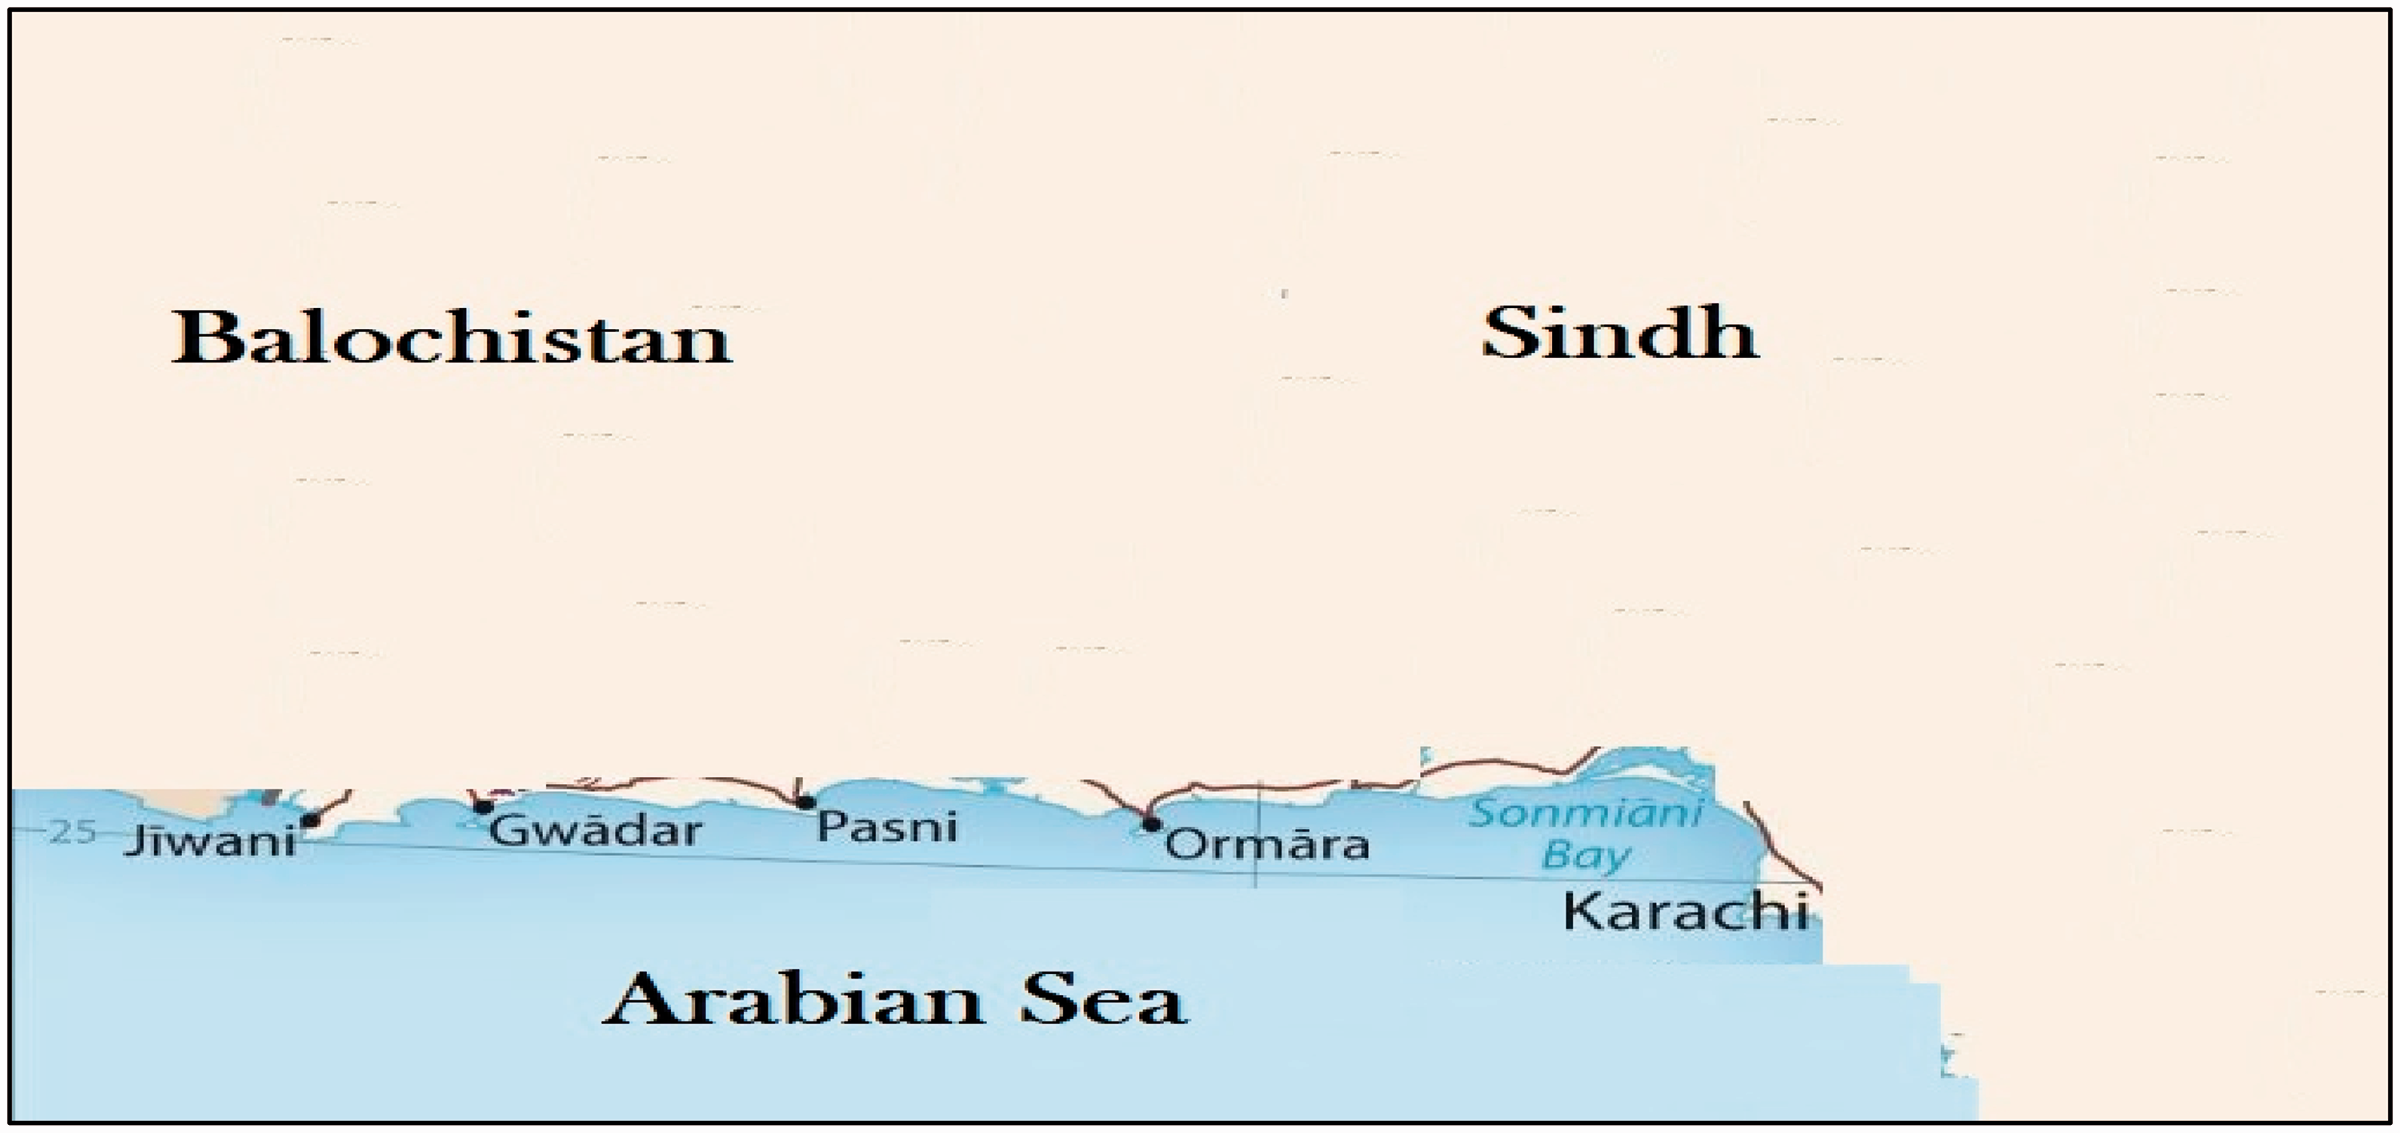
Six sites along the coastline of Pakistan.
Materials and methods
Site description and data collection
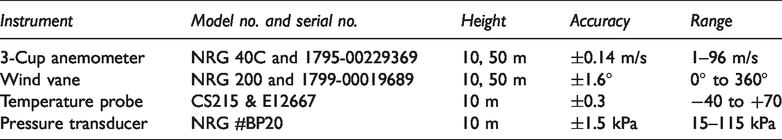
Six locations, namely Gwadar, Jiwani, Pasni, Ormara, Sonmiani Bay, and Karachi have been selected for this study which are located along the coastal belt of Pakistan. The wind towers were installed at flat terrains (at all six stations) with minimum obstructions of height up to 2.5–3.5 m which were 250–250 m away from towers. Wind data were recorded every 60 min. Technical specification of measurement sensors is given in Table 1.
Technical specifications of wind data measurements sensors.
Wind potential estimation at six stations along the coastline of Pakistan was made using ten-year (2009–2018) hourly recorded wind data (at 10 and 50 m height) and local atmospheric pressure and temperature data (measured at 10 m height). WSCs at each station were evaluated using wind power law and WS data were extrapolated to two required heights of 80 and 100 m, respectively. Monthly and seasonal variation in WSC was analyzed. Furthermore, air density was calculated at each station using temperature and pressure data measured at 10 m height and extrapolating it to calculate the air density at other heights. Wind power potential was estimated using Weibull probability density function. Effect of height on mean WS, Weibull parameters, wind PD, wind energy density (ED), and annual energy production (AEP) was analyzed on monthly and seasonal basis. Finally, economic assessment was performed using 15 turbines to evaluate the economic feasibility of wind energy harvesting at each of these sites.
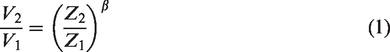
Wind power law
To extrapolate the WS to the required hub height from measured wind data at a lower height, following wind power law is used (Azad et al., 2011; Farrugia, 2003; Fırtın et al., 2011; Khahro et al., 2014b; Rehman and Al-Abbadi, 2008)
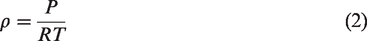
Air density (ρ)
Treating air as an ideal gas, ideal gas equation can be used to estimate air density using local atmospheric temperature and pressure, as given below
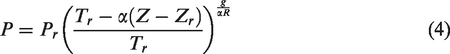
In order to calculate the air density at a height where local measured atmospheric temperature and pressure data are not available, extrapolation of temperature and pressure is done using following equations (3) and (4), respectively (Elger et al., 2016)

Weibull distribution
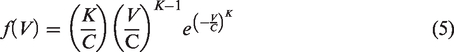
Weibull distribution is the most widely used distribution to estimate wind potential throughout the world. Mathematically, Weibull probability density function is given as follows
There are different methods in literature to estimate Weibull parameters.
In this study, following less commonly used method has been applied for weibull parameters estimation (Sumair et al., 2020)


However, analysis of Weibull scale and mean WS data (found in literature) shows that scale parameter and mean WS follow the following slightly different relationship given in equation (8)

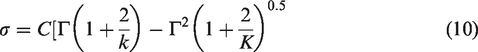
Using the basic definition of standard deviation for any probability density function, given as equation (9)
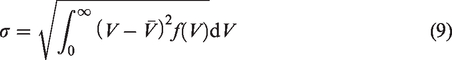
Integrating equation (9) and simplifying yields equation (10)
Taking natural log of equations (8) and (10) followed by the elimination of C from resulting equation gives equation (11)

Equation (11) is numerically solved to obtain Weibull shape and scale parameters.
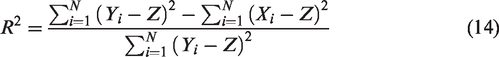
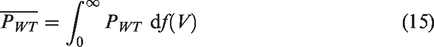
Wind PD and wind energy density (ED) were calculated using
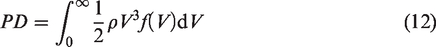
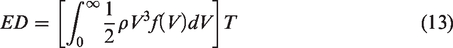
T is required time period over which wind ED is to be evaluated. Accuracy of this method has been accessed using coefficient of determination (R2)
Techno-economic feasibility of energy production
Average power produced by a certain wind energy harvesting machine is an important consideration as it affects the economic feasibility of wind power project. Average power a wind turbine can produce is calculated using equation (15)
Integral in equation (15) replaced by summation over bins, NB, gives equation (16) as an alternative of equation (15)
Thus, energy production over a certain time period is given by equation (17)

Performance of a wind turbine is generally described by a parameter known as CF, given as follows in equation (18)
However, only the CF cannot render a turbine feasible or unfeasible for wind energy utilization. To evaluate economic feasibility, unit cost of energy (C) must be estimated.
Unit cost of energy is calculated using equation (19)
While net present worth is calculated using equation (20)
Results and discussions
Analysis of monthly and seasonal variation in WSC
Measured WS data at 10 and 50 m height have been used to calculate WSC on monthly and seasonal basis which are further used to extrapolate WS to two heights of 80 and 100 m, respectively. Ten-year monthly calculated values of WSC have been listed in Table 2. Monthly and seasonal variation has also been depicted in Figure 2. It has been observed that WSC varies throughout the year depending upon atmospheric conditions. At each station, the highest values of WSC have been observed in winter (in December) and the lowest in summer (in July). Moreover, autumn has somewhat lower values of WSC than spring. The reason can be associated with temperature changes throughout the year. At high temperature, there is better mixing of air AGL and hence smaller values of WSC are expected and vice versa. On all investigated locations, summer is characterized by highest temperature followed by autumn, spring, and winter, respectively. Therefore, lowest values of WSC have been observed in summer followed by autumn, spring, and winter respectively. Comparison between various sites shows that Pasni has the lowest average value of WSC as 0.096 while Karachi has the highest as 0.148. This difference can be associated with different temperatures observed at each station along with the near surface activities.
Ten-year monthly averaged values of WSC (β) at each station.
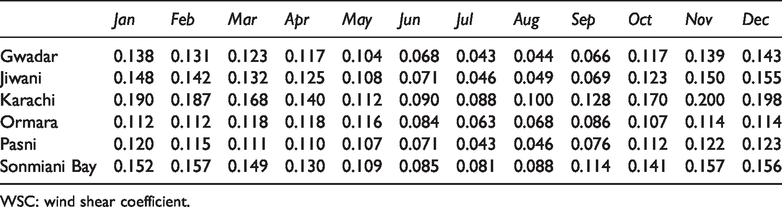
WSC: wind shear coefficient.
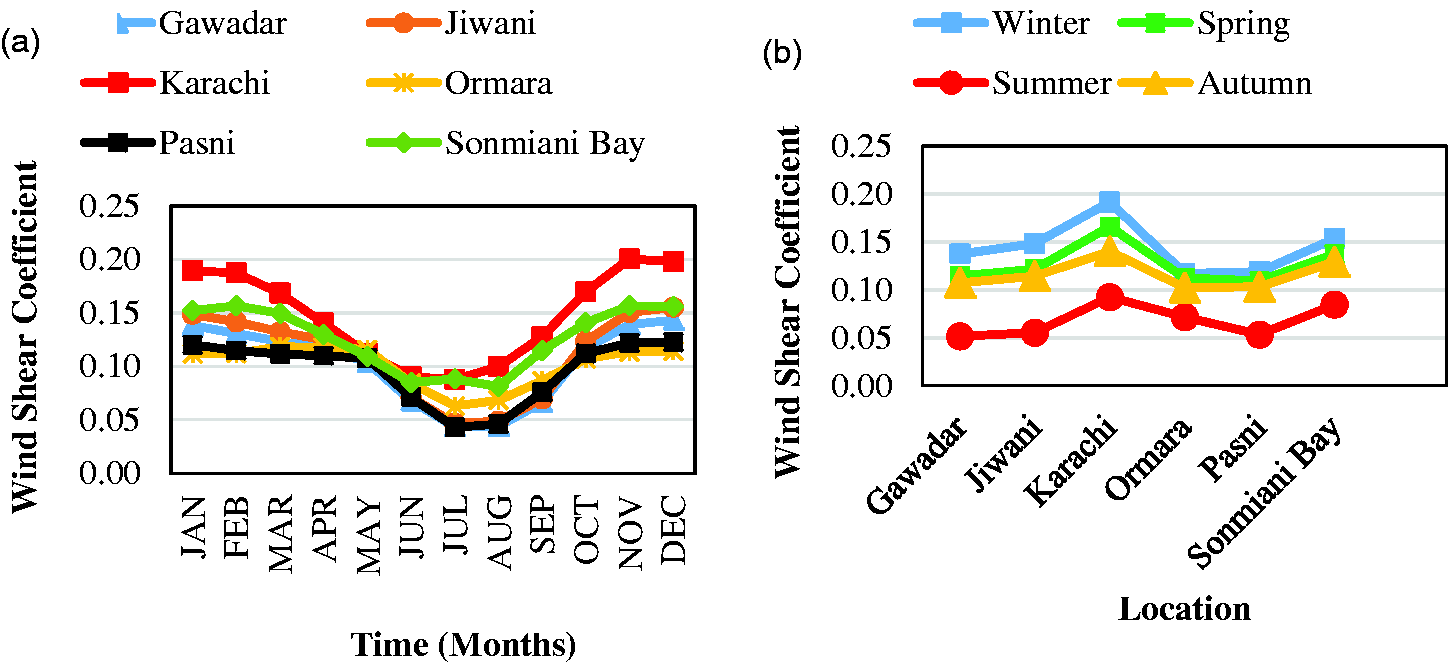
(a) Monthly and (b) seasonal variation in WSC at each station.
Variation in air density with height
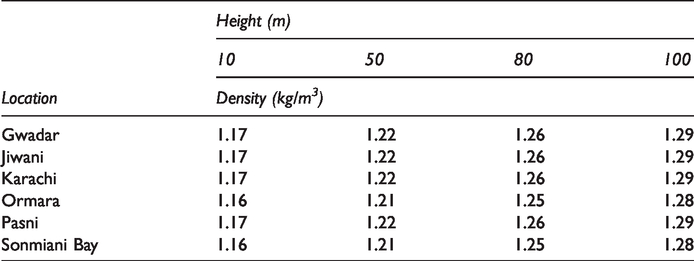
Air density values have been calculated using local atmospheric conditions at each station. Measured data of temperature and pressure at a height of 10 m were recorded which was extrapolated to higher heights. Average values of air density over the entire observed period at four heights have been listed in Table 3. Monthly and seasonal variation analysis, showing the effect of height, has been presented in graphical form in Figure 3 at Gwadar. Analysis of density variation at a height shows that density is highest in winter and lowest in summer. During summer, temperature is highest hence air density is lowest and vice versa. Analysis of air density variation w.r.t height shows that with increase in height, air density also increases. As air density depends upon temperature and pressure, with increase in height, both decrease. However, the decrease in temperature is significant than the decrease in pressure. Therefore, air density is mainly influenced by decrease in temperature which causes it to increase. Similar trends can be observed for other locations too. Table 4 shows that an increase of about 11% has been observed with increasing height from 10 to 100 m for all investigated locations.
Average values of air density at four heights at each location.
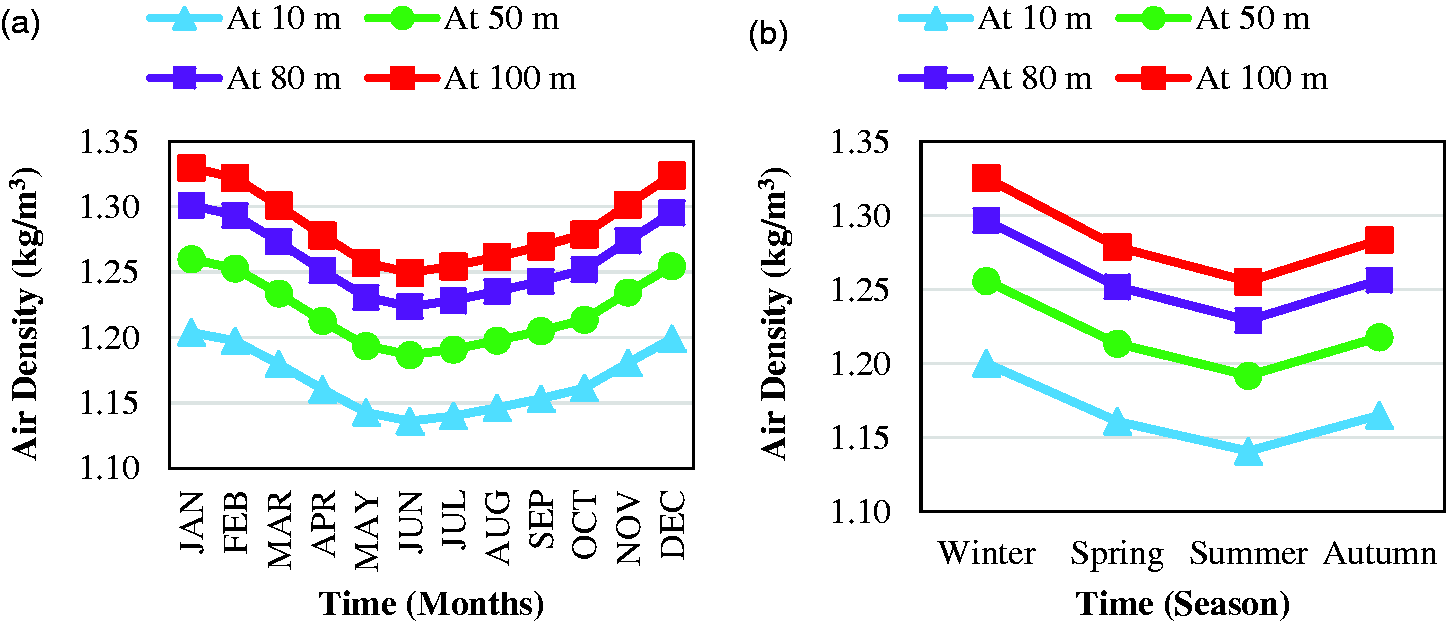
Variation of density with height (a) monthly and (b) seasonal at Gwadar.
Average values of wind speed at four heights at each location.
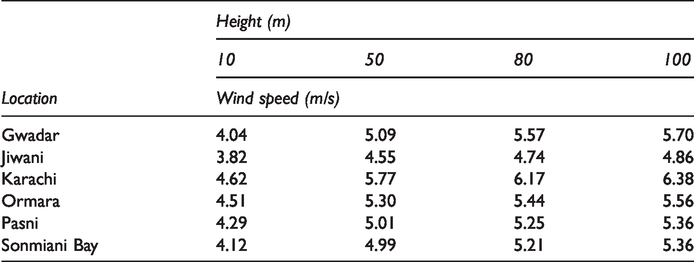
Variation in WS with height
WS at two heights were measured and extrapolated to two higher heights of 80 and 100 m, respectively, using WSC. Average values of WS at each height are listed in Table 4. It can be observed that Karachi has the highest WS (observed in summer) while Jiwani has the lowest of all (also observed in summer). Detailed monthly and seasonal variation has been depicted in Figures 4 to 6 for three stations of Gwadar, Karachi, and Pasni, respectively. Remaining stations have also similar pattern of variation with height. Moreover, it has been observed that effect of variation in height is most prominent in winter and least in summer (due to highest and lowest values of WSC in winter and summer, respectively), e.g. in Karachi, WS increases from 3.41 (at 10 m) to 5.26 m/s (100 m) in winter which is about 54.17% while it is only 26.71% in summer. Same is the case for other locations as well.
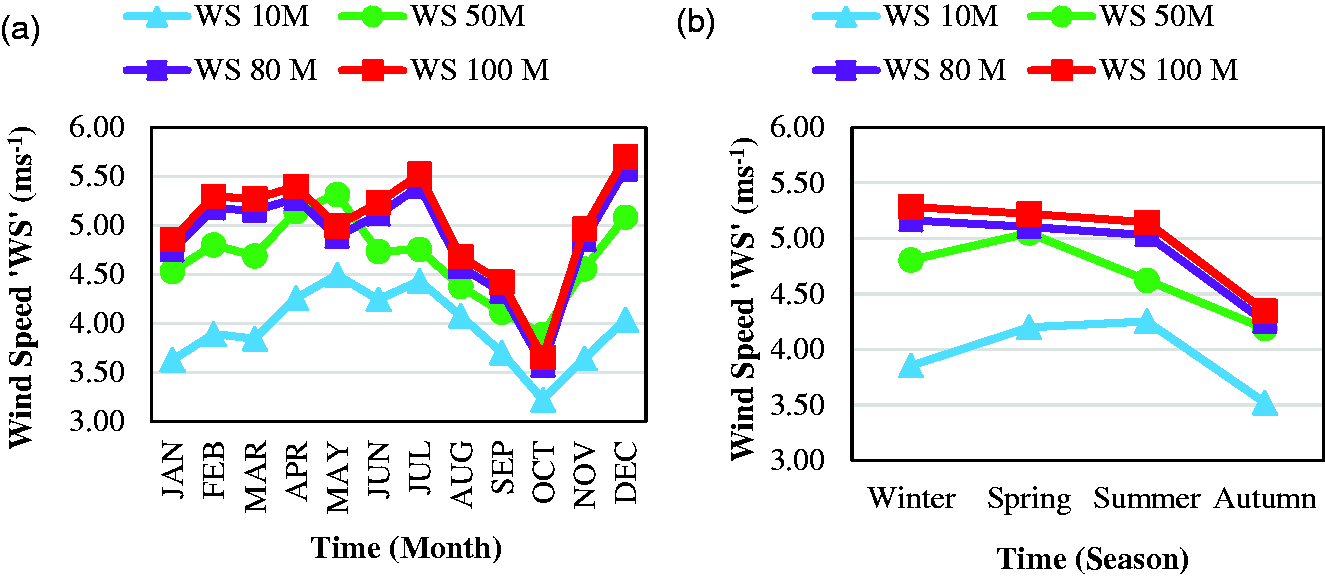
Monthly (a) and seasonal (b) variation in WS with height at Gwadar.
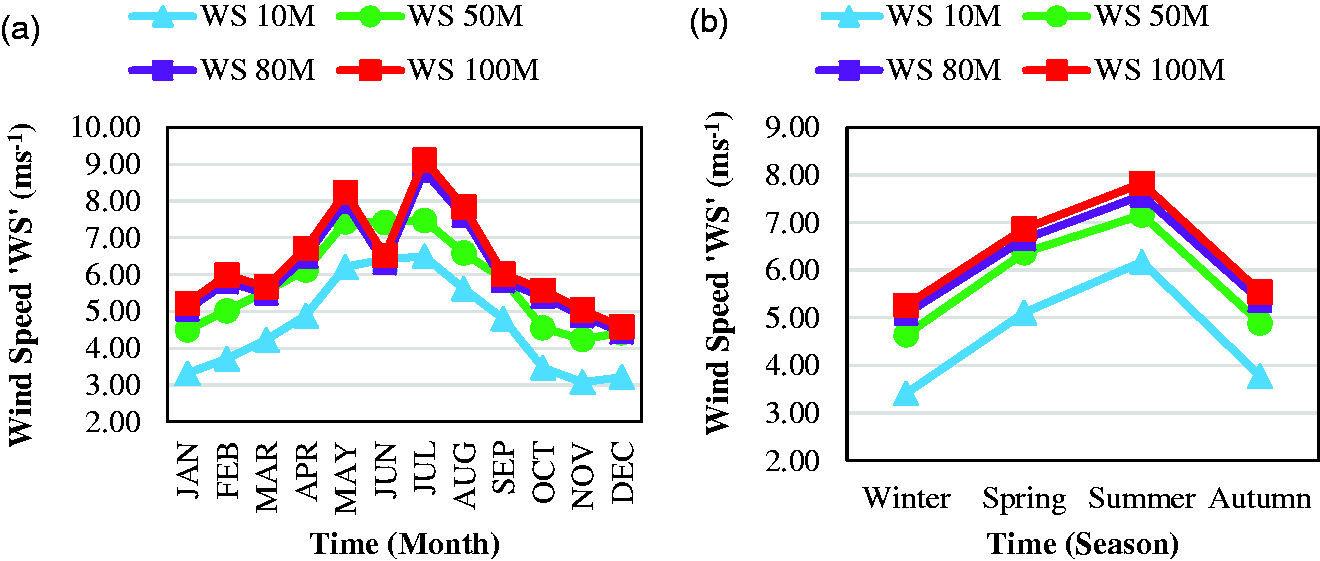
Monthly (a) and seasonal (b) variation in WS with height at Karachi.
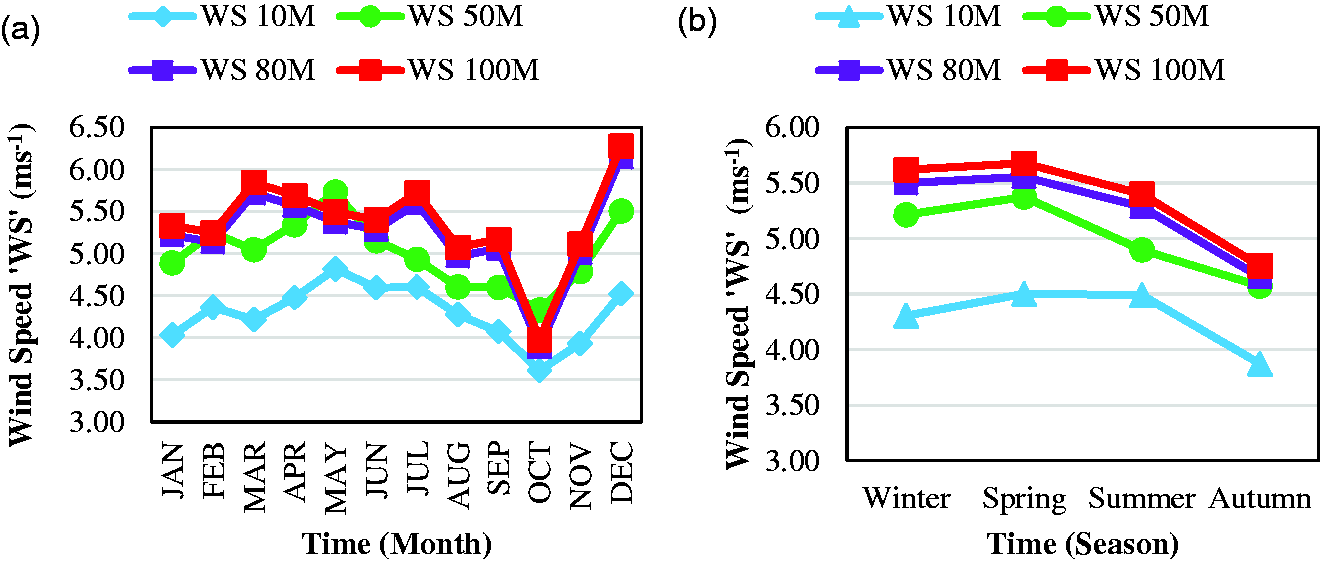
Monthly (a) and seasonal (b) variation in WS with height at Pasni.
Variation in Weibull parameters with height
Weibull shape and scale parameters have been calculated using 10-year wind data at four different heights. Seasonal variation in Weibull parameters with height has been shown in Figure 7. It has been observed that Weibull shape parameter slightly decreases with increasing height but this change is not significant. On the other hand, Weibull scale parameter increases significantly with increasing height. As Weibull scale parameter is proportional to mean WS, so as the speed increases with height so is the case for Weibull scale parameter.
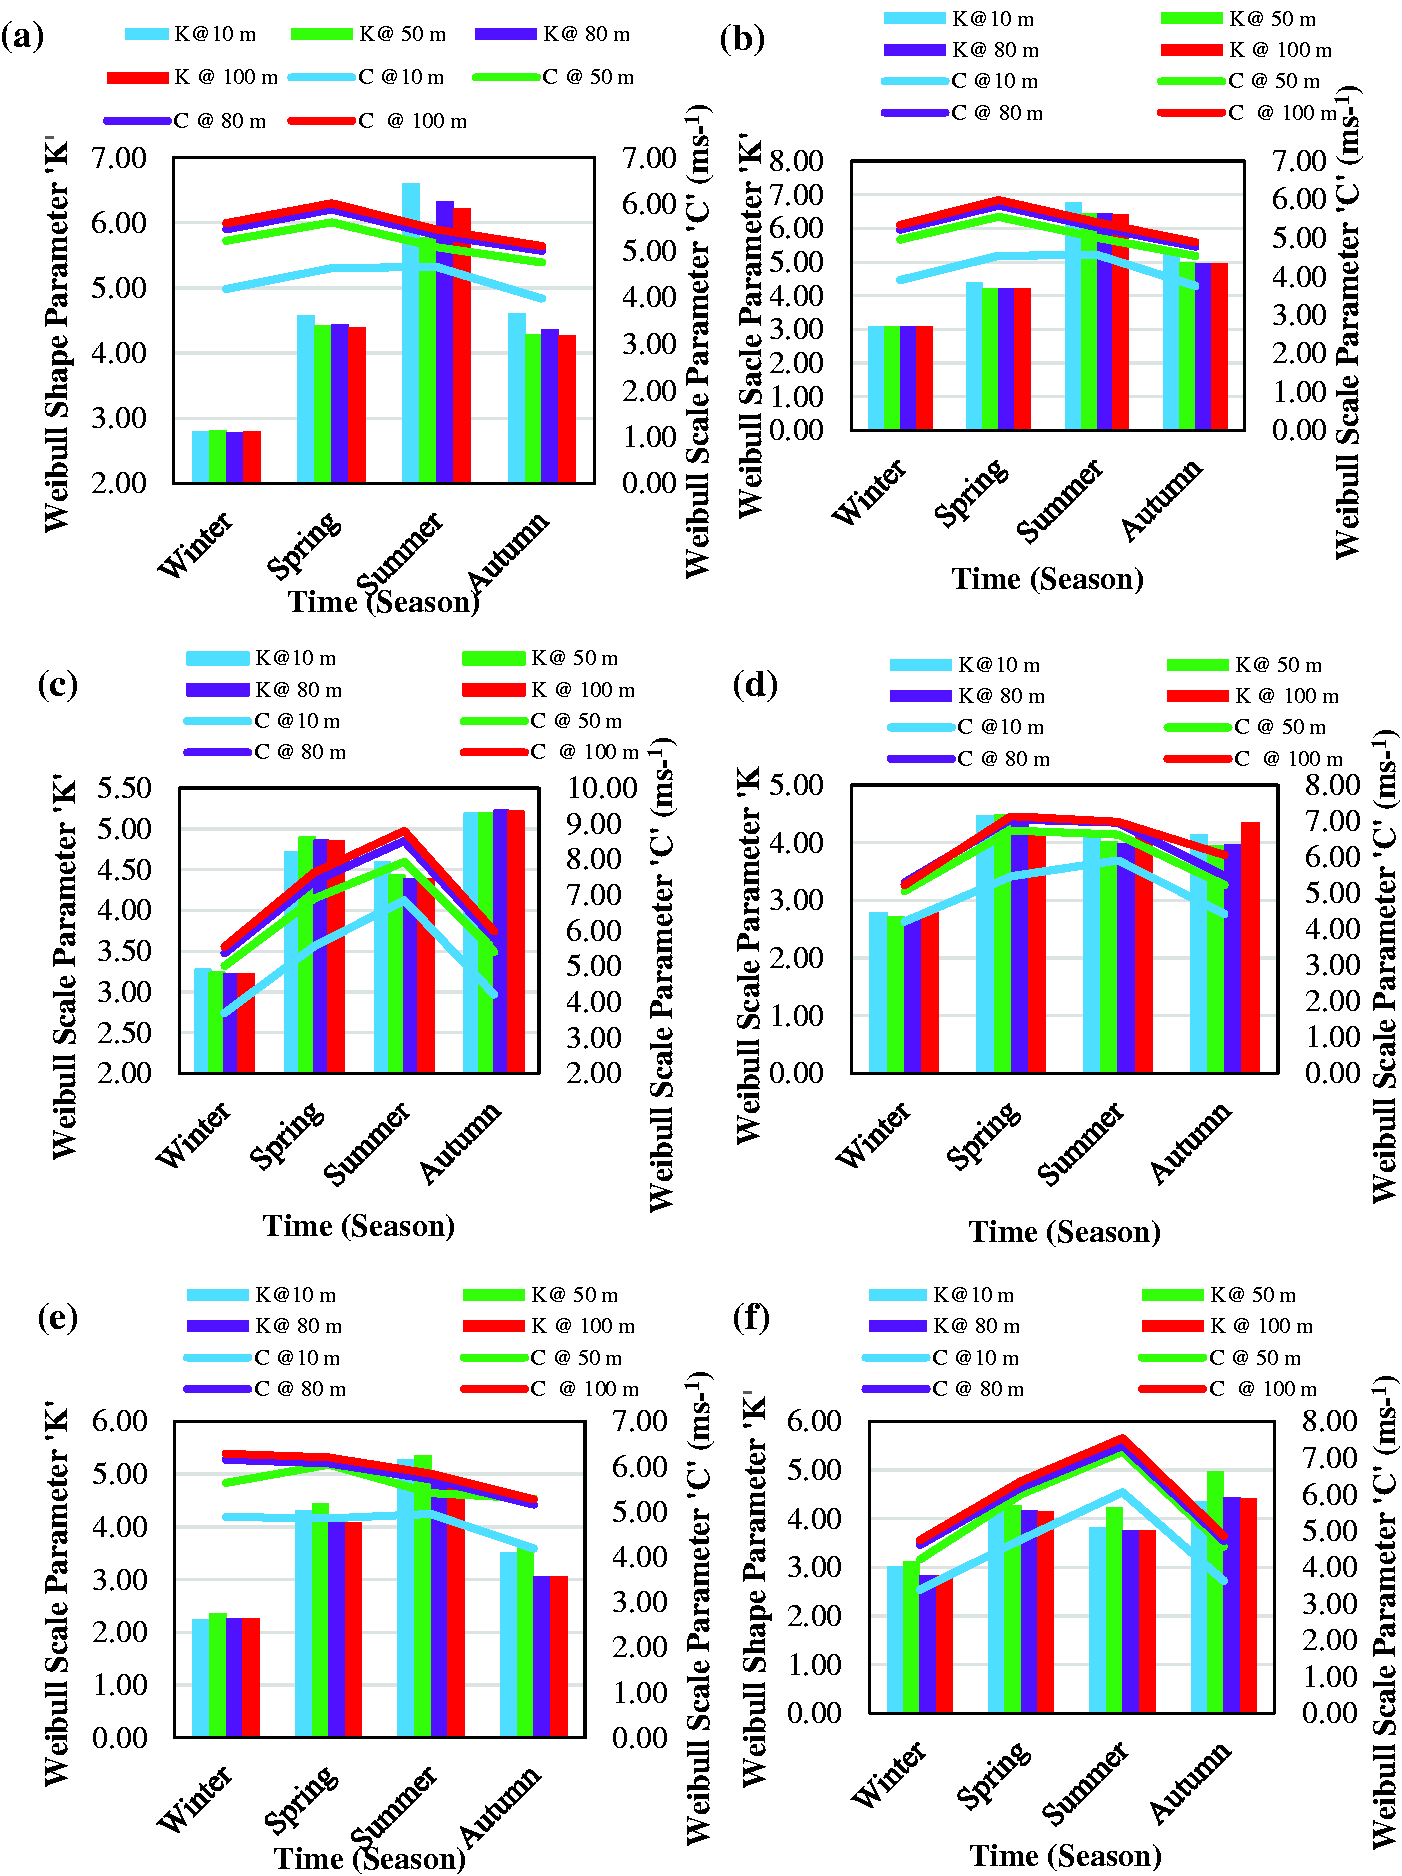
Seasonal variation in Weibull parameters with height for (a) Gwadar, (b) Jiwani, (c) Karachi, (d) Ormara, (e) Pasni, and (f) Sonmiani Bay.
Investigating the effect of height on Weibull distribution
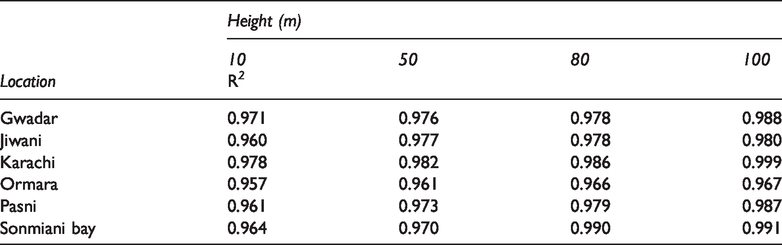
Weibull distribution curves for four different heights at each location have been drawn using Weibull parameters calculated at each height. These distribution curves (for three locations; other locations have also similar trends of variation) have been shown in Figures 8 to 10, respectively. It has been observed that as the height increases, peak of distribution curve decreases and spread on X-axis increases. Peak depends upon shape parameter (higher values mean higher peak and vice versa) and spread on X-axis depends upon scale parameter (higher values are associated with higher spread and vice versa). With increase in height, shape parameter slightly decreases and scale parameter increases, therefore, curve becomes less higher and more spreading with increase in height. In order to evaluate the accuracy of Weibull distribution, coefficient of determination (R2) has been calculated and listed in Table 5. It can be observed that new method developed in this study estimates the real wind data with significant accuracy (with R2 values more than 0.95). It can also be observed that R2 increases with increasing height at a particular location. This is so as Weibull distribution has limitation in defining the lower wind velocities accurately; with increase in height, WS increases and hence Weibull distribution can describe actual wind data more accurately.
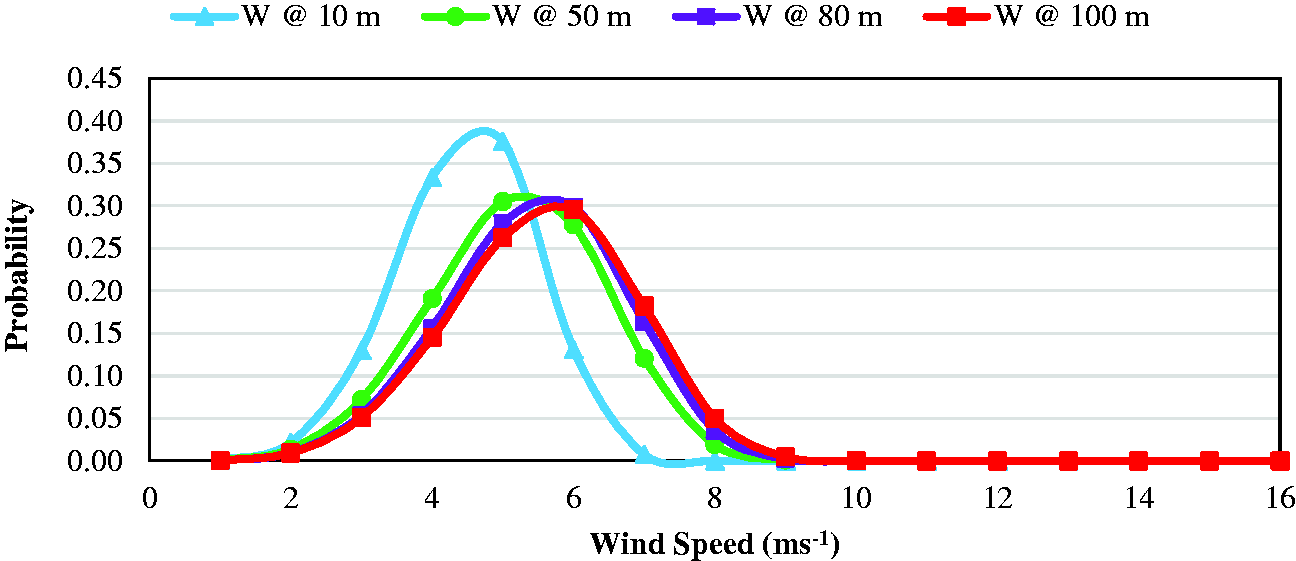
Weibull distribution curve for four heights at Gwadar.
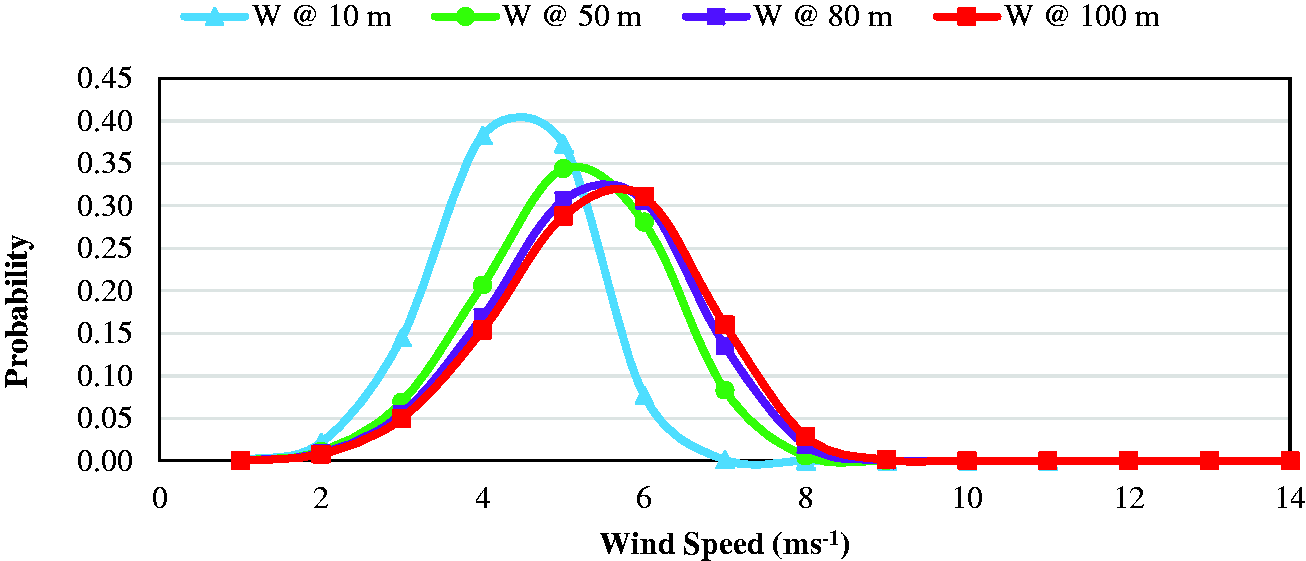
Weibull distribution curve for four heights at Jiwani.
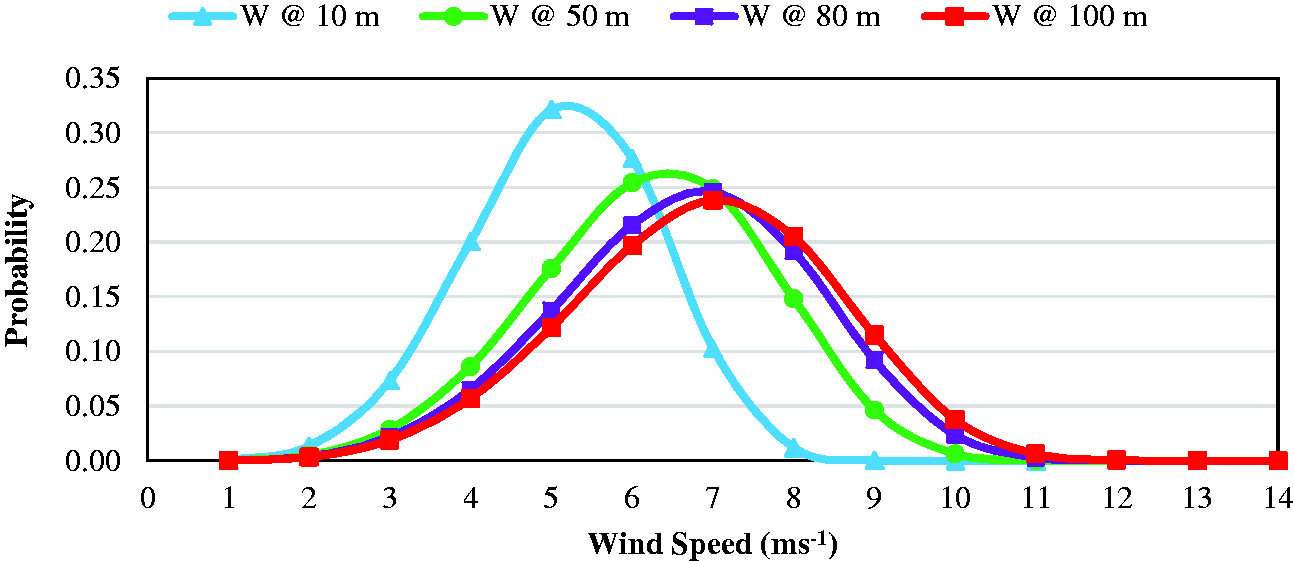
Weibull distribution curve for four heights at Karachi.
Coefficient of determination at various heights.
Variation in wind PD and wind ED with height
Using Weibull parameters and local air density calculated at each location for all heights, wind PD values have been calculated on monthly basis. Seasonal variation with height has been depicted in Figure 11. No generalized behavior of seasonal variation for all sites has been observed as it depends upon the wind patterns of individual site which may not necessarily be the same for all sites. However, a generalized behavior of impact of wind shear on PD in different seasons for all sites has been observed, i.e. with increase in height, PD increases more in winter than in summer. At Gwadar, for example, PD increases from 46.24 to 122.81 W/m2 (165.59%) by moving from 10 to 100 m height in winter while this increment is about 78.42% in summer. As winter season is most influenced by wind shear and summer is the least. Furthermore, comparison among all sites shows that Karachi is the most potential site while Jiwani is the worst. Same is the case regarding wind ED variation shown in Figure 12.
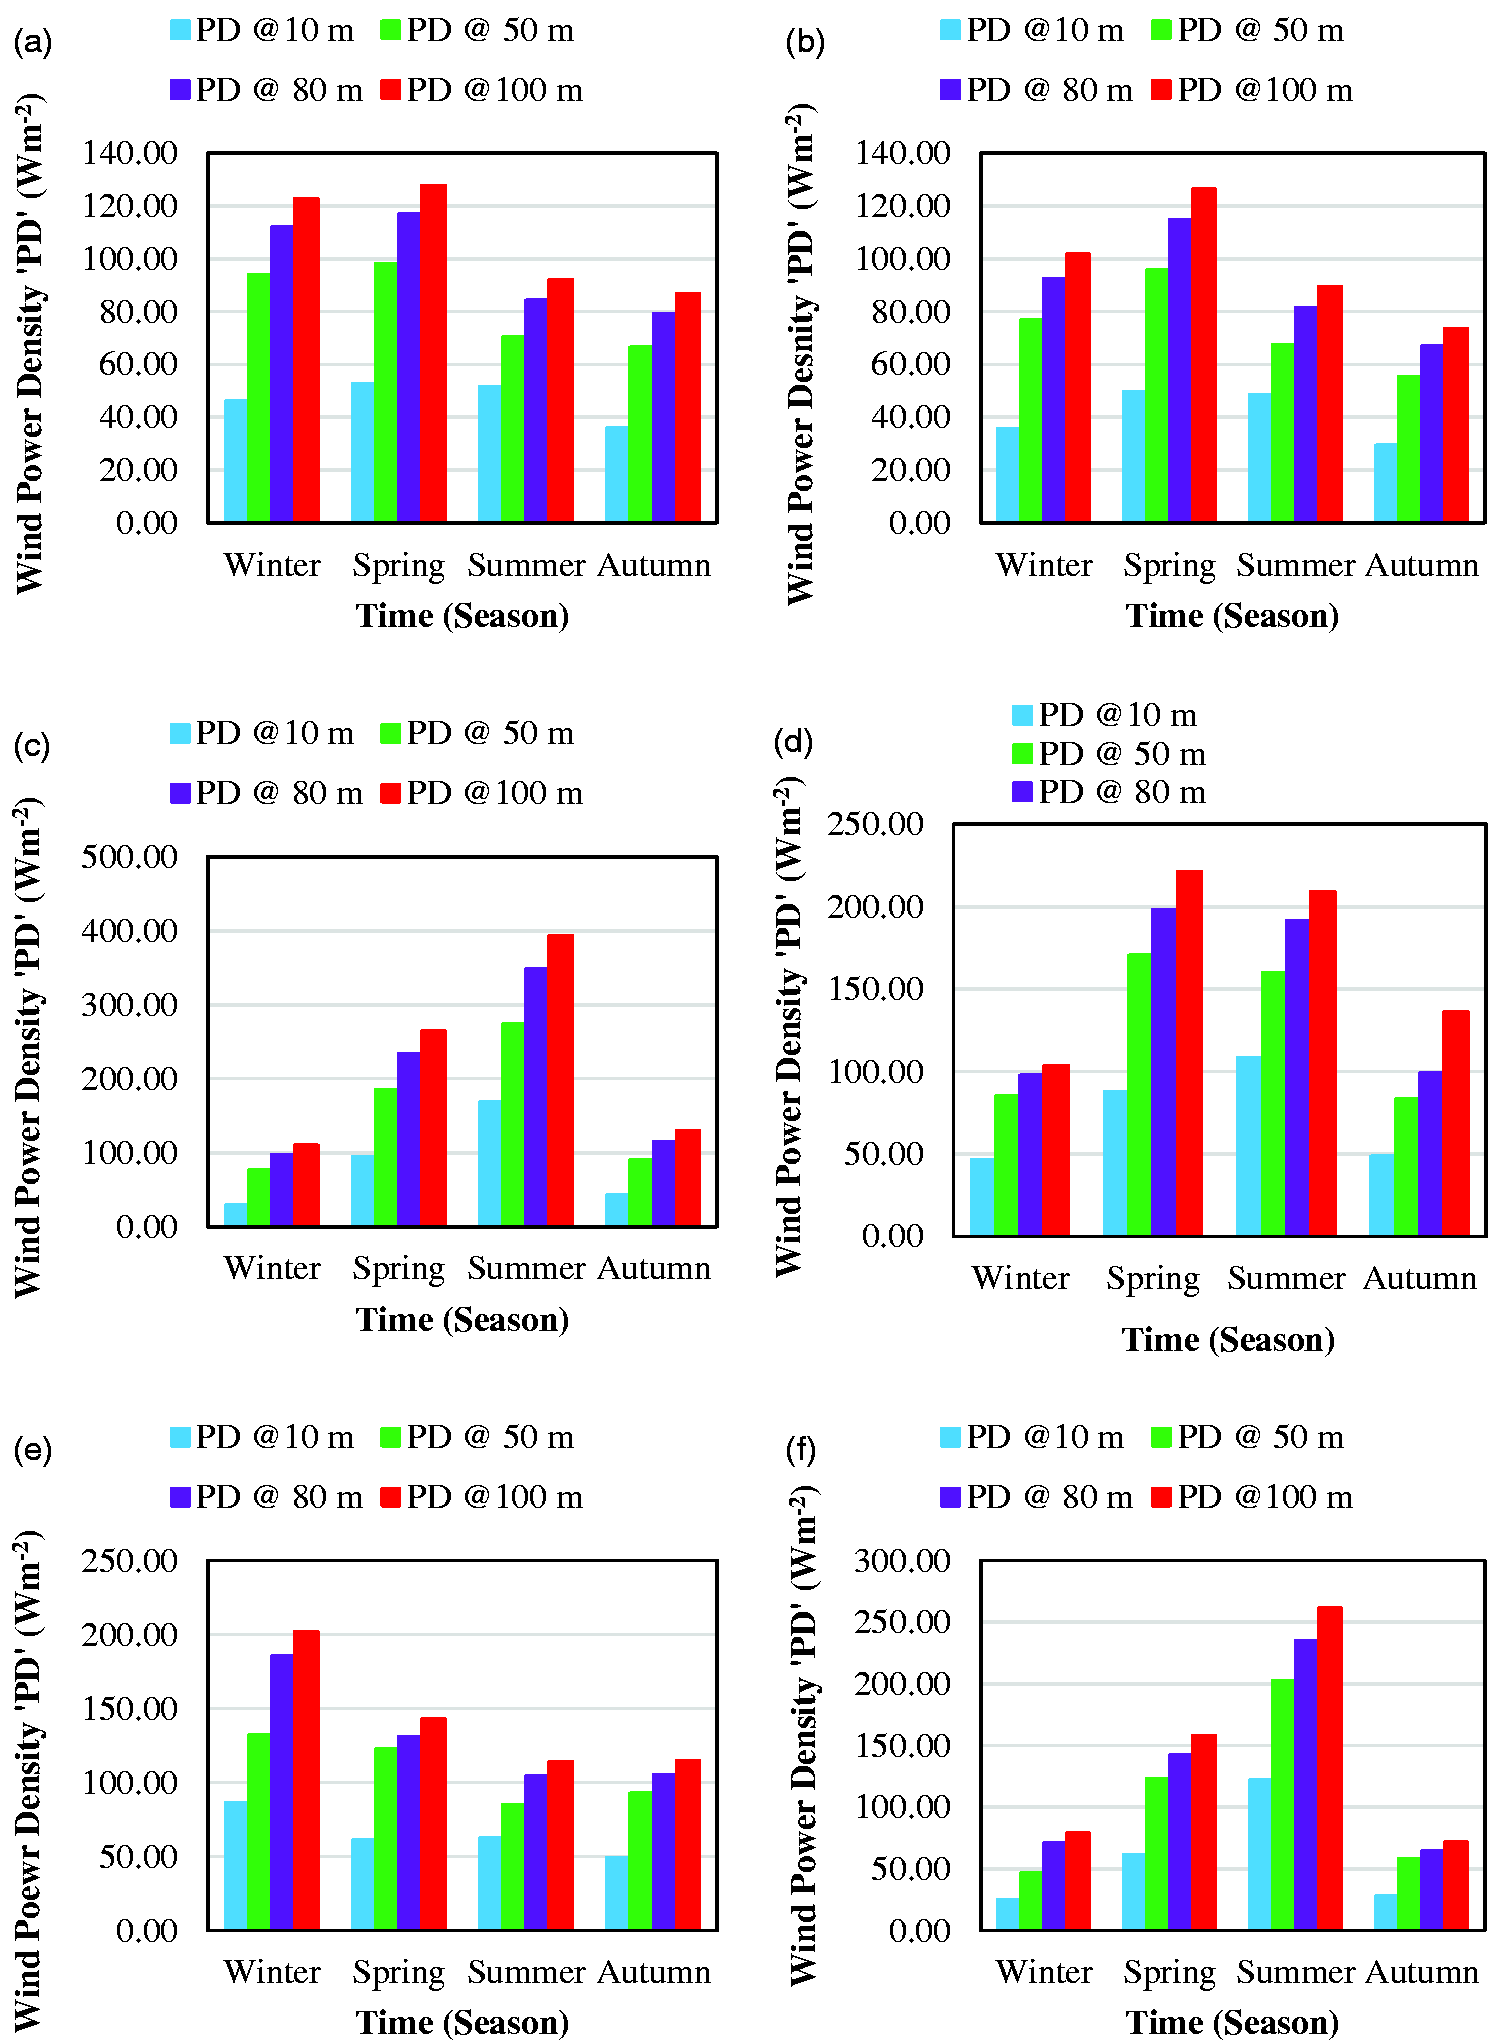
Seasonal variation in wind PD with height for (a) Gwadar, (b) Jiwani, (c) Karachi, (d) Ormara, (e) Pasni, and (f) Sonmiani Bay.
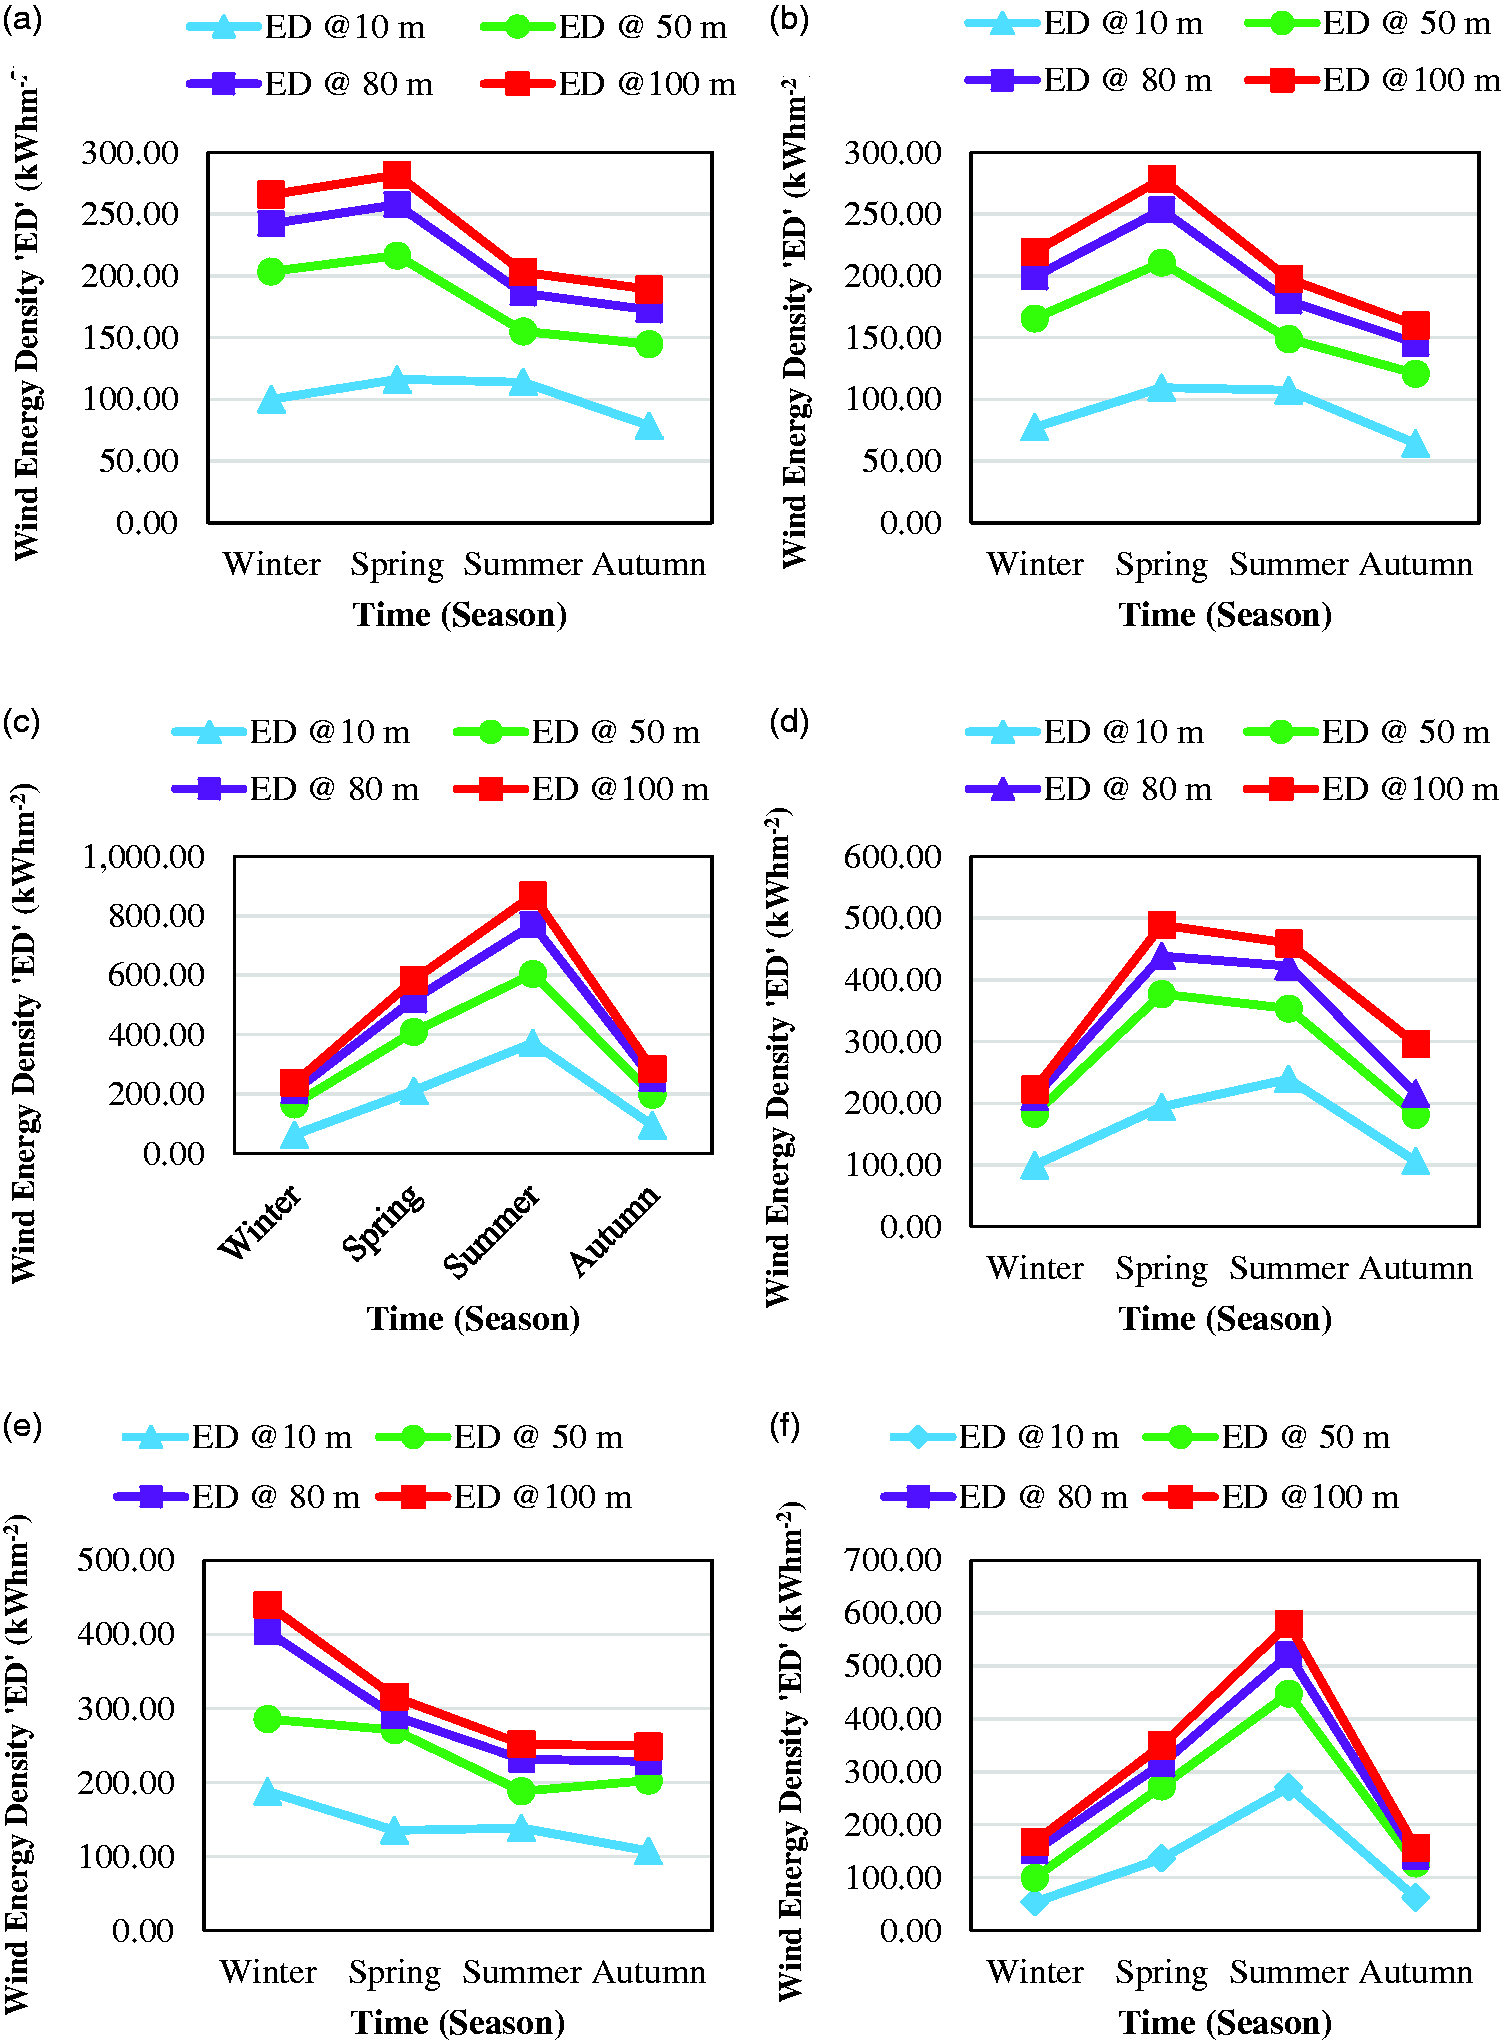
Seasonal variation in wind ED with height for (a) Gwadar, (b) Jiwani, (c) Karachi, (d) Ormara, (e) Pasni, and (f) Sonmiani Bay.
AEP and economic feasibility analysis
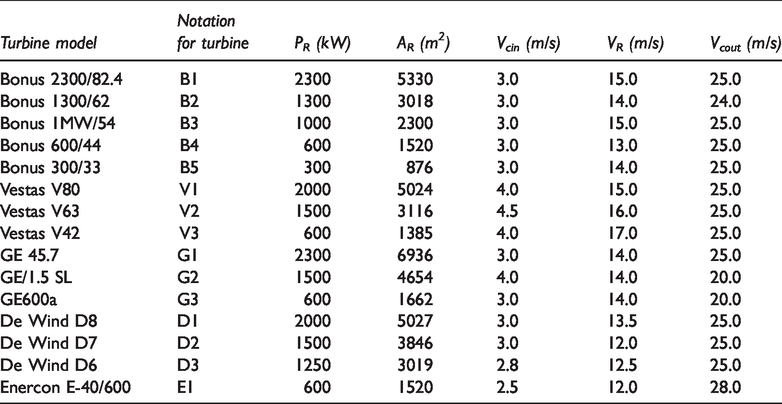
Fifteen turbine models which are most used in Pakistan and are planned to be installed along the coastline of Pakistan by GOP are listed in Table 6 along with their technical specifications (rated power, rated WS, rotor area, cut-in and cut-out speeds, etc.). General wind power curve (applicable to any turbine with its rated power, cut-in speed, cut-out speed rated WS) has been shown in Figure 13. AEP has been estimated for four heights of 10, 50, 80, and 100 m, respectively, along with the evaluation of CFs in each case. Amount of power produced (Pp), AEP, and CFs have been calculated for 10, 50, 80, and 100 m height, respectively. All these parameters have been found to be increased with increasing hub height and this is expected. Comparison among these turbines shows that G1 (GE 45.7) shows the best performance at all locations w.r.t AEP while B5 (Bonus 300/33) shows the least. For example, at 10 m height, G1 has Pp, CF, and AEP as 503.17 kW, 21.88%, and 4407.79 MW h, respectively, while corresponding values at 100 m height are 1337.18 kW, 58.14%, and 11,713.68 MW h, respectively. On the other hand, B5 has Pp, CF, and AEP as 63.40 kW, 21.13%, and 555.42 MWh at 10 m and 168.50 kW, 56.17%, and 1476.03 MWh at 100 m height, respectively. As CF alone cannot help in selecting of turbines, i.e. higher CF does not necessarily make a turbine feasible and vice versa. Selection of turbine also depends upon the economic feasibility. Therefore, unit cost of energy has been calculated and it was found that G1 is the most economical turbine at Gwadar and Jiwani while G2 at all other locations. On the other hand, V2 has been found the least economical for all locations. It can also be inferred that a single turbine cannot always be feasible at each location. Comparison among locations shows that Karachi is the most feasible site for wind power projects installation with highest Pp, AEP, and CF with minimum unit cost of energy ($0.019 and $0.017 at 80 and 100 m heights, respectively).
Turbine models with their specifications, PR (rated power), AR (rotor area), Vcin (cut-in speed), VR (rated speed), and Vcout (cutout speed).
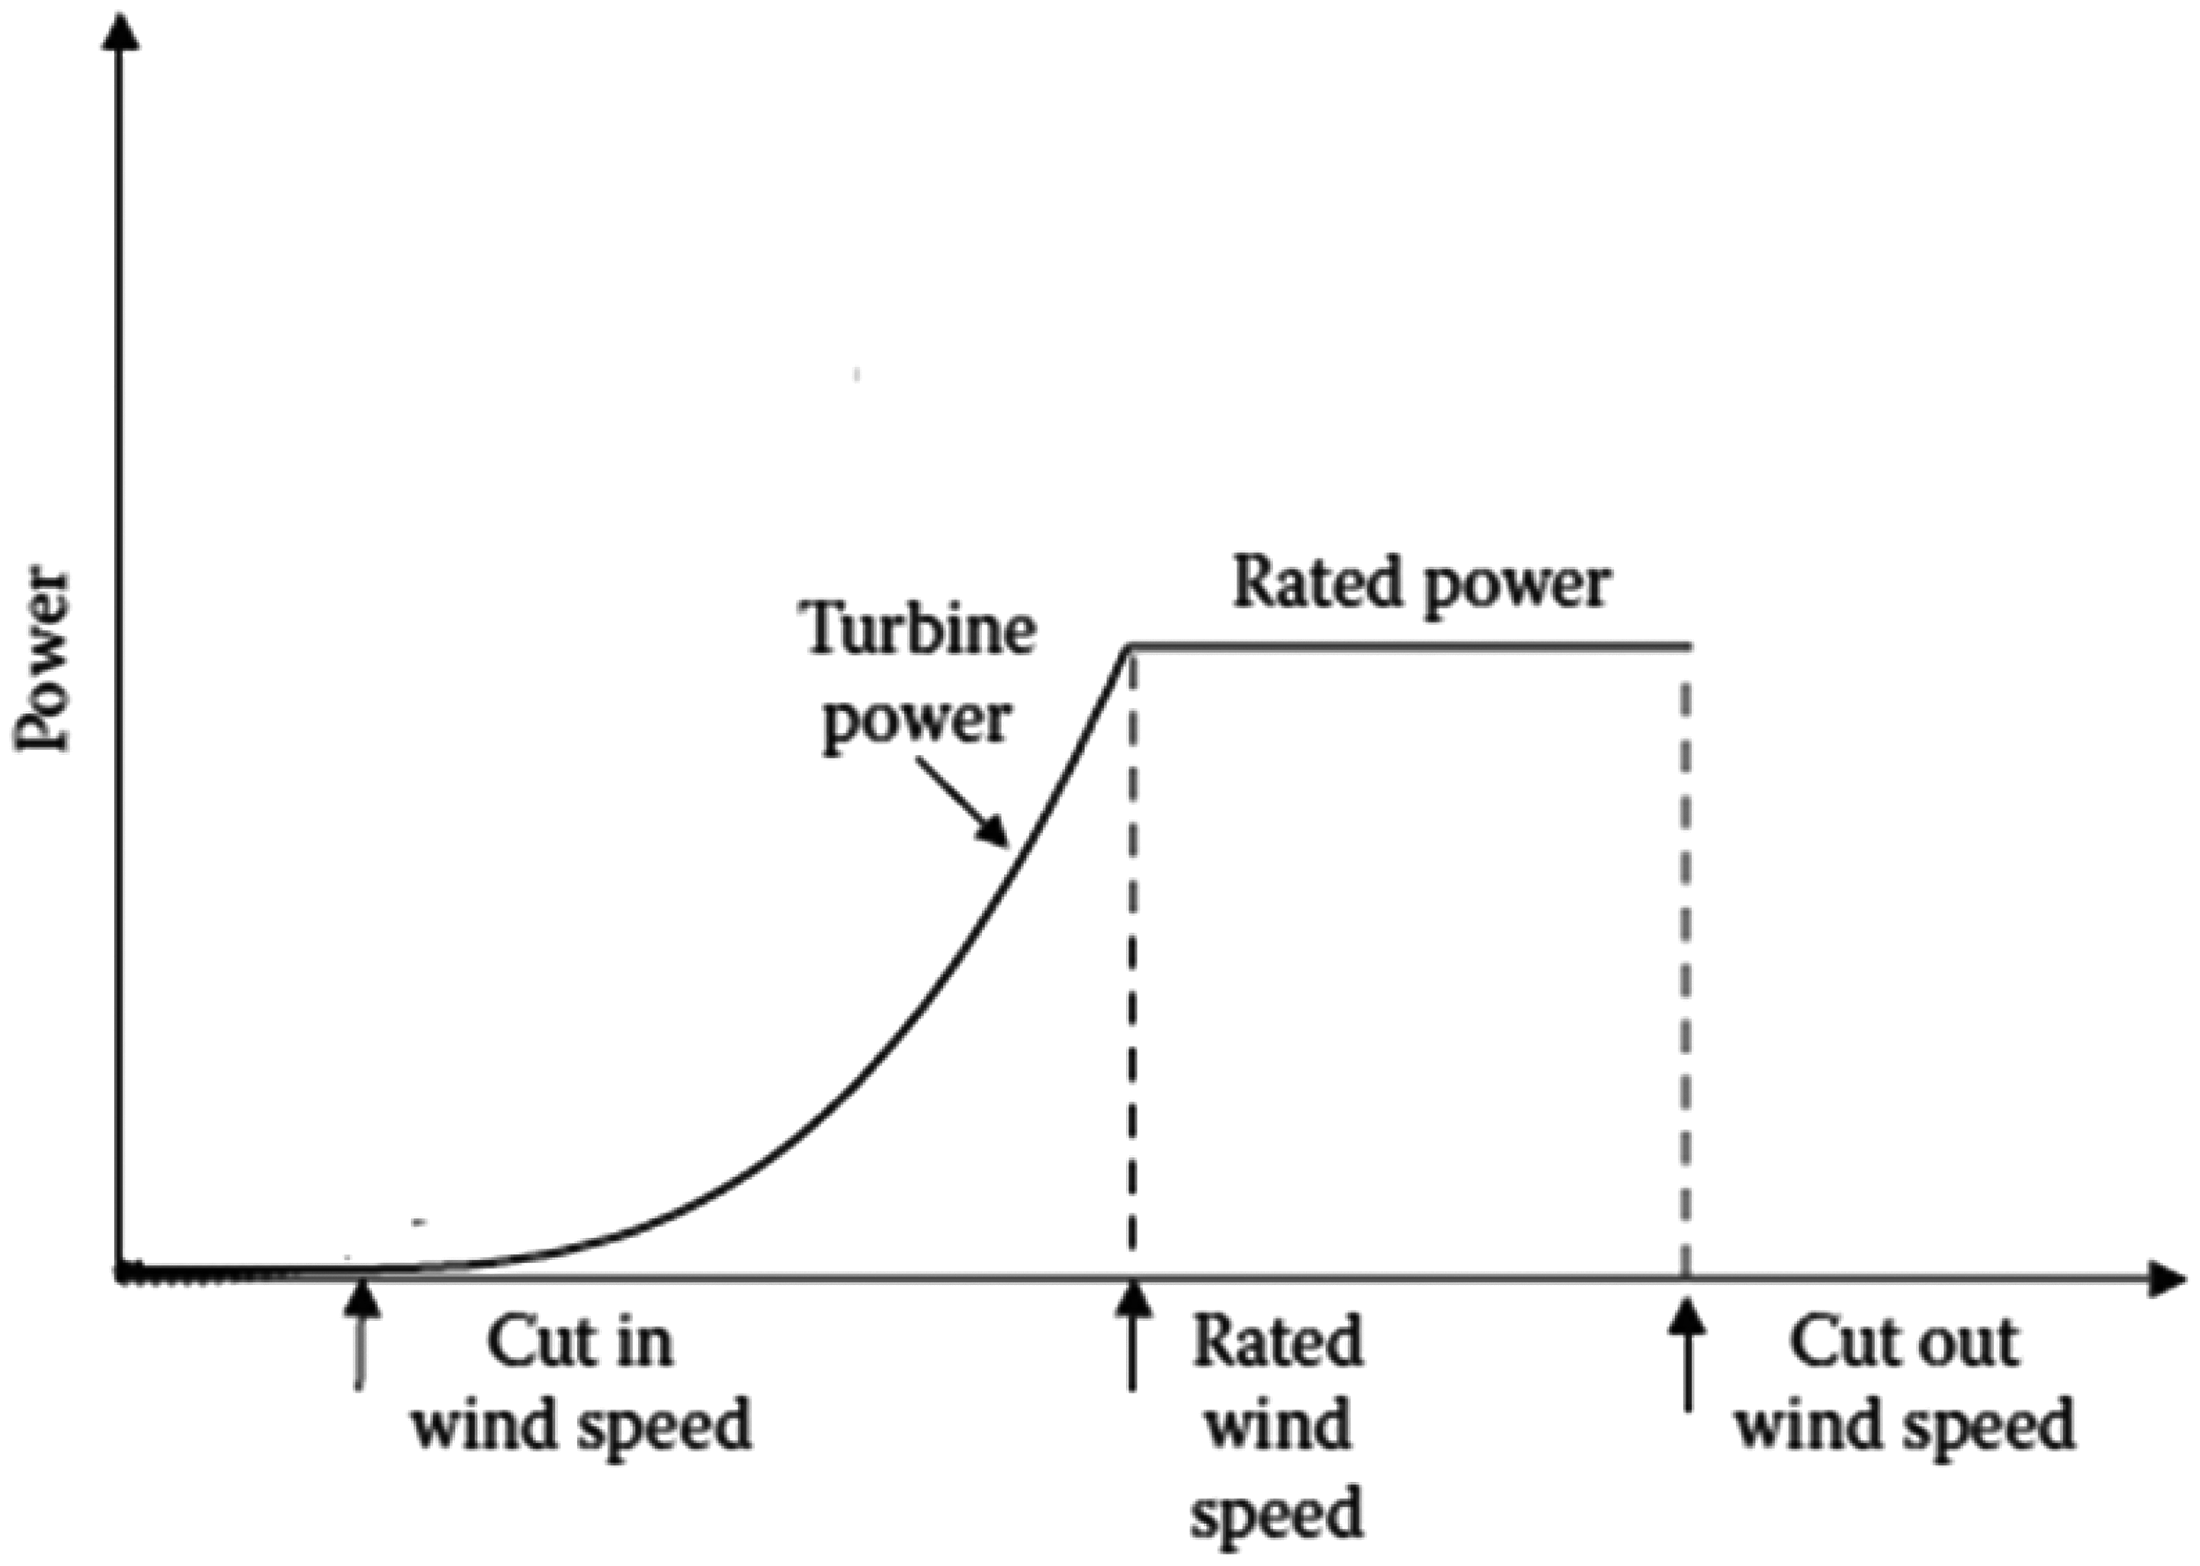
Generalized wind power curve for wind turbines.
Comparison of measured and predicted WS
As long-term wind data are required to estimate wind potential with significant accuracy, wind data measurement at higher heights is associated with higher measurement costs along with technical difficulties. Therefore, extrapolation is needed. In current work, wind data at 10 and 50 m height were available for 10-year period; however, measured wind data at 80 and 100 m heights were available for only one year of 2015. Therefore, using WSCs, WS was extrapolated to 80 and 100 m heights, respectively, for entire period. In order to analyze the accuracy with which WSCs extrapolated the wind data, a comparison between measured and predicted values for the year of 2015 was conducted and both data sets were found to be in good agreement, as shown in Figures 14 and 15, respectively.
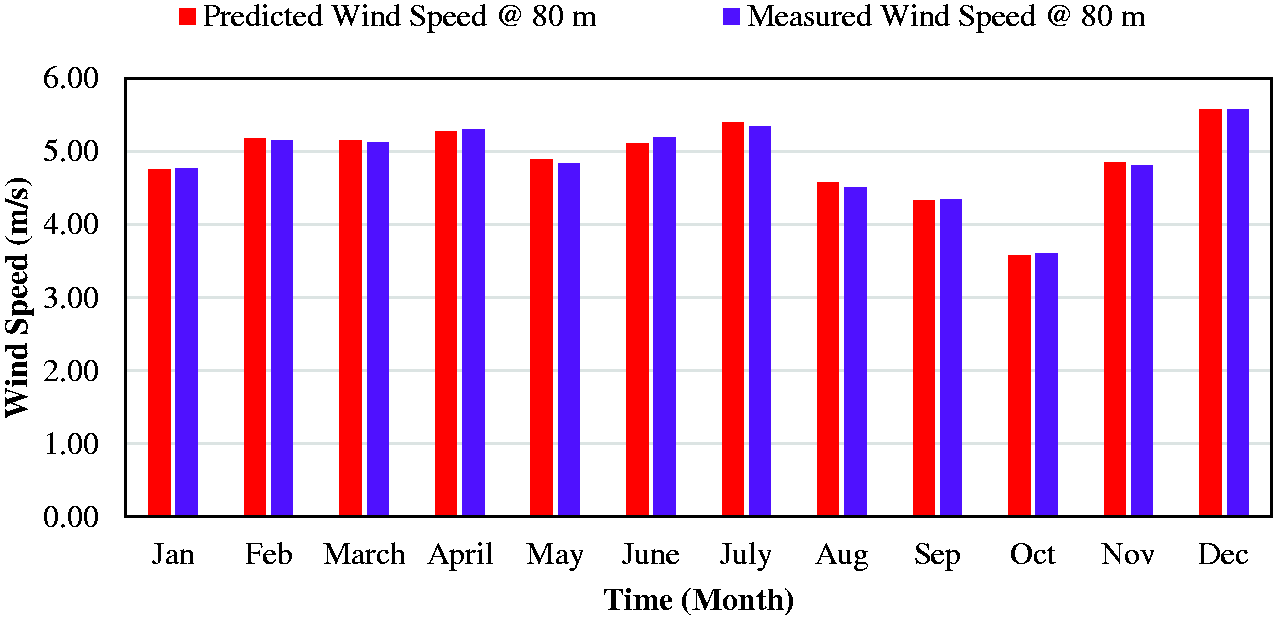
Comparison of measured and predicted WS values at 80 m.
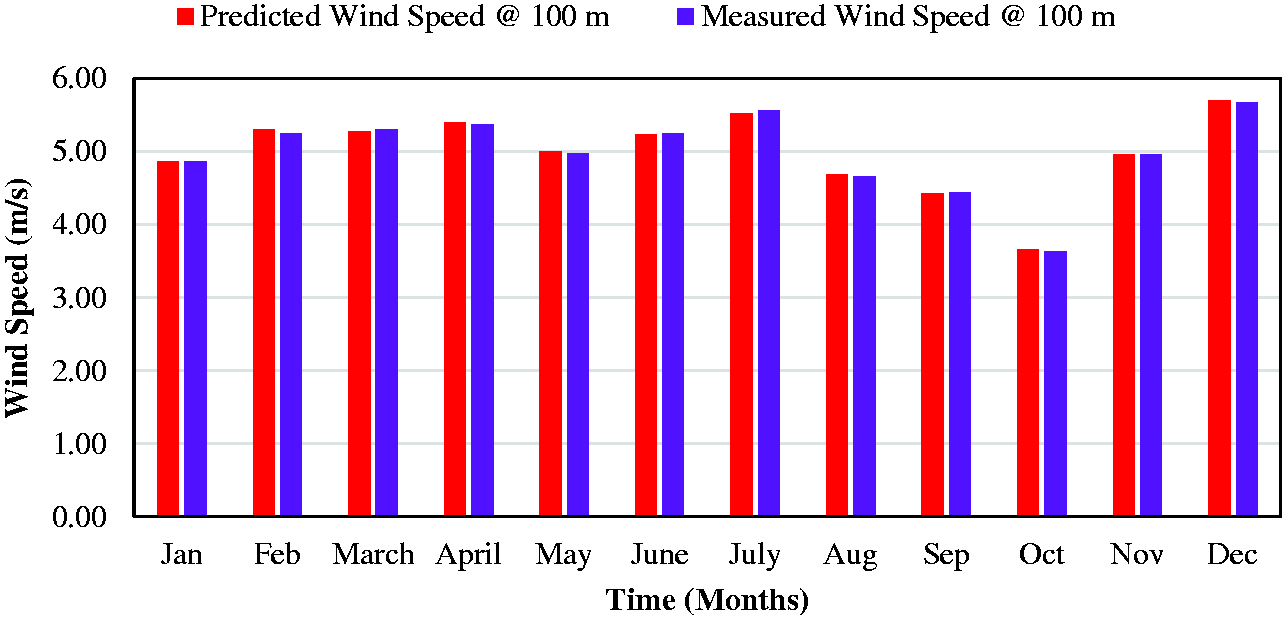
Comparison of measured and predicted WS values at 100 m.
Validation of results
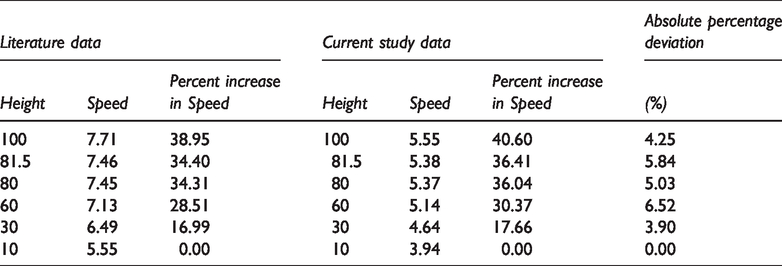
Historical data validation method has been used to compare the outcomes of this work. The validity of a model is determined with respect to method used and scope of research. This study mainly focuses on the investigation of wind shear effect to estimate wind power potential at higher heights where measured wind data are generally not available using power law model. This model has been found to be valid when compared with previous historical data, as shown in Table 7 (Azad et al., 2011; Dahmouni et al., 2011; Fırtın et al., 2011; Hulio et al., 2019b; Ilinca et al., 2003; Islam et al., 2011; Milanese et al., 2019; Mohammadi and Mostafaeipour, 2013; Ouammi et al., 2010; Shoaib et al., 2017)
Comparison of current study data with historical data (obtained from literature).
Conclusion
WSCs at six sites along the coastline of Pakistan have been estimated using measured wind data at two heights. Effect of wind shear on monthly and seasonal variation of different wind parameters has been analyzed along with wind power estimation using Weibull distribution. Finally, techno-economic feasibility analysis of AEP using 15 turbine models has been conducted. Following conclusions have been drawn from this work:
WSCs are maximum in winter and minimum in summer. The reason can be associated with temperature changes throughout the year. At high temperature, there is better mixing of air AGL and hence smaller values of WSC are expected and vice versa. On all investigated locations, summer is characterized by highest temperature followed by autumn, spring, and winter, respectively. Therefore, lowest values of WSC have been observed in summer followed by autumn, spring, and winter. With increase in height, the decrease in temperature is more prominent than decrease in pressure. Therefore, air density increases with increasing height. Similarly, with increase in height, Weibull shape parameter has been found to slightly decrease while Weibull scale parameter increases significantly. Wind PD and wind ED have been found to significantly increase with increasing height owing to the increase in both WS and air density with height. This increase has been found the most significant in winter while lowest in summer. G1 (GE 45.7) shows best performance w.r.t AEP at all locations, w.r.t CF and unit cost at Gwadar and Jiwani (for other locations, G2 has been found the best model). On the other side, B5 and V2 have been found the worst w.r.t AEP and both CF and unit cost (both), respectively.
Footnotes
Declaration of conflicting interests
The author(s) declared no potential conflicts of interest with respect to the research, authorship, and/or publication of this article.
Funding
The author(s) received no financial support for the research, authorship, and/or publication of this article.