
Abstract
Wind energy resource assessments for Pentecost Island and Epi Island in Vanuatu were carried out using one year of wind data. The wind data were used to calculate the daily average wind speed, diurnal variation of wind speed and monthly average wind speed. The diurnal variation of wind shear coefficient of the site was also studied and it correlated well with the temperature variation. Ten methods were used to determine the Weibull parameters and the wind power density of the site. The best method was determined using the goodness of fit test/error where the correlation coefficient, coefficient of efficiency, root mean square error, maximum absolute error and maximum absolute percentage error for the 10 methods were compared. It was found that the moments method was the best method for obtaining the shape parameter (k), the scale parameter (A) and the correct wind power density for the Pentecost Island site, whereas for the Epi site, the median and quartiles method performed the best. The mean wind speed for the Pentecost site was 5.60 m/s, while that for the Epi site was 5.86 m/s. The Weibull parameters were also estimated for the two seasons for both the islands. The wind resource maps showing the wind power density were also obtained. The annual energy production from 10 Vergnet 275 kW wind turbines, positioned at good locations on the digital wind map, was estimated. Finally, an economic analysis of the turbines was carried out, which indicated a payback period of 4.85 years.
Keywords
Introduction
Vanuatu is a Pacific Island country consisting of about 80 islands in a Y-shaped chain. The land area of Vanuatu is about 12,200 square kilometres with a population of around 234,000. The islands are of coral and volcanic origin with some islands still having active volcanoes. Most of the islands have dense forests which are well watered with mountainous peaks. The climate in Vanuatu is tropical with temperatures varying between 23–33°C. There is substantial amount of rain with humidity averaging about 74%. Winds are variable throughout the year with high possibilities of tropical cyclones (Gale, 2018). The wind resource assessment presented in this paper is for Pentecost Island and Epi Island in Vanuatu. The geography of Pentecost Island is mountainous stretching from north to south over 60 km with the highest point reaching almost 947 km, which is Mount Vulmat. The western side of the island is mostly temperate, whereas the eastern side of the island is humid and rainy. The island is suited for agriculture since it is very green (Brand, 1967). The Epi Island is of volcanic origin, which is approximately 833 m above ground level (AGL). The Island stretches 43 km long, 18 km wide and has black volcanic sand beaches, three fresh water lakes and few volcanoes (Brand, 1967).
The increase in pollution, energy consumption and exploitation of limited fossil fuel resources have driven scientists and engineers to search for better, cleaner and renewable sources of energy that can be used as a substitute to fossil fuels, which have hazardous effects on the atmosphere. The use of fossil fuels has contributed and played a major role in the depletion of the ozone layer resulting in global warming. The global warming seems to be the major cause of sea-level rise in pacific island countries due to the shrinkage of polar ice caps.
Wind energy is a fast developing technology compared to other renewable energy technologies. The advantages of wind and solar energies over fossil fuels are that they are clean energy sources. The countries in the South Pacific face a major threat due to climate change. Over the years, the major contributor to climate change is global warming. Global warming is caused by greenhouse gases such as carbon dioxide. This gas consumes sunlight which bounces back from the earth’s surface and stays for longer periods of time in the atmosphere contributing to greenhouse effect. Over the years, the use of fossil fuels has increased contributing to a higher emission of greenhouse gases. The pacific island countries are the worst affected because they are surrounded by the sea and many of them have low-lying atolls. The increase in harsh environmental conditions and rising sea levels has motivated increased investment in the feasibility studies of renewable energy technologies. These studies could help to exploit the renewable sources of energy and decrease the import of fossil fuels to the Pacific in the future. This can contribute to 100% clean energy sources with less hazardous impacts on the atmosphere (Prasad et al., 2017). The renewable energy power generation target for most of the pacific island countries is 100% by 2020–2030. As of now, Vanuatu generates about 26% of its power from renewable sources. Vanuatu has already installed wind farms and plans to further increase the power generation with wind turbines.
To decide the locations for installing the wind turbines, a detailed wind resource assessment needs to be carried out. Accurate wind resource assessment requires the knowledge of exact Weibull parameters at the measurement locations with the help of which the exact wind power density (WPD) can be estimated. This will help in the estimation of accurate annual energy production (AEP) from the proposed turbines. To find the accurate Weibull parameters, a number of methods have been proposed and tried at different locations all over the world.
Researchers have been actively involved in wind resource assessment studies to find the accurate AEP at the measurement locations that will enable implementation of advanced designs and modifications to existing renewable technologies. These studies will help to contribute in the reduction of fossil fuel usage significantly. The world will soon be in an energy crisis if relevant research is not carried out in the field of renewables (Prasad et al., 2017). In the area of wind energy, accurate estimation of WPD is crucial. The Weibull parameters, which are the shape factor (k) and the scale factor (A), are calculated by several methods and compared to find the WPD. Ozay and Celiktas (2016) used a two-parameter Weibull statistical distribution to analyse the wind characteristics of Alacati region in Izmir. They used five and a half years of data for three heights of 70, 50 and 30 m AGL, respectively. The data sets were recorded at an interval of 10 min. Using the two-scale parameter method, they found the average wind speed to be 8.11 m/s, the shape parameter (k) was 2.05 and the scale parameter (A) was 9.16. The wind rose diagrams suggested that higher wind speeds occurred between sectors 340–360°, whereas lower wind speeds occurred between sectors 10–29°. Saleh et al. (2012) studied the wind data for Zafarana Project in Suez Gulf to estimate the Weibull parameters using five methods. They used monthly averaged data for one year. They compared their accuracy based on the root mean square error (RMSE) and found out that the maximum likelihood method (ML) is best suited for the estimation of wind speed distribution in the particular region. Seguro and Lambert (2000) compared three methods for estimating the Weibull parameters: the graphical method, the ML and the modified maximum likelihood method (MML). They found out that the ML was best to use if the data were in time-series format, and the MML was best to use if the data were in frequency distribution format. Akgül et al. (2016) studied the wind speed data provided by Turkish State Meteorological Service and found that the least squares estimators are less efficient for estimating Weibull parameters. They also found out that the ML and MML are best for estimating the Weibull parameters. The distributions in this case were compared by using the correlation coefficient (
Thus, it is clear that many previous researchers employed only one method of finding the Weibull parameters, some others used more than one method. The present work involves estimation of accurate Weibull parameters using 10 different methods of finding Weibull parameters and five different goodness of fit/error estimation methods. The previous works presented above have not used 10 methods and found the best method that gives the most accurate Weibull parameters and WPD. The present work also involves detailed analysis of wind characteristics including estimation of diurnal variation of wind shear coefficient from the entire data, diurnal variation of temperature, the correlation between them for two different locations and estimation of turbulence intensities. Moreover, the data are divided according to the seasons in Vanuatu, and seasonal variation of wind speed and direction as well estimation of seasonal Weibull parameters are unique in this study. An economic analysis is also carried out which gave the payback period based on the current electricity charges in Vanuatu.
Data and methodology
The detailed wind resource assessment is carried out for two locations in Vanuatu. The data were acquired using Integrated Renewable Energy Resource Assessment Systems (IRERAS) that consisted of 34-m tall towers and different instruments and sensors. The details of the instruments and sensors, the locations of measurements, the data modelling using Weibull distribution and the methods used for estimating Weibull parameters, the performance analysis of different methods and the validation of data are presented in the following subsections.
Method
Two IRERAS towers were installed at the two sites that are being studied to measure the wind data. The tower is a 34-m tall NRG systems tower that is hinged to a base plate which is supported by a gin pole and guy wires. There are several sensors in the IRERAS tower that measure wind speed, solar insolation, wind direction, barometric pressure, temperature, relative humidity and rainfall. The measured data are collected in a NRG SymphoniePlus data logger through the use of an SD card. The data are then transferred to the ICT centre at the University of the South Pacific through the use of a GSM iPack, which is combined with a SIM card. These data are transferred through a mobile network to the main server. There are several instruments and sensors integrated with the tower. Cup anemometers are used for measuring wind speeds at 34 m and 20 m AGL, respectively. The accuracy of the anemometers is 0.1 m/s ranging from 5–25 m/s. A wind vane was used at 30 m AGL to measure the wind direction and was aligned to the true north direction. For measuring barometric pressure, a barometric pressure sensor was used. A temperature sensor enclosed in a circular six-plate radiation shield was used to measure accurate temperature. The data logger is interfaced with a Symphonie Pack system through internet enabled logging system. Any GSM network of a local internet service provider could send data over as an email attachment using a SIM card. There are a total of 15 channels in the data logger which measure mean values, maximum values, minimum values and the standard deviation of the data. The data are recorded at a 10-min interval and sent to the main server once a day. Table 1 below shows the specification of the sensors.
Measurement sensor specifications.
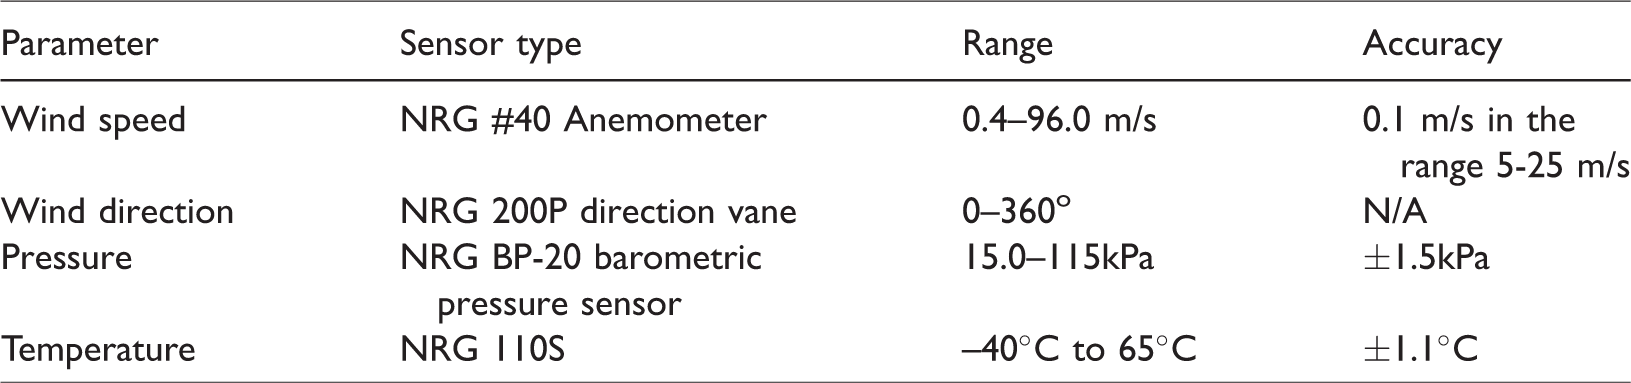
Figure 1 shows the location of the measurement site on the island of Pentecost. The site is near the village Lebukunvile and is located at 15°41’7.16”S, 168°11’34.83”E. Initial measurements performed at this site indicated good winds, based on which it was decided to install the Integrated Renewable Energy Resource Assessment System (IRERAS) there.
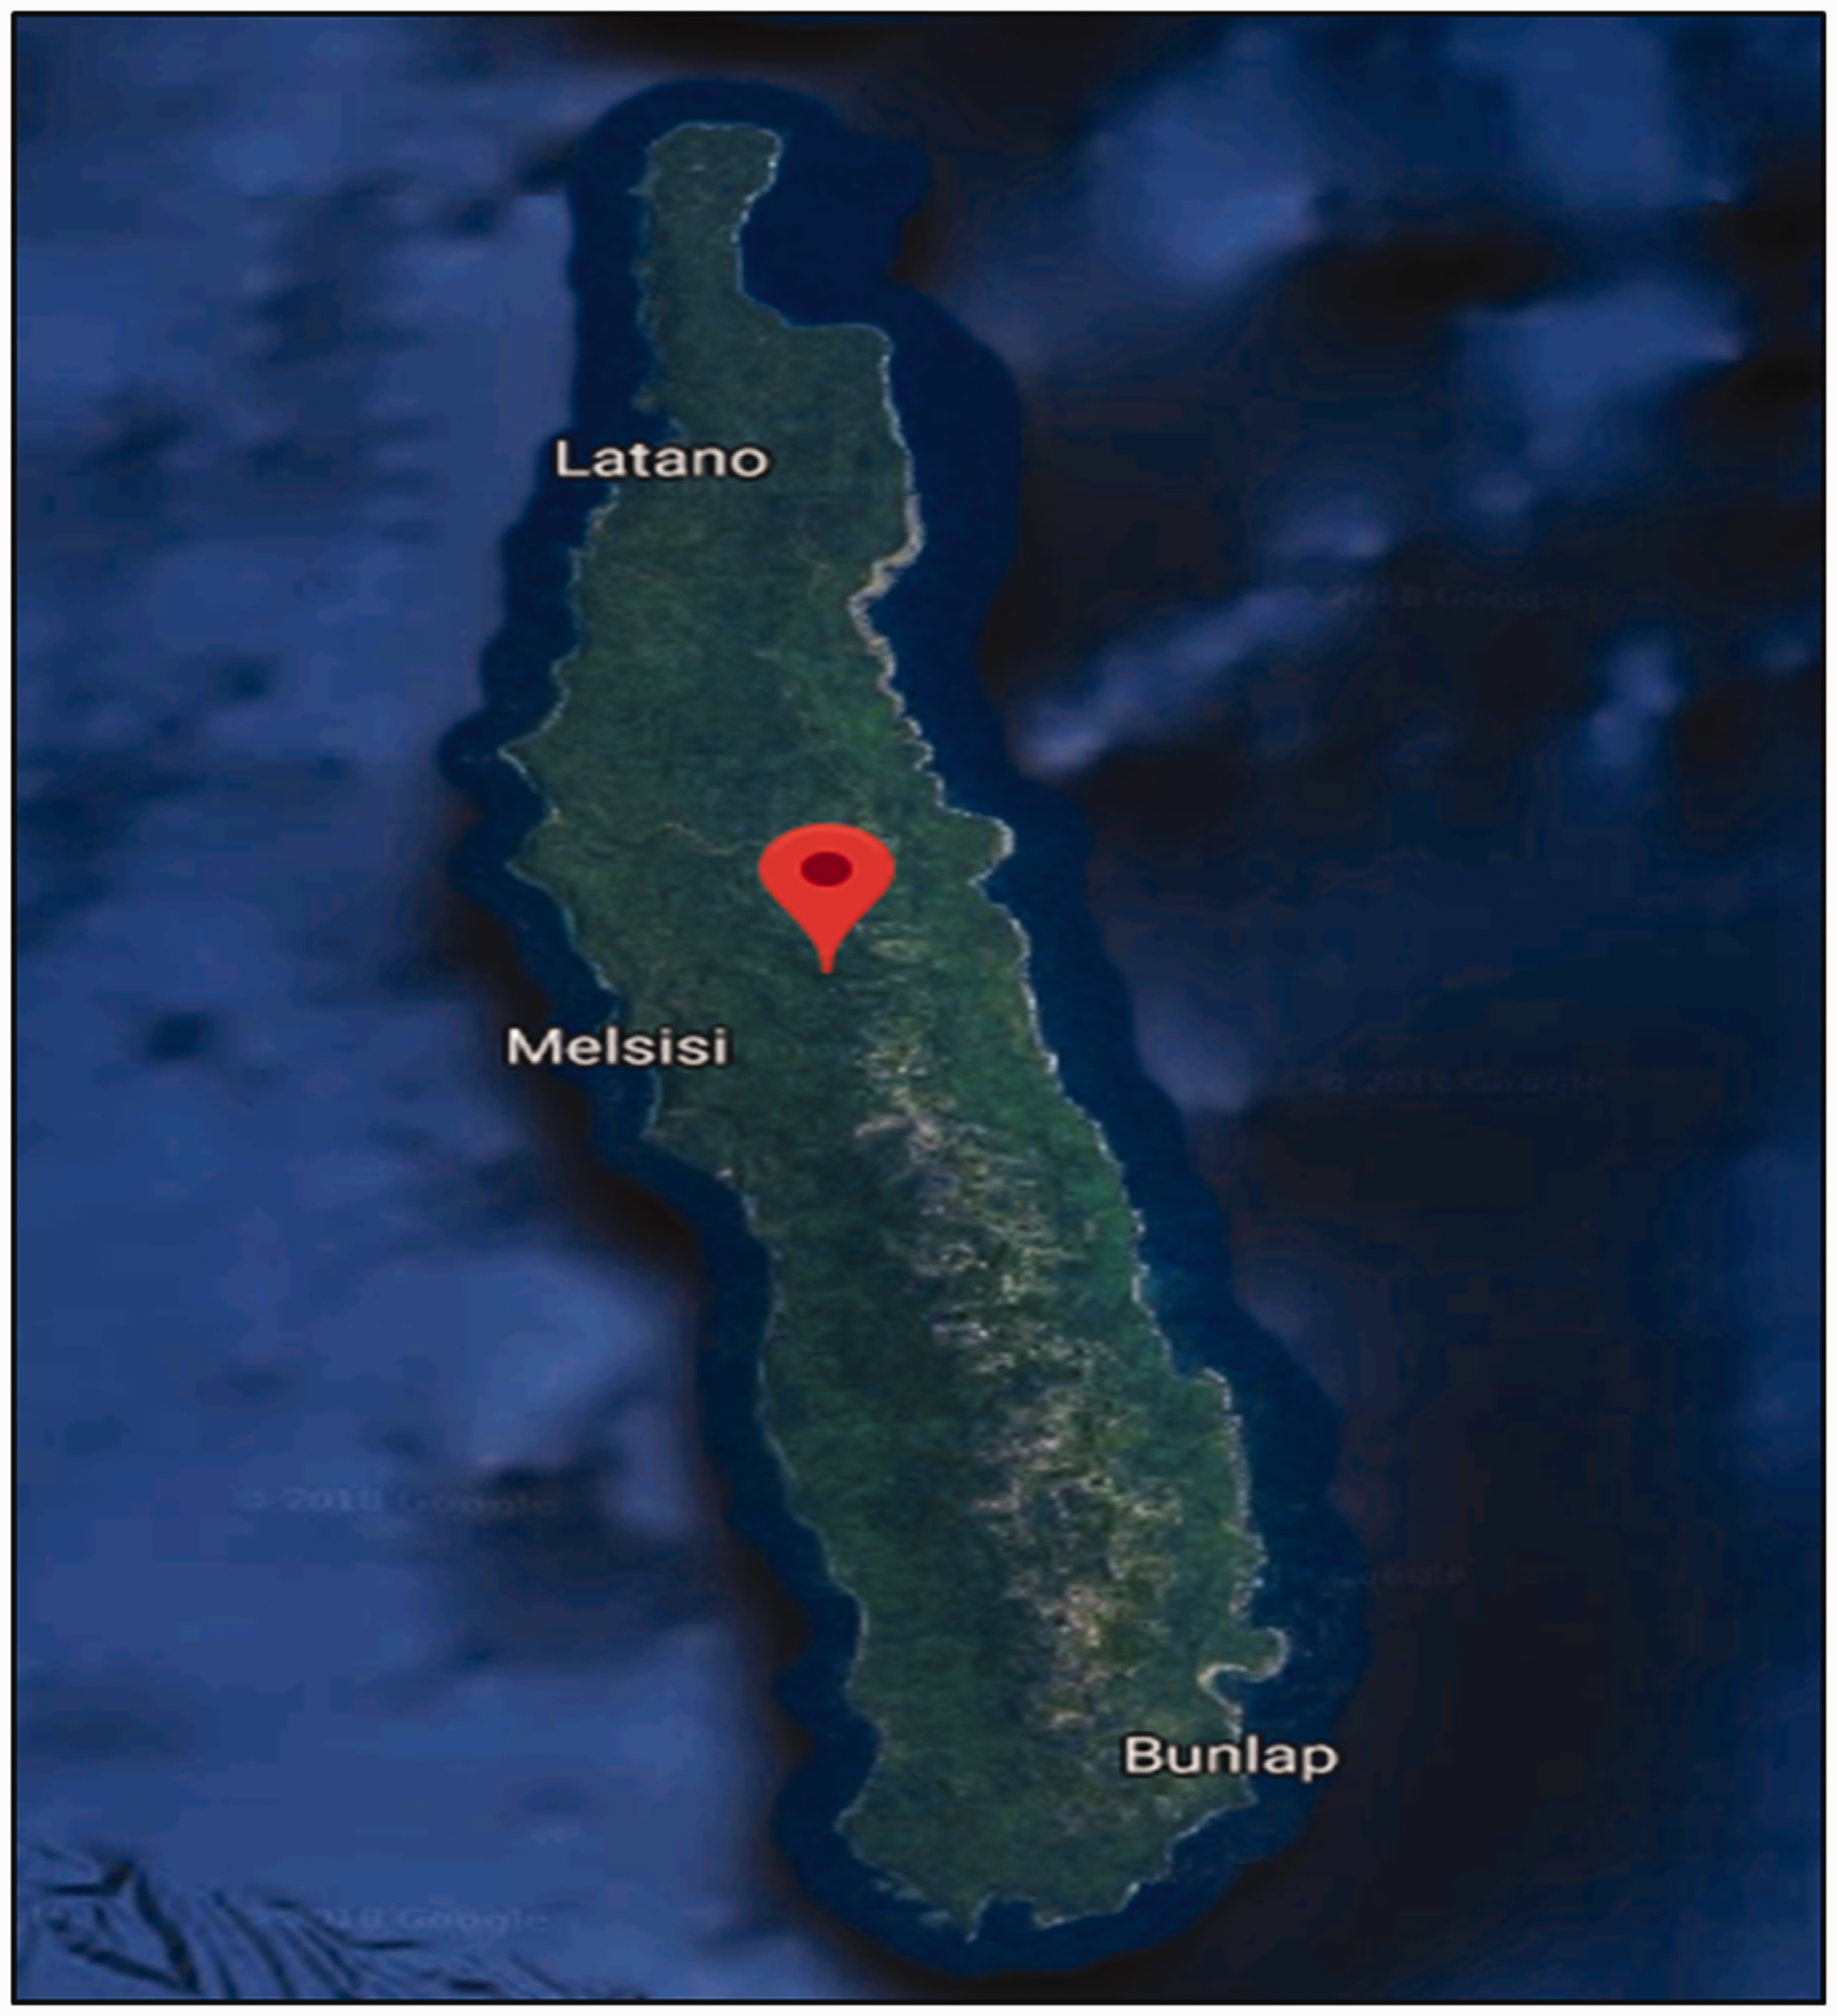
Location of the measurement site on the map of Pentecost Island in Vanuatu.
Figure 2 shows the location of the measurement site on the island of Epi. The site is located at Paia Hill with the coordinates 16°35’12.17”S, 168°11’51.48”E. Some previous measurements at this location had showed good potential of wind power generation, hence this site was chosen for the installation of IRERAS and long-term measurements. Both the sites required clearing the area of trees to reduce surface roughness and to avoid unnatural wind shear. However, both the sites are not far from the sea (being small islands), hence the wind speeds are expected to be higher and only slightly less than the offshore winds that are normally high due to low roughness and small friction on the sea surface (Zheng et al., 2016).
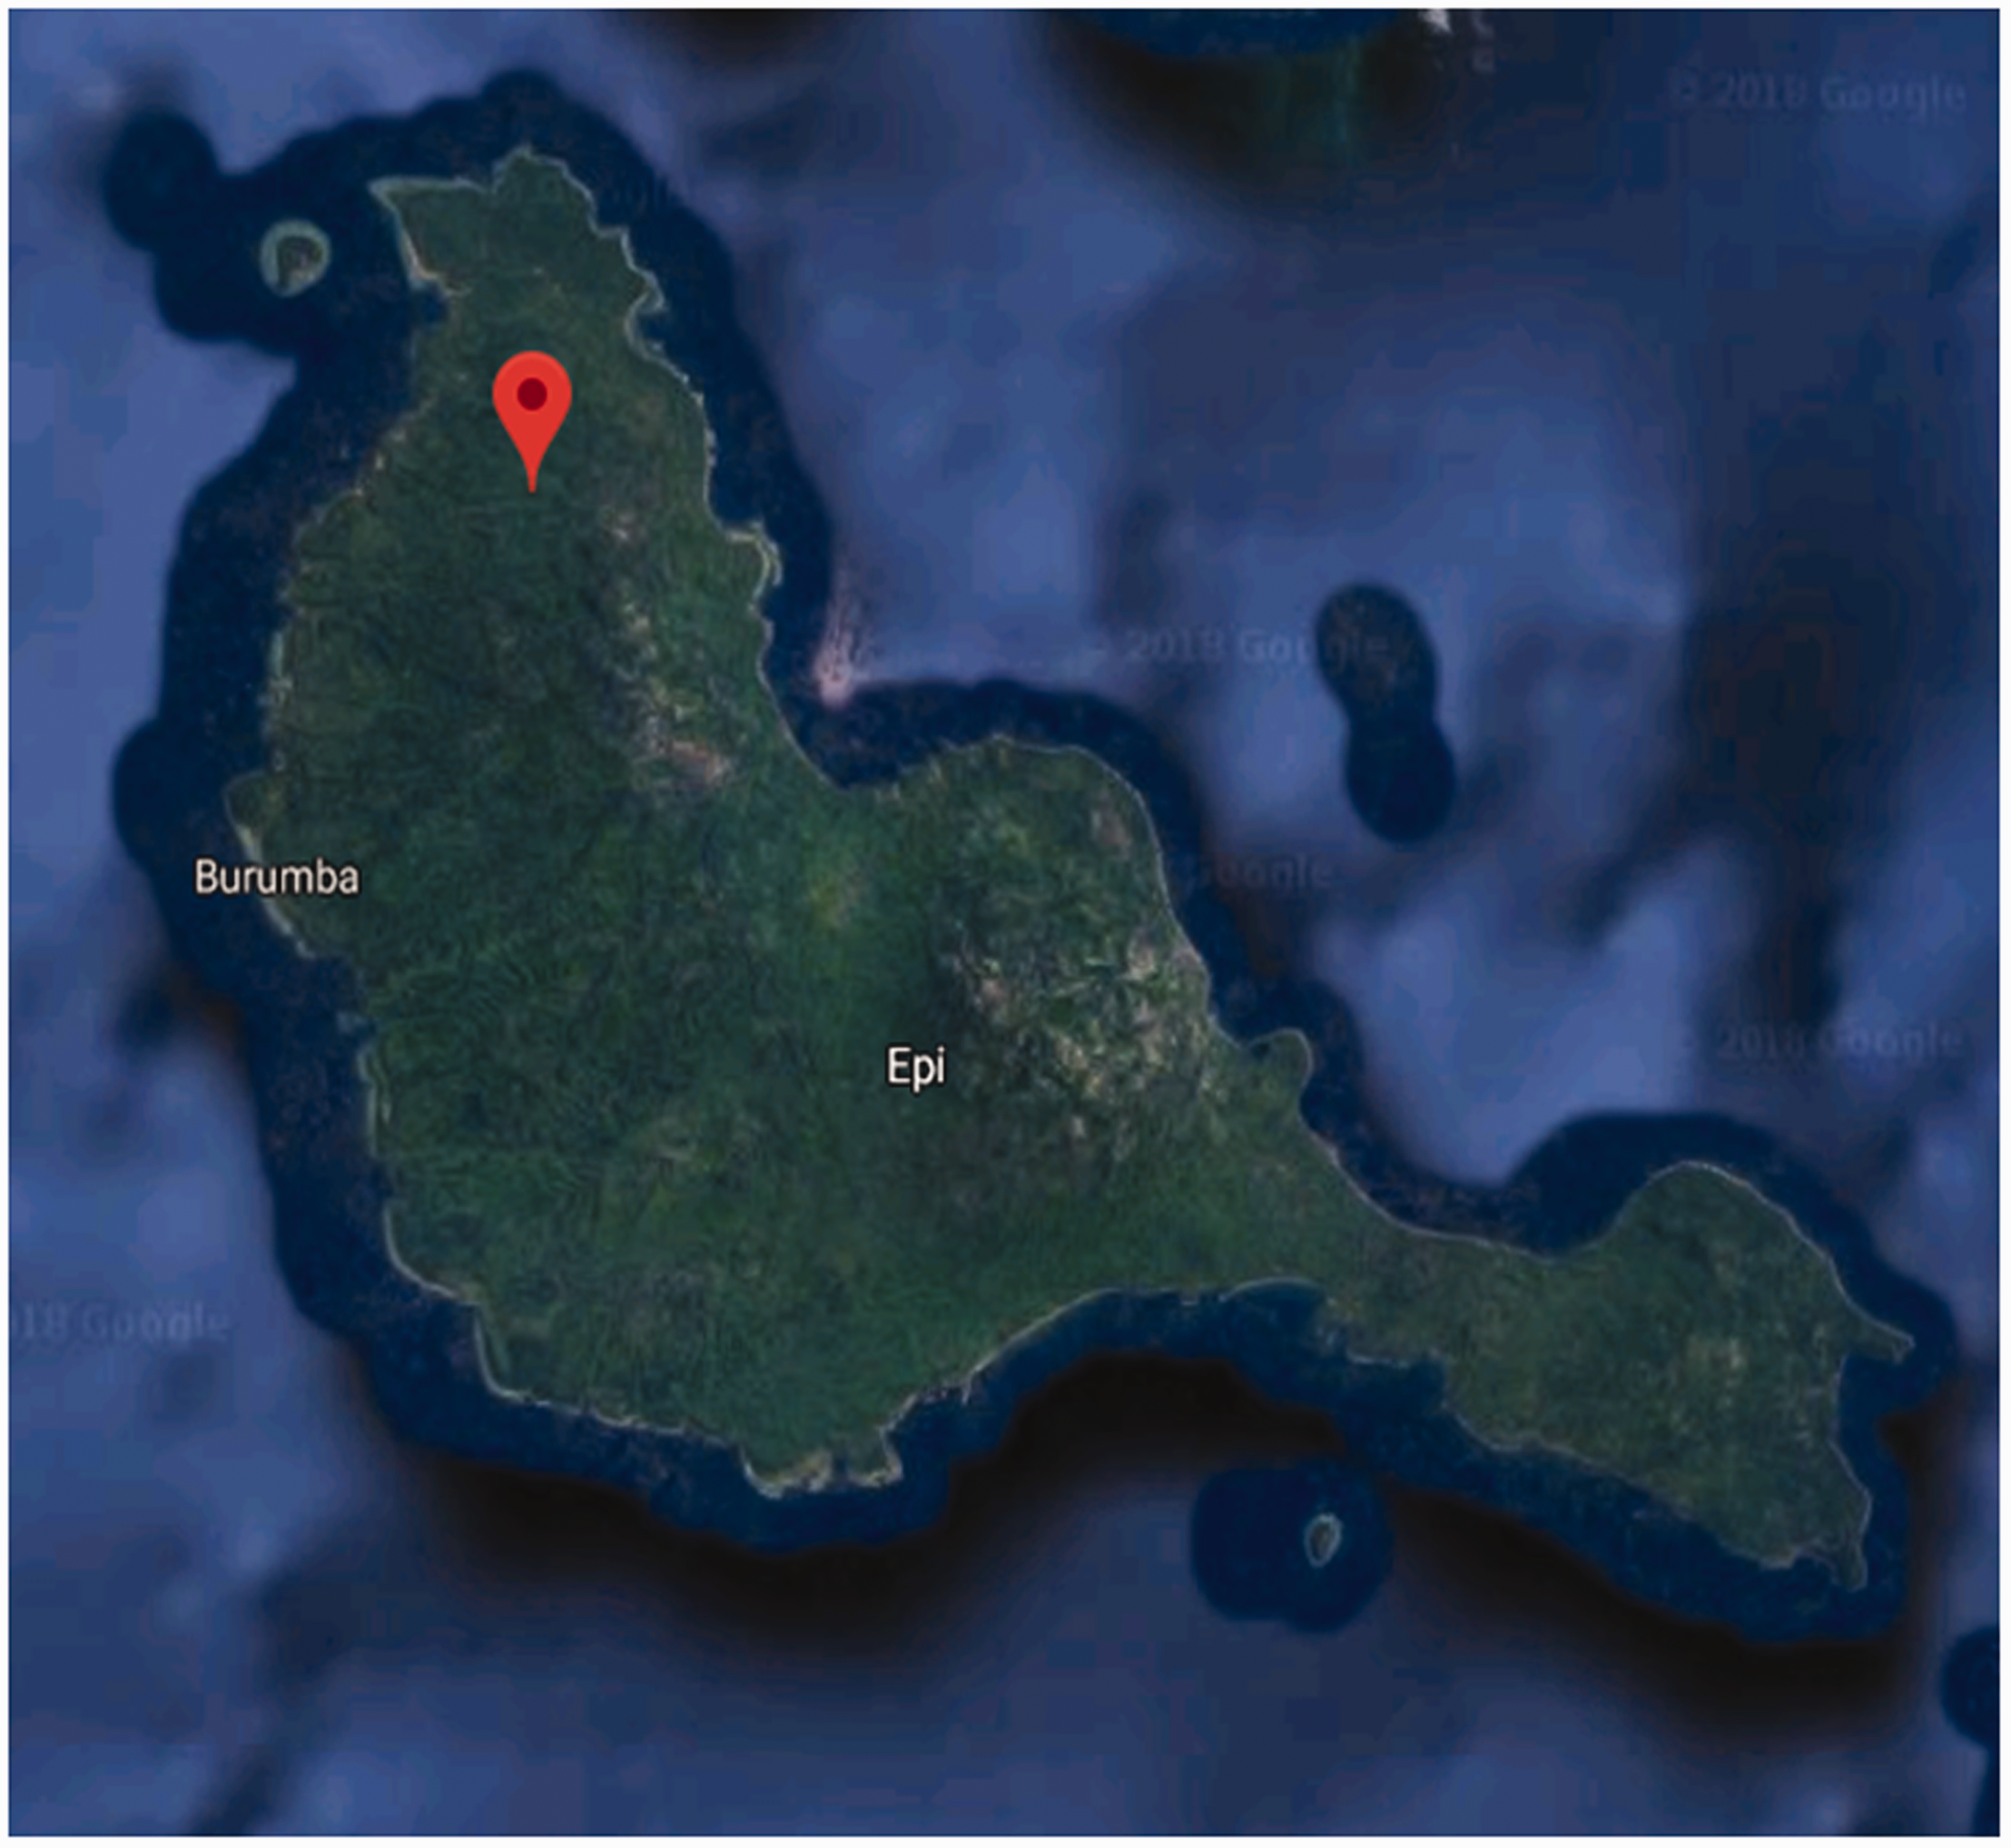
Location of the measurement site on the map of Epi Island in Vanuatu.
Data modelling and estimation of Weibull parameters
The Weibull distribution in probability theory and statistics is the continuous probability distribution. This distribution model is named after a Swedish mathematician named Waloddi Weibull. This distribution is used in reliability engineering and also in other fields due to its relative simplicity and versatility (Akdağ and Güler, 2018). The two-parameter Weibull distribution expression is given by equation (1) (Patel, 2005)
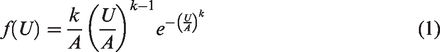
There is another form of Weibull distribution which is called the one-parameter Weibull distribution even though it has two parameters (shape and scale parameters), but in this case, the shape parameter is assumed to be known beforehand. The Weibull distribution can be used to model a variety of life behaviours depending on the values of the parameters (Keyhani et al., 2010).
The study of wind energy is quite complex because random data are recorded at intervals, therefore it is very important to carry out a detailed statistical analysis. There are several methods to determine the Weibull parameters. The 10 different methods that were used to carry out this research are as follows:
Empirical method of Justus (EMJ) Empirical method of Lysen (EML) Energy pattern factor method (EPF) Maximum likelihood method Modified maximum likelihood method Median and quartiles method (MQ) Moments method Least squares fit method (LS) WAsP method New moments method (NMO)
The statistical data are analysed, and the above methods are used to estimate the shape factor (k) and the scale factor (A). The goodness of fit test is carried out by comparing the correlation coefficients (R2) and several error estimation parameters such as RMSE. The best method of all gives the correct WPD at the site which can be used to calculate the AEP of the respective site. In conjunction with these estimations, data validation is also a very important exercise. The anemometers used at 34 m height and 20 m height have specific range, and it must be ensured that no statistical data are below the threshold of these sensors or above the anemometers’ accurate measurements limit. If there is, then the data must be verified with other statistical data such as wind data from NASA or other sources (Seguro and Lambert, 2000).
Empirical method of Justus
This is one of the methods that was invented by Justus whereby the shape factor (k) and the scale factor (A) are computed, respectively, by the following equations (Seguro and Lambert, 2000)

Empirical method of Lysen
In this method invented by Lysen, the only difference is that the scale factor (A) is computed using a different equation as shown below. However, the shape factor (k) computation remains the same as for the method of Justus (Seguro and Lambert, 2000)

Energy pattern factor method
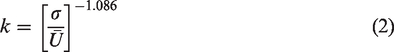
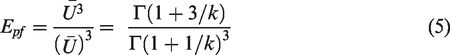
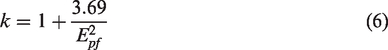
The energy pattern factor method is mostly used for aerodynamic design of the turbine blades. However, for this method, the calculation for the scale parameter (A) is similar to that of the Empirical method of Justus. The energy pattern factor and the shape parameter (k) are computed by the two equations (5) and (6), respectively (Seguro and Lambert, 2000)
Maximum likelihood method
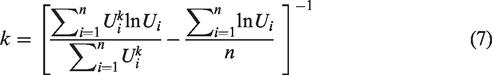
This method is a likelihood function of the statistical data of wind that is most commonly provided in a time series format. This method requires extensive numerical repetitions to determine the shape factor (k) and the scale factor (A) for the Weibull function. The shape and scale factors can be computed by the equations (7) and (8), respectively (Seguro and Lambert, 2000)
Modified maximum likelihood method
The modified MLM is somewhat similar to the ML whereby an extensive number of iterations determine the shape and scale parameters. However, this method can only be applied if the statistical data available is in the format of a frequency distribution. For this method, the shape parameter (k) and the scale parameter (A) can be determined by the following equations (Seguro and Lambert, 2000)
Median and quartiles method
For this method, if the median of wind speed is U and the percentage quartiles at 25% and 75% are equating to the probability of U, which is less than or equal to the percentage quartiles, then the shape parameter (k) and the scale parameter (A) can be computed by the following equations (Seguro and Lambert, 2000)

Moments method
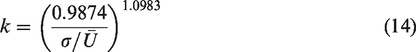
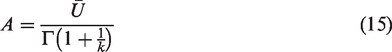
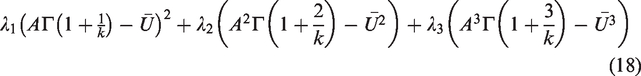
In the MO, the first and the second moments are used by carrying out integration of the gamma function by carrying out an unbiased estimate of the r’th moment. For this method, the standard deviation and the mean wind speed must be calculated first. The equation for calculating this is shown as follows (Aukitino et al., 2017)
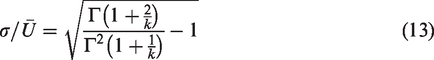
Then, after some iterations, the shape factor (k) and the scale factor (A) can be calculated by the equations (14) and (15) (Aukitino et al., 2017)
Least squares fit method
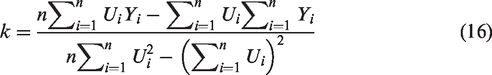
In this method, the cumulative distribution function of the Weibull distribution is transformed into a linear regression, and the shape factor (k) and the scale factor (A) is computed using the equations (16) and (17) (Chaurasiya et al. 2018)

New moments method
For the new MO, the mean and variance describes the dispersion while the skewness describes the shape of a distribution. The first two moments are the mean and variance while the third moment is the skewness of the probability distribution curve. The symmetry of the shape of distribution is known as skewness. The first and second moments are same as that in the MO while the third moment is a key function in estimating wind power accurately to be suitable for the specified location. The equations for the new moments are shown below respectively (Usta et al., 2018)

WAsP method
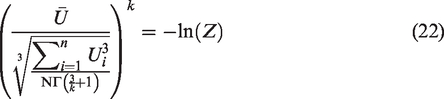
This method used to compute the Weibull parameters is a PC programme used for extensive data analysis of wind energy resources. This programme is used to simplify rigorous data sets of wind for a particular site by using meteorological conditions for other reference sites. The predicted and the reference sites should have similar weather conditions, and the data sets must be reliable (Bowen and Mortensen, 1996). The ruggedness index is very important for WAsP analysis. It can be used to identify if the situation is within the recommended operation of the software. Some of the major characteristics for prediction are the size of the map, the contour line intervals and the accuracy of the digitized contour lines. The ruggedness of the terrain of the reference and the predicted sites must both be closer to 0% (Bowen and Mortensen, 1996).
The two requirements of the WAsP method are (Solyali et al., 2016):
Mean power densities from the fitted Weibull distribution must be same as that of the observed. Proportion of values greater than the mean observed wind speed from the fitted Weibull distribution should be same as that for the observed distribution.
Then, the equation would be
Then, the cumulative distribution function, which is F(U), would indicate the proportion of values that are less than U, thus 1-F(U) would give proportion of values that are greater than U. A symbol Z is defined which represents the proportion of observed wind speeds that are greater than the mean observed wind speed using the requirements above

Performance analysis of different methods
The goodness of fit of the 10 different methods was estimated to determine the best method out of all. Some of the values that were compared were the correlation coefficient (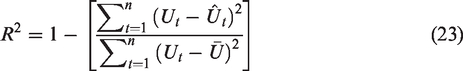
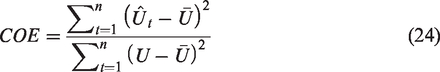
The COE (Rocha et al., 2012) is used to measure how accurate a predicted model is when wind speeds are estimated against the actual values. The best result would indicate a higher value with values ranging from minus infinity to 1. The following equation shows how the COE is computed (Kaldellis and Zafirakis, 2011)
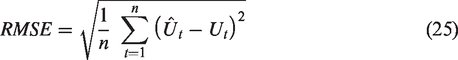
The RMSE is used to determine the accuracy between predicted wind values of the Weibull function and the observed wind data by comparing the standard deviation of the differences. As the standard deviation becomes smaller, the RMSE gets closer to zero (Mohammadi et al., 2016). The equation for calculating the RMSE is shown below
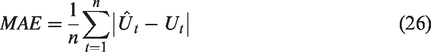
The MAE is the difference between two continuous variables. Low values of MAE indicate greater accuracy (Willmott and Matsuura, 2005). The equation for computing the MAE is
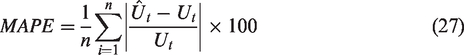
The MAPE is a measure that expresses an error in percentage so that it is easier for estimating the accuracy of the particular method. Lower values indicate higher accuracy for this method (Tofallis, 2015). The equation (27) shows how MAPE is computed
Data validation
In the present work, the Weibull parameters at the potential sites are determined by analysing the time series data. The statistical data from Pentecost and Epi Islands in Vanuatu need to be validated and processed for the required output parameters. The steps for wind data processing are to retrieve raw data file, developing a data validation routine, validating the data, creating a valid data file and finally processing the data and generating reports. It is critical to ensure that the data being received are correct by comparing it to the parameters in the manufacturer’s catalogue. Also, the data being retrieved at the tower station must be compared with data from neighbouring meteorological centres. There are a few tests that were carried out for validation check. First, the range test which identifies vague results, such as the wind speed, is below the offset value of the sensor’s threshold. Also, values that are greater than the maximum need to be reviewed for correctness. Further, the relational tests compares values that are acquired from different heights. Finally, the trend test compares the changes in measured values. In the data processing, the range of the wind speed is offset <Average < 25m/s, the range of the solar radiation is offset<Average < 1300W/m2. For the barometric average pressure, the range must fall in between 94kPa <Average < 106kPa, and the average difference in temperature must be greater than 1°C in between 1000 h and 1700 h. The wind speed average change for 1 h must be less than 5 m/s, average change in the temperature in one hour must be less than 5°C, and the barometric pressure variation in three hours must be less than 1 kPa (Jain, 2016).
After the validation test, the next step is data processing and analysis where the monthly mean wind speed, seasonal mean, annual mean, diurnal variation of wind speed and temperature are calculated. The various methods of estimating Weibull parameters will be used to find the shape factor (k) and scale factor (A). The wind resource assessment will be carried out to find the daily mean, monthly mean, seasonal mean, and diurnal variation to be used in the Weibull function to obtain the shape factor and scale factor. These parameters can be obtained using software Excel, software R and WAsP.
The measured data were compared with 10 years of satellite data obtained using the Merra-2 satellite by NASA. The data were adjusted to match the exact height of the anemometers located 34 m AGL at the two sites using the wind shear coefficient obtained from our measurements at two heights.
Results and discussion
Wind speed analysis
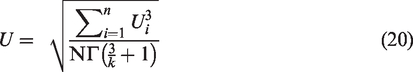
It is known that wind speeds are unpredictable and continuously vary with time. For the sites undertaken in this study, the wind speeds were recorded at 10-min intervals for more than a year. At least one year data are required to capture the variations in wind speed, direction, turbulence and shear (Jain, 2016). Then, the daily average wind speeds and monthly average wind speeds were calculated and plotted. The mean wind speed is calculated using the following equation
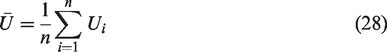
Daily average wind speeds for an entire year recorded at 34 m and 20 m AGL for the Pentecost site.
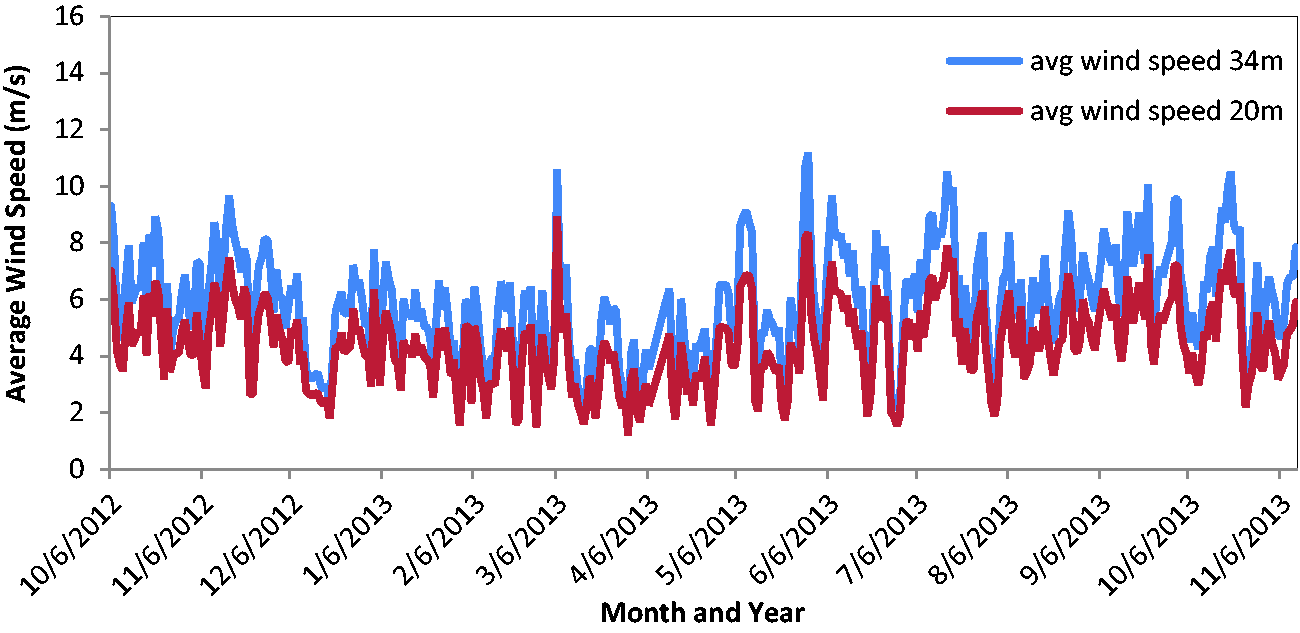
Daily average wind speeds for one and a half years recorded at 34 m and 20 m AGL for the Epi site.
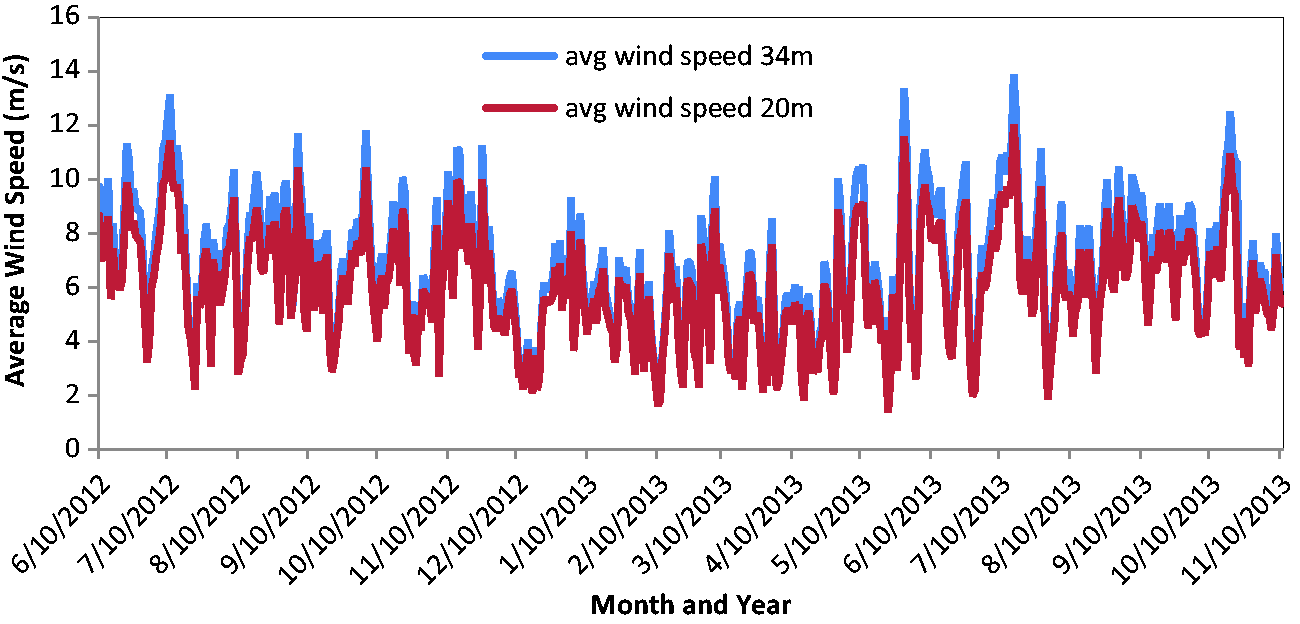
Similarly, the monthly averages were calculated for 20 m AGL and 34 m AGL and are presented in Figures 5 and 6, respectively. The figures present the varying monthly average wind speeds, respectively, for the sites Pentecost and Epi at the two heights. It can be seen that the highest wind speeds for the two heights are recorded in September, whereas the lowest wind speeds for the two heights are recorded in April for the Pentecost site. For the Epi site, the highest wind speeds are recorded in July, whereas the lowest wind speeds are recorded in April. In Vanuatu, there are normally two seasons being the warmer wet season and the cooler dry season. The warmer wet season is from November to March with the average temperature 28°C, whereas the cooler dry season is from April to October with the average temperature 23°C. From the Figures 5 and 6, it can be observed that the higher wind speeds are recorded for the cooler months compared to the warmer months.
Monthly average wind speeds recorded at 34 m and 20 m for the Pentecost site.
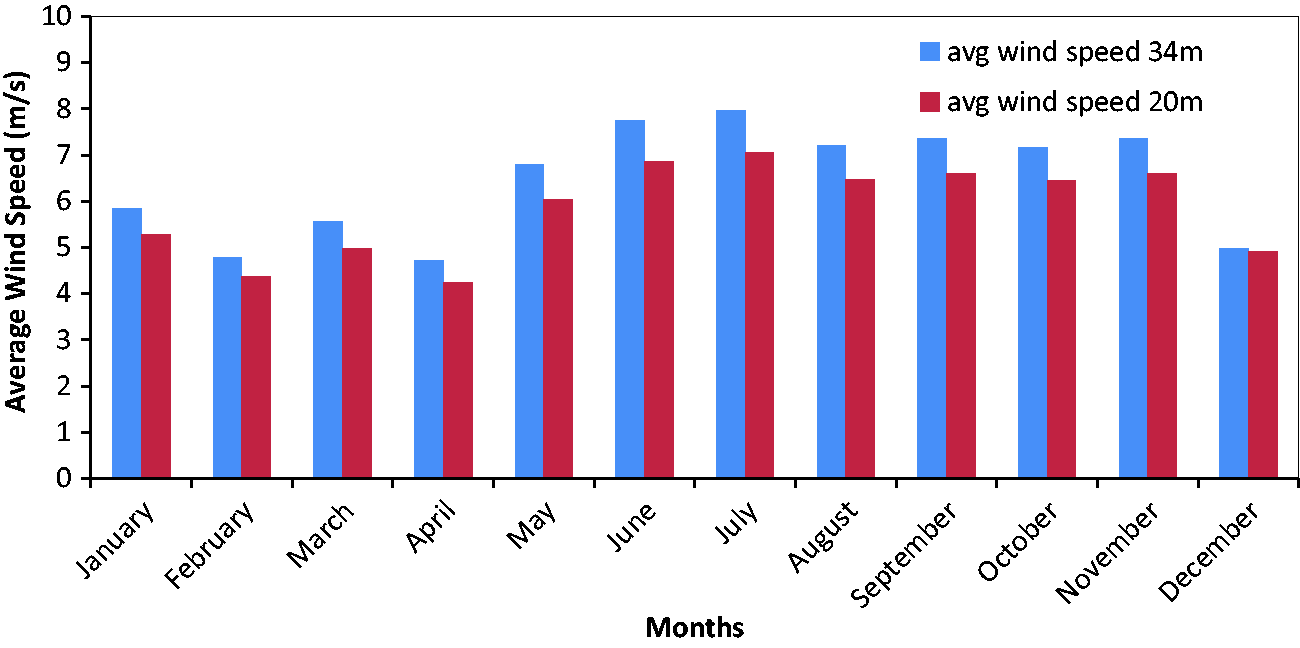
Monthly average wind speeds recorded at 34 m and 20 m for the Epi site.
Wind shear analysis
The wind shear is a meteorological phenomenon that occurs between relatively short distances and is normally expressed as the difference of wind speeds over the distances. It has a very significant effect on the operation of a wind turbine. The wind shear coefficient (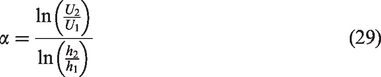
In this study, the two heights, which are 34m and 20m, were used to calculate the wind shear coefficient for the two sites, and the results of diurnal variation are presented in Figure 7. It shows that the wind shear coefficient is greater at night compared to the day time. This could possibly be the cause of temperature inversion effect, which measures the change of atmospheric temperature with altitude. This usually occurs at night time where the air is cooler near the surface and the warmer air mass is above the cooler air mass disabling any convection. When the sun rises, the surface is heated up causing the cooler air mass to heat up causing it to ascend upwards (McIlveen, 1992). It is interesting to note that at around 2 pm, the wind shear is lowest.
Diurnal variation of the wind shear coefficient.
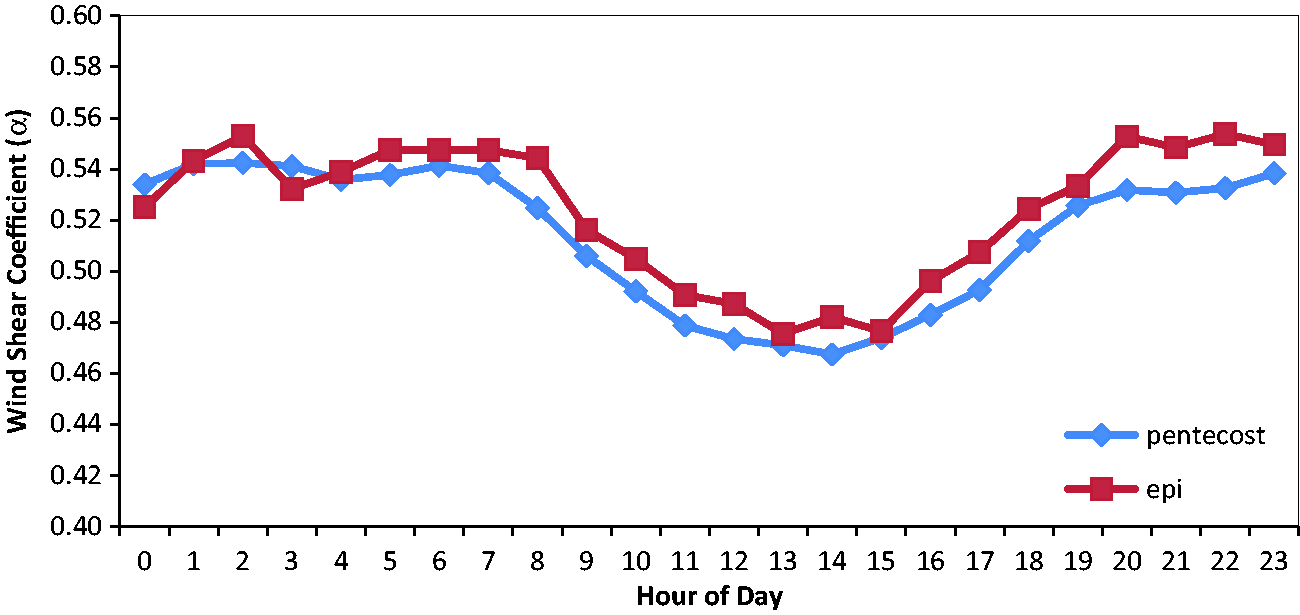
Figure 8 shows the diurnal variation of the average temperature recorded near the surface. The lowest average temperature for diurnal variation is found at around 5 am. Then, the temperature starts to rise at around 7 am and the cold air trapped near the surface starts to get heated up. At around 1 pm, the highest temperature is recorded. The upward movement of air causes bunching of horizontal wind streamlines upwards resulting in increased wind speeds just above the previously trapped air. Wind shear is lower for increased wind speeds, and this is the reason why Figure 7 shows the lowest wind shear between 1 and 2 pm.
Diurnal variation of the Average temperature in absolute scale.
Satellite data for the two sites
Figure 9 shows the satellite-based annual variation of the mean wind speed at the Pentecost site obtained by estimating the wind speed at the same height above sea level as the 34 m AGL anemometer for the years from 2009 to 2018. The data were obtained from satellite Terra-2 (Blumenfeld, 2019). It can be seen that for the years 2009 and 2015, the wind speeds were higher than the measured average wind speed. For the years 2012 and 2013, the annual average wind speeds are slightly lower than the measured average speed; however, it should be noted that the measurements were not performed for full year for both the years.
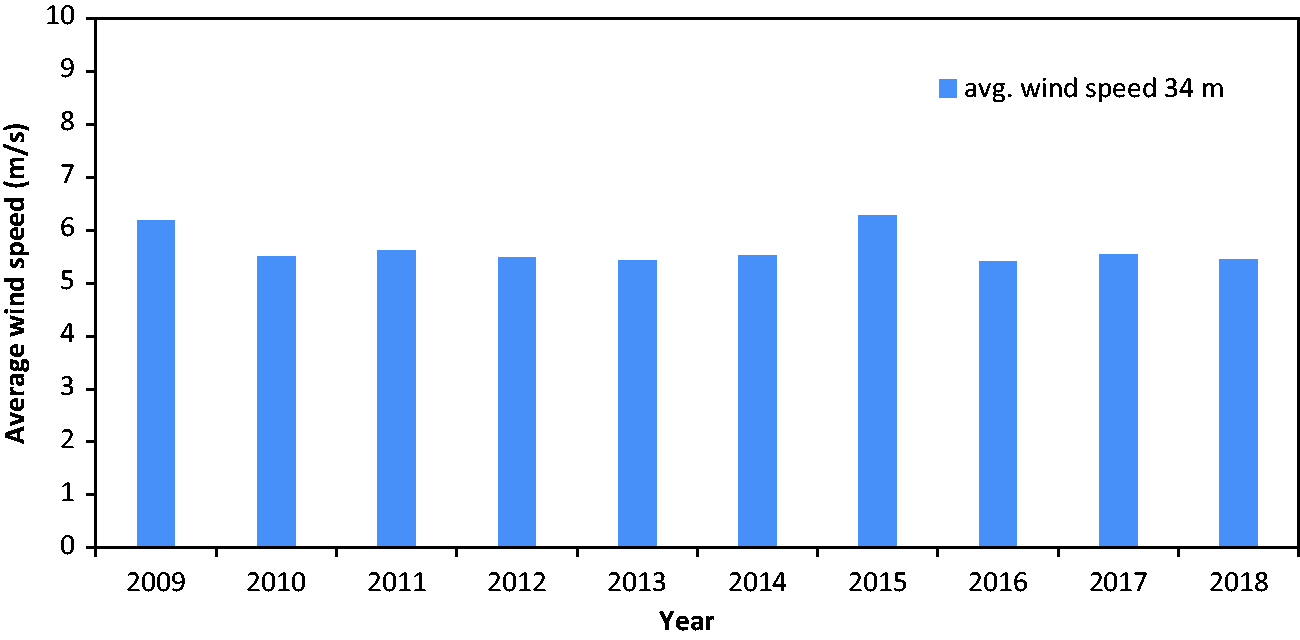
Average annual wind speed at 34 m AGL for Pentecost.
Satellite data were also obtained for Epi and using the wind shear coefficient for the site estimated from the wind measurements at 34 m and 20 m, the wind speed data from satellite Terra-2 (Blumenfeld, 2019) for 50 m above sea level was extrapolated to 34 m AGL. Figure 10 shows the annual variation of the wind speed for the Epi site from 2009 to 2018. The average wind speed for the 10 years was 5.962 m/s, which was slightly higher compared to the measured averaged wind speed in of 5.86 m/s in 2012 and 2013. Wind speeds from satellite wind speeds are generally higher compared to the actual measurements.
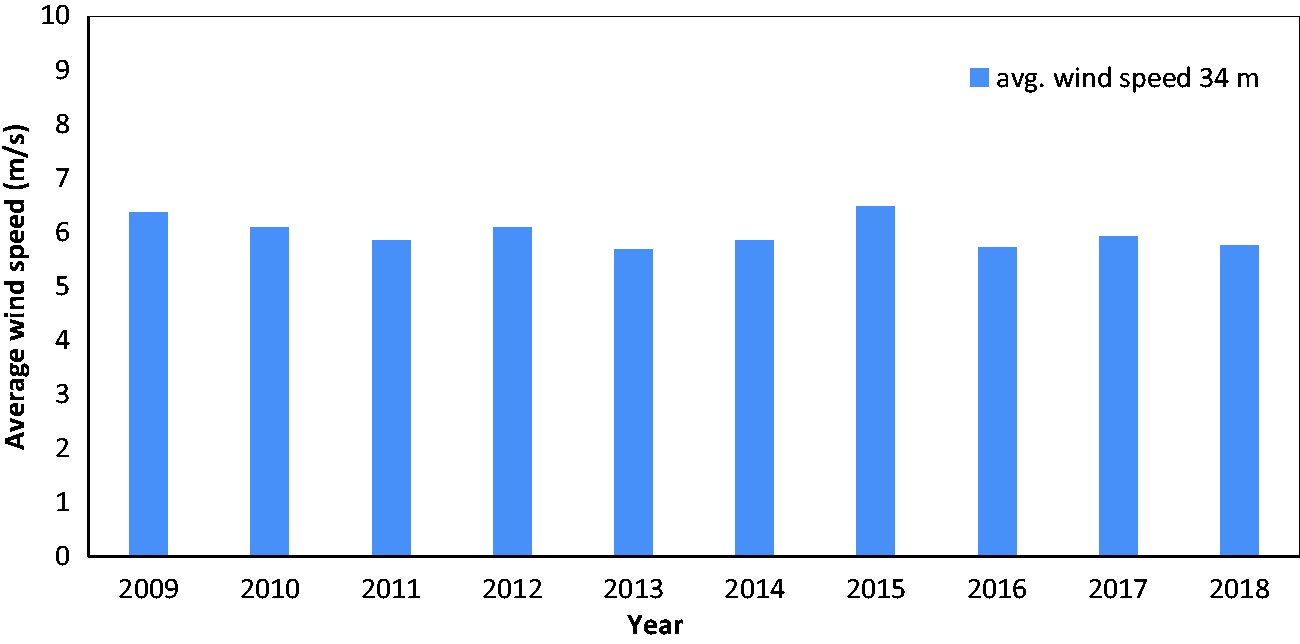
Average annual wind speed at 34 m AGL for Epi.
Turbulence intensity
Turbulence is the measure of the fluctuation in wind speed measured over series of time. It is usually dissipated by the transformation of kinetic energy into thermal energy by formation and devastation of smaller eddies. The turbulence intensity is computed using equation (30) (Aukitino et al., 2017)
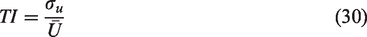
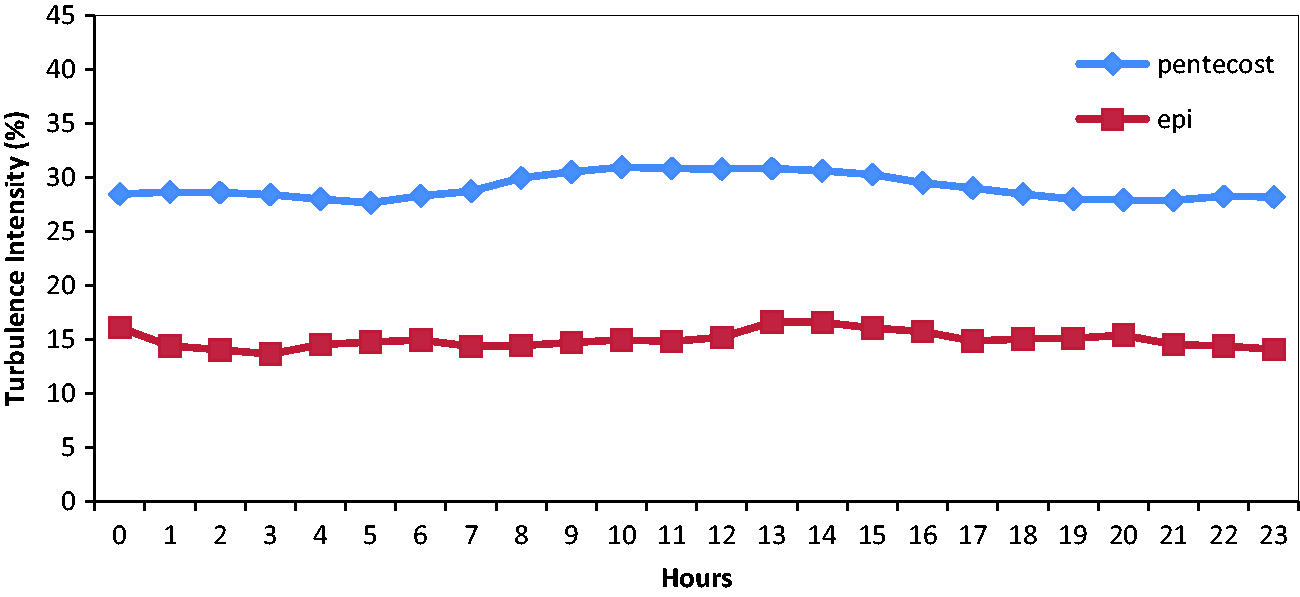
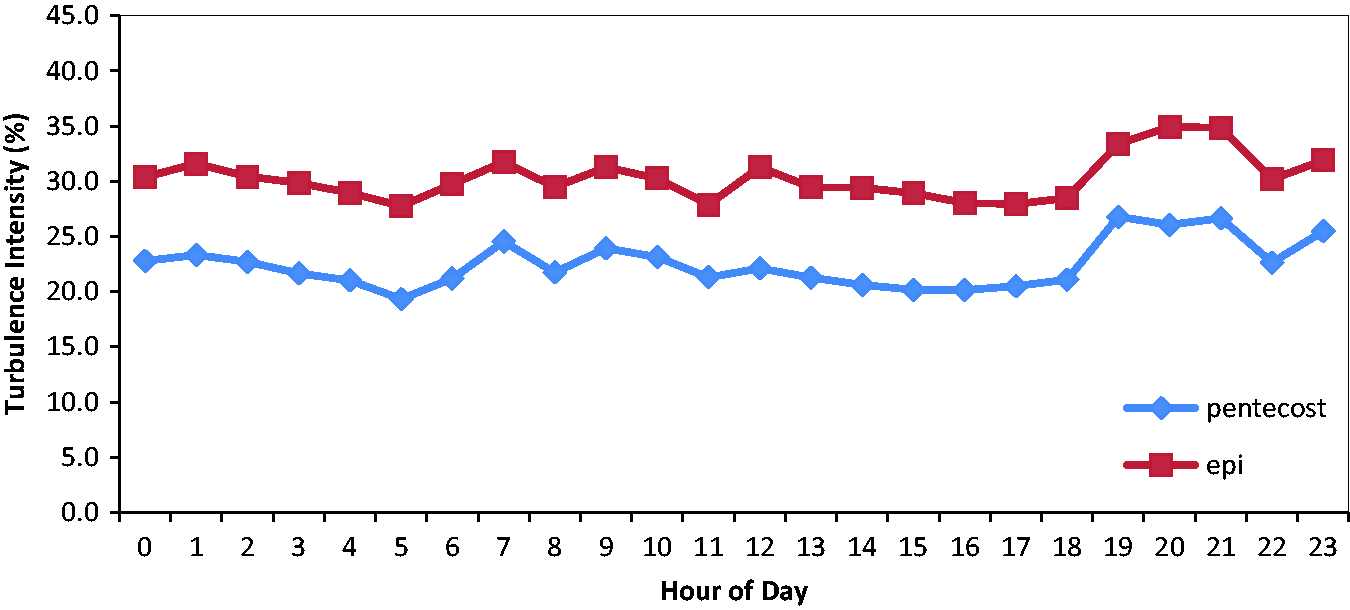
Figure 11 shows the diurnal variation of the turbulence intensity for the entire area in Pentecost and Epi, which reveals that the turbulence intensity for the Pentecost site fluctuates between the values of 18.72% and 22.47%, whereas the turbulence intensity for the Epi site fluctuates between 27.63% and 30.93%. It was noted from the data that the greater heights have lower turbulence since the air flow is smoother with increased heights. Also the greater turbulence was recorded at the 20 m height.
Diurnal variation of turbulence intensity for the whole year.
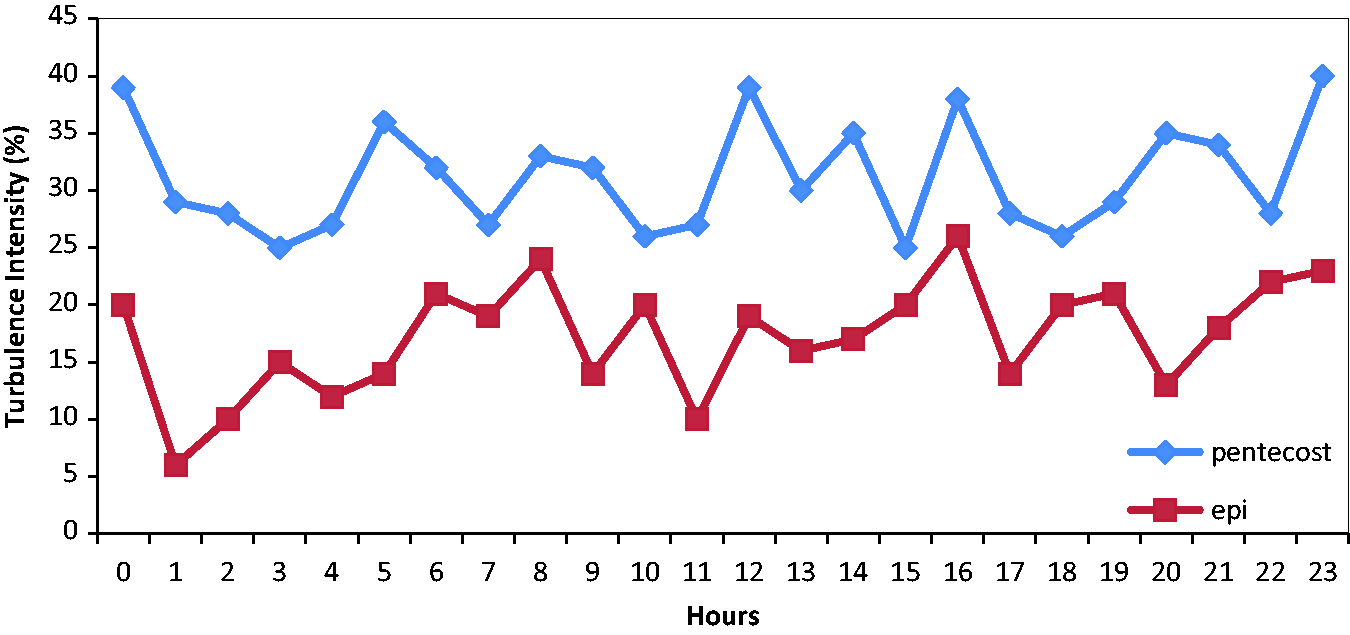
Moreover, the analysis of the diurnal variations of the turbulence intensity on a very windy day of the year is carried out. Figure 12 shows the turbulence intensity on a very windy day of the year with the wind speed averaging around 11 m/s. For the Pentecost site, the highest turbulence intensity was recorded at 26.8% while the lowest was 19.3%. For the Epi site, the highest and the lowest turbulence intensity that were recorded were 34.9% and 27.8%, respectively. The average turbulence intensity calculated was 22.5% and 30.3% for the sites, respectively.
Diurnal variation of turbulence intensity for a windy day.
Similarly, Figure 13 shows the diurnal variations of the turbulence intensity on a less windy day of the year with the wind speed averaging around 1.5 m/s. The highest and lowest turbulence intensities recorded for the Pentecost site were 59.26% and 14.62%, respectively. Whereas for the Epi site, the highest and lowest intensities recorded were 67.35% and 14.61%, respectively. The average turbulence intensity for the Pentecost site and the Epi site was found to be 31.68% and 41.50%, respectively.
Diurnal variation of turbulence intensity for a less windy day.
Wind direction analysis
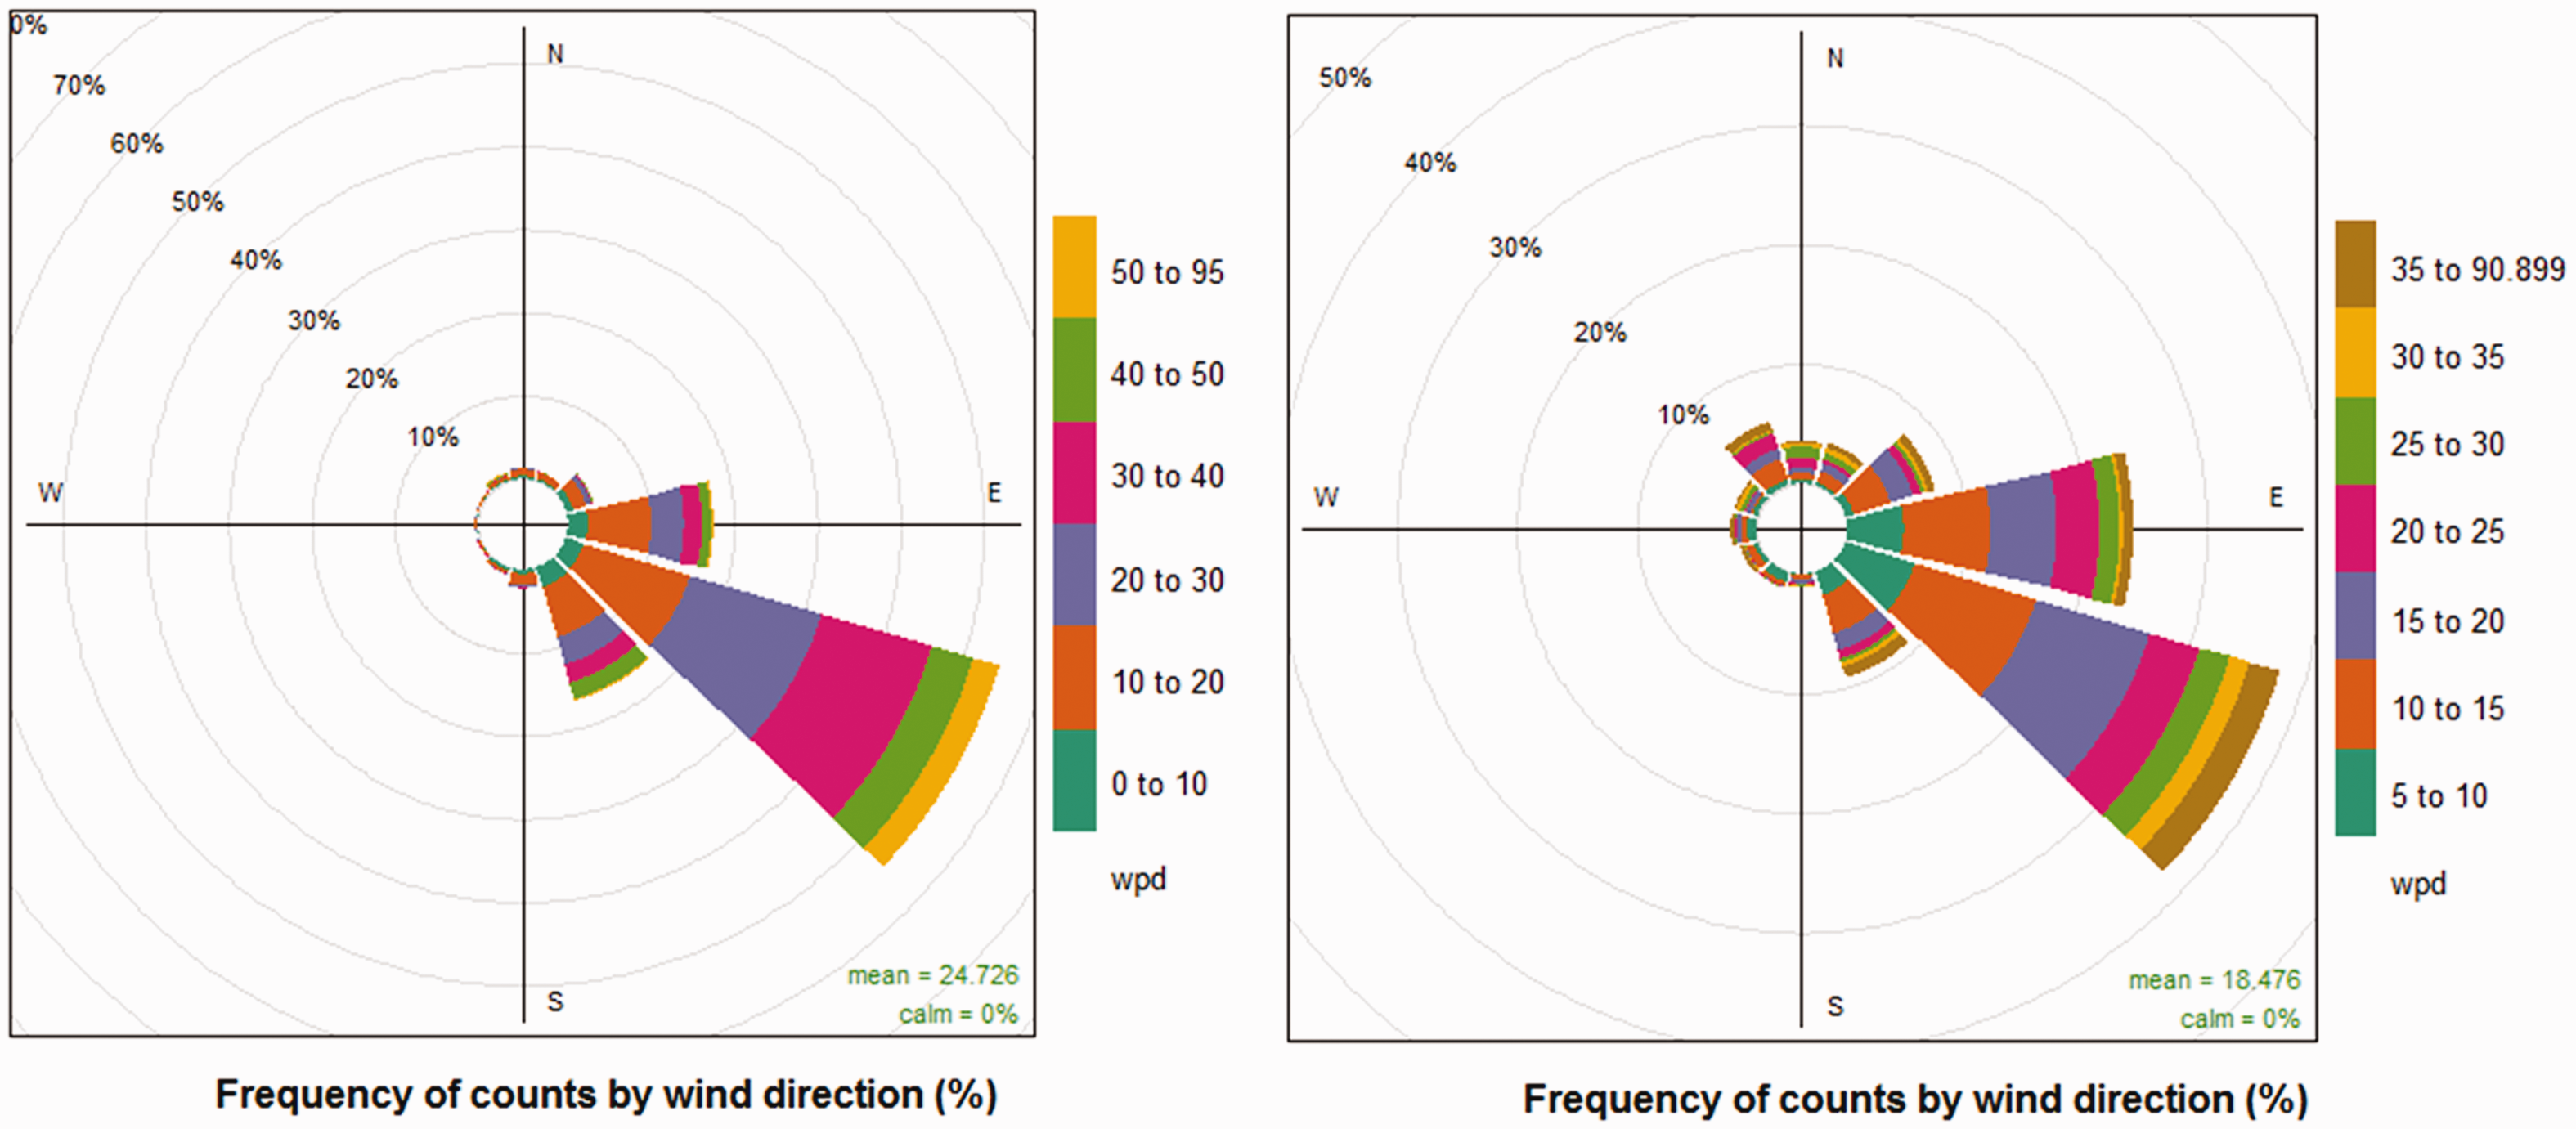
The analysis of wind direction is very important to determine from which direction the wind is predominant and from which direction the maximum energy could be harnessed. Figure 14 shows the WPD rose diagrams for the Pentecost site and the Epi site, respectively. The WPD rose diagrams present the wind climatic factors at a site better than wind speed rose diagrams (Zheng et al., 2016). It is clear for the Pentecost site wind rose that the predominant wind direction is from the southeast at around 44% of the time in an entire year. On the other hand, the predominant wind direction for the Epi site is also from the southeast at around 47% of the time in an entire year. Each circle on the graph shows that the frequency of wind flowing from the direction is 10%.
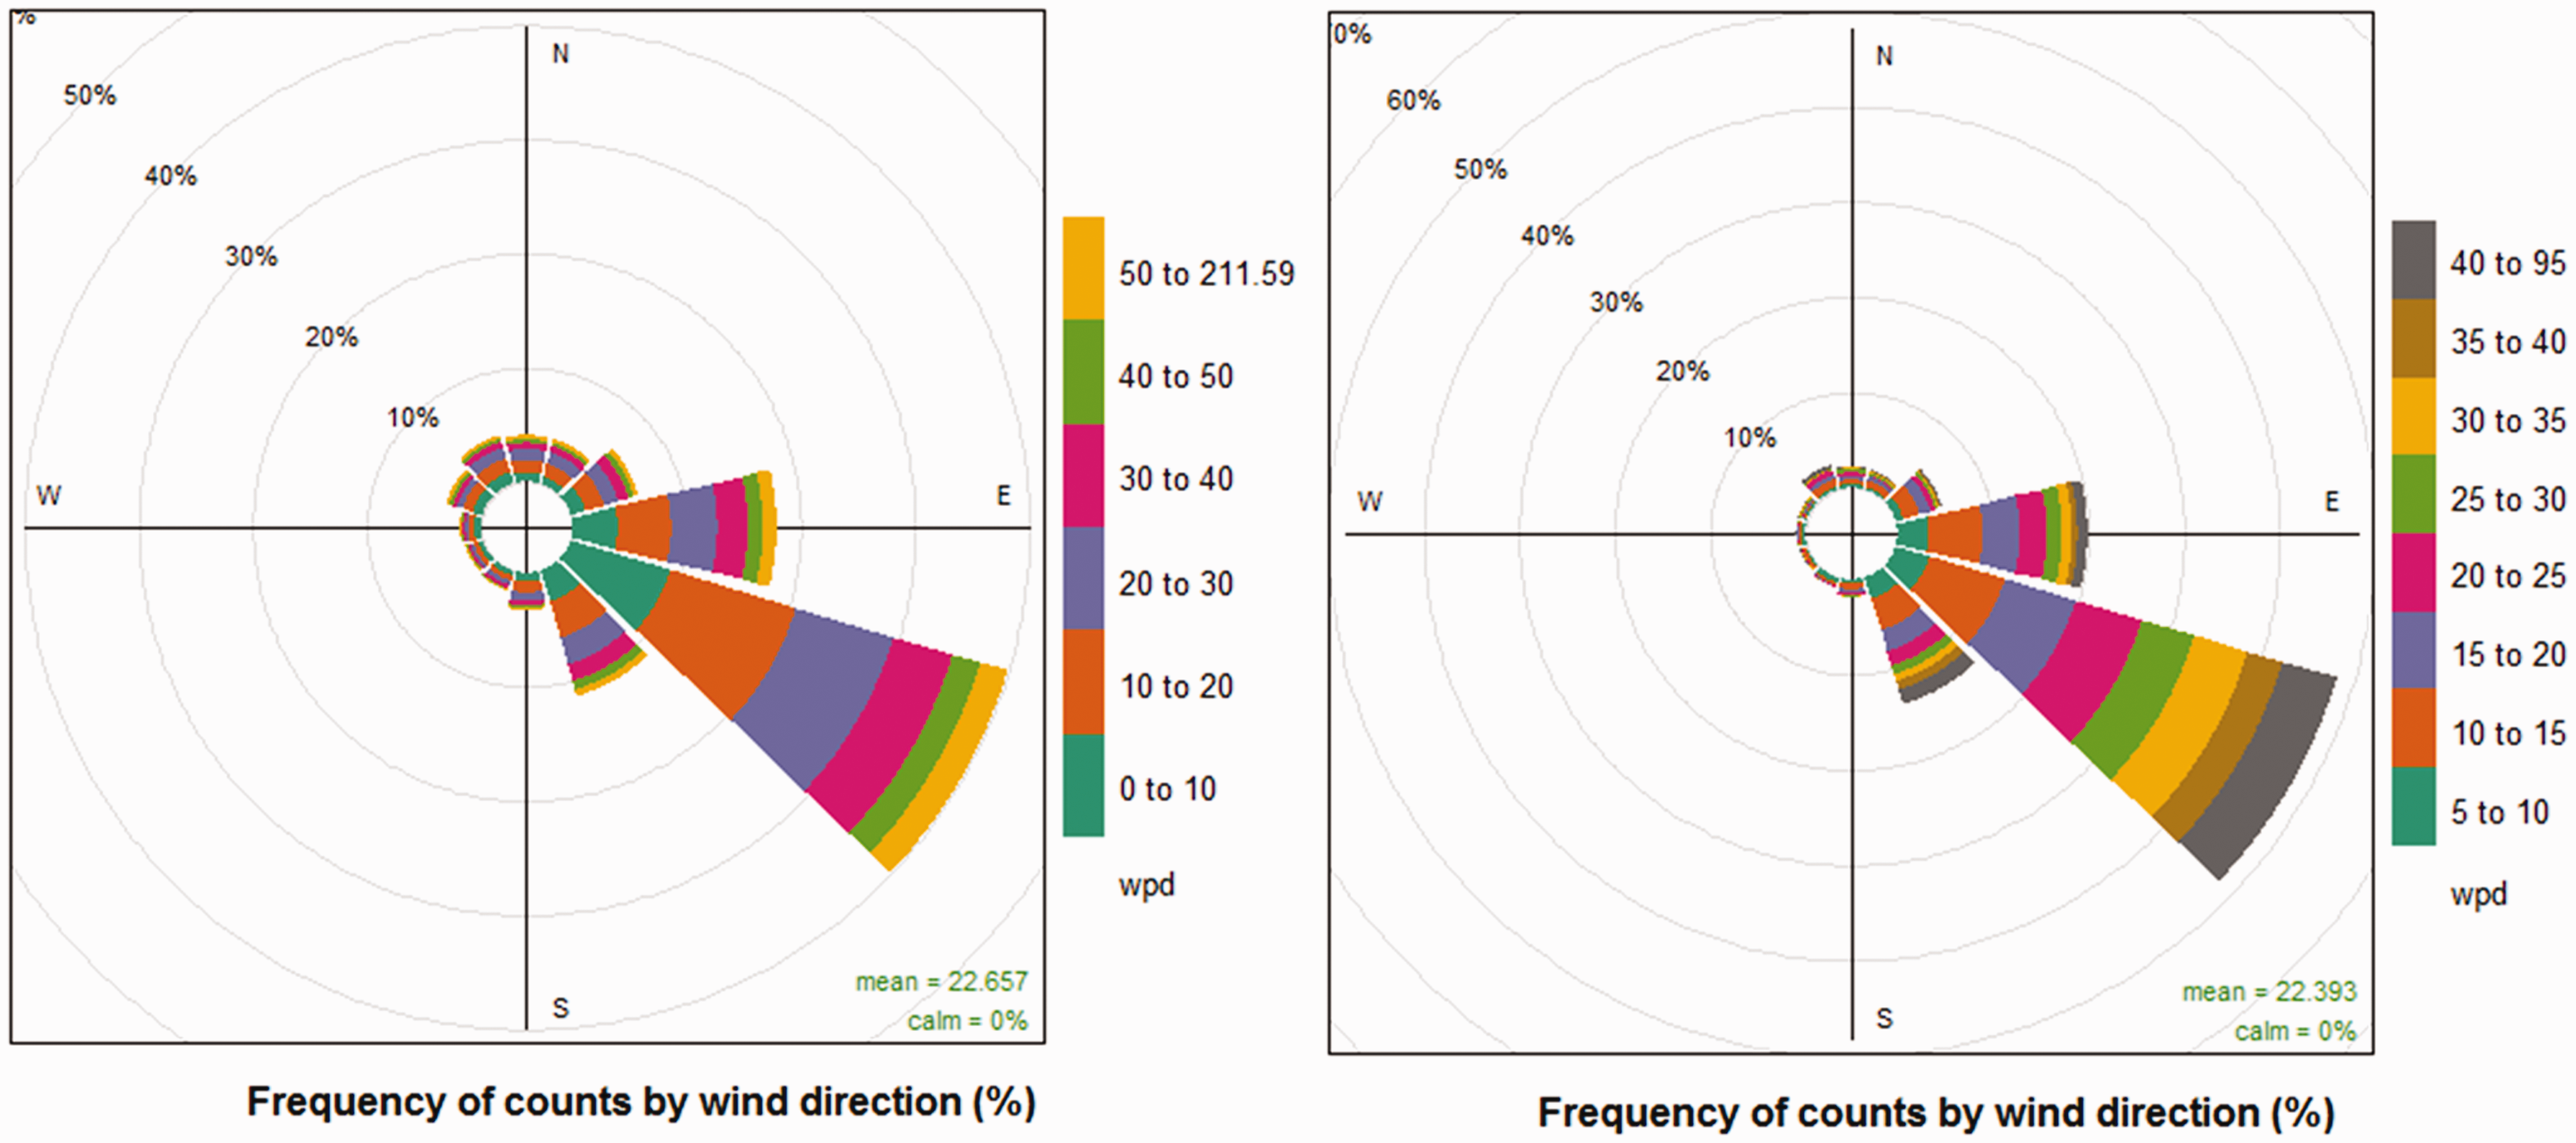
Wind power density rose plots showing frequency of wind received from all directions for Pentecost (left) and Epi (right).
Figure 15 shows the seasonal direction of wind and the WPD in the form of a WPD rose plots for the Pentecost site for the winter and summer seasons. During the winter season, about 44% of the wind comes from the southeast direction and about 20% comes from the east direction. For the summer season, nearly 57% of the wind comes from the southeast direction, while about 13% of the wind comes from the eastern direction.
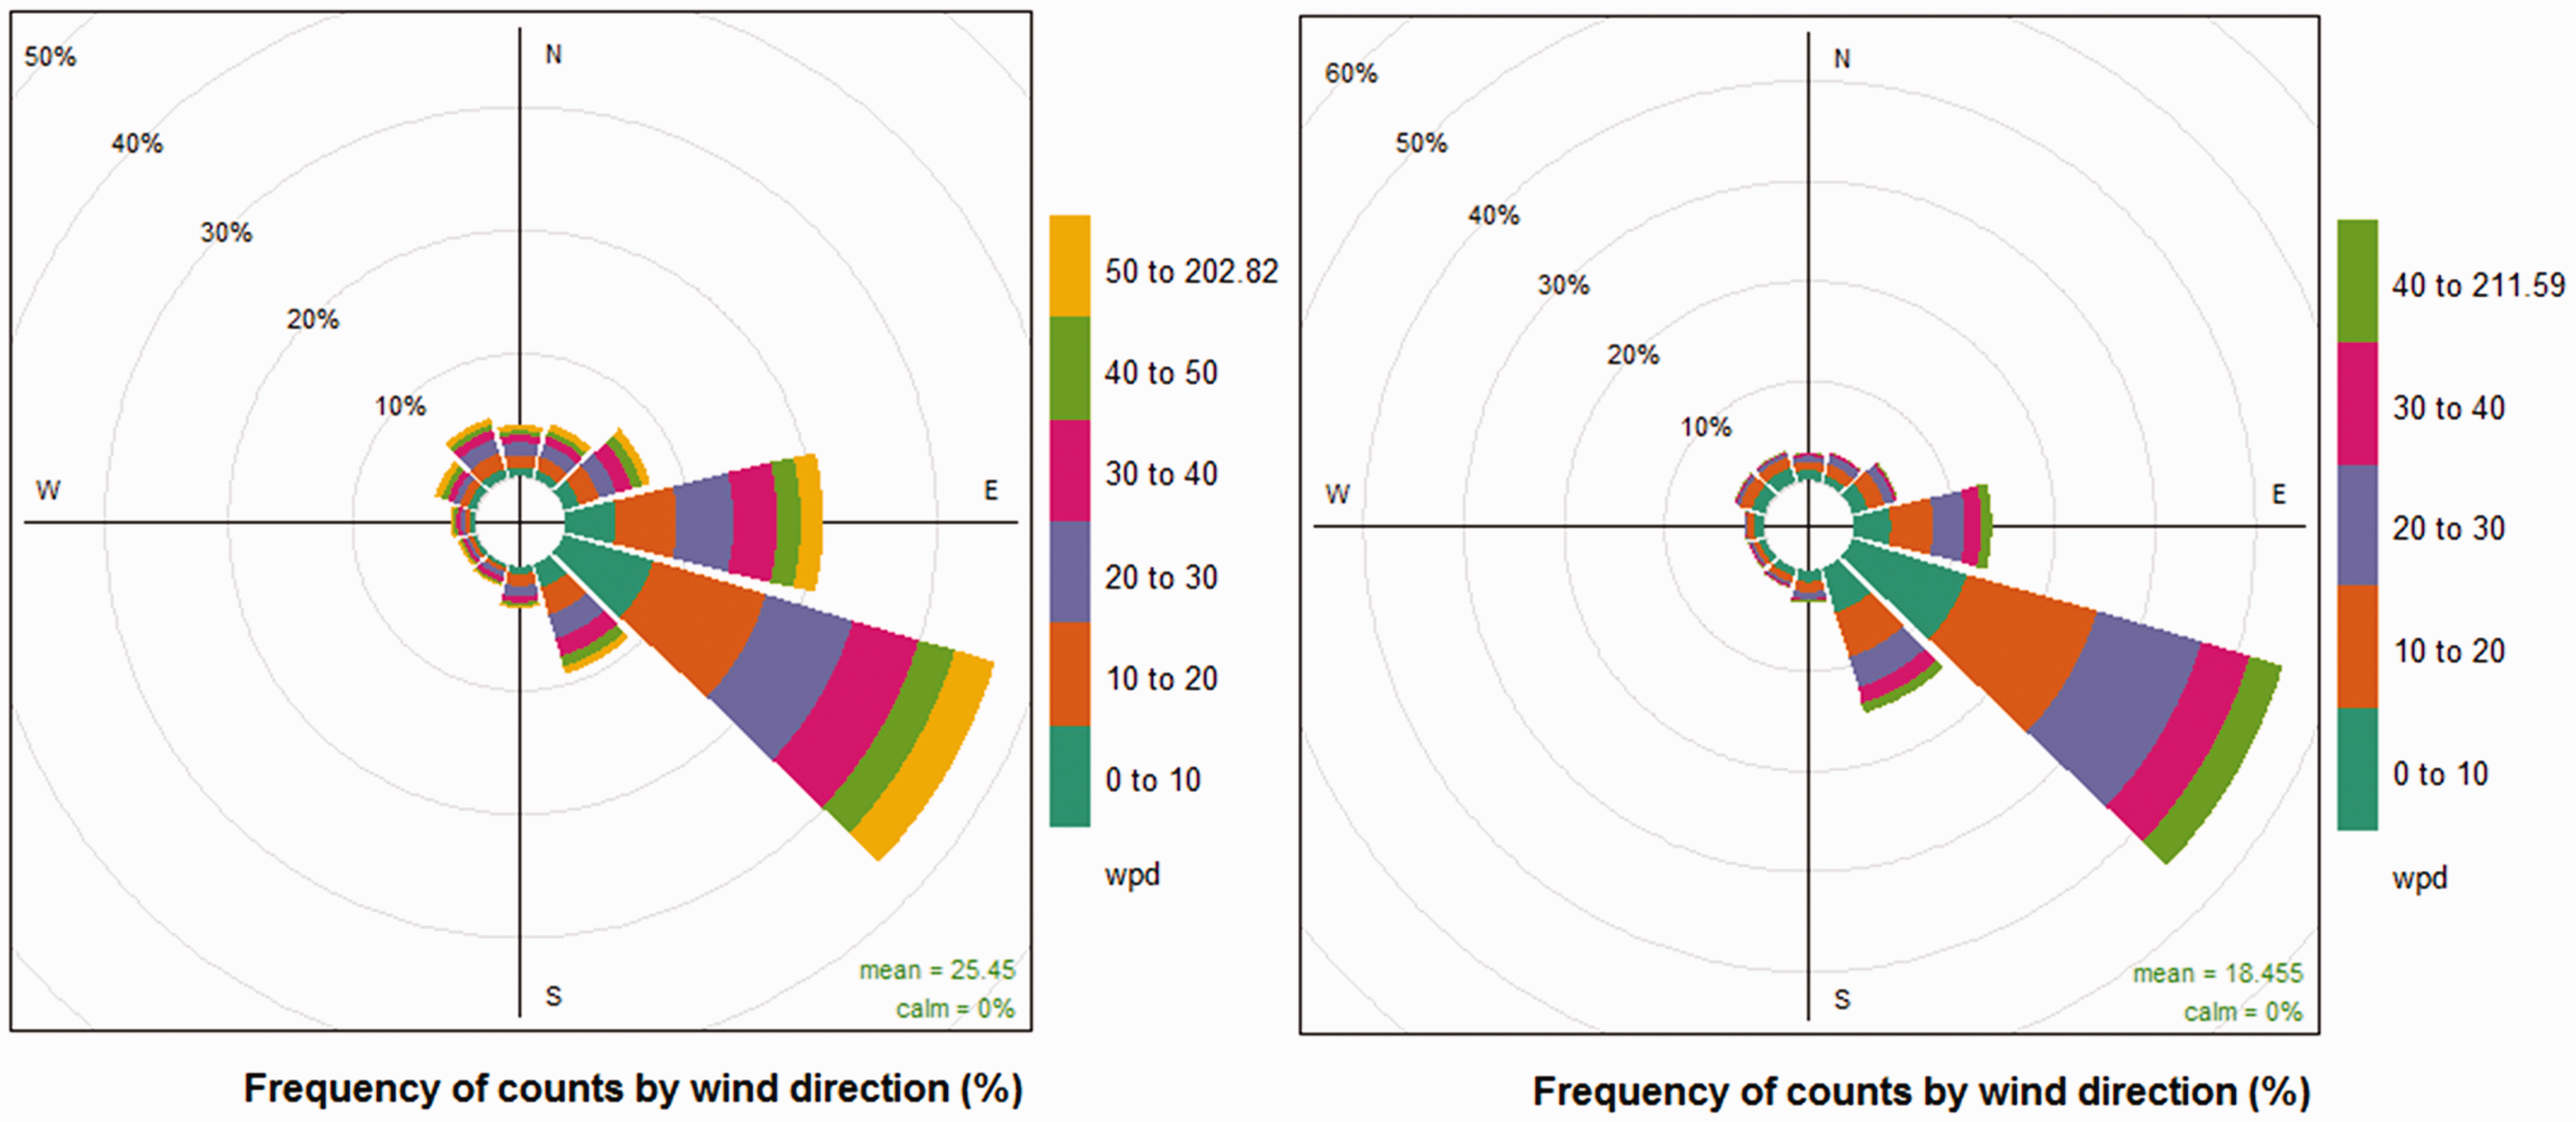
Wind power density rose plots for Pentecost for winter (left) and summer (right).
The WPD rose plots for the two seasons for the Epi site are shown in Figure 16. It can be seen that during the winter season, nearly 60% of the wind comes from the southeast direction, while only about 7% comes from the eastern direction. On the other hand, for the summer season, about 45% of the wind comes from the southeast direction and about 23% of the wind comes from the eastern direction. Thus, the major contribution to the easterly winds for the entire duration for the Epi site is during the summer season.
Wind power density rose plots for Epi for winter (left) and summer (right).
An important factor in wind analysis is the WPD, which is a very important factor for a good wind turbine design that provides a good capacity factor and is economical for the nation (Akpinar and Akpinar, 2004). Sometimes, the geographical location and the height of the turbines relative to ground level and other factors provide larger errors in statistical analysis, thus some methods are not relevant or acceptable (Dabbaghiyan et al., 2016). Further, according to previous researchers and also from the works discussed in the ‘Introduction’, different methods fit better for different locations (Arslan et al., 2014; Katinas et al., 2017). In this work, the Weibull parameters are estimated using the 10 methods mentioned in ‘Data modelling and estimation of Weibull parameters’ section, and the best method that had the least error compared to the measured data was used for determining the WPD. The Wind frequency distribution and Weibull distribution curves obtained from the 10 methods for the Pentecost site are shown in Figure 17.
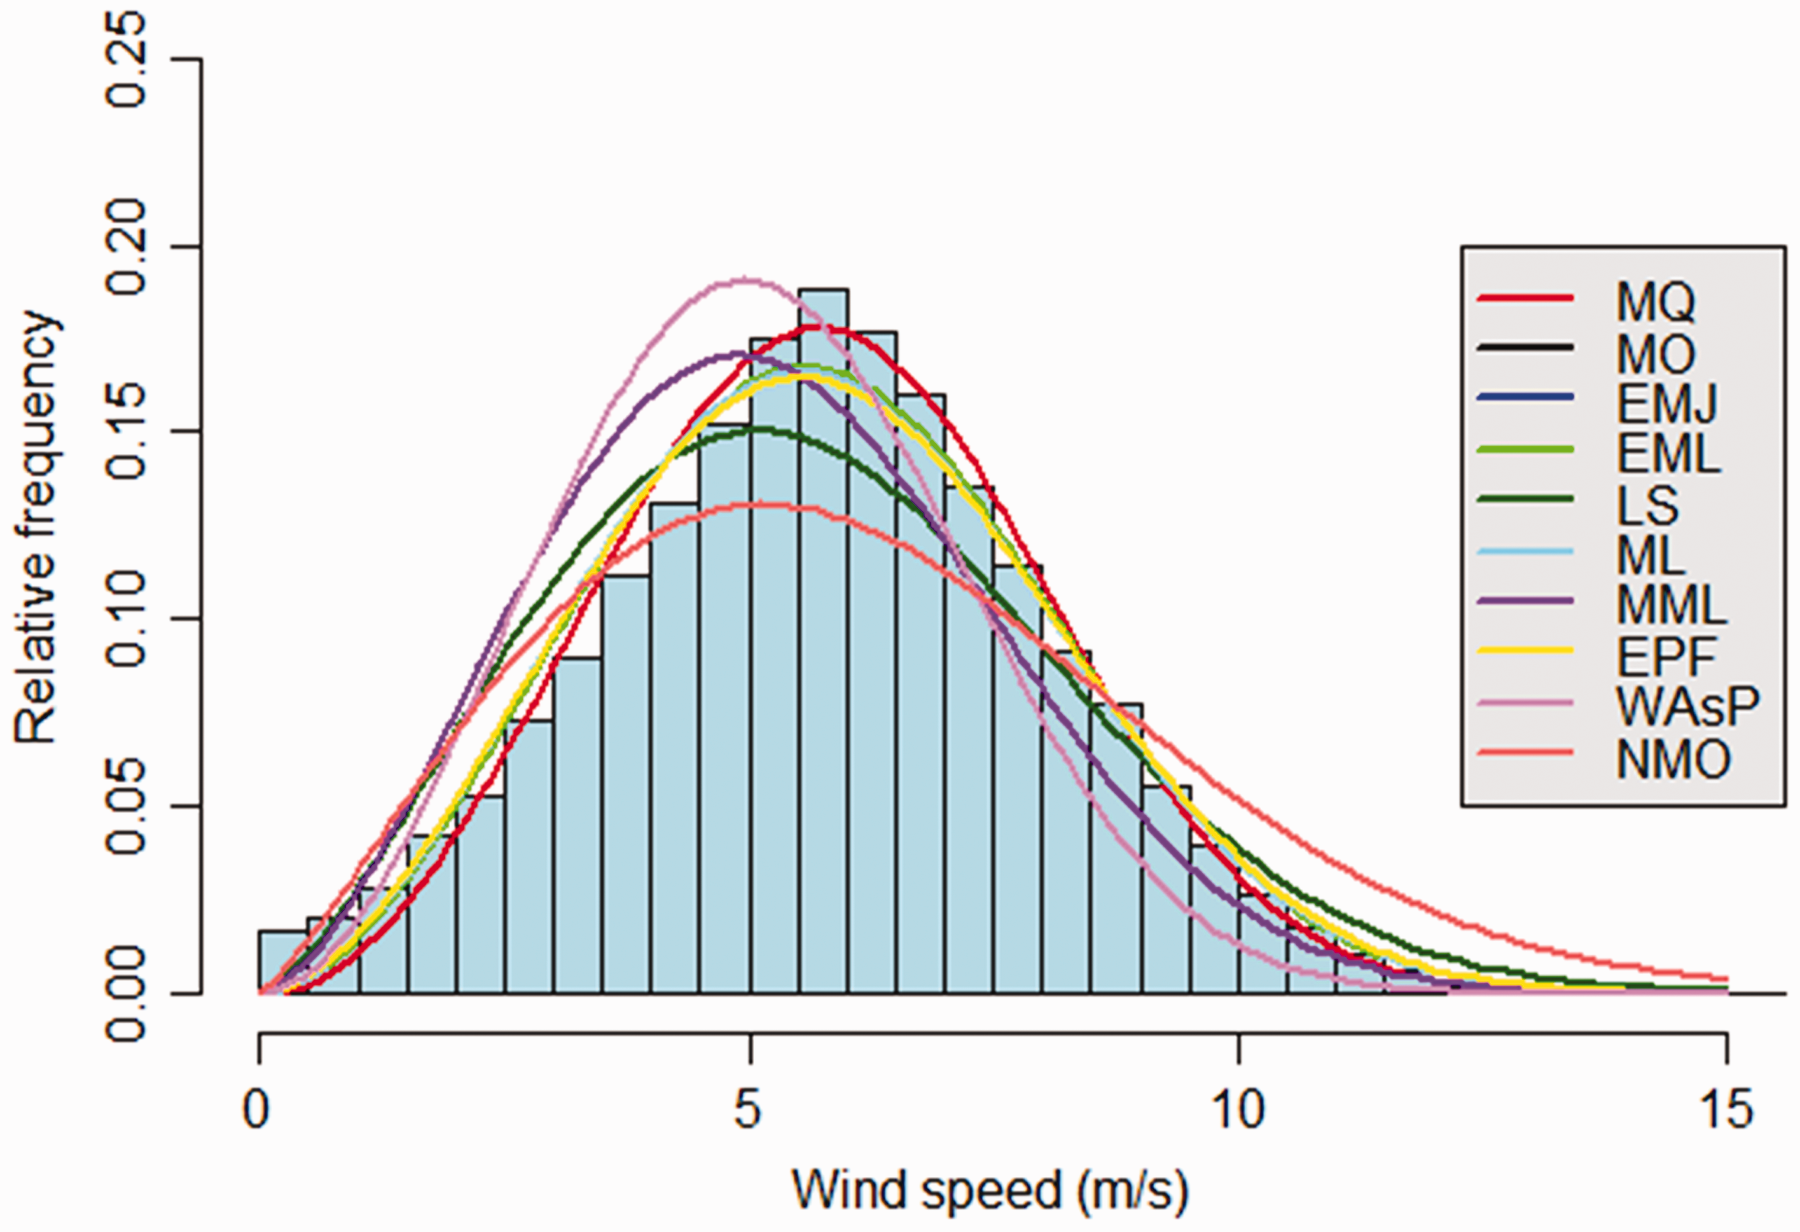
Wind frequency distribution and Weibull distribution curve for the Pentecost site.
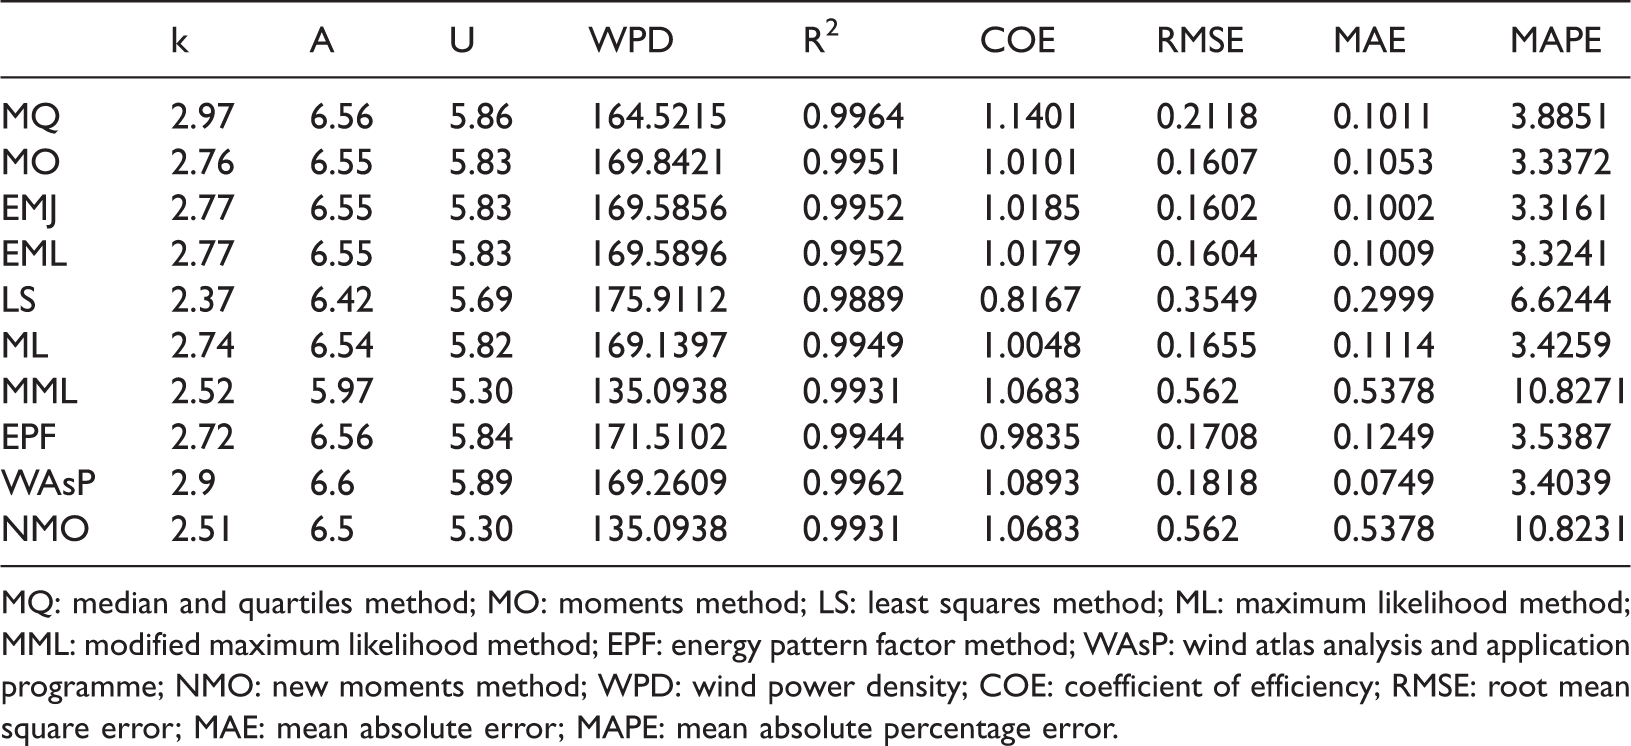
Table 2 presents the Weibull parameters, k and A (shape and scale parameters), as well as the measures of goodness of fit and error: the correlation coefficient (
Goodness of fit test error for Pentecost site, Vanuatu.
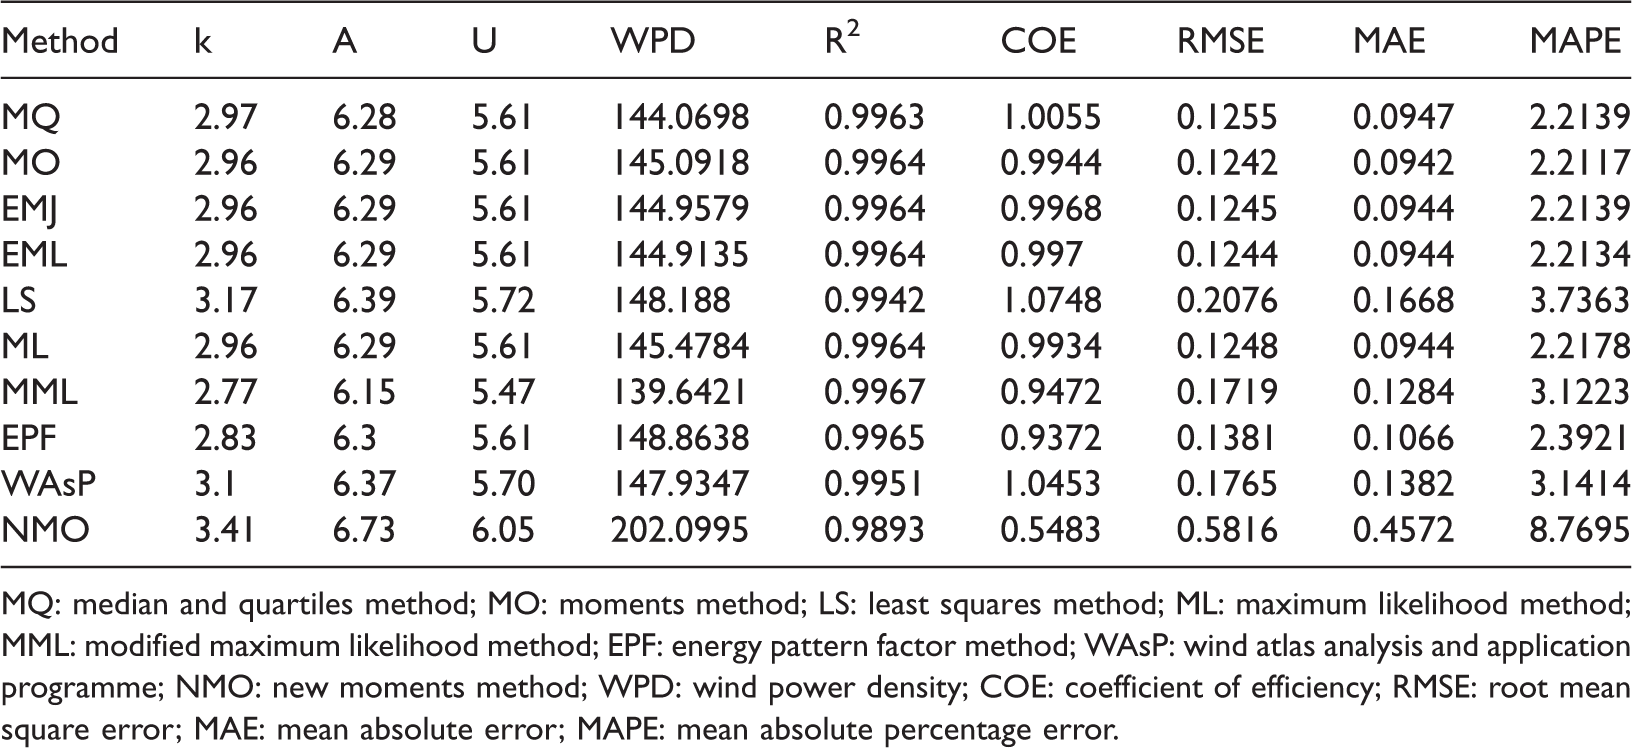
MQ: median and quartiles method; MO: moments method; LS: least squares method; ML: maximum likelihood method; MML: modified maximum likelihood method; EPF: energy pattern factor method; WAsP: wind atlas analysis and application programme; NMO: new moments method; WPD: wind power density; COE: coefficient of efficiency; RMSE: root mean square error; MAE: mean absolute error; MAPE: mean absolute percentage error.
Figure 18 presents the wind frequency distributions and the Weibull distribution curve for the Epi site. It can be seen that the frequency distribution is significantly different from the Pentecost site, with higher frequencies seen on the higher wind speed side. It can be seen that the scale factor A is higher for the Epi site, resulting in a ‘wider’ distribution curve compared to the Pentecost site’s Weibull distribution curve.
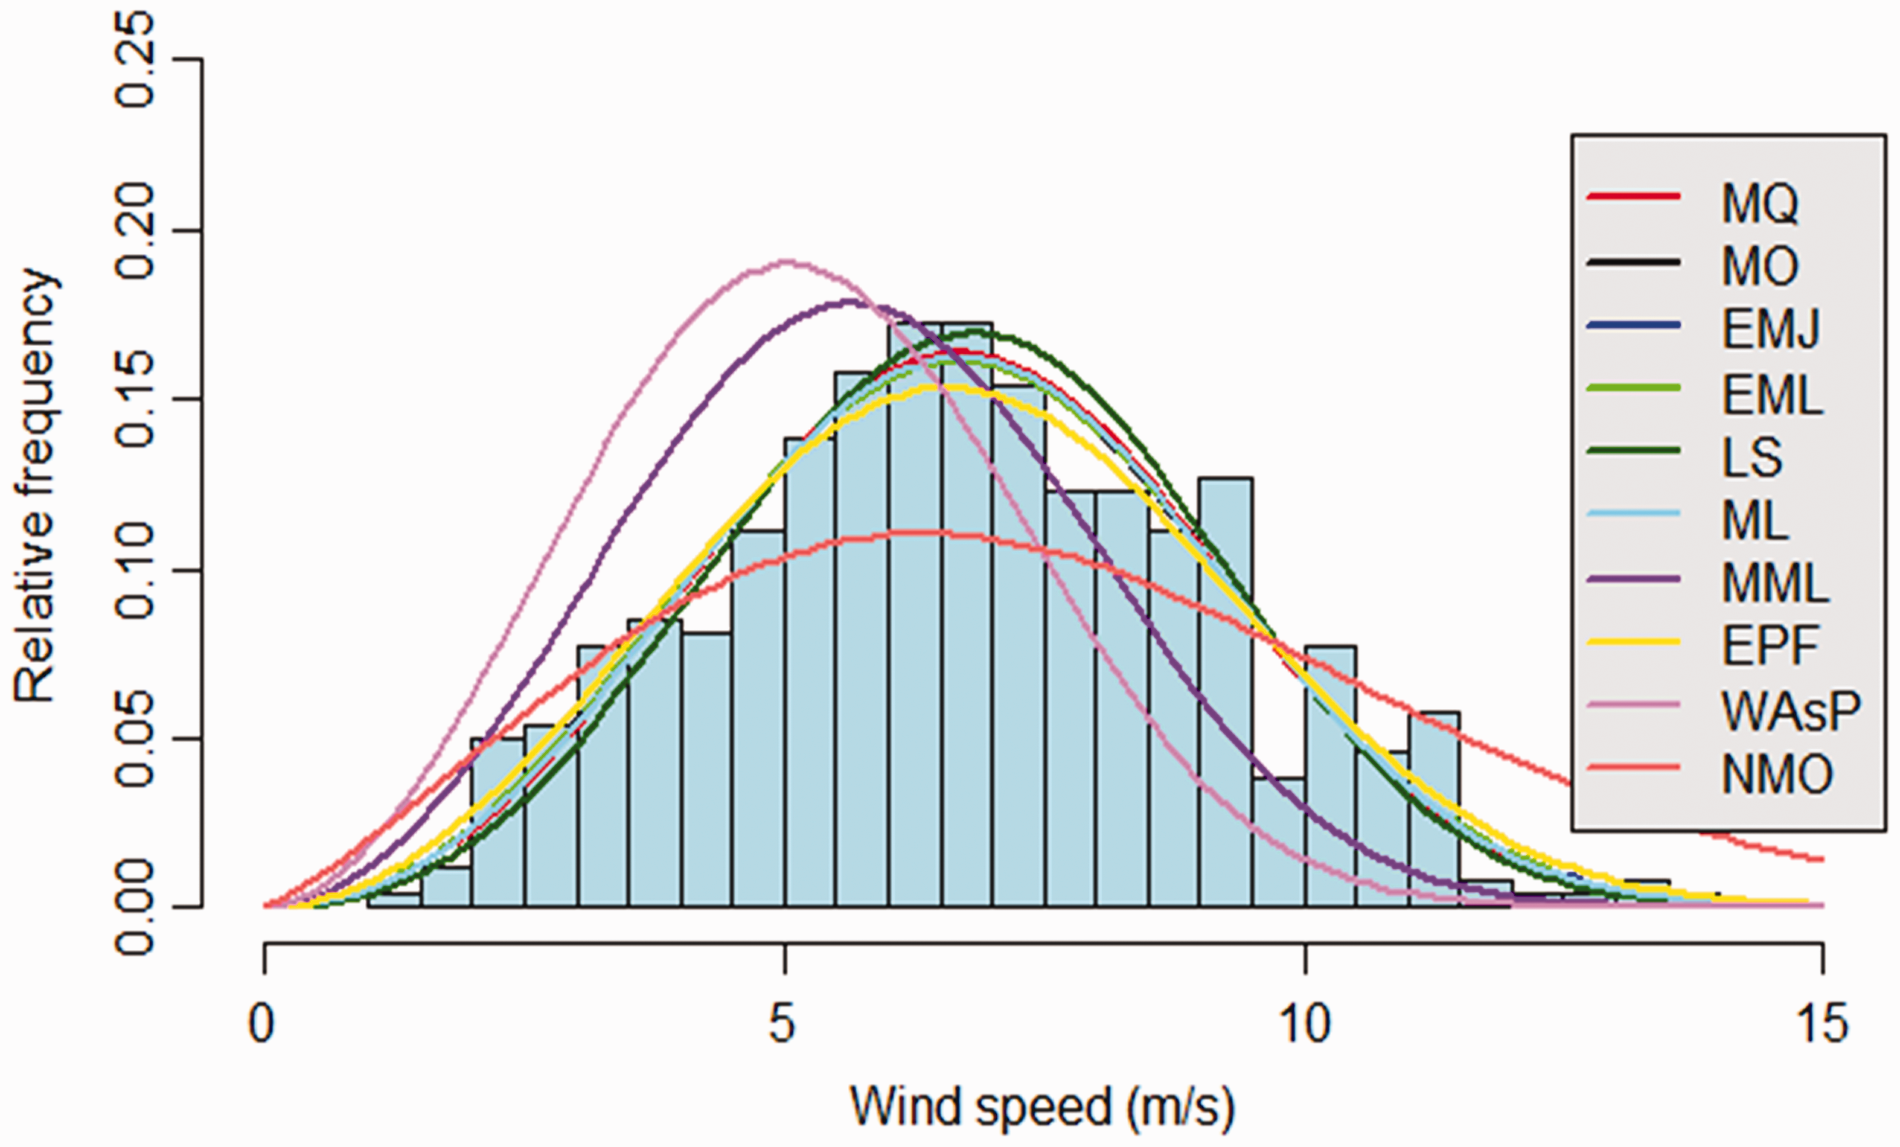
Wind frequency distributions and Weibull distribution curve for the Epi site.
The goodness of fit test error was also carried out for the Epi site, which is shown in Table 3, for which the median and quartiles method (MQ) method performed best. The MQ method had a
Goodness of fit test error for Epi, Vanuatu.
MQ: median and quartiles method; MO: moments method; LS: least squares method; ML: maximum likelihood method; MML: modified maximum likelihood method; EPF: energy pattern factor method; WAsP: wind atlas analysis and application programme; NMO: new moments method; WPD: wind power density; COE: coefficient of efficiency; RMSE: root mean square error; MAE: mean absolute error; MAPE: mean absolute percentage error.
Finally, as discussed earlier that Pentecost Island has only two seasons, which are the warmer wet season and the cooler dry season. The warmer wet season is from November to April and the cooler dry season is from May to October. The one-year wind data were divided into two seasons as mentioned above. The goodness of fit tests were carried out for both the seasons to calculate the shape factor (k), the scale factor (A), the mean wind speed and the correct WPD. The data were also fed into WAsP software to determine the shape factor (k) and the scale factor (A). The correct shape and scale factor along with the correct WPD are presented in Table 4.
Weibull parameters, mean wind speed and wind power density for the dry and wet season for Pentecost and Epi site.
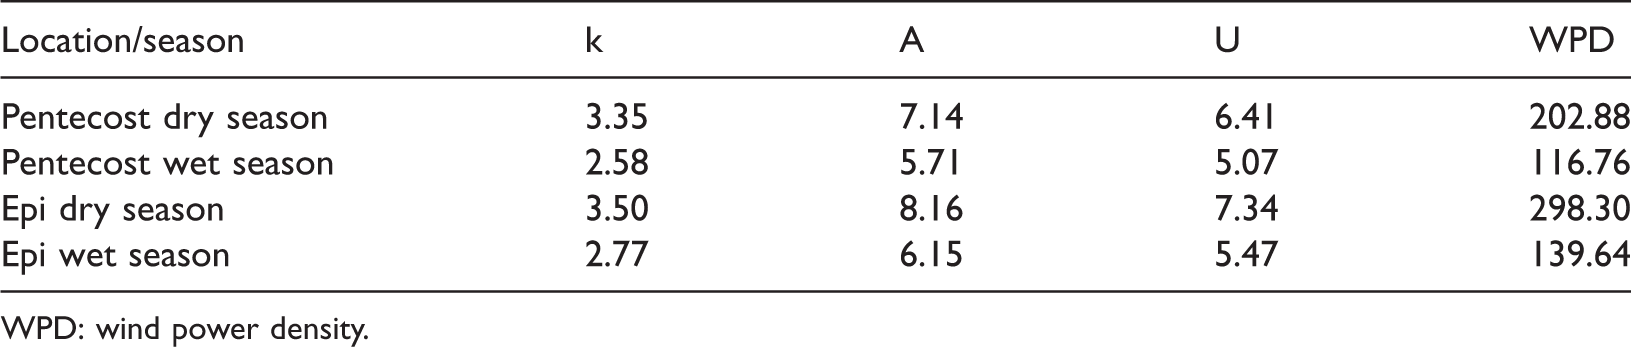
WPD: wind power density.
Estimation of AEP
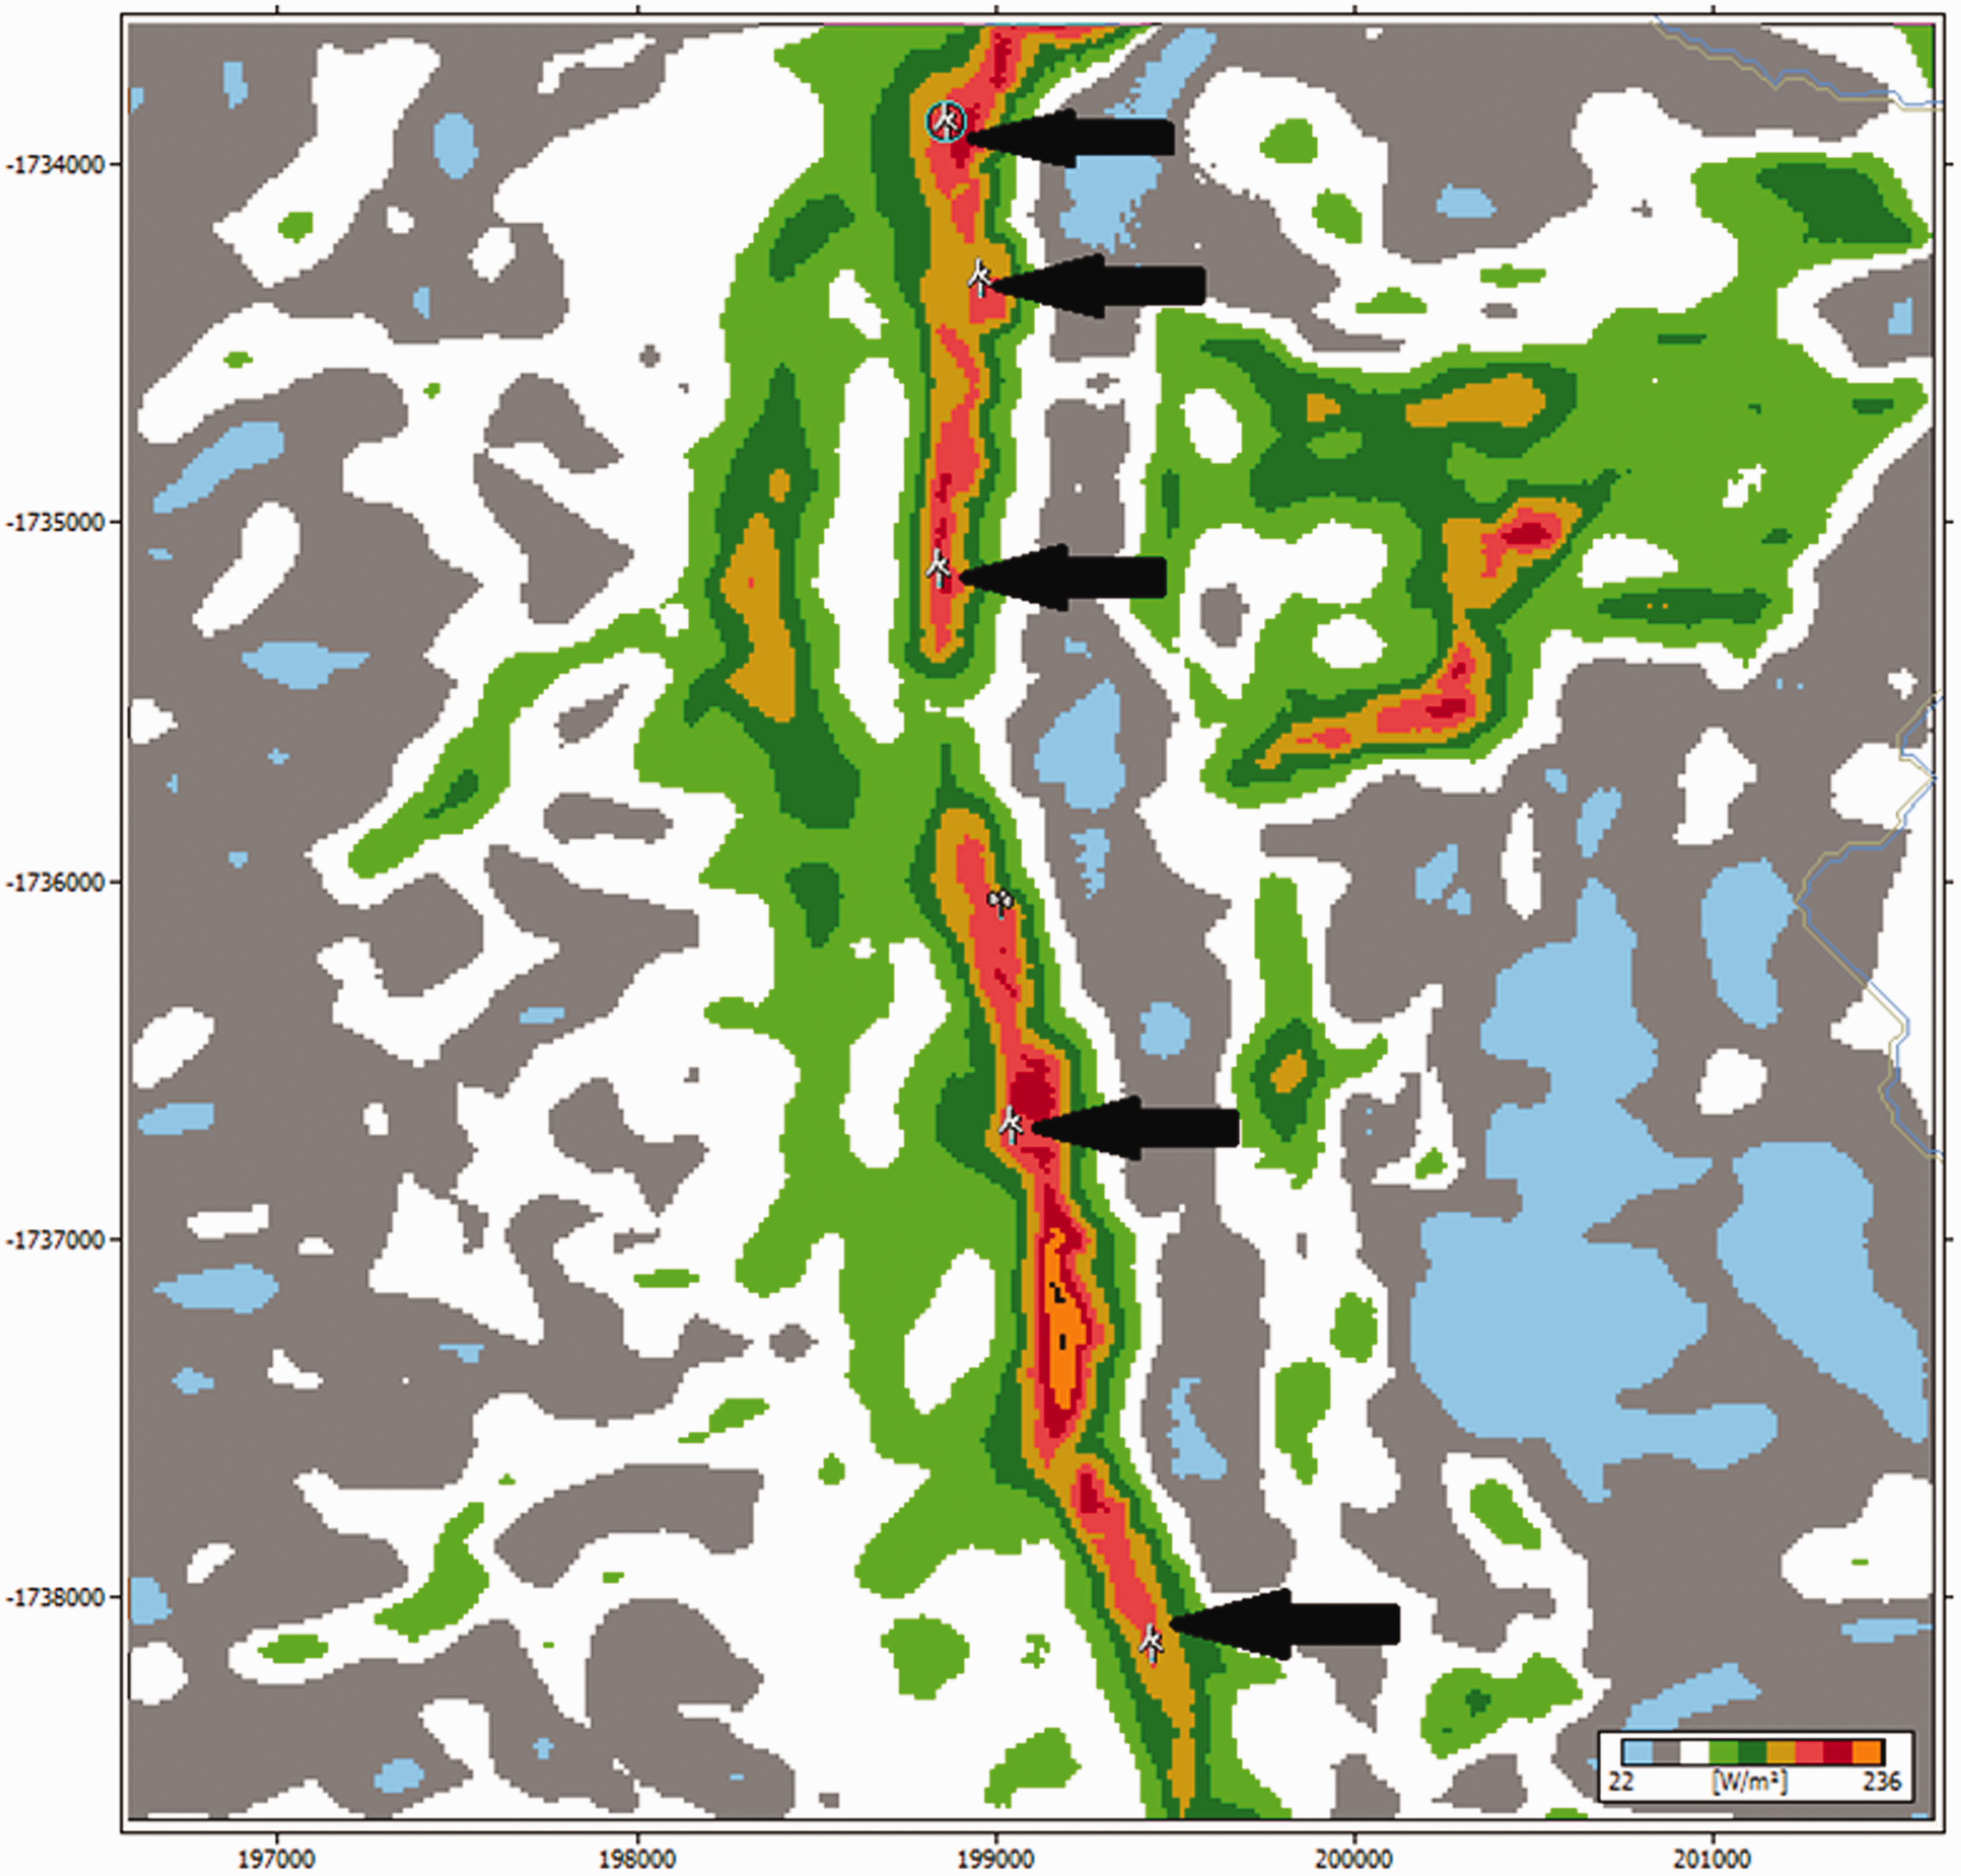
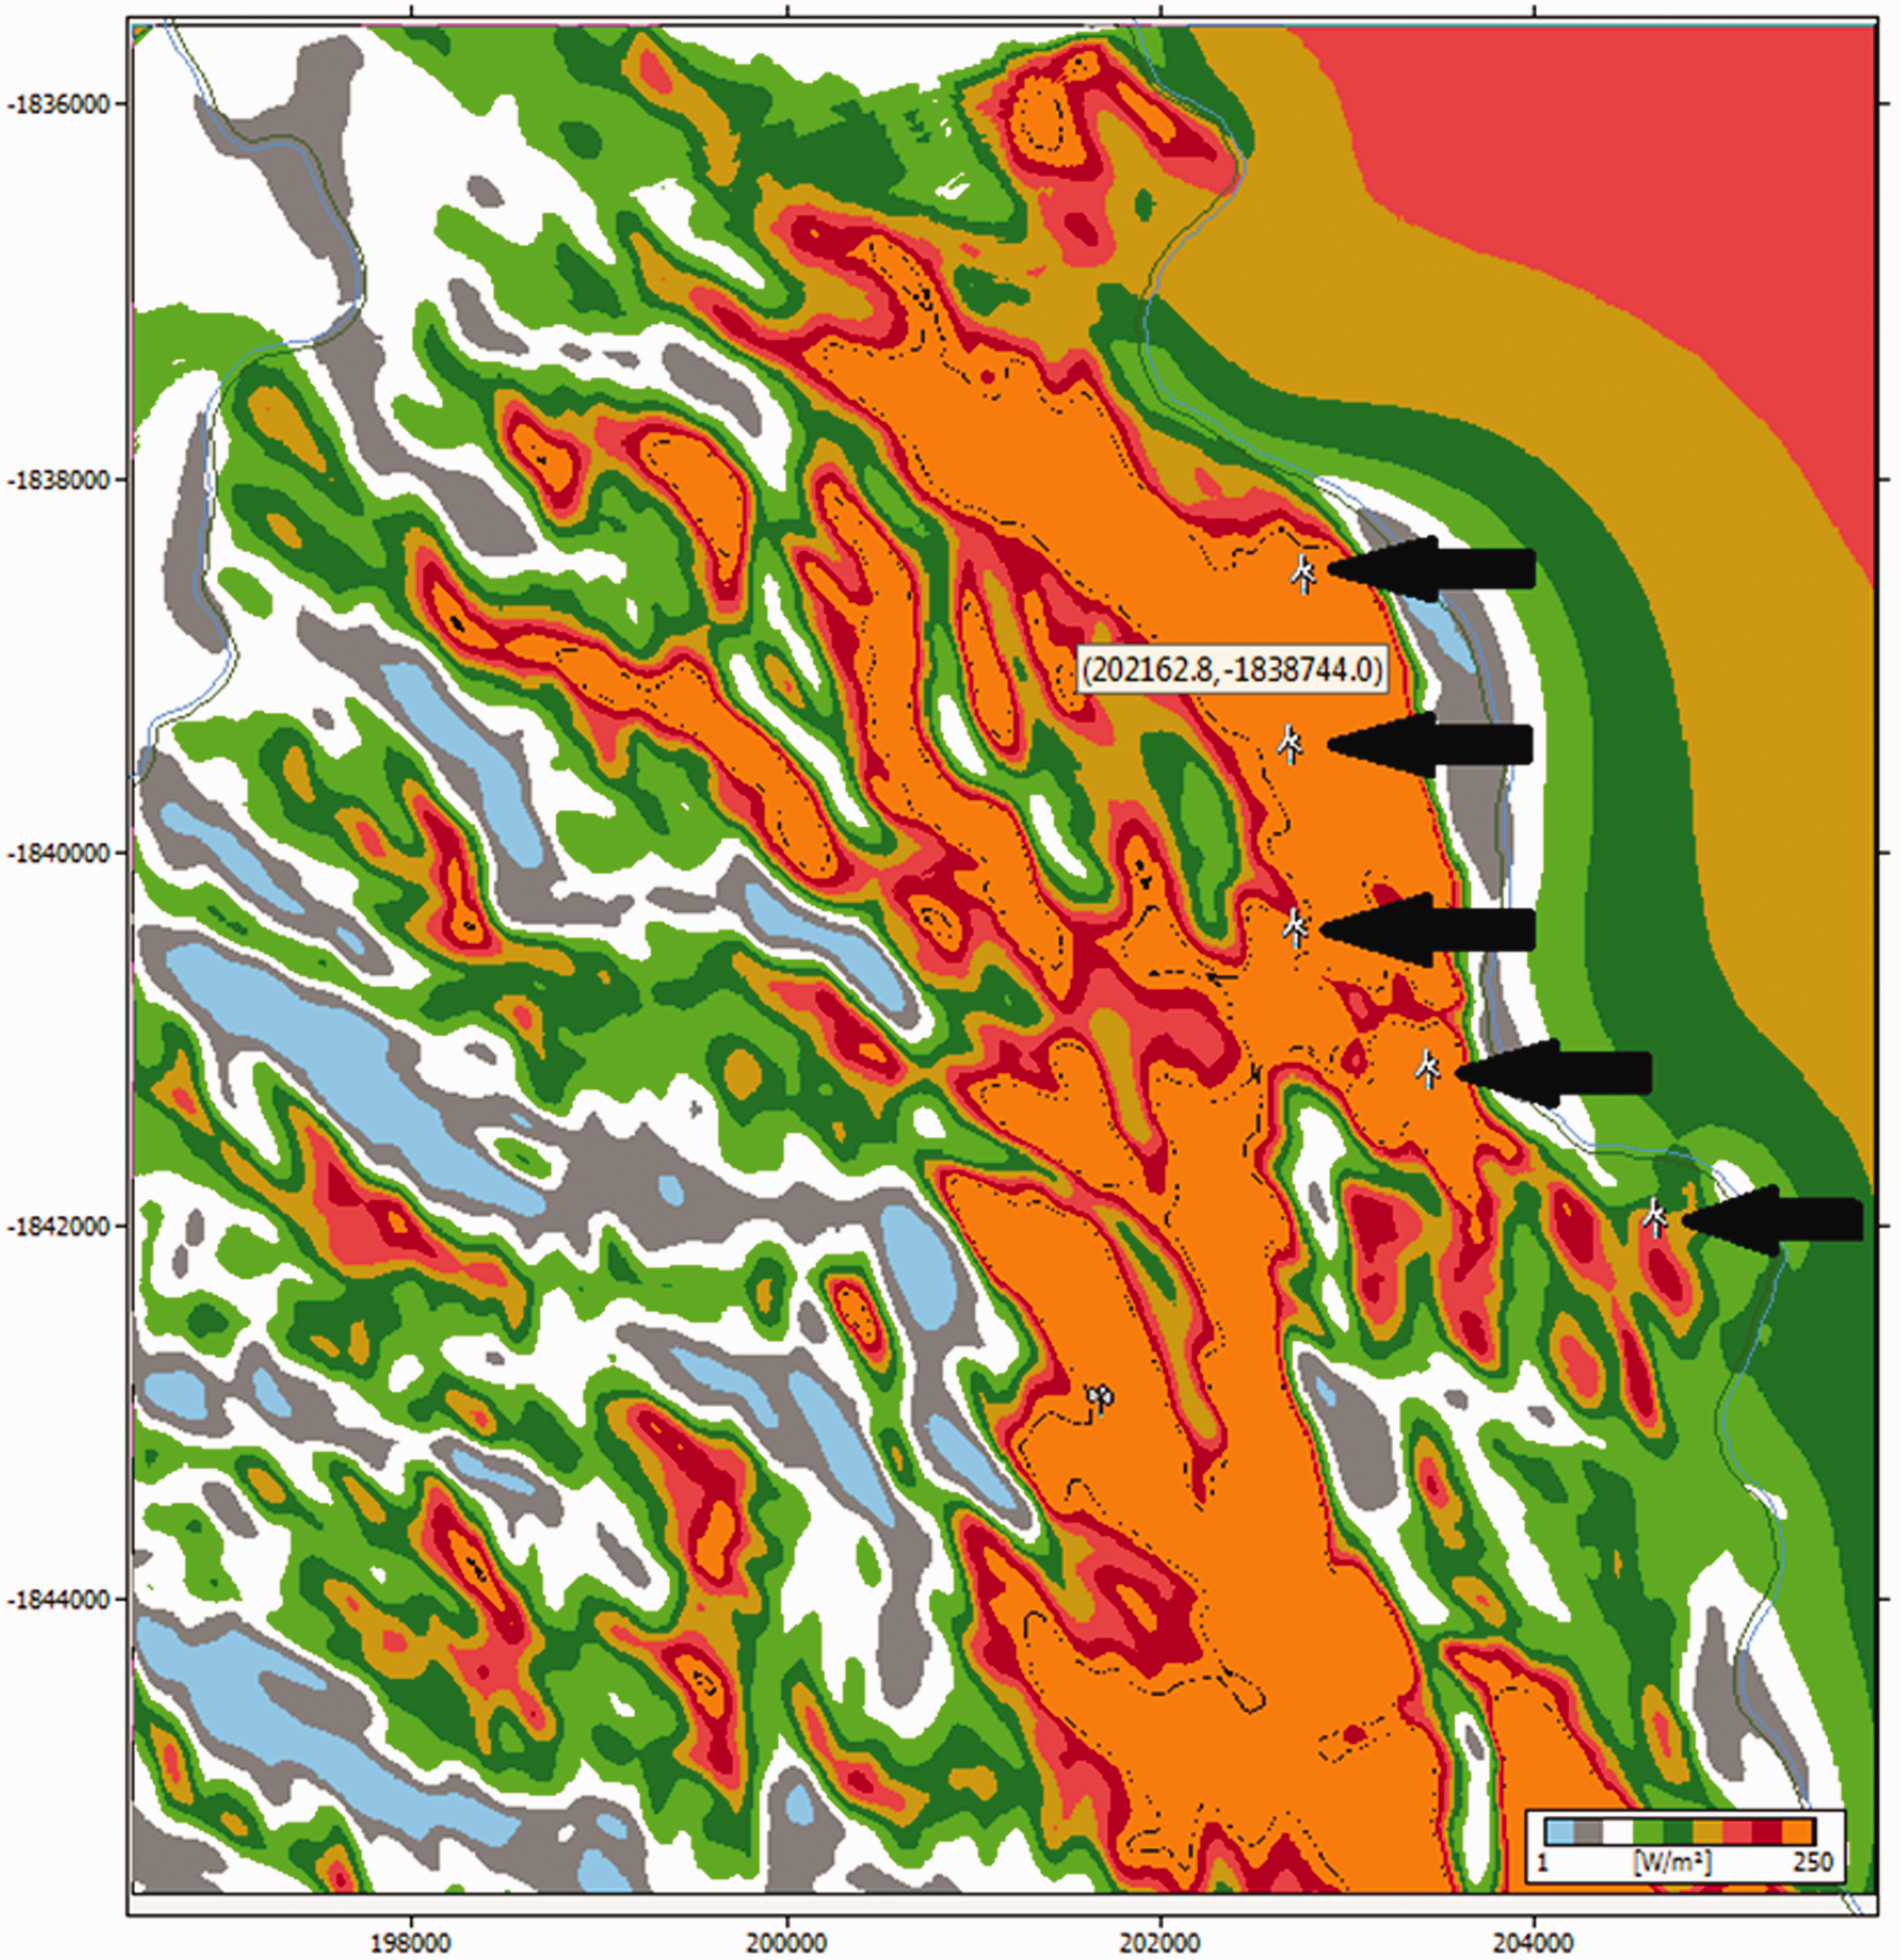
The estimation of AEP was carried out for both the sites using WAsP software, whereby Vergnet 275 kW wind turbines were placed in five separate locations on the wind map for each location. The portions of the wind map that had desired wind speeds from comparison of different methods were chosen. The required calculations were carried out, and the output was recorded as shown in Tables 5 and 6 for the two sites, respectively.
AEP for all the five turbines at the Pentecost site.
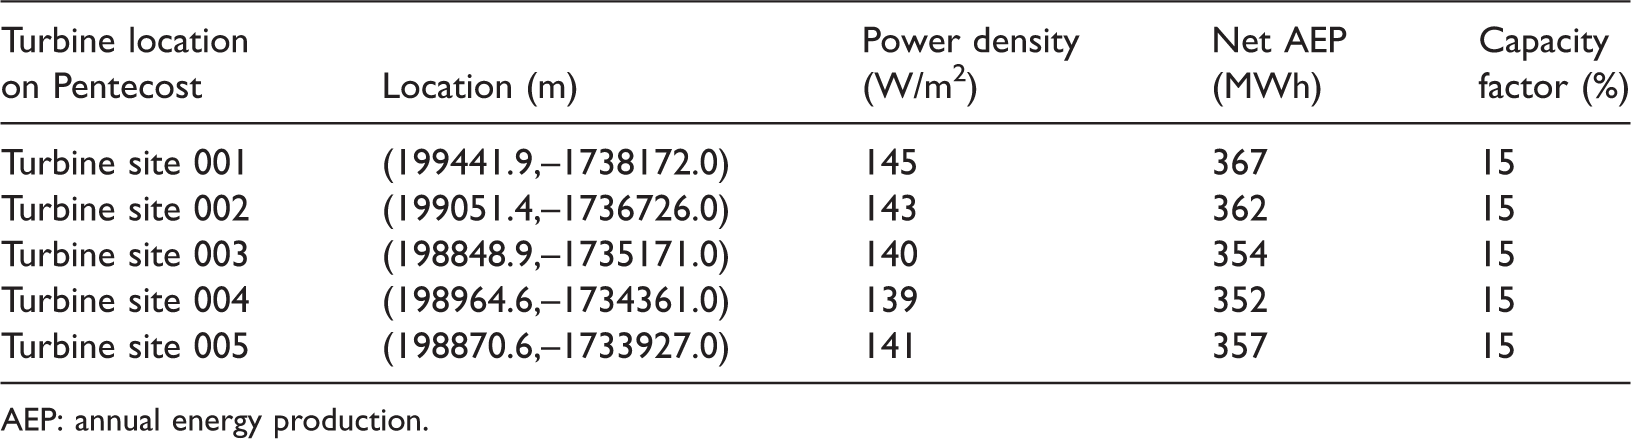
AEP: annual energy production.
The specifications of the Vergnet 275 kW wind turbine are very important for consideration in the calculation. The hub height of the turbine used is 32 m, the rotor diameter is 32 m, the cut-in wind speed is 3.56 m/s, the rated wind speed of the turbine is 12.2 m/s at a density of 1.16
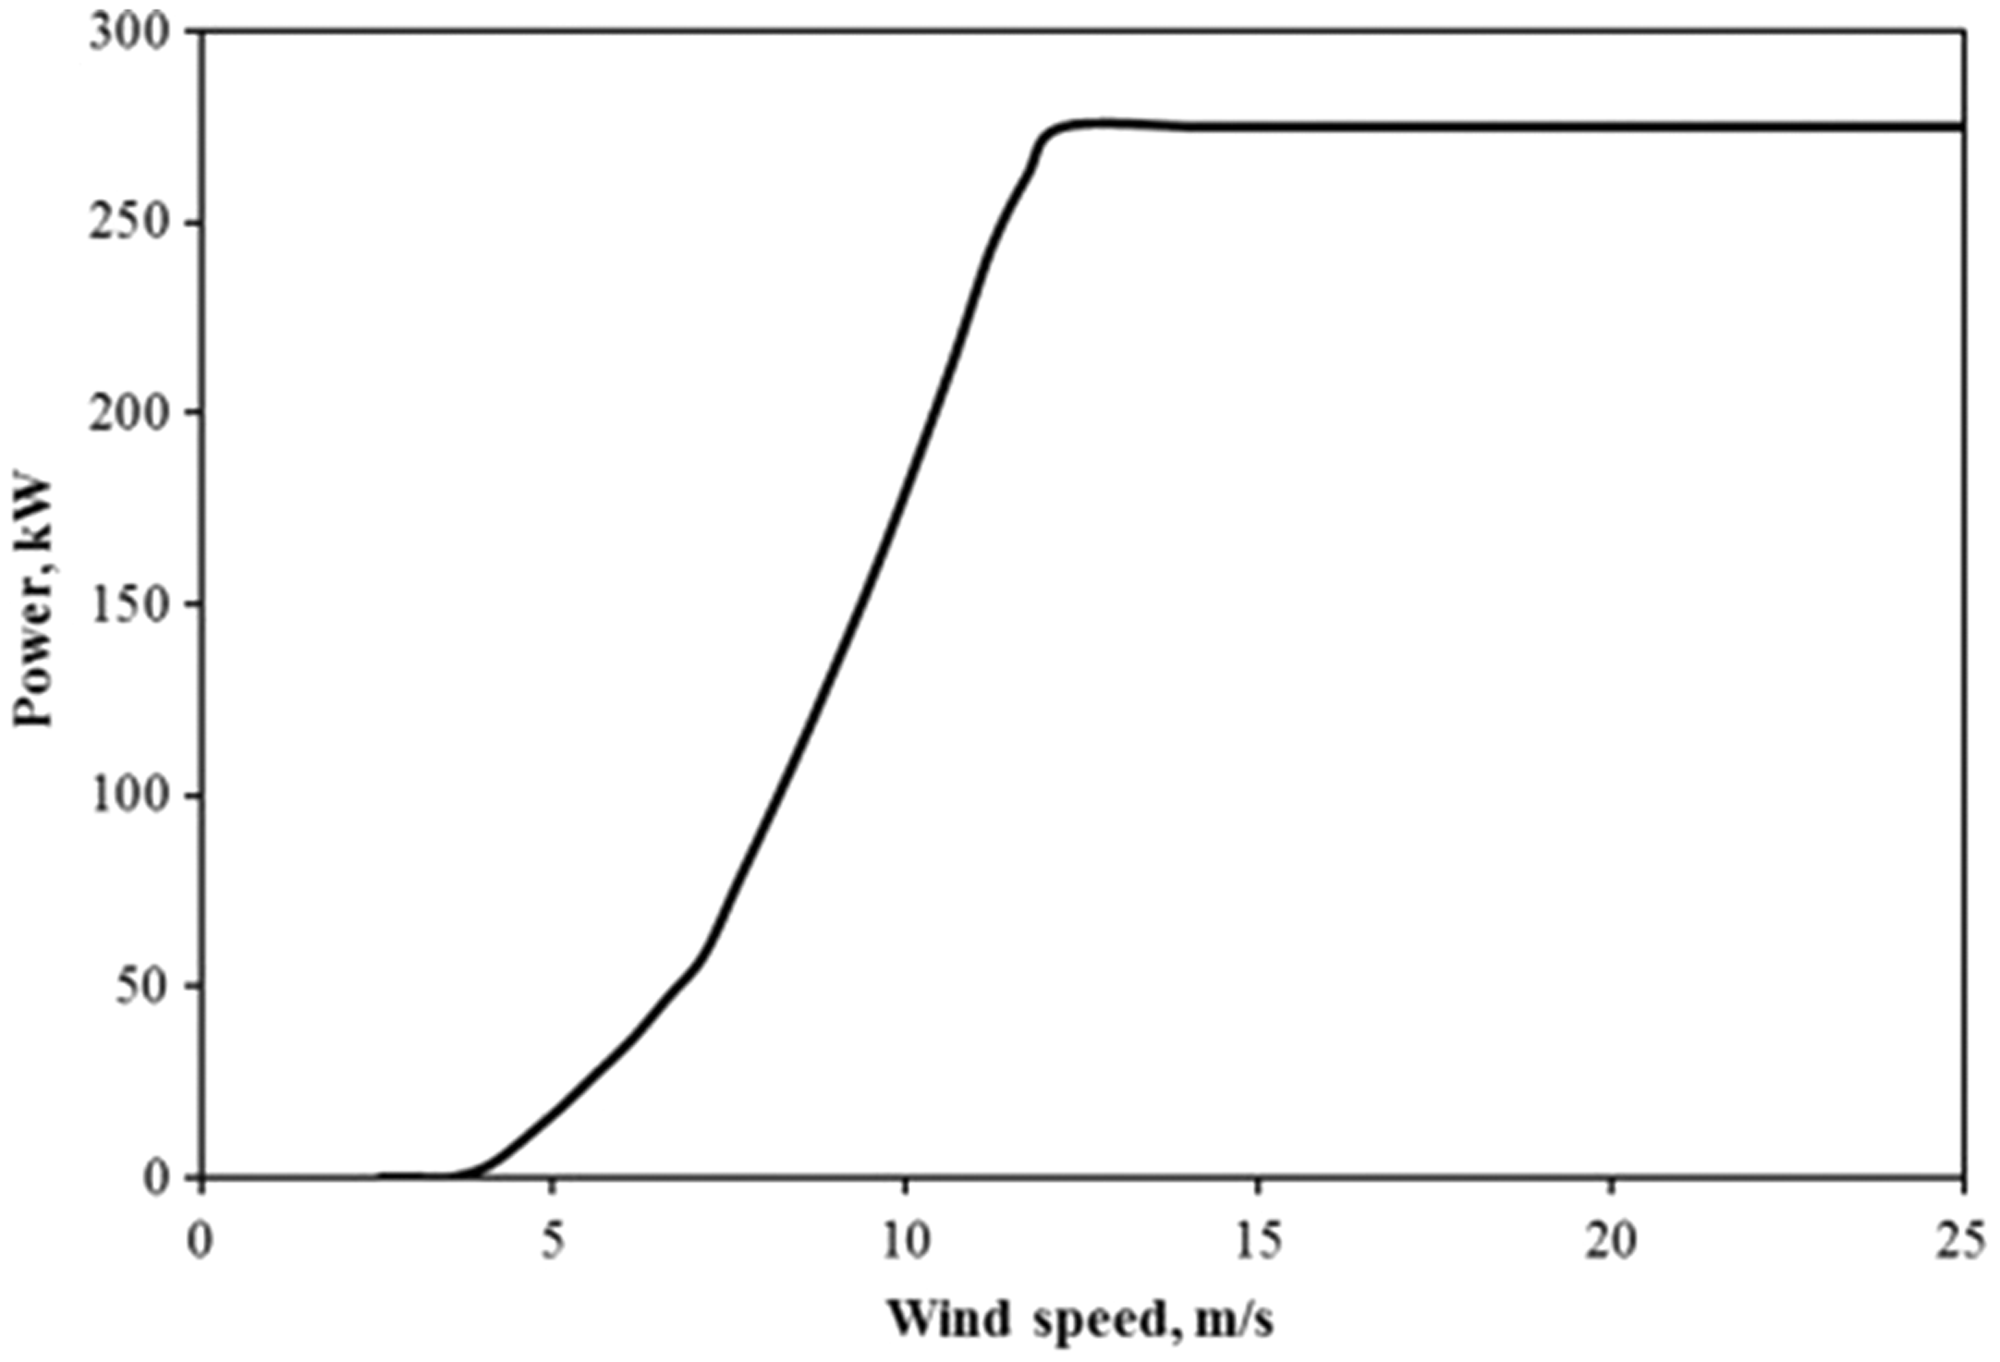
Power curve for the Vergnet 275kW wind turbine.
Other wind turbines could have also been used, but there are many reasons why the above-mentioned wind turbine was chosen. First, it can be lowered down in case of cyclones or for maintenance works. It has a winch at the base, which makes it easier for lowering. It usually takes 30 min for each wind turbine. Other turbines were also considered, but it had taller towers which would give increased AEP, but this does not justify the initial costs and operation and maintenance costs. Turbines of larger capacities, such as 1 MW, would not be suitable for smaller countries due to the louder noise and higher vibrations. The hub height was kept at 32 m, and this was almost similar for all other locations as there was not much significant difference in the results obtained.
Five turbines were placed at separate locations on the map for each site (island) and analyzed using WAsP software. The results that were obtained were the WPD, the net AEP and the capacity factor of each of the five wind turbines, presented in Tables 5 and 6. There was not much difference for the different locations on an island since the turbine heights AGL were almost the same. Figure 20 shows the wind resource map and the locations of five turbines on the Pentecost site. The five turbines will generate a total of 1792 MWh of energy per year. The wind resource map and the locations of five turbines on the Epi island are shown in Figure 21. The five turbines will produce 2169 MWh of energy per year on this island. The capacity factor of the wind turbines was also calculated. The capacity factor is a ratio of the power the wind turbine would produce for an entire year to its rated capacity. In this case, the capacity factor was 15% for the five turbines at the Pentecost site and varied from 17% to 19% for the Epi site. The capacity factor would have been improved by increasing the hub heights for the turbine or if the wind speeds were higher for the site. The wake loss for all the turbines were 0%.
AEP for all the five turbines at the Epi site.
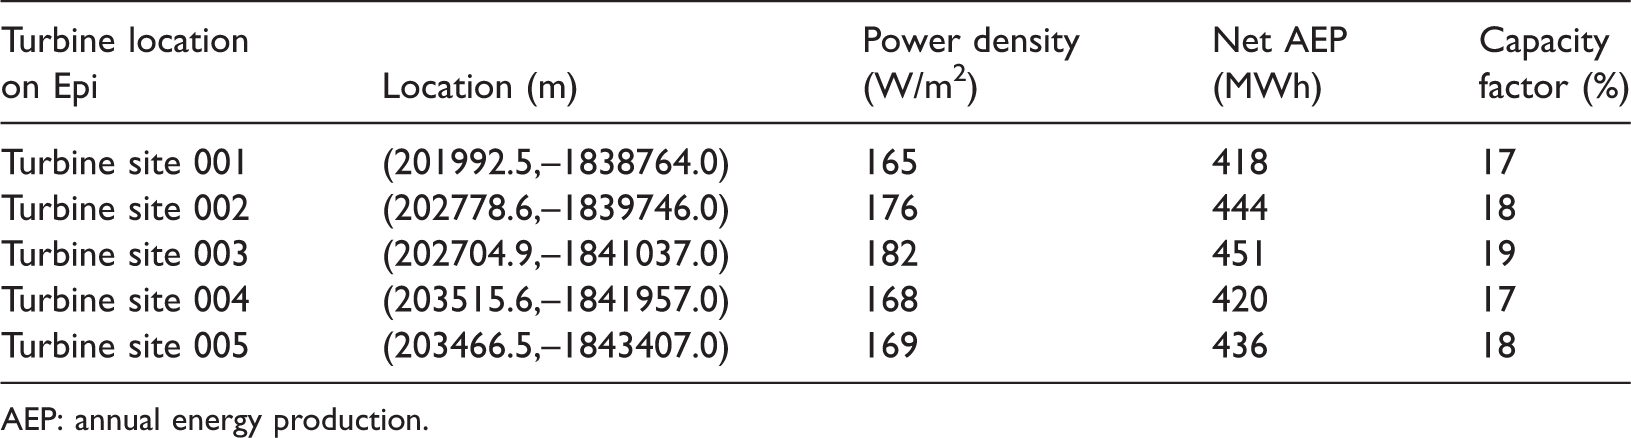
AEP: annual energy production.
Wind resource map for the Pentecost Island showing the wind power density and the locations of the five wind turbines.
Wind resource map for the Epi Island showing the wind power density and the locations of the five wind turbines.
Economic analysis
The economic analysis of installing the Vergnet 275 kW wind turbine was carried out with all the amounts in US$ based on the following assumptions (Aries et al., 2018):
Lifetime (T) of turbine = 20 years, Interest rate (r) = 12%, Inflation rate (i) = 3%, Operation, maintenance and repair works = 25% per annual cost of turbine, Scrap value = 10% of the cost of turbine and civil work, Investment (i) = cost of the turbine + cartage cost + grid integration cost + civil work cost.
The equation (31) is used to estimate the present value of costs
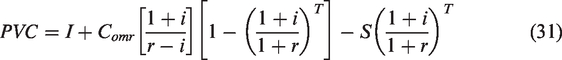
There are a few factors that need to be considered before the calculation for the PVC is made based on the assumptions mentioned above. First, the cost of the turbine would be $660,000.00, which includes the cost of the turbine, the cost of civil work, the cartage cost and the cost for grid integration. Second, the transportation per cartage cost of the turbine is $80,000. Then, if the inflation rate is 3%, the interest rate is 12% and the scrap value is at 10% of the total cost of the turbine, and the operation maintenance and repair cost of the turbine came to $7,250.00. Finally, using the equation (31), the PVC of the turbine would be $726,338.00. The average AEP of each wind turbine is 396.1 MWh. The current electricity rate for Vanuatu stands at $0.47/kWh. Then, it would give an average saving of $149,850.00 per turbine per year with a payback period of 4.85 years. Thus, this is a great investment for a small island nation that relies heavily on fossil fuels for energy production.
Conclusion
Wind energy resource assessments for Pentecost and Epi Islands in Vanuatu were carried out. Both the sites have good wind speeds at 34 m AGL. The diurnal variation of wind shear coefficient showed a good correlation with the diurnal average temperature variation. On a typical windy day, the average turbulence intensity was 22.5% at 34 m AGL, while on a less windy day, the average turbulence intensity was found to be 31.68%. The wind energy rose diagrams showed that the predominant wind direction was from the southeast for both the Pentecost and the Epi sites. The goodness of fit tests were carried out for the 10 methods used to estimate the Weibull parameters k and A. The best method for calculating the Weibull parameters for the Pentecost site was the MO, which gave a WPD of 145.0918 W/
Footnotes
Declaration of conflicting interests
The author(s) declared no potential conflicts of interest with respect to the research, authorship, and/or publication of this article.
Funding
The author(s) disclosed receipt of the following financial support for the research, authorship, and/or publication of this article: Funds for carrying out this work were provided by Korea International Cooperation Agency (KOICA) under its East-Asia Climate Partnership programme. The project number was (2009–00042).