
Abstract
Hydrogen produced from chlor-alkali plants in Jordan is typically wasted and vented to the atmosphere. If it is recovered and utilized then it can viably play a significant role for process heat on site. This study demonstrates how cleaner production can be applied to the chlor-alkali industry, with focus on utilization of hydrogen as energy resource. A chlor-alkali based on membrane cell process, in northern part of Jordan, was examined as a case of reusing excess hydrogen produced. In the baseline scenario, 47% of produced hydrogen was used in HCl production, 10% in controlling pressure difference, and the remainder was not used (i.e. 43% of hydrogen was vented into the atmosphere). The proposed cleaner production option was to install a hydrogen boiler next to the existing fuel boiler and utilize the hydrogen to generate steam for on-site process heating purposes. The effectiveness of this cleaner production option was discussed in relation to its technical and environmental feasibility. On-site utilization of hydrogen was found to provide 34% of the total steam needed at the full capacity. This in return yields a saving percentage of around 33.37% and a payback period of 0.947 year. From environmental perspective, theoretically, carbon dioxide emission reductions can be up to 1810 tons based on the chlor-alkali productions pattern for 24 consecutive months.
Introduction
Jordan is a non-oil producing country with very limited indigenous energy resources. Jordan energy supply depends at about 96% on imports of oil, oil products, natural gas, and electricity (Saidan, 2012), which accounted for 26% of total imports and 7% of GDP in 2016 (Ministry of Energy and Mineral (MEMR), 2016).
Moreover, the final energy demand (6.416 Mtoe) and electricity demand consumed by industry are 17% and 24%, respectively. The maximum load of the electric system more than doubled in last 10 years (i.e. an average annual growth of 7.7%). Currently, the electricity tariffs are undergoing a reform process to remove subsidies, so as to be consistent with costs of supply and provide an adequate incentive to save energy for large consumers (MEMR, 2016) influx of refugees into Jordan coupled with increasing demand of energy and water resources have caused significantly increased economic burden in Jordan (Al-Addous et al., 2019; Al-Awad et al., 2018; Al-Hamamre et al., 2017; Hindiyeh et al., 2018; Jabr et al., 2019; Saidan et al., 2017, 2018, 2019).
The chlor-alkali industry forms an important component of basic chemical building blocks that are essential for making thousands of downstream chemical products (Worrell et al., 2000; Yang et al., 2009). This process is also among the highest energy consuming processes due to the high electricity utilization that becomes the key issue to the process feasibility (Jung et al., 2014). However, there are multiple attempts to reduce the energy consumption of the chlor-alkali process using alternative sources of energy (Rabbani et al., 2014a, 2014b, 2016; Wang et al., 2014) or by replacing the standard hydrogen-evolving cathode in membrane technology by an oxygen-depolarized cathode (Garcia Herrero et al., 2017a, 2017b). The chlor-alkali process applies 90% of the electric current in the process to a brine (water and salt) solution to produce chlorine, hydrogen gas, and sodium hydroxide, or caustic soda solution. It is worth mentioning that more than 95% of world chlorine production is achieved using the chlor-alkali process (Euro Chlor, 2012; Jung et al., 2014).
Three different electrolytic processes are currently used to produce chlorine and caustic soda: (a) the diaphragm cell process (Griesheim cell) introduced in 1885, (b) the mercury cell process (Castner-Kellner cell) used industrially since 1892, and (c) the membrane cell process developed in the early seventies of the last century (Schmittinger et al., 2006). All new plants are based on the favorable membrane cell process because of low capital investment and operating costs relative to diaphragm and mercury processes (Schmittinger et al., 2006).
Chlorine is produced and collected at the negatively charged electrode, known as the cathode, and hydrogen and caustic soda are produced and collected at the positively charged electrode, known as the anode (Han et al., 2014). Production of 1 kg of chlorine is accompanied by the production of 1.1 kg of caustic soda and 0.03 kg of hydrogen (Fauvarque, 1996).
Hydrogen (H2) is a clean energy carrier accepted worldwide since its combustion only produces water as by-product and does not contribute harmful oxides of carbon, nitrogen, sulfur, etc. which are responsible for global warming (Chaubey et al., 2013; Dunn, 2002; Dutta, 2014; Hamad et al., 2014; Rand, 2011; Satyapal et al., 2007). Hydrogen is a non-carbon-based energy source and has high energy content per mass compared to petroleum, i.e. hydrogen energy content is 120 MJ/kg which is more than the double of that of liquefied natural gas (54.4 MJ/kg; Ni et al., 2006). Therefore, there have been lately many attempts to intensify and increase the production of H2 by the chlor-alkali process; for instance, by using spinning disc membrane electrolyzer (Mendoza et al., 2017), or using centrifugal force fields, ultrasonics, rotating electrodes and rotating cells (Scott, 2018).
Chlorine production is one of the most energy-intensive industrial processes in the world. Significant reduction of energy demand in the chlor-alkali industry is highly desirable (Moussallem et al., 2008). Therefore, this paper investigates the viability of using hydrogen gas by-product as a fuel source on site of chlor-alkali process based on cleaner production (CP) and pollution prevention (P2) assessment. Moreover, it assesses both the economic and environmental benefits based on the CP and P2 measures.
The CP and P2 assessment imply reducing or eliminating waste at the source by modifying production processes, promoting the use of non-toxic or less-toxic substances, implementing conservation techniques, and re-using materials rather than putting them into the waste stream. It is thus a tool for improving the eco-efficiency of an industrial facility; the industrial facility can improve its capacity to use fewer resources and generate less waste, while maintaining or increasing its rate of production (Basu et al., 2013; Ciccozzi et al., 2003; Fresner, 1998; Kjaerheim, 2005; Suh et al., 2005).
Hydrogen potential and utilization in Jordan is still in a research stage (Alrabie and Saidan, 2018; Saeed et al., 2013). Hence, the importance of the present study lies not only in the scientific field, but also in current practical application in all chlor-alkali industries based on membrane cell process.
This paper focuses on the implementation of CP assessment on the utilization of the hydrogen produced from the chlor-alkali process in Jordan in relation to its technical and environmental feasibility.
Materials and methods
The P2 assessment has been carried out following the Guide to Industrial Assessment for Pollution Prevention and Energy Efficiency to facilitate the assessment (Environmental Protection Agency, 2001).
Several detailed visits were carried out to collect necessary data and establish the material, water, and energy flow analyses. The whole process was performed in two phases and monitored subsequently to evaluate the changes progressively implemented against the reference situation. As such, phase I corresponds to the initial system before the changes were made. However, phase II represents the quantitative auditing of the facility and determines the implementation progress of the CP and P2 recommendations.
Overview of the manufacturing process
The chlor-alkali industrial process selected in this study is located in Jordan’s Hallabat Industrial Park, which is a company for caustic chlorine facility that was established in 2004. The facility produces caustic soda, liquid chlorine gas, hydrochloric acid, and sodium hypochlorite. The facility’s full production rates are:
crusty soda concentration of 99%: 24,500 tons/year, soda concentration of 50% liquid: 49,000 tons/year, soda concentration of 33% liquid: 73,500 tons/year, liquefied chlorine gas purity of 99.50%: 21,000 tons/year, hydrochloric acid concentration of 33%: 25,000 tons/year, sodium hypochlorite concentration of 12%: 15,000 tons/year.
The membrane cell process is a clean but complicated process with several produced products and by-products. A schematic of the chlor-alkali process is depicted in Figure 1, in which the brine is supplied as solid salt from the Dead Sea. However, prior being used in the membrane cells processes, it is normally dissolved in open tanks to the saturated limit and then a further clarification, precipitation, and filtration processes are conducted to remove the total suspended solids and sludge.
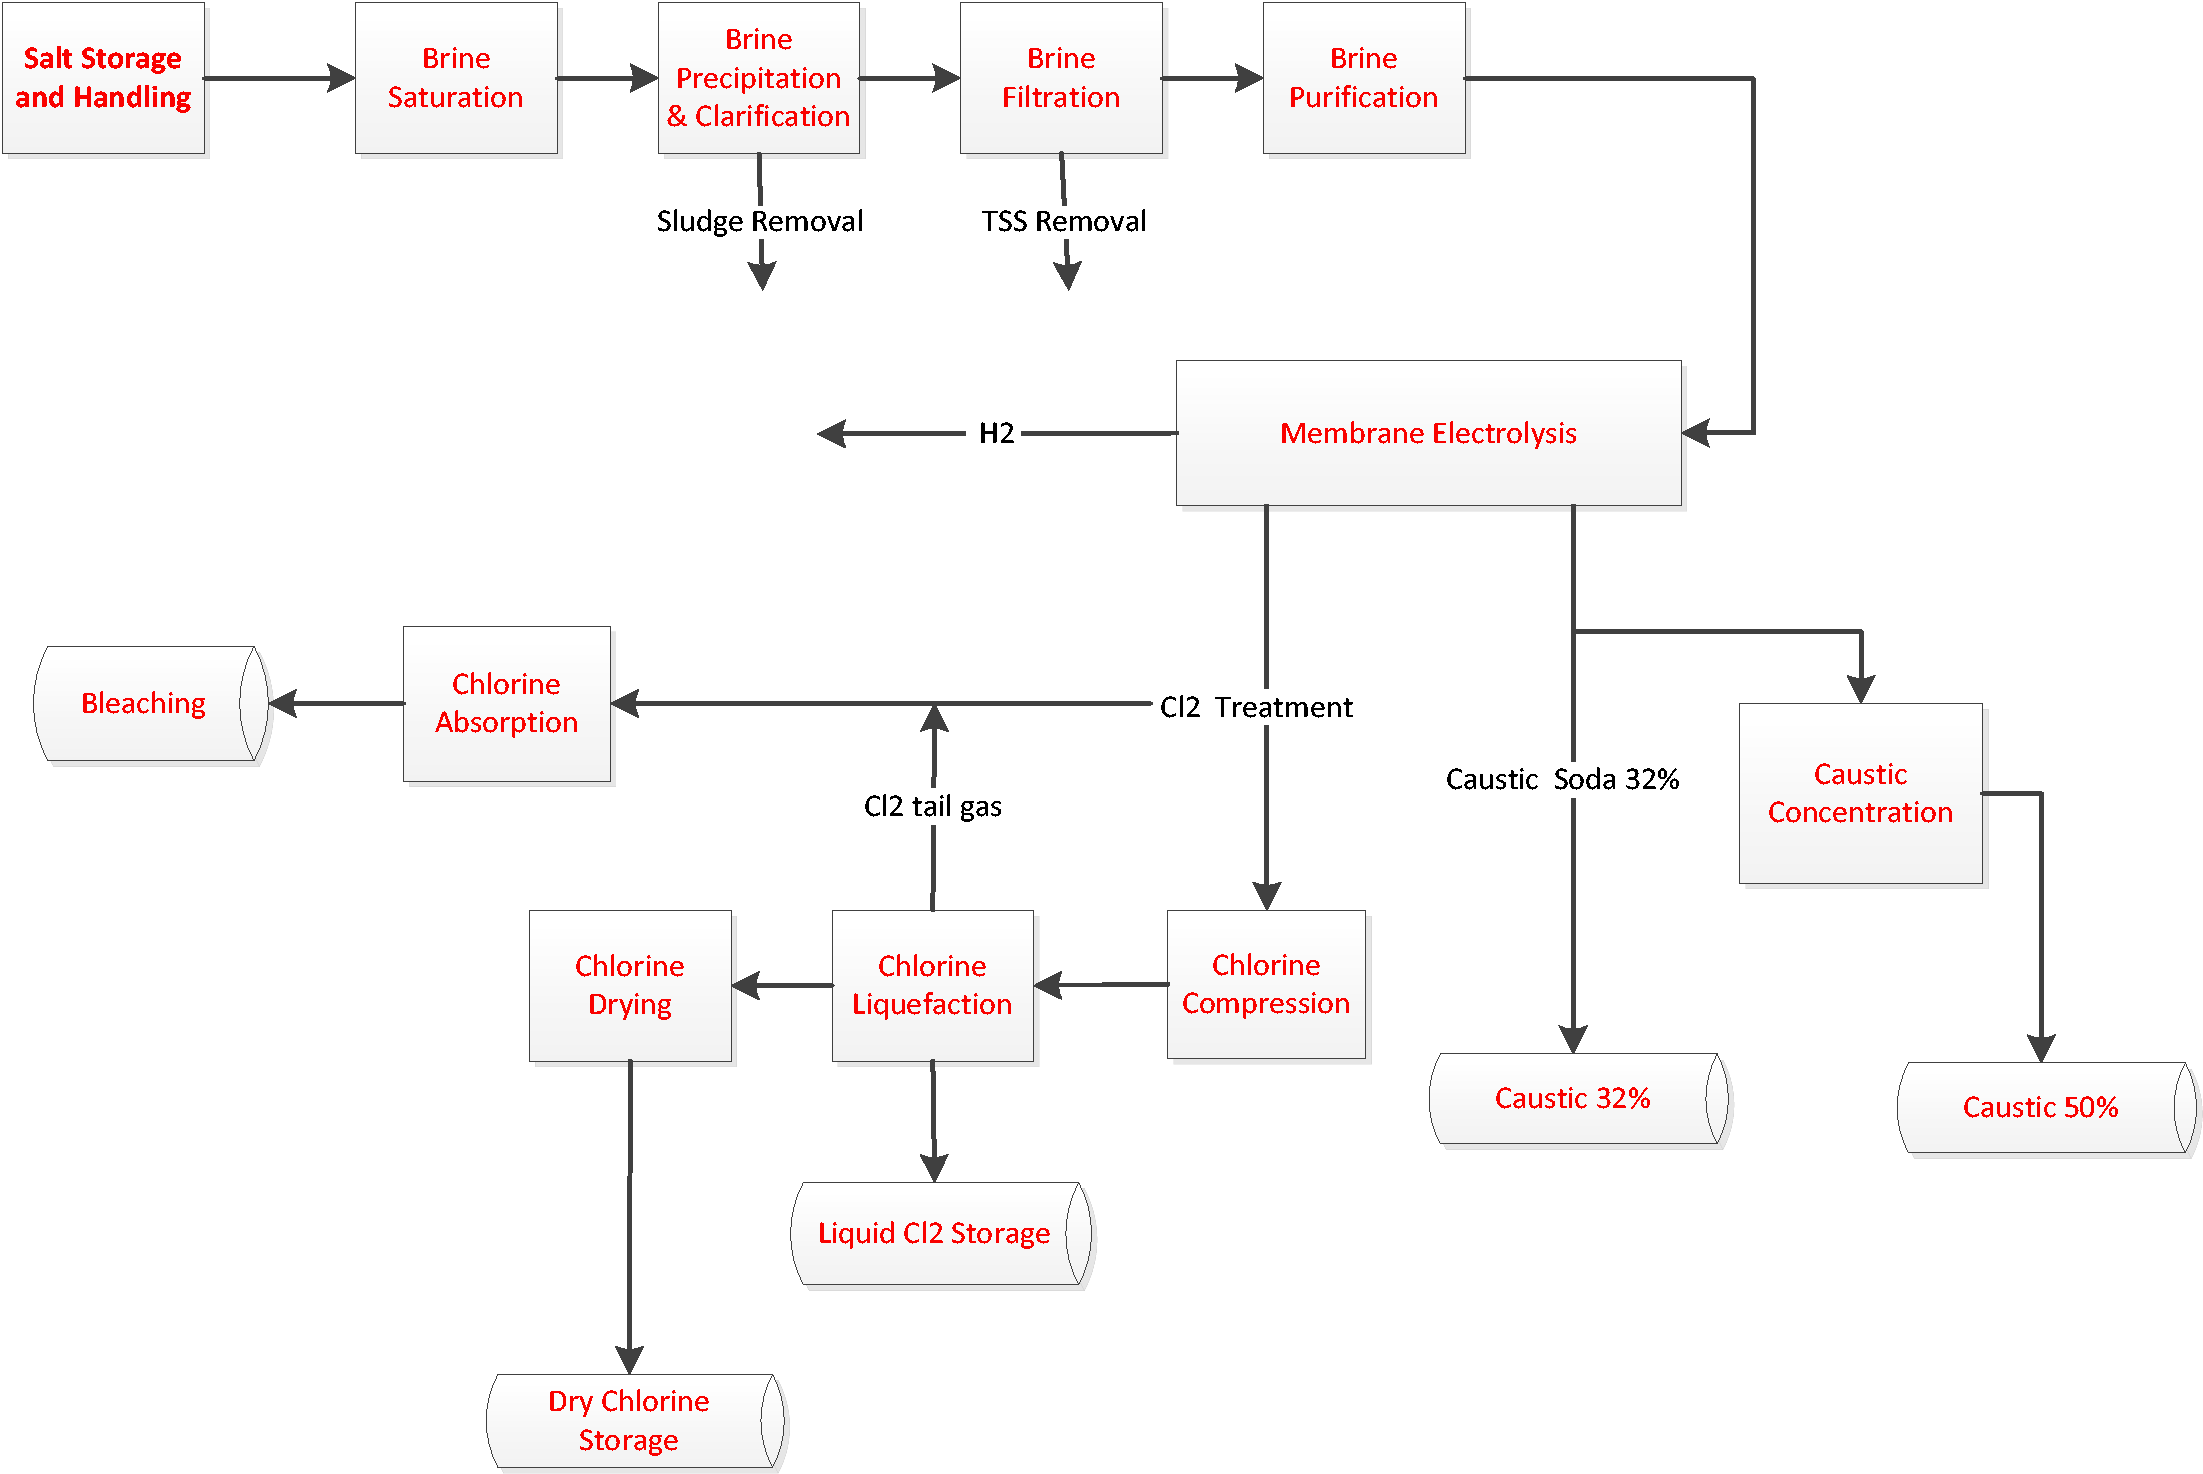
Chlor-alkali production block diagram.
The dissolved salt passes through an extra purification process to reduce the concentration of any undesirable components (e.g., sulfate ions, cations of calcium (Ca), magnesium (Mg), barium (Ba) and other metals) that can affect the electrolytic process. Moreover, the brine is usually acidified with hydrochloric acid before it enters the membrane electrolysis cells. Then chlorine and hydrogen, as well as caustic soda can be produced in series of electrolyzers by passing an electric current (DC) between two electrodes separated by an aqueous electrolyte with good ionic conductivity (Wang et al., 2014).
As the core part of the chlor-alkali plant is based on a specific electrolyzing system, see Figure 2, the reaction at the anode of the electrolyzer is (Mattioda and Christidis, 1989)

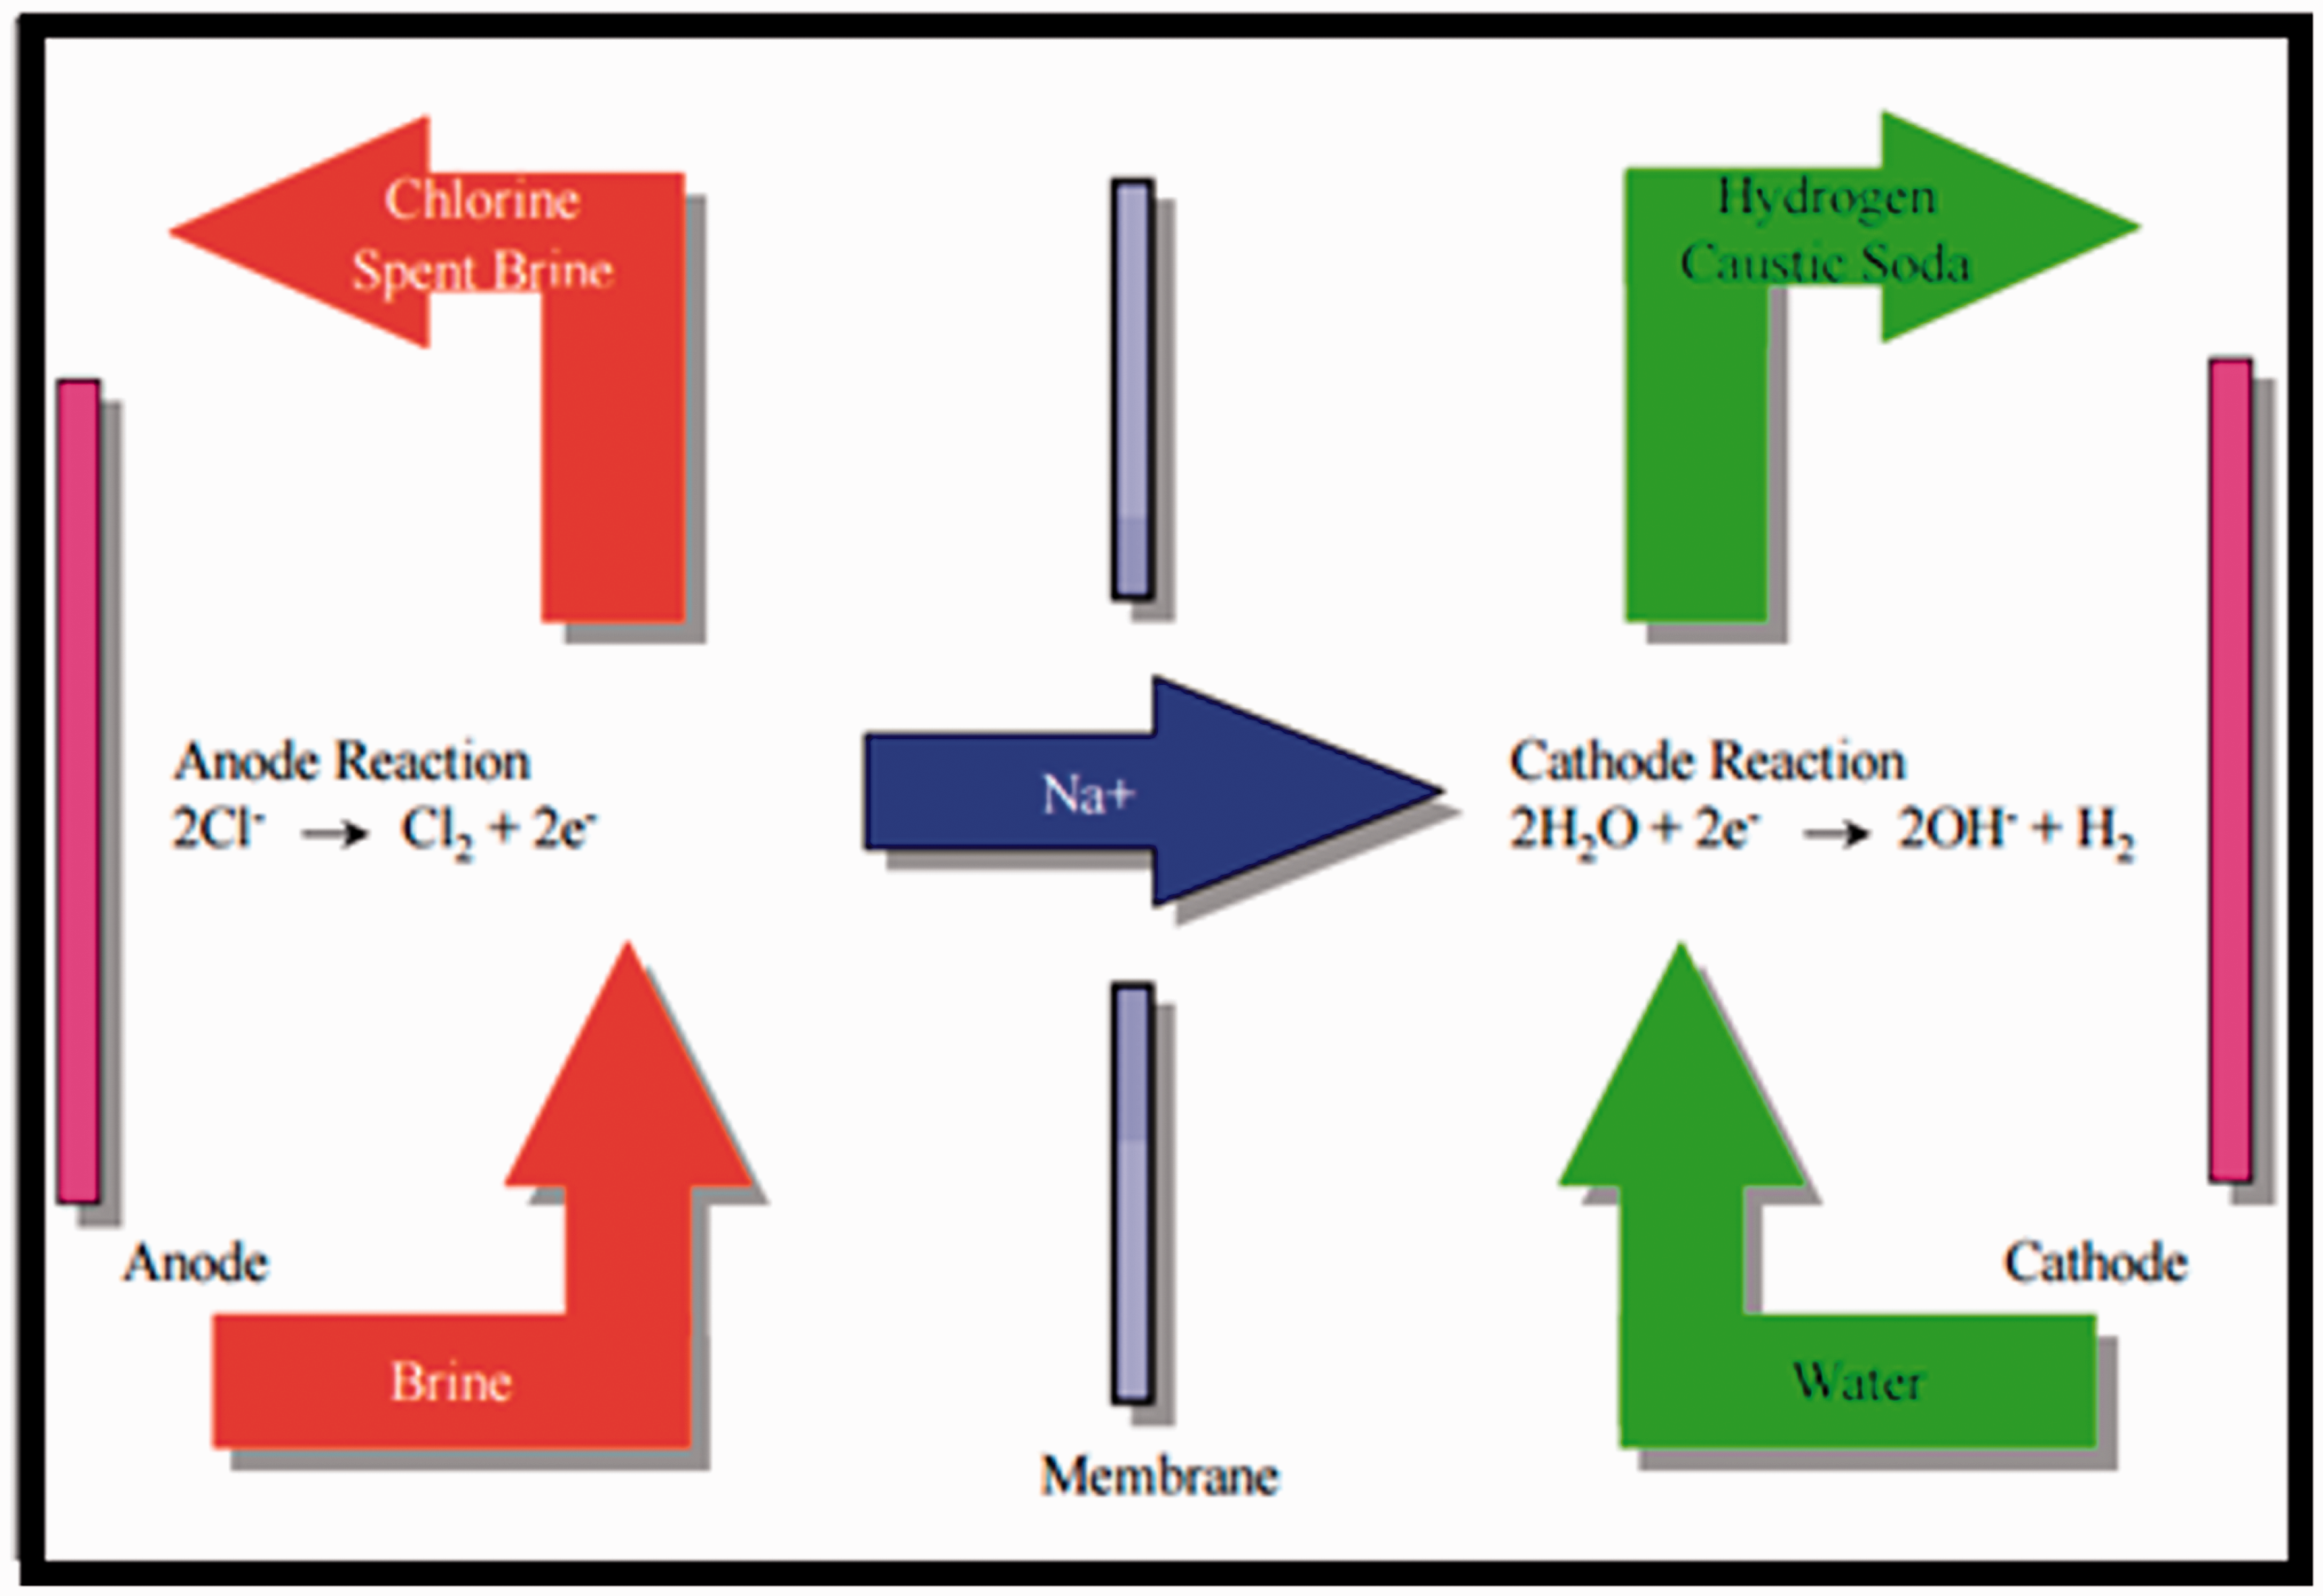
Membrane cell operation.
The reaction at the cathode is

The total reaction is

The overall process reaction is

The generated chlorine goes through a series of processes for cooling, cleaning, drying, compression. and liquefaction. The process also generates waste gases consisting of nitrogen (N2), oxygen (O2), hydrogen (H2), carbon dioxide (CO2), and less than 8% of the generated chlorine. The generated chlorine is used for the synthesis of bleach (sodium hypochlorite) through the chlorine absorption unit.
As a by-product, the caustic soda is also normally produced in several stages using evaporators. The caustic soda produced from membrane cells is usually approximately 32 wt% sodium hydroxide (NaOH), which needs to be concentrated to 50 wt% NaOH to be traded as a commodity.
The other by-product is H2, which leaves the cell in high concentration form (>99.9 vol% by volume) and is normally cooled to remove water vapor, NaOH, and salt.
Data collection
With the assistance of the technical team at the facility, most valuable data were obtained through field trips and detailed walk-through assessment, and consultations with experts. Data were also extracted from the production process technical reports, auditing reports, and routine monitoring reports. More data related to the products and by-products from the manufacturing process were provided from the process flow diagram, as well as, the mass and energy balance diagram from 2011 to 2014.
The main inputs and outputs, together with an overview of the facility and key flows of environmental resources, were obtained. Data on measurements and estimations were obtained from the technical persons in charge and the records of the financial, procurement, and maintenance departments.
Baseline scenario of the hydrogen process
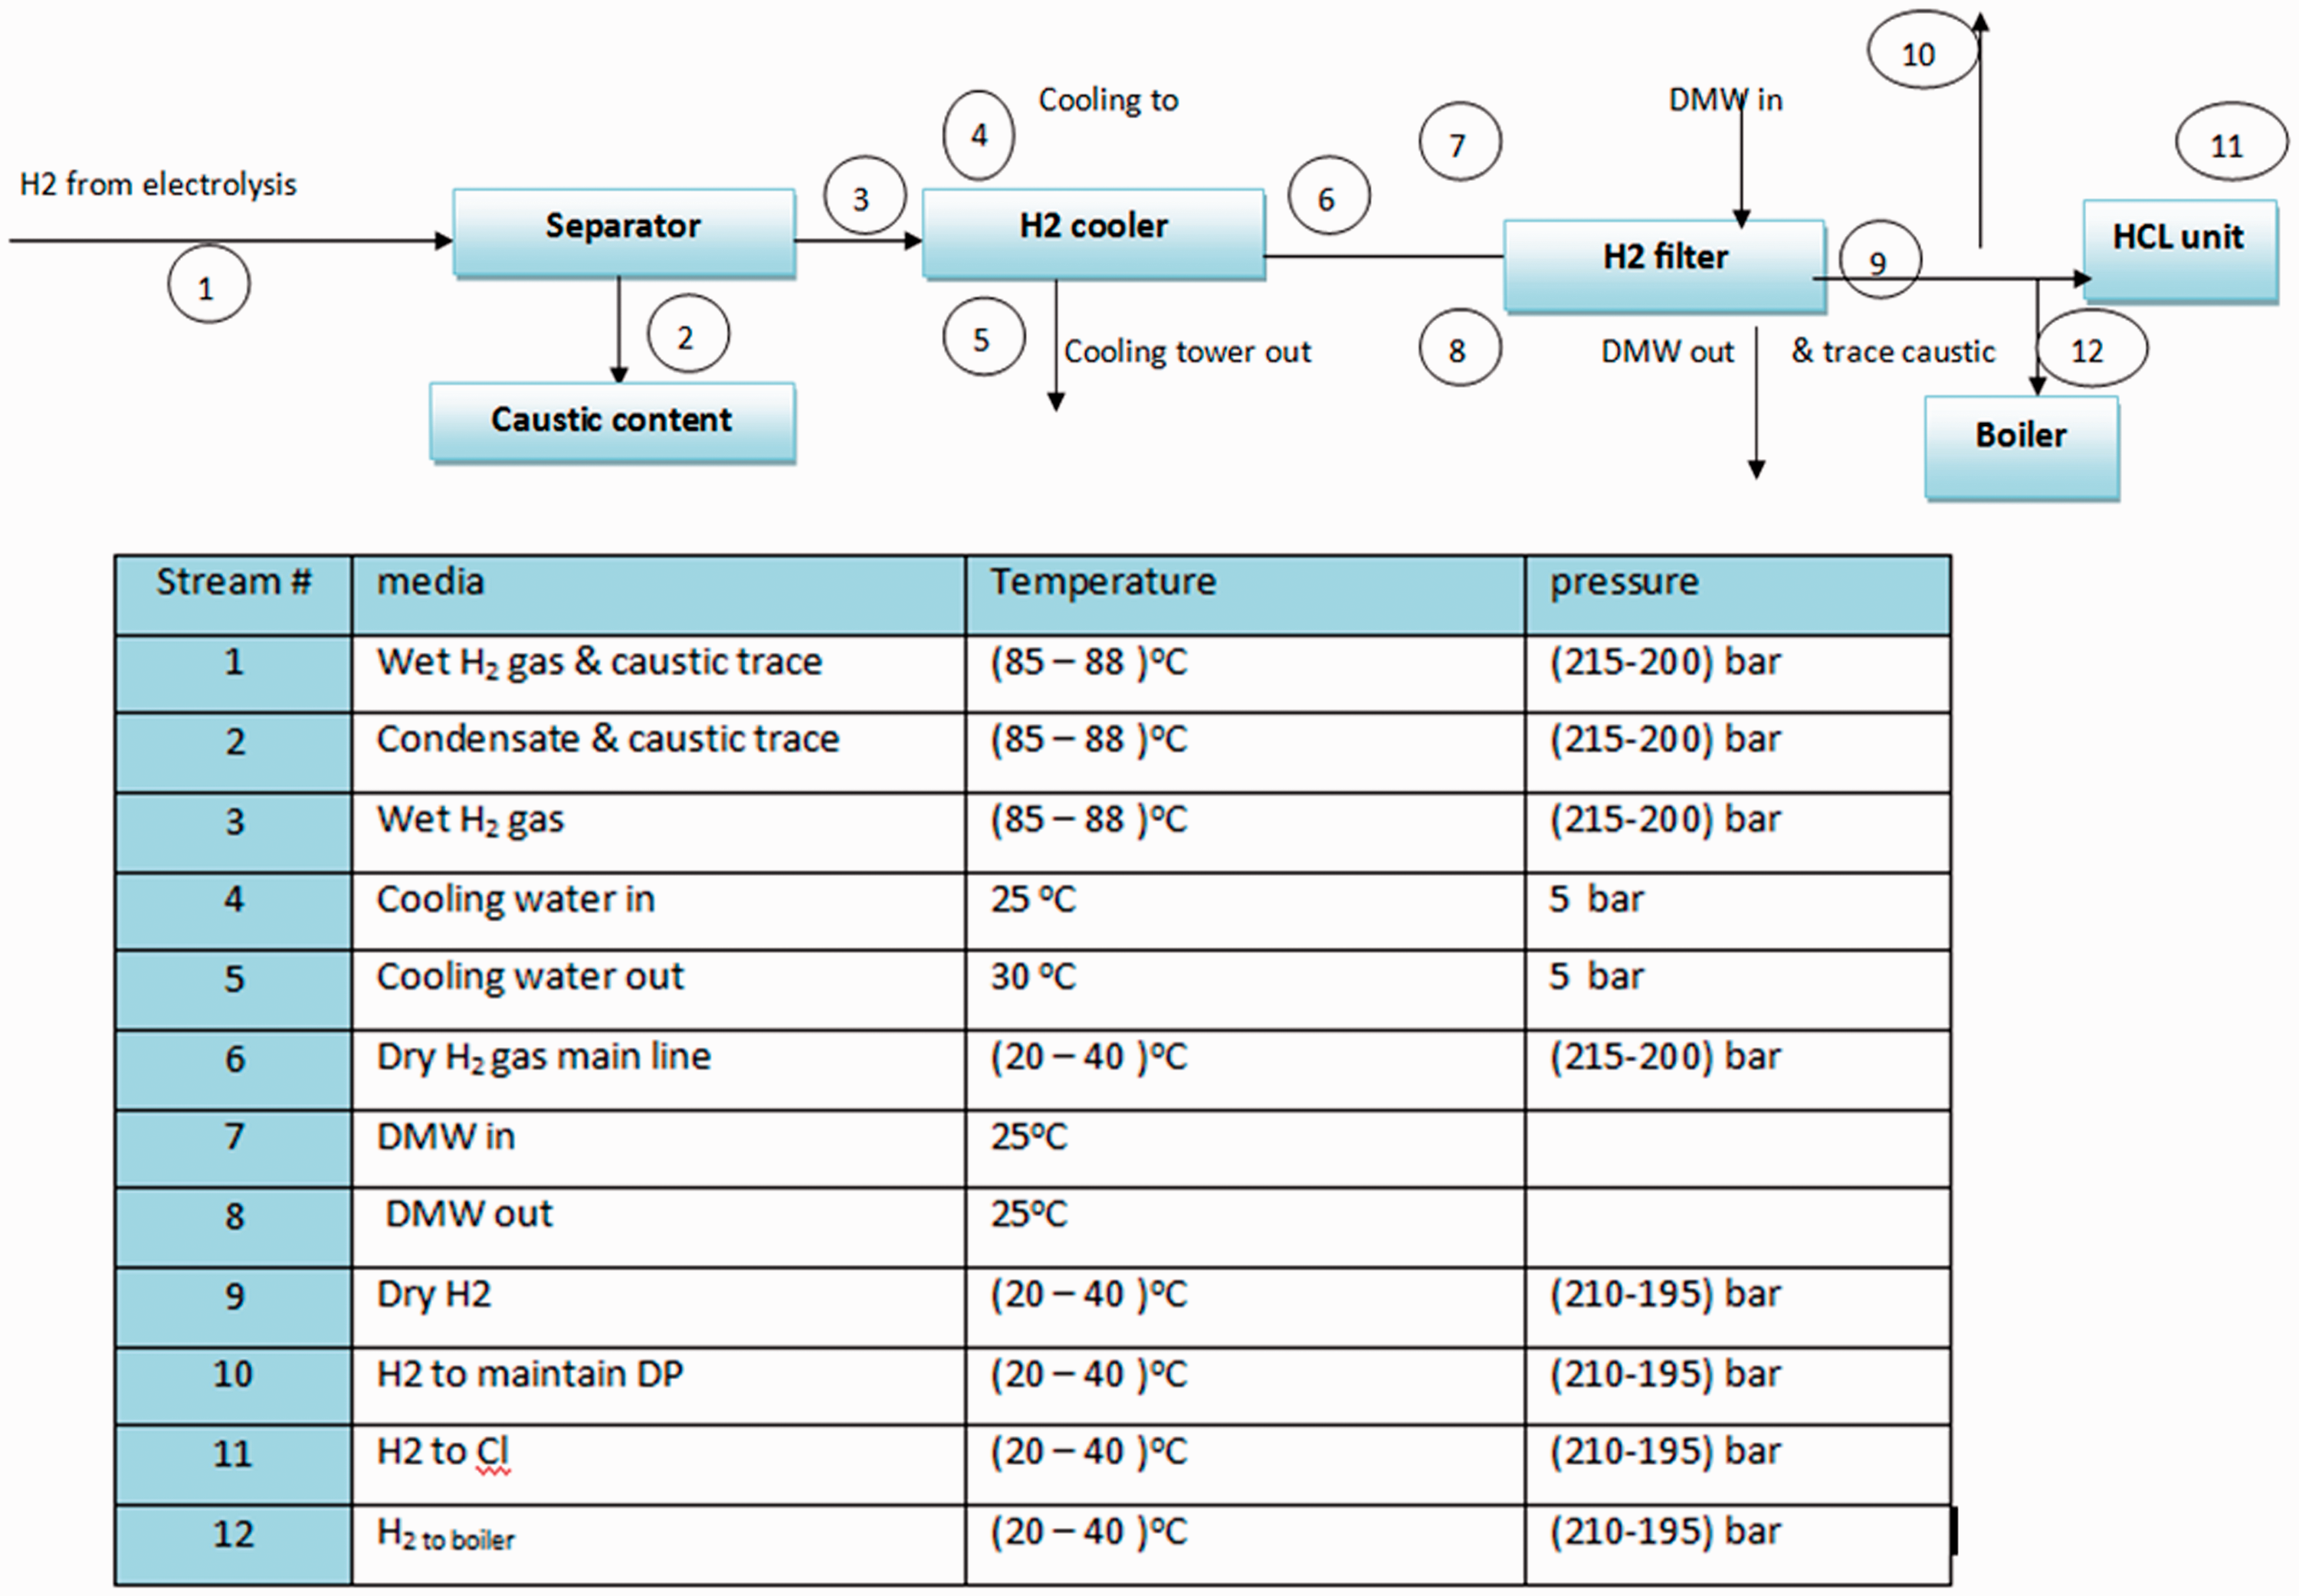
As mentioned earlier, hydrogen (H2) is a by-product of the electrolysis of brine (28 kg of H2 for each ton of chlorine produced), hydrogen leaving the cells is highly concentrated (>99.9% by volume). After it is produced, it must pass through many operations to be utilized; these operations are shown in Figure 3.
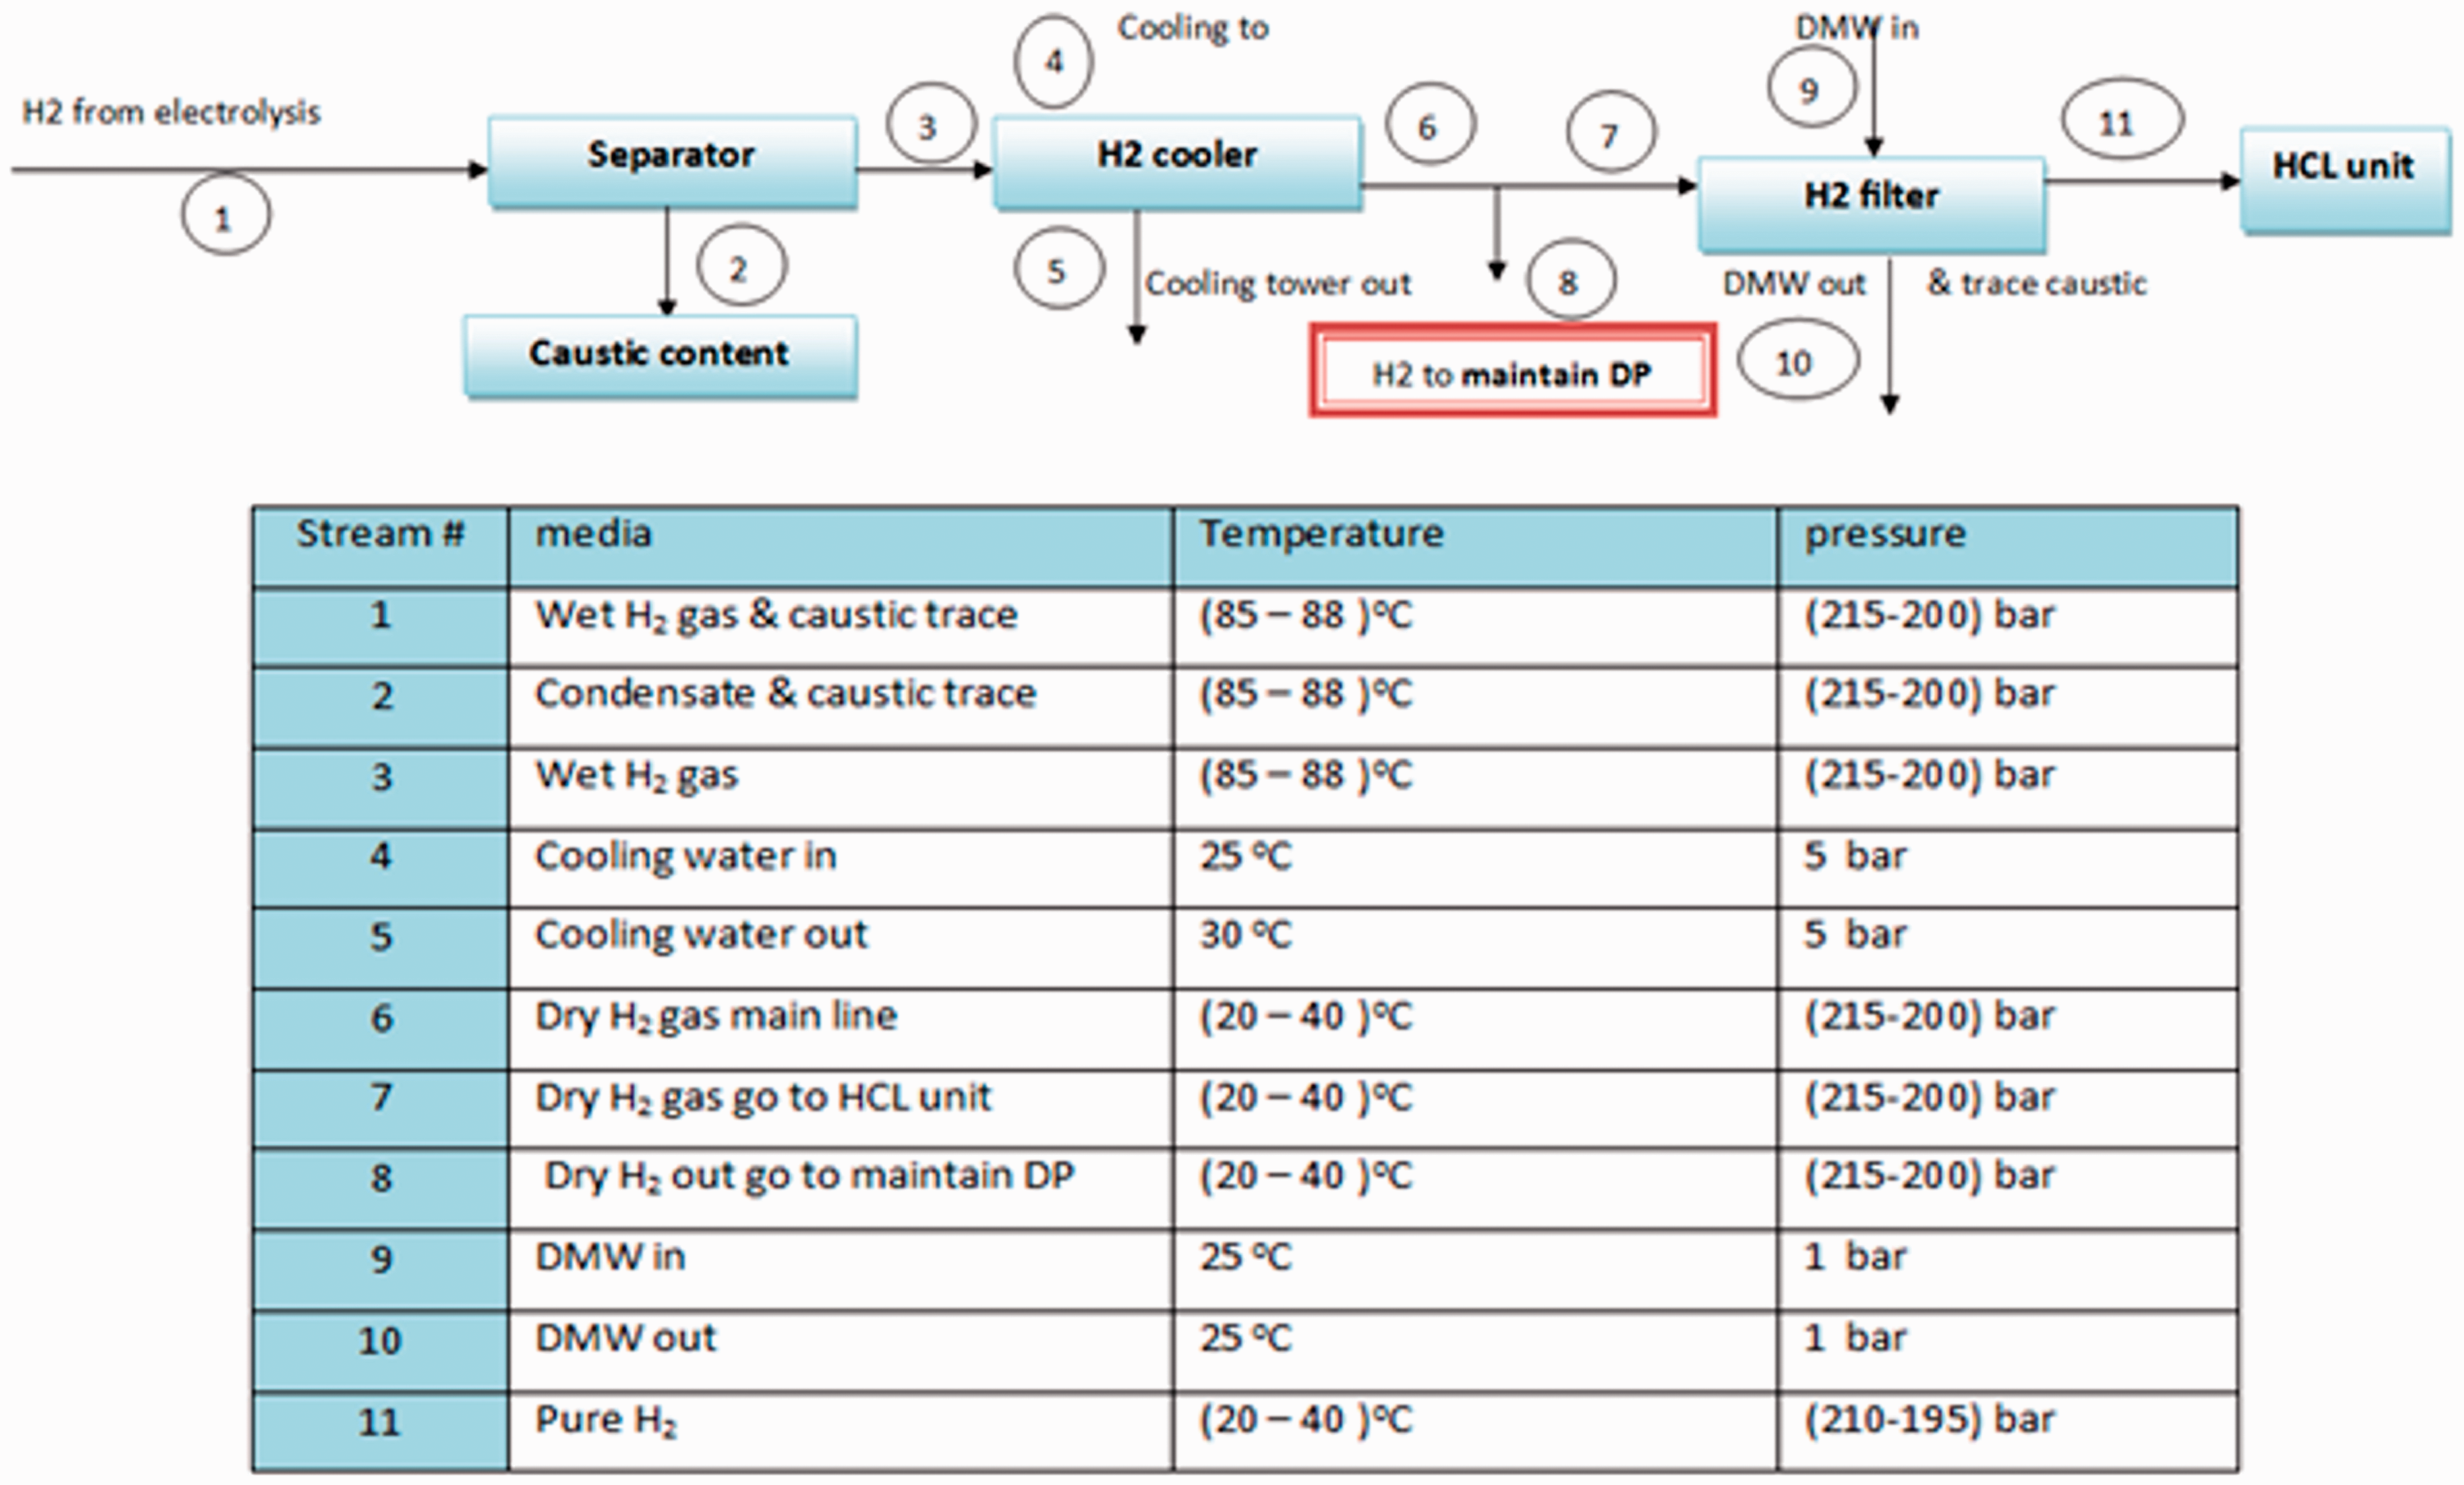
Hydrogen line in the baseline process.
Stage 1: Separator
The hydrogen gas produced by the electrolysis cell is a wet gas with caustic soda traces, at a temperature ranging between 85°C and 88°C, and a pressure ranging between 215 and 200 bar. The hydrogen is sent directly into the separator which separates the liquid and gas hydrogen mixture using graphite; hydrogen in this process enters and leaves the separator at the same temperature and pressure.
Stage 2: Hydrogen cooler
After leaving the separator at 85–88°C and pressure at 215–200 bar, the wet hydrogen passes through hydrogen cooler which converts hydrogen to a gaseous state and its temperature is decreased to ambient levels. Figure 4(a) shows the hydrogen cooler used in the industrial facility in the present study.
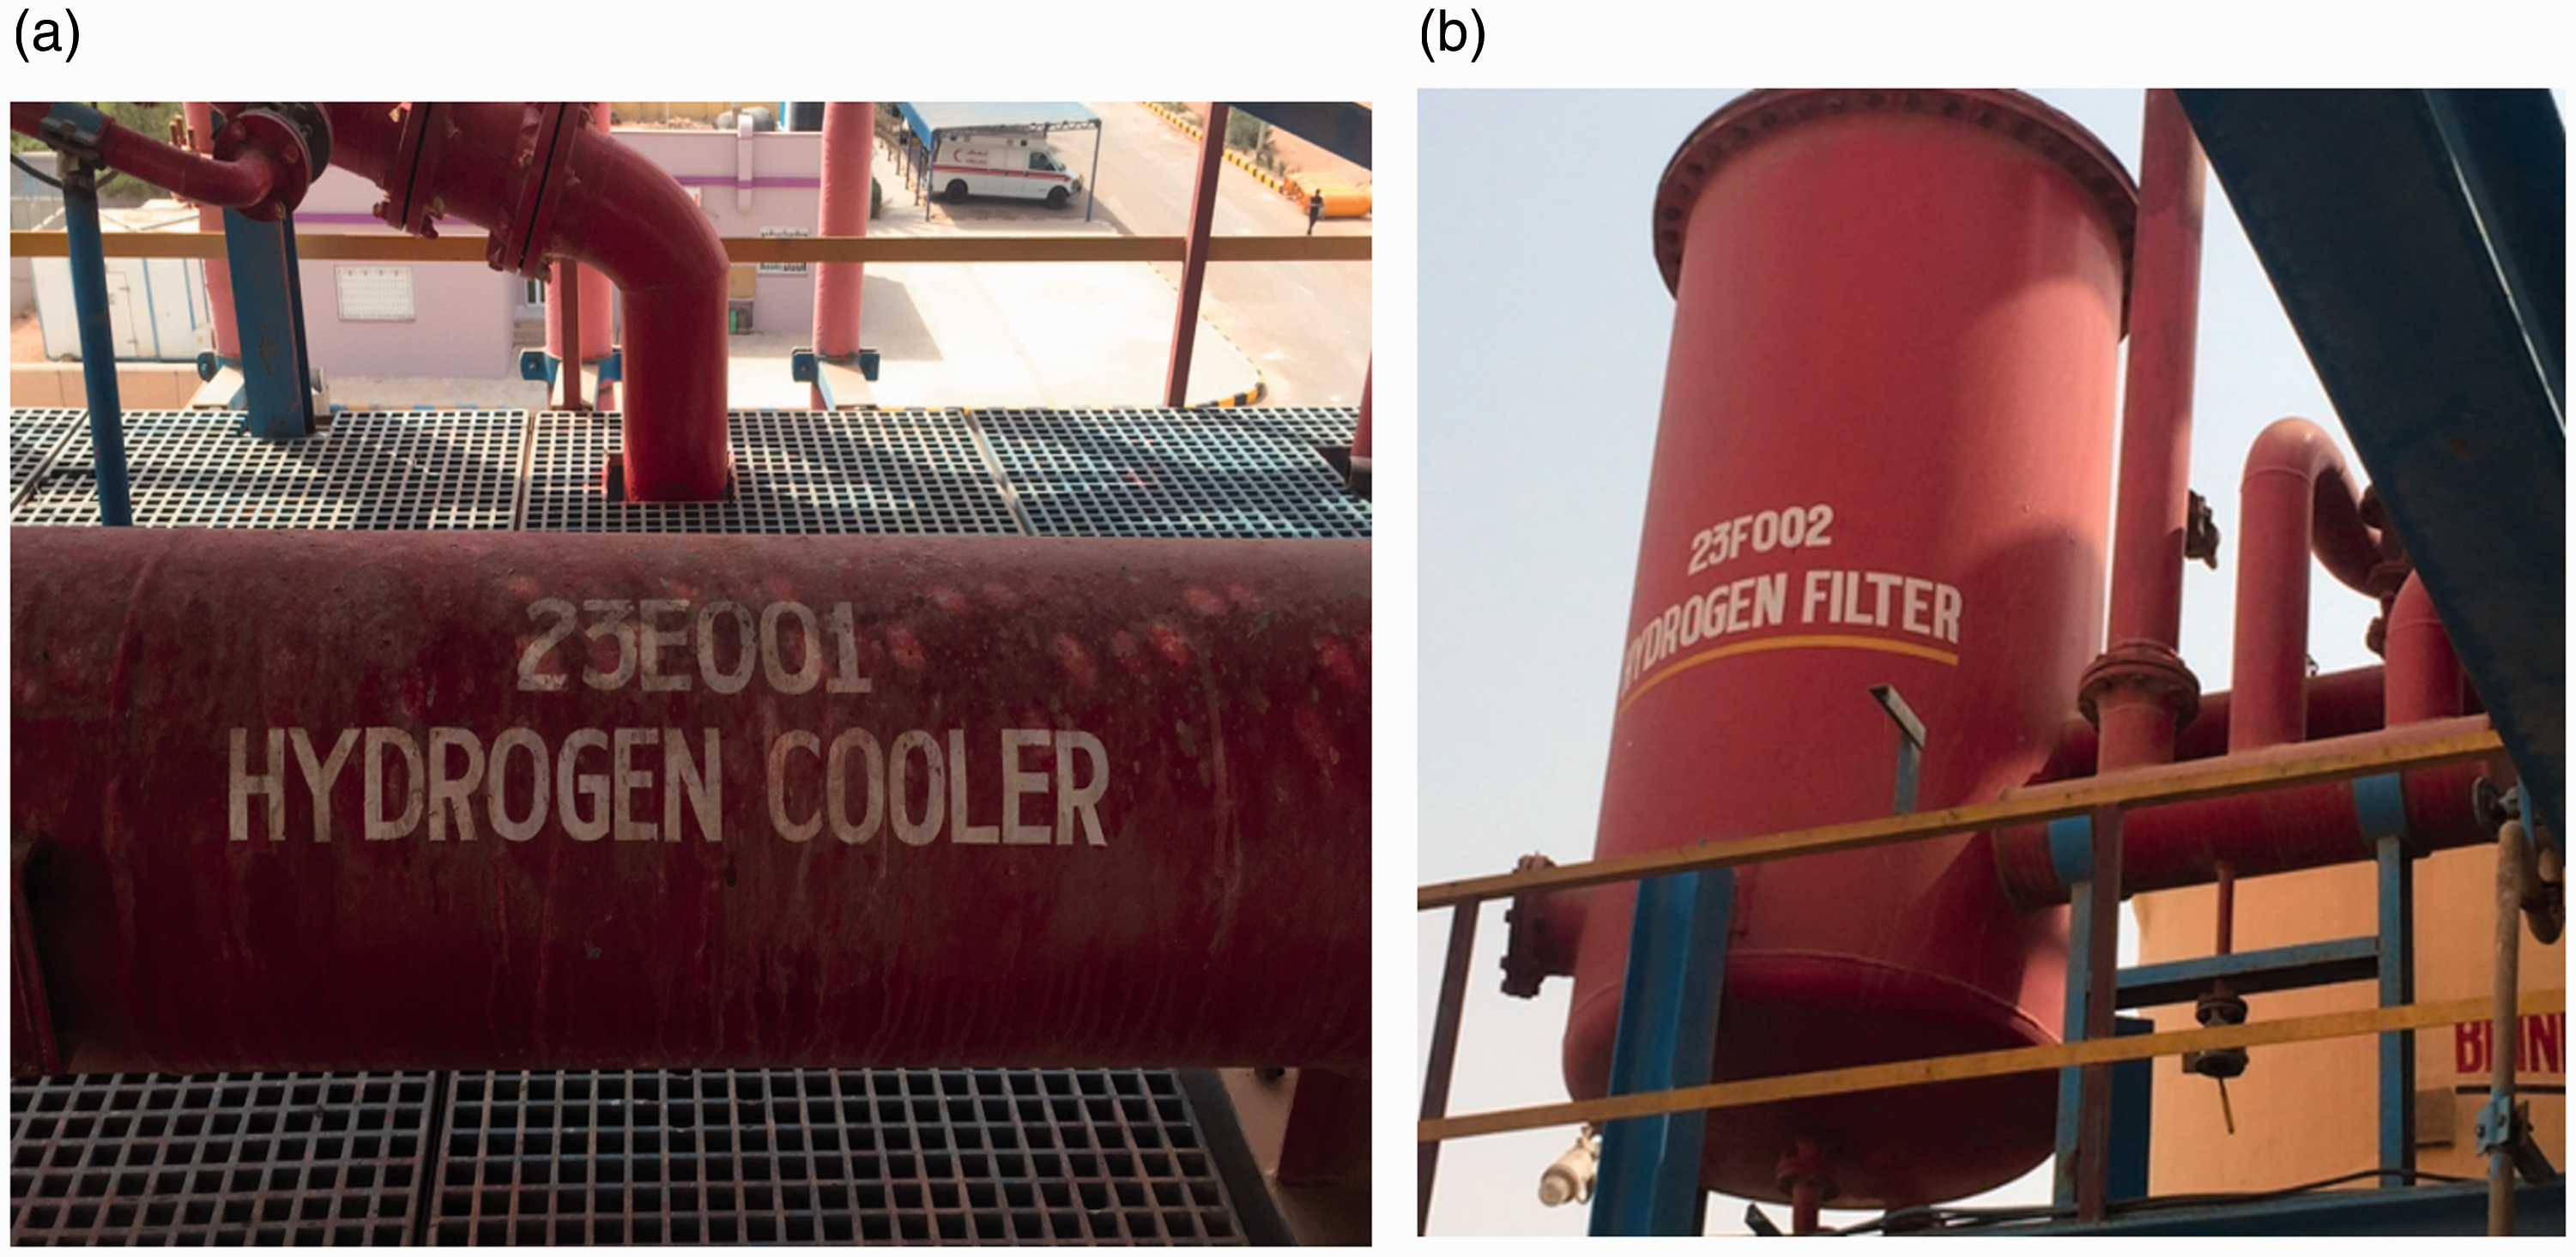
(a) Hydrogen cooler and (b) hydrogen filter in the chlor-alkali factory.
Stage 3: Hydrogen filter
The dry cool hydrogen is sent to a filter—after venting part of it to maintain the pressure difference in the process at a certain value where demineralized water is used to remove further traces of caustic soda and enters the HCl unit with temperature of 20–40°C, and pressure of 210–195 bar. The remaining hydrogen is vented to the atmosphere as it is of no use. Figure 4(b) shows the hydrogen filter used in industrial facility in the present study.
Stage 4: Hydrochloride (HCl) unit
Usually, after filtering the hydrogen, it is immediately directed to HCl unit where around half of it (around 47%) is used to produce HCl, and the rest is vented to the atmosphere as it is of no use. Total of 1750 kgH2/day is produced in the electrolysis membrane as a by-product of chlorine production. This amount of hydrogen usually used in HCl production is passed into the HCl production unit along with chlorine to produce HCl as implied by the unit’s name; about 10% of the produced dry hydrogen is vented to the atmosphere to maintain differential pressure (DP) between the cathode and anode of the electrolysis cell, and the rest is diluted in air and vented out to the atmosphere to avoid explosion risk.
It has been recorded that the maximum production capacity of HCl per day is 30 tons and HCl unit requires 821.9 kg of H2 per day which is approximately 47% of the total amount of produced hydrogen. Also, a maximum 10% of the total amount of the produced hydrogen is vented out to control pressure which is about 175 kg of H2 per day. The remaining 43% excess hydrogen is flared in the air after mixing with steam to prevent explosions. The relationship between the production capacity and the production of NaOH, Cl2, and H2 is shown in Figure 5 which shows a direct proportional relationship. Figure 6 exhibits the paths by which hydrogen is directed and their percentages, showing that the 43% which is vented into the air in the baseline scenario.
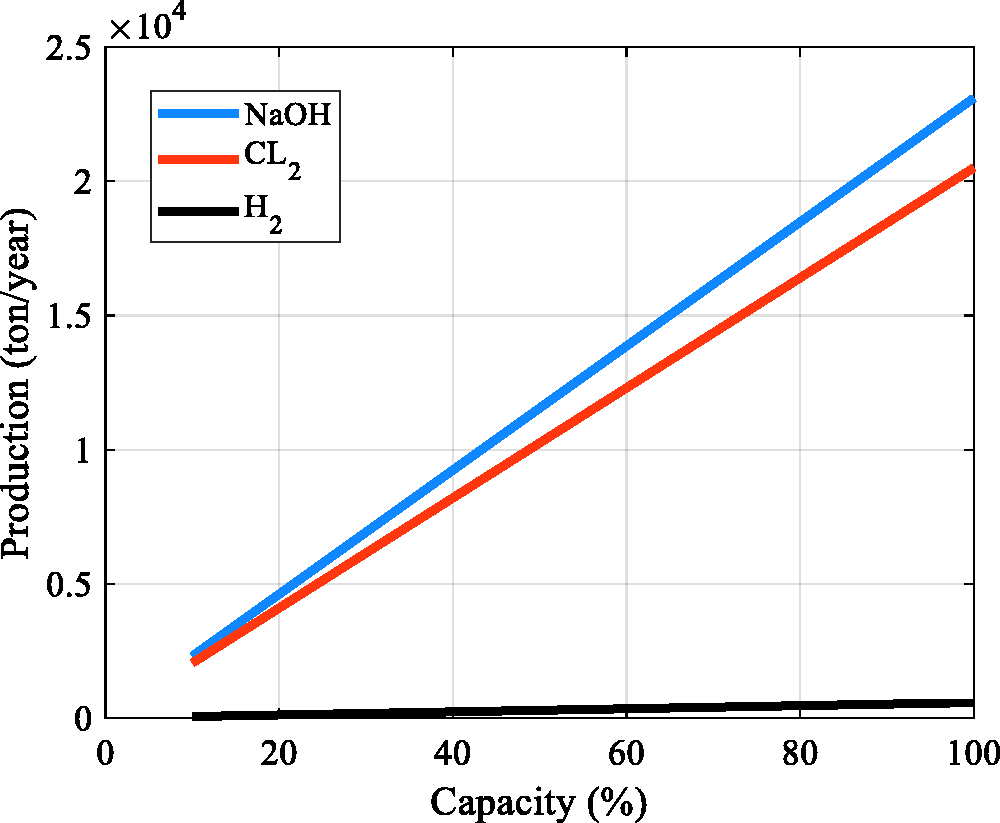
Production of NaOH, Cl2, and H2 under different operation capacities in (ton/year).
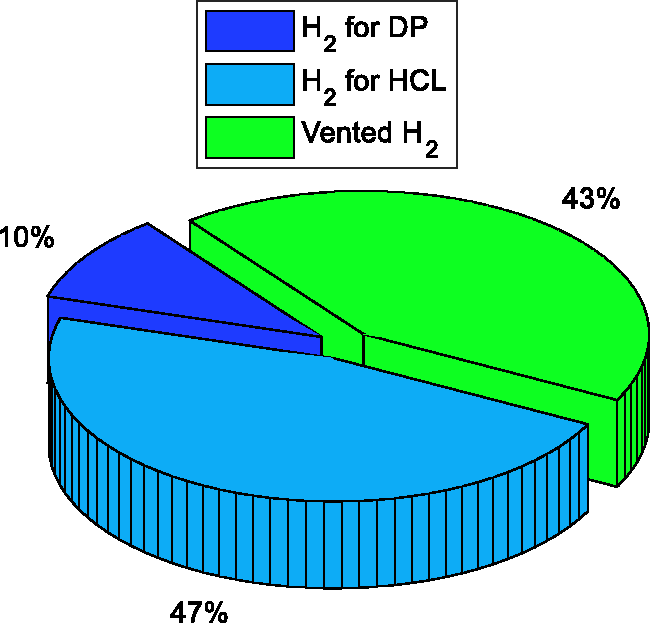
Pie chart of hydrogen paths.
The hydrogen utilization scenario
Physical changes to the system
Instead of flaring the excess hydrogen of the process in the air, it could be of great value as it can serve as an energy source of high importance to decrease reliance on the conventional fuel that is required to produce steam and therefore has a significant impact on fuel expenditure in the factory.
The process of venting out excess unused hydrogen into the atmosphere continued until the end of 2011 when the process was modified to utilize the excess unused hydrogen by adding a hydrogen boiler.
Addition of boiler into the system changed the old path of hydrogen to a new one, where the hydrogen after the filtering stage is not only used to maintain the DP in the process and producing HCl process, but also to generate steam inside a specific boiler. Figure 7 indicates the new utilization process of the hydrogen while Figure 8 shows the boiler used in industrial facility in the present study.
The new process after reusing the hydrogen.
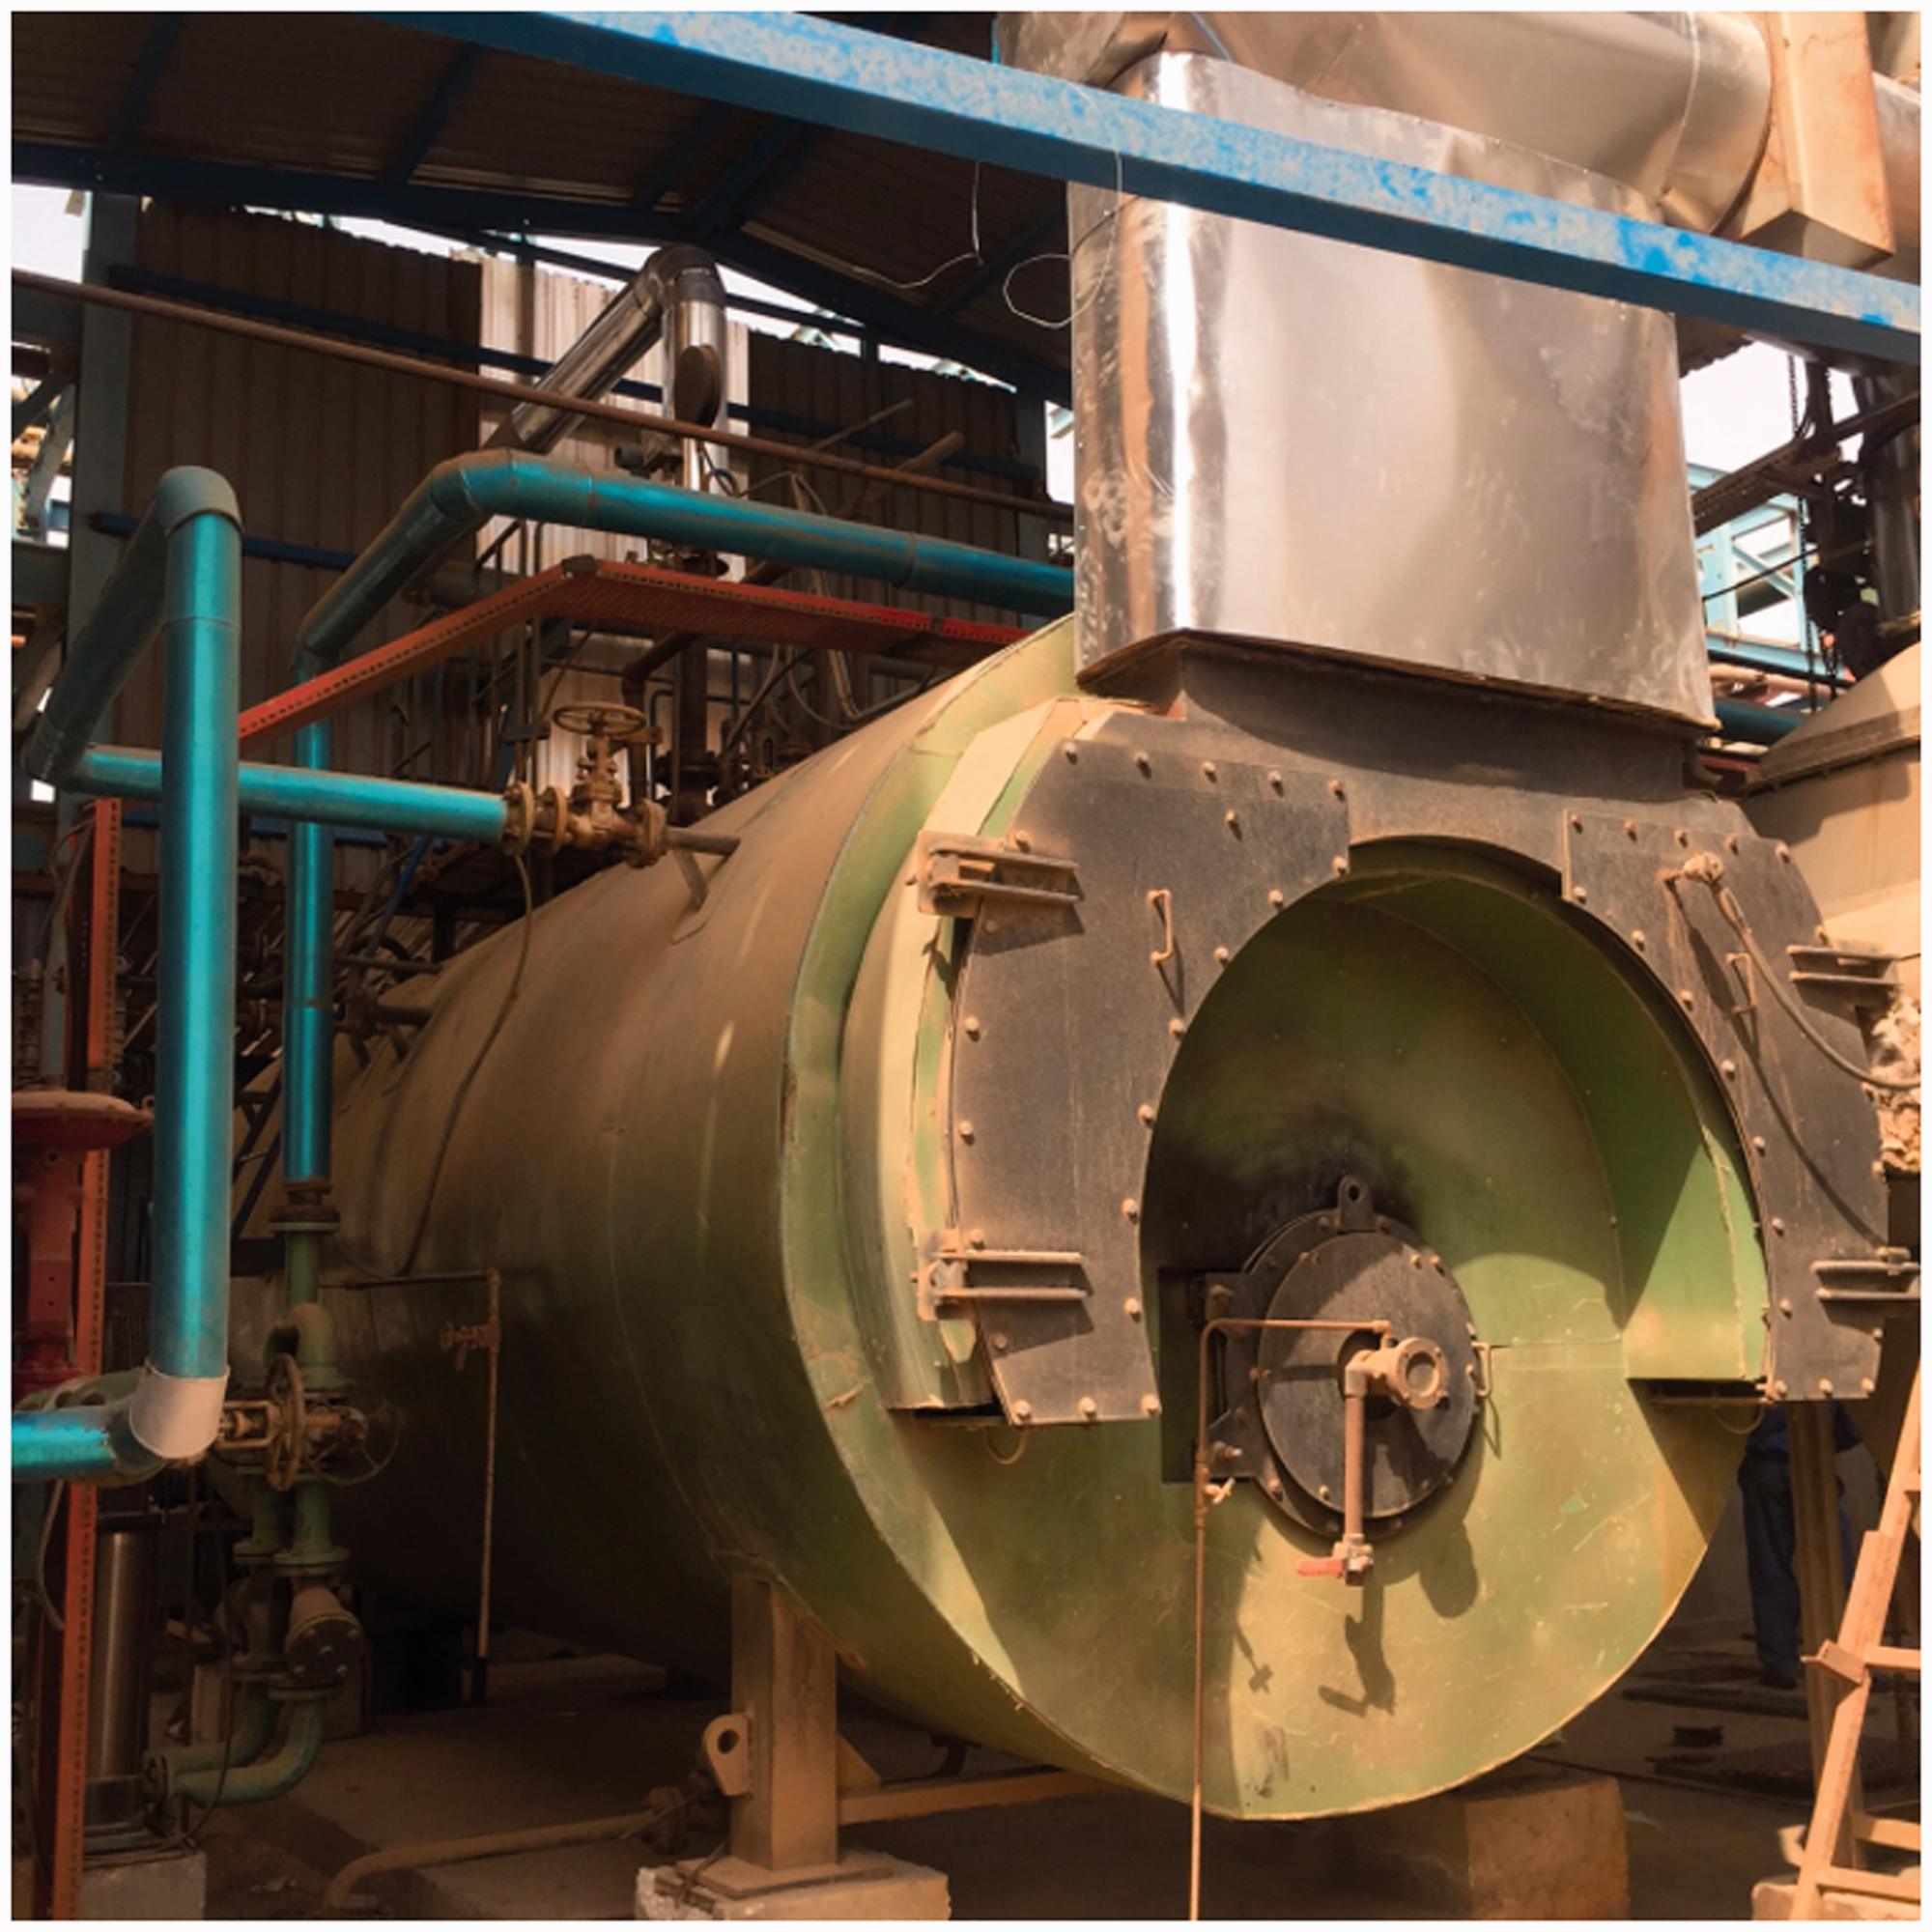
Combined boiler used in the chlor-alkali factory.
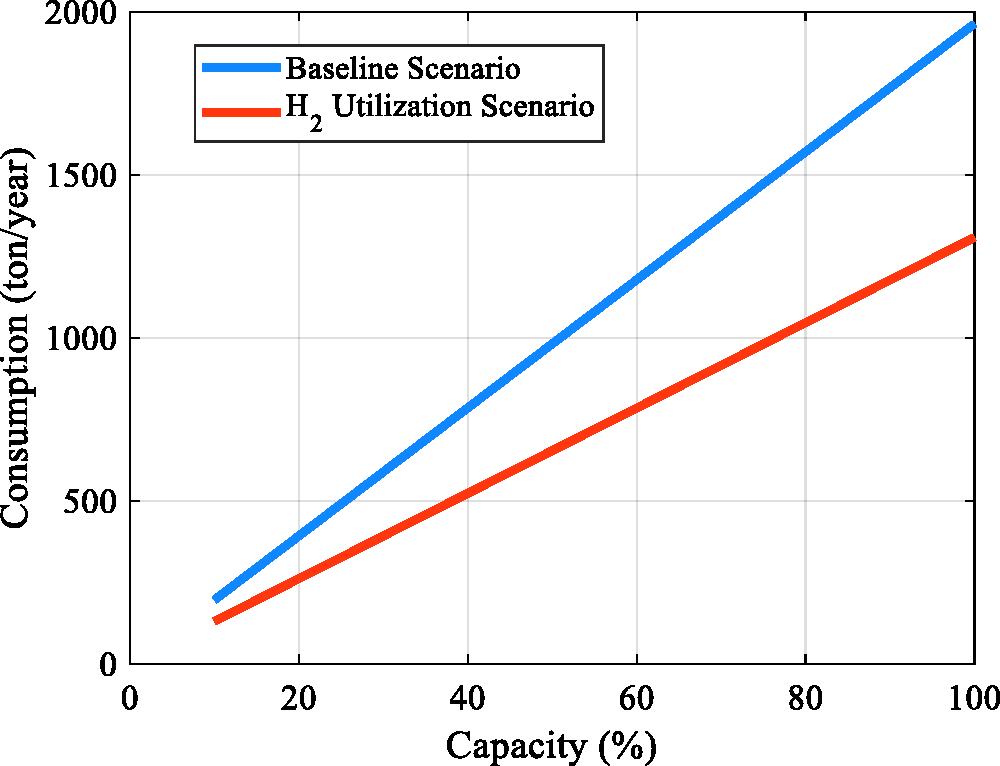
The steam generated by the hydrogen boiler is used in the heating process of brine solution, caustic solution, concentration units, flaking unit, etc. In the last few years, industrial facility in the present study is used to generate steam solely through the fuel-oil boiler. At maximum production capacity, 24,800 tons of steam per year were required, which is converted into 1964 tons of fuel per year and an average cost of USD 1,364,800 per year.
The presence of hydrogen as a by-product of a significant amount wasted was the inspiration to use the excess hydrogen as an alternative fuel since it is a clean fuel and has zero additional cost in the process.
Stoichiometric calculations
Based on the data shown in Table 1, stoichiometric calculations have been made as a quantitative analysis to investigate the amount of hydrogen gas produced.
The chlor-alkali factory capacities.
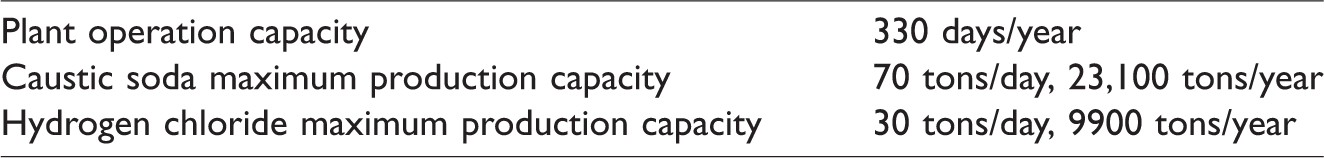
There are two formulas to be considered in this study: the electrolysis equation of brine


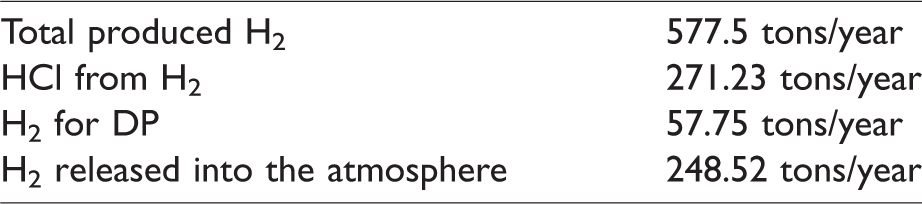
The production of Cl2 is calculated based on the stoichiometric equation (5) and found to be 62,125 kg/day based on 70,000 kg/day production of NaOH in the selected chlor-alkali industrial process. Moreover, 1750 kg/day of H2 is produced and determined accordingly (equation (5)), however, hydrogen consumption to produce 30,000 kg/day of HCl can be calculated by equation (6) and determined to be 821.9 kg/day. The amount of hydrogen released to maintain pressure between cathode and anode in electrolyzer is 175 kg/day which is approximately 10% of the daily H2 production. Finally, 753.1 kg H2/day is the daily released hydrogen which is determined by the following equation (7)

The annual usage and discharge of hydrogen are calculated and tabulated in Table 2.
Annual usage and discharge of H2.
Steam production.
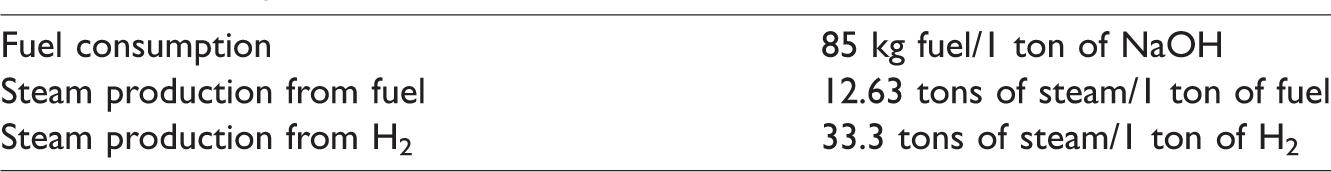
Steam production calculations
The amount of annual fuel consumption is 1963.5 ton based on 330 days of operation per year. This is calculated based on the data gathered from the selected industrial chlor-alkali process and based on the analysis where 1 ton of NaOH production consumes 0.085 ton fuel. The total amount of NaOH in the process is 70 tons/day.
Moreover, 24,799 tons of steam are produced from fuel boiler annually. This is estimated based on the operational indicator that 12.63 tons of steam are produced by 1 ton of fuel combustion in boiler system as gathered from the selected chlor-alkali industrial process team. Table 3 shows the operational indicators related to steam production whether using fuel or hydrogen.
However, the annual amount of steam production hydrogen combustion in hydrogen boiler system is 8275.7 tons, which can replace 33.3% of the required steam in the chlor-alkali process. This is estimated based on the indicator that each ton of hydrogen combustion can generate 33.3 tons of steam. In this context, the remaining steam (67.7%) needed in the process can be generated from the fuel.
Financial calculations
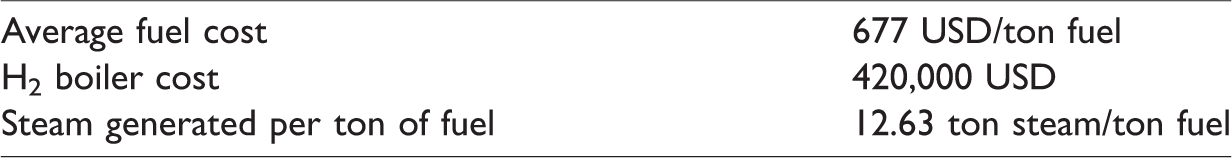
In terms of cost and financial evaluations of the proposed solution, the fuel cost per year in the baseline scenario (when no hydrogen was used) is USD 1,329,290 approximately, which is calculated according to equation (8)

However, 1308 tons of fuel is the annual amount of fuel still needed when the hydrogen is used to generate steam. Consequently, the annual cost of fuel consumption for this proposed scenario is USD 885,682 based on equation (8). Accordingly, an annual savings of USD 443,605 can be achieved. This yields a saving percentage of around 33.37% based on equation (9); and a payback period of 0.947 year (based on equation (10)) and the cost of hydrogen boiler is as given in Table 4.


Cost of fuel and steam tonnage data.
Results and discussions
Quantitative indicators
The first key piece of information is the amount in ton per year for the hydrogen available from combustion as a function of the capacity. This is shown in Figure 9, and it is clear that up to 250 tons per year of H2 is available for combustion at the factory.
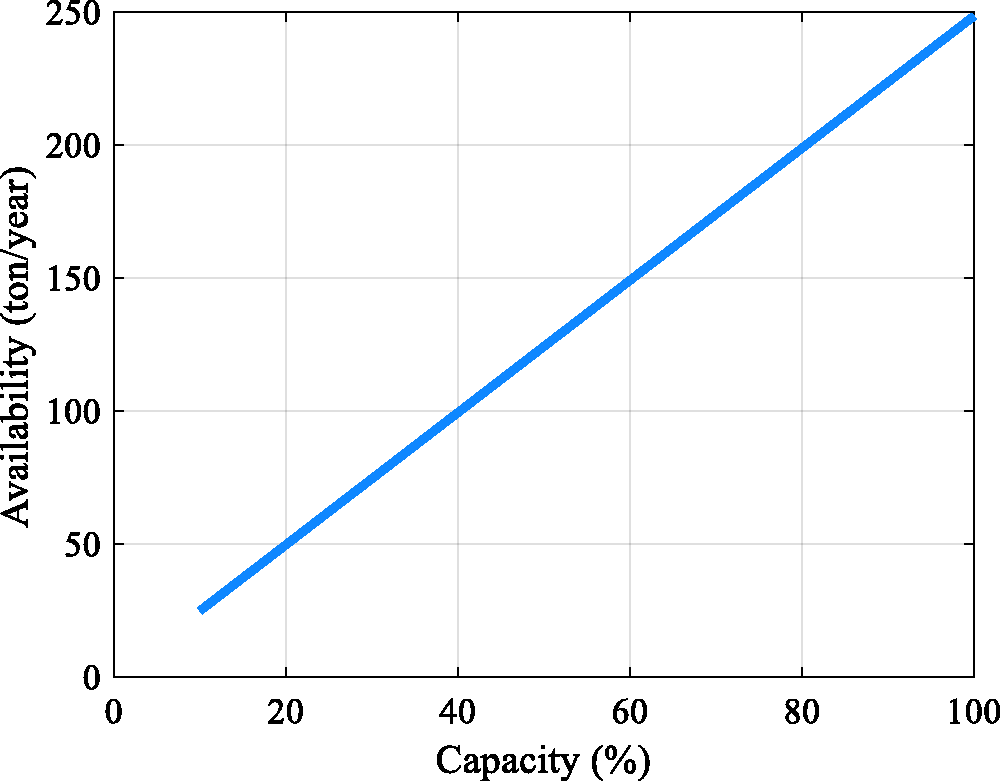
The amount of hydrogen available for combustion (ton/year).
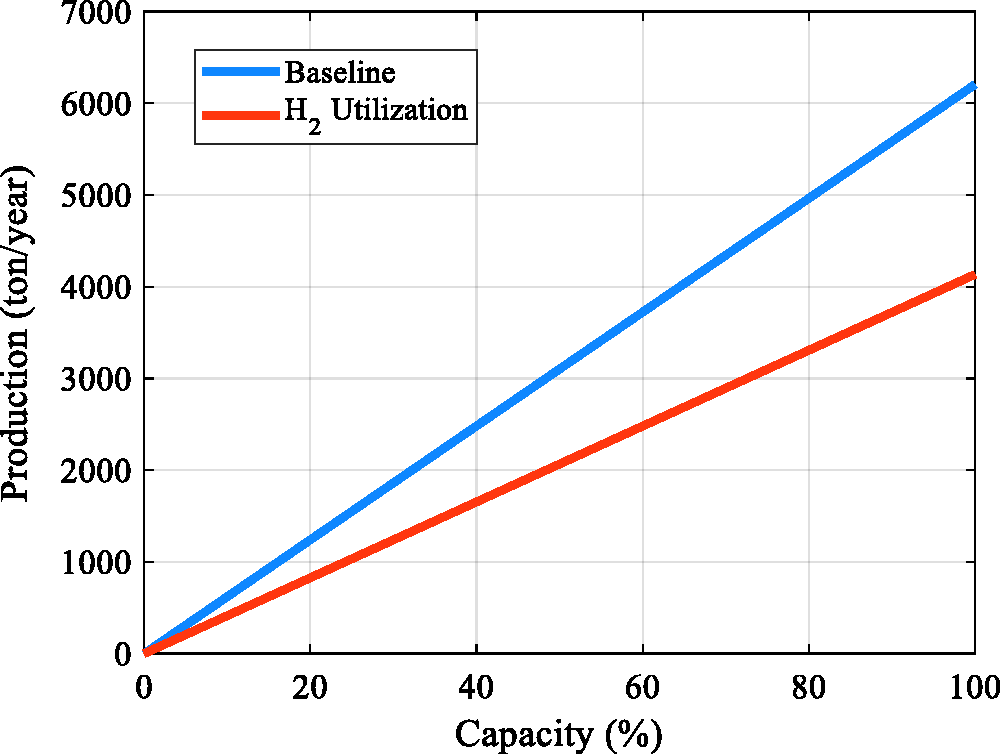
As mentioned earlier, the utilization of H2 reduces the dependency on fossil fuel to generate steam. Figure 10 exhibits both hydrogen and fossil fuel shares in the steam generation at full production capacity. Total steam needed at the full capacity is about 2480 ton per year; hydrogen can account for generating 34% of it and the rest is generated by fuel.
Hydrogen and fossil fuel shares in a steam generation at different capacities.
Financial indicators
In terms of cost, utilizing the hydrogen as another source of energy in the factory helped to significantly reduce the total fuel bill. The savings could reach USD 220,000 if the factory operates at half its capacity and it can reach USD 450,000 when the capacity reaches 100%.
Another important financial indicator is the payback period which can be determined by assuming a cost of USD 420,000 for a hydrogen boiler (as stated in Table 4); this yields that the savings can be translated into a payback period in which the cost of the boiler can be fully recovered. At full capacity, the payback period can be as little as one year. Figures 11 and 12 show the fossil fuel expenditure of baseline versus hydrogen utilization scenarios, and how the payback period decreases with the increase in production capacity.
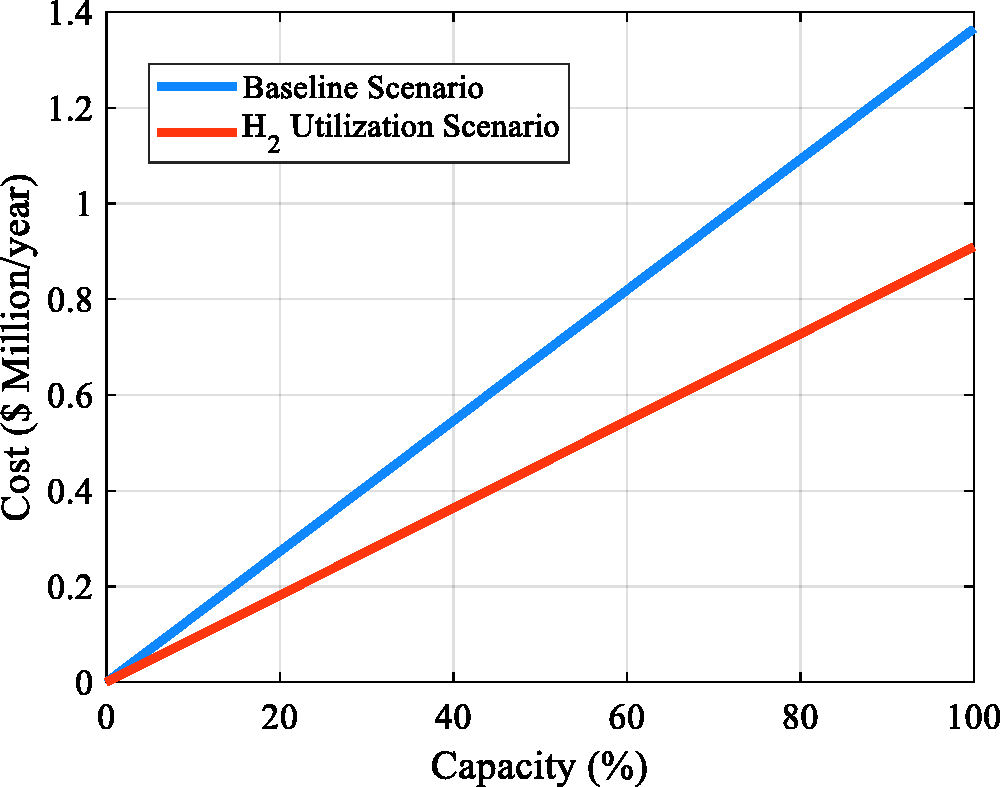
The fossil fuel expenditure of baseline vs. hydrogen utilization scenarios.
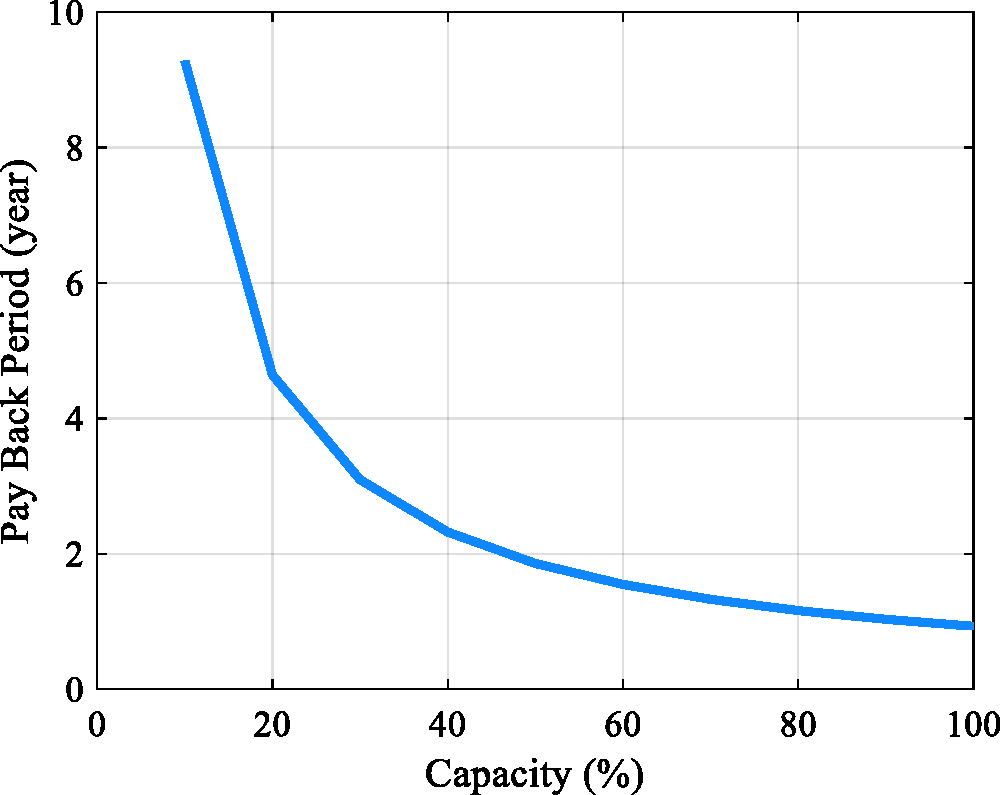
The payback period at different production capacities.
Environmental indicators
Although carbon dioxide is considered vital to life, excessive amounts of this gas released into the atmosphere contribute significantly to the buildup of greenhouse gases which is a major cause of global warming. During the combustion of hydrogen and unlike conventional fuel, no carbon dioxide is released and that is why hydrogen is considered as a clean fuel. The utilization of hydrogen gas in steam production reduces CO2 emissions significantly. Figure 13 exhibits emission quantities in both baseline and hydrogen utilization situations under different production capacities as calculated from equation (11) based on the emission factor for diesel which is 3.16 kg CO2/kg

CO2 emissions of baseline and hydrogen utilization scenarios.
Analysis of actual data
Calculations have been made with regard to actual data of caustic soda, chlorine, and hydrogen production as well as fuel consumption during both 2011 and 2012, the availability of this data is of great significance as it provides us with a baseline scenario, however, theoretical calculations had to be made to obtain information on hydrogen utilization scenario, as data after the installation of the hydrogen boiler in 2014 was hard to obtain. Figures 14, 15, and 16 are plots of caustic soda, chlorine, and hydrogen quantities produced during 2011 and 2012. The capacities varied from month to month.
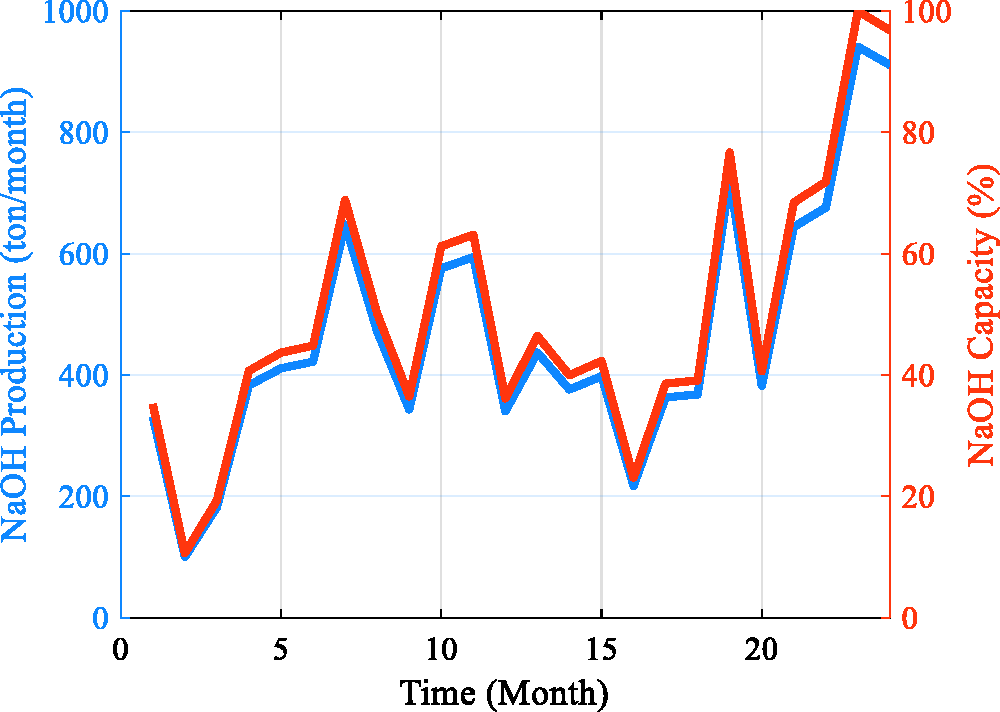
Caustic soda production and capacity for 2011 and 2012 (24 consecutive months).
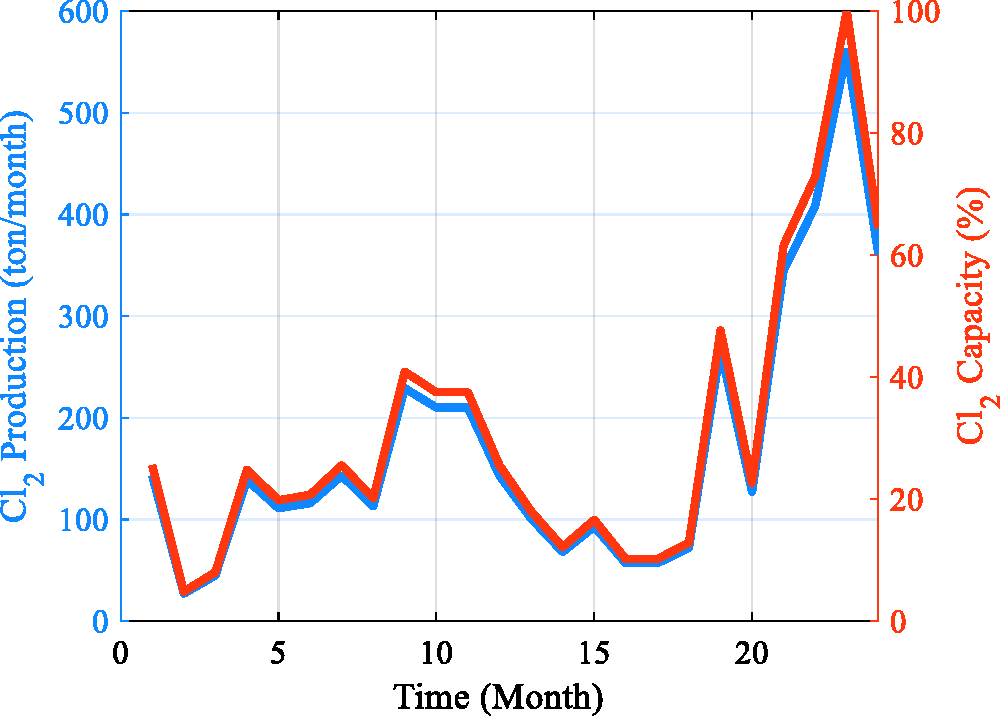
Chlorine production and capacity for 2011 and 2012 (24 consecutive months).
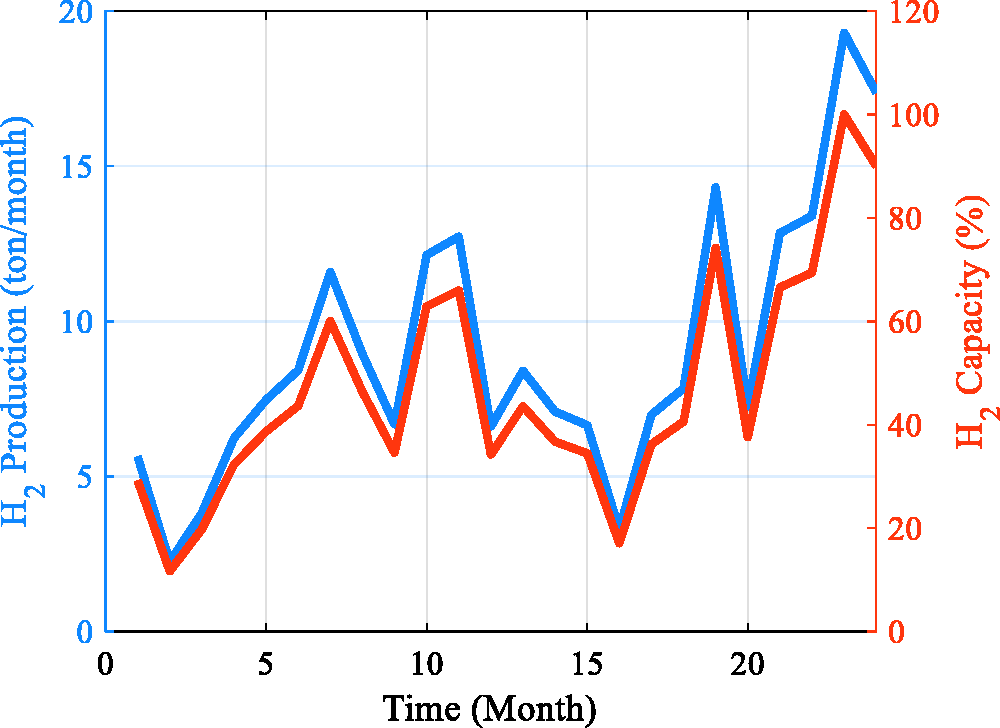
Hydrogen production and capacity for 2011 and 2012 (24 consecutive months).
In terms of finances, hydrogen utilization could have achieved major savings if a boiler was installed in 2011, Figure 17 shows the expenditure on fuel in both baseline and hydrogen utilization scenarios. Savings of about USD 450,000 could have been achieved.
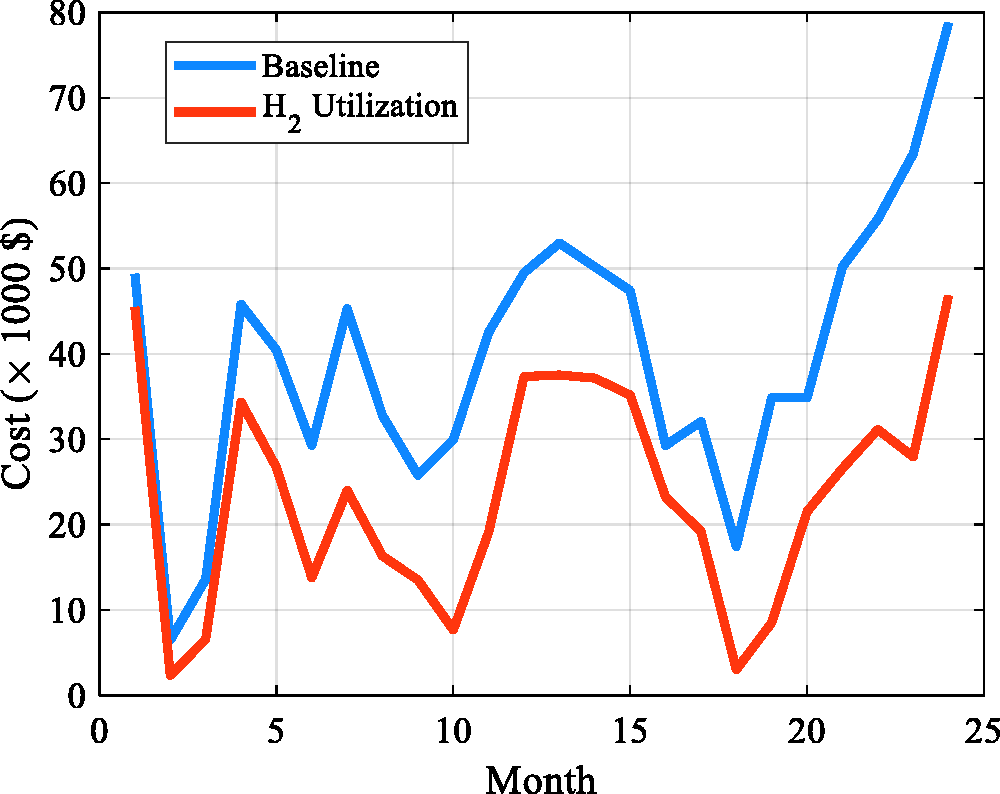
Actual baseline fuel expenditure (measured) vs. theoretically estimated fuel expenditure after H2 utilization (calculated) for 2011 and 2012 (24 consecutive months).
The carbon dioxide emission reduction that could have been achieved is represented in Figure 18, which indicates the baseline CO2 emission versus the theoretical values of CO2 emitted after hydrogen boiler is utilized. Major reductions up to 1810 tons of CO2 could have been achieved during these two years.
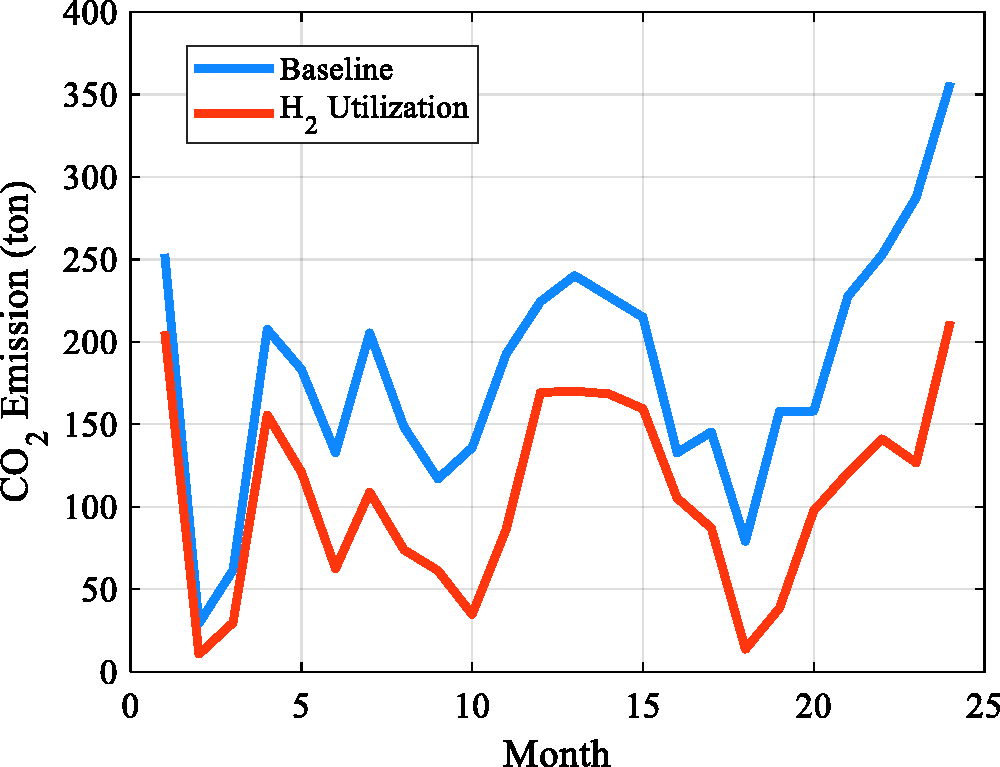
Actual baseline CO2 emissions (measured) vs. theoretically estimated emissions after H2 utilization calculated) for 2011 and 2012 (24 consecutive months).
Conclusions
In particular, this study shows that hydrogen produced as a by-product from chlor-alkali plant in Jordan can achieve major savings on fuel usage and expenditure, as well as, major reductions of CO2 emissions by only using excess hydrogen from the process. A chlor-alkali industry which produces chlorine, caustic soda, and hydrogen chloride was considered in the present study. In the baseline scenario, the chlor-alkali process requires 24,799 tons of steam per year, which was provided by diesel fuel only, at an average cost of USD 1,330,000/year. One of the by-products of caustic soda production is hydrogen gas; a 47% was used in HCl production, and 10% in controlling pressure difference, and the remaining hydrogen was vented into the atmosphere. This study demonstrates that to improve the economic and environmental performance it is sometimes necessary to make changes to the existing processes or equipment. Hence, a hydrogen boiler was proposed as a viable CP option such as on-site reusing of hydrogen generated can be a feasible option to partially replace fuel and subsequently enhance the environmental performance with payback period of time less than one year when the production is at its full capacity. The company has installed the first hydrogen boiler in the Middle East in 2014. For future studies, it is recommended to investigate the energy efficiency and electricity consumption reduction potential from the main supply by on-site electricity production with the hydrogen co-generated in the electrolytic process for chlor-alkali production, hence avoiding the thermodynamic limitations that are typical of thermal generators and relatively achieving higher net efficiencies.
Footnotes
Declaration of conflicting interests
The author(s) declared no potential conflicts of interest with respect to the research, authorship, and/or publication of this article.
Funding
The author(s) received no financial support for the research, authorship, and/or publication of this article.