
Abstract
Based on tracer tests and the equivalent flow channel model, this study proposes a theoretical modelling framework to back-calculate the unknown parameters of geothermal reservoirs and predict the thermal breakthrough in production wells. The inverse modelling module combines the analytical solution of the tracer transport equation with the method of moving asymptotes, and then an analytical model that considers heat advection and transfer was used to predict the thermal breakthrough in a production well. Based on the results of tracer tests in the double geothermal wells, Xianxian geothermal field, China, two equivalent flow channels were determined, and their average flow velocity, dispersion coefficient, section area, and channel length were estimated using this theoretical framework. The possible thermal breakthrough in the production well and its main influencing factors are also discussed. The theoretical model was applied to the engineering case, and the tracer test data were used to carry out the parameter back analysis and obtain the goodness of fit (R2)=0.7907 > 0.6, indicating that the optimization result strongly correlated with the measured value and the fit was good. The values of the thermal reservoir parameters from the tracer test’s back analysis were used to predict the thermal breakthrough for the geothermal well system. The results indicated that due to the lower tracer recovery rate, the hydraulic connection between the production well and the recharge well was poor. During the 100-year service life of a geothermal well system, the production water temperature will not obviously change, and no thermal breakthrough will occur.
Keywords
Introduction
Deep geothermal resources are a kind of clean and environmentally friendly renewable energy, and geothermal tail water reinjection is the key link for the sustainable exploration and utilization of deep geothermals. At present, theoretical models that can accurately guide the optimal design of geothermal tail water reinjection schemes are not mature, and related work is carried out mostly based on experience. Therefore, long-term tail water reinjection has a higher risk of thermal breakthrough in exploitation wells. Accurately grasping the hydraulic connection between the reinjection well and the exploitation well is the premise of the scientific management of geothermal tail water reinjection. However, due to the limitations of the buried depth and on-site measurements, it is still difficult to directly detect the hydraulic connectivity between geothermal wells. The back analysis of hydrogeological parameters based on tracer tests is an effective method to solve the above problems and has been applied in geothermal field management (Axeleeon, 2005).
Axelsson et al. (2001) conducted three tracer tests in the Laugaland geothermal field in Iceland using potassium iodide and sodium fluorescein. The equivalent seepage channel model was used to analyse the connectivity between the irrigation wells and predict the thermal breakthrough and the mining energy of the exploitation well. Rose et al. (2009) used naphthalene sulphonate to conduct a tracer test in the Desert Peak geothermal field in Nevada, USA. The pore volume of the thermal reservoir was calculated by analysing the tracer test data, and the optimal irrigation well layout was proposed. Yanagisawa et al. (2009) conducted a tracer test in the Cooper-Basin geothermal field in Australia using naphthalene sulphonate and sodium fluorescein and analysed the connectivity between the irrigation wells. Mattson et al. (2011) conducted three tracer tests in the Raft River geothermal field in Idaho using sodium fluorescein and sodium naphthalene sulphonate. The hot water flow law of the fissure thermal reservoir was analysed by contrast. Zeng et al. (2008) used potassium iodide and the radioisotope 35S to conduct a tracer test in the Wang geothermal field in Tianjin. By analysing the peak concentration of the tracer recovery curve, the ‘generalization’ speed of the reinjected fluid was calculated, and the connectivity of the thermal reservoir between the irrigation wells was preliminarily evaluated. Pang et al. (2014) conducted a tracer test in the geothermal field of Xiongan New Area using fluorescein sodium. The multi-seepage channel between the reinjection well and the multi-port exploitation well was analysed, and the channel distance and seepage velocity were inversely analysed. Li (2010) conducted a tracer test in the geothermal field of the Beijing urban area using ammonium molybdate and potassium iodide. Combined with the pumping test data, a Gauss–Seidel iterative formula was constructed for the parameter inversion calculation, and the thermal storage temperature field was simulated. Wang et al. (2013) conducted a tracer test in the geothermal field of Xiongxian County using fluorescein sodium. These investigators calculated the maximum flow rate of the tracer in the channel and the flow direction of geothermal water and analysed the effect of different spaces between pairs of wells on the thermal breakthrough using the horizontal fracture-type medium model. Zhao et al. (2017) used sand molybdate to conduct sandstone thermal storage in the geothermal field of Pingyuan County. These researchers used the equivalent seepage channel model to carry out tracer test inversion and predict the heat breakthrough of the exploitation well and performed a sensitivity analysis on the main factors affecting the thermal breakthrough of the exploitation well.
From the above research, rich experience has been accumulated in geothermal field tracer testing, but research on both the migration law of tracers in thermal reservoir seepage channels and theoretical models to predict the thermal breakthrough of the exploitation wells is not sufficient. Based on the on-site tracer test, this paper proposes a complete theoretical framework for thermal reservoir parameter inversion and the thermal breakthrough prediction of exploitation wells based on a seepage channel model. The analytic solution of the solute concentration in the seepage channel is determined by solute transport theory. Combined with the structural optimization algorithm-moving asymptote method, a thermal storage parameter inversion theory model is proposed. Then, convective heat transfer is applied, and the analytical solution of the temperature change in the seepage channel is deducted, which can predict the temperature change in the geothermal water of an exploitation well. Relying on the geothermal well-to-well system of the Xianxian geothermal field, Hebei Province, China, this theoretical framework is used to conduct a quantitative explanation of data from tracer tests of the geothermal tail water reinjection of deep thermal reservoirs and predict the exploitation well heat breakthrough in the reinjection. Additionally, a sensitivity analysis is also carried out on the main parameters affecting the thermal breakthrough of exploitation wells.
Theoretical model
Seepage channel model
The seepage channel model assumes that there are several dominant seepage channels between the geothermal wells, which dominate the geothermal water seepage in the thermal reservoir (Figure 1). The dominant seepage channel may be part of a nearly vertical fault zone or part of a horizontal rock formation, and the seepage in the dominant flow channel may be approximately equivalent to a one-dimensional Darcy flow.
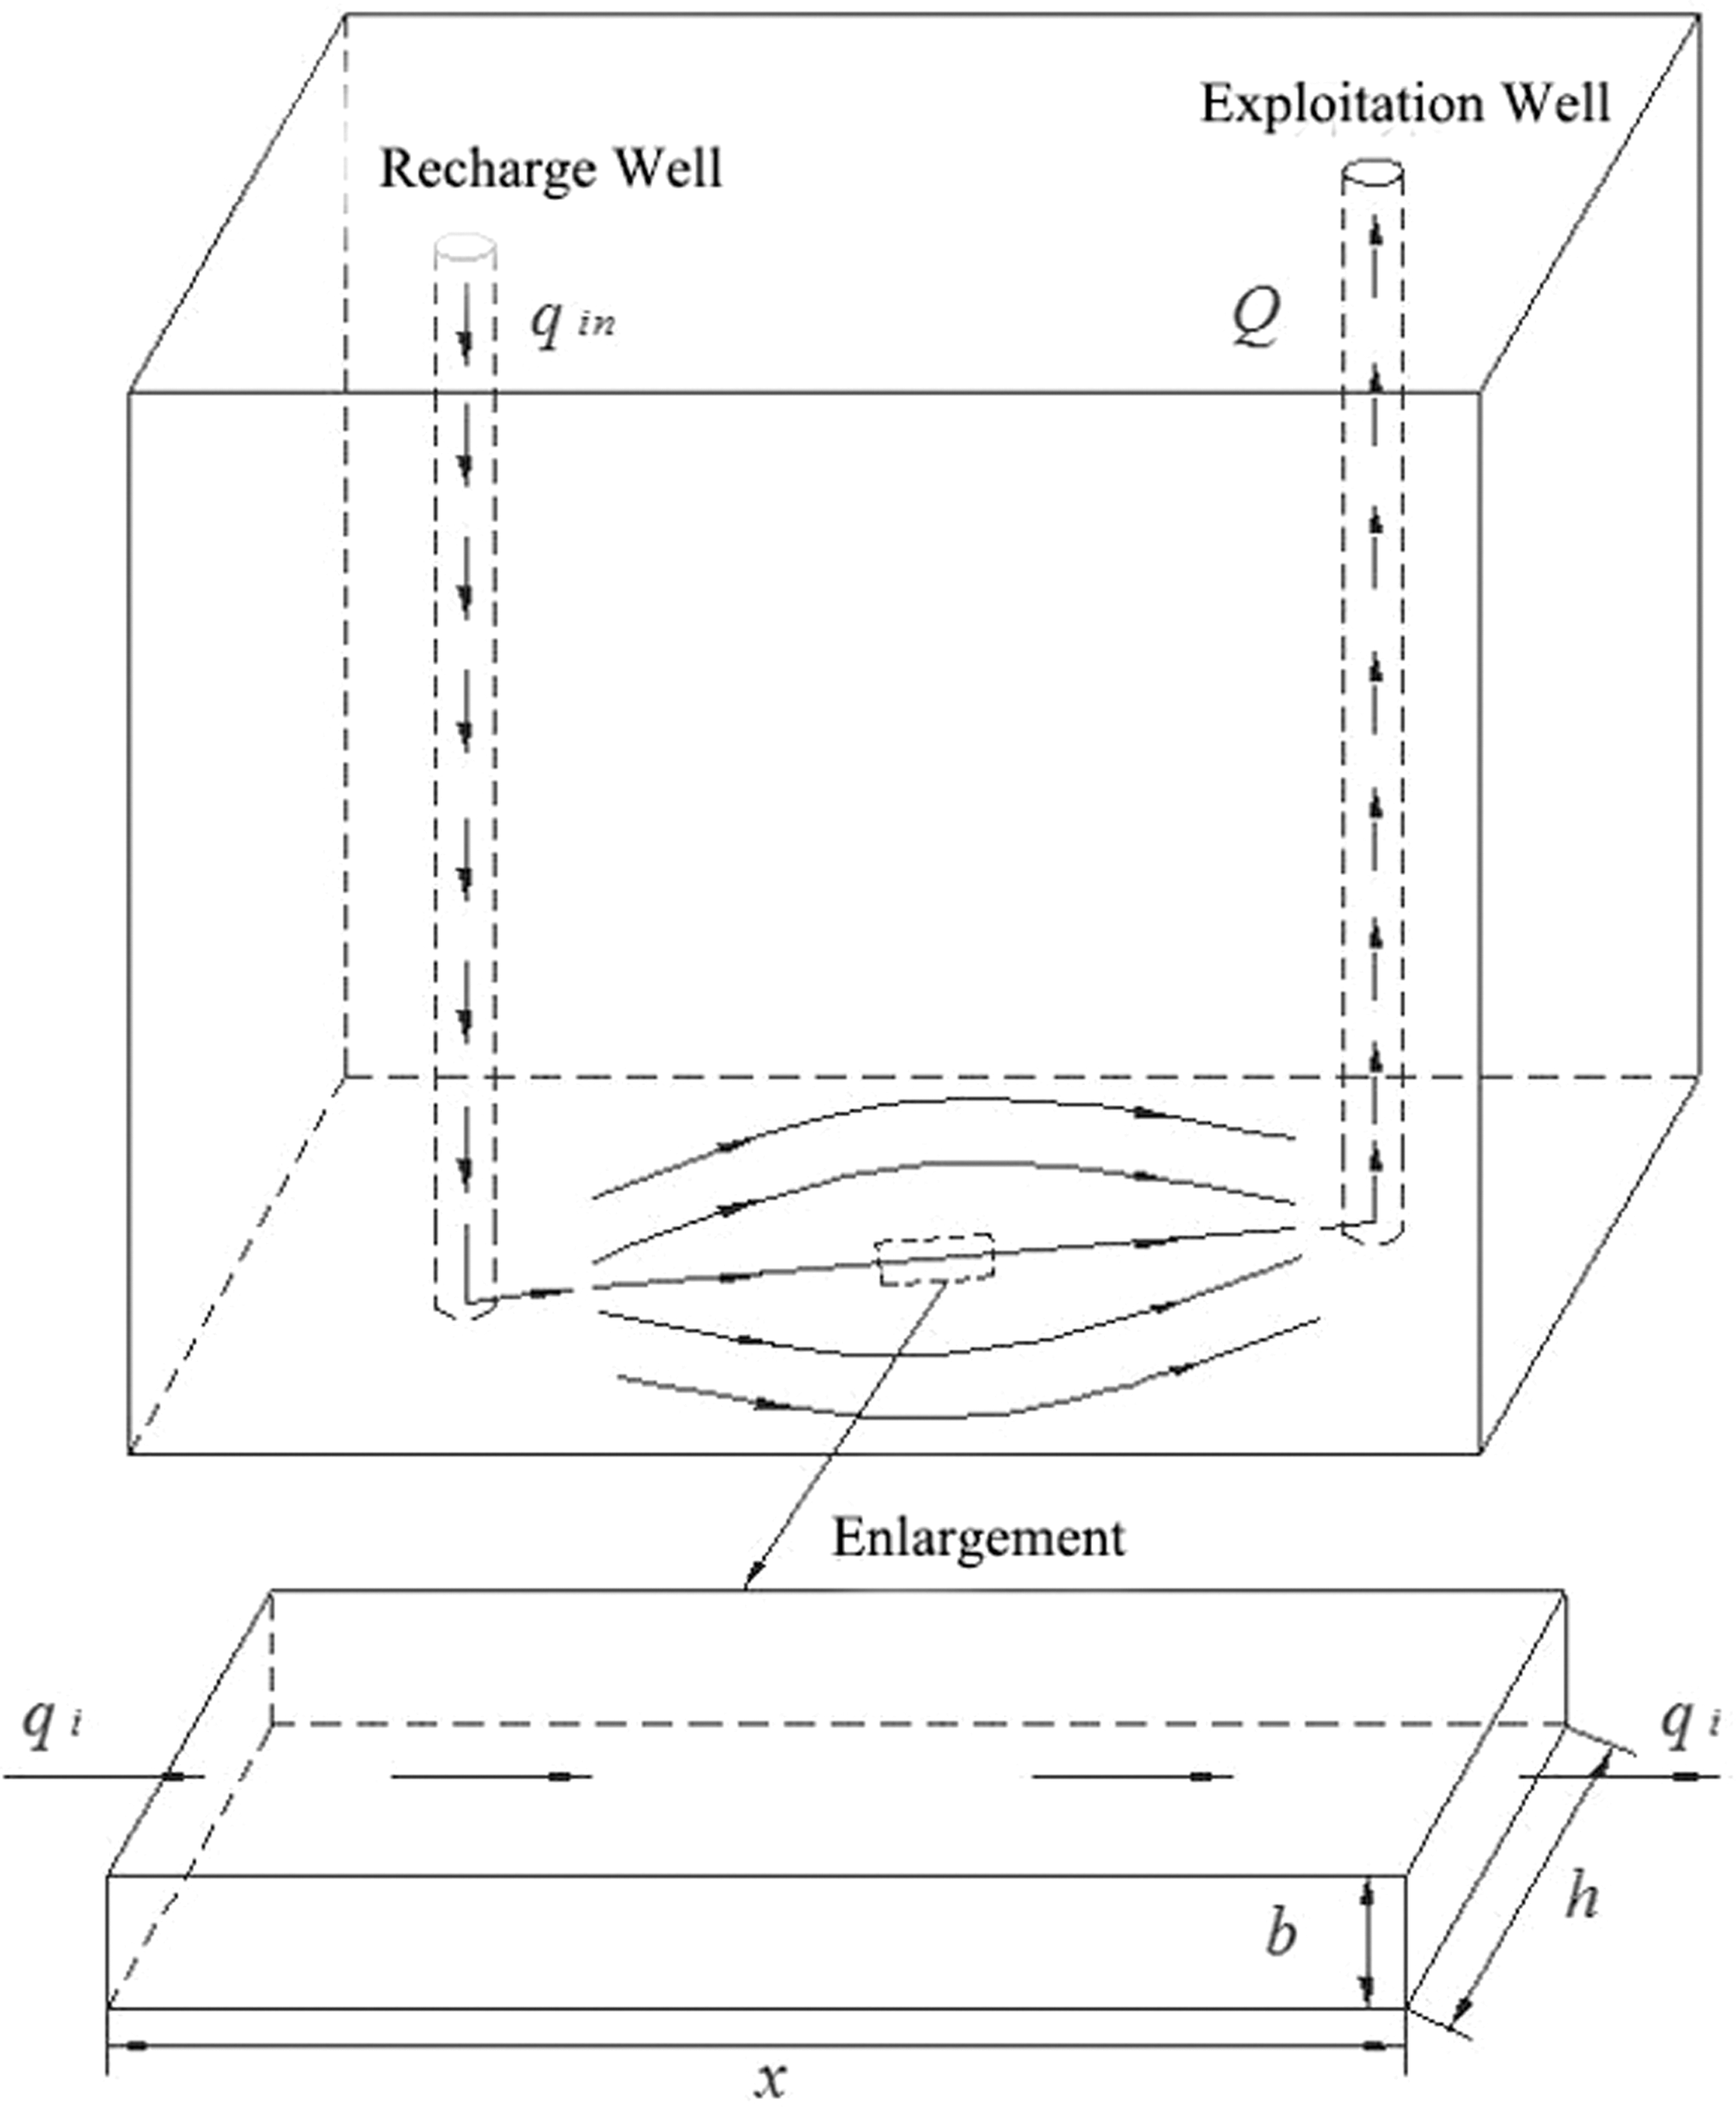
Sketch of the deep thermal reservoir seepage channel model.
Solute transport theory
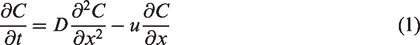
The main transport mechanism of a tracer in a one-dimensional seepage channel is convection and hydrodynamic dispersion, which neglects the diffusion process between channels, other thermal reservoir rocks and the lateral hydrodynamic dispersion in the channel. The tracer migration process in the seepage channel can be described by the convection–diffusion equation in classical porous media (Bodin et al., 2003)
At the moment when

Combining the initial conditions and the boundary conditions, the solution of the partial differential equation (1) is
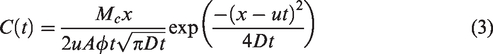
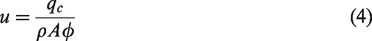

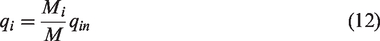
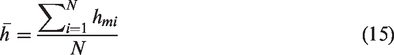
Considering the conservation of the tracer mass in the exploitation well, the following relationship holds when the exploitation rate is Q (kg/s)

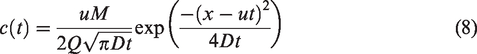
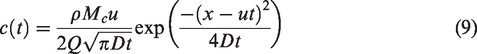
The concentration expression of the tracer in the exploitation well is
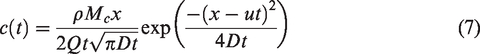
If there are n flow channels between the geothermal and well, the concentration expression of the tracer in the exploitation well is (Axelsson et al., 1995)

Inversion model
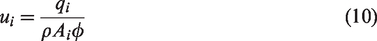
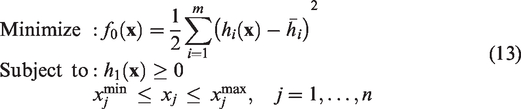
The unknown parameters in equation (8) (such as the channel length xi, the average flow rate ui, the dispersion αi, and the channel cross-sectional area Ai) cannot be directly determined and need to be obtained by inversion of the tracer test. This paper introduces the method of moving asymptotes (MMA) to establish a theoretical framework for back analysis of thermal storage parameters. The objective function or the original optimization problem P can be defined as
The goodness of fit (R2) is an important indicator to measure the degree of fit, which is defined as follows (Zhao and Skelton, 2013)
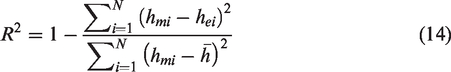
The value range of R2 is [0,1], and the closer the value of R2 is to 1, the better the degree of fit; in contrast, the closer the value of R2 is to 0, the worse the degree of fit is.
The MMA algorithm was proposed by Svanberg (1987) and is particularly suitable for multivariate optimization problems. The MMA algorithm needs to specify the upper and lower bounds of the optimized variables first and then perform the optimization calculation as follows:
Select the initial calculation point Calculate the function values Generate a sub-problem P(k) to approximate the original problem. Based on the calculation in step 2, the function in the original problem is approximated by the function Solve the sub-problem P(k) and make the resulting optimal solution the next iteration point x(k+1), then repeat steps 2–4. When the convergence criterion is met, the iteration stops. The optimal solution to the sub-problem
Svanberg (2002) gives the form of the convergence criterion as follows

Axelsson (2005) developed the tracer test analysis software TRINV based on the nonlinear least squares method to carry out tracer analysis back analysis, but the nonlinear least squares method for complex problems is prone to iterative non-convergence. The advantage of the MMA algorithm is that it is possible to optimize multiple variables at the same time, which are insensitive to the upper and lower bounds of the optimized variables, and it rarely occurs when the iteration does not converge.
Convective heat transfer theory
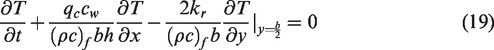
Assuming that the water–rock interface temperature is equal, the differential equation for convective heat transfer control in the seepage channel is


Equation (17) can be further reduced to the following form
Make
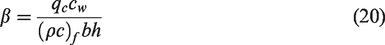
Then, equation (19) can be reduced to

When

Therefore, the temperature expression of water in the seepage channel is
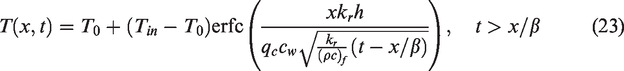

Thus, equation (23) can be written as
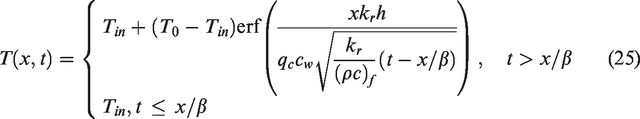
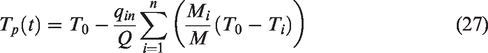
Considering the exploitation rate Q, the water temperature Tp in the exploitation well at different times is

If there are i flow channels between the two wells, then the water temperature Tp in the exploitation well can be calculated by the following expression
Project cases
Tracer test
The studied area is located in Xian County, Cangzhou City, Hebei Province, where the strata are mainly the Cenozoic, Paleozoic, and Middle-Upper Proterozoic. From top to bottom, the systems lie as follows: Quaternary system (Q), Neogene system (N), Paleogene system (E), Carboniferous–Permian system (C–P), Ordovician system (O), Cambrian system (∈), Jixianian system (Jx), and Changchengian system (Ch). The thermal reservoir mainly lies in the Wumishan formation, and the Gaoyuzhuang formation of the Jixianian system. The major lithology is dolomite, and the thermal reservoir temperature is 80–107°C. The thickness of Wumishan thermal reservoir is 2003 (underground 1326 − 3329 m).
The tracer test site is located in Meizhuangwa Farm, Xian County. Three geothermal wells, namely XXZK1, GRY1, and XXZK2, are distributed from south to north. Among them, the distance between XXZK1 and GRY1 is 100 m, between GRY1 and XXZK2 is 175 m, and between XXZK1 and XXZK2 is 270 m. For XXZK, the depth is 2500 m and the diameter is 215.9 mm; for XXZK2, the depth is 2050 m and the diameter is 215.9 mm; and for GRY1, the depth is 4050 m and the diameter is 152 mm. The geological section of the tracer test site is shown in Figure 2.
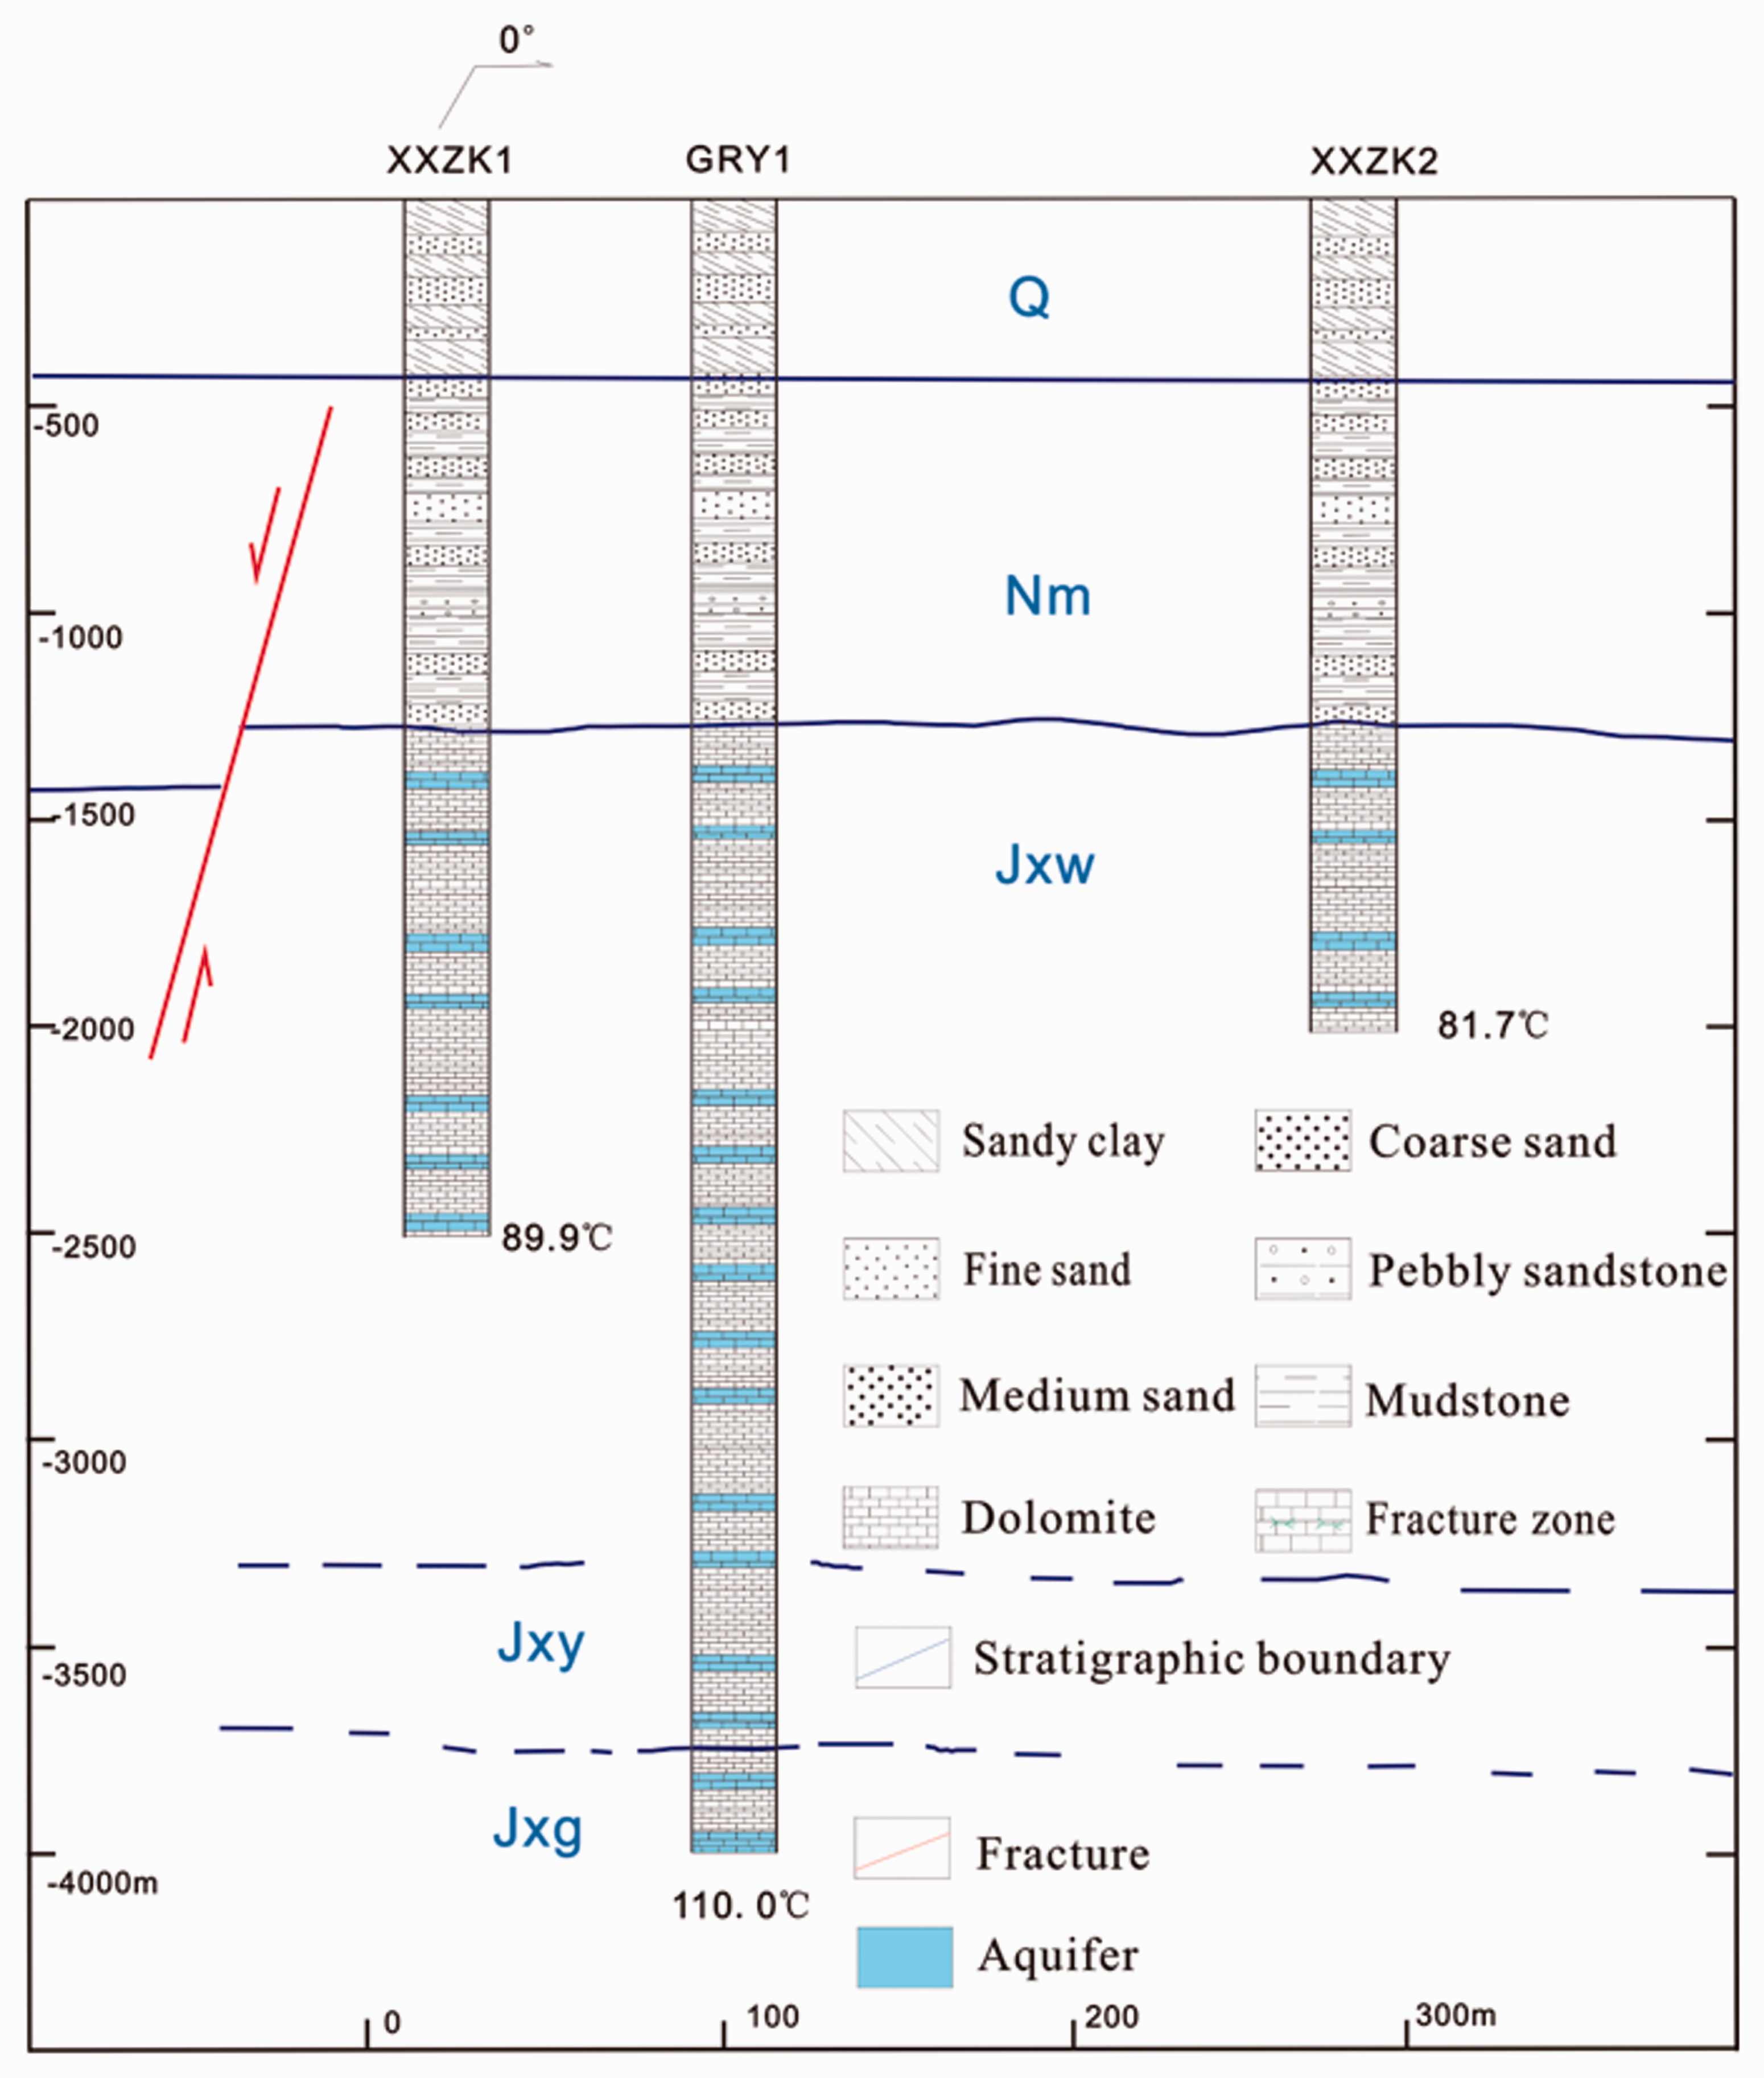
Geological section of the tracer test site.
The first stage, XXZK2 was used as the recharge well with a recharge rate of 100 m3/h; XXZK1 was used as the production well with the production rate of 100 m3/h. The second stage, both recharge and production rate are 130 m3/h. On 23 September 2017, 400 kg of sodium naphthalene sulphonate was charged into recharge well. Since then, sampling occurred every day and was encrypted near the peak until it ended on 21 May 2018. The sampling lasted for 245 days with a total of 4828 samples taken.
Quantitative explanation of the tracer test data
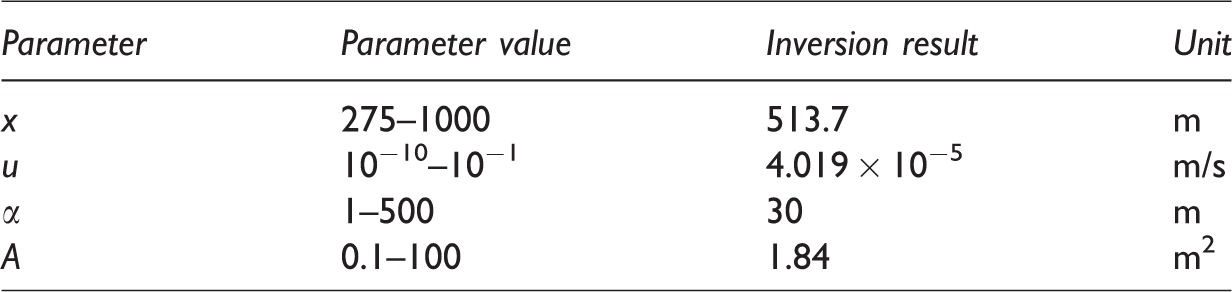
The water sample was sent to the testing centre of the geothermal science and exploration laboratory to test the concentration of the tracer, and a scatter diagram of the tracer concentration in the geothermal water with time was obtained, as shown in Figure 3. Due to various factors such as transformer replacement, circuit problems, and repeated trips during the tracer test, some data points with large errors were deleted from the scatter diagram. The fitting analysis of the tracer test data was conducted based on equation (7) and the MMA inversion algorithm, and the parameter values in the inversion are shown in Table 1. The calculated R2 = 0.7907 and R2 > 0.6, which indicated a good fit. The fact that there is only one peak in the fitted curve indicates that there is one dominant seepage channel between the geothermal wells and that the length of the channel is approximately 513.7 m.
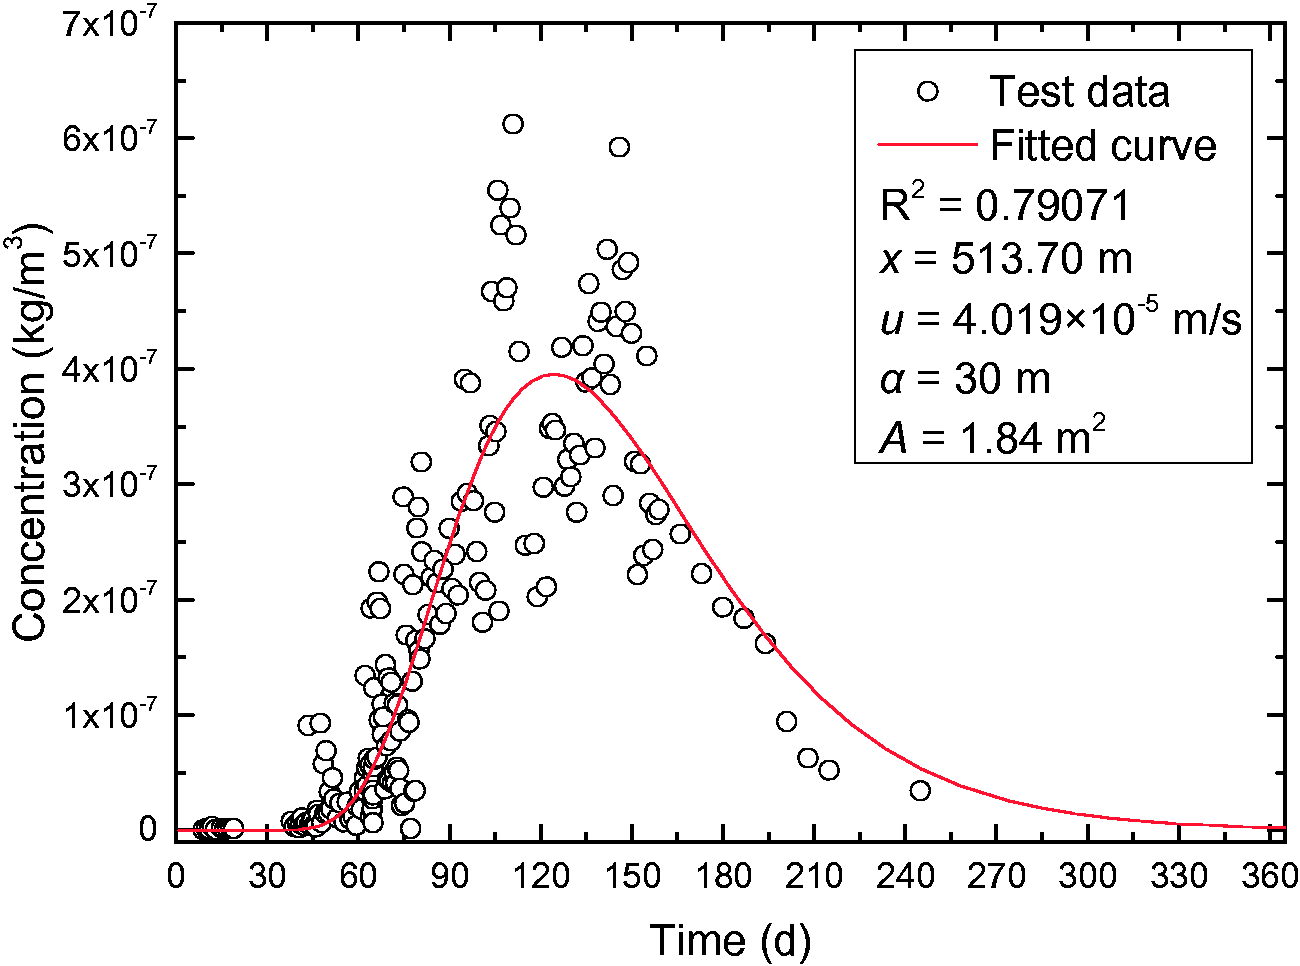
Tracer test data and the fitted curve.
Parameter values and inversion results.
Thermal breakthrough prediction results and analysis
The heating of recharge ‘cold water’ by the seepage channel depends on the surface area of the channel rather than its volume. Therefore, assumptions must be made regarding the geometry of the channel. Considering that the premise of the existence of the initial conditions and boundary conditions is
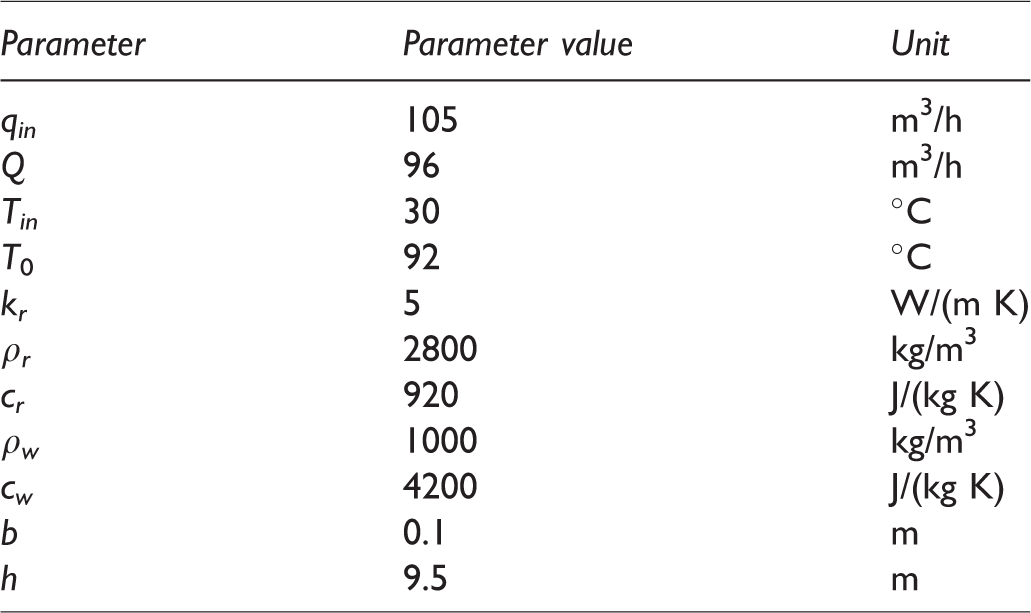
Parameter values.
The tracer recovery rate Mi/M can be obtained by analysing the tracer test data. A total of 400 kg of sodium naphthalene sulphonate was charged at the beginning of the test, and 0.09 kg was recovered during the tracer test, so the calculated tracer recovery rate was 0.0225%. The change in the production water temperature within 100 years is shown in Figure 4. The low tracer recovery rate indicated a poor hydraulic connection between the production well and the recharge well. Most recharge water flowed into the thermal reservoir through other flow channels, while only a small part of the recharge water reached the production well through the dominant seepage channel. The temperature drop in the production well was small. Therefore, a preliminary judgement can be made that during the 100-year service life of a geothermal well system with long-term recharge, the production water temperature will not obviously change, and no thermal breakthrough will occur.
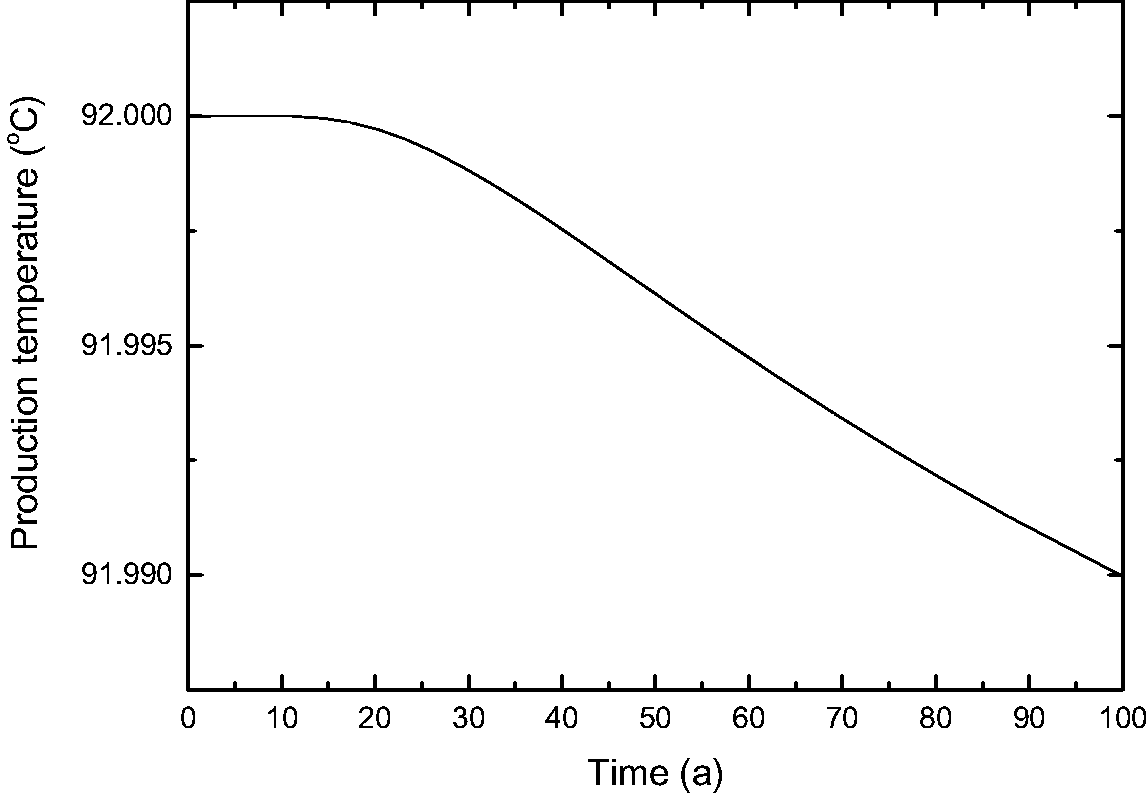
Variation curve of the production water temperature.
Parameter sensitivity analysis
To study the influence of the channel length x, the seepage rate u, and the channel area A on the thermal breakthrough of the production well, a sensitivity analysis of the above parameters was carried out to provide a theoretical basis for further optimization of the geothermal recharge. The values of each parameter are shown in Table 3, and the calculated results are shown in Figures 5 to 7. Figure 5 shows that the shorter the dominant seepage channel is, the earlier the recharge cold water will reach the production well and lead to a thermal breakthrough, whereas the longer the channel is, the more the thermal breakthrough will be effectively extended. Therefore, in actual engineering, the distance between the recharge well and the production well should be increased as much as possible. Figure 6 shows that the faster the seepage rate is, the earlier the recharge cold water will reach the production well and lead to thermal breakthrough. From the curve, magnitudes of 10−5 and 10−4 of the seepage rate greatly influence the shape of the thermal breakthrough curve. Therefore, in actual engineering, the seepage coefficient of the thermal reservoir should be determined by means such as a pumping test to avoid a large seepage coefficient between the wells, which will cause very rapid thermal breakthrough. Figure 7 shows that the larger the area of the seepage channel is, the earlier the recharge cold water will reach the production well and lead to thermal breakthrough. A larger channel area means more recharge cold water flows into the production well through the seepage channel and causes the rapid decline of temperature in the production well. Therefore, in actual engineering, relevant parameters such as the porosity and the fracture rate of the thermal reservoir rocks can be obtained by analysing the core of the borehole. When selecting the location of the wells, areas with large porosity and fracture rate between the wells should be avoided as much as possible to reduce the risk of thermal breakthrough in the production well.
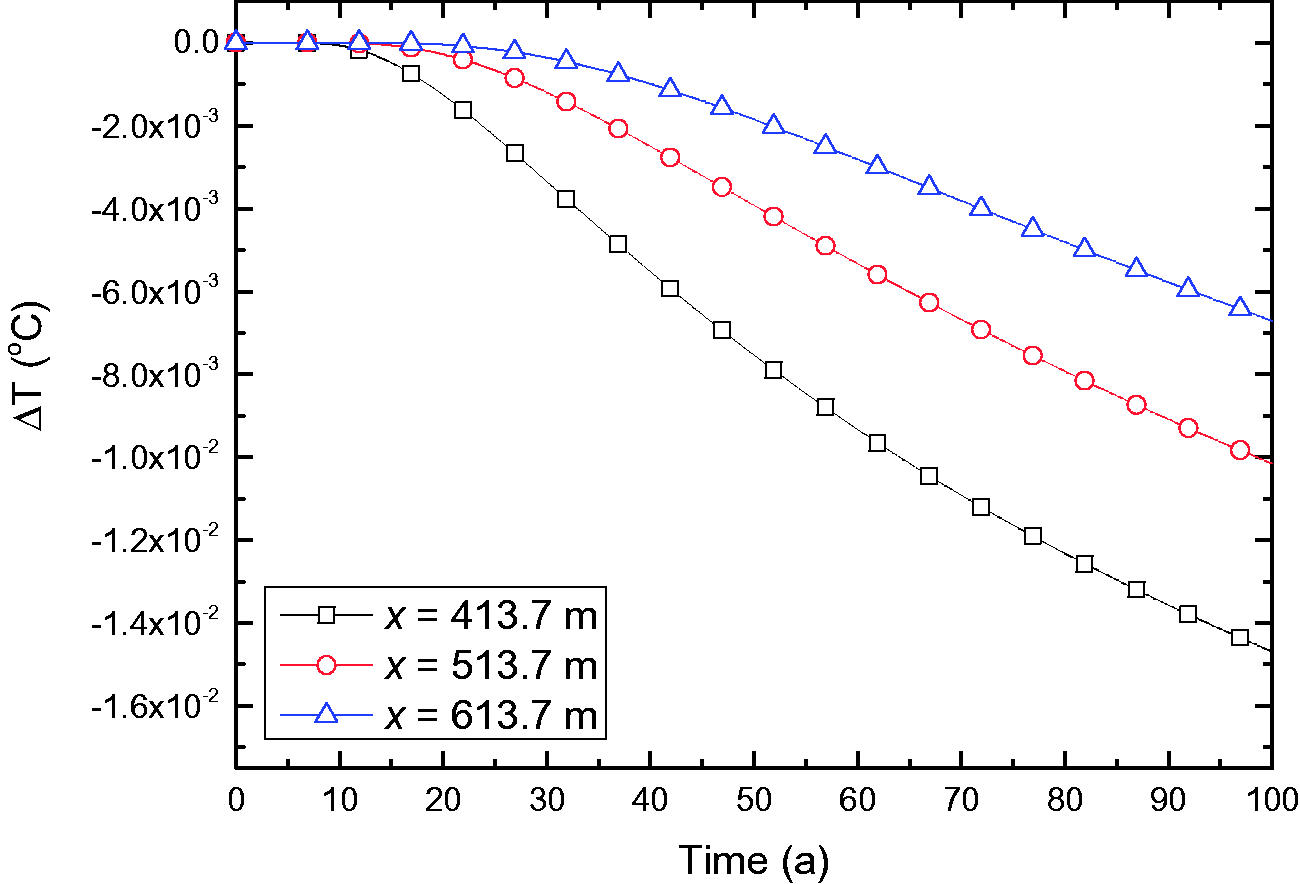
Change in the temperature difference in the production well at different x values.
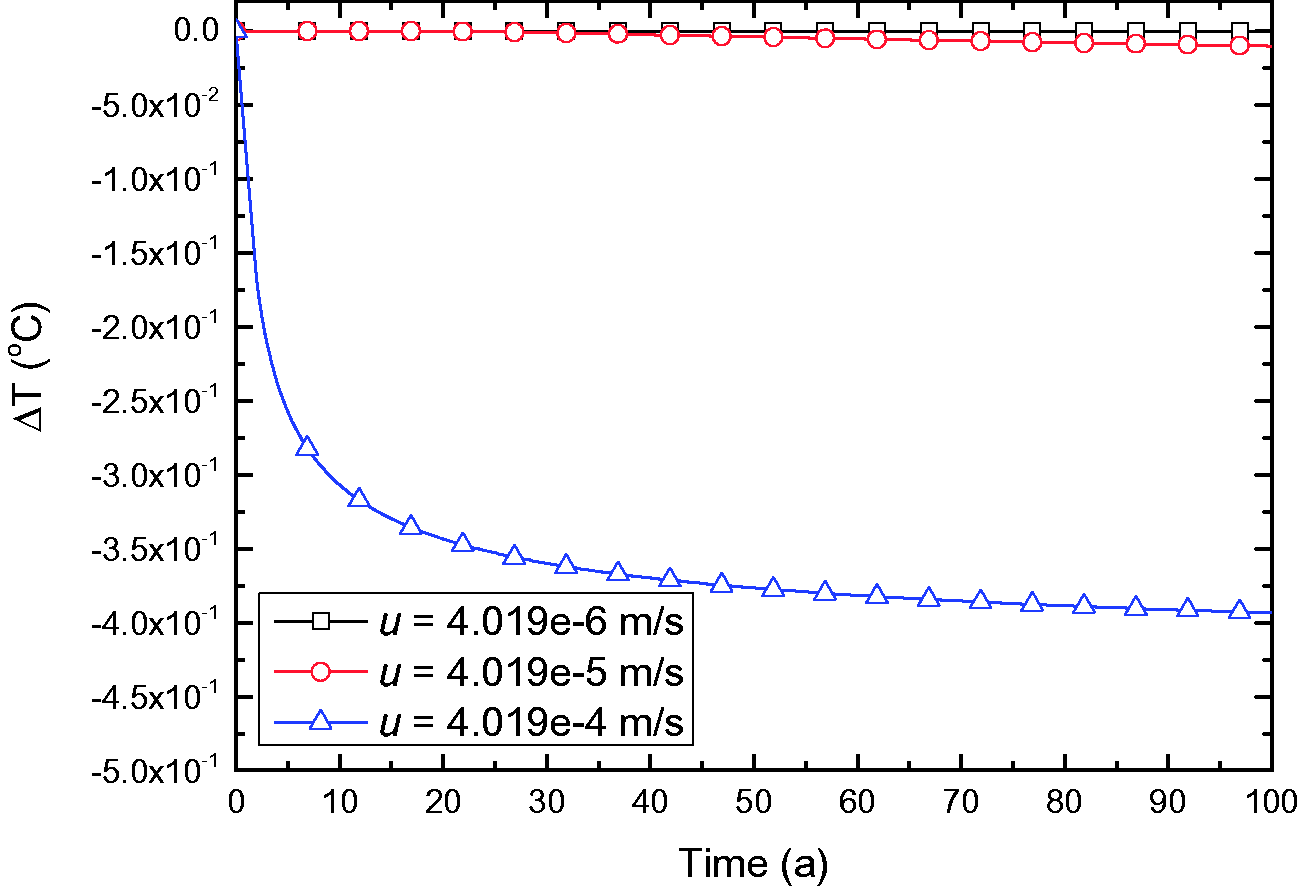
Change in the temperature difference in the production well at different u values.
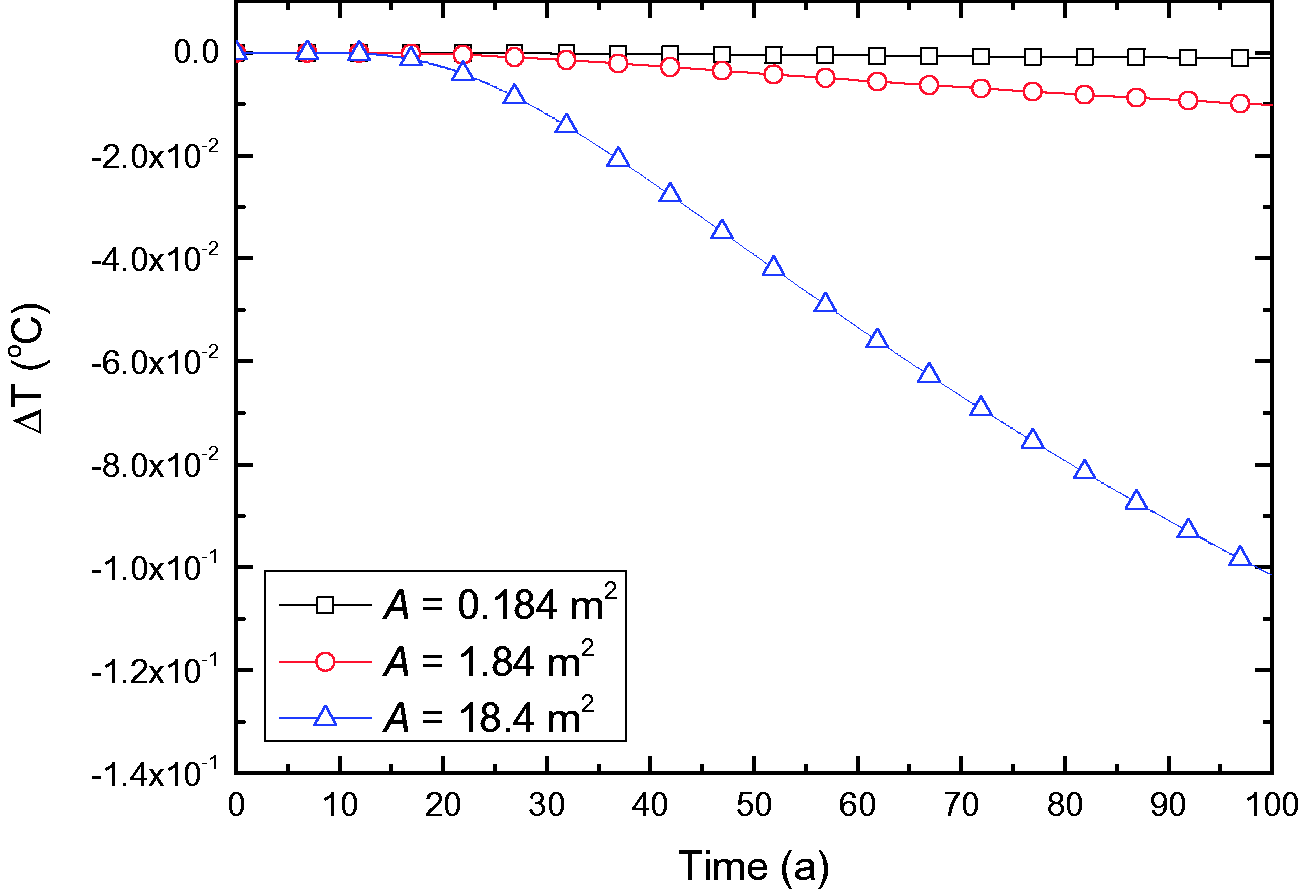
Change in the temperature difference in the production well at different A values.
Parameter values.

Conclusion
Based on previous research, this paper used the seepage channel model as the theoretical basis and applied the solute transport theory to modify the analytical solution describing the change in solute concentration in the production well and proposed the theoretical framework of the inverse analysis of the thermal reservoir parameters based on the MMA algorithm. In addition, the convective heat transfer theory of porous media was applied to obtain an analytical solution of the temperature change in the production well to finally form a complete theoretical model of the geothermal tail water recharge.
A theoretical model was applied to the engineering case, and the tracer test data were used to carry out the parameter back analysis and obtain R2 = 0.7907 > 0.6, indicating that the optimization result had a strong correlation with the measured value and that the fit was good.
The values of the thermal reservoir parameters of the tracer test’s back analysis were used to predict the thermal breakthrough for the geothermal well system. The results indicated that due to the lower tracer recovery rate, the hydraulic connection between the production well and the recharge well was poor. During the 100-year service life of a geothermal well system, the production water temperature will not obviously change, and no thermal breakthrough will occur.
Sensitivity analysis of the main parameters obtained by inversion, including the channel length x, the seepage rate u, and the channel area A, suggested that when selecting the location of the wells, various means such as the pumping test and analysis of the borehole core should be used to determine the parameters such as the seepage coefficient, porosity, and fracture rate of the heat reservoir in advance. Areas with large parameters should be avoided as much as possible, and the distance between the wells should be as large as possible to reduce the risk of thermal breakthrough in the production well.
Footnotes
Authors’ note
Any underlying research materials related to our paper (e.g. data, samples or models) can be accessed.
Declaration of conflicting interests
The author(s) declared no potential conflicts of interest with respect to the research, authorship, and/or publication of this article.
Funding
The author(s) disclosed receipt of the following financial support for the research, authorship and/or publication of this article: This project is supported by the Chinese Academy of Geological Sciences Fund (No. YK201611, SK201501).