
Abstract
Thermal maturity has a considerable impact on hydrocarbon generation, mineral conversion, nanopore structure, and adsorption capacity evolution of shale, but that impact on organic-rich marine shales containing type II kerogen has been rarely subjected to explicit and quantitative characterization. This study aims to obtain information regarding the effects of thermal maturation on organic matter, mineral content, pore structure, and adsorption capacity evolution of marine shale. Mesoproterozoic Xiamaling immaturity marine oil shale with type II kerogen in Zhangjiakou of Hebei, China, was chosen for anhydrous pyrolysis to simulate the maturation process. With increasing simulation temperature, hydrocarbon generation and mineral transformation promote the formation, development, and evolution of pores in the shale. The original and simulated samples consist of closed microspores and one-end closed pores of the slit throat, all-opened wedge-shaped capillaries, and fractured or lamellar pores, which are related to the plate particles of clay. The increase in maturity can promote the formation and development of pores in the shale. Heating can also promote the accumulation, formation, and development of pores, leading to a large pore volume and surface area. The temperature increase can promote the development of pore volume and surface area of 1–10 and 40-nm diameter pores. The formation and development of pore volume and surface area of 1–10 nm diameter pores are more substantial than that of 40-nm diameter pores. The pore structure evolution of the sample can be divided into pore adjustment (T < 350°C, EqRo < 0.86%), development (350°C < T < 650°C, 0.86% < EqRo < 3.28%), and conversion or destruction stages (T > 650°C, EqRo > 3.28%). Along with the increase in maturity, the methane adsorption content decreases in the initial simulation stage, increases in the middle simulation stage, and reaches the maximum value at 650°C, after which it gradually decreases. A general evolution model is proposed by combining the nanopore structure and the adsorption capacity evolution characteristics of the oil shale.
Keywords
Introduction
Organic-rich shale is important as a source rock for conventional and unconventional oil and gas and as a reservoir for shale gas. A gas shale reservoir is characterized by abundant pores, with sizes ranging from several to several hundreds of nanopores (Chalmers et al., 2012; Loucks et al., 2009, 2012). A considerable portion of gas is found in an adsorbed state within micropores and mesopores of gas shale (Chalmers and Bustin, 2008; Rexer et al., 2013; Ross and Bustin, 2009). Elucidating the complex pore networks in gas shales has become a strategic subject because the shale pore structure is one of the most important factors controlling the gas adsorption capacity. Meanwhile, the pore structure and porosity are crucial parameters for evaluation of shale gas potential and production (Chalmers and Bustin, 2008; Ross and Bustin, 2009; Wang et al., 2004; Mastalerz et al., 2013). The geological control factors of pore structure in gas shales include total organic carbon (TOC) content, thermal maturity, and mineralogy, which have been preliminarily discussed in previous works(Chalmers and Bustin, 2008; Ross and Bustin, 2009; Tian et al., 2013; Valenza et al., 2013).
Scholars have focused on determining the influence of thermal maturity on the geochemical and mineralogical features of the source rock itself, such features include kerogen geochemical properties and structure (Modica and and Lapierre, 2012; Tiwari et al., 2013; Valenza et al., 2013), pore distribution and porosity, clay mineral orientation, and fabrics (Clarkson et al., 2012, 2013; Milliken et al., 2012; Tiwari et al., 2013). Image analysis measurement techniques have been successfully developed to characterize complex pore systems and elucidate the effects of thermal maturation on the evolution of nanopore characteristics (Chalmers et al., 2012; Clarkson et al., 2012; Curtis et al., 2012; Wang et al., 2016). Although these techniques can be used to characterize the shale pore structure and identify the effect of maturity on it to some extent, most studies were based on statistics and comparison of natural shale samples with different maturity levels. For different shale samples, organic matter type and content and mineral components vary, thereby affecting the development of nanopores. Thus, a series of artificial maturity and hydrous pyrolysis experiments have been performed to simulate the maturation process in shale during the past few years (Chen and Xiao, 2014; Guo et al., 2017; Hu et al., 2015; Sun et al., 2015; Tang et al., 2015). However, results of research on the development of pores during thermal maturation have not reached agreement. Therefore, the response of shale porosity to hydrocarbon generation and cracking caused by thermal maturation remains unclear in gas shale systems. The effect of changes in organic and inorganic material composition on methane adsorption capacity during the thermal simulation has also not been evaluated.
The outcomes obtained by previous studies are not systematized and are mainly focused on continental and marine–continental transitional facies shale. The evolution of marine shale, especially in the high and overmature stages, has not been studied yet. Thus, understanding of such phenomenon is inconsistent and causes abundant dispute, and additional systematic studies must be performed. Artificial maturation and pyrolysis experiments must be conducted on marine samples with the same heating rate and time but at different temperatures. In this study, immature Mesoproterozoic Xiamaling marine shale in Hebei Zhangjiakou was selected to conduct thermal simulation experiment and reveal the evolution characteristics of the pore structure and adsorption capacity of marine shale in the immature to high and overmature stages. The immature Xiamaling marine shale was artificially heated under anhydrous pyrolysis conditions at 12 different temperatures to create different artificial thermal maturity levels. Variations in geochemistry characteristics, mineralogy, pore structure, and adsorption capacity of marine shales with increasing thermal maturity were characterized. This work aims to (1) understand the effect of thermal maturity on organic matter and mineralogy evolution, (2) investigate pore size distribution during thermal treatment, (3) analyze the effects of organic matter and minerals on changes in pore development and adsorption capacity with increasing pyrolysis temperature, and (4) divide the stages of pore development and adsorption capacity. Results are important to elucidate the evolution characteristics of the pore structure and adsorption capacity of marine shale and beneficial for evaluation of shale gas resource potential and gas production of Xiamaling shales in China and other marine shales worldwide.
Samples and experiments
In this research, starting samples used for pyrolysis were obtained from oil shale, which was collected from Xiamaling marine shale formation, Mesoproterozoic, in Zhangjiakou, Hebei. The oil shale was obtained from the unweathered part of the outcrops in a mining pit with depth of 3–5 m. The locations were already described by previous studies (Bian et al., 2005; Liu et al., 2011). The geochemistry characteristics of the initial shale are shown in Table 1 and Figure 1. The samples used for pyrolysis experiments were carefully polished to remove any weathered surfaces, cleaned with deionized water, mined to homogeneity, and crushed to grains with size ranging from 0.83 mm to 4 mm. The samples were then thoroughly mixed to ensure a homogeneous sample from which aliquots were taken for each anhydrous pyrolysis experiment. After the thermal simulation, the organic geochemistry analysis, mineral composition and content determination, low CO2 and N2 adsorption, and isothermal adsorption test were carried out on the initial shale and the pyrolyzed samples.
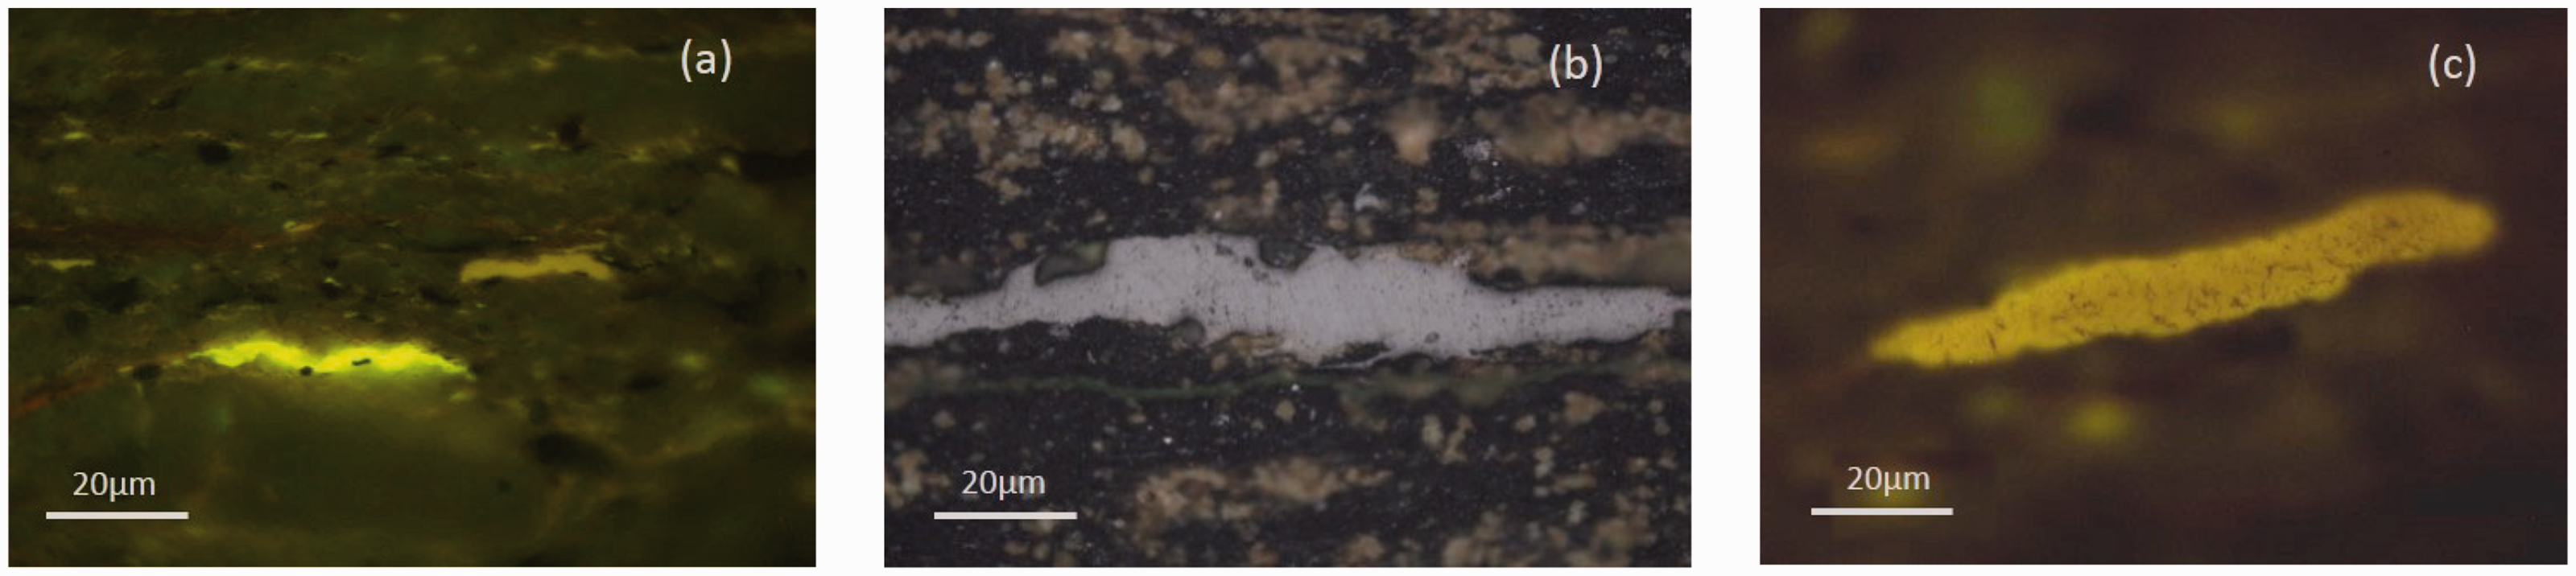
Maceral photographs of the oil shale, 125 × 10 (a: lamalginite, transmitted light; b: vitrinite-like macerals, reflected light; c: transmitted, blow light).
The geochemistry characteristics of initial shale and solid residues of the oil shale.
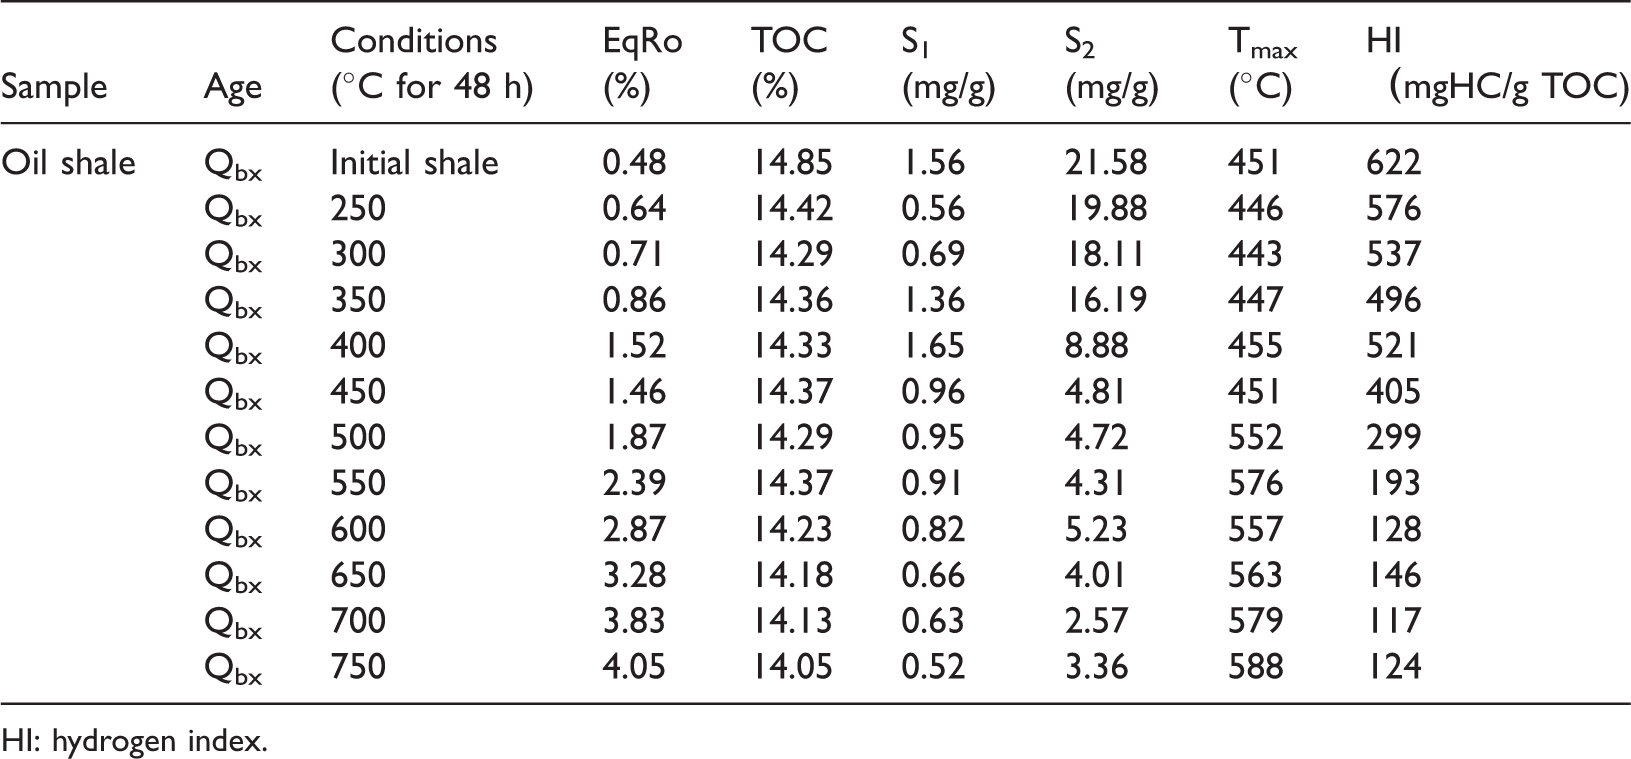
HI: hydrogen index.
Anhydrous pyrolysis
The anhydrous pyrolysis experiment of this research was performed in a programmed oven under inert conditions. The oil shale was first crushed and sieved into <250 μm fraction and homogenized. All the samples were then dried for 24 h at 60°C in a vacuum oven. Next, the crushed oil shale was separated into 12 fractions, transferred to a series of quartz tubes, and sealed under vacuum. The sealed quartz tubes were put into an oven for heating from room temperature to a preset temperature at a heating rate of 200°C/h in the furnace and then maintained for 48 h. The target temperature was set within a range of 250–750°C at 50°C intervals. Each heating procedure was started with a new batch of powdered samples and the corresponding experimental conditions were set on the computer. Once the experiment was over, the pyrolysis solid residues at each target temperature were recovered and transferred to an ongoing multidisciplinary analytical program.
Geochemical analysis
The pyrolysis data for shale samples were obtained using a Rock-Eval 6 developed by French Vinci Technologies. The total TOC content of the shale was measured by LEC CS-230 carbon–sulfur analyzer after treatment with hydrochloric acid to remove carbonates according to the method by Dai et al. (2015). TOC content was calculated by the peak area of CO2 generated from the combustion of the organic matter and calibrated by carbon in steel (TOC = 0.812 ± 0.006%).
In the initial shales and the samples from anhydrous pyrolysis experiment in which no “true” vitrinite was present, the vitrinite-like maceral reflectance was used to replace the vitrinite reflectance in the present research. The vitrinite-like maceral reflectance measurements were carried out on polished blocks and powder samples under reflected light using 3Y-Leica DMR XP microphotometric system. The random reflectance was measured in oil immersion (n = 1.518) at 546 nm using a 50×/0.85 objective lens. According to the maturities of the initial shales and the simulation samples achieved from different pyrolysis temperatures, a standard with a reflectance closest to the measured value was selected from three available standards: yttrium aluminum garnett YAG-08–057(Ro = 0.904%), NR1149(Ro = 1.24%), and cubic zirconia(Ro = 3.11%). The vitrinite-like maceral reflectance was then converted to equivalent vitrinite reflectance (EqRo) using the equation of Xiao et al. (2000).
The maceral observation of the initial samples was performed on one-side polished blocks with a Leica MPV microscope using reflected white and fluorescent light, and the analysis and identification of macerals in shales were referred to Stach et al. (1982).
Mineral composition and content analysis
The initial shale and its heated solid residues were crushed into powders with a grain size of <250 μm for X-ray diffraction (XRD) analysis, which was carried out on a Bruker D8 Advance X-ray diffractometer with a Cu radiation (λ = 1.5406 for Cu Kα1), and the working voltage and current are 40 kV and 30 mA, respectively. Stepwise scanning measurements were performed at a rate of 4°/min between 3° and 85°(2θ). The mineralogical composition and the relative mineral percentages were semiquantitatively determined (mineral wt.%) using the area under the curve for the major peaks of each mineral, with correction for Lorentz polarization (Gareth et al., 2008).
Low-pressure CO2 and N2 adsorption
The adsorption experiment was conducted on an ASAP2460 instrument, and the samples were crushed and sieved to 60–80 mesh (250–180 μm) dried in a vacuum oven at 110°C for 24 h to remove adsorbed moisture and volatile matter.
A low-pressure CO2 adsorption isotherm was used to characterize the micropores (<2 nm). This type of analysis was performed at 273 K with a relative pressure P/P0 ranging from 0.00003 to 0.03(Ghosal and Smith, 1996). CO2 adsorption data were interpreted using the Brunauer–Emmett–Teller (BET) and Langmuir models. The micropore surface area was calculated by the well-known Dubinin–Radshkevich (D–R) equation, which is based on volume filling theory of micropores and follows the fundamental relation. The micropore volume was determined by the Dubinin–Astakhov (D–A) equation based on the CO2 isotherms (Dubinin and Stoeckli, 1980).
Low-pressure N2 adsorption is considered a standard and preferable method for surface area and pore volume measurement of mesopores and macropores. N2 adsorption isotherms were obtained at 77.4 K with a relative pressure (P/P0) ranging from 0.005 to 0.998. Adsorption and desorption isotherms were measured to investigate the hysteresis types for N2 adsorption. The N2 data collected on crushed samples were interpreted using multipoint BET and Langmuir analysis for surface area and Barett–Joyner–Halenda (BJH) analysis for pore size distribution (Joyner et al., 1951; Stephen et al., 1938).
Isothermal adsorption experiment
Methane adsorption measurement was conducted on the original and thermal simulation residues of shale samples. The experiments were performed on the powered samples by using the IS-300 isothermal adsorption instrument (produced by Terra Tek Company, USA). The calibration gas was He and N2 was utilized as the valve carrier gas. The sample cells were maintained at 30°C (±0.2°C), and the laboratory air temperature was maintained at approximately 25°C. The amount of absorbed methane was recorded in units of m3/t at 0°C and 101.325 KPa. A total of 100–150 g of powdered sample was employed for the analysis. Two of the shale samples were selected to perform the repeatability tests to check the repeatability of the adsorption data and each sample was measured twice. The error of the repeated measurements of the adsorption capacity results was 1.2–6.8%.
Results and discussions
Evolution of the geochemistry parameters and mineralogy
Geochemistry parameters evolution
The TOC value of the initial shale is 14.85%, and the TOC content of the solid residuals ranges between 14.05% and 14.42%. The EqRo value of the initial shale is 0.48%, indicating an immature stage of thermal maturation. The EqRo of the simulated samples ranges from 0.64% to 4.05%. The Tmax of the unheated samples is 451°C, and the Tmax of the solid residues is in the range of 443°C–588°C. The S1 and S2 of the initial oil shale are 1.56 mg/g and 21.58 mg/g, respectively. The S1 and S2 of the solid residues are 0.52–1.65 mg/g and 2.57–19.88 mg/g, respectively. The hydrogen index (HI) of the original oil shale is 622 mg/g TOC, and the HI of the simulated samples ranges from 117 mg/gTOC to 576 mg/gTOC (Table 1).
Most of the areas in the microscopic fluorescent photographs of the initial oil shale have a brown color, and the main macerals under the microscope are amorphous macerals and telalginite, lamalginite, and spherical algae, which emit yellow–green fluorescence. In the organic matter in lamellate, flocculent, and globular, vitrinite-like macerals can be found in some samples under reflected light. Notably, most of the kerogen contents are type II (Figure 1).
The anhydrous pyrolysis conditions of 250–750°C for 48 h were used in this study and have been shown to simulate the entire oil window (Lewan et al., 1985). The geochemical analysis dates for the rocks recovered from the experiments are listed in Table 1, with the selected parameters plotted in Figure 2.
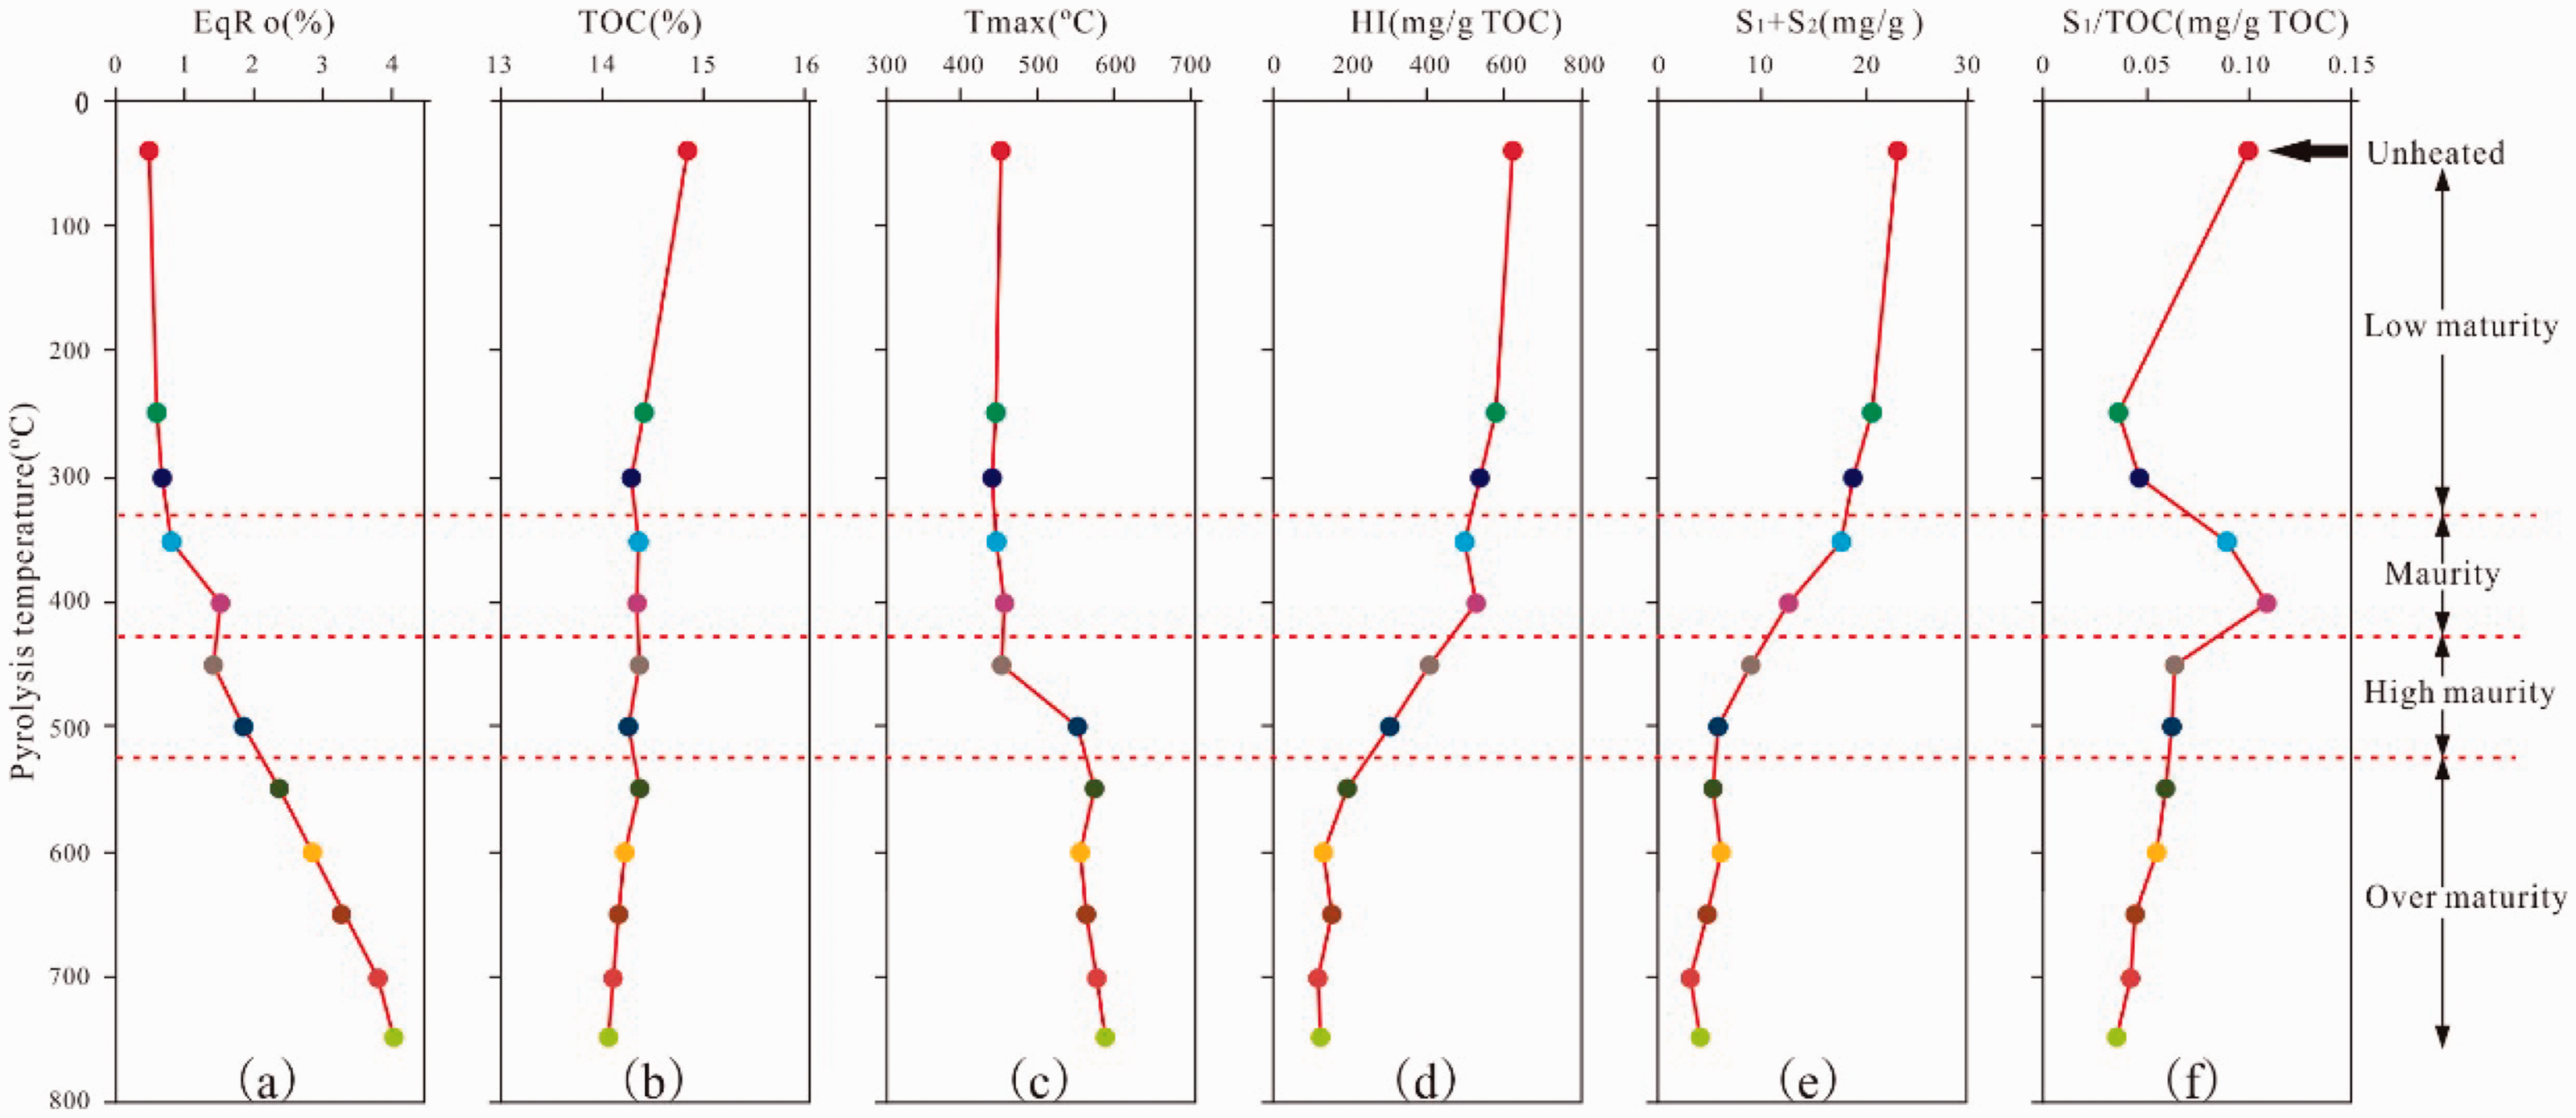
Variations in geochemical indices for the unheated oil shale and its pyrolyzed aliquots plotted with the pyrolysis temperature for 48 h duration. (a)EqRo (%); (b) TOC(%); (c) Tmax (°C); (d) HI (mg/gTOC); (e) S1 + S2(mg/g); and (f) S1/TOC (mg/g TOC).
As the pyrolysis temperature increases to 750°C, the mean equivalent vitrinite reflectance increases from 0.48% to 4.05%, which has a good positive correlation with the pyrolysis temperature even if an individual equivalent vitrinite reflectance value (Figure 2(a)), such as EqRo, at a pyrolysis temperature of 400°C does not fit the trend. On average, the TOC content declines from 14.85% in an unheated sample to 15.05% at a pyrolysis temperature of 750°C during pyrolysis (Figure 2(b)). The reason for this decline remains unclear and is speculated to be attributable to the heterogeneity of the samples. As the pyrolysis temperature increases to 750°C, the Tmax also rises from approximately 450°C to nearly 590°C. The Tmax skips from 451°C to 576°C between the pyrolysis temperature of 450–550°C and then drops to 557°C at the pyrolysis temperature of 600°C. As the simulation temperature rises, the Tmax eventually increases to 588°C (Figure 2(c)). The HI also decreases from 622 mg HC/g TOC in the unheated sample to 128 mg HC/g TOC at a pyrolysis temperature of 600°C and then decreases to the value of 117–146 mg HC/g TOC above 600°C (Figure 2(d)). The variation in the TOC content of the shale residue is inconsiderable from 400°C to 550°C, whereas their HI changes are large in this temperature range. The HI decreases as a function of the TOC content, which basically agrees with Hartman (1987), who documented that the relationship between the TOC content and the HI index can be approximated by a quadratic equation. The S1 + S2 also decreases from 23.14 mg/g in the unheated sample to lower than 4.0 mg/g at pyrolysis temperature of 750°C (Figure 2(e)). Additionally, the S1/TOC decreases from 0.105 mg/g TOC in the unheated sample to 0.039 mg/g TOC, with the pyrolysis temperature increasing up to 400°C. S1/TOC also increases from approximately 0.048 mg/g TOC to nearly 0.115 mg/g TOC and then drops to 0.037 mg/g TOC at a pyrolysis temperature of 750°C (Figure 2(f)).
The artificial maturation by pyrolysis reduces the TOC of the pyrolysis residues by 5.4% from the immature (EqRo = 0.48%) through the oil window to the overmature (EqRo = 4.05%), which is lower compared with the 30–50% TOC loss for type II kerogen source rocks over a similar maturity range (Baskin, 1997; Lewan et al., 2014). This finding shows that kerogen conversion considerably varies for similar kerogen types from different locations. This finding also suggests that the restoration of the original TOC content is fundamental for hydrocarbon potential estimation and resource assessment, especially for high to overmature shales.
Mineralogy evolution characteristics
The initial sample and solid residues contained brittle minerals (such as quartz, feldspar, and dolomite) and clay minerals (such as smectite, illite–smectite, illite, and chlorite). The samples also contained other ingredients. In the simulation process, the mineral composition of the sample did not change before 550°C, and the feldspar disappeared after the 600°C (Table 2).
Mineralogical compositions of the initial sample and its solid residues at different pyrolysis temperatures.
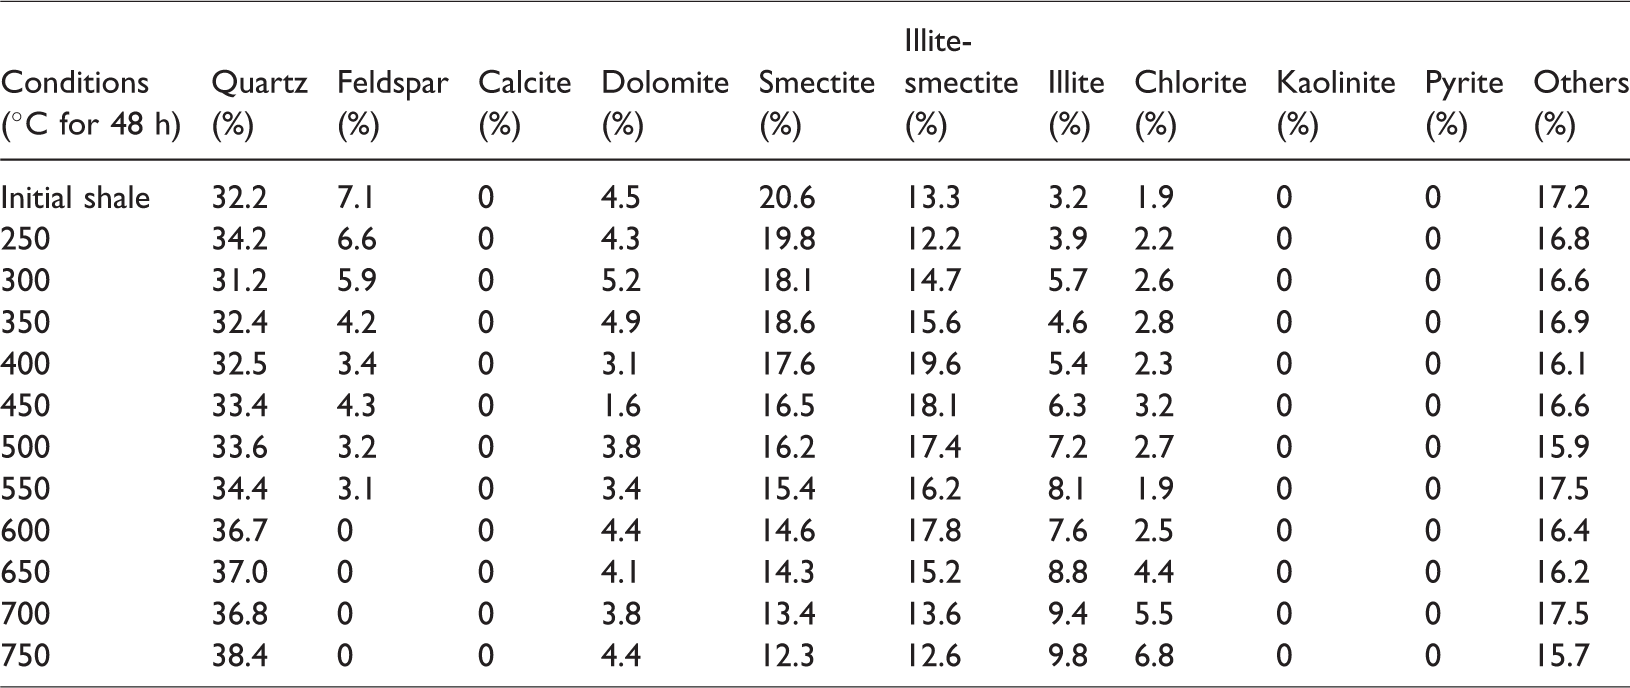
With the increase in the thermal simulation maturity, the quartz content generally presents an increasing trend. However, some individual simulations do not conform to this change rule, such as that at 250°C (Figure 3(a)). The content of feldspar gradually decreases to 0 at 550°C (Figure 3(b)). The content of dolomite shows a fluctuating pattern, with the lowest content at 450°C (Figure 3(c)). However, the smectite content demonstrates a continuously decreasing trend (Figure 3(d)). Illite–smectite is generally characterized by increases and decreases (Figure 3(e)). Illite presents a continuous increase in regularity (Figure 3(f)). The content change of chlorite is not evident in the initial stage of simulation but gradually increases after 550°C (Figure 3(g)).
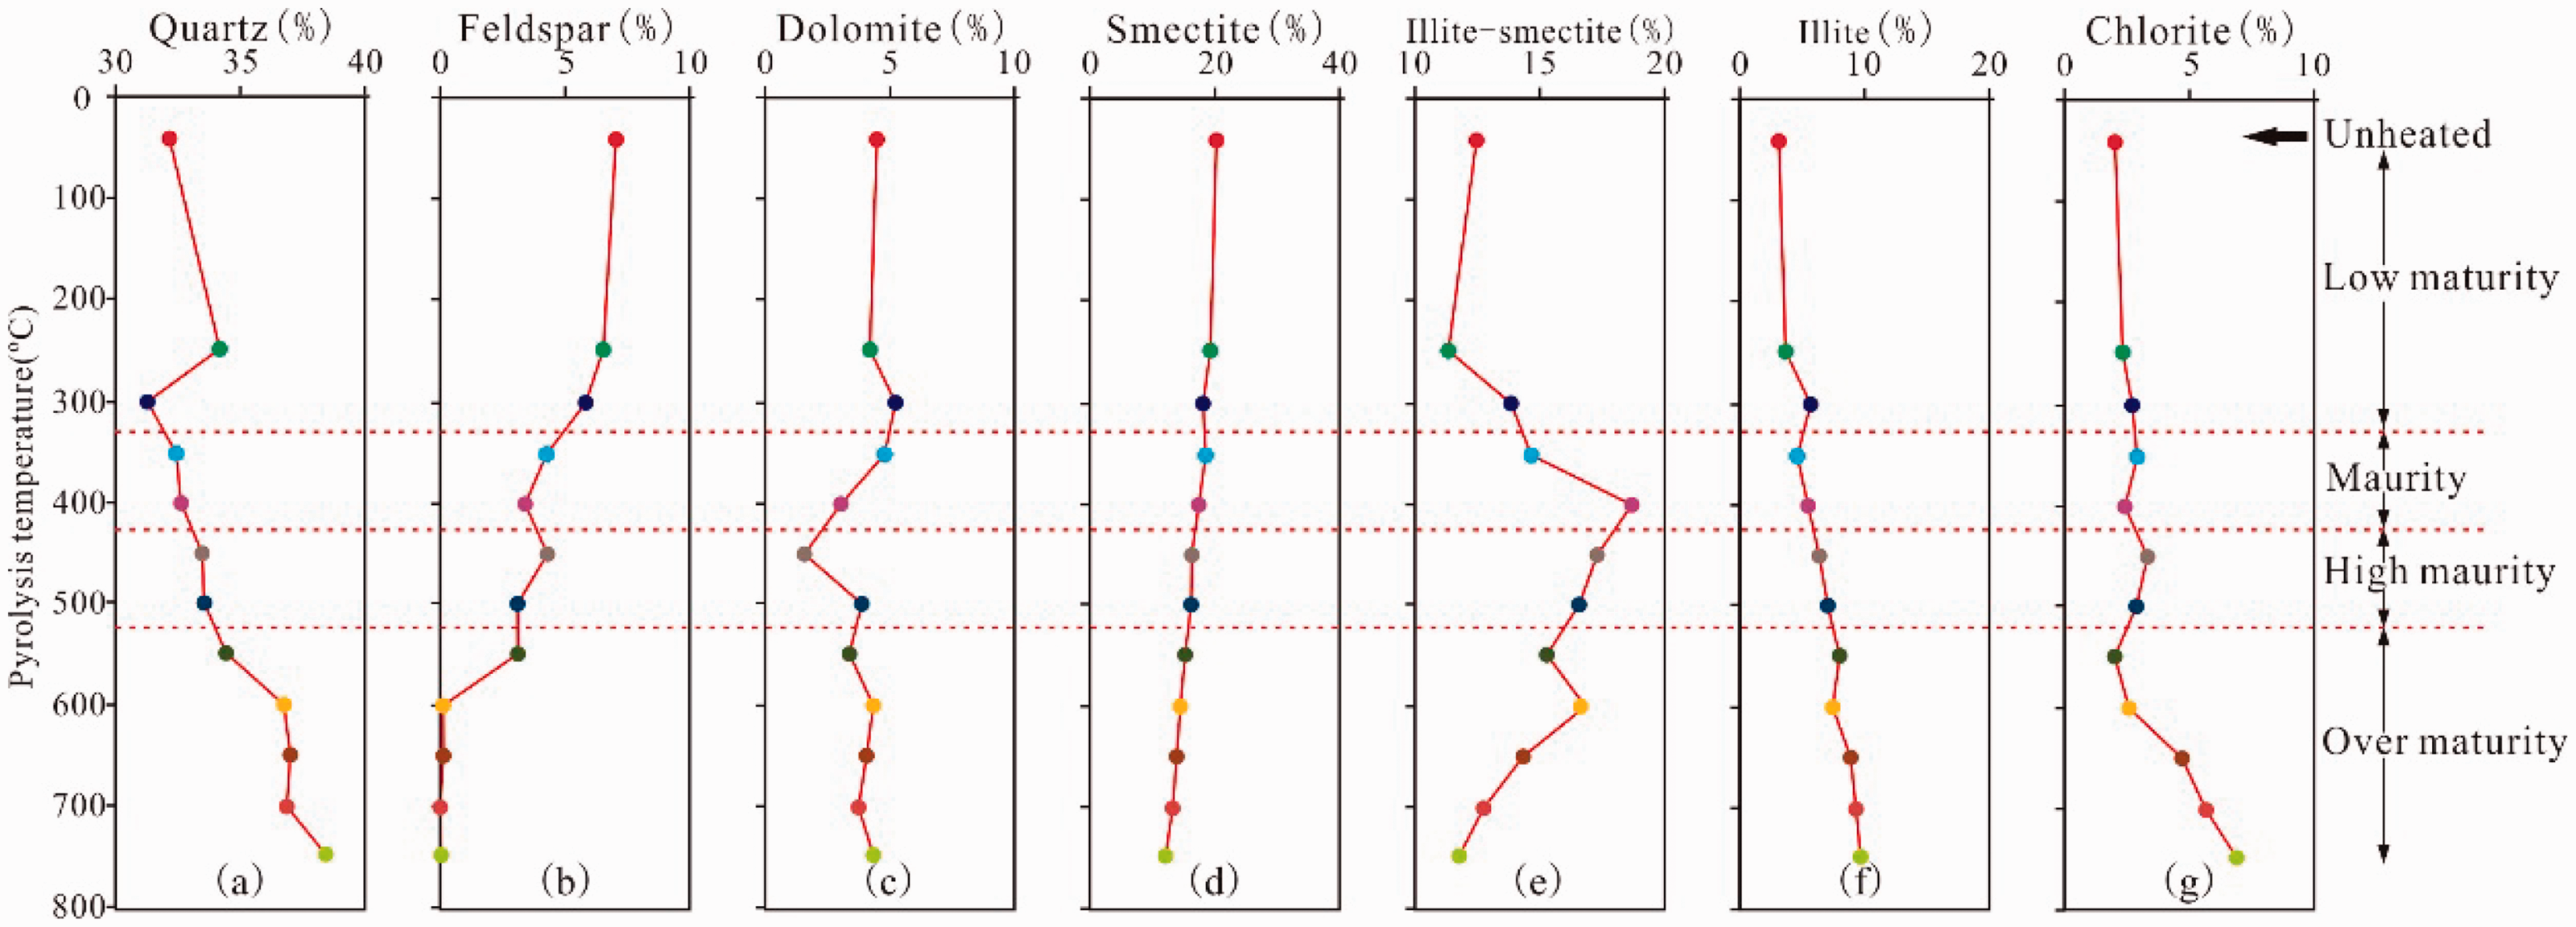
Variations in mineral composition and content for the unheated oil shale and its pyrolyzed aliquots plotted with the pyrolysis temperature for 48 h duration. (a) Quartz (%), (b) Feldspar (%), (c) Dolomite (%), (d) Smectite (%), (e) Illite–smectite (%), (f) Illite (%), and (g) Chlorite (%).
In a closed system, as the simulation temperature gradually increases, some clay minerals in the shale gradually become unstable; in particular, a large amount of crystal water contained in smectite can be dehydrated. With the combination of kerogen pyrolysis or degradation produced by water and organic acids or phenols, it begins to transform to a stable clay mineral (Chuhan et al., 2000; Huang et al., 2009a, 2009b; Shi et al., 1994). Owing to a large amount of initial smectite and feldspar in the shale sample, a couple of interdependent associated reactions should exist in the thermal simulation of shale (Chuhan et al., 2000; Huang et al., 2009a, 2009b; Shi et al., 1994; Wu et al., 2005):


Reaction (1) occurs relatively easily to convert feldspar into kaolinite and silicon and produce K+ under acidic conditions. Reaction (2) is a spontaneous endothermic reaction of low energy consumption, which easily occurs when a large amount of K+ is provided in the reaction (1), facilitating the conversion of smectite into illite. Although increasing the temperature is easy, it can accelerate the conversion rate of smectite to illite, thereby contributing to the increase in the feldspar dissolution rate and the release of additional K+. In a reaction environment without adequate K+, reaction (3) will be conducted as a response; in a reaction under an environment with numerous K+, reaction (4) will be performed in response to prompt the conversion of unstable minerals in the shale, such as smectite, feldspar, kaolinite, and some other minerals, into stable minerals, such as illite and siliceous (Chuhan et al., 2000; Ghanizadeh et al., 2014; Huang et al., 2009b; Wu et al., 2005).
According to the research of Huang et al. (2009), the dissolution of feldspar and the illitization of kaolinite are important reactions to each other’s dependence, and the reaction is a typical volume reduction reaction. According to reaction (3), the rock will have a solid volume decrease of 22.304 cm3/mol, the reaction process will generate approximately 10.7% of the extra space, and the reaction can continue and form secondary pores as long as feldspar or kaolinite are not consumed. Given that the content of feldspar in the original sample (7.1%) is larger than that of kaolinite (0), the kaolinite produced in reaction (1) is all dissolved and converted into illite, resulting in 0 kaolinite content in the sample. In addition, the large number of Ca2+ provided by reaction (2) is the cement for dolomite and chlorite and is especially important as the material source of the ankerite cement.
Therefore, due to the presence of reactions (1)–(4), the smectite gradually dehydrates and dissolves the feldspar in the conditions of organic acid or phenol produced in kerogen. Smectite then forms kaolinite precipitation, producing a quartz secondary increase and converting smectite to illite–smectite and then to illite. The deposition of kaolinite will also be gradually converted to illite under the influence of feldspar. Therefore, in Figure 3, the content of quartz (quartz) is gradually increasing and the content of feldspar gradually decreases to 0. The content of smectite reduces, and the mineral content of illite–smectite increases and then decreases. The content of stable minerals, such as illite and chlorite, gradually increases, while that of kaolinite is always 0 in shale. Therefore, as the simulation temperature increases, the organic matter gradually generates organic matter pores, and reactions (1)–(4) are the spontaneous absorption and reduction of volume. Under the action of organic acids and phenol dissolution fluid produced by organic matter, the soluble minerals in the oil shale will be dissolved, and the pores of the inorganic dissolution will be produced; thus, the formation, development, and evolution of secondary dissolution pores will be promoted.
Porosity evolution characteristics with increasing thermal maturity
Response of CO2 and N2 adsorption isotherms to thermal maturity
Figure 4 provides an overview on the CO2 isotherms of the initial shale and the solid residues, which correspond to type I isotherms as defined by International Union of Pure and Applied Chemistry (IUPAC), indicating the existence of numerous micropores in the shale. The pores in the shale are mainly one-end closed pores or plate-like particles (Rouquerol et al., 1994; Singh et al., 1985). Moreover, the CO2 adsorption content of the samples at P/P0 around 0.03 is 1.12–4.71cm3/g, showing the lowest value at the oil generation peak (350°C) lower than that of the unheated sample. The CO2 adsorption content then presents an increasing trend with the rise of the temperature after 400°C. This increase can be due to the generated oil, which would clog the pore and occupy the gas adsorption site during the process of raising the temperature from the unheated sample to the oil window at 350°C (EqRo = 0.86%), resulting in the reduction of the CO2 adsorption site and a decrease in the adsorption content. When the simulation temperature continued to increase and exceeded the oil generation peak, the oil generated by the shale was decreased and decomposed or cracked, and the gas adsorption site occupied by the oil was released. Therefore, the CO2 adsorption content gradually increased with the elevation in the simulation temperature after 350°C.
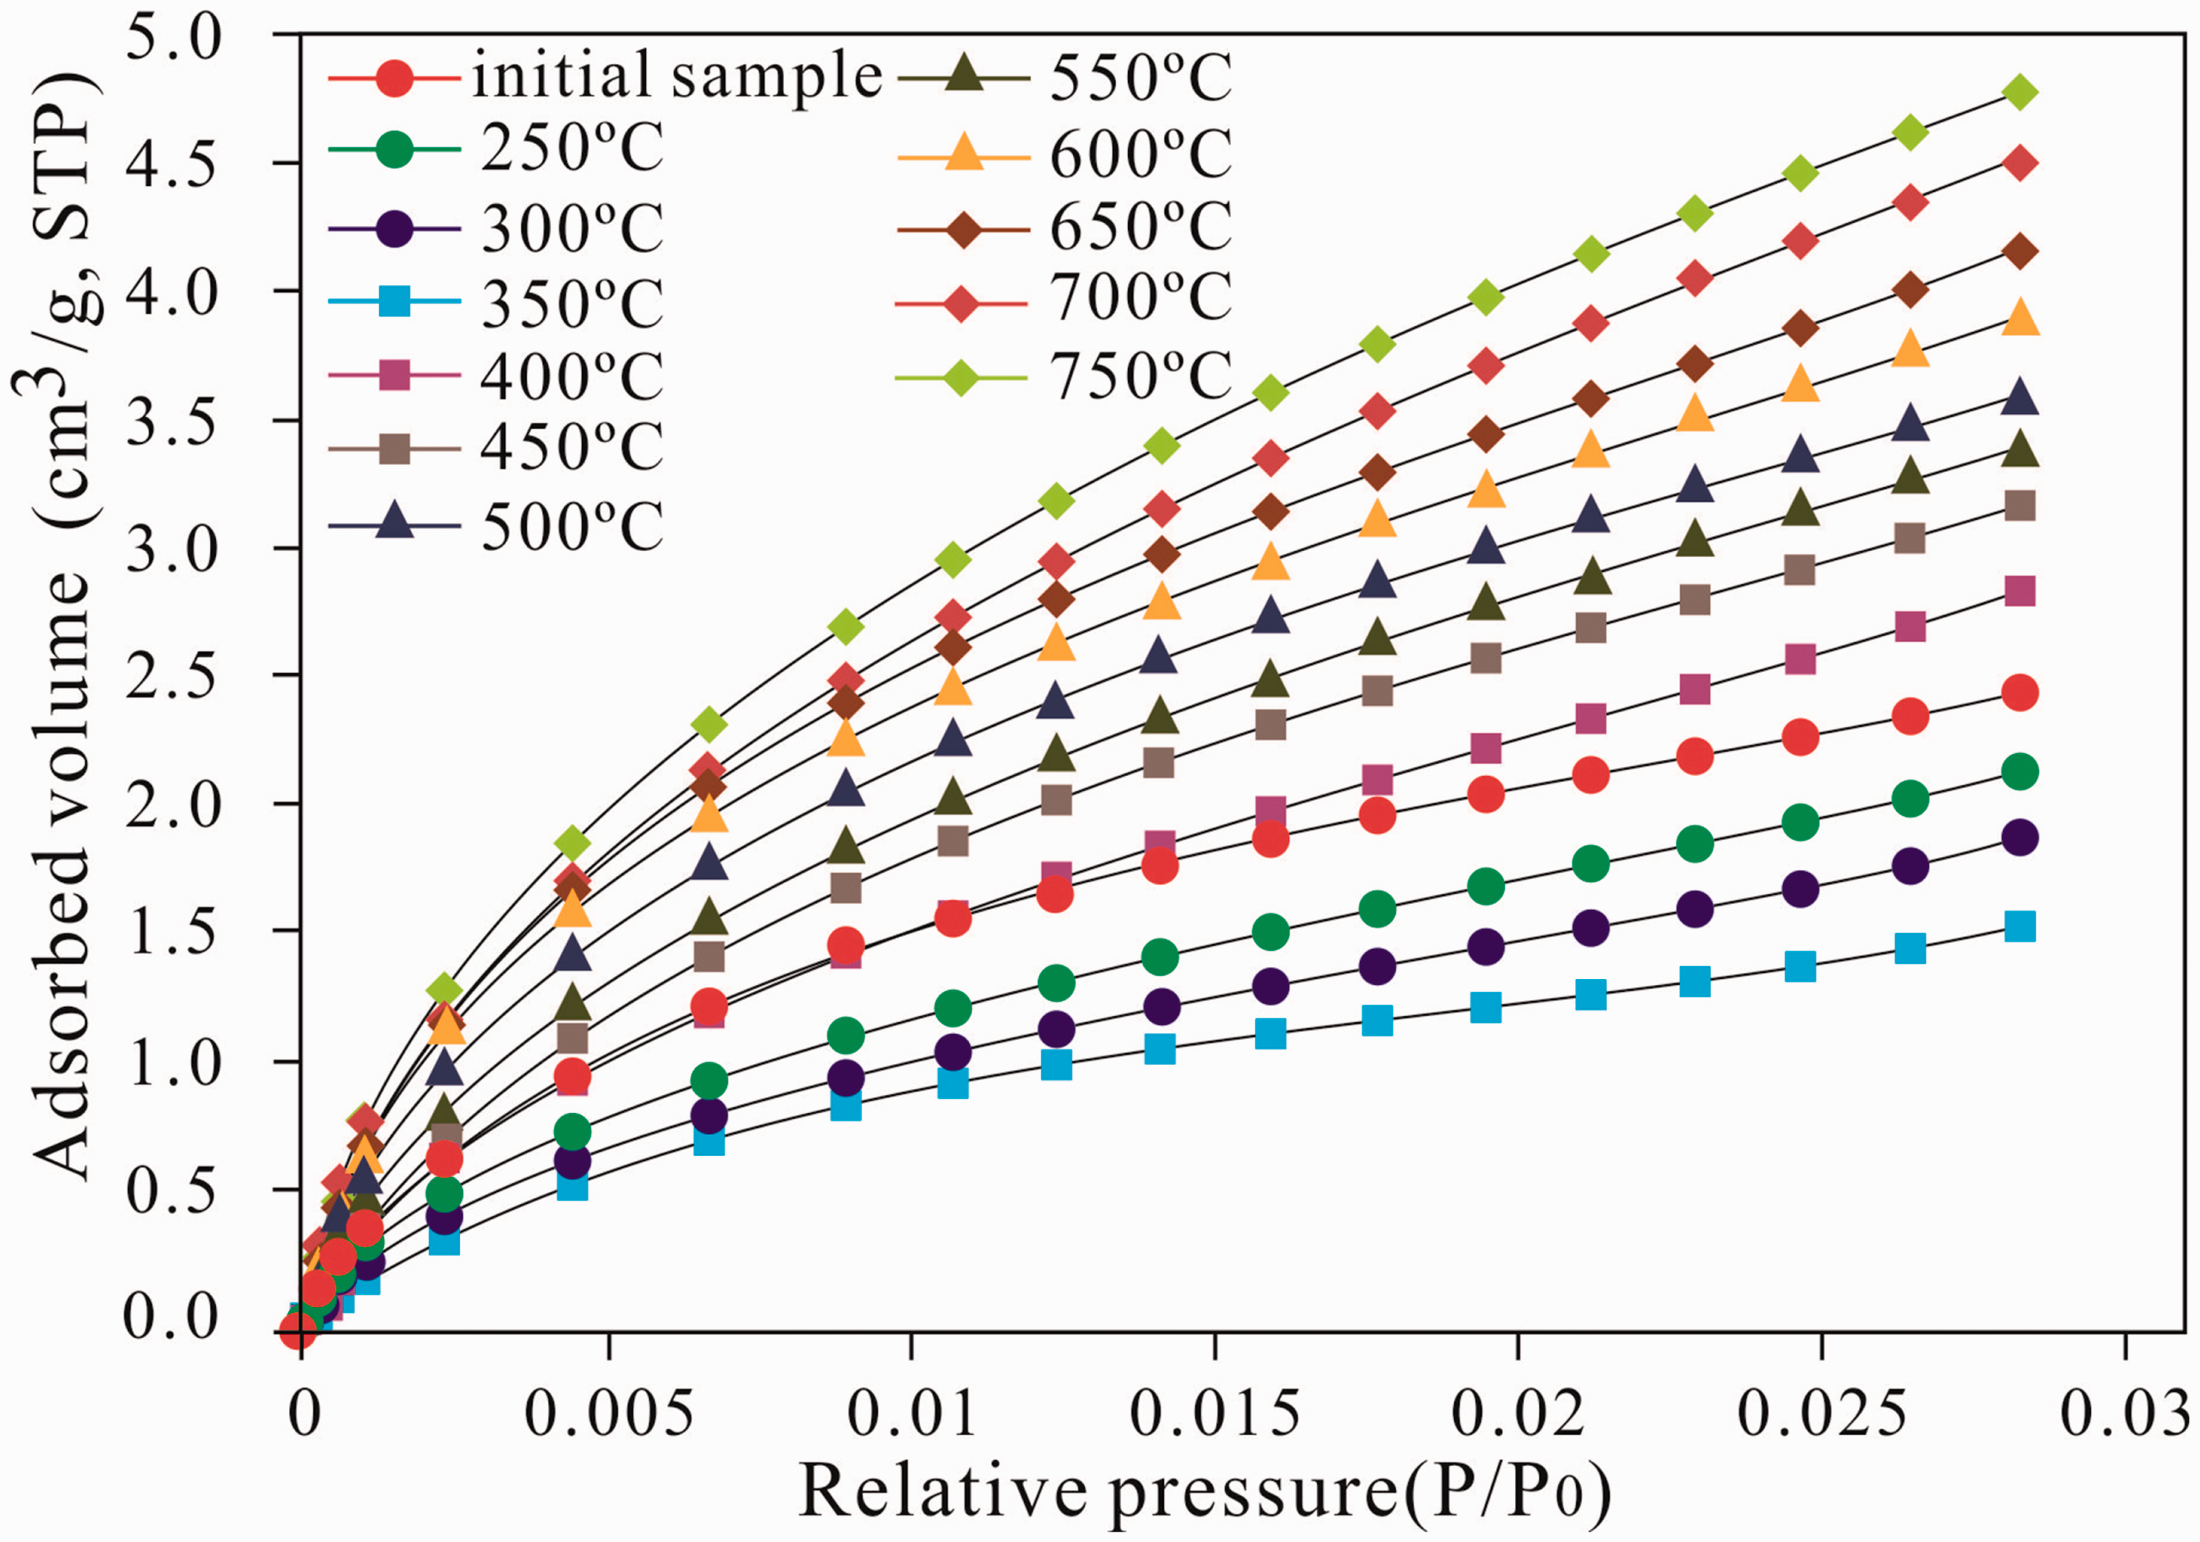
CO2 isotherms curve of the shale samples at different simulation temperature (273.1 K).
The N2 adsorption–desorption isotherms of the initial oil shale and the solid residuals show that the isotherm curves of the samples at different pyrolysis temperatures are characterized by their hysteresis loop, which corresponds to types II and IV isotherms, as defined by IUPAC. These curves are associated with capillary condensation occurring in the mesopore structures, and the hysteresis loop becomes noticeable as the maturity increases. The type II isotherm reflects the interior of the sample with closed micropores and is usually associated with the narrow slit-like pores. The type IV hysteresis is produced by wedge-shaped pores and indicates the presence of one end-closed and narrow throat pores in the samples. The shape of the hysteresis loop is also close to type H3, which is usually thought to be associated with aggregates of plate-like particles, leading to slit-shaped pores based on the interpretation of the IUPAC (Rouquerol et al., 1994; Singh et al., 1985).
The N2 isotherms at different temperatures show that (Figure 5) the hysteresis loop is not completely closed in the low-pressure part after the temperature exceeds more than 550°C(EqRo > 2.39%). which should be caused by swelling or microporous adsorption, and this phenomenon has also been reported by many previous scholars in their research (Mastalerz et al., 2008, 2012, 2013; Wei et al., 2018). At different simulation temperatures, a certain amount of N2 adsorption is observed when the relative pressure is less than 0.01, indicating the presence of micropores. The adsorption capacity increases with the temperature, suggesting that the number of micropores is increasing. As the simulation temperature increases, the amount of N2 adsorption of the unit mass sample gradually increases, showing that the total pore volume and surface area are also increasing.
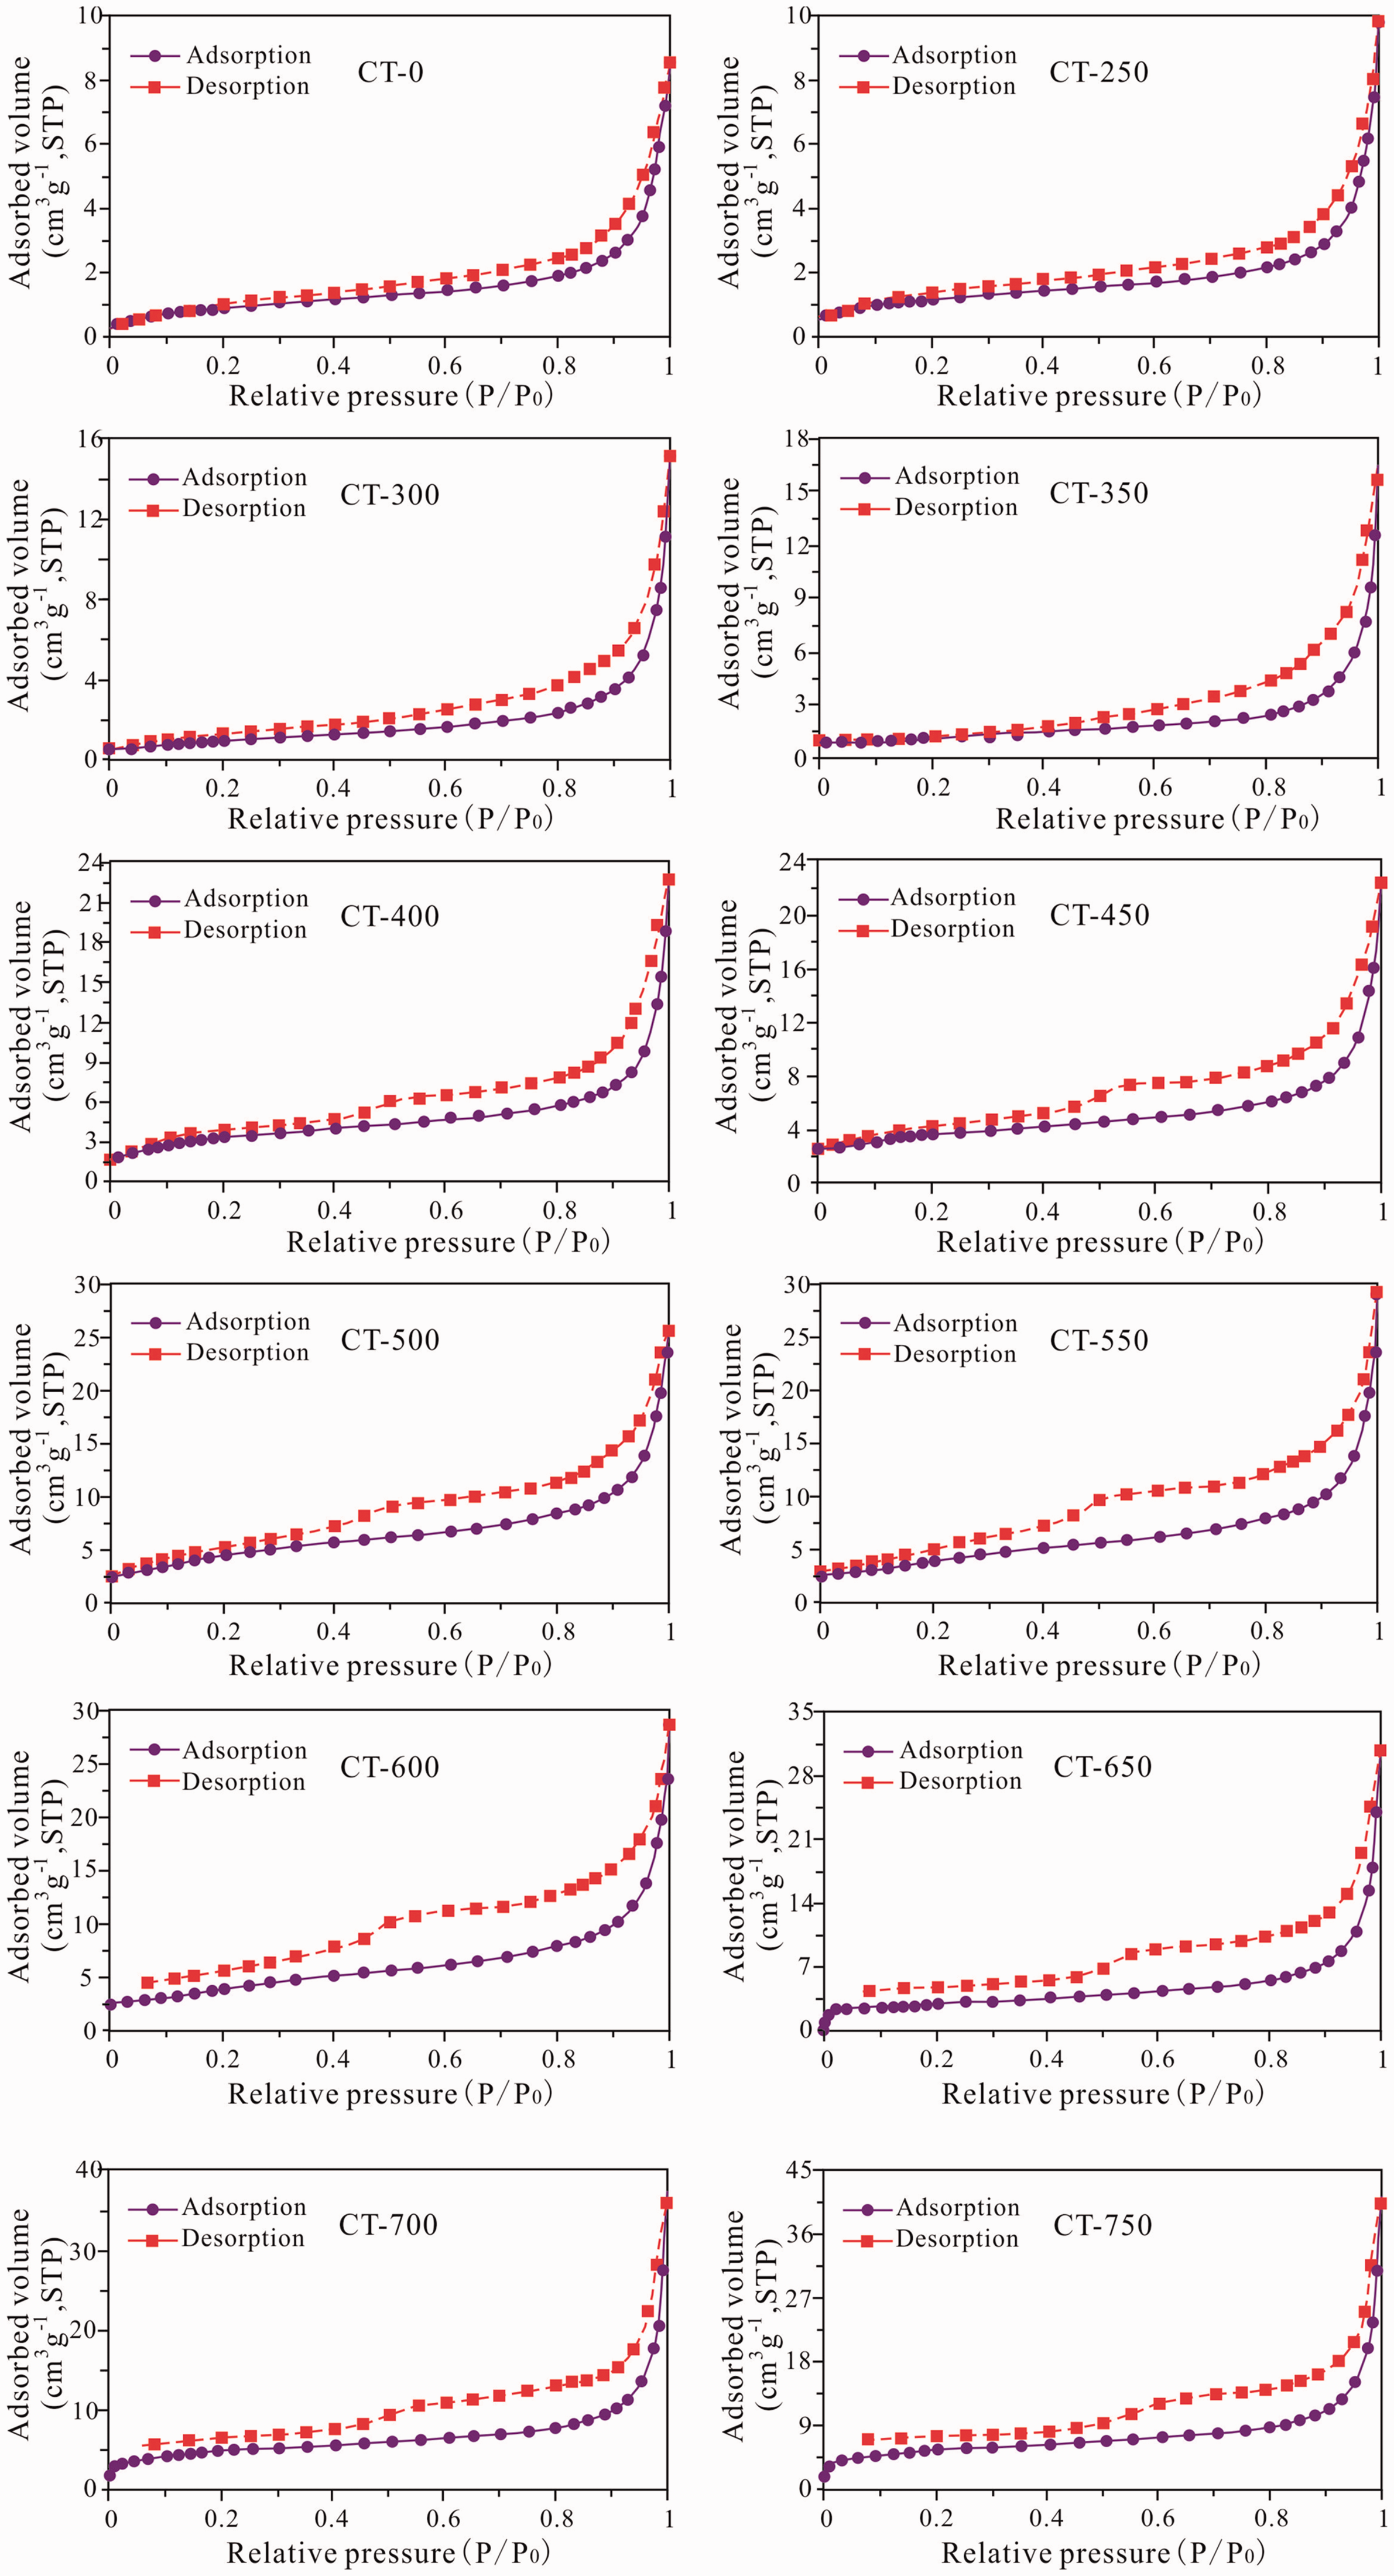
Nitrogen adsorption isotherms for oil shale with different simulation temperatures. CT-0 represents the original sample, and CT- 250, 300, 350, 400, 450, 500, 550, 600, 650, 700, 750 represents the different simulation temperature samples (77.4 K).
Moreover, the CO2 adsorption content exhibited an increasing trend compared with that of the unheated sample up to 750°C at a relative P/P0 of 0.03. The quantities adsorbed were 8.62, 9.91, 15.47, 16.33, 22.59, 23.28, 25.51, 29.28, 28.36, 30.44, 36.25, and 41.12cm3/g, which generally displayed a linear correlation with the pyrolysis temperature with a correlation coefficient (R2) of 0.86 (Figure 6(a)). The N2 amounts adsorbed at P/P0 around 0.996 showed an increasing trend at the unheated sample to 750°C. The quantities adsorbed were 2.41, 1.84, 2.26, 1.52, 2.81, 3.24, 3.62, 3.43, 3.81, 4.27, 4.52, and 4.71 cm3/g, which also have a positive correlation with the temperature with a correlation coefficient (R2) of 0.97 (Figure 6(b)). Therefore, the pyrolysis temperature, which can be viewed as an index of maturity in pyrolysis, reveals a positive role in increasing the pore content and promoting the formation, development, and evolution of pores.
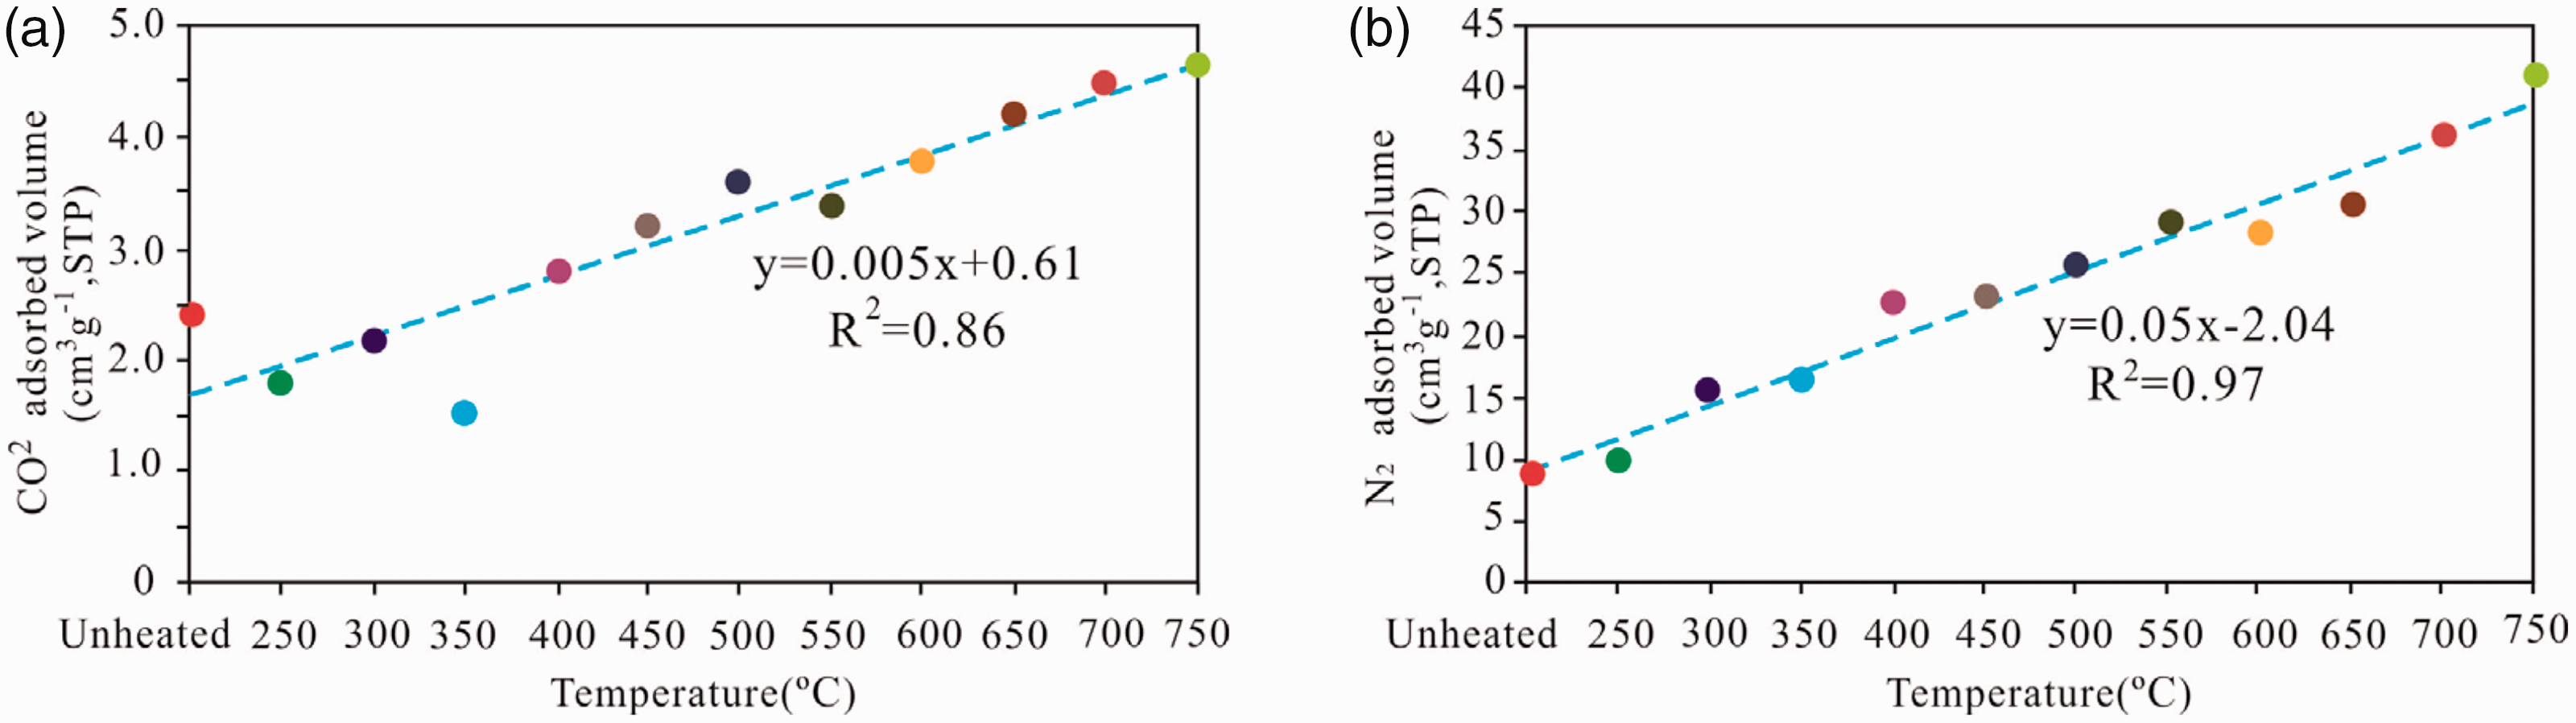
The relationship between the CO2 and N2 quantity adsorbed and the pyrolysis temperature of the oil shale.
Response of pore size distribution to thermal maturity
The cumulative pore volume and surface area of the sample vary under different simulation temperatures, along with the distribution of pore diameter. This finding shows that with increasing simulation temperature, pores with large diameters (>150 nm) considerably decreases (Figure 7), and cumulative pore volume and surface area demonstrate an increasing trend. The main contributors to the cumulative pore volume are the 50–100 nm diameter macropores and the 1–10 nm diameter micropores and mesopores, while the 1–10 nm diameter micropores and mesopores are the major contributors to the cumulative surface area. For the cumulative pore volume of 50–100 nm diameter macropores, in the cumulative pore volume and surface area of 1–10 nm diameter micropores and mesopores, the effect of temperature is more substantial than that of the other pores. In addition, from the initial samples to the solid residuals of 350°C, the pore structure changes and cumulative pore volume and surface area decrease with increasing temperature due to the filling porosity of pyrolysis productions. From the solid residuals of 350–650°C, the pore volume of macropores with diameters more than 150 nm decreases while that of macropores with diameters of 50–100 nm and 1–10 nm diameter micropores and mesopores increases, and the cumulative surface area of 1–10 nm diameter micropores and mesopores also increases. This finding indicates that the formation of 50–100 nm diameter macropores and 1–10 nm diameter micropores and mesopores stems from the decrease in the macropores with diameters larger than 150 mm. From 650°C to 750°C, mesopores and micropores appear to increase more substantially, which lend weight to the argument that the increased micropores and mesopores resulted from the disappearance of the macropores (diameter >150 nm).
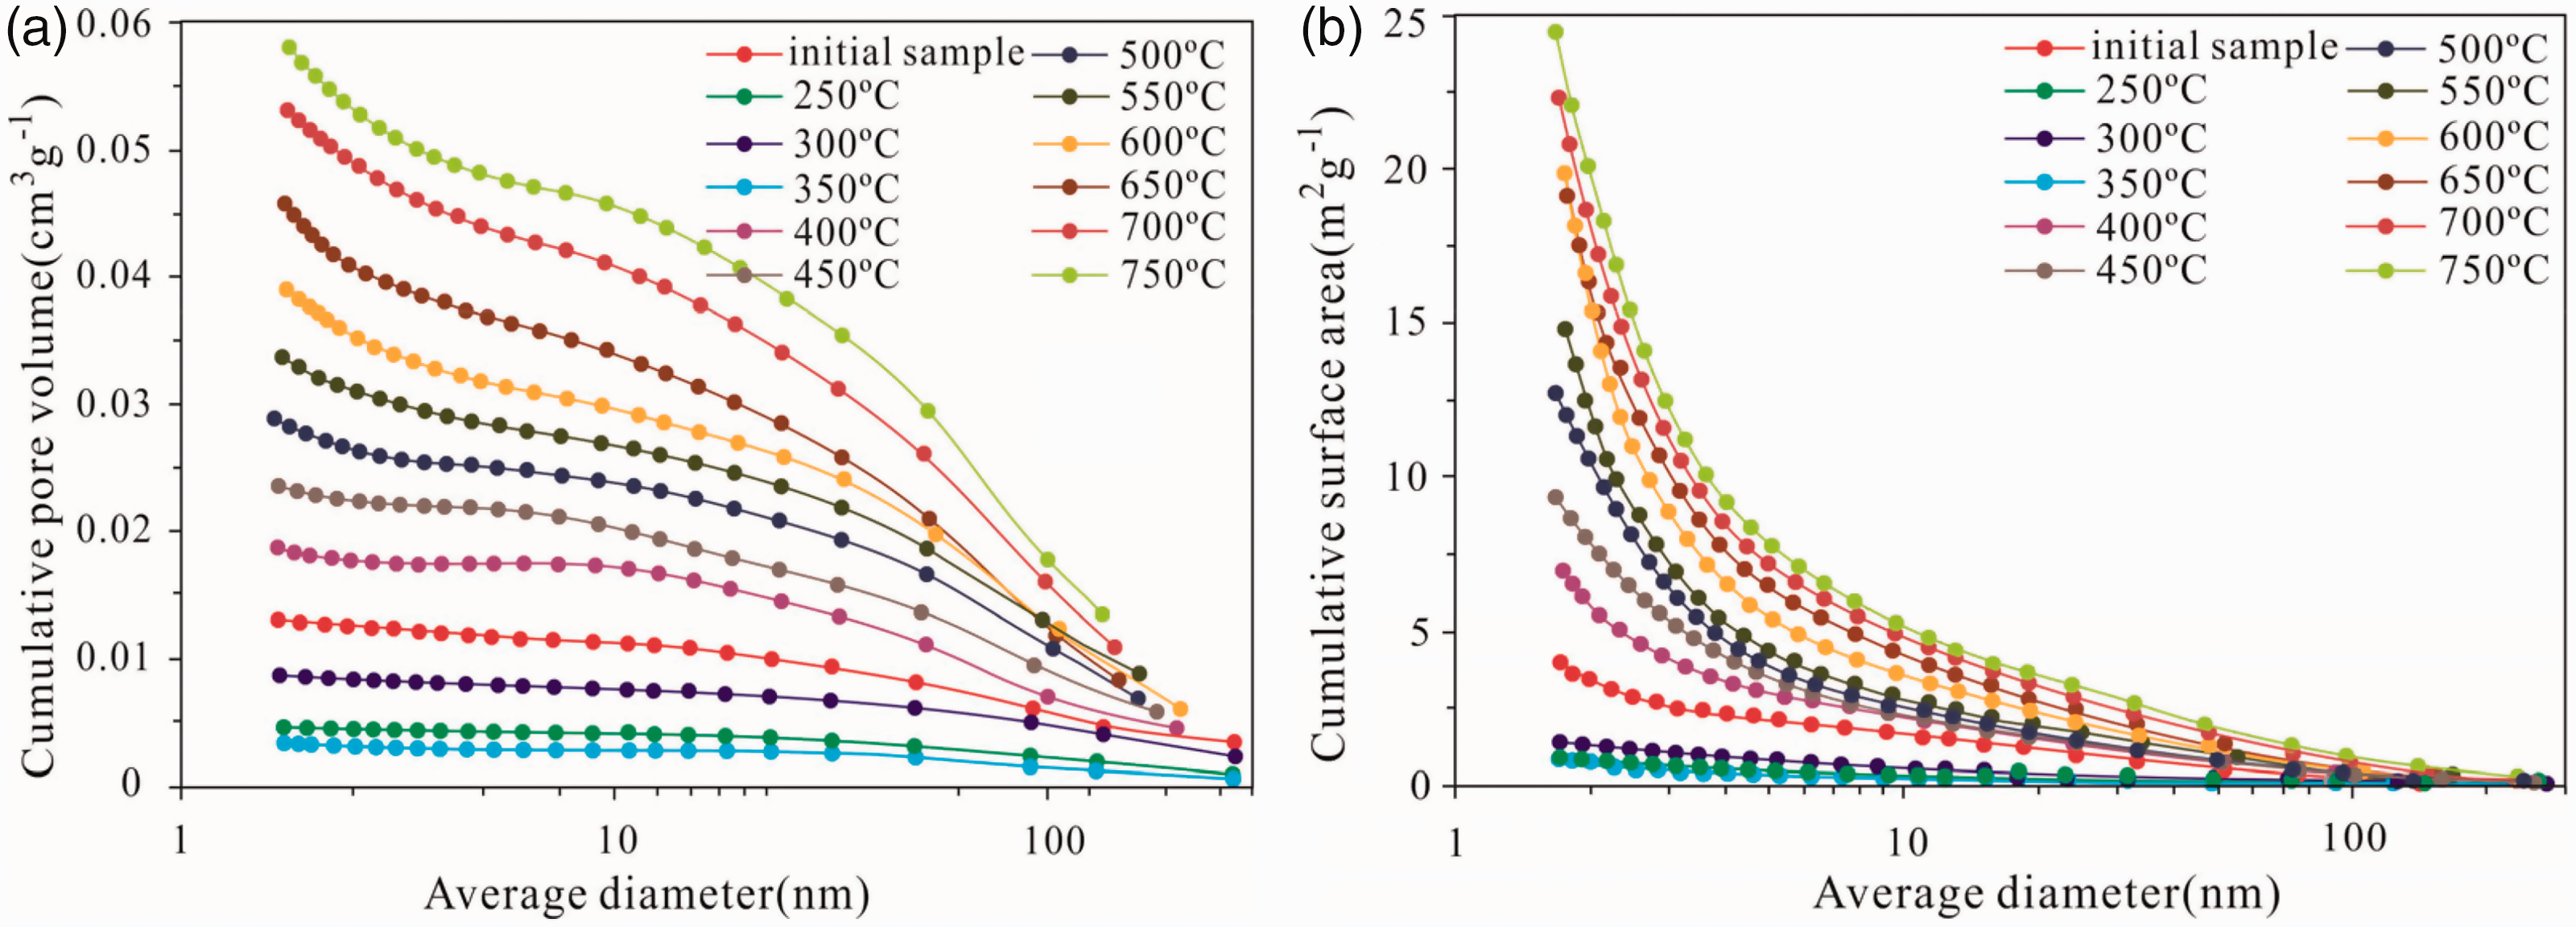
Cumulative pore volume (a) and cumulative surface area (b) for oil shale and pyrolysis products at different temperature.
With an increasing pyrolysis temperature, the cumulative BJH pore volume and cumulative BET surface area linearly increase with the pyrolysis temperature (Figure 8), and the coefficient indexes are 0.89 and 0.92, respectively, which indicates that the thermal maturation process increases the BJH total pore volume and surface area of shale residues. However, the average pore diameter and mean pore radius do not considerably change with increasing pyrolysis temperature (Figure 10), which suggests that new pores form with the pyrolysis of shales and the simulation temperature has a substantial effect on the development of the pores. With increasing simulation temperature, the organic carbon in the sample is constantly consumed in the continuous process of hydrocarbon generation (Figure 2(b)). The organic pore produced by hydrocarbon generation increases, the dissolution of organic acid is produced in the process of hydrocarbon generation, and the quantity and scale of secondary pores in minerals, such as intracrystalline pores, interparticle pores, crystal pores, and intraparticle pores, increase. Therefore, pyrolysis temperature plays an important role in promoting the development of pores.
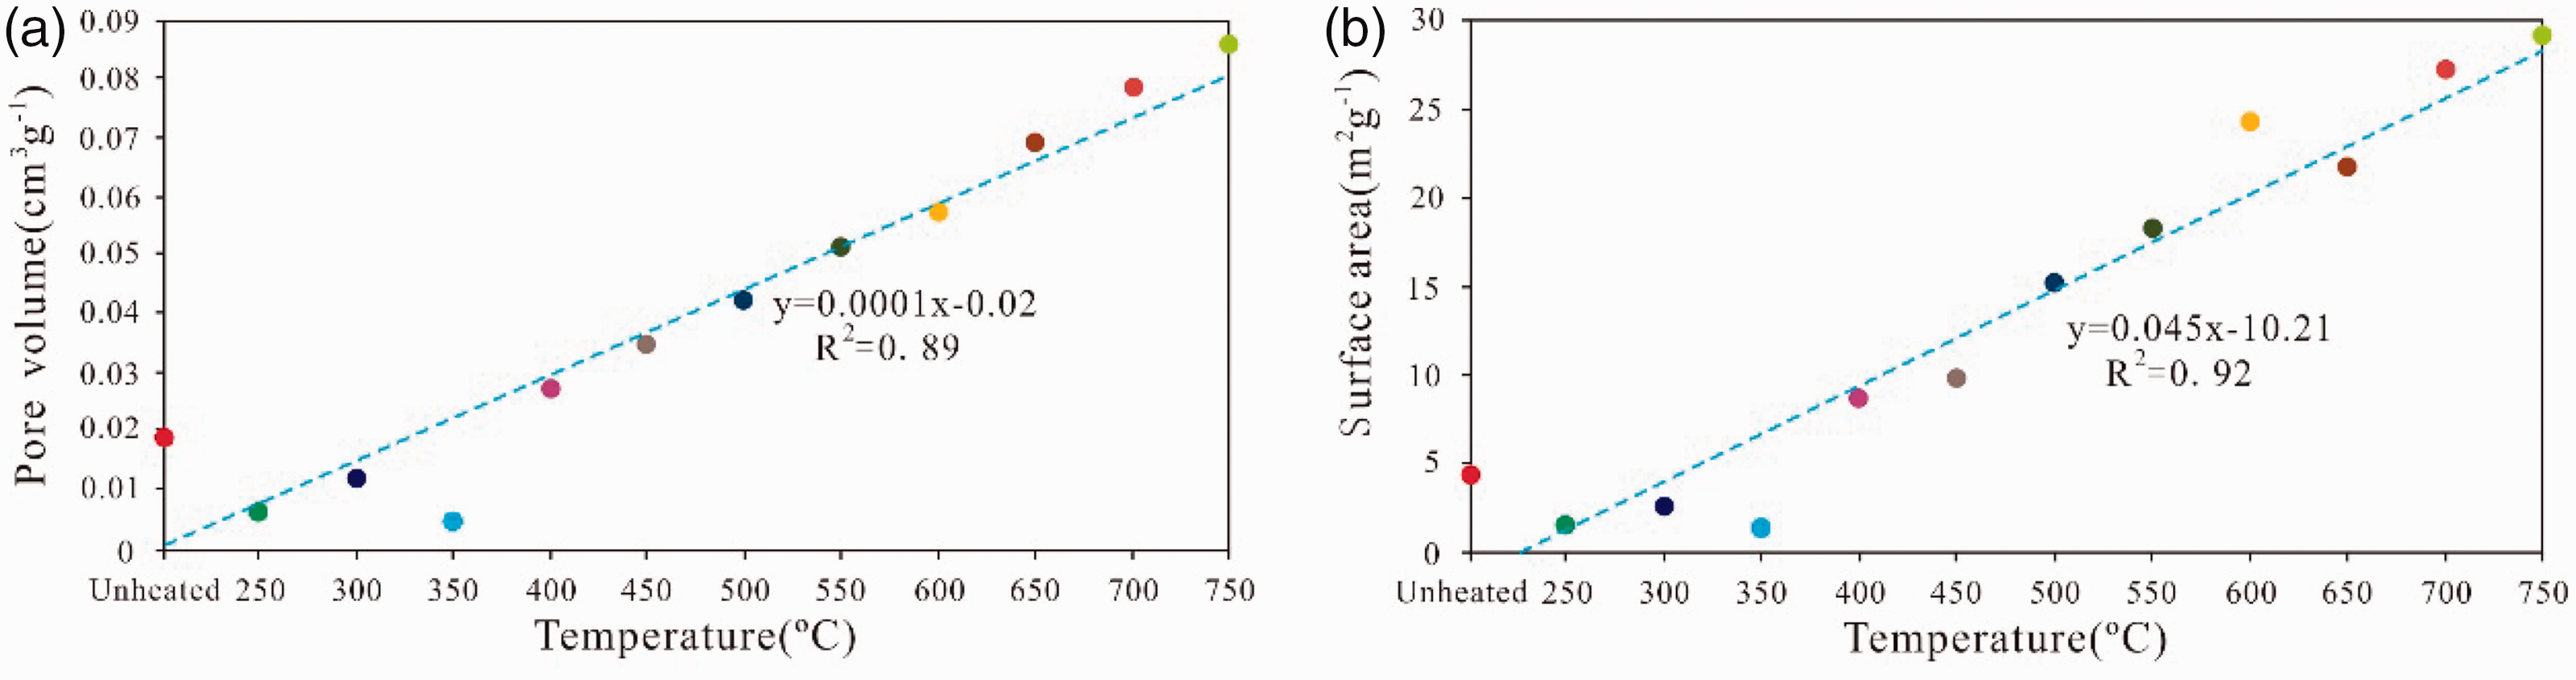
The relationship between the total pore volume and pyrolysis temperature (a), and the relationship between the total pore volume and pyrolysis temperature (b).
The pore volume and pore diameter distribution at different simulation temperatures indicate that the accessible pore volume versus the pore diameter of the samples has a bimodal distribution (except for 550°C). One maximum is attributed to small pore throats with diameters in the range of 1–10 nm and the other maximum is attributed to pore throats of 40 nm (Figure 9(a)). The 40-nm diameter macropores at 0–350°C contribute most of the pore volume, but the 1–10 nm diameter micropores and mesopores contribute less to pore volume. With the increasing simulation temperature from 350°C to 750°C, the proportion of pore volume contributed by 1–10 nm diameter micropores and mesopores increases. This phenomenon shows that the 1–10 nm diameter micropores and mesopores are rapidly increasing, and the effect of temperature on the 1–10 nm diameter pores is more substantial than that of the pore volume of 40 nm pores. The volume of the pores with an average pore width in the range of 1–10 nm considerably changes with the increasing pyrolysis temperature, while the volume change is less in the macropores with an average diameter >40 nm, indicating that macropores are not as sensitive as the micropores and mesopores to heating (Figure 9(a)). This finding can be attributed to the generation of micropores and mesopores with average pore widths of 1–10 nm rather than macropores with average diameters of >40 nm by the organic matter during hydrocarbon generation with increasing temperature. Hence, heating considerably affects the micropores than the macropores, and the newly generated pores are mostly of micropores and mesopores of thermal origin.
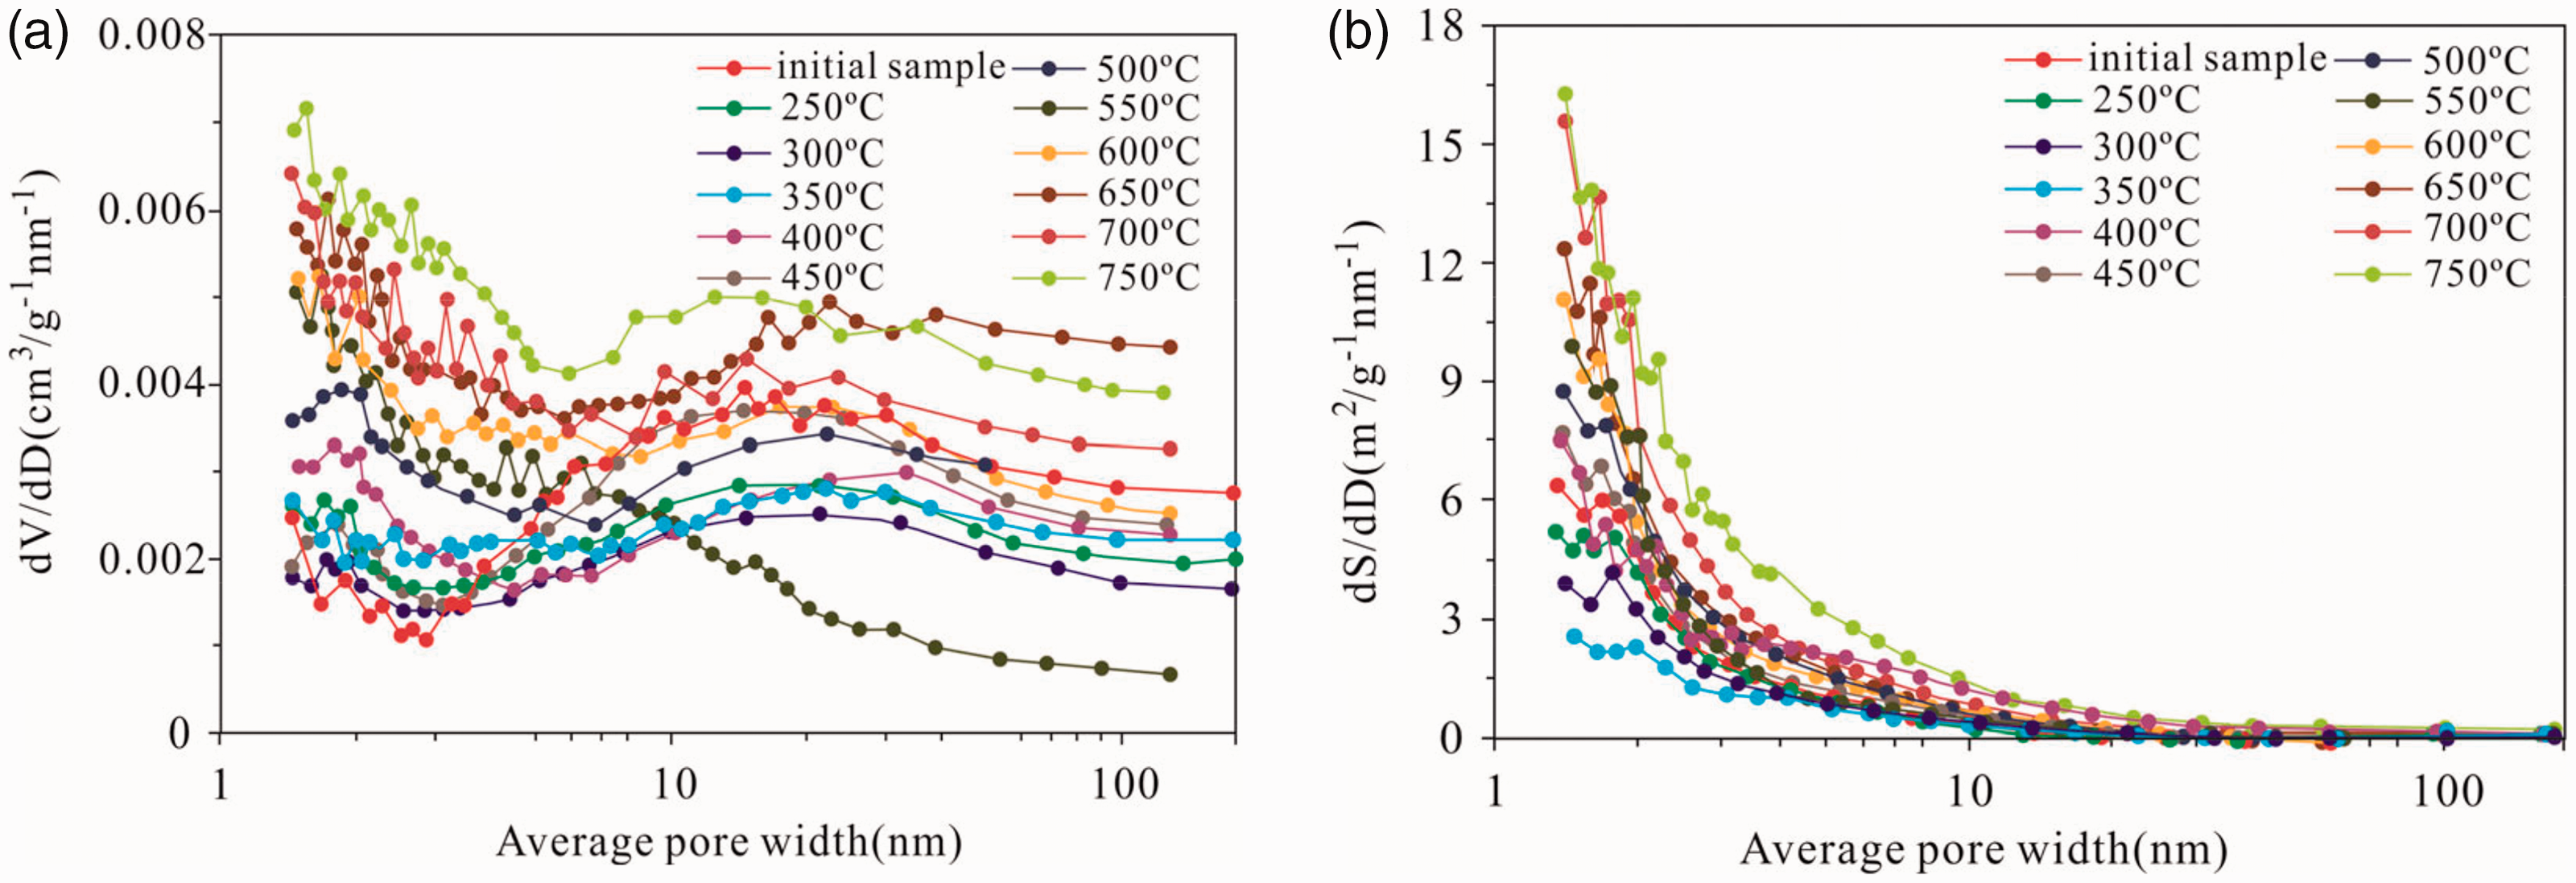
Pore volume (a) and surface area (b) distribution with pore size derived from the N2 adsorption branch for the isotherms of the initial shale and the solid residues using BJH model.
The BET pore surface area distribution analysis reveals that all the pyrolysis samples have a unimodal pore size distribution with a maximum of 1–10 nm diameter pores (Figure 9(b)). As the temperature rises, the 1–10 nm diameter micropores and mesopores contribute more to the pore surface area, indicating that the 1–10 nm diameter micropores and mesopores are the main contributors to surface area during the heating process. This finding could be because the pores generated in the oil shale are mainly organic pores (micropores) produced in the process of hydrocarbon generation by organic matter as the simulation temperature increases, and the 1–10 nm diameter micropores and mesopores are produced by organic acid dissolving minerals rather than the macropores exceeding 10 nm. Therefore, as the temperature rises, the surface area of the 1–10 nm diameter micropores and mesopores is well developed, and the surface area of the macropores is limited. The pore volume of 1–10 nm diameter micropores and mesopores considerably increase, but the pore volume of the macropores increases by a small amount.
The pore volume and surface area analysis results indicate that during pyrolysis, the newly formed pores are primarily micropores and mesopores instead of macropores. This finding was also indicated by the study on shale by Yang et al. (2013), in which focused ion beam milling and scanning electron microscopy (FIB-SEM), low-pressure N2 and CO2 adsorption and desorption analysis, and mercury intrusion were used to observe the enlargement of pore width from tens of nanometers to a few hundred nanometers with increasing thermal maturity for maturity levels above 0.9% EqRo. Klaver et al. (2012) also demonstrated the pores in early mature shale samples (EqRo was approximately 0.59–0.61%) are mostly crystallized mineral and clay-rich matrix pores, with only a small part derived from organic pores. The quantity of organic pores increases with thermal maturity. The pore size and alignment will considerably influence the permeability. Thermal maturity alters the pore distribution and the pore structure system, which has a substantial impact on the shale permeability (Ghanizadeh et al., 2014; Yang and Aplin, 1998).
Response of pore structure parameters to thermal maturity
The relationship among the average pore diameter, surface area, pore volume, and simulation temperature of oil shale samples is shown in Figure 10. The pore diameter of the macropores decreases from unheated to 350°C, reaching the lowest value at 350°C and then gradually increases. The aperture diameter range of the mesopores has a small change with increasing temperature; when it is increased from unheated to 350°C, the diameter range has a small increase, a small decrease, and then a minor increase. The pore diameter of the micropore is not evident with temperature and no considerable change is observed in the simulation.
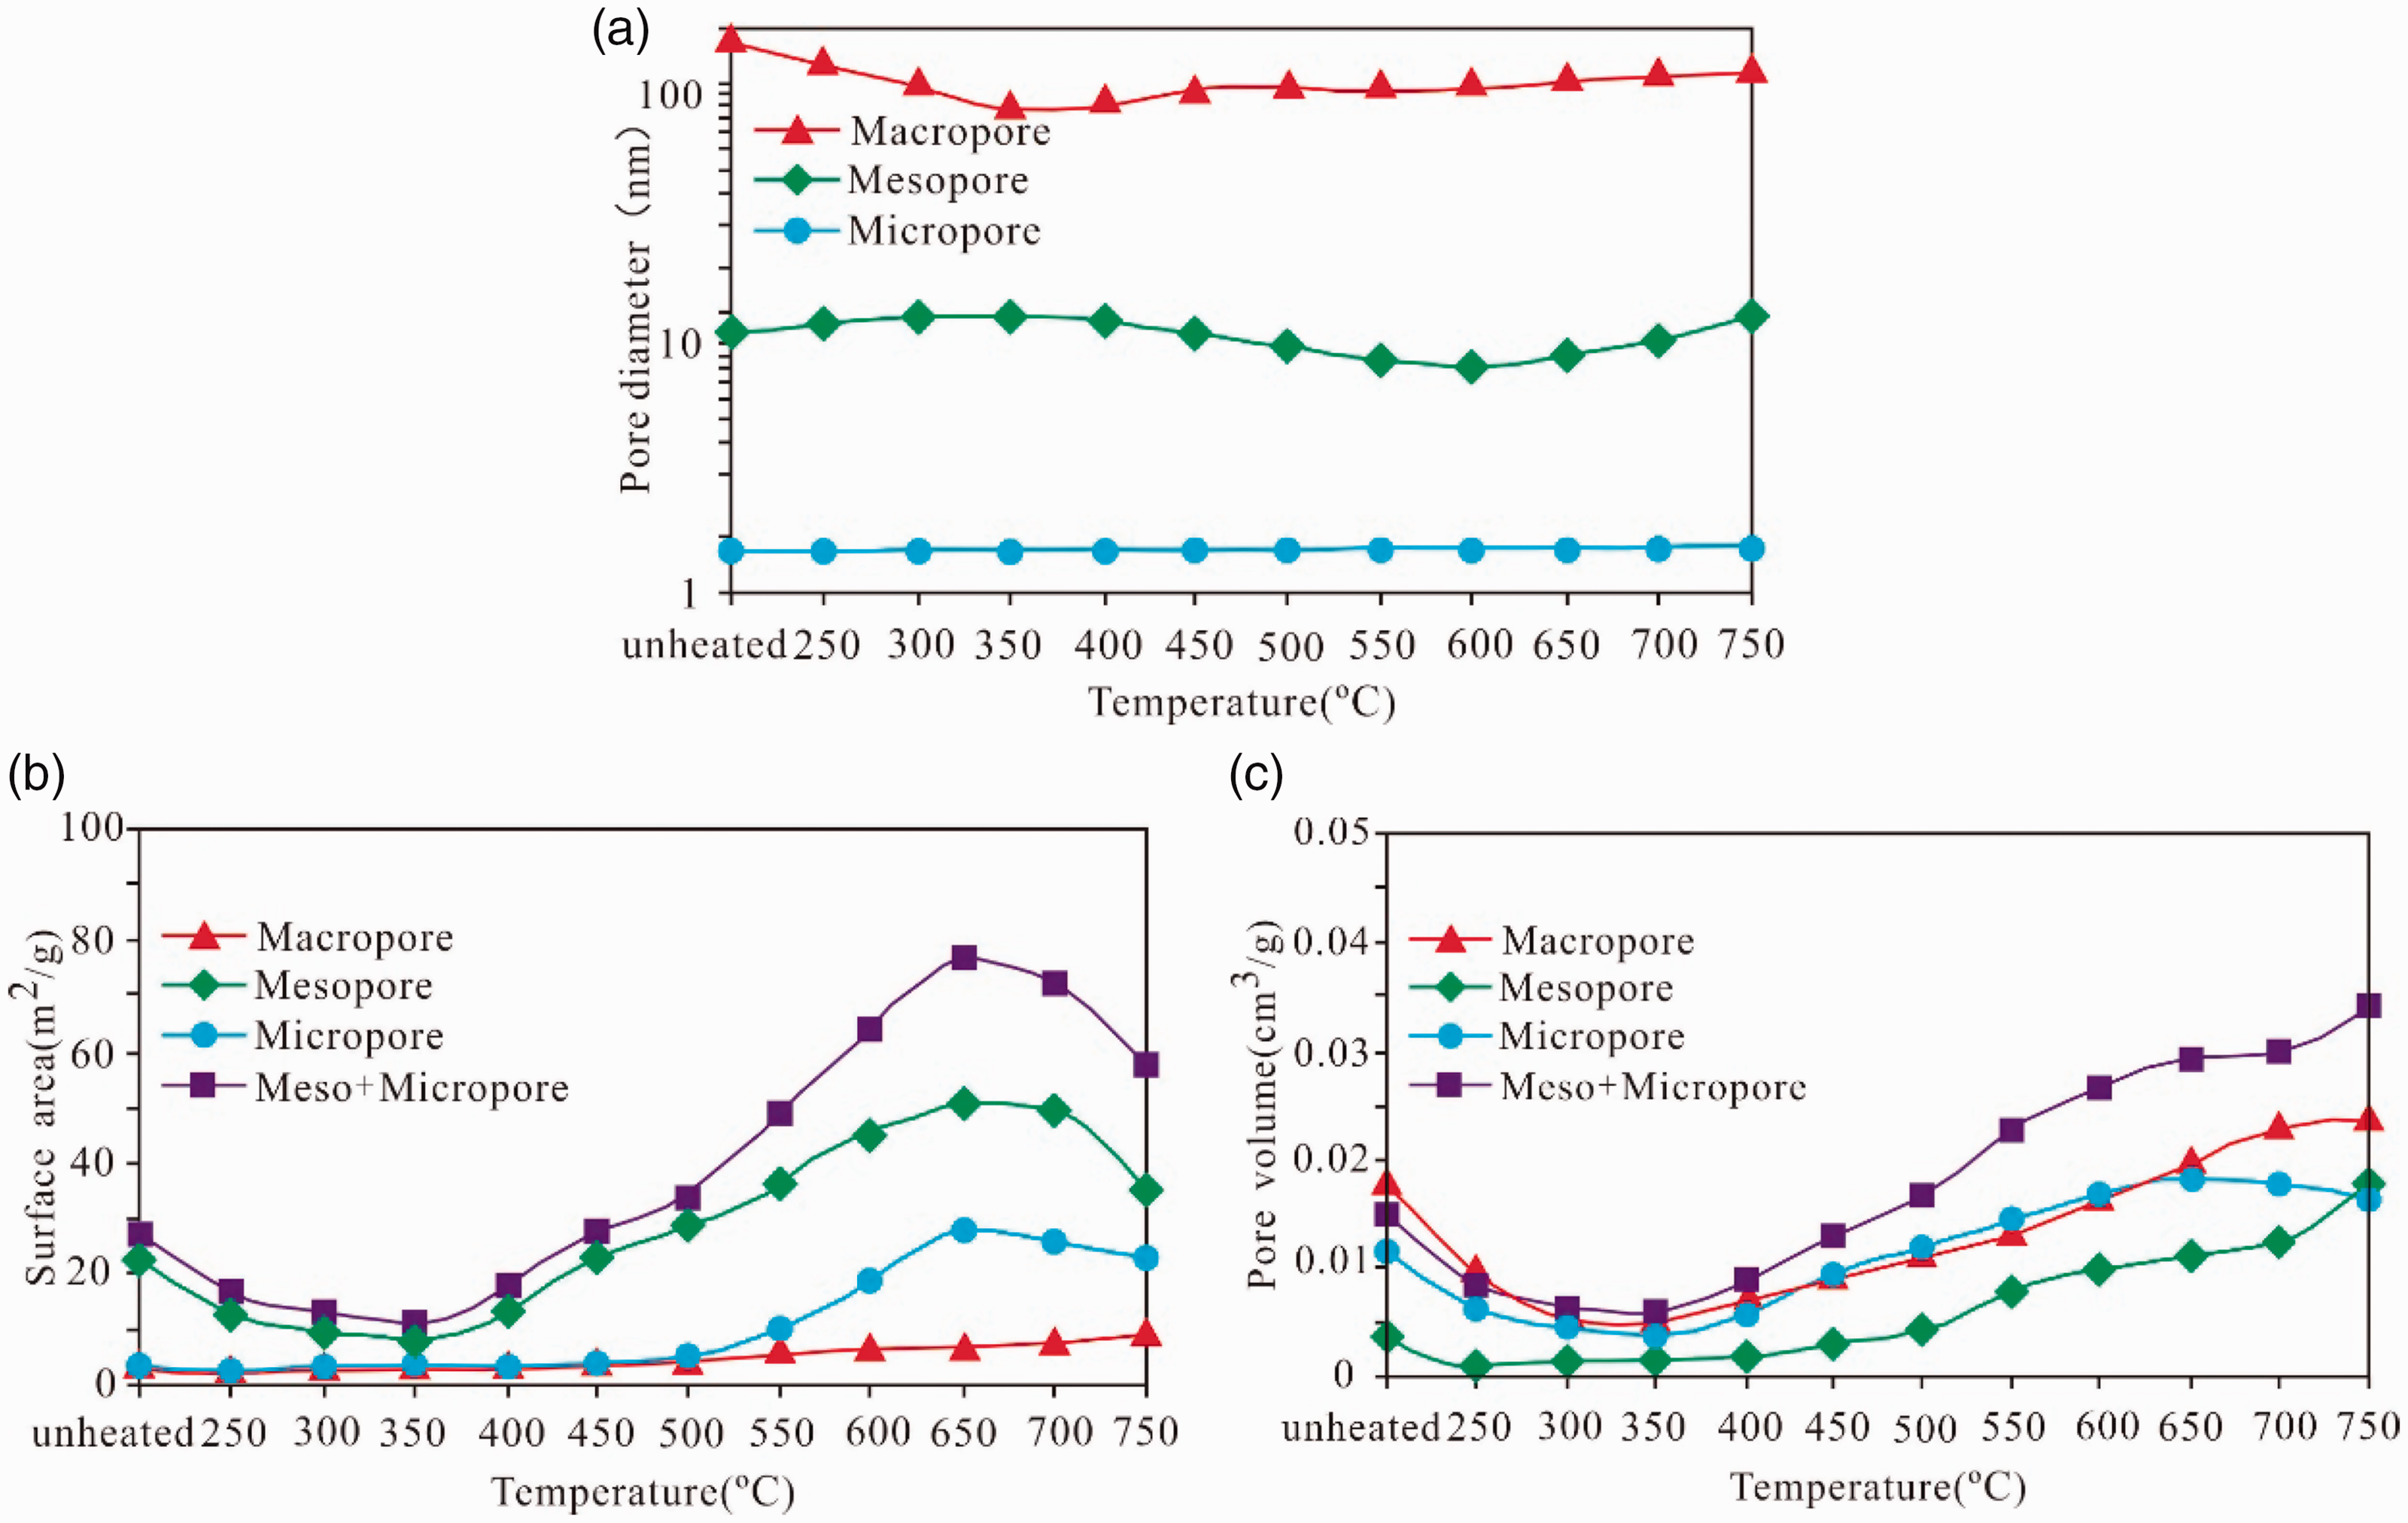
The pore diameter (a), surface area (b), pore volume (c) of the shale samples as function of thermal maturity as indicated by simulation temperature.
The surface area of the macropores slightly increases with the increase of the maturity, and the surface area of the mesopore shows a decreasing trend when it changes from unheated to 350°C, reaching the lowest value and gradually increasing at 350°C and reaching the maximum value and then decreasing at 650°C. The change of surface area of the micropore is not observed from unheated to 550°C, but an evident increase and a gradual decrease are found when the surface area is heated from 550°C to 650°C. The pore volume of the micropores, mesopores, and macropores reaches the lowest value at 350°C and then increases with rising temperature. The micropore volume considerably decreases at larger than 650°C, the pore volume of the mesopores and macropores increases, and the pore volume of micropores and mesopores continues to increase. During the high evolution stage, the following events occur: the transition of micropores to mesopores, the expansion of the diameter of mesopores, leading to decrease in micropore volume decrease, and the increase in the volume of the macropores and mesopores. Similarly, the surface area of the micropores and mesopores decrease while that of macropores increase (Figure 10).
Based on the results of the present study, according to the different simulation temperatures, the evolution of the pore structure of the gas shales can be roughly divided into pore adjustment stage(T < 350°C, EqRo < 0.86%), development stage (350°C < T < 650°C, 0.86% <EqRo < 3.28%), and conversion or destruction stage(T > 650°C, EqRo > 3.28%).
In the pore adjustment stage (T < 350°C, EqRo < 0.86%), the surface area and pore volume of micropores, mesopores, and macropores are decreasing in different amplitudes, and their surface areas and pore volumes are lower than those of the unheated samples. Before the peak of oil generation, some publications have reported that the surface area and pore volume of nano-sized pores in oil shale pyrolysis experiments were considerably reduced (Bai et al., 2012; Mastalerz et al., 2013; Tian et al., 2008). This reduction is due to the small quantities of secondary pores produced by the transformation of inorganic minerals in this phase. Moreover, the heavy components, such as oil and asphaltene, which are produced by the organic pyrolysis of the oil window, are adsorbed on the pore surfaces of the minerals and organic matter, and the pyrolysis products fill and occupy the pore spaces (Bai et al., 2012; Tian et al., 2008). Therefore, the pore diameter, surface area, and pore volume of micropores, mesopores, and macropores decrease with increasing temperature up to 350°C.
In the development stage of nanopores (350°C < T < 650°C, 0.86% < EqRo <3.28%), the surface area and pore volume of micropores, mesopores, and macropores in the samples increase with the growth of the simulation temperature. This finding is attributed to the increasing simulation temperature, which results in the hydrocarbon generation of organic matter to produce considerable amounts of organic pores. Unstable minerals in the oil shale, such as dehydrated smectite, when the collapse of the cambium produces a crystal hole and smectite and feldspar are dissolved by organic acids produced by organic hydrocarbon, enlarges the pore space. Before the peak of hydrocarbon generation, the oil and asphaltene and other heavy components generated by the organic matter have been released to expose the pore spaces occupied before the pyrolysis or cracking (Hill et al., 2003; Huang et al., 2009; Shi et al., 1994; Tian et al., 2008). Therefore, in this stage, the pore diameters of mesopores and macropores slightly increase, and the surface area and pore volume of micropores, mesopores, and macropores are also increased with the elevation in the simulation temperature.
In the nanopores transformation and destruction stage (T > 650°C, EqRo >3.28%), the surface area of the micropores and mesopores decreases and that of the macropores slightly increases, the micropore volume is slightly reduced and that of the mesopores and macropores increases, while the total volume (micropore volume plus mesopore volume) increases. When the shale enters a high maturity stage, the organic nanoscale pores can be transformed or destroyed under the conditions of further warming and supercharging. Under the conditions of this experiment, the nanometer pore diameter of the shale organic matter becomes large, and the process of micropores transiting to mesopores and mesopores transiting to macropores is present. Therefore, the surface area of the micropores and mesopores decreases while that of macropores increases. Moreover, the pore volume of the micropores decreases while that of the mesopores and macropores increases. In the actual geological condition, the nanopores of the organic matter may also be affected by the later compaction. Milliken et al. (2013) researched Marcellus shale and found that the preservation of organic porosity is related to the content of organic matter, and a reduction of organic nanoporosity occurs by compaction when the organic matter content exceeds a certain value (TOC > 5.5%), thereby reducing the total porosity of the shale.
Adsorption evolution characteristics with increasing thermal maturity
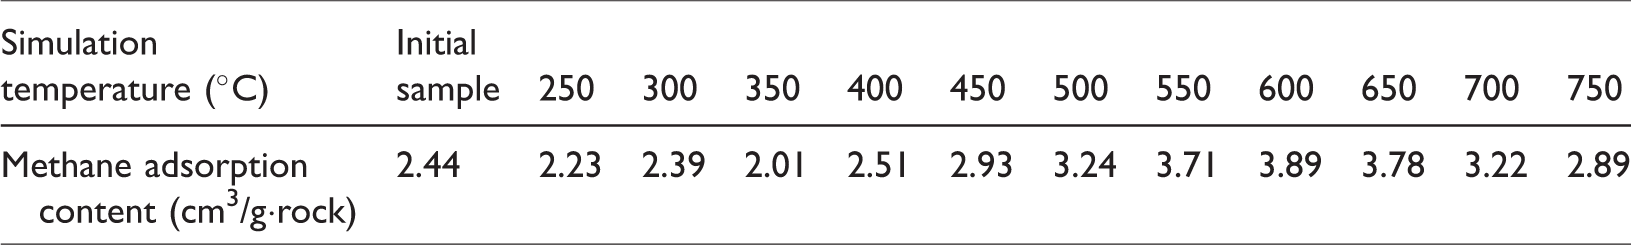
An isothermal adsorption experiment was performed on the initial oil shale and the solid residual to determine the influence of the maturity on the adsorption capacity of shale, and the methane adsorption content of the initial oil shale and the solid residual is 2.01–3.89 cm3/g·rock (Table 3). With increasing simulation temperature, the methane adsorption content of the oil shale showed different lifting trends at the different stages (Figure 11).
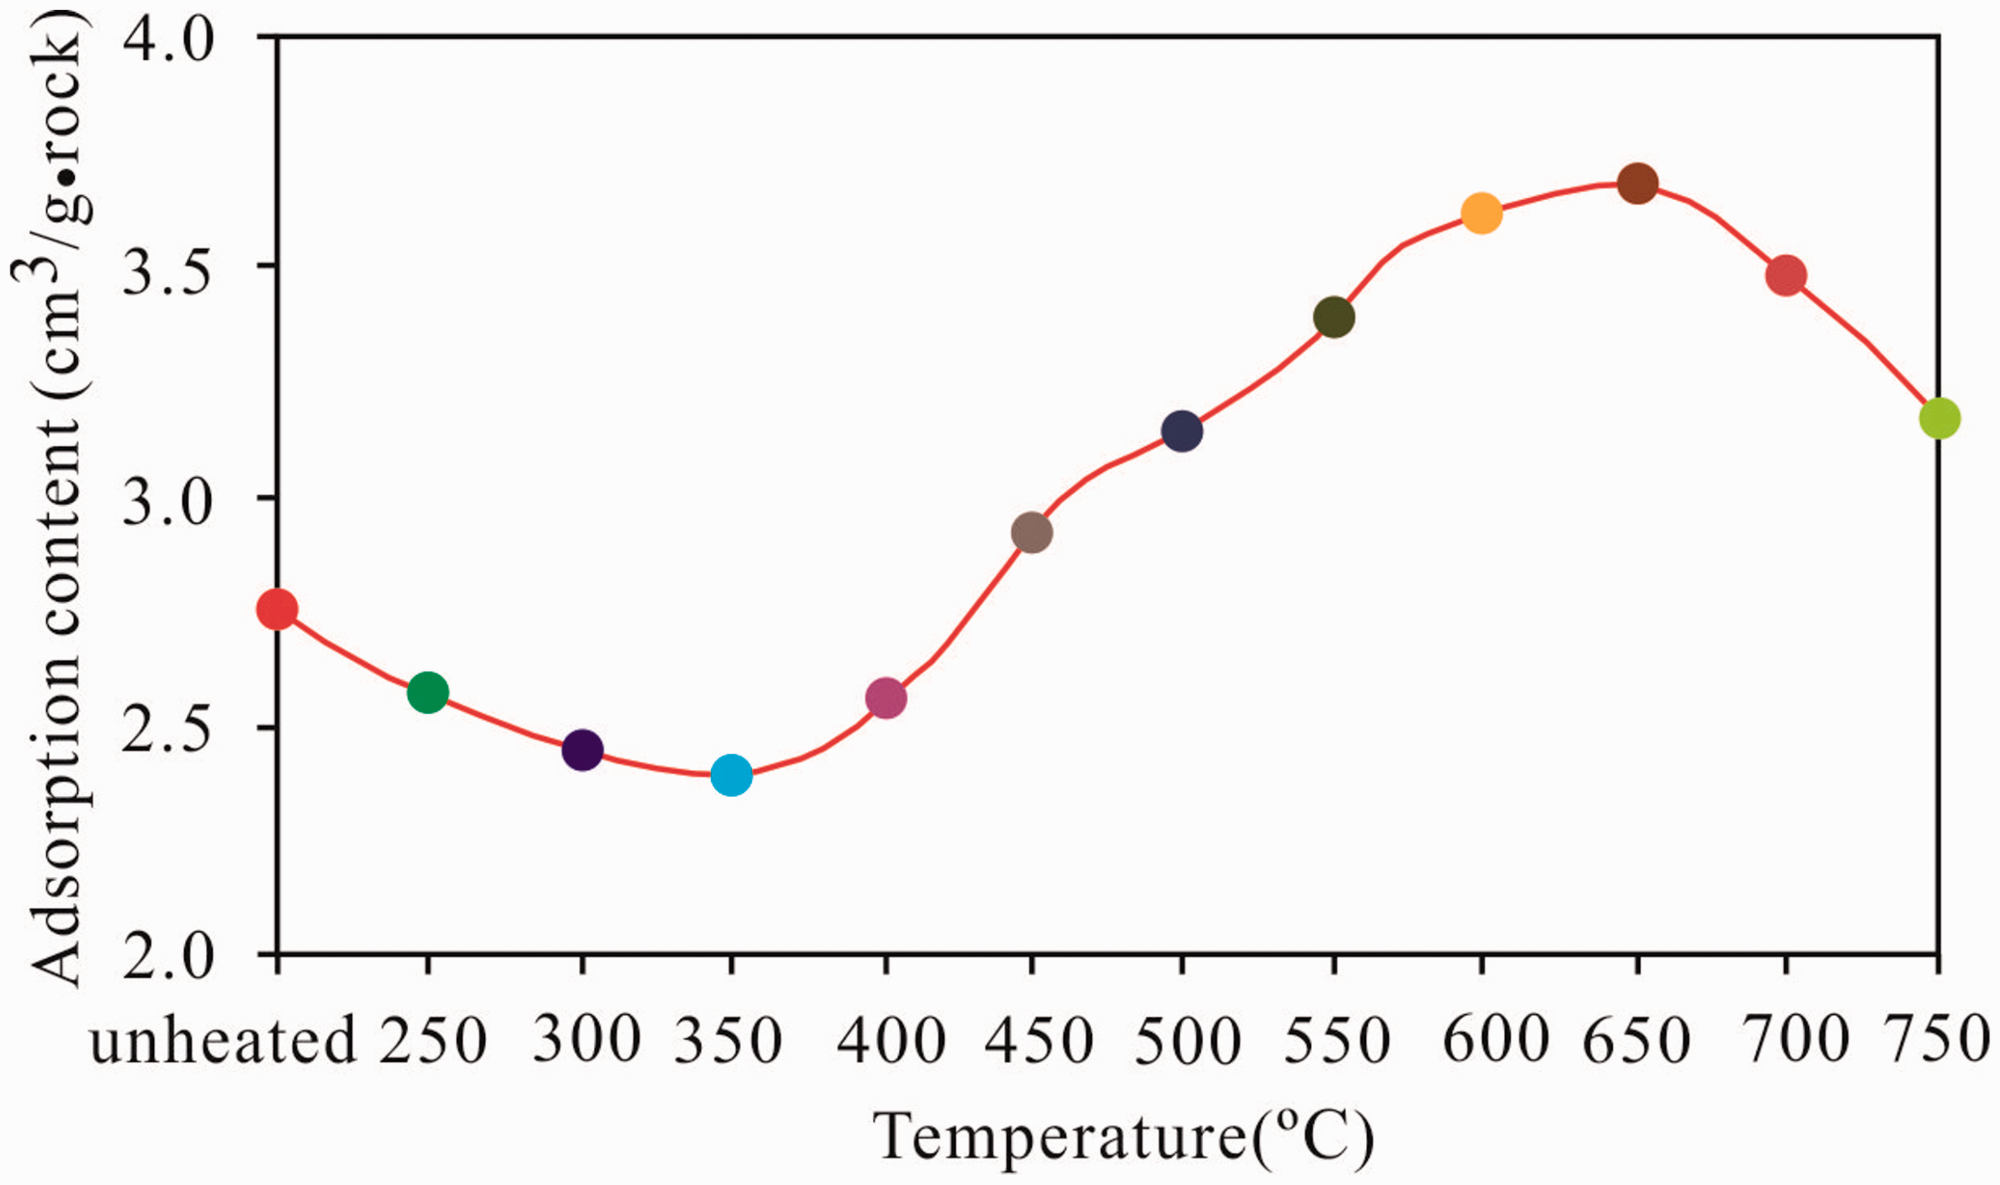
Relationship between the simulation temperature and methane adsorption content of the oil shale.
Methane adsorption content of the oil shale and solid residues.
During the process of the temperature increase from unheated to 350°C in the initial stage of the simulation, the maturity of the samples gradually increases and the methane adsorption content slightly decreases. This finding can be attributed to the splitting and decomposition of organic matter into heavy hydrocarbons within the scope of low–middle maturity with large molecular weights as the maturity increased. The generated heavy hydrocarbons underwent primary and secondary migration, thereby occupying or blocking some of the original micropores and mesopores or those formed by thermal decomposition with a size of approximately 4 nm, which results in the decrease in adsorption sites for methane. Therefore, the methane adsorption content of the samples gradually decreased (Bernard et al., 2012; Chen and Xiao, 2013, 2014).
As the temperature increases from 350°C to 650°C in the middle stage of the simulation, the maturity gradually increases, the methane adsorption content presents a rapidly increasing trend, and the methane adsorption content reaches the maximum point at 650°C. During this period, the organic matter kerogen continues to decompose and heavy hydrocarbons with large molecular weights within the mesopores and micropores split and decompose, reopening the occupied pores. The expanse and overflow of gas also expand the original pores, increasing the number of micropores (Bernard et al., 2012; Chen and Xiao, 2013, 2014). The increasing number of pores, pore volume, and surface area expand the number of methane adsorption sites. Thus, the methane adsorption capacity during this stage considerably increased with maturity.
At the end of the simulation, the maturity of the oil shale continued to increase after the temperature exceeded 650°C (EqRo > 3.28%), and the methane adsorption content had a considerable downward trend. According to Kaneko and Murata (1997), holes that can accommodate single adsorbate molecules have the highest adsorption energy, which rapidly decreases as the pore diameter increases. The adsorption potentials of different pore diameters vary in the following order: micropores (<2 nm) > mesopores (2–50 nm) > macropores (>50 nm). During this period, the increasing maturity decreased the number of micropores, which have the largest adsorption potential because of the transformation to mesopores and macropores, demonstrating small adsorption potentials. The shale pore volume and surface area decreased when the maturity increased due to the transformation of micropores to mesopores and macropores. Thus, the attachment sites for methane and the adsorption capacity of the shale decreased. Consequently, the adsorption capability of the samples dropped.
The preceding analysis shows that maturity has an important influence on the adsorption capacity of shale. Maturity not only controls the generation and evolution of the shale’s internal pores but also affects the organic matter cracking to heavy hydrocarbon with a liquid or solid state, which would occupy and block the pores or cause heavy hydrocarbon cracking to release the pores, increase or decrease the methane adsorption site, and control the shale’s adsorption capacity.
Evolution model of nanopore structure and adsorption capacity
The mineral composition in oil shale has been undergoing chemical reactions at different temperatures, which has an important influence on the formation and adsorption capacity of inorganic nano-sized pores in the shale. Organic matter in the shale is the main carrier of nanoscale pores. The formation and evolution of organic nanoscale pores are the main factors that influence the shale reservoir property, while organic nano-pores are the key factors for the change of the shale adsorption capacity. Under the different simulation temperature conditions, the gas generation of organic matter in shales mainly includes the following three pathways: (1) kerogen cracking to asphaltene and gas, (2) asphaltene cracking to oil and gas, (3) and oil cracking to gas and pyrobitumen (Jarive et al., 2007). The change in mineral composition and the formation of organic matter results in the adjustment, generation, and transformation of the pore, thus affecting the adsorption capacity of the shale. Considering the previous typical classification (Guo et al., 2017; Jia et al., 2014; Schimmelmann et al., 1999), the geochemistry parameters and mineralogy evolution characteristics of the present research, the evolution of the nanopores, and the adsorption capacity model can be divided into the main oil generation stage(T < 350°C, EqRo < 0.86%), oil cracking stage (350°C < T < 650°C, 0.86%<EqRo < 3.28%), and wet gas cracking stage (T > 650°C, EqRo > 3.28%) (Figure 12).
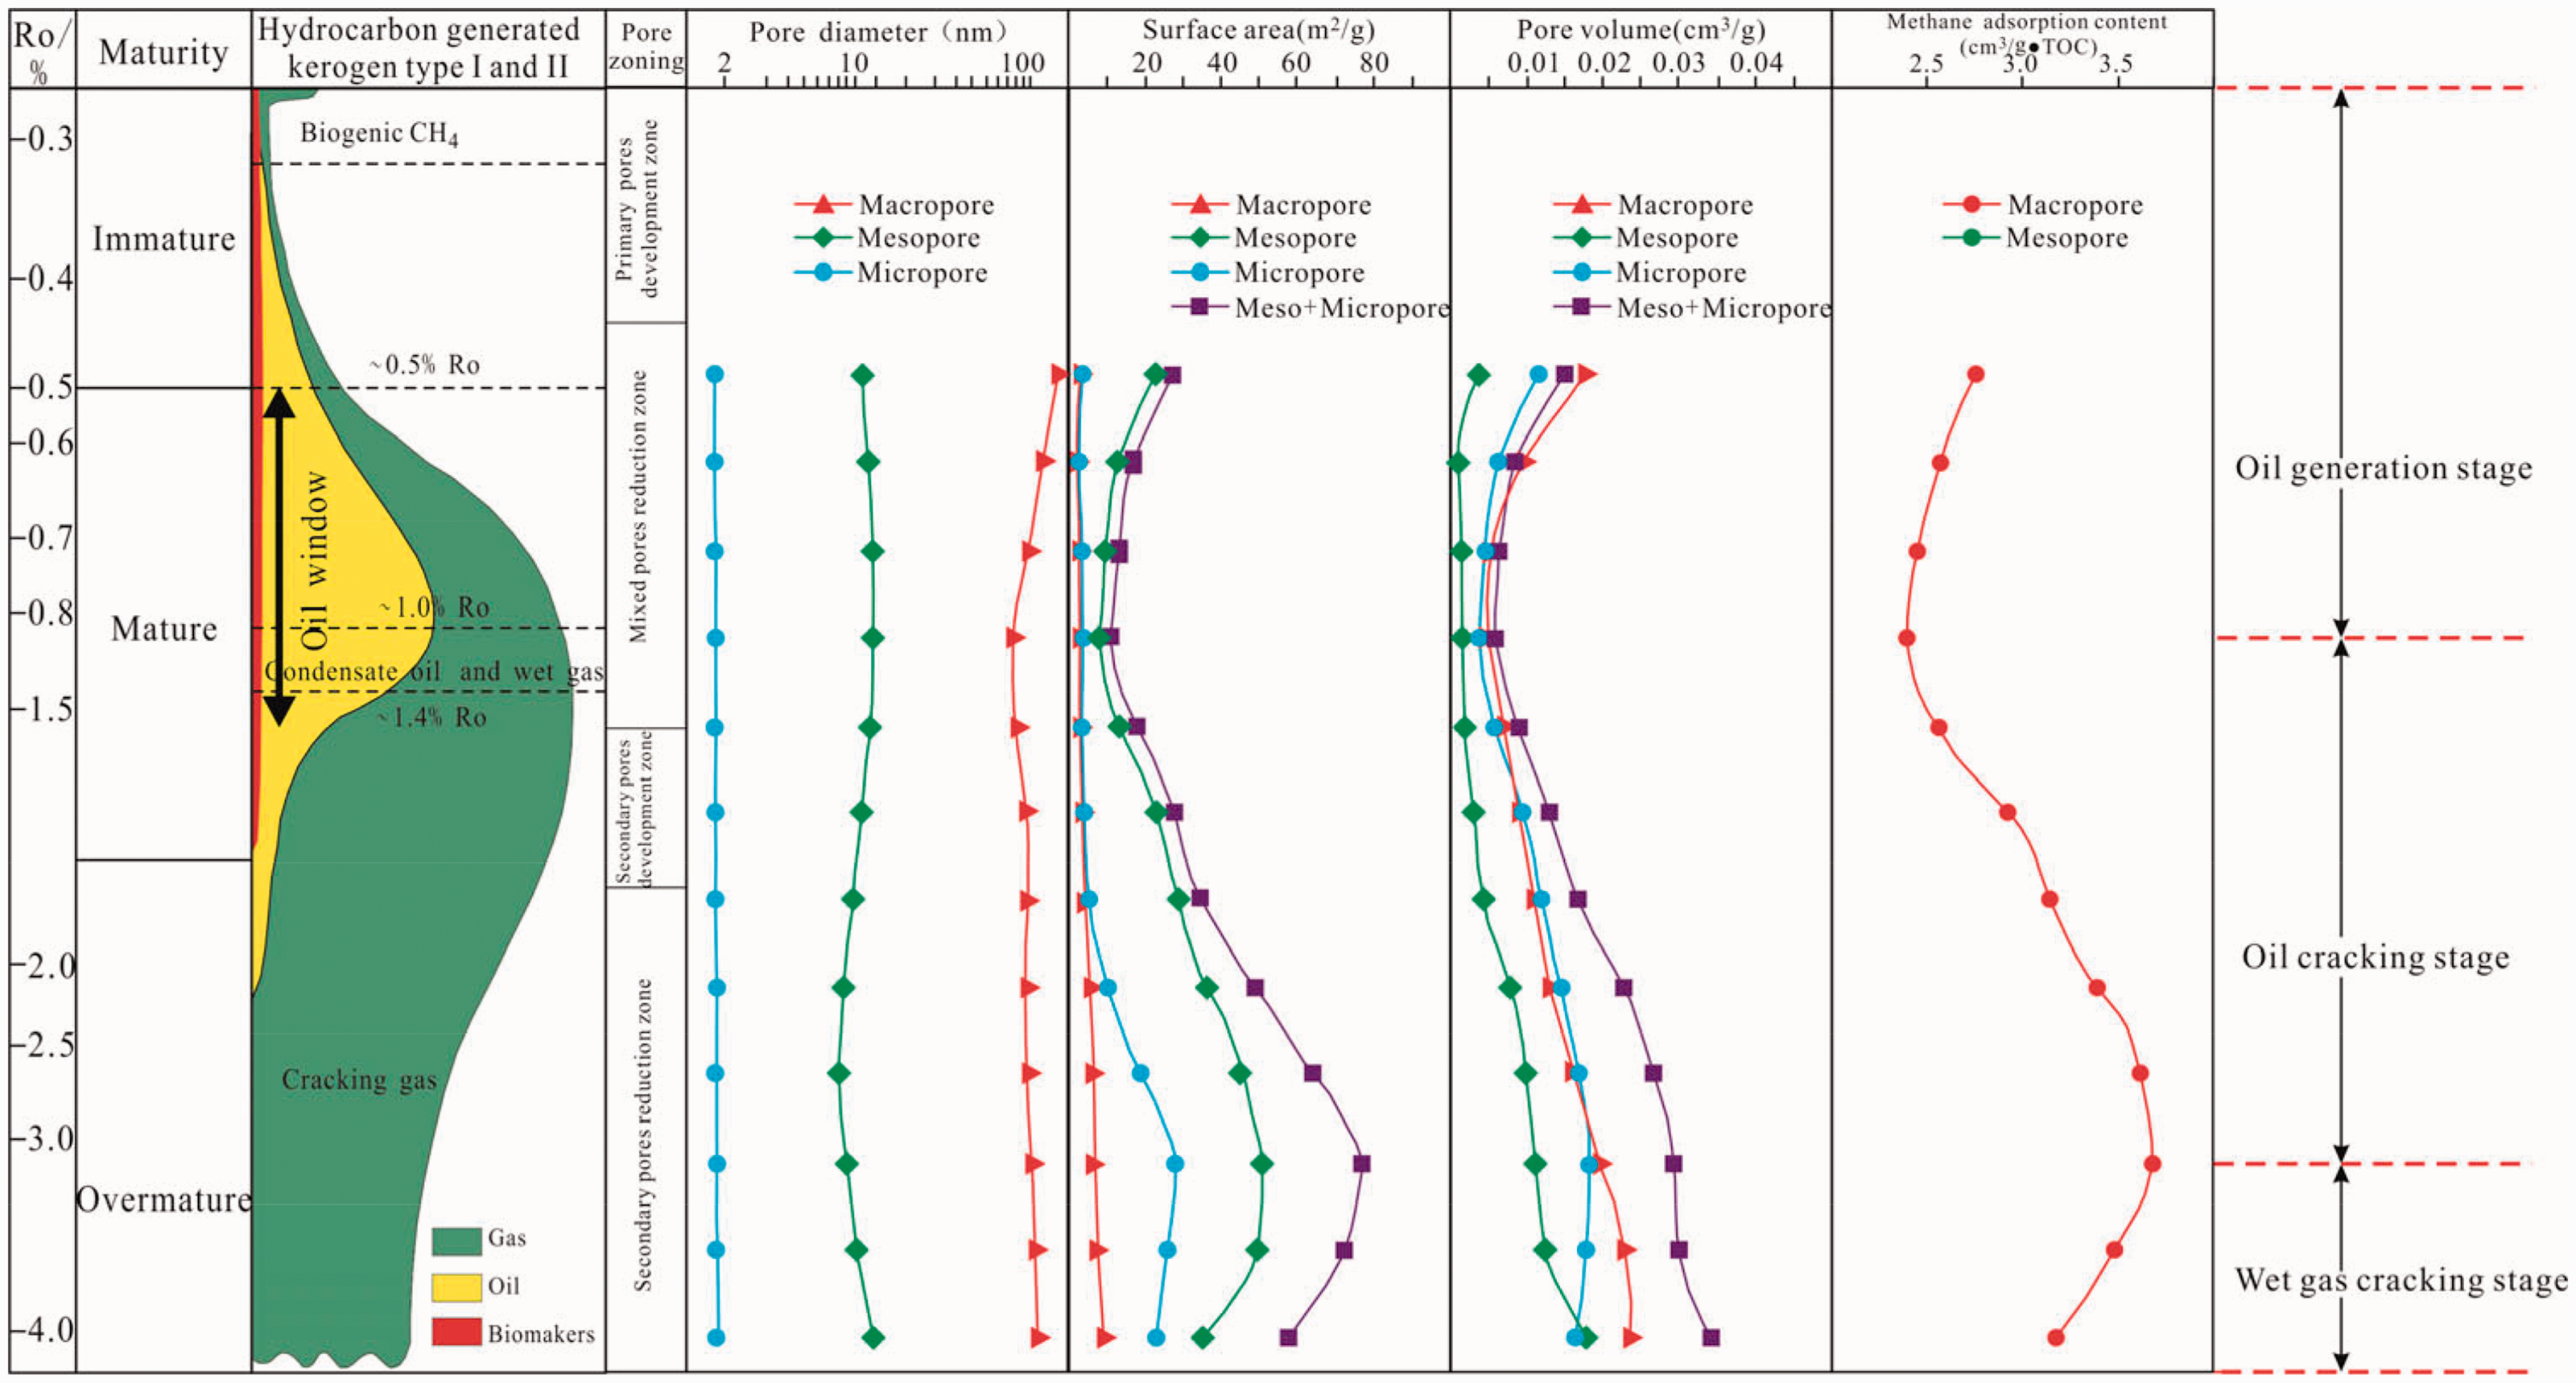
The evolution characteristics and model of nanoscale pore structure and adsorption capacity of the oil shale during artificially thermal maturation.
During the main oil generation stage (T < 350°C, EqRo < 0.86%), the simulation temperature would rise to the oil peak, the functional groups of the kerogen in the oil shale are fractured, the HI decreases, and the organic matter is constantly consumed to produce hydrocarbons and organic acids. Some unstable clay minerals, such as smectite, are removed from crystal water. Under the action of the organic acid generated by the kerogen, the silica is formed by the dissolution of smectite and feldspar and converted into a layer of illite–smectite, illite, and chlorite, along with the formation of nanopores (Chalmers et al., 2012; Chuhan et al., 2000; Lewan et al., 2014). Primary and secondary migration of the generated oils will occur in the oil window stage, with residual oil rich in asphaltene and resin, filling in intra- and intergranular spaces, and plugging the pore throat, resulting in a decrease in shale porosity. Thus, the development extent of the primary porosity is reduced, and a large number of mixed pores are generated (Bai et al., 2012; Modica and Lapierre, 2012; Romero-Sarmiento et al., 2014; Wei et al., 2014). Therefore, at this stage, the surface area and pore volume of the micropores, mesopores, and macropores in the oil shale are decreased, and the heavy elements generated by organic matter occupy the methane gas adsorption site, which leads to the decrease in adsorption capacity of the samples.
In the oil cracking stage (350°C < T < 650°C, 0.86% < EqRo < 3.28%), residual organic matter and kerogen are abundant in hydrocarbon generation, a large number of oxygenic hydrogenous functional groups fall off, and the HI sharply decreases. Heavy hydrocarbon gas (C2-5) generated secondary cracking during the formation of methane and asphalt, and the residual kerogen, residual bitumen, and newly formed bitumen are further cracked and produce a large amount of organic acid (Hill et al., 2003; Modica and Lapierre, 2012; Tian et al., 2008). In addition, unstable minerals, such as feldspar and illite–smectite, have been subjected to the dissolution of organic acid at high temperatures and have been converted to stable minerals, such as illite and chlorite. The secondary pores of quartz and dissolved secondary pores are formed, and the number of secondary organic pores and the pores in inorganic minerals, such intra- and intergranular pores, increase (Chalmers et al., 2012; Chuhan et al., 2000; Huang et al., 2009). In the oil cracking stage, the cracking of residual oil and solid bitumen release some blocked pores. The expansion of gas can lead to the expansion of the original pore (Cao et al., 2015; Curtis et al., 2012; Jarive et al., 2007; Mastalerz et al., 2013). Therefore, the surface area and pore volume of the micropores, mesopores, and macropores are increased, which leads to the rise in the gas adsorption position, thus elevating the adsorption capacity.
At the gas-cracking stage (T > 650°C, EqRo > 3.28%), the temperature would gradually increase to the over-mature stage, the organic matter demonstrated further cracks, and the organic nanoscale pores generated in the early stage have been transformed or destroyed. Moreover, the organic acids have been exhausted. Therefore, the intraparticle and interparticle pores generated by clay minerals are no longer increased, and the number of secondary pores gradually decreased. Under the conditions of this experiment, the pore diameter of the oil shale has become large, and the processes of micropores transiting to mesopores and mesopores transiting to macropores are present. Therefore, the surface area of the micropores and mesopores decreases while that of the macropores increases and the pore volume of the micropores decreases while that of the mesopores and macropores increase, reducing the methane adsorption site and decreasing the adsorption capacity of the oil shale.
Notably, the preceding evolutionary characteristics are only the general evolutionary rules of nano-pore structures and adsorption capacity for Xiamaling immature marine shale. The oil-cracking stage and the wet gas cracking stage are also suitable for the high and over-mature marine shales, with type II kerogen and similar mineral compositions and content. The evolution model is not only suitable for the Xiamaling marine shale but also indicates the evolution of pore and adsorption capacity of over-mature marine shale. Due to the various regions, many factors, such as types, quantities, and occurrence of organic matter in shales, variations in mineral components and compositions, and the actual geological conditions, are different in varying times. Further investigation found considerable differences in nanoporosity evolution with increasing maturity. In addition, this law has universal application importance. However, experimental samples from different regions and times may show various patterns of change, and the evolution of shale in different regions must be treated differently.
Conclusions
With increasing simulation temperature, hydrocarbon generation and inorganic mineral transformation promote the formation, development, and evolution of secondary pores, such as organic and inorganic pores, in oil shale. Closed microspores and the one-end closed pore of the slit throat, all opened wedge-shaped capillaries, and fractured or lamellar pores are all existing in the original and simulated samples, which are also related to the plate particles of clay. The temperature increase has inconsiderably altered the morphology of pores in shale. The heating can promote the accumulation of pore volume and surface area and the formation and development of pores, which can contribute to a large pore volume and surface area. The temperature increase can promote the development of pore volume and surface area of 1–10 nm and 40 nm pores, respectively, and the formation and development of pore volume and surface area of 1–10 nm are more substantial than that of the 40 nm pores. The evolution of the nanopores in oil shale can be roughly subdivided into three stages: pore adjustment stage (T < 350°C, EqRo < 0.86%), development stage (350°C < T < 650°C, 0.86% < EqRo < 3.28%), and conversion or destruction stage (T > 650°C, EqRo > 3.28%). Methane adsorption content decreases with increasing simulation temperature in the low–middle maturity stage (T < 350°C, EqRo < 0.86%), increases in the middle-high maturity stage (350°C < T < 650°C, 0.86%<EqRo < 3.28%), reaches at the maximum value at approximately 650°C, and then gradually decreases at the end of the simulation (T > 650°C, EqRo > 3.28%). The micro- and nano-pores structure and the adsorption capacity evolution model are established. The main oil generation stage (T < 350°C, EqRo < 0.86%), surface area, and pore volume of micropores, mesopores, and macropores in oil shale are decreased, which leads to a reduction in adsorption capacity. The oil-cracking stage (350°C < T < 650°C, 0.86% < EqRo < 3.28%), surface area, and pore volume of the micropores, mesopores, and macropores are increased and the adsorption capacity is enhanced. In the wet gas-cracking stage (T > 650°C, EqRo > 3.28%), the pore diameter of shale organic matter increases and the surface area of micropores and mesopores decreases; meanwhile, the surface area of the macropores increases, the pore volume of the micropores decreases, while the volume of the mesopores and macropores increases. Thus, the adsorption capacity also gradually decreases.
Our findings provide support and introduce a theoretical model for the identification of shale gas prospective zones according to thermal maturity mapping and for the prediction of quantitatively geochemical and inorganic changes due to thermal evolution. Further pyrolysis experiments can be conducted by choosing samples with low TOC content of various kerogen types from different depositional environments to improve the applicability and feasibility of the experimental findings.
Footnotes
Acknowledgements
The authors would like to extend their appreciation to Doctor Wang Qi who referenced this paper and Professor Tian Hui for all their valuable comments, which helped considerably improve the quality of this paper.
Declaration of conflicting interests
The author(s) declared no potential conflicts of interest with respect to the research, authorship, and/or publication of this article.
Funding
The author(s) disclosed receipt of the following financial support for the research, authorship, and/or publication of this article: The research was supported by the National Natural Science Fund Project of China (41372143), and the Chinese National Science and Technology Major Project (2017ZX05035-002).