
Abstract
The use of energy from biomass is becoming more common worldwide. This energy source has several benefits that promote its acceptance; it is bio-renewable, non-toxic and biodegradable. To predict its behavior as a fuel during thermal treatment, its characterization is necessary. The experimental determination of ultimate analysis data requires special instrumentation, while proximate analysis data can be obtained easily by using common equipment but, the required time is high. In this work, a methodology is applied based on thermogravimetric analysis, curves deconvolution and empirical correlations for characterizing different regional agro-industrial wastes to determine the high heating value, the contents of moisture, volatiles matter, fixed carbon, ash, carbon, hydrogen, oxygen, lignin, cellulose and hemicellulose. The obtained results are similar to those using standard techniques, showing the accuracy of proposed method and its wide application range. This methodology allows to determine the main parameters required for industrial operation in only in one step, saving time.
Introduction
Actually, the developed and the developing countries are suffering the consequences of excess consumption in the world, one of them is the great generation of waste from different origins (United Nations, 2013). Particularly Argentina, one of the underdeveloped countries, is a great generator of lignocellulosic waste because one of the main productive activity is the agroindustry and their residues are totally wasted. This when caused fire, is attracting rodents and is causing pollution in specific areas. These types of waste come from the wine industry, wood industry and industry production of jams and preserve food, too.
In addition, there is a global trend of researching new ways to reuse them. Focusing on agro-industrial wastes, the scientists exploit new way to reuse. For example, new materials, the energy production through different thermal treatments (gasification, pyrolysis and combustion, principally) and fermentatives process.
The thermal treatments give different products: syngas, bio-oil, biochar, etc. Therefore, nowadays, the residual biomass is a promising alternative for energy production more clean than the fossil energy (balance CO2) and the reuse of waste biomass contributes to environmental care (Fernandez et al., 2016).
On the other hand, each thermal process has advantages and disadvantages (Demirbaş, 2001; Gómez-Barea et al., 2006; Khan et al., 2017; Valle et al., 2012; Vitasari et al., 2011) but, a common problem is the manipulation of the operating variables, due to the diversity of raw material to process. The development and evolution of large-scale production of second generation fuels, as primary tool, requires knowledge of the characteristics of the materials feeding.
Taking into account the biomass heterogeneity and biomass thermal conversion, their characterization is required, to reliably predict its behavior as a possible fuel. The proximate and ultimate analysis is one of the most important characterization methods. Proximate analysis is used to determine the weight percentages (wt.%) of moisture, volatile matter (VM), fixed carbon (FC) and ash of a biomass while ultimate analysis is used in order to determine the weight percentages of chemical elements (carbon, hydrogen, nitrogen, oxygen and sulfur). Researchers conduct proximate or ultimate analysis and subsequently, they use the resulting data to determine the heating value via established empirical correlations.
On the other hand, the hemicellulose, cellulose and lignin are the principal components of biomass. Several authors suggest that the thermal conversion under different atmosphere (considering pyrolysis, gasification and combustion) can be descript as the decomposition of these mean components (Couhert et al., 2009). So, the characteristics of thermal process and their product yield is influenced by their chemical composition.
Also, thermal process is complex because they go through a series of reactions and can be influenced generally, by many factors (Manyà et al., 2003). Between these, the pyrolysis is a fundamental thermochemical conversion because it is an important step in combustion and gasification processes. The pyrolysis can transform biomass into gaseous and liquid fuels and some various chemical products (Fernandez et al., 2016).
In this context, the present paper has an objective to demonstrate that a single thermogravimetric analysis (TGA), through isothermal and no-isothermal periods, can be used as a simple and effective tool in order to estimate the majority of parameters required for a solid biofuel characterization.
The most common parameters are moisture, VM, FC, ash, carbon, hydrogen, nitrogen, oxygen and sulfur contents, high heating value (HHV), and also, hemicellulose, cellulose, lignin contents (Vassilev et al., 2015) because these parameters affect the degradation kinetics and they, have a great significance during the thermal processes, the operating variables must be adapted to these characteristics.
Materials
Lignocellulosic biomass
In Argentina, one of the most important economic activities is the agro-industry, highlighting the industry seasonal fruits. This sector produces a significant environmental impact in specific geographic areas. Approximately, 140,000 t of peaches are processed in canning and jams industries, generating a significant amount of solid waste biomass, 37,800 t/year only in Region of Cuyo. On the other hand, the wine industry is considered as a very important economic activity in the region and it generates about 51,928 t/year of marc and stalks. The samples of these wastes are from San Juan, Province.
Other important waste from the timber industry is the sawdust, this is centered in the south and north of the country. The samples of this waste are from Neuquén province.
Determination of dimensions
In order to work with samples of the same size and minimize the transport phenomena, studied biomass waste was ground, and sieved and the resulting 0.1–0.2 mm size fraction was used for the thermogravimetric tests. ASAE Standard S319.3 was used to determine the size distribution of the ground samples (Fahrenholz et al., 2010).
Characterization by standard methods
Proximate analysis
Immediate analysis includes the determination of moisture, VM, FC and ash contents. These parameters were obtained according to ASTM standards (ASTM D3173-87, ASTM D3172-89 (02)). Table 1 shows the obtained results.
Results of proximate analysis, ultimate analysis. Contents of lignin, cellulose and hemicellulose determined by ASTM standard methods.
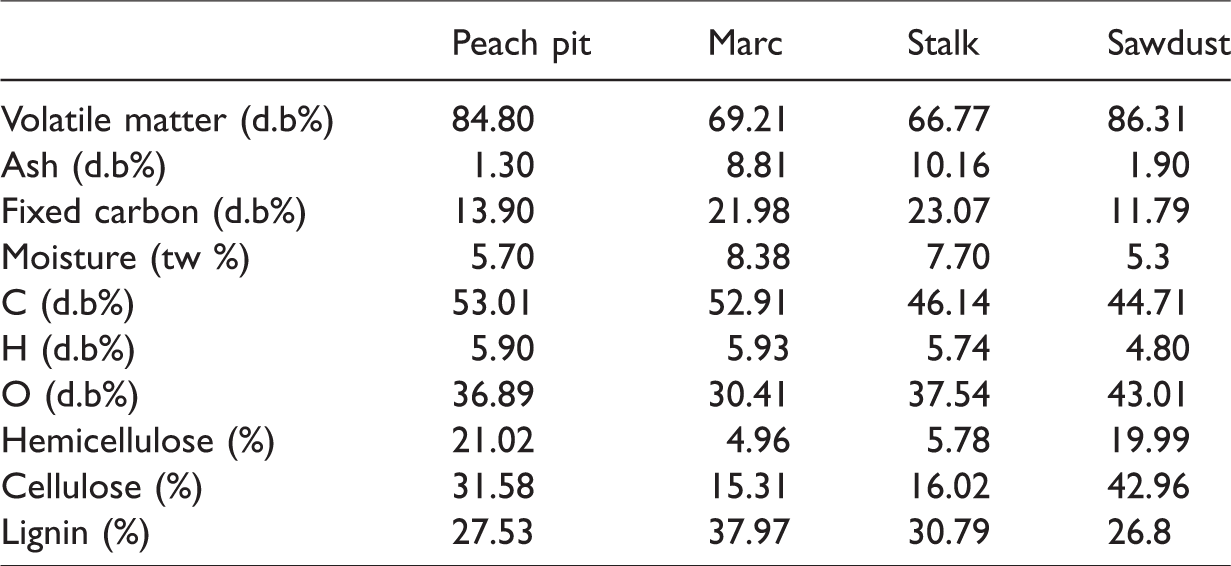
b. Ultimate analysis
Analyses of the samples were performed using Euro 3000 model elemental analyzer. The analysis results are expressed in dry basis (Table 1). The sulfur and nitrogen contents complete 100%. Their quantities are negligible considering the other elements.
c. Contents of lignin, cellulose and hemicellulose
The values of lignin, cellulose and hemicellulose contents, expressed in percentage, were determined by ASTM standard (ASTM D1106-56, ASTM D1103-60 and ASTM D1103-60, respectively). These analyses were carried out by the laboratory of the Chemistry Section of Agro Products (EEAOC-Estación Experimental Agroindustrial Obispo Colombres)-Tucumán/Argentina. The analysis results are expressed in dry basis (Table 1).
Methods
Characterization by thermogravimetric analysis
Through TGA, the biomass wastes characterization can be carried out, covering a wide range of applications in the research and economic development (Ottaway, 1982). This technique can be the simplest and most effective way to observe the thermal decomposition profile of the solid fuel. TGA is based on measuring the change in the sample mass, in the time, when it is subjected to a temperature program in a controlled atmosphere. In this case, TGA was performed using a thermal analyzer DTG-60 simultaneous Brand: DTA-TG.SHIMADZU, serial no.: C305647/00473.
Twelve milligrams of biowaste were evaluated. The experiments were carried out following the ASTM International Standard-Designation: E 1131-03. Standard Test Method for Compositional Analysis by thermogravimetry. This test is an empirical technique in which the substance mass, heated at a controlled rate in an appropriate environment, is recorded as a function of time or temperature. Mass loss, under specific atmosphere and during a specific temperature ranges, provides a compositional analysis of the analyzed material. Figure 1 shows illustratively the used methodology. As observed, it is required numerous changes of several operating parameters (gas atmosphere, heating ramp, isothermal periods duration). The flow rate of nitrogen/air was equal to 50 ml/min.
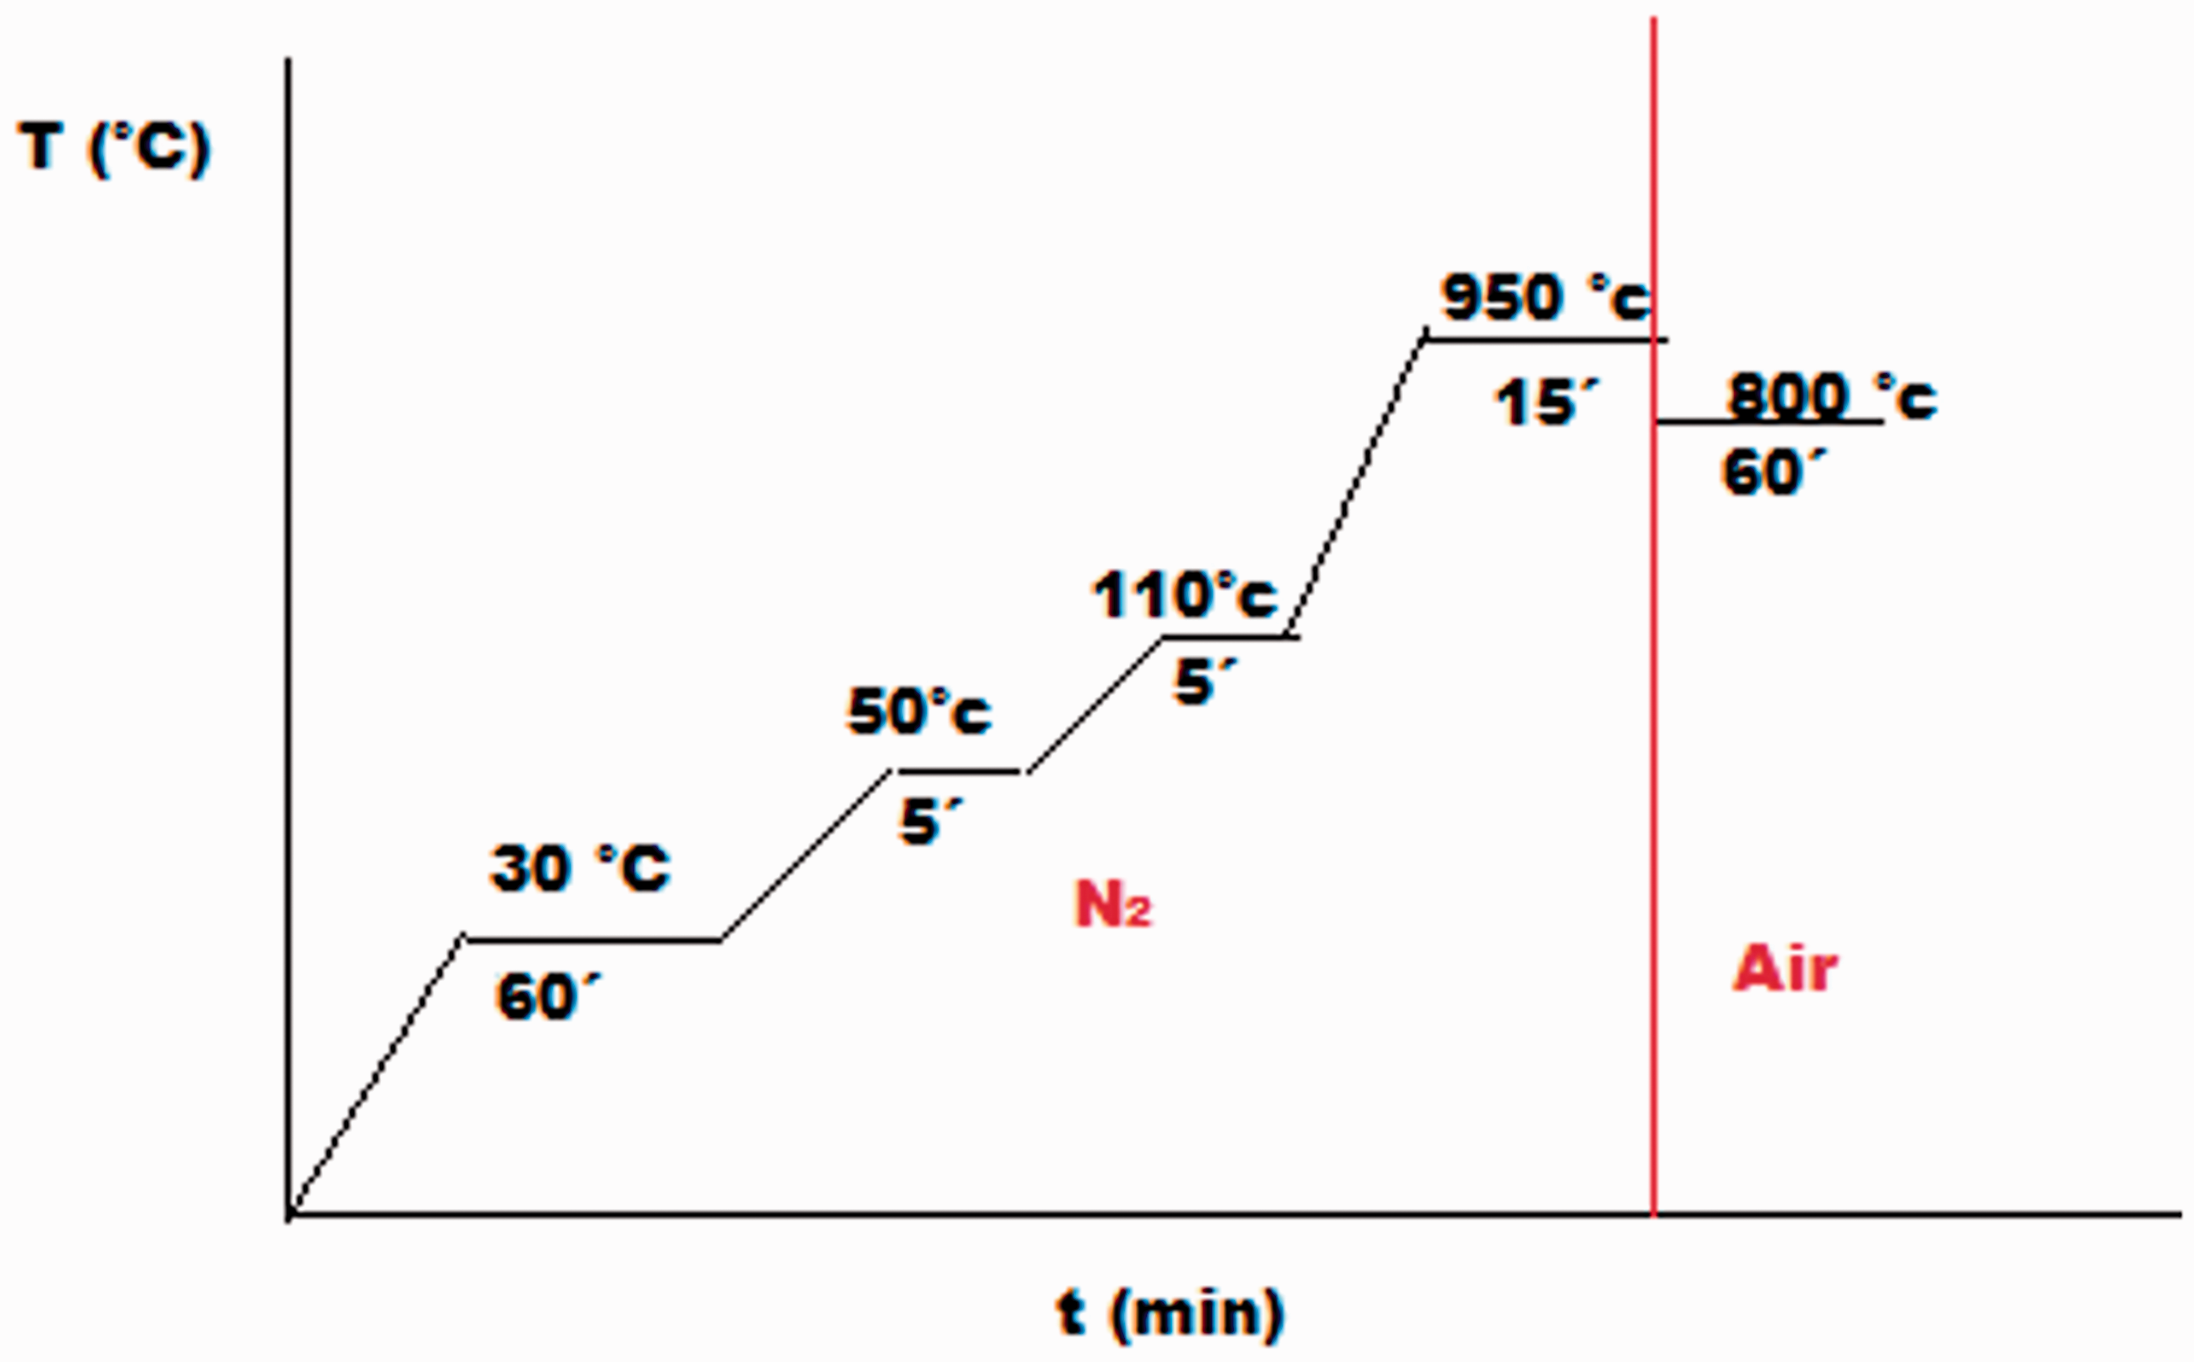
Methodology used to determine the proximate analysis.
Before starting the methodology, the purging with nitrogen during 60 min at constant temperature equal to 30°C is carried out in order to remove all oxygen traces (Step 1). The methodology involves heating at 50°C/min to 50°C and an isothermal period at this temperature for 5 min. Then, the sample is heated to 110°C, at the same heating rate and the sample is held during 5 min at this temperature.
The sample temperature is raised to 950°C, using a heating rate equal to 90°C/min. Next, an isothermal period at this temperature is kept, its duration was equal to 15 min. All these steps are carried out under nitrogen atmosphere. Finally, the temperature is decreased to 800°C under air atmosphere for 60 min, in order to oxidize the remaining organic matter of residual biomass sample. After the weight remained constant, the system is closed and the experient concludes.
a. Proximate analysis
The standard procedures for the proximate analysis are expensive, tedious, and their success depends on the operator ability. Due to all measurements that this analysis involves, weight changes under certain conditions of temperature, time and atmosphere, the thermogravimetry use is ideal in order to determine the results of this analysis. Using the TGA method, these results can be obtained in approximately two hours and half, whereby a great time and money saving can be achieved by performing sequential of all measurements on a sample (Karatepe and Küçükbayrak, 1993).
Following the methodology described above (ASTM E 1131-03), the curves TG and DTG are obtained for each studied agro-industrial waste. An example of this curve is shown in Figure 2. DTG curves show a first peak, corresponding to moisture loss, between 25°C and 110°C approximately. The second observed peak in these curves corresponds to the VM content, and it is present between 105 and 950°C approximately. These two determinations are carried out under inert atmosphere (nitrogen). The third peak shown in DTG curves corresponds to the FC content. This peak appears under oxidative atmosphere (air). Finally, the ash content is calculated by difference between the total weight and the other constituents. Similar techniques have been used by other authors (Karatepe and Küçükbayrak, 1993; Ottaway, 1982; Saldarriaga et al., 2013, 2015). Table 2 shows the obtained results for each studied waste.
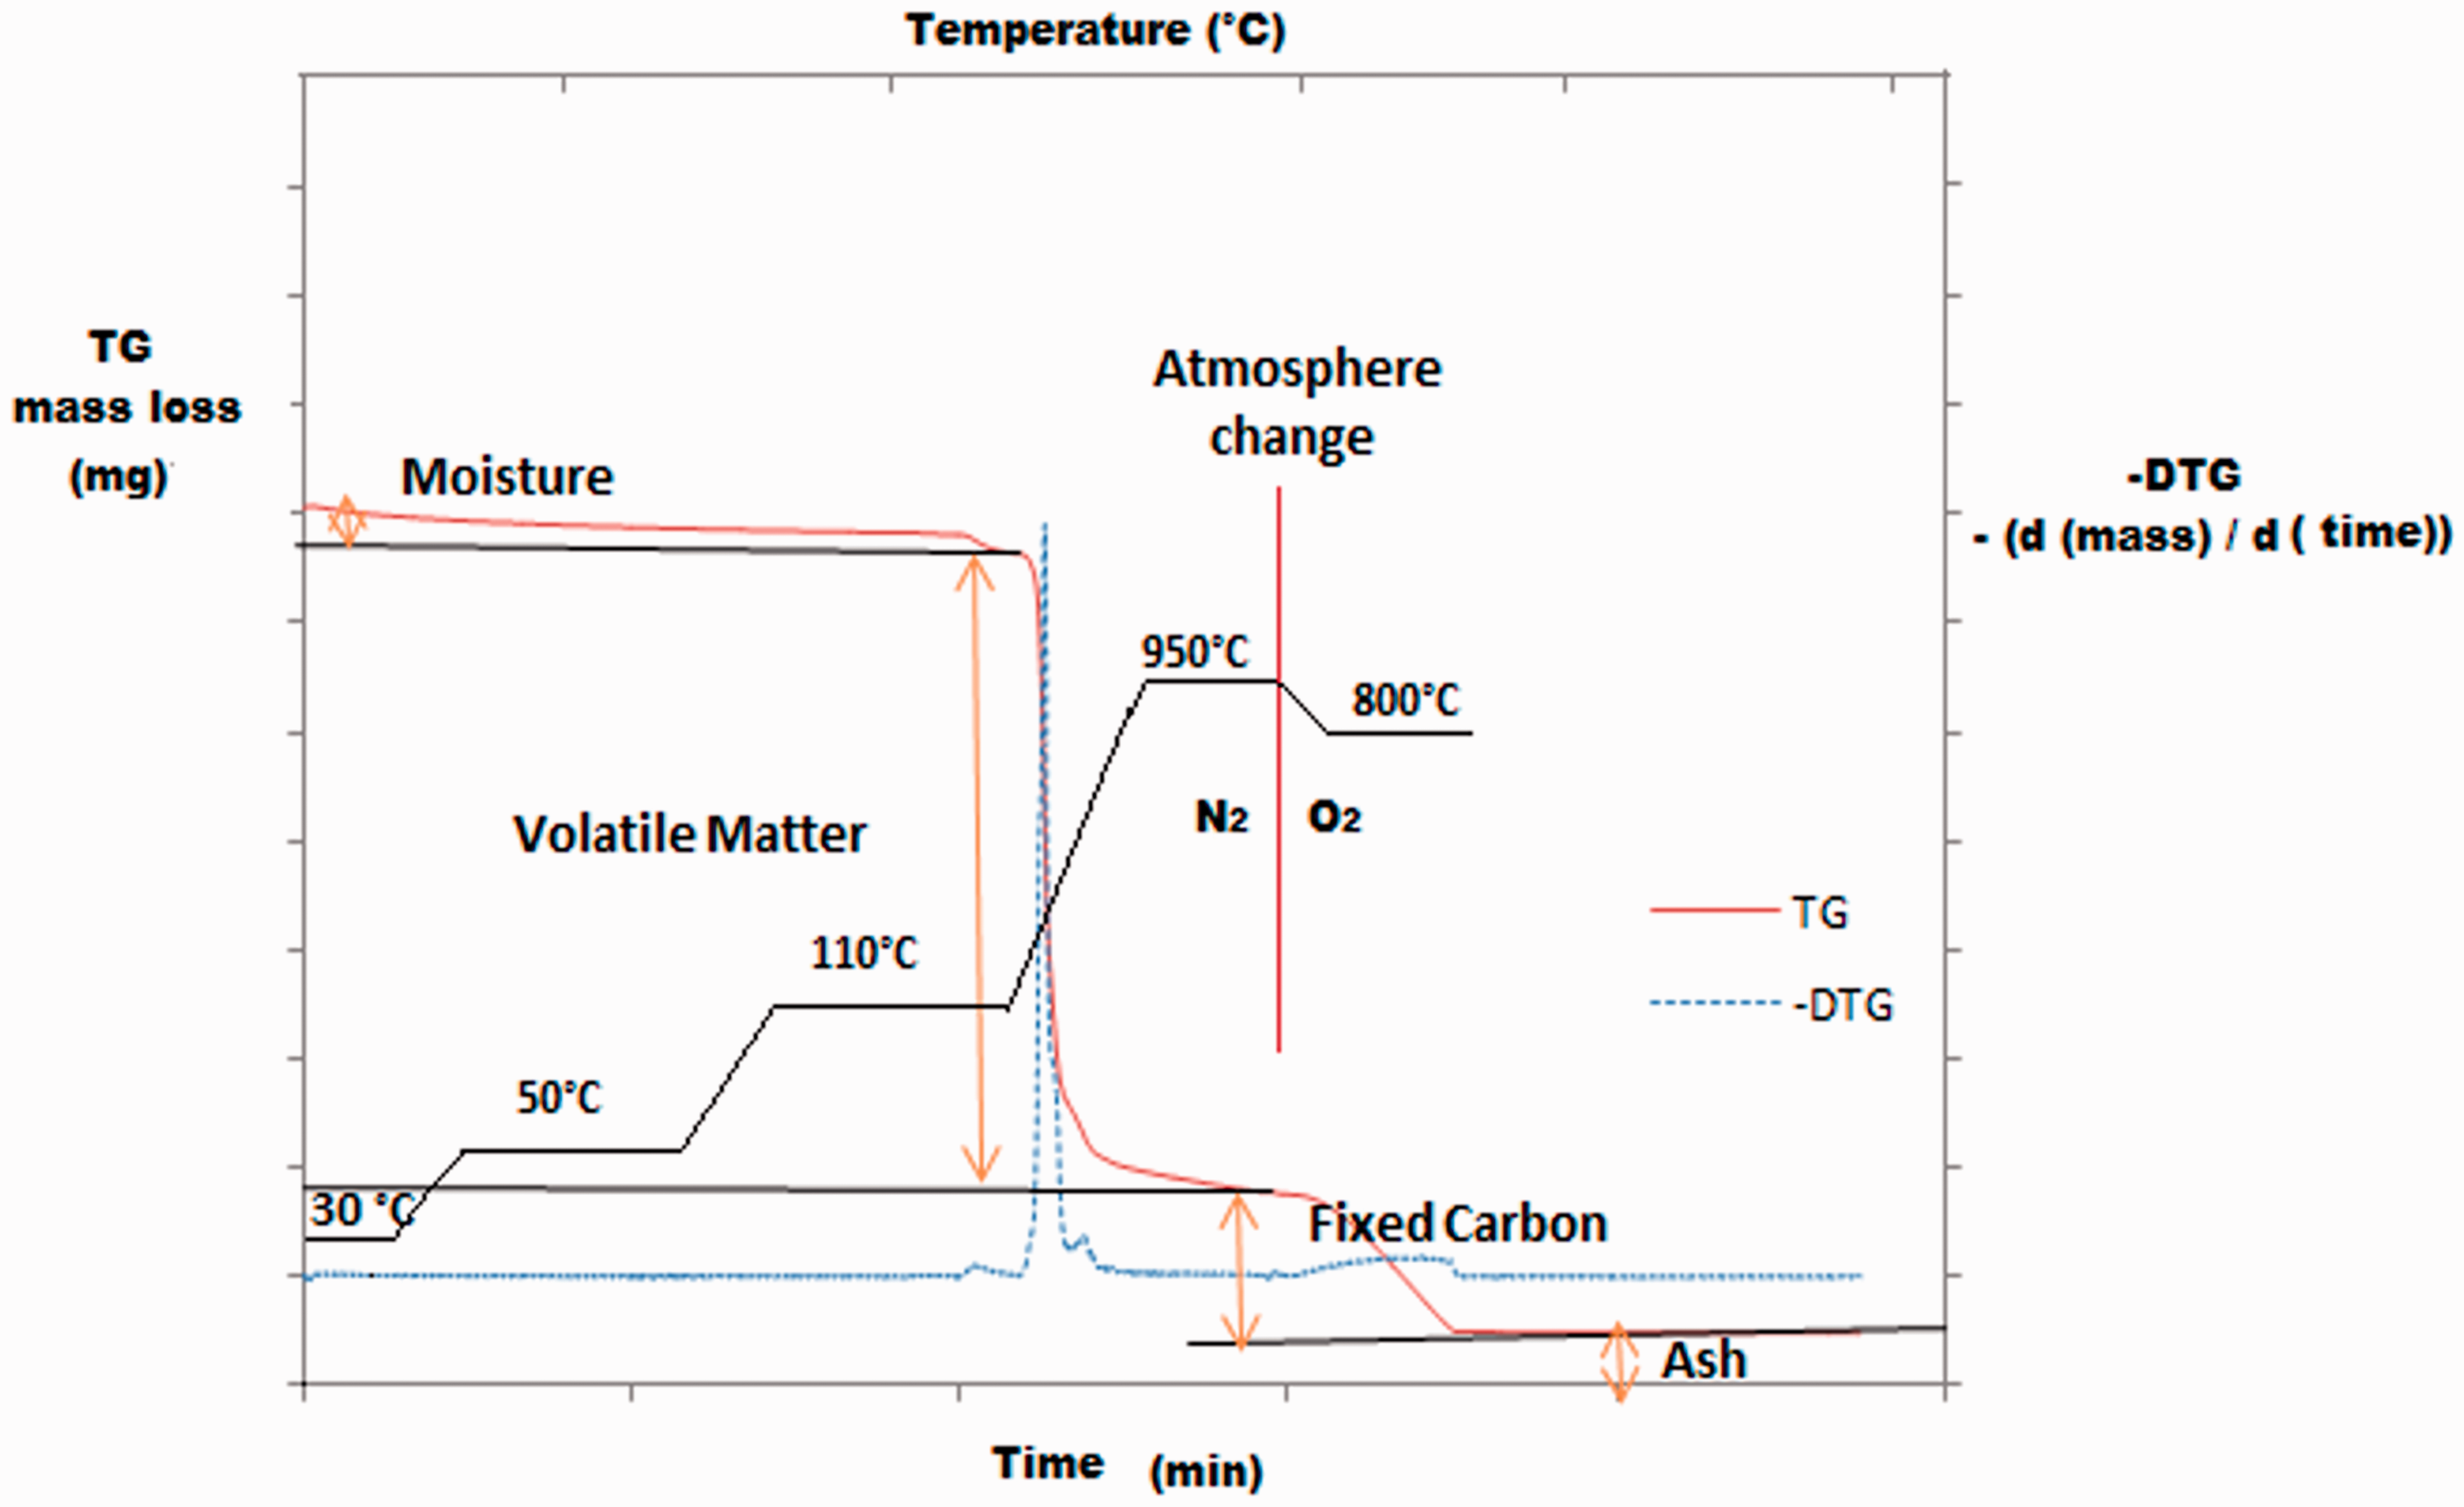
Example of the TG and –DTG curve for agro-industrial waste in order to determine the proximate analysis.
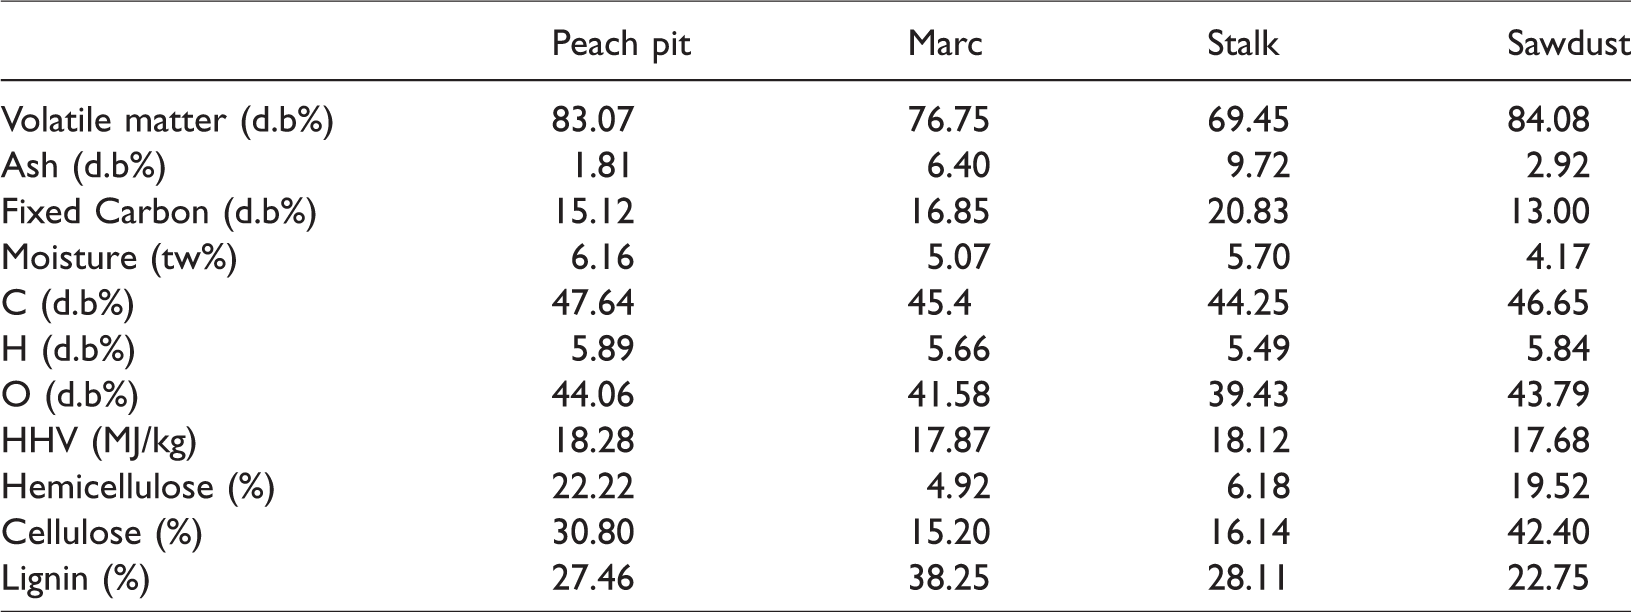
Results of proximate analysis, ultimate analysis and lignin, cellulose and hemicellulose contents using thermogravimetric analysis.
b. Ultimate analysis and HHV
The carbon, hydrogen, oxygen contents and HHV have been determined from correlations using proximate analysis determined by thermogravimetry analysis. Empirical equations developed by Parikh et al. (2005a, 2007b) were used:


c. Lignin, cellulose and hemicellulose contents
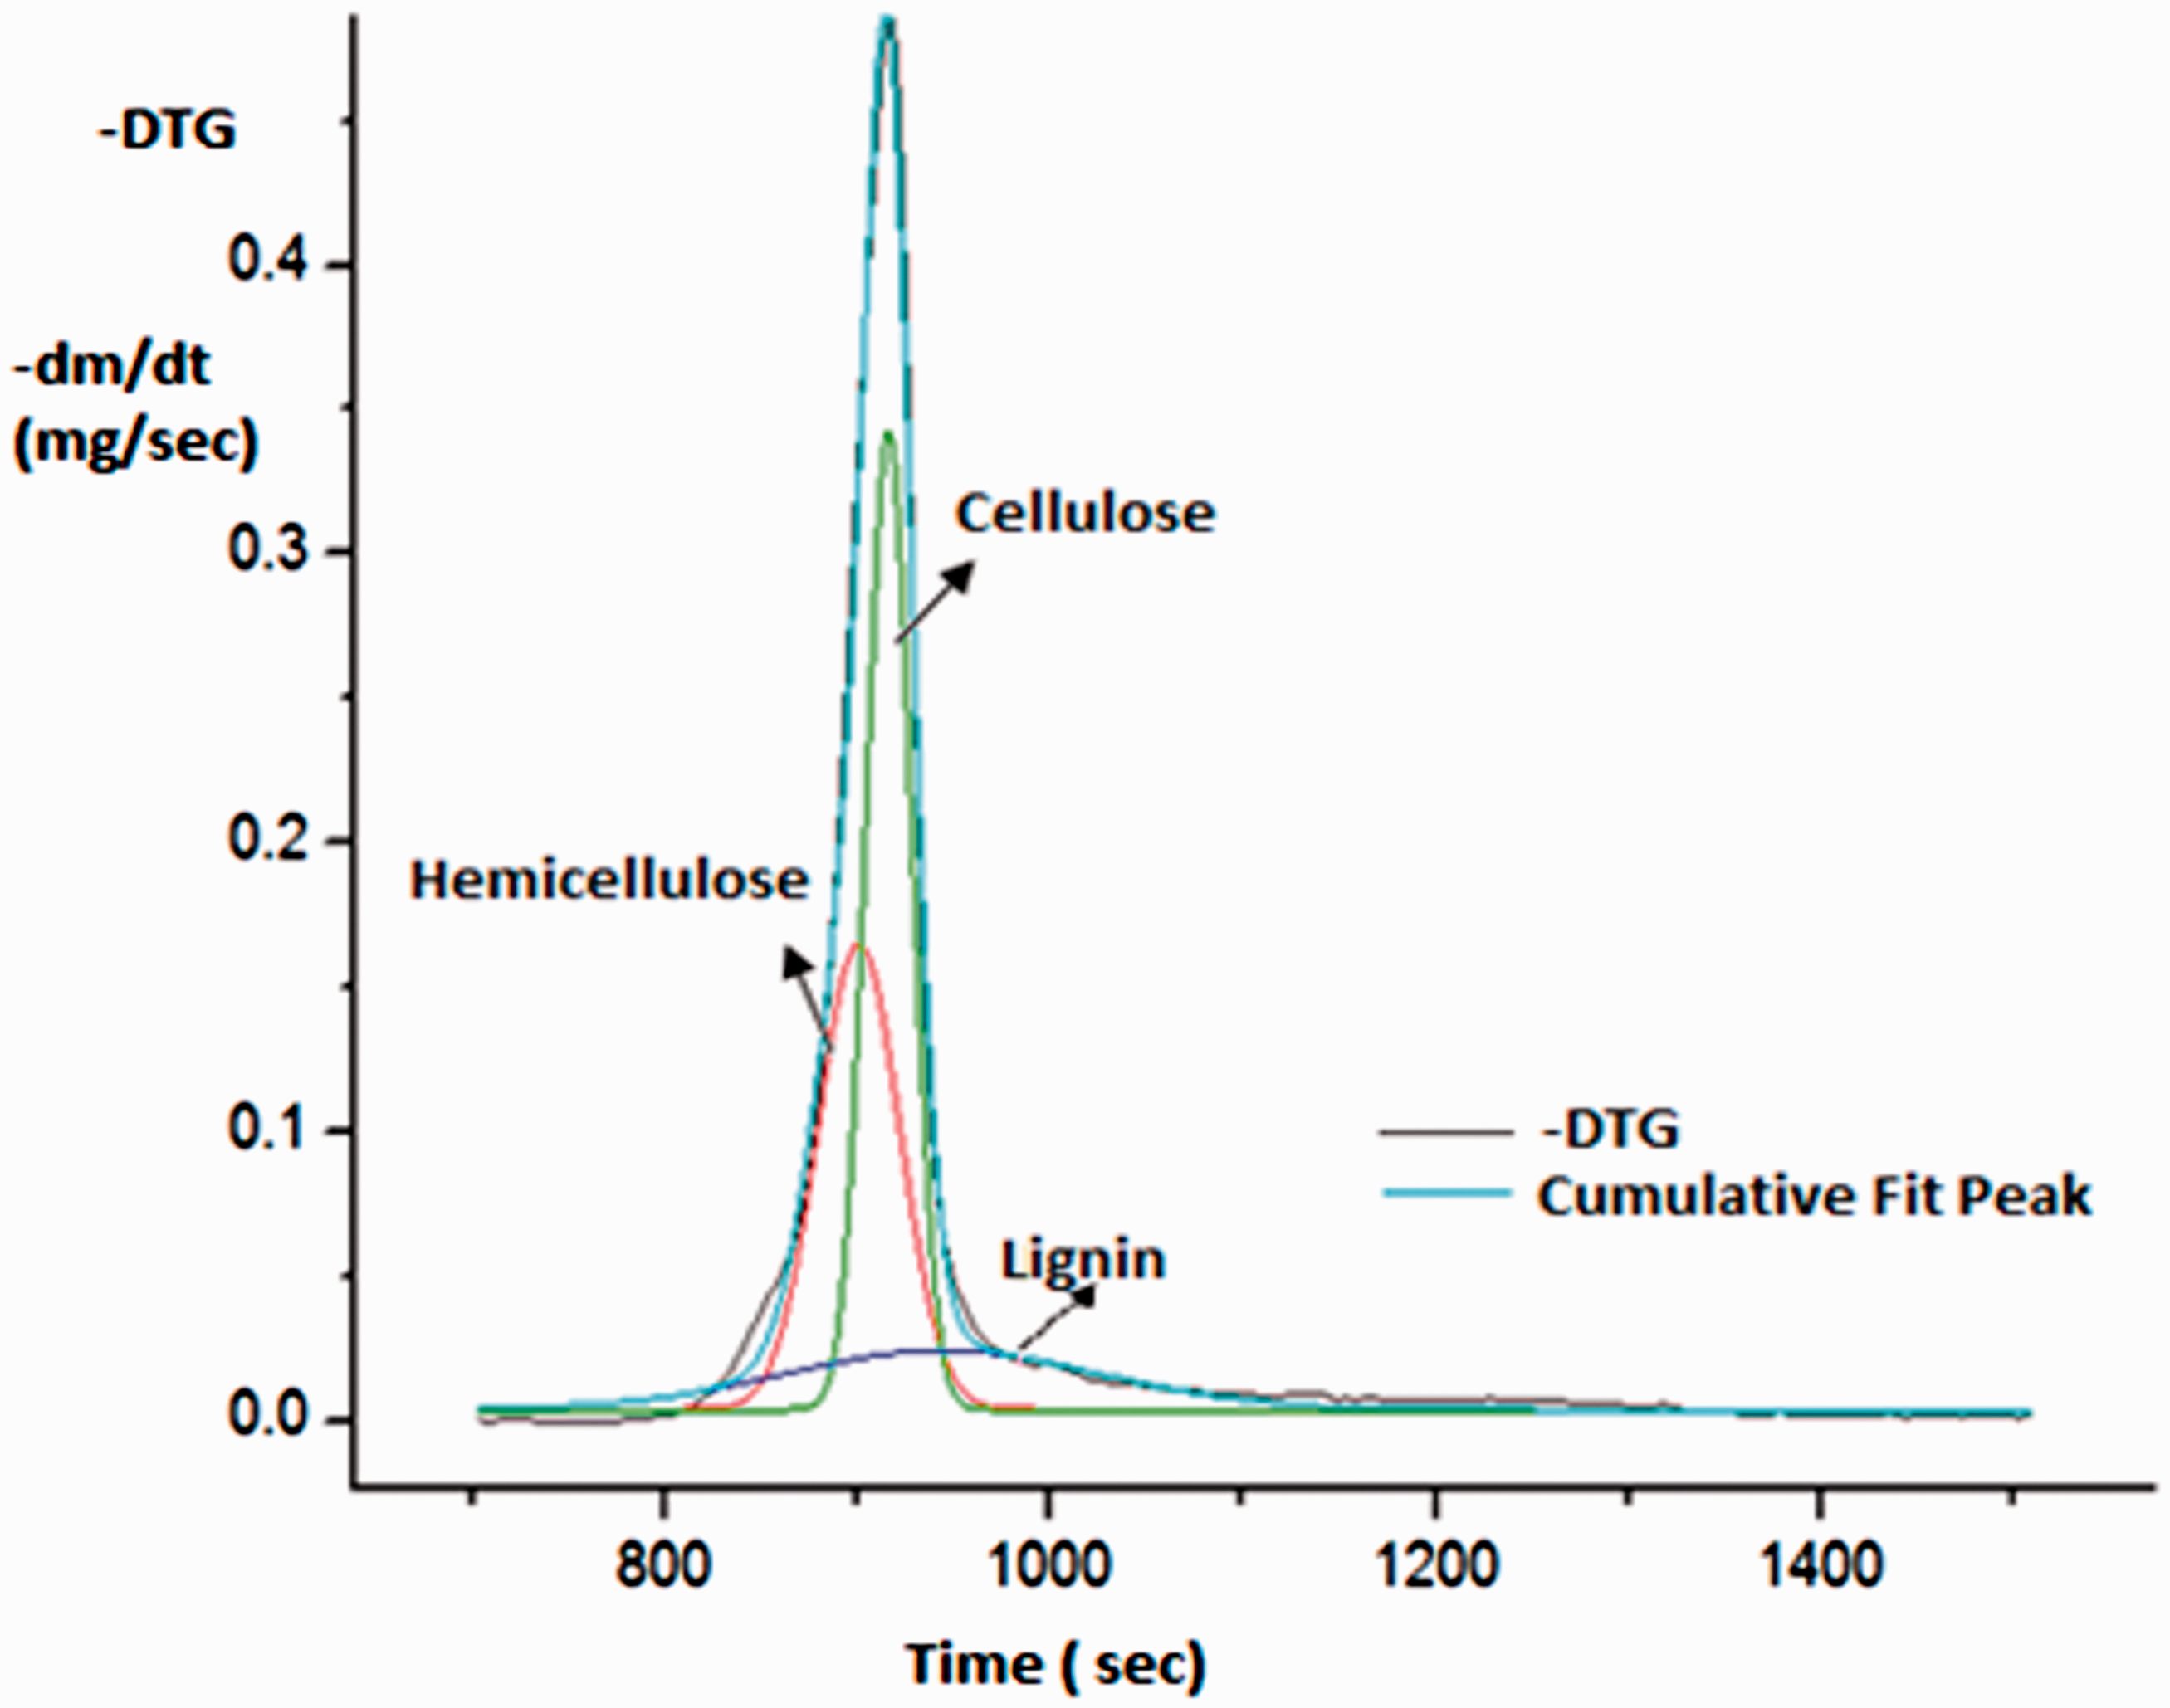
These contents were determined using a methodology based on the DTG curves deconvolution. This technique was applied in order to separate clearly all peaks corresponding to degradation of the three natural polymers contained in biomass. Their contents are determined in relation with the size ratio of the areas under these peaks. The DTG curves deconvolution was carried out using the Origin 8.6 software. Table 2 shows the results obtained by this technique. A Gaussian type curve was used to adjust each peak. In order to describe it, a mathematical model was proposed. Equation (5) shows the –dm/dt variation with the time. Its integration allows to estimate the percentage of cellulose, hemicellulose and lignin contents. This integration was carried out using Mathcad 1.5 software.
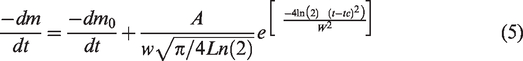
Deconvolution of the –DTG curve corresponding to the degradation of peach pit.
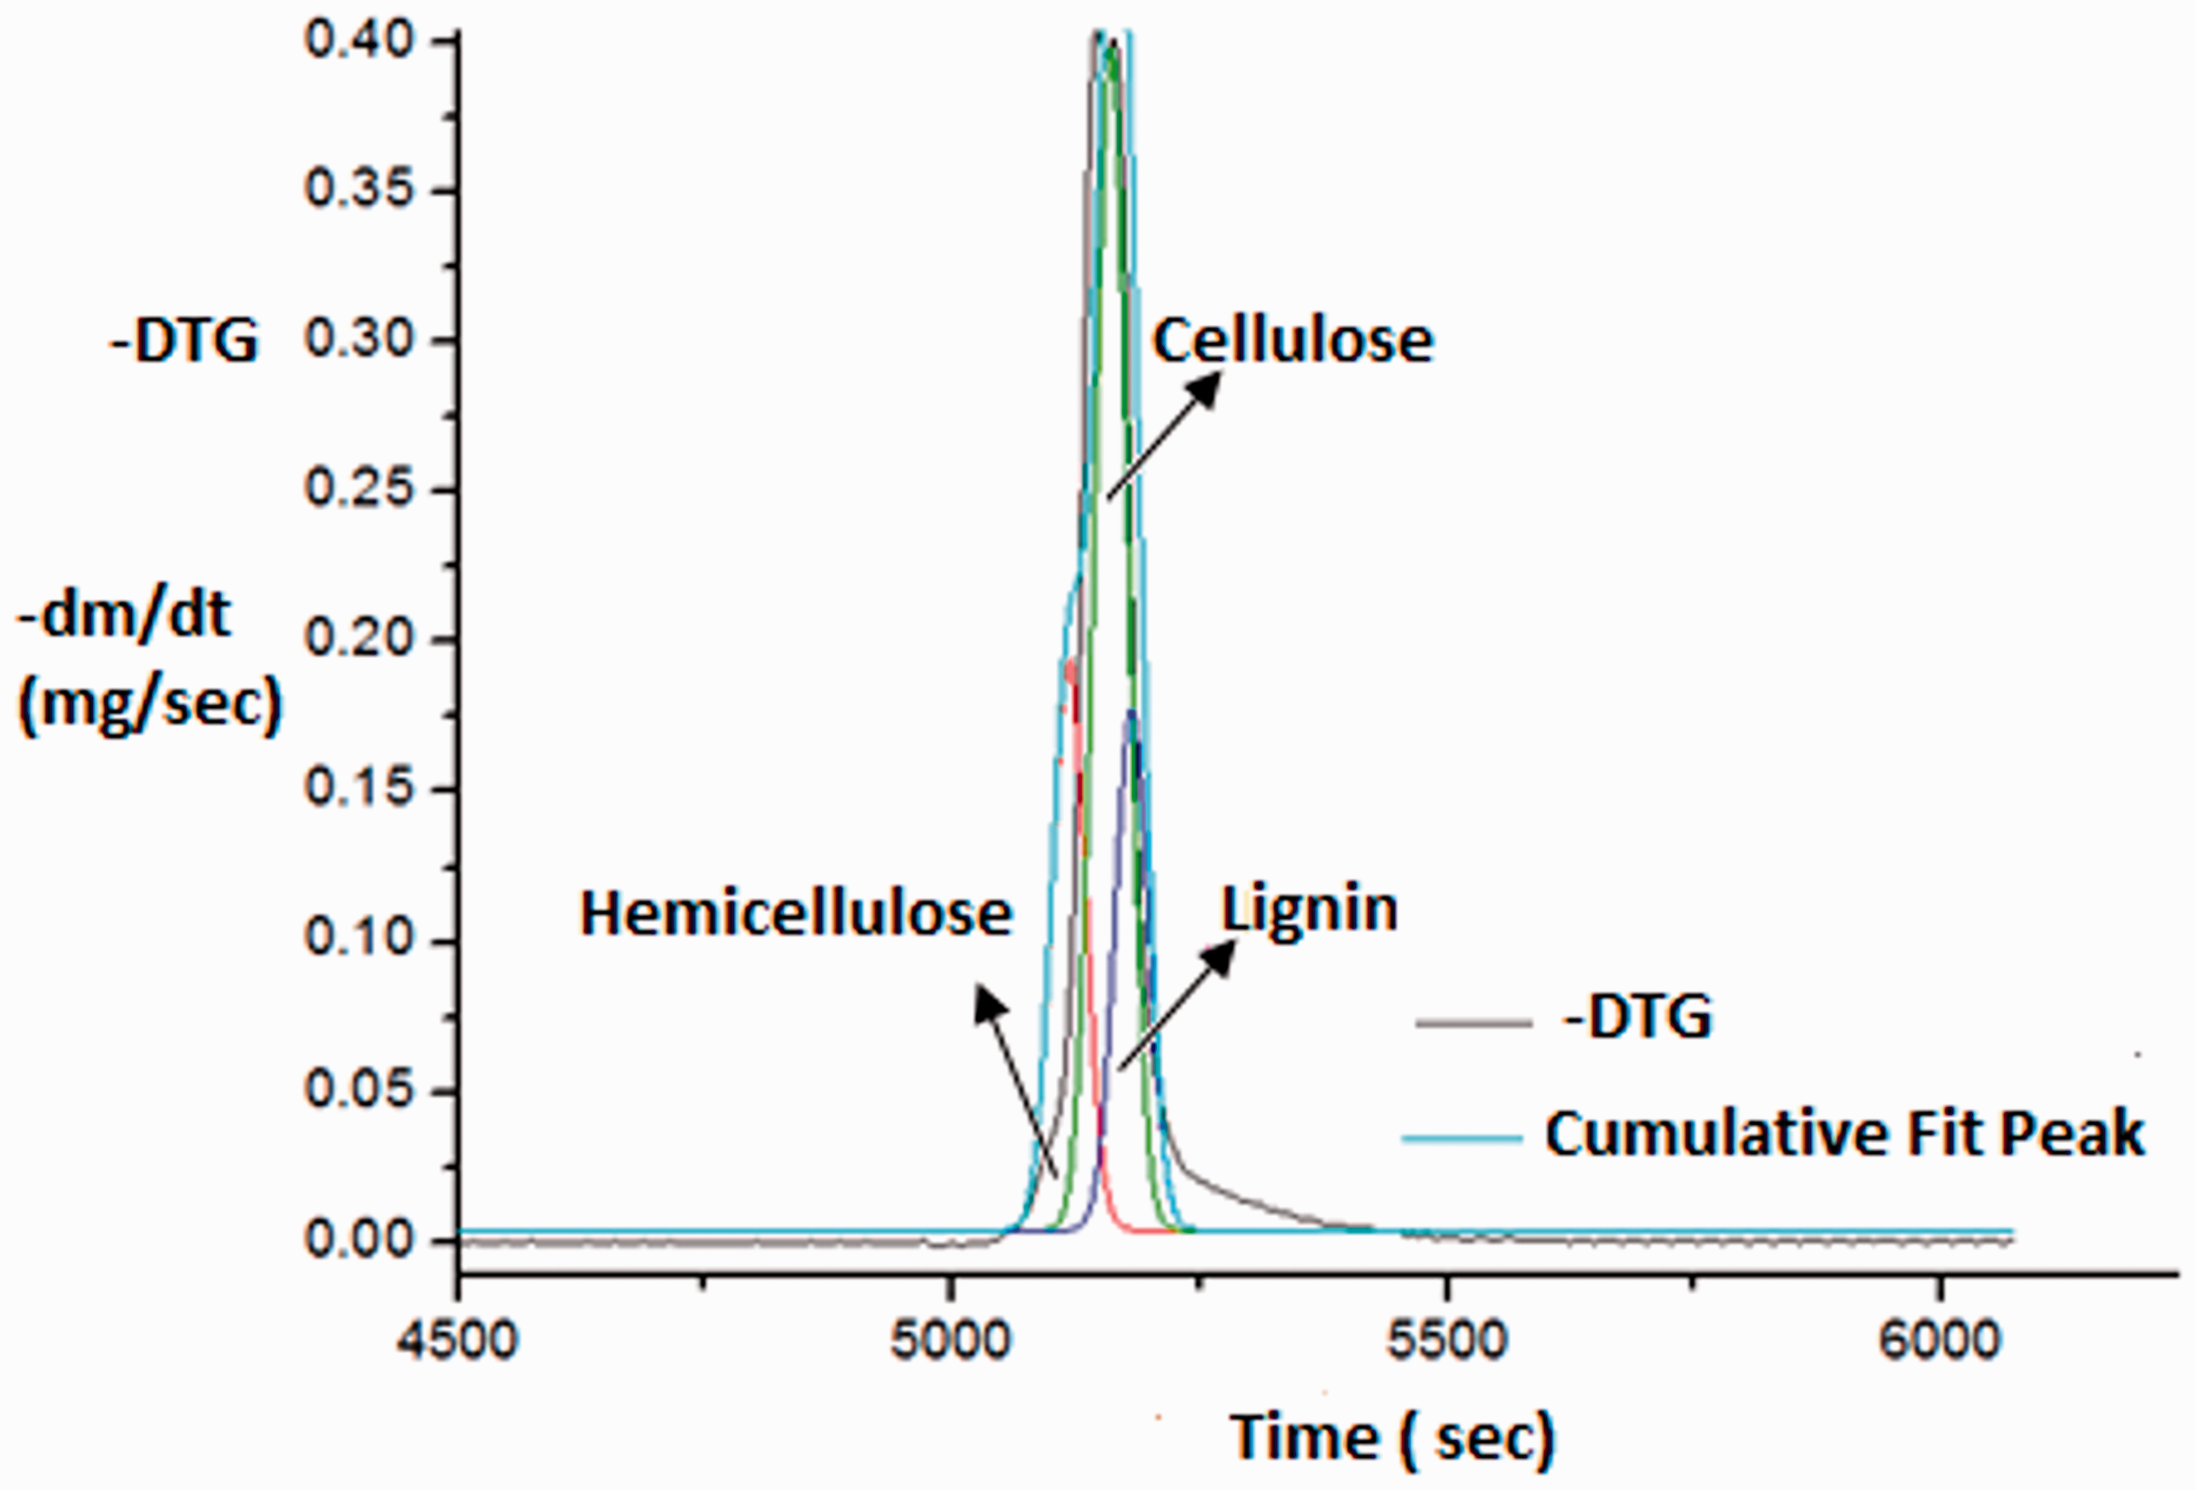
Deconvolution of the –DTG curve corresponding to the degradation of Marc.
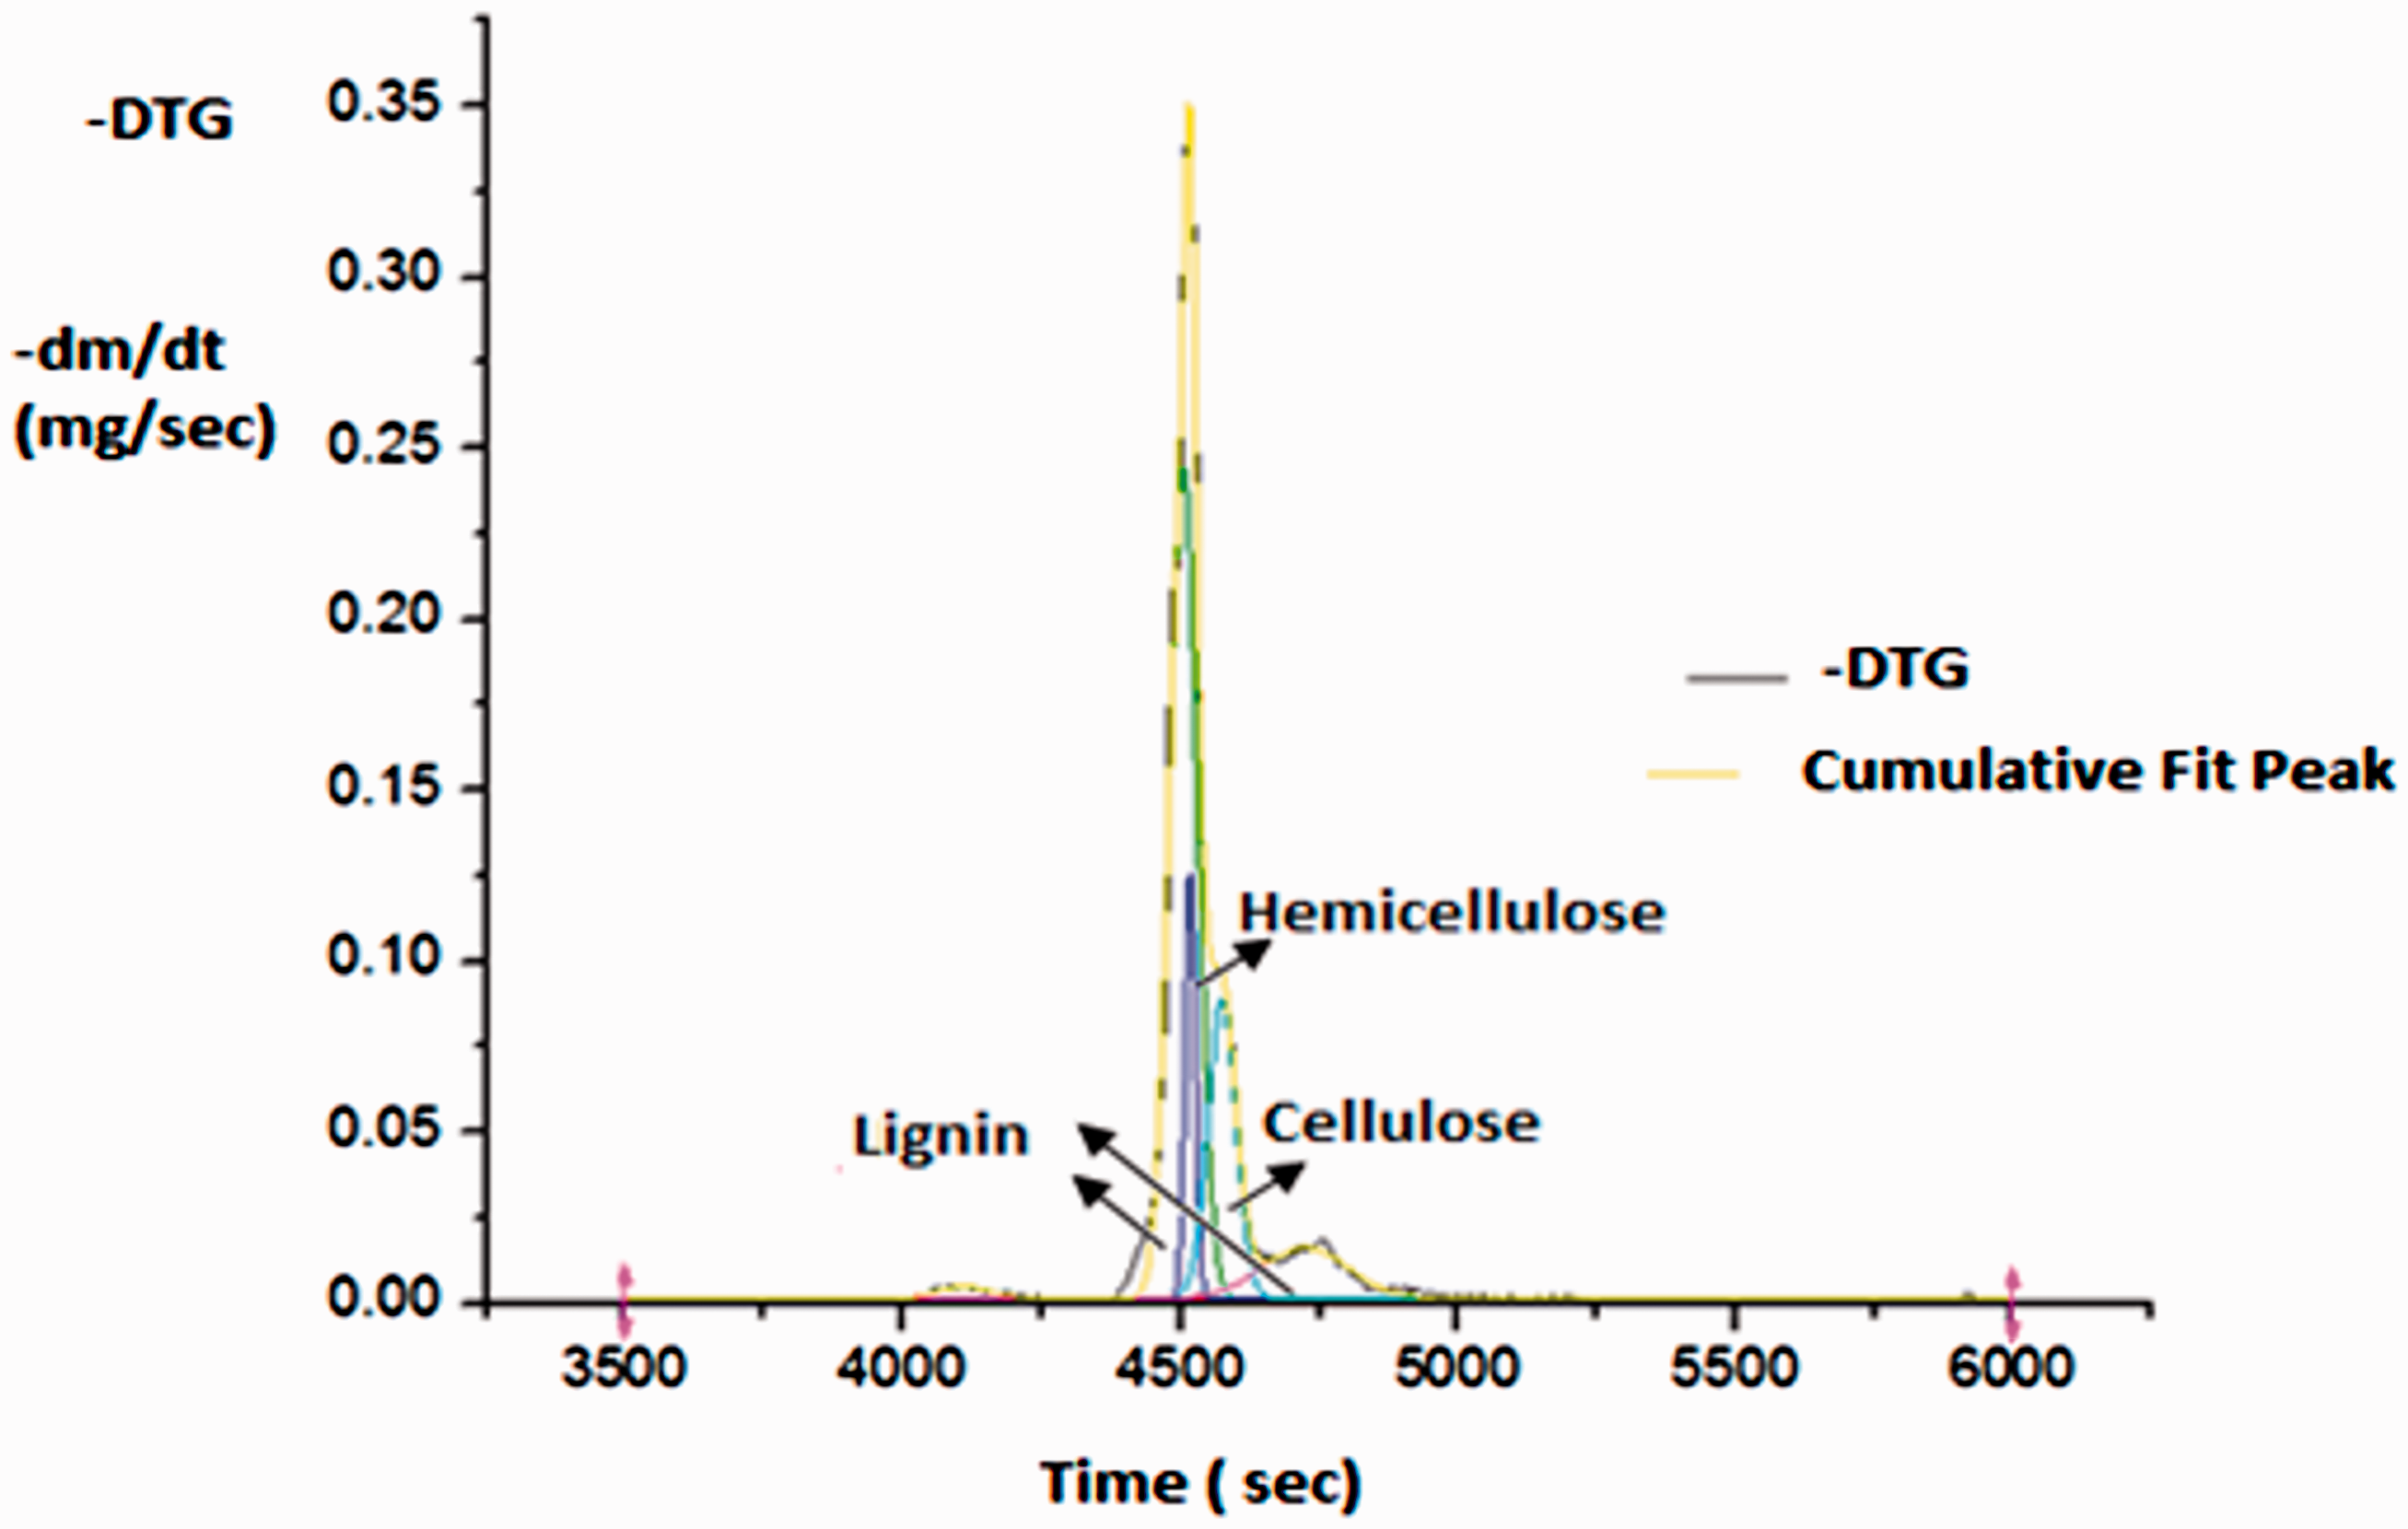
Deconvolution of the –DTG curve corresponding to the degradation of Stalk.
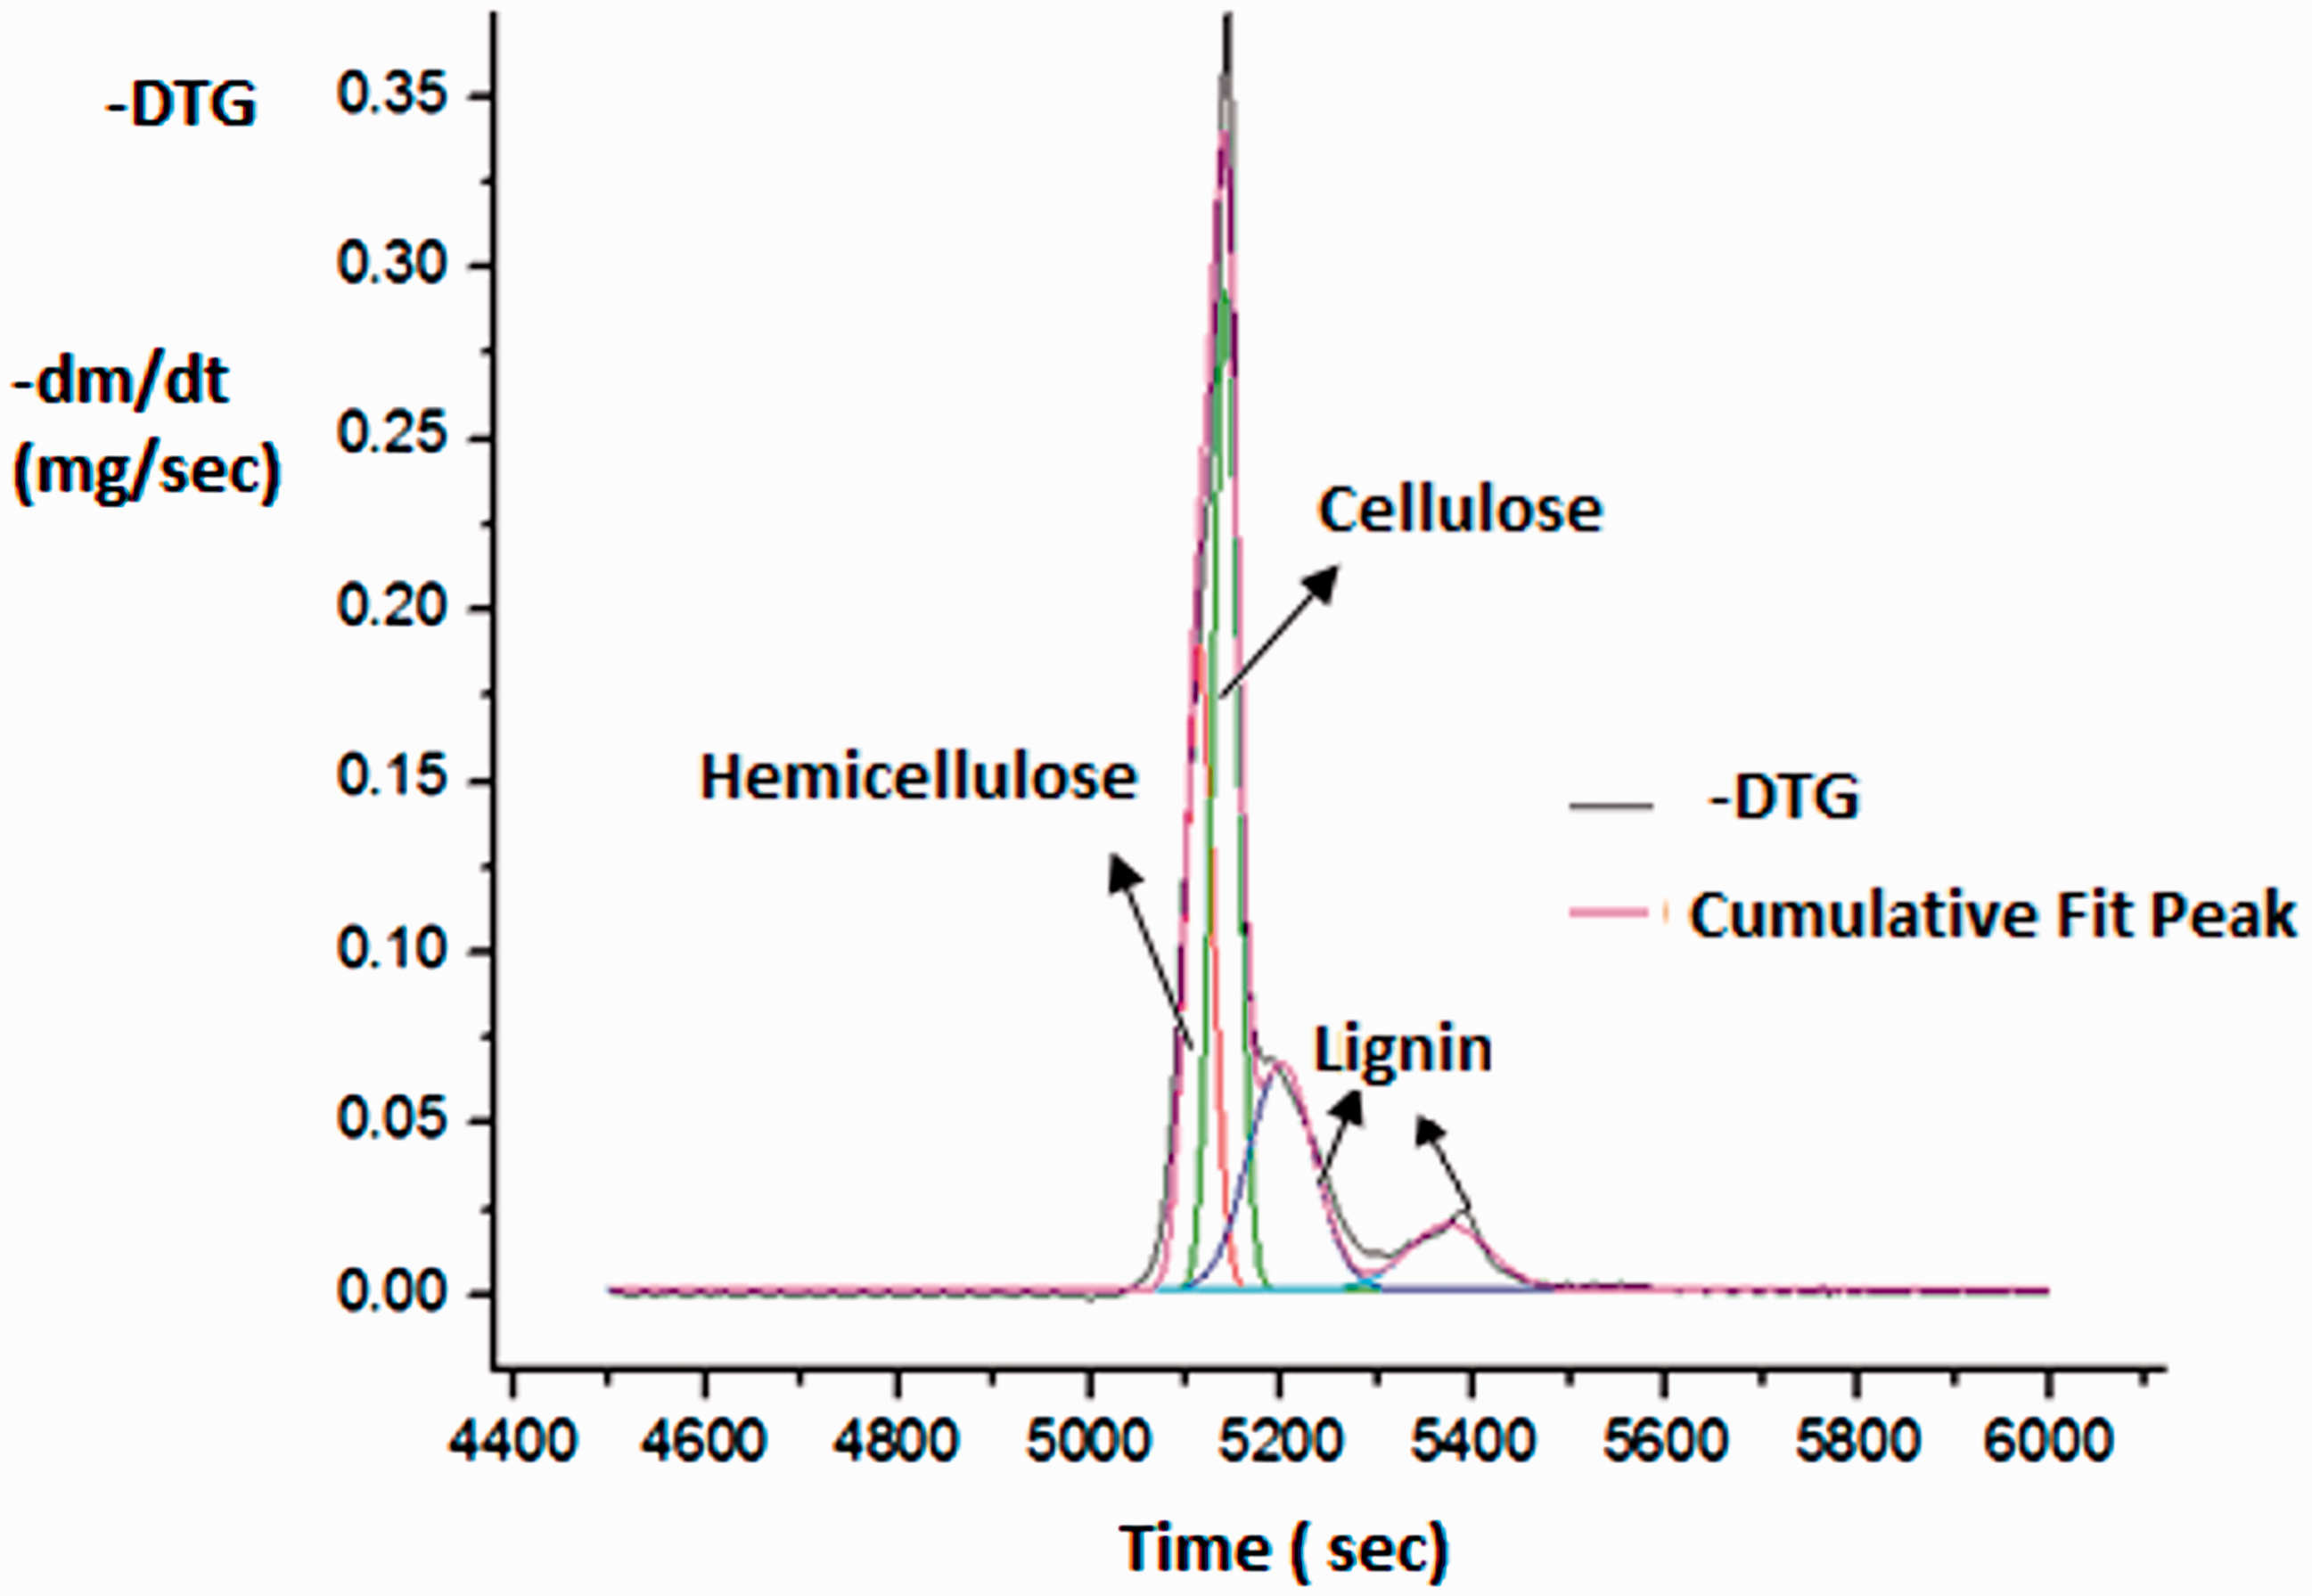
Deconvolution of the –DTG curve corresponding to the degradation of Sawdust.
Results and discussions
Characterization by standard methods
The results of the proximate by ASTM standard methods are shown in Table 1. The moisture contents were the 5.7%, 8.3%, 7.7%, and 5.3%, for peach pit, marc, stalk and sawdust, respectively. High water content increases the energy requirements to carry out the thermal treatment, rises the residence time for drying and reduces the temperature, resulting in incomplete conversion. These aspects decrease the process efficiency. Also, the moisture increases microbial respiration and thereby it reduces the fuels physical quality, especially its durability. Considering the obtained results, these biomass wastes can be used for energy production from different thermal treatments, without previous drying process.
The analyzed wastes showed a high VM content, generally more than 70% (Table 1). High volatile levels make the ignition easier at low temperatures, implying a high reactivity and hence, improving the thermal process. Also, other studies have shown that the high volatile content improves the overall rate of process due to gases release is also high during the pyrolysis step, being the gas–gas reaction rate faster than gas–solid reaction rate (Tchapda and Pisupati, 2014).
The FC is determined as the remain fractions after the VM is completely released. The higher VM/FC ratio improves the contact of reactants and reduces the residence time for the combustion process, indicating a higher reactivity degree of the biomass (Obernberger and Thek, 2004). This calculated ratio is 6.1, 3.14, 2.89 and 7.32 for peach pit, marc, stalk and sawdust, respectively.
Finally, the ash content affects the process costs and the environment, by the rise quantity of dust emission and reduction of thermal process efficiency because the increasing of its content causes the HHV diminution. Also, the high ash levels can produce slag deposits, creating a greater thermal resistance to heat transfer and requiring expensive maintenance equipment. In addition to this, depending on their composition, erosion may have originated in the reactor. The ash disposal and its reuse may also be affected by the composition, and in some cases these wastes can be used as fertilizer or as concrete additive for the construction. The ash content of peach pit is the lowest (Van Eijk, 2012). The results of ultimate analysis by ASTM standard methods are shown in Table 1. The ultimate analysis indicates that studied wastes are environmental friendly, with only trace amounts of nitrogen and sulfur because their values are depreciable. The HHV is 18.28, 17.87, 18.12 and 17.68 MJ/kg, for peach pit, marc, stalk and sawdust, respectively. Similar values are reported in the literature for wood (Damartzis et al., 2011; Demirbas, 2004; McKendry, 2002; Yang et al., 2007). The sawdust presents the maximum oxygen content corresponding to the lower HHV, it completely agrees with the values reported by McKendry (2002). Therefore, a higher oxygen concentration has a negative impact on the HHV.
Lignocellulosic biomass is composed mainly of three basic structural components; lignin, hemicellulose and cellulose. These component contents in biomass vary depending on the biomass type; also for the same biomass type, these contents depend on the environmental conditions of the generation place. So, the operation variables of determined thermal process should adapt to the variation of the biomass composition for a better performance.
In agreement with the current literature, the woody vegetable species have tightly bound fibers and they are richer in lignin, however, herbaceous vegetables have more loosely bound fibers, indicating lower lignin content (Stefanidis et al., 2014). Considering the obtained results (Table 1), the highest hemicellulose and lignin contents are present in peach pit, 21.02 and 37.97%, respectively. The sawdust has the highest cellulose content 42.96%.
McKendry worked with different biomass and he reported values for cellulose, hemicellulose and lignin equals to 40–50%, 20–40% and 10–40%, respectively (McKendry, 2002) and Yang et al. determined hemicellulose, cellulose and lignin contents about 20–40, 40–60, and 10–25% correspondingly (Yang et al., 2007). Hence, the obtained values are in the order of reported values by these authors.
Characterization by TGA
The found results of proximate analysis by TGA (ASTM E 1131-03 and Figure 2) are similar to the obtained data using standard methods (ASTM D3173-87, ASTM D3172-89 (02)).
Comparing the experimental results of ultimate analysis (Table 1) with the found values using the correlations proposed by Parikh et al. (2007b), it can be observed that they are similar.
The HHV was determined for correlations proposed by Parikh et al. (2005a), the calculated values are 18.28, 17.87,18,12 and 17.68 MJ/kg by peach pit, marc, stalk and sawdust, respectively (Table 2). Nhuchhen and Abdul Salam (2012) validated this correlation with experimental data. Demirbas and Arin (2002) determined experimentally the HHV of 16 different biomass fuels and reported similar values. Quirino et al. (2005) reported similar values for wood, too.
The lignin, cellulose and hemicellulose contents were determined using a methodology based on DTG curves deconvolution. The results are shown in Table 2. The hemicellulose, cellulose and lignin decompositions are in ranges around 220–315°C, 315–400°C, 180–900°C, respectively (Yang et al., 2007). The decomposition process depends on the content of these principal components. Figures 3 to 6 show DTG curves obtained during thermogravimetric experiments under nitrogen flows. In these figures, the observed peak results from the cellulose degradation and it is accompanied by a shoulder at low temperature, associated to hemicellulose degradation, and a tail at high temperature related to lignin decomposition (Poletto et al., 2010). This behavior is similar to the standard pyrolysis model (Barneto et al., 2009).
Pyrolysis curves of studied wastes, at constant heating rate under inert atmosphere, took place in visible stages of weight loss. The first stage, ranging from 25 to 125°C approximately, corresponds to the moisture loss and light molecules release. The derivative plot (DTG) had a separate peak for this zone of weight loss. The second step is observed as a shoulder in the temperature range between 150 and 450°C and it could be attributed to hemicellulose decomposition and partial cellulose and lignin degradations. The temperature for maximum decomposition rate is above 370°C and it can be attributed to the degradation of cellulose and it is also associated with the pyrolytic lignin degradation, starting with fragmentation of the inter-unit linkages (Popescu et al., 2010).
Then, in order to separate these elements and determine their contents, a variation of traditional thermogravimetric method is used in the region between 110 and 950°C under nitrogen atmosphere (Figure 1). This was also used by other authors (Saldarriaga et al., 2015). They determine lignin, cellulose and hemicellulose contents by deconvolution of the obtained peaks (Figures 3 to 6). The results are shown in Table 2. The obtained values were compared with standard ASTM (Table 1), being similar.
Considering the lignin content for the sawdust, a highest difference between the experimental and the predicted values was observed, although both values are in the same magnitude order. However, for all practical purposes, this difference can be considered negligible. The average error is about 3.82% using the TGA analysis.
As the objective of this work is to determinate the effectiveness of TGA in order to estimate all the usual analytical parameters required for a solid fuel characterization, a review of similar techniques used previously by other researchers was carried out, finding that:
The methodology used by Martyn Ottaway (Ottaway, 1982), suitable for coals and cokes, is the fastest test (8 min), however, this technique only calculates the proximate analysis without the determination of moisture content for that, this parameter must be obtained by the standard method.
Karatepe and Küçükbayrak (1993) used a technique very similar to the utilized technique in this work in order to obtain the proximate analysis results. These authors used a purge period equal to 30 min. This less time suggests that it is possible with its reduction. However, the technique proposed by these researchers has only been tested for lignite but, it has not been validated for biomass.
Barneto et al. (2009) used the TGA methodology (duration equal to 25 min) but they determined only the proximate analysis. The utilization of this technique for the determination of the lignocellulosic content is not possible as typical polymer constituents of biomass could be indistinguishable (the corresponding peaks would be superposed and deconvolution of curves TGA/DTG should be erroneous).
The methodology proposed by Saldarriaga et al. (2015) as a quick characterization from TGA experienments, takes 160 min, while the proposed method in this work lasts 145 min (which could be reduced to 115 min if we reduced the time of purging step).
Even though Saldarriaga et al. (2015) determined the same parameters obtained in this work, they calculated the lignocellulosic content using an algorithm more complex than the technique used in this paper.
The correlations proposed by Sheng and Azevedo (2002) for prediction of the lignocellulosic content of the biomass are not applicable to peach pit, marc, stalk and sawdust, as these wastes do not compliance all the limit restrictions of the correlations. Therefore, the methodology of the deconvolutions of the TGA curves proposed in this paper is applicable for a large range of biomass samples for predictions of the lignin, cellulose and hemicellulose because this has no limitations.
For the topics exposed above, the used technique in this work is the fastest for a complete qualitative and quantitative characterization of the waste biomass as the obtained errors are small and on the other hand, its obtantion allows to regulate the operating parameters of the thermal process according to the composition of different regional agro-industrial wastes.
Conclusions
The TGA is a fast and feasible alternative in order to determine the results of proximate and ultimate analysis and to predict the HHV. This is relevant because the elementary composition is one of the most important properties for the use of biomass as fuel. The experimental determination of the ultimate analysis data requires special instrumentation, while the proximate analysis data can be easily obtained using common equipment. However, the standard techniques require long operative time, so TGA presents a great advantage over it. Moreover, using the proposed technique, the hemicellulose, cellulose and lignin contents can be determined, too. All these parameters can be known only in one step, saving time.
This method of analysis is much simpler, faster and cheaper than the standard procedures for the characterization of lignocellulosic solid wastes used for the bioenergy production.
Footnotes
Declaration of conflicting interests
The author(s) declared no potential conflicts of interest with respect to the research, authorship, and/or publication of this article.
Funding
The author(s) received no financial support for the research, authorship, and/or publication of this article.