
Abstract
In this study, the corn cob was torrefied at five different temperatures (200, 225, 250, 275 and 300°C) for four different residence times (15, 30, 45 and 60 min). The physical and chemical properties such as proximate and ultimate analysis, true density, grindability and hydrophobicity of Thar coal along with raw and torrefied corn cob were investigated. To examine the changes in the functional groups of torrefied corn cob, more information was taken from spectrometric studies, by using Fourier transform infrared spectroscopy (FTIR). It was found that there is no significant improvement in the physical and chemical characteristics of torrefied corn cob at low torrefaction temperatures of 200 and 225°C, although as the torrefaction temperature and residence time increased, a significant improvement was found in the physical and chemical characteristics of the torrefied corn cob. At the maximum torrefaction temperature (300°C) and longer residence time (60 min), the physical and chemical characteristics of the torrefied biomass were found to be equivalent to Thar coal. The FTIR studies showed that due to torrefaction, the R-OH groups decrease and C=O groups were increased within the fuel. Due to this change, the tendency of corn cob to absorb water decreases and the biomass becomes more hydrophobic in nature. Thus, torrefaction is an effective way to improve the characteristics of corn cob to such an extent that it could be comparable to Thar coal, which is a lignite coal. Previously, different researchers proposed that energy intensification and mass loss of biomass are proportional to the heating temperatures of 200–300°C. All were tinged with uncertainty, as the temperature range is too wide and does not specify a precise effect of different torrefaction temperature towards particular biomass. While the present study gives a point by point comprehensive information, utilizing single biomass (Corn cob), underneath the maximum feasible temperature levels from 200 °C to 300 °C (for example 200, 225, 250, 275 and 300 °C) and residence time (15, 30, 45, and 60 minutes). This comprehensive data may facilitate better optimization of the torrefaction conditions.
Introduction
Pakistan has 185 billion tons of Thar lignite coal. On the other side, Pakistan is an agricultural country rich in agricultural residues. The annual production of corn cob is 600 million metric tons. There are some challenges associated with the biomass. Biomass absorbs moisture easily, which leads to degradation upon long storage and results in a low heating value fuel. This characteristic, coupled with low energy density, makes it more expensive for transportation (McKendry, 2002). Furthermore, biomass is fibrous in nature and tenacious to grind to desired particle sizes which require high energy input. Prior to grinding, the biomass requires drying, as moisture is an important factor during milling (Arias et al., 2008).
The chemical and physical properties of a biomass can be upgraded by carrying out torrefaction, a developing process, which is believed to become a leading technology (Bergman and Kiel, 2005). It is a mild pyrolysis pre-treatment, which involves a moderate temperature of about 200–300°C in the absence of oxygen. Several studies have been conducted using different temperatures within the range of 200–300°C and at residence times from 30 to 60 min (Mani et al., 2004). Characterization of solid torrefied biomasses such as standard fuel analysis, mass retained and energy retained is vastly under research at present. A few studies extended the reaction time from 3 to 5 h. In general, all results have shown that the more severe the torrefaction conditions, the easier is the grinding of the biomass and the greater the amount of energy that can be saved during this process. However, with the elevated torefaction temperature, mass loss of the solid torrefied product also goes on and there should be a balanced between temperature and other torrefaction conditions to retain high energy in solid torefied fractions. Therefore, choosing an optimum operating condition is crucial, as different types of biomass give different outcomes (Ibrahim et al., 2013). This thermal pre-treatment produces a more hydrophobic and grindable solid product compared to the raw material as reported in few previous studies where significant improvement of their grindability properties was observed (Arias et al., 2008; Chen et al., 2011). The present study focuses on the investigation of the physicochemical composition of the solid torrefied biomass (corn cob) along with Thar coal. A range of characterization methods were used, including proximate and ultimate analyses, hydrophobicity, grindability and true density. Fourier transform infrared spectroscopy (FTIR) was used to study the changes in the chemical structure of torrefied biomass. Moreover, another objective of this study was to investigate the effect of torrefaction on the physical characteristics of the corn cob at different temperatures and at different residence times. Previously, different researchers proposed that energy intensification and mass loss of biomass are proportional to the heating temperatures of 200–300°C. All are tinged with uncertainty, as the temperature range is too wide and does not specify a precise effect of different torrefaction temperatures towards a particular biomass (Teh and Jamari, 2016). The present study gives a detailed baseline data, employing a single biomass fraction (Corn cob), under the maximum possible temperature ranges from 200°C to 300°C (i.e. 200, 225, 250, 275 and 300°C) and residence times (15, 30, 45, 60 min). These comprehensive data may facilitate better optimization of the torrefaction conditions. Furthermore, torrefaction improves the characteristics of corn cob to such an extent that it becomes comparable to Thar coal, which is lignite coal. Corn cob was torrefied at different temperatures, i.e. 200, 225, 250, 275 and 300°C.
Experimental methodology
Sample collection
The samples used in this study are corn cob and Thar coal. The corn cob was collected from an agricultural field of Okara (southern Punjab), Pakistan, cultivated during February–March season and handpicked in May–June. Thar coal was taken from block III of coal deposit in Sindh Province. The corn cob measuring 3 mm was taken for the study.
Pre-treatment analyses
Proximate analysis of coal was performed according to the ASTM standard D-3172-07a, whereas the proximate analysis of raw corn cob was performed according to the ASTM standards: E-871 for total moisture, E-872 for volatile matter, E-1755 for ash content and D-3172 for fixed carbon content. Ultimate analysis of raw coal and corn cob was carried out using an elemental analyzer Flash 2000 CHONS according to ASTM D-5291. The heating value was measured in a Digital Bomb Calorimeter (LECO AC500) according to ASTM D-5865. Subsequently, the true density was measured in a PMI Helium Pycnometer as per DIN-66137–215. All the analyses were repeated thrice and their mean values are reported here. The results of raw corn cob and coal are listed in Table 1.
Proximate and ultimate analysis of Thar coal and raw corn cob (dried basis).
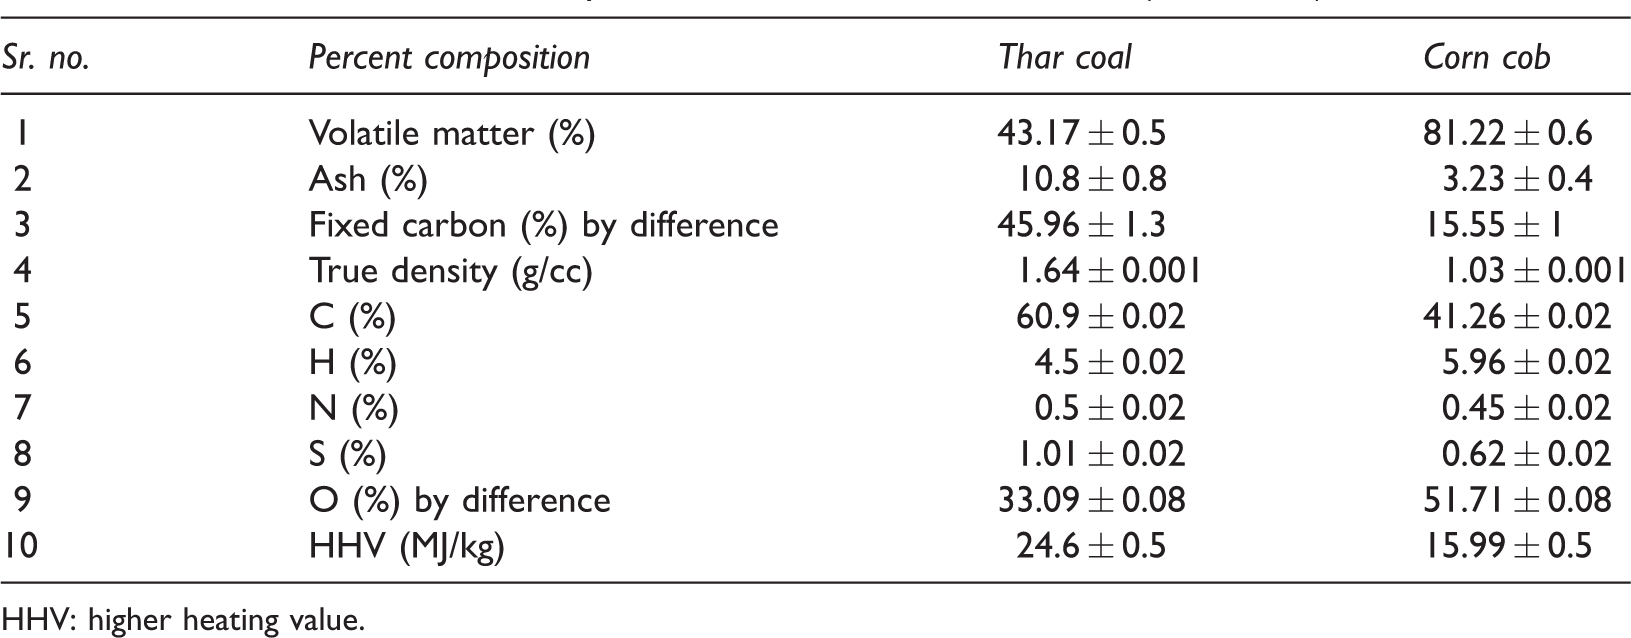
HHV: higher heating value.
Torrefaction
Prior to the main torrefaction experiments, corn cob was dried at 105 °C for 24 h to eliminate the free water. Torrefaction was carried out in a lab scale tube furnace (Figure 1). A dried corn cob sample of about 10 g was used per batch. A constant flow of nitrogen at a flow rate of 3 ml/min was supplied to the tube furnace to ensure an inert atmosphere and to avoid any combustion of biomass in the tube, whereas the heating rate was fixed at 50°C/min for all the runs. In the inner stainless tube, a fine mesh was inserted and fixed to prevent any transference of un-torrefied particles with flow of nitrogen towards flue gasses. Therefore, complete torrefaction was ensured and internal diffusion of solid particles was restricted. The corn cob was torrefied at five different temperatures (200, 225, 250, 275 and 300°C) and at four different residence times (15, 30, 45 and 60 min).
Lab. scale torrefaction setup.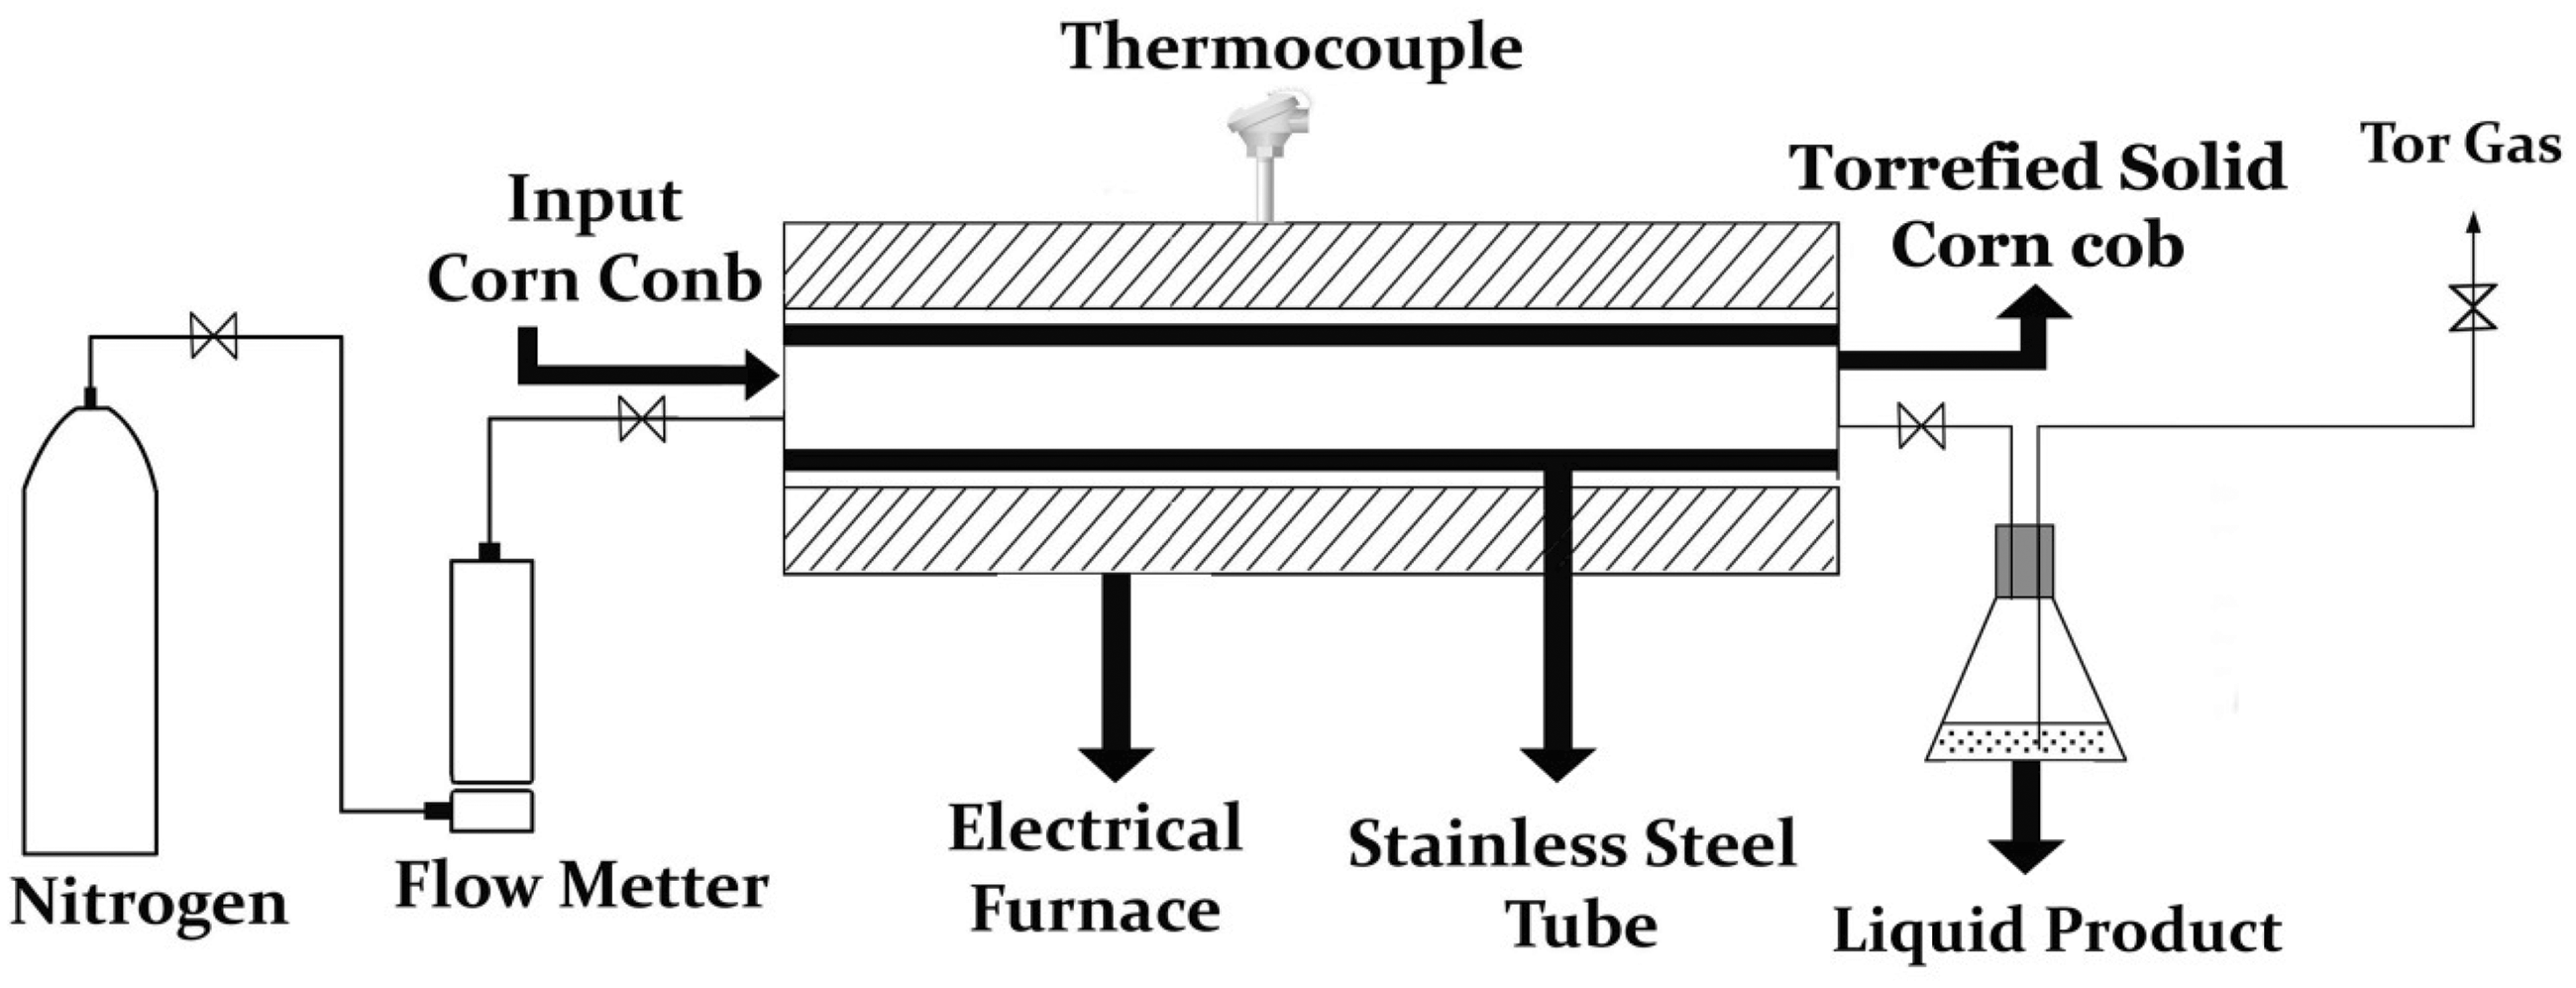
After the desired temperature and residence time, the sample was taken out of the furnace and desiccated. Each test was repeated three times under the same conditions to ensure reproducibility of results. The resultant torrefied product was desiccated, weighed and the mass yield, was calculated as percentage of the original dry mass sample, by using equation (1)

From measured calorific values and mass yield, energy yield, was determined, by using equation (2)

Post-torrefaction analyses
Proximate and ultimate analysis of the torrified fractions of corn cob was performed as referred in the ‘Pre-treatment analyses’ section. All the analyses on torrefied samples were not repeated three to four times, but results are reported after obtaining constant weights as per their respective ASTM standards. All the figures and tables show the results after achieving constant weights. Moreover, some additional tests were performed to investigate the physicochemical nature of corn cob, which are as follows.
Composition analysis
The contents of hemicellulose, cellulose and lignin in biomass were determined by the analytical methods, following their respective Tappi standards (Di Blasi et al., 1999).
Estimation of extractives
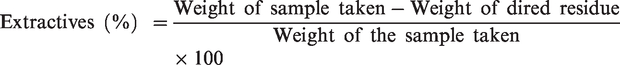
1 g of dried biomass sample with 60 ml acetone was placed in a round bottommed flask at 90°C for 2 h. After that the sample was dried at 105°C until a constant weight was obtained. The weight difference before and after the extraction is the amount of the extractives.
The formula of extractives was calculated by
Estimation of hemicellulose
1 g of extractive free biomass with 10 ml of 0.5 mol/l of sodium hydroxide solution was mixed and held at 80°C for 3.5 h. After that the sample was washed with distilled water until the solution attained neutrality. Then it was dried to a constant weight. Weight difference before and after drying was hemicellulose content. The formula of hemicellulose was calculated by

Lignin estimation
30 ml of concentrated sulfuric acid was added in an extractive free dried biomass. The sample was held overnight for 24 h and boiled at 100°C for 1 h. Decantation of boiled samples was done. After that the mixture was filtered and the residue was titrated with 10% barium chloride solution until the sulfate ion in the filtrate was unexposed. Clear filtrate was dried in a heating oven at 100°C till constant weight was achieved. This weight difference was recorded as the lignin content.
The formula of lignin is as follows

Cellulose estimation
Cellulose was estimated by summing up the percentages of extractives, hemicellulose and lignin.
The formula of cellulose was calculated by

Grindability test
The grindability of raw and torrefied corn cob was evaluated and compared by using a modified version of the Hardgrove Grindability Index (HGI) previously used by Bridgeman et al. (2014). In this modified method, the same fixed volume (50 cm3) for each coal and biomass sample was used instead of a fixed weight. The HGI machine was calibrated with coals of known HGI values (39, 57, 87 and 100) as described in Bridgeman et al. (2014).
Calibration of HGI Machine
About 1000 g of a standard reference coal with known HGI is ground using a crushing mill and sieved the entire amount (1000 g) of air-dried 4.75-mm (No. 4) sieve size sample, for 2 min in the mechanical sieving machine. The sample is then sieved using 1.18 mm and 600 µm size sieves. About 50 cm3 of each sample is then measured out and weighed using a measuring cylinder with an accuracy of ± 0.1 cm3 and a balance accurate to ± 0.01g. The 50 cm3 sample is then distributed evenly in the grinding bowl, which contains the balls and ground for 2 min at 165 rpm. The sample is then removed from the grinding bowl and separated using a 75 µm sieve and a sieve shaker (5min). The two separate fractions are weighed to the nearest 0.01 g. if there is a loss of sample greater than 0.5 g the test is aborted and repeated. The mass in grams passing through the 75 µm sieve is calculated using
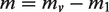
where mv = mass of 50 cm3 sample
m1 = mass of sample collected on 75 µm sieve
The process is repeated three more times and an average value from the four results calculated. The process is repeated for the three other coals. (for this study four coals of HGI values of 39, 57, 87 and 100 were used.) The results are used to plot a calibration curve for the mill of HGI versus m.
The particle size distribution profiles for the raw and torrefied biomass in comparison to Thar coal were also determined, using the method described in Ibrahim et al. (2013). The samples were ground and sieved using a series of 1.18 mm and 600 µm sieves. About 50 cm3 volume of the sample collected on the 600 µm sieve was taken to a mill for further grinding. The obtained ground sample was then sieved using a series of sieves of mesh sizes 600, 335, 212, 150, 75 and 53 µm. The sample mass retained on each sieve was calculated and documented as a percentage of the original sample mass.
Hydrophobicity
Hydrophobicity of raw and torrefied biomass was determined by immersion test. About 0.5 g of corn cob sample having particle size <1 mm was taken and immersed in deionized water at room temperature in a sintered glass filter for 2 h, followed by air drying for 1 h, before the estimation of its moisture content.
FTIR analysis
Carry-630 FTIR Agilent Tech. Spectrometer was used to carry out the spectroscopic studies of raw and torrefied corn cob samples and the changes in the functional groups of the corn cob were reported by using this instrument. For all the raw and torrefied samples, fixed weight was taken.
Thermogravimetric analysis
Combustion characteristics of raw corncob, Thar coal and torrefied corn cob (at 300°C and 60 min) were determined by a thermogravimetric analyzer (TGA LECO 701) under air atmosphere. The flow rate of air was kept at 3.5 l/min. The sample with a mass of about 0.5 g was heated from 25 to 950°C with a heating rate of 20°C/min.
Results and discussion
Chemical characterization of torrefied biomass
Proximate analyses
The effect of torrefaction conditions (different temperatures and residence times) on the proximate analysis of corn cob in comparison to non-torrefied sample is presented in Figure 2. It can be seen from the presented results that with an increase in torrefaction temperatures from 200 to 300°C, the volatile matter gradually decreased. The volatile matter content changed little at 200 and 225°C, while at 250, 275 and 300°C, a significant reduction was observed. The presented data indicate that an increase in the torrefaction temperatures and residence times leads to a decrease in the volatile matter content and an increase in fixed carbon content (Ohliger et al., 2013; Sadaka and Negi, 2009; Wannapeera et al., 2011). It was found that at severe torrefaction conditions (300°C and 60 min), the proximate constituents of corn cob become equal to Thar coal. The % of VM and fixed carbon in corn cob were 44.55% and 48.51%, respectively, at 300°C and 60 min that is almost equal to the values of Thar coal that were 43.17% and 48.51%, respectively.
Effect of residence time and temperature on percent composition of torrefied corn cob.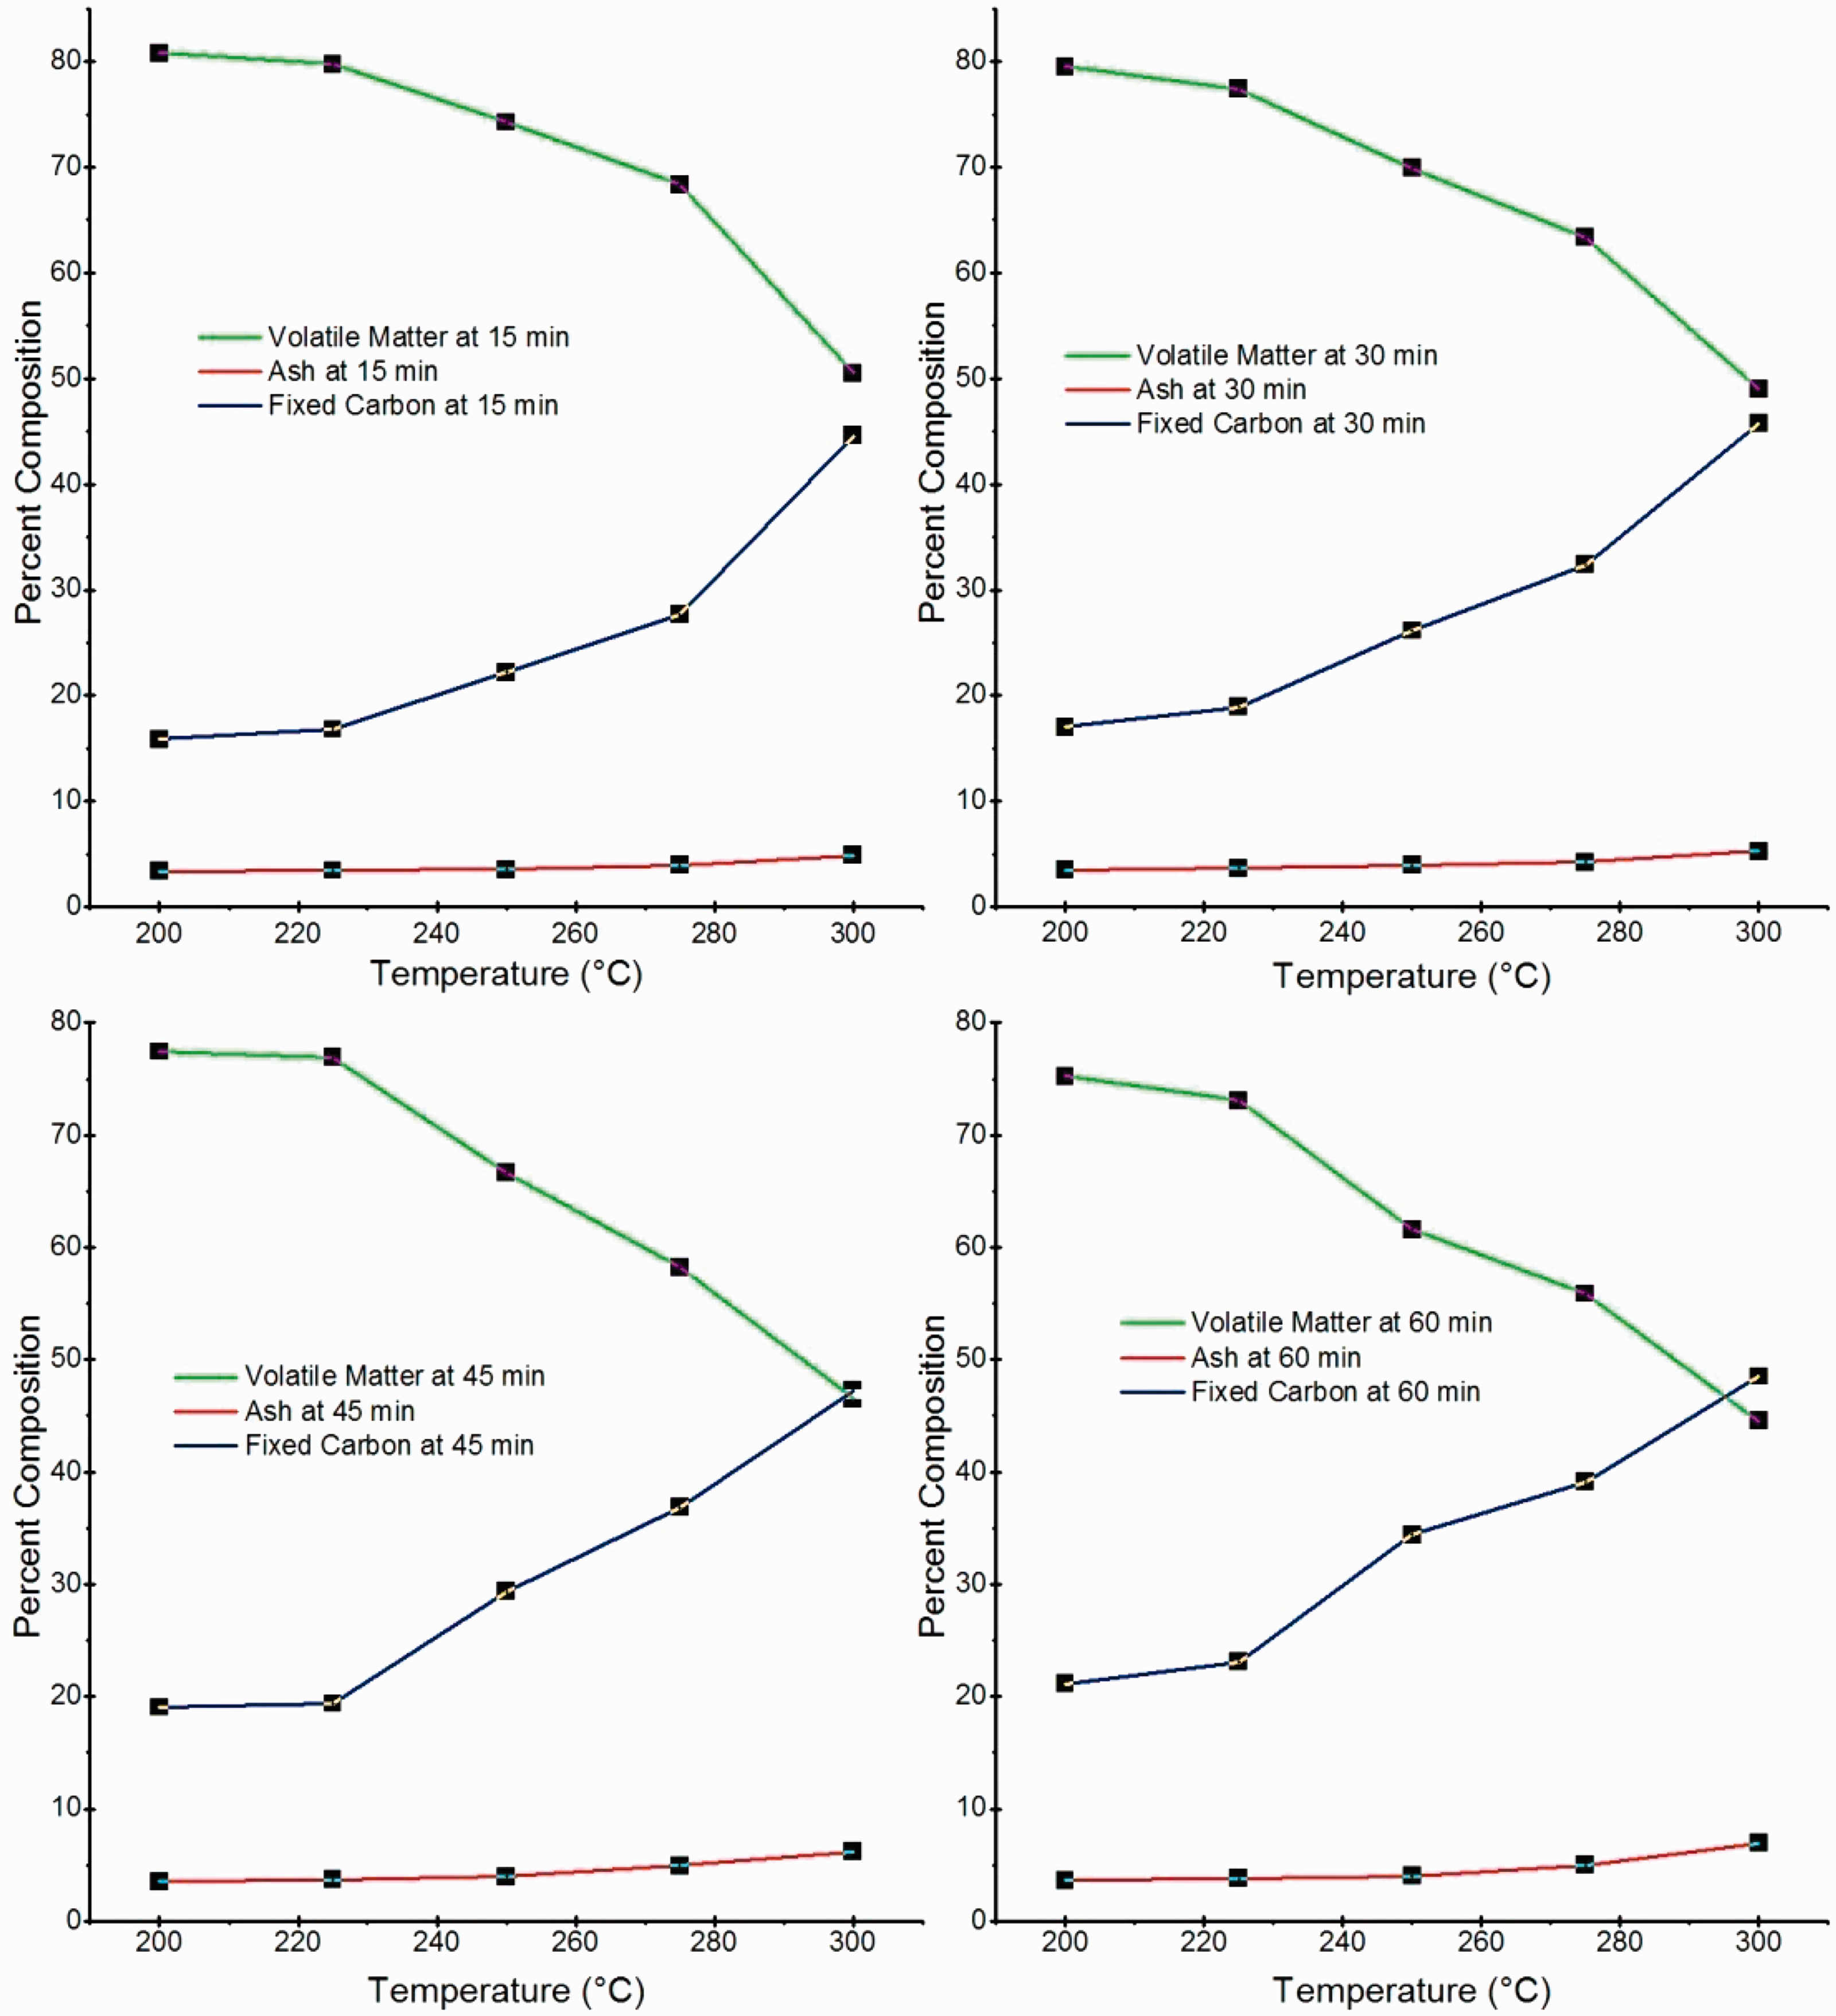
As the torrefaction temperature and residence time increases, ash content also increases (Figure 2). It could be due to a loss of mass of organic matter content in the form of volatile matter released during torrefaction. This could result in retention of ash in the solid products leading to an increase in ash content in torrefied corn cob (Chen et al., 2014; Phanphanich and Mani, 2011).
Ultimate analyses
An increasing trend in the carbon content was found with an increase in torrefaction temperature and residence time (Table 2). A maximum carbon content of 55.27% was recorded at 300°C and 60 min, which is almost equal to carbon content in Thar coal. The oxygen content of the torrefied corn cob was found to be significantly reduced. This could be due to different reactions during torrefaction involved in the formation and release of CO, CO2 and water vapors (Park et al., 2013; Poudel and Oh, 2014). A decrease in hydrogen content at low torrefaction temperatures (200 to 225°C) was found to be almost negligible. It was found that with an increase in torrefaction temperature and residence time, the hydrogen content decreases. A maximum reduction of 3.77% was found at maximum torrefaction temperature and residence time (300°C and 60 min). This could be due to the fact that some of the hydrocarbons such as C2H6 and CH4 are released only at higher temperatures (Arias et al., 2008; Chen et al., 2014). The torrefaction can release some of the volatile organic sulfur as per the findings of Ren et al. (2017a, 2017b). In the current study, the torrefaction process also significantly reduces the sulfur content of the torrefied biomass but has a negligible impact on the nitrogen content (Yoo and Choi, 2016). However, it could be observed from Tables 1 and 2 that at severe torrefaction condition, the CHNSO contents of torrefied corn cob almost become similar to Thar coal.
Effect of temperature and residence time on Elemental composition and HHV (MJ/kg) of torrefied corn cob (dried basis).
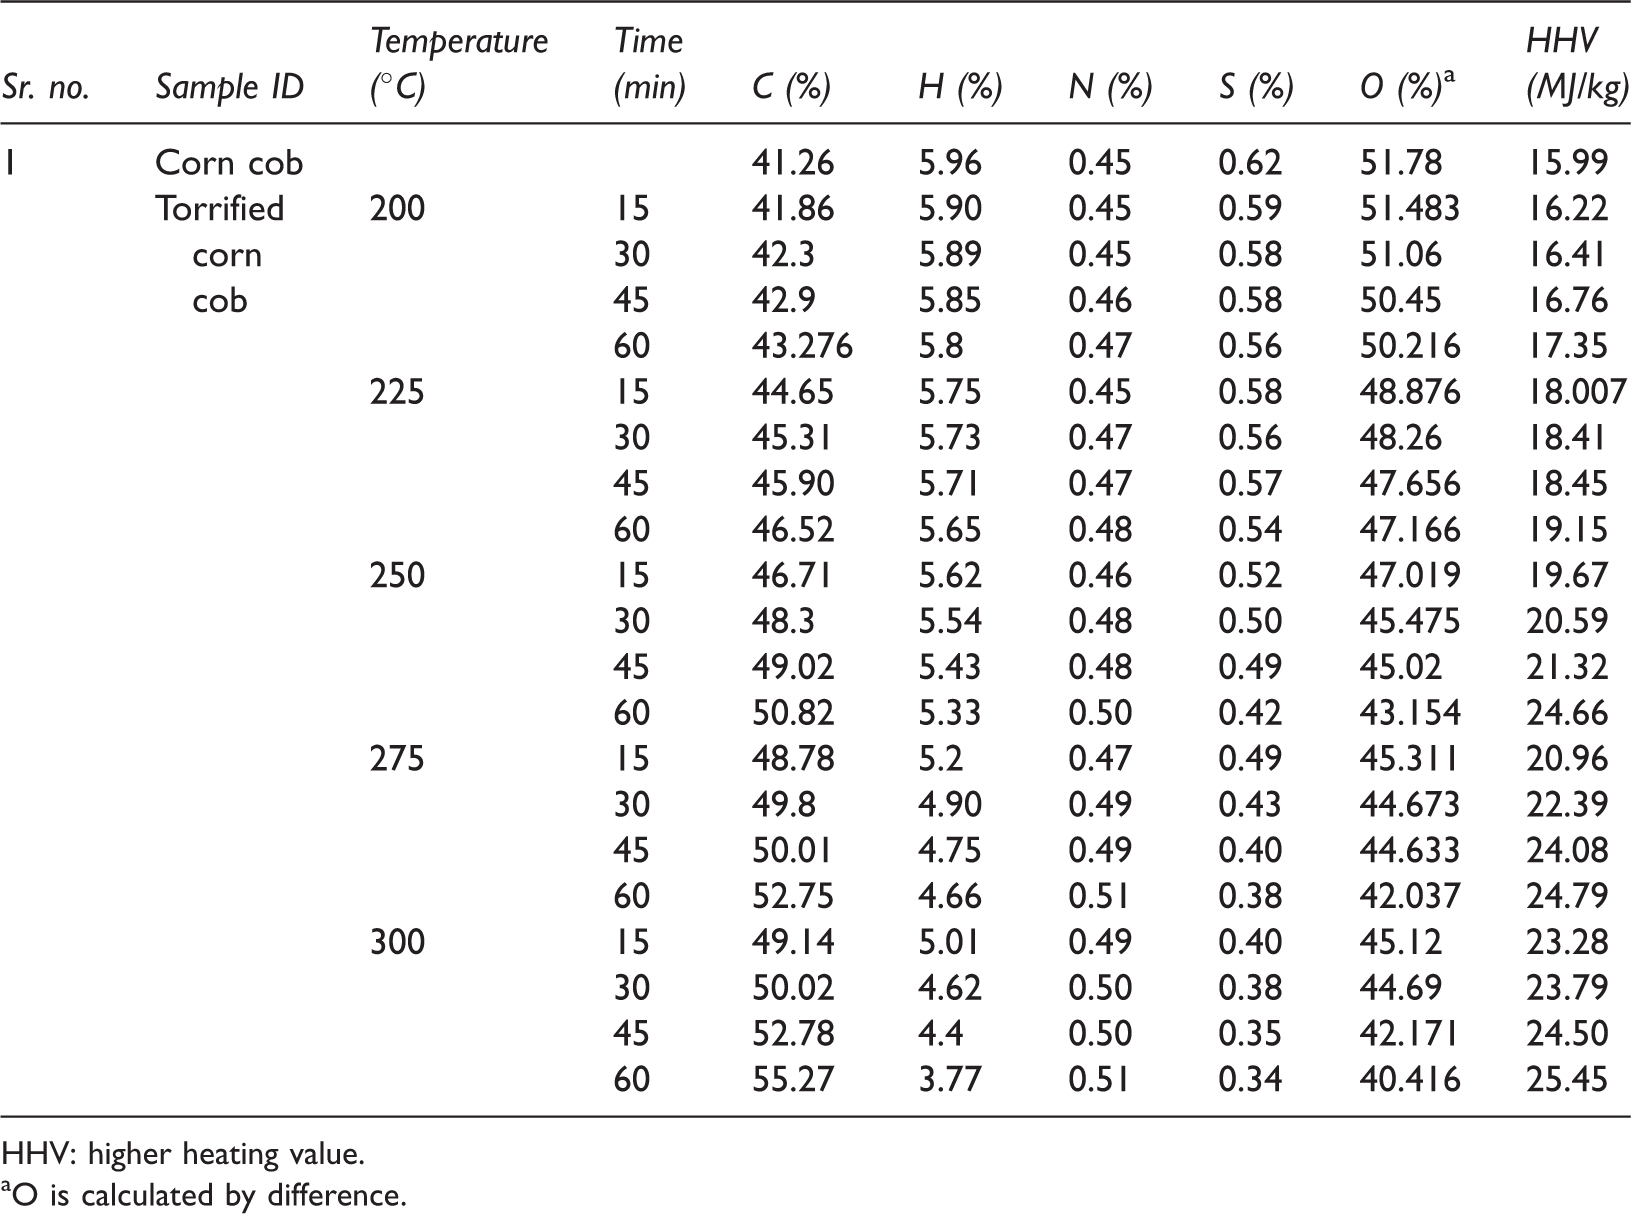
HHV: higher heating value.
aO is calculated by difference.
Heating values
It was found that with an increase in the torrefaction temperature and residence times, the heating value also increases. A maximum increase was observed at 300°C and at 60 min residence time, i.e. 25.45 MJ/kg which is almost equal to heating value found in Thar coal, i.e. 24.6 MJ/kg. An increase in heating value could be due to decrease in moisture content and increase in C/O ratio that resulted due to torrefaction (Chen et al., 2014; Meng et al., 2012).
Composition analysis
The effect of torrefaction temperature and residence time on the chemical composition of corn cob is shown in Table 3. During torrefaction, hemicellulose decomposed rapidly, as it is the more reactive constituent of biomass (Lipinsky et al., 2002; Prins et al., 2006). The decomposition of hemicellulose starts at low temperature, and at mild torrefaction temperature of 250°C, the hemicellulose was found to be 14.5%, and at 275°C, it was found to be 10.9% at a residence time of 60 min. At severe torrefaction temperature of 300°C and 60 min residence time, the hemicellulose could have decomposed rapidly and the value dropped to 6.5%. The cellulose content slightly decomposed between the temperatures of 200 to 250°C. It is evident that cellulose partially decomposed at 275°C, and at 300°C, a rapid decomposition was recorded (Table 3). It could be due to the fact that cellulose is formed from glucose polymer with no branches that make it thermally stable, and thus it was decomposed at high temperature (Chen et al., 2011; Yang et al., 2007). A remarkable degradation of hemicellulose followed by a moderate decomposition of cellulose increased the lignin content to a large extent (Chen et al., 2011). These findings are in accordance with the findings of Chen et al. (2011, 2014), Phanphanich and Mani (2011), Zheng et al. (2012). It could be observed from Table 3 that after severe torrefaction conditions (300°C and 60 min), the true density of corn cob was recorded as 1.60 g/cm3 which is almost equal to the true density of Thar coal that was 1.64 g/cm3.
Effect of temperature and residence time on fiber composition of torrefied corn cob (dried basis).
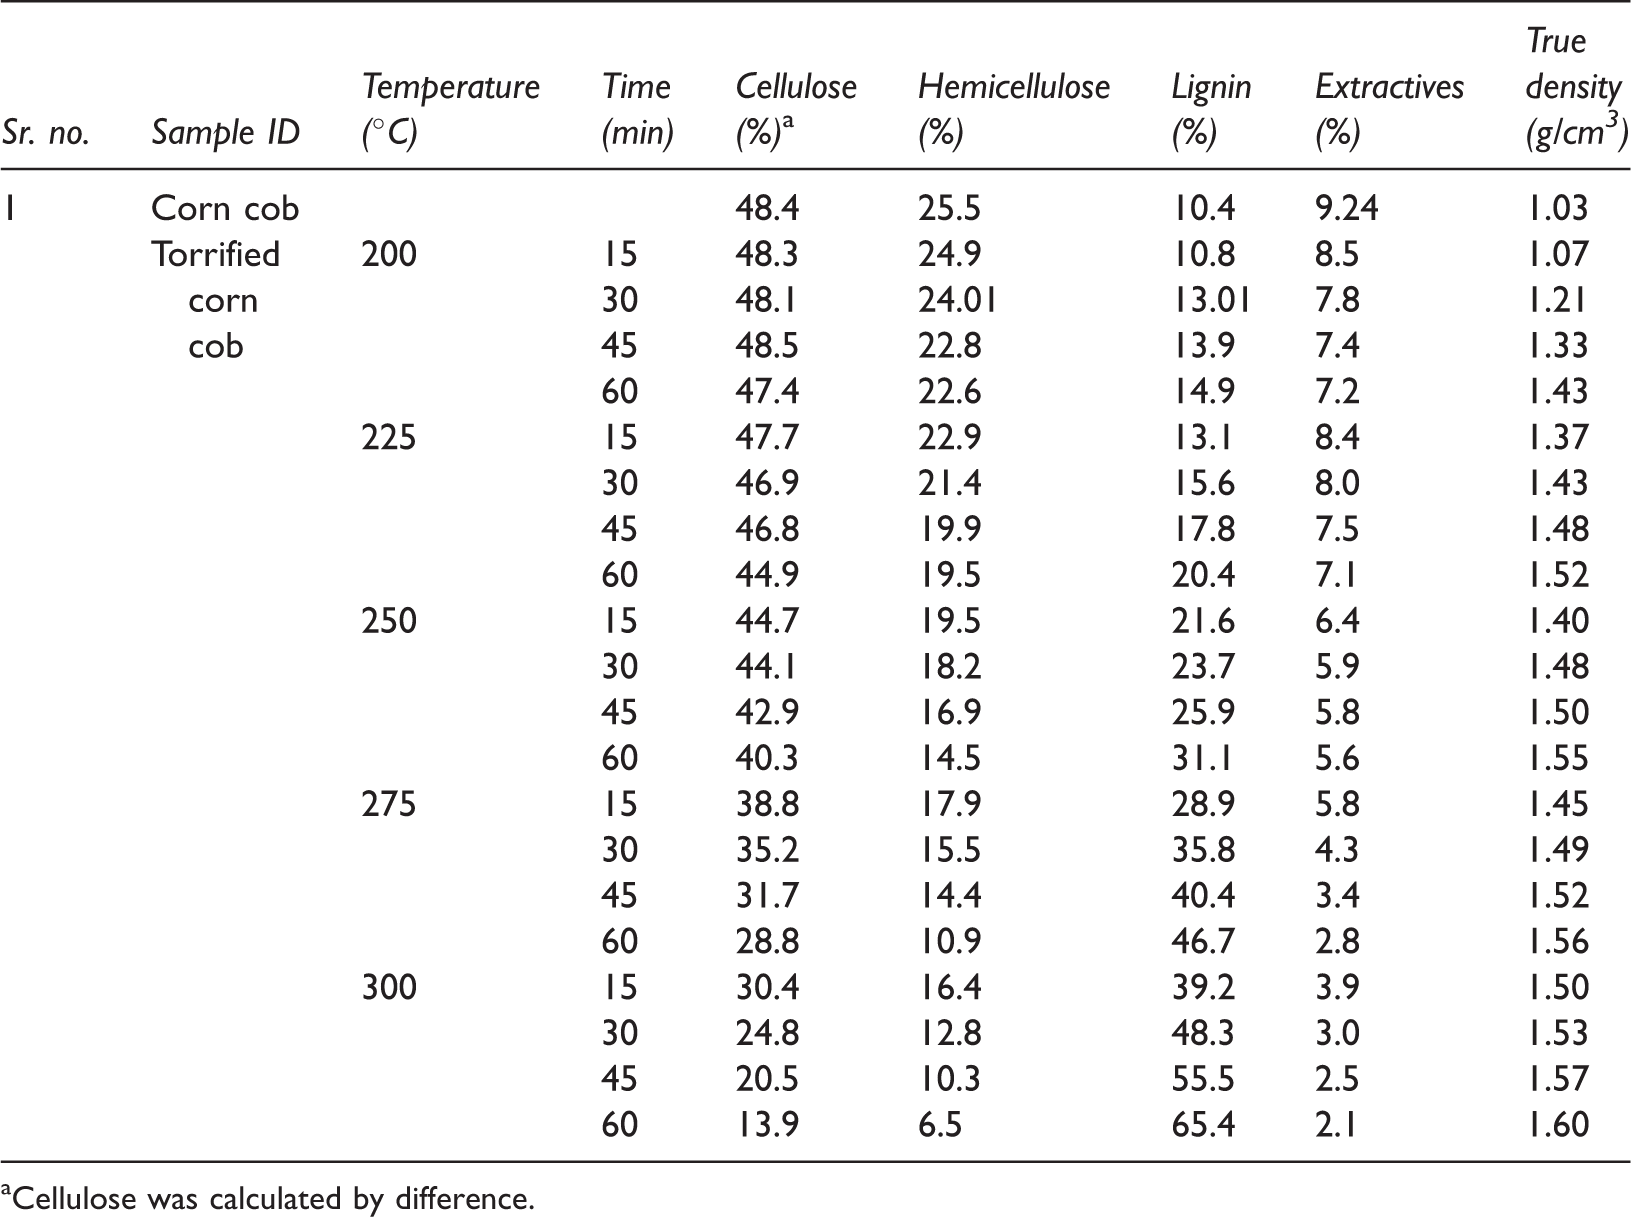
aCellulose was calculated by difference.
FTIR spectra of corn cob and coal.
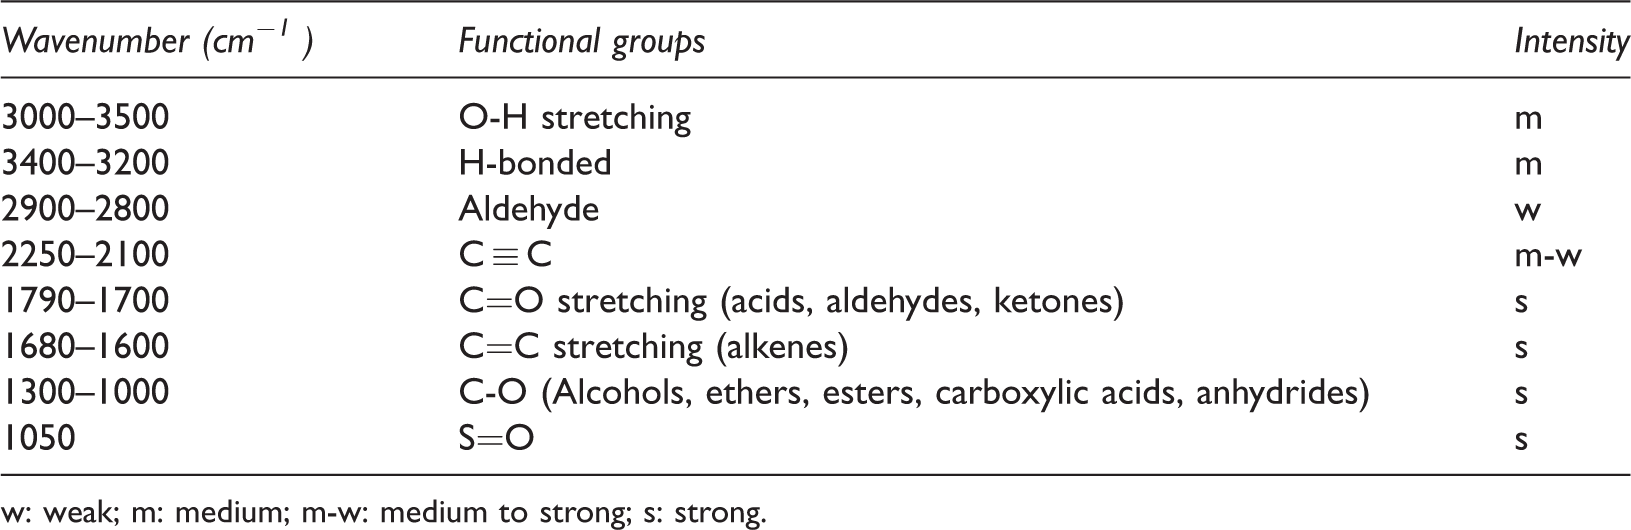
w: weak; m: medium; m-w: medium to strong; s: strong.
Physical characterization of torrefied fuel
Effect of torrefaction on mass yield and energy yield
The resultant mass yield and energy yield of torrefied corn cob under different torrefaction conditions are shown in Figure 3. Figure 3 shows that at lower temperatures, i.e. 200 and 225°C there was no significant effect on mass and energy yield, whereas the temperature and residence time changed mass and energy yield. A decrease in mass yield under severe torrefaction conditions could be due to loss of moisture and volatile organic matter content in torrefied corn cob (Ciolkosz and Wallace, 2011). A loss of water took place in two different steps. Firstly during the drying of corn cob prior to torrefaction and secondly due to the dehydration reactions of organic matter of biomass during torrefaction (Poudel and Oh, 2014). A reduction in mass yield could also be due to the decomposition of cellulose and hemicelluloses at severe torrefaction conditions (Wang et al., 2012). A reduction in mass yield at temperatures 200 and 225°C was found to be negligible. A significant reduction in mass yield, i.e. 69.08 and 62.4% was found at 250 and 275°C at 45 and 60 min residence times, respectively. A maximum reduction in mass yield was found at 300°C, i.e. 63.09%, 60.88%, 57.09% and 54.76% at 15, 30, 45 and 60 min residence times, respectively, as shown in Figure 3. A decrease in mass yield at higher torrefaction temperatures could be linked with the thermal decomposition of biomass. The energy yield can be calculated from the mass yield, as described by Bridgeman et al. (2008). The energy yield increases at 200 and 225°C. As the temperature and residence time increased, the energy yield also decreased and it dropped from 93.03% at 200°C to 88.38% at 300°C (Figure 3).
Effect of temperature and residence time on energy and mass retained (%) after torrefaction of corn cob.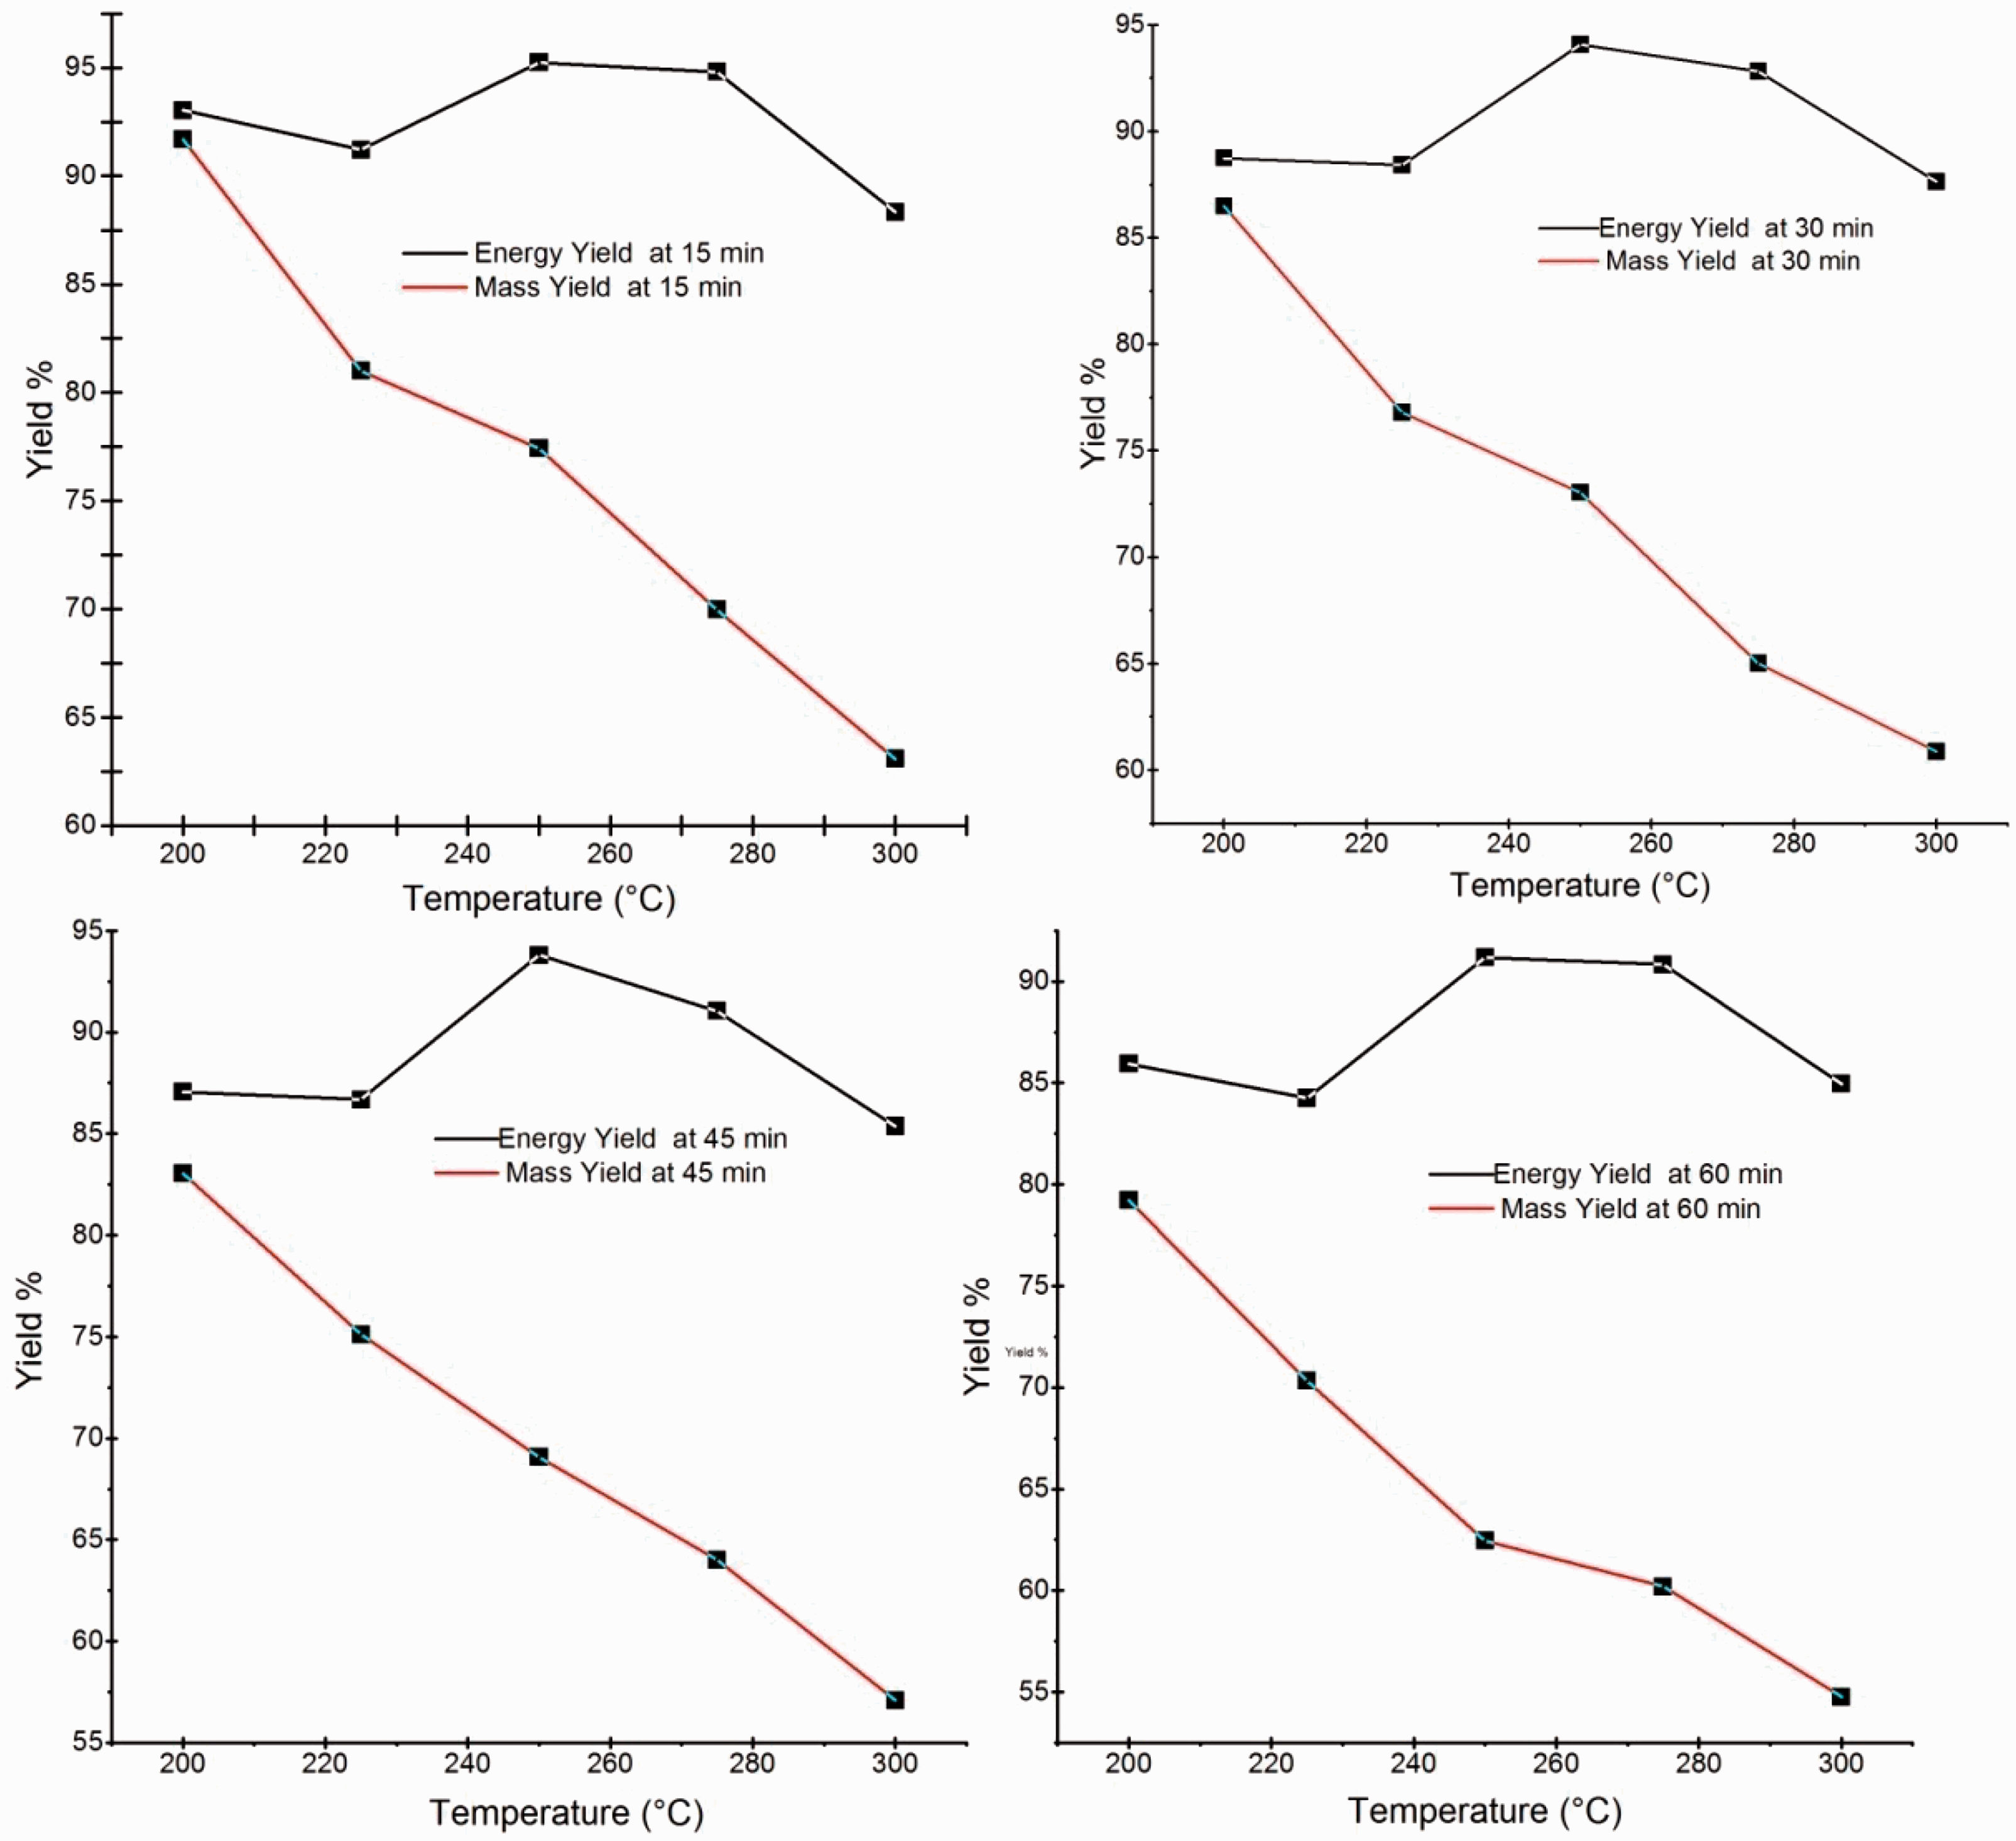
Grindability
The particle size distribution of the raw corn cob, Thar coal sample and its torrefied corn cob fractions at different temperatures (200, 225, 250, 275, 300°C) after milling are shown in Figure 4. It was found that as the torrefaction temperature and residence time increased, the grinding of torrefied sample became easier. The grindability behavior of torrefied samples is improved enough and it becomes comparable to coal. After torrefaction, the particle size of biomass was found to be reduced. This could be due to the decomposition of cellulose and hemicelluloses in corn cob. The reduced particle size of corn cob can improve the grindability of corn cob leading to better energy consumption during its grinding. Thus, the energy consuming torrefaction process become energy saving owing to the easy grinding of torrefied solids which thereby, reduces its grinding cost (Chen et al., 2014; Batidzirai et al., 2013).
Effect of temperature and residence time on grindability of torrefied corn cob.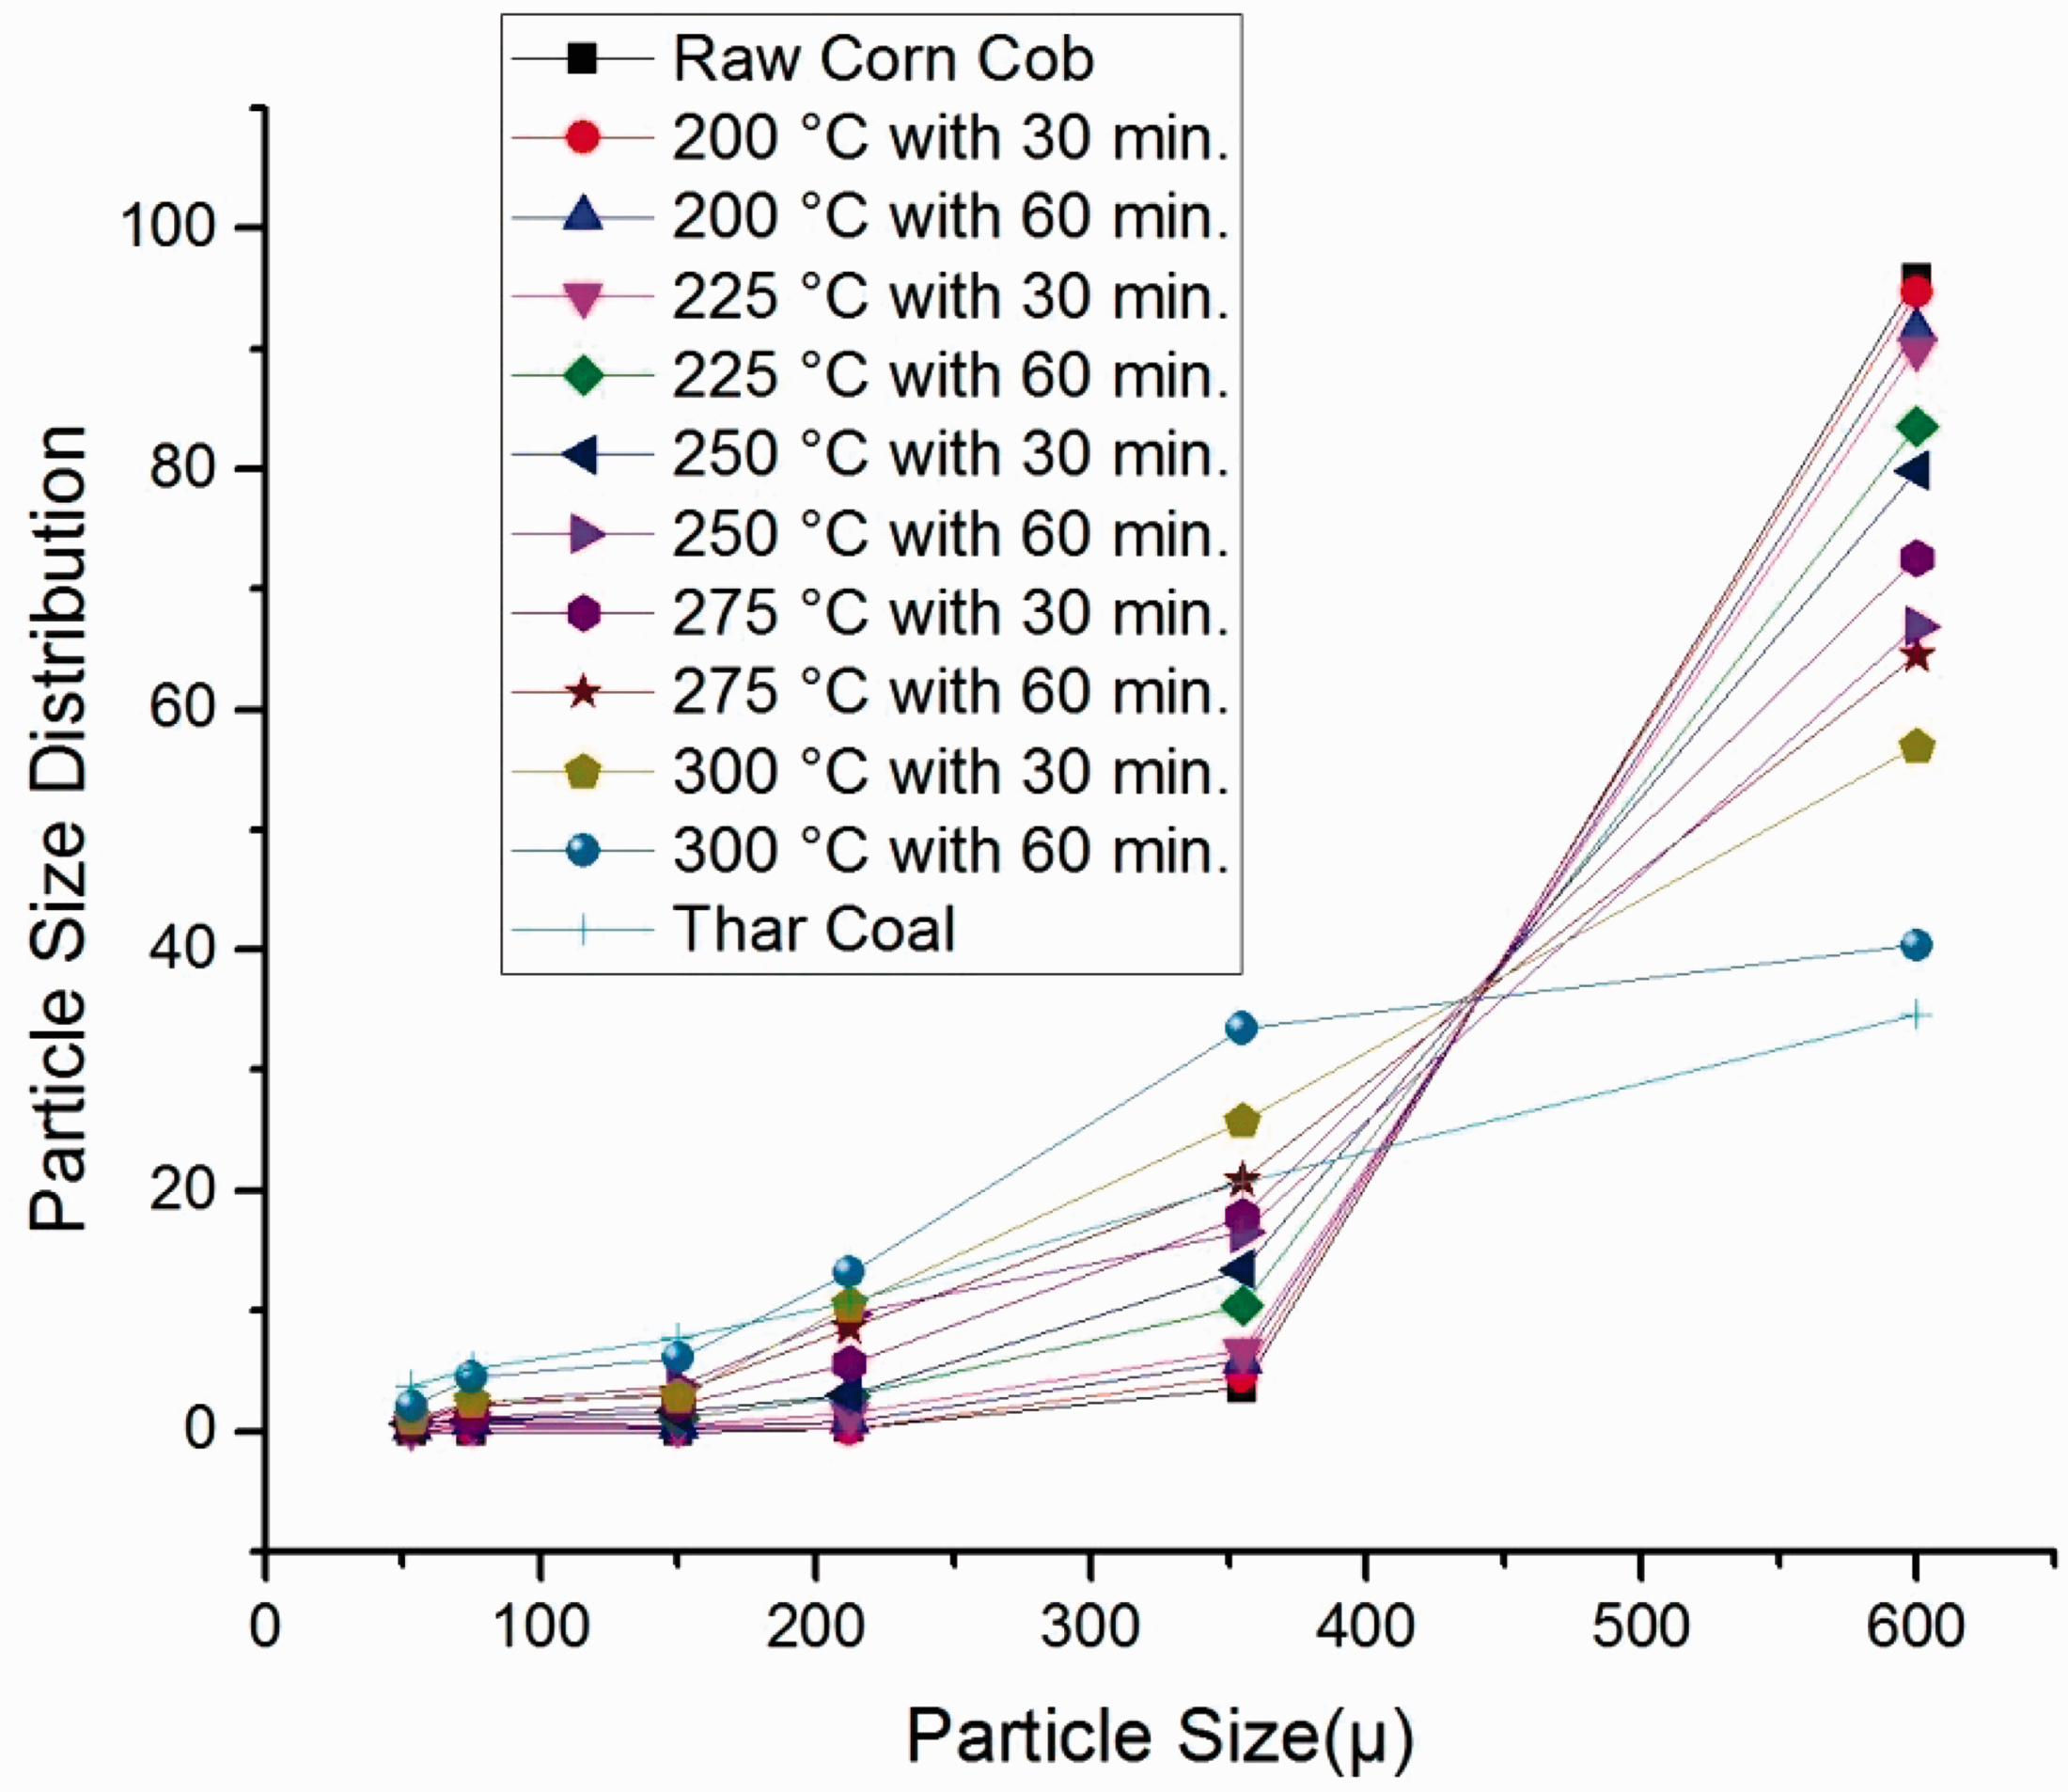
At particle size distribution of raw corn cob, it was observed that most of the fraction was retained on the coarsest sieve (i.e. 600 µm). A very small quantity (i.e. 4.5%) of biomass was found to be retained on rest of the sieves (i.e. 355, 212, 150, 75, 53 µm). It could be due to the fibrous nature that prohibits its complete sieving.
At lowest temperature (200°C with 30 min), the results were same like raw corn cob and no appreciable effect was noticed. On the contrary, after increasing the residence time up to 60 min, a small proportion of mass was retained on all the sieves but still have reasonable quantity on 600 µm (91%). It can be due to the low temperature treatment (i.e. 200°C) which could not favor the reduction in particle size efficiently.
Ultimately, a noticeable impact of torrefaction temperature with respect to particle size distribution was observed (Figure 4). A major portion was split onto other finer sieves that showed a remarkable reduction in particle size after torrefaction at higher temperatures. A small figure of 0.25% (at 200°C with 30 min) was changed into 2.1% at finest sieve (i.e. 53 µm) with 300°C and 60 min residence time.
It was observed that at highest temperature and residence time (i.e. 300°C and 60 min), only 40% mass was retained on 600 µm, whereas remaining 60% mass was distributed to all other finer sieves. Similar trend was encountered in size reduction of Thar coal which may support the comparable grinding cost of both fuels.
Hydrophobicity
Figure 5 shows that as the torrefaction temperature and residence time increased, the tendency of torrefied corn cob to absorb moisture was found to be reduced (Felfli et al., 2005; Ferro et al., 2004). At the severe torrefaction condition (300°C, 60 min), the biomass became more hydrophobic. This could be due to the degradation of hemicellulose that has the large capacity to absorb water (Acharjee et al., 2011). The raw corn cob had the tendency to absorb 15.76% water. At increasing torrefaction temperature and residence time of 300°C and 60 min, the biomass becomes hydrophobic. It absorbed only 0.1% of moisture. This investigation is in agreement with the Pim Chuai et al. (2010).
Spectroscopic studies
FTIR analysis
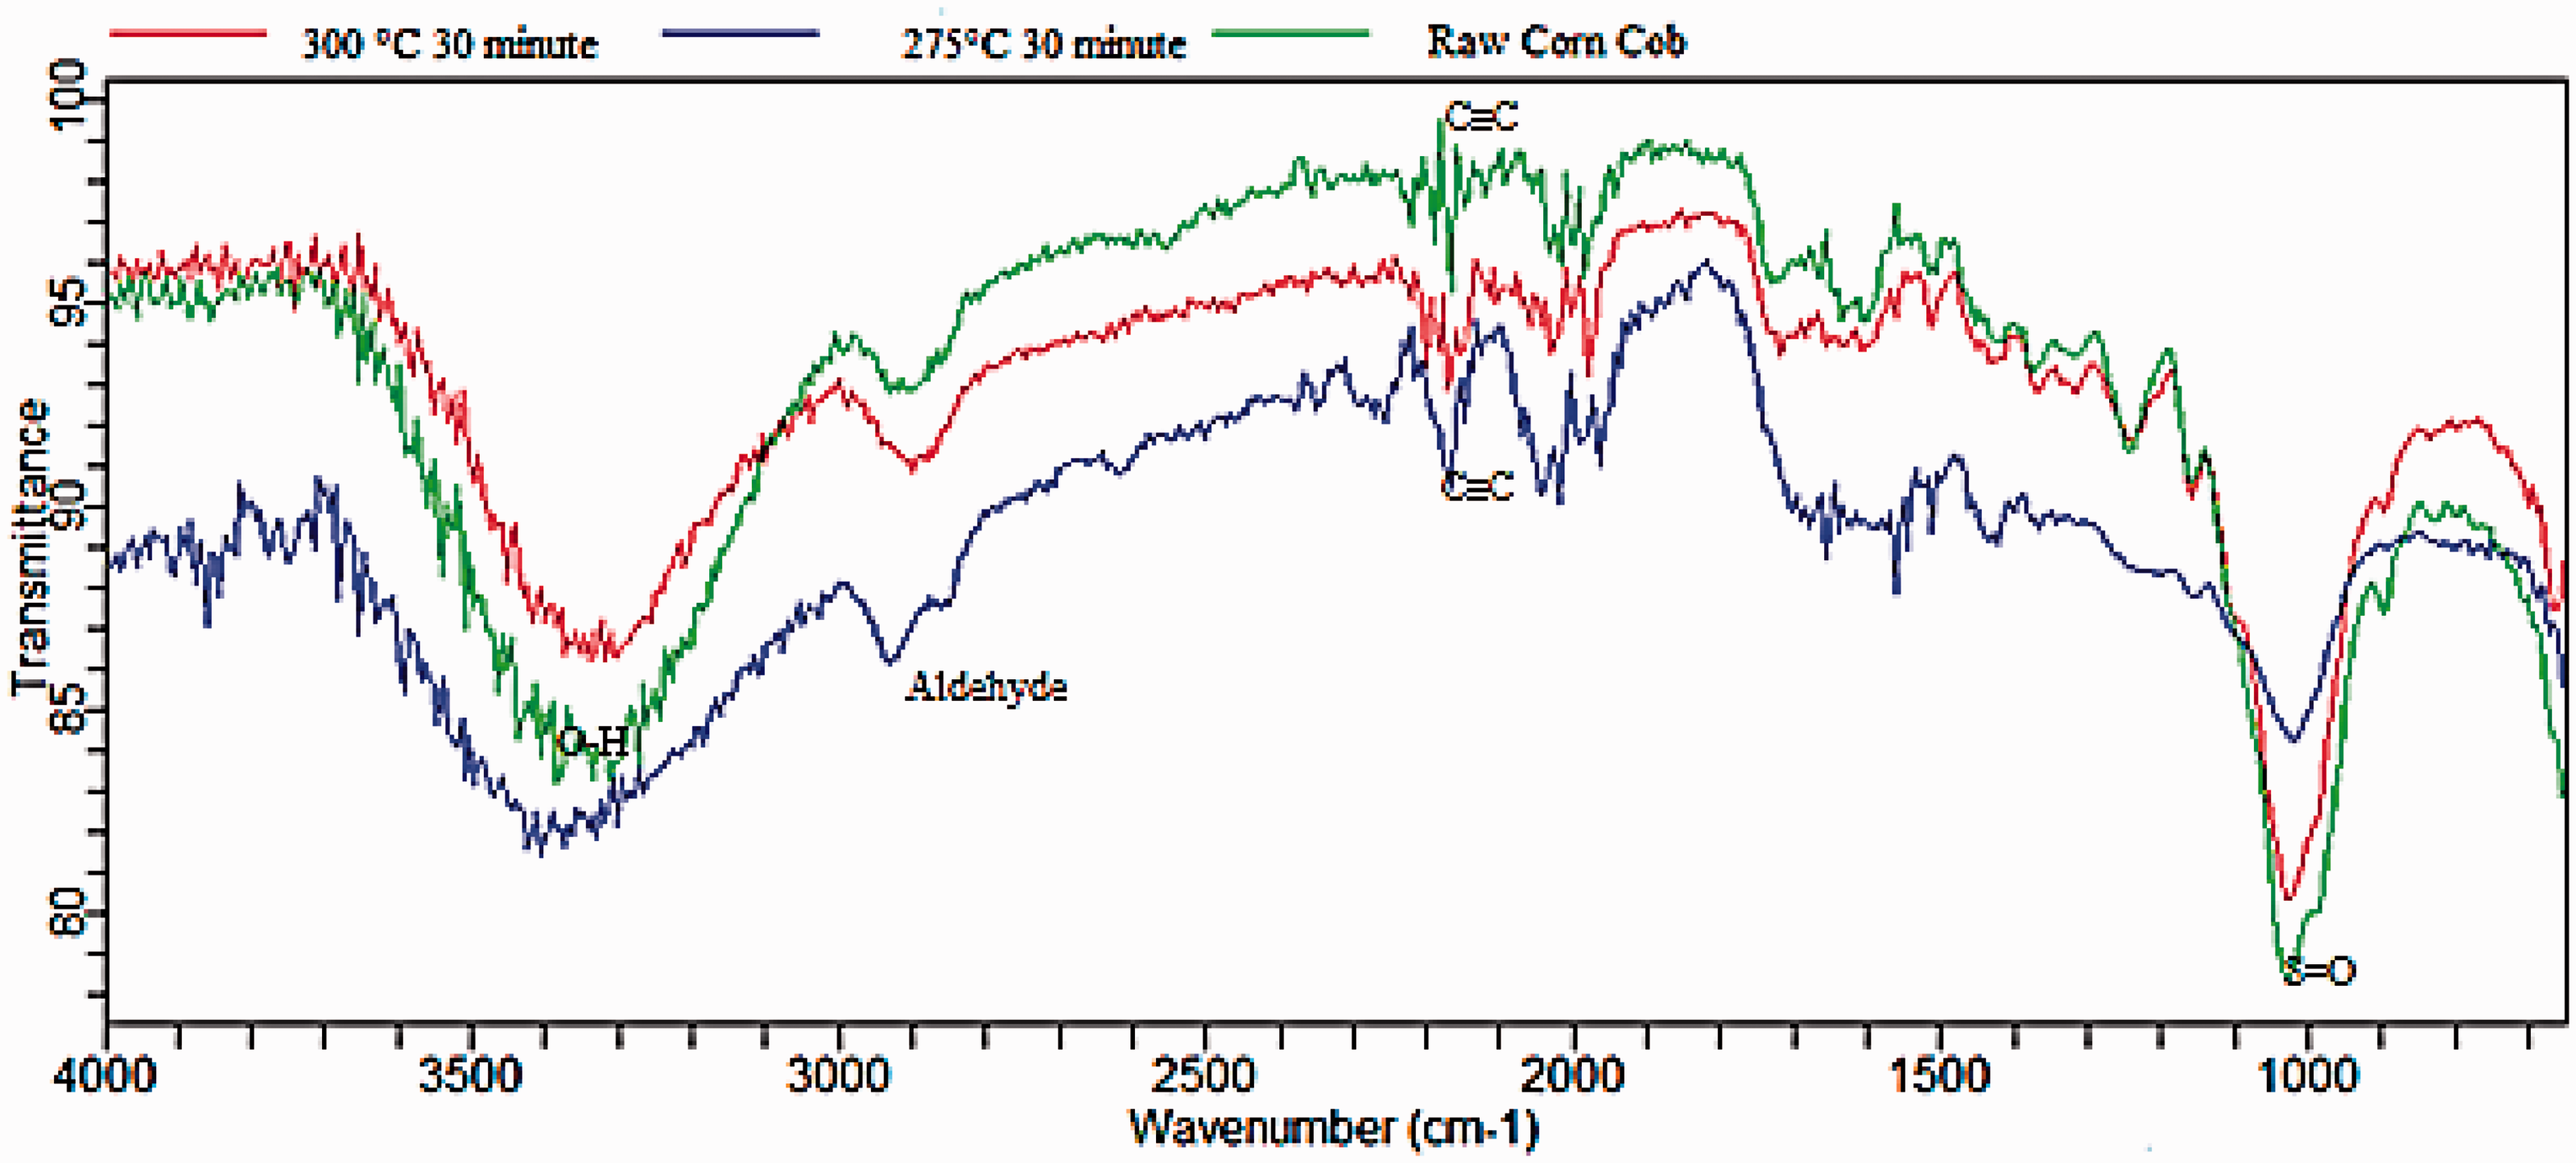
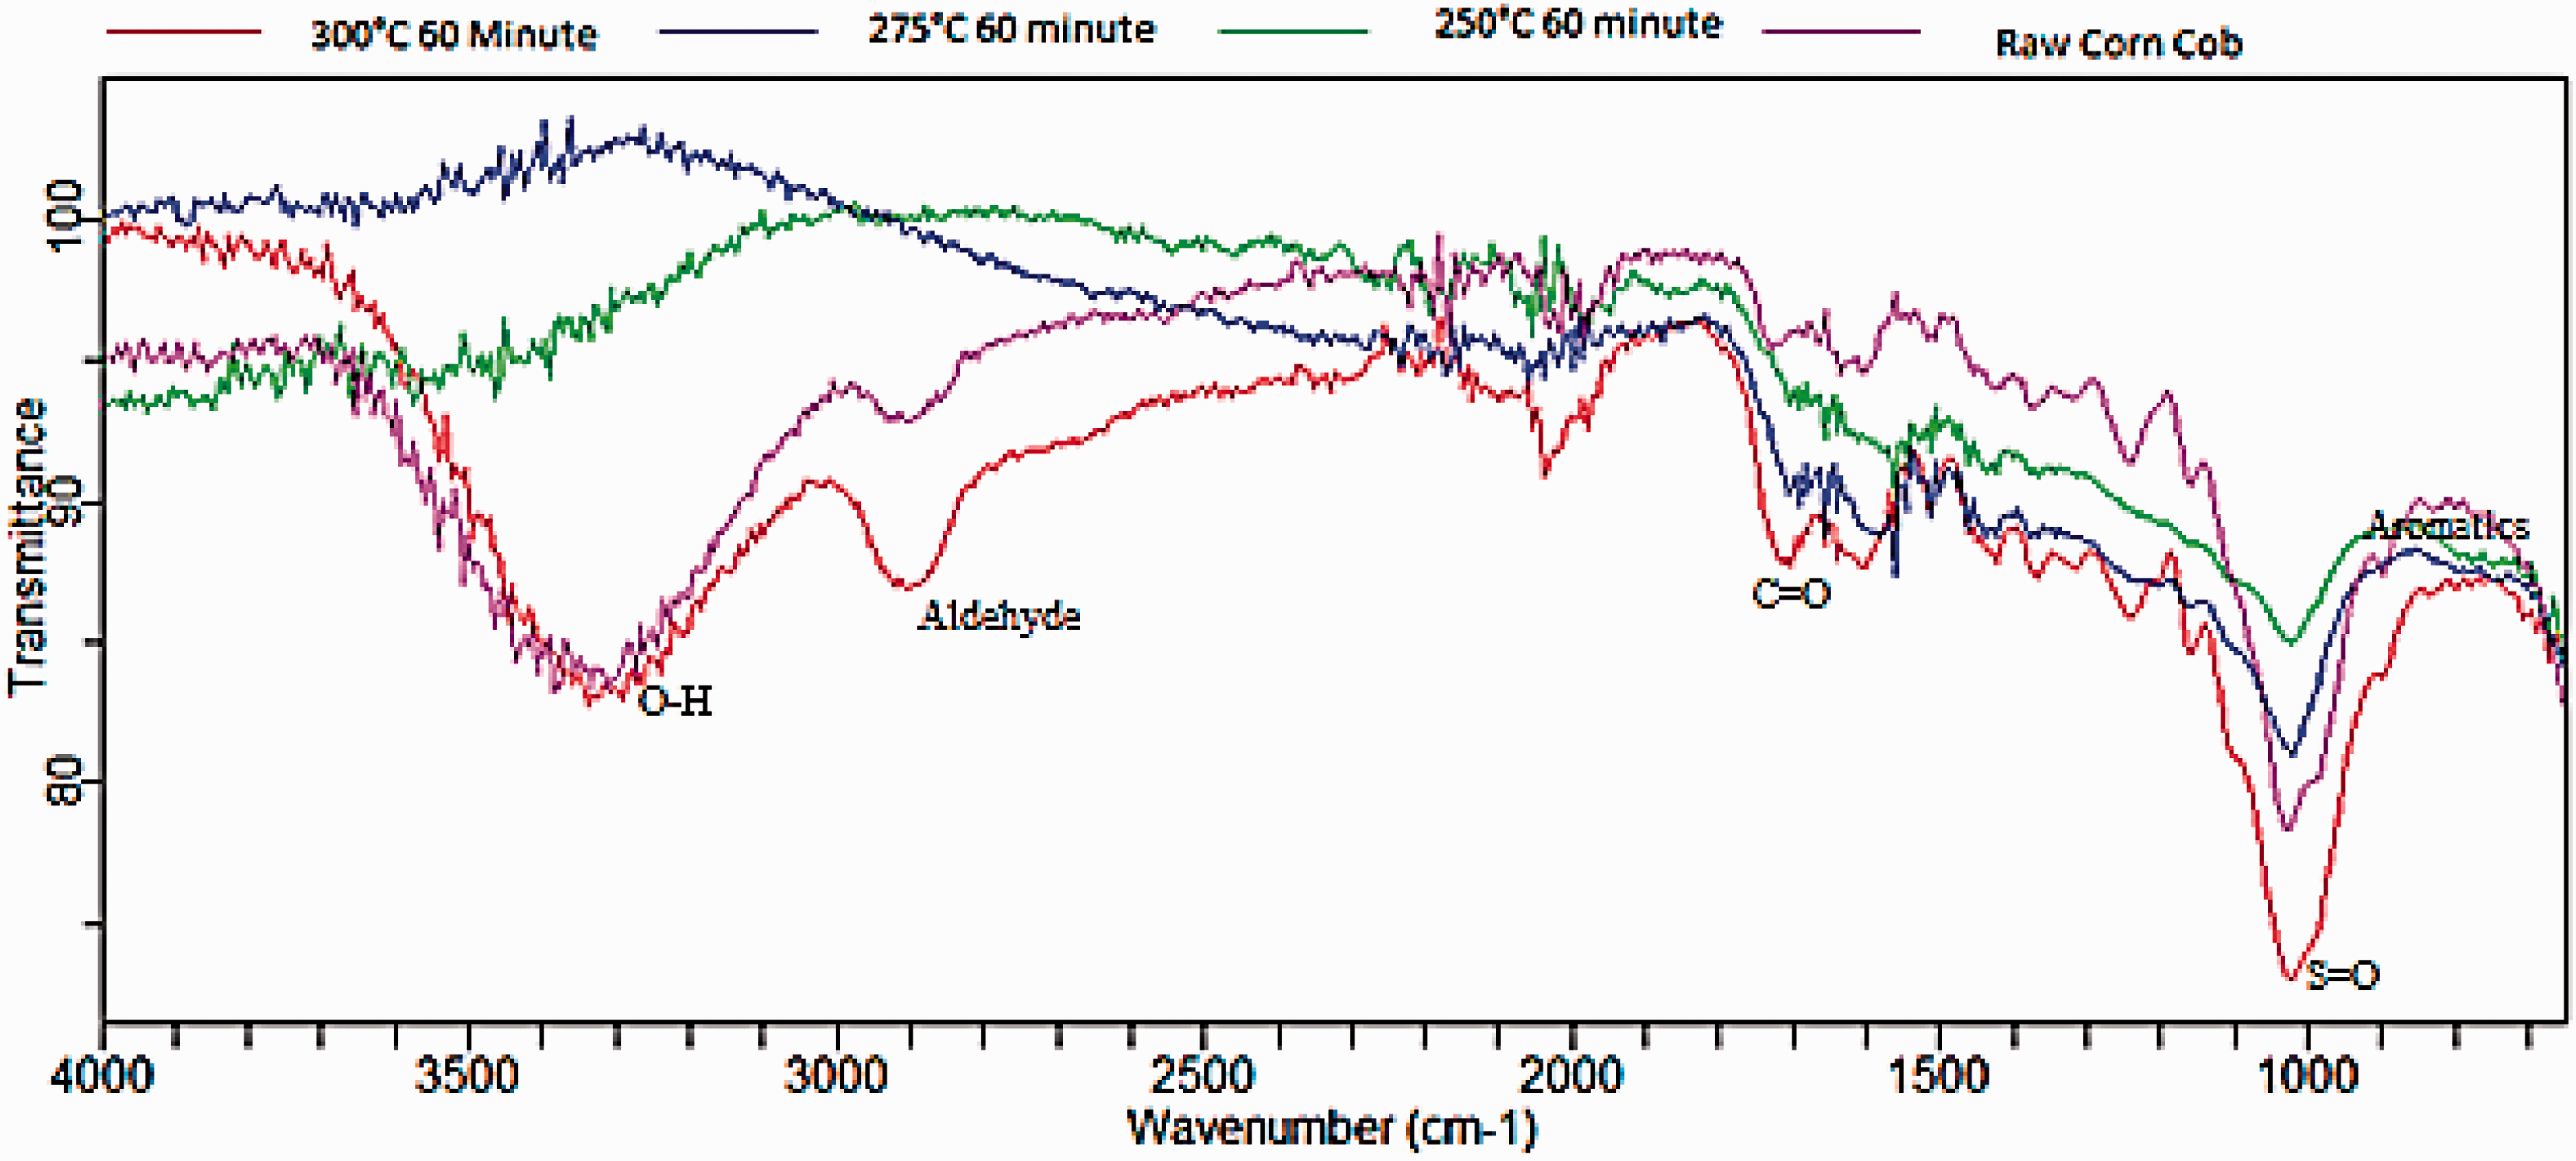
To investigate changes in the chemical structure of the torrefied corn cob, Fourier transform infrared spectroscopy was used, and the FTIR spectrum is shown in Table 4. The results are given in Figures 6 to 9. It can be observed from Figure 6 that at lower temperatures (i.e. 200 and 250°C), no visible peak was found at 3500–3000 cm−1, which could be due to the loss of O–H group. Figures 7 and 8 demonstrate a decrease in the intensity of the O–H band around 3500–3000 cm−1 at 275 and 300°C torrefaction temperature. It is evident from Figure 8 at 300°C and 30 min, the intensity of OH group at 3500–3000 cm−1 decreases which could be due to increase in torrefaction temperature and the functional groups shifted towards lower wavenumber, a sharp peak has been observed at 1000 cm−1. Similar trend can be observed in Figure 9.
Effect of temperature and residence time on moisture uptake (%) of torrefied corn cob. FTIR spectra of raw and torrefied corn Cob at 200°C and 250°C (at 30 min). FTIR spectra of raw and torrefied corn cob at 200°C and 225°C (at 60 min). FTIR spectra of raw and torrefied corn cob at 275°C and 300°C (at 30 min). FTIR spectra of raw and torrefied corn cob at 250°C, 275°C and 300°C (at 60 min).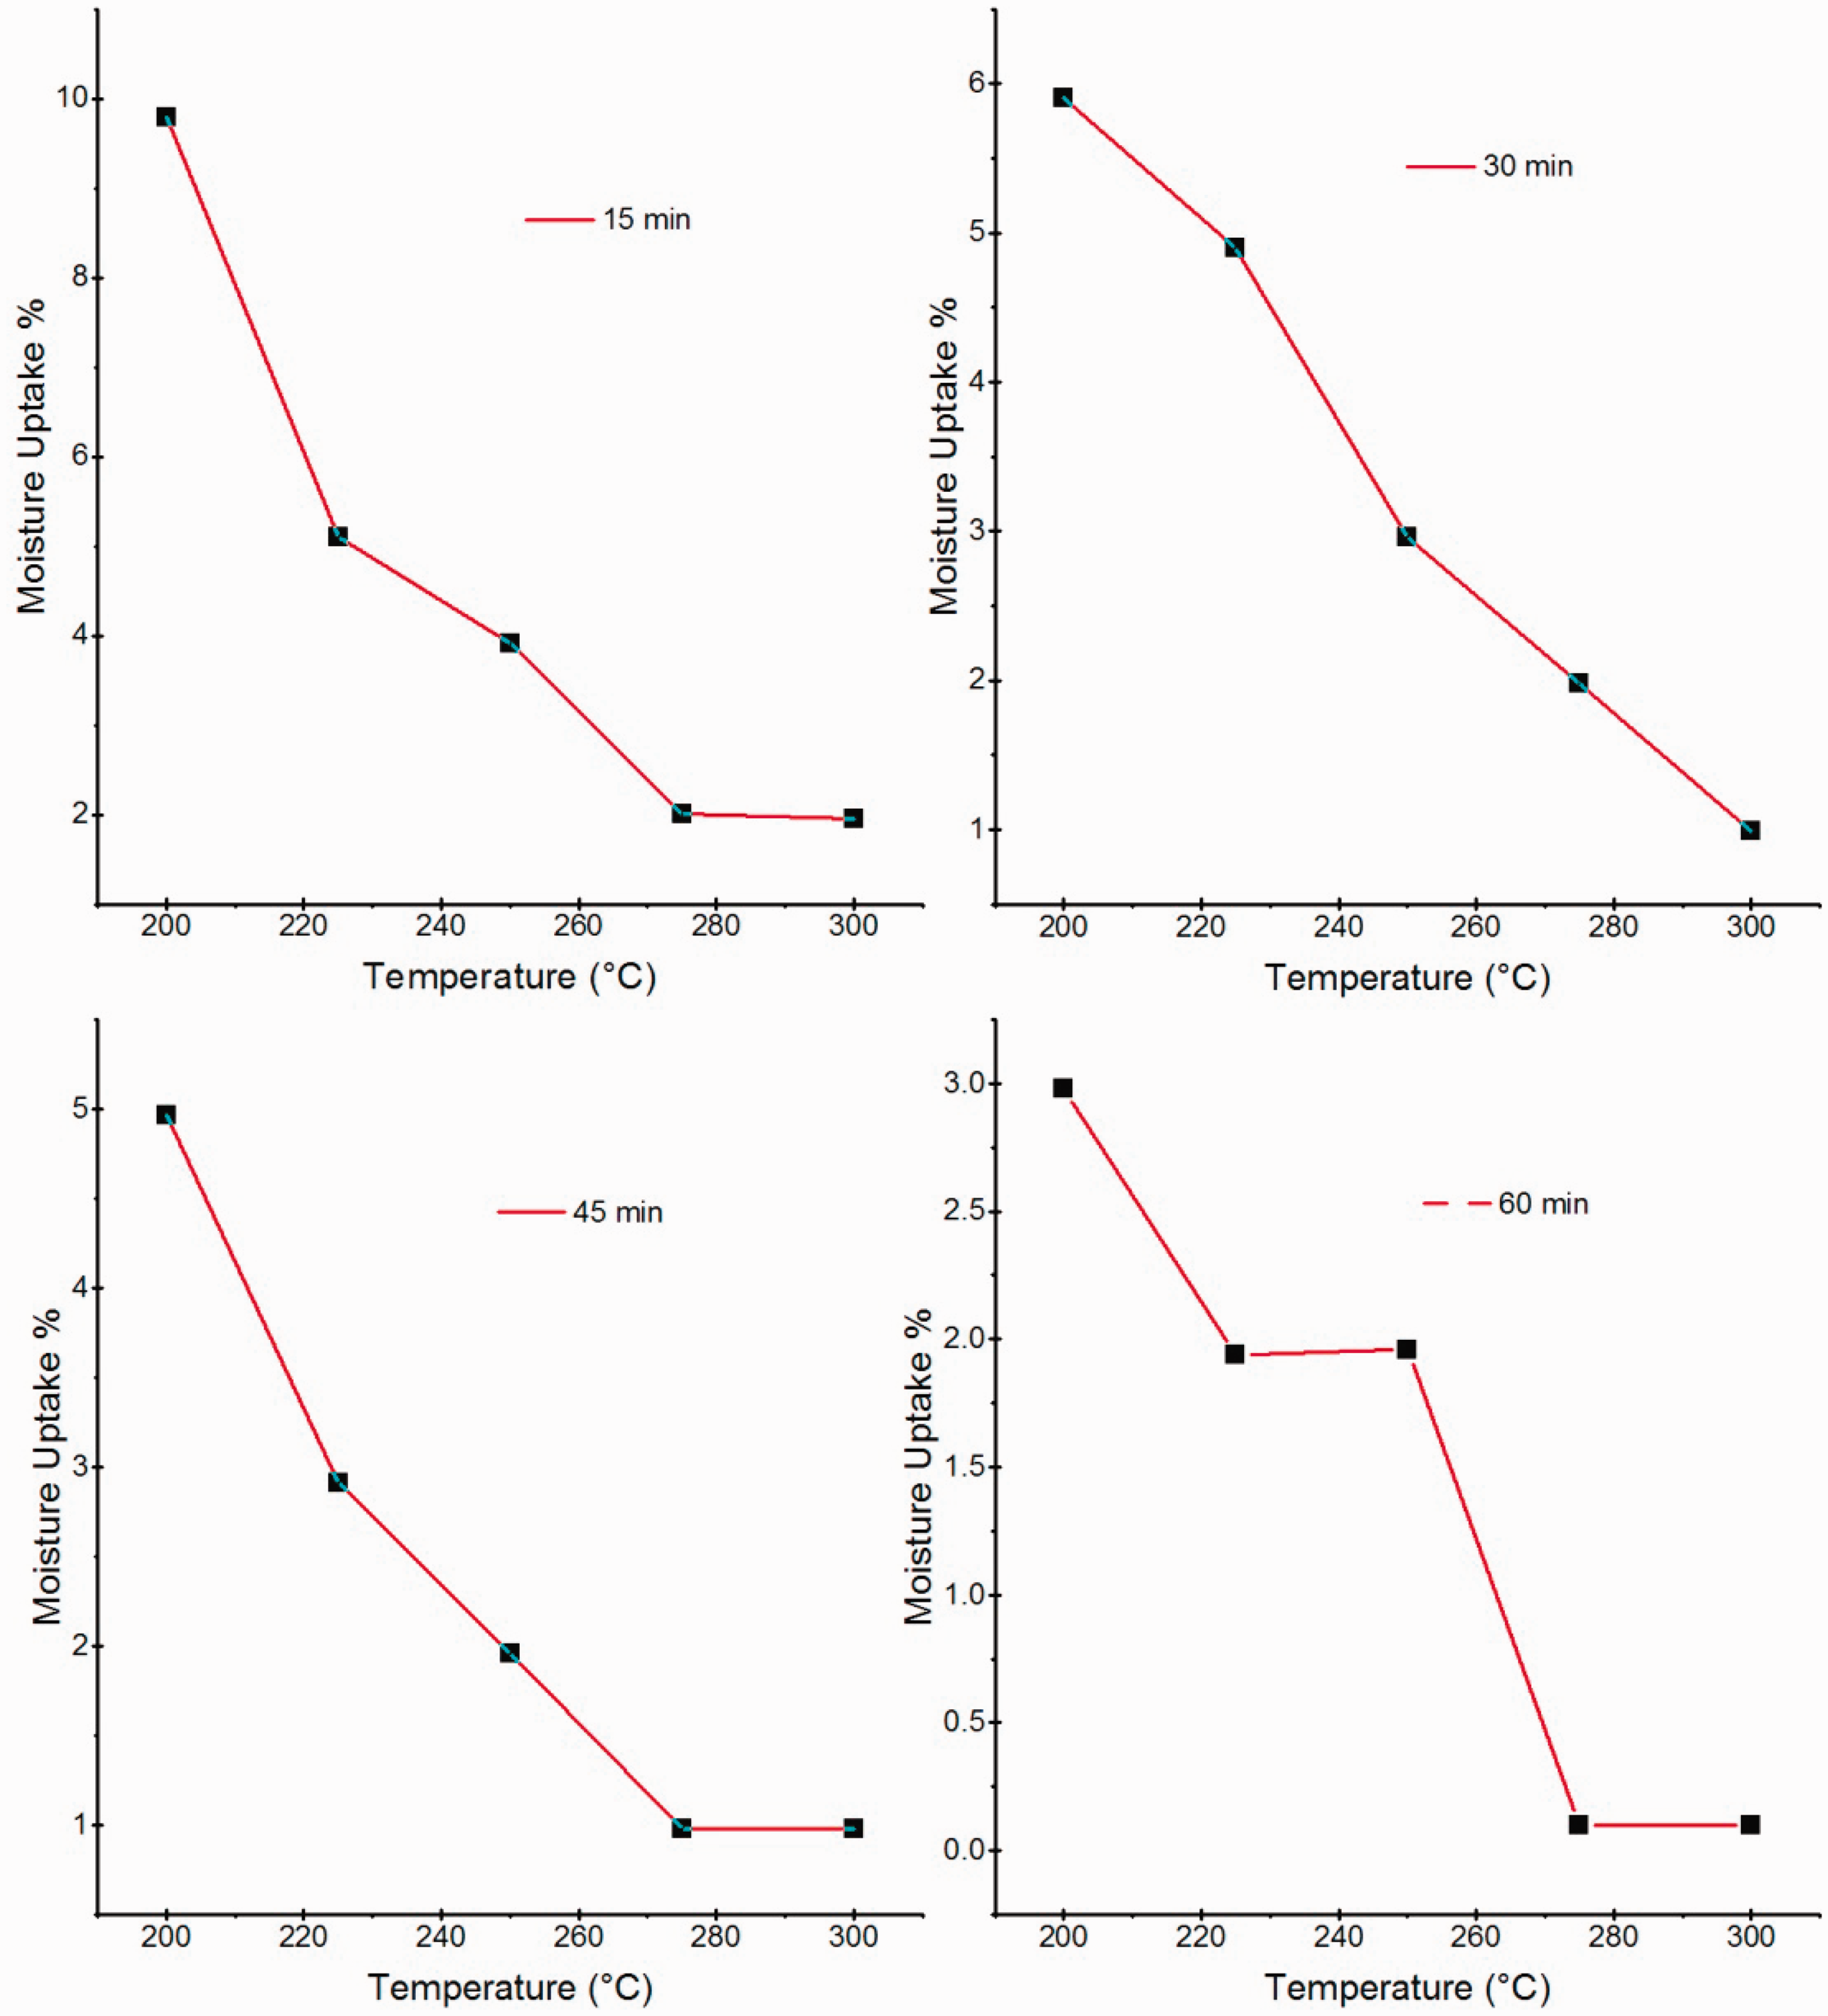
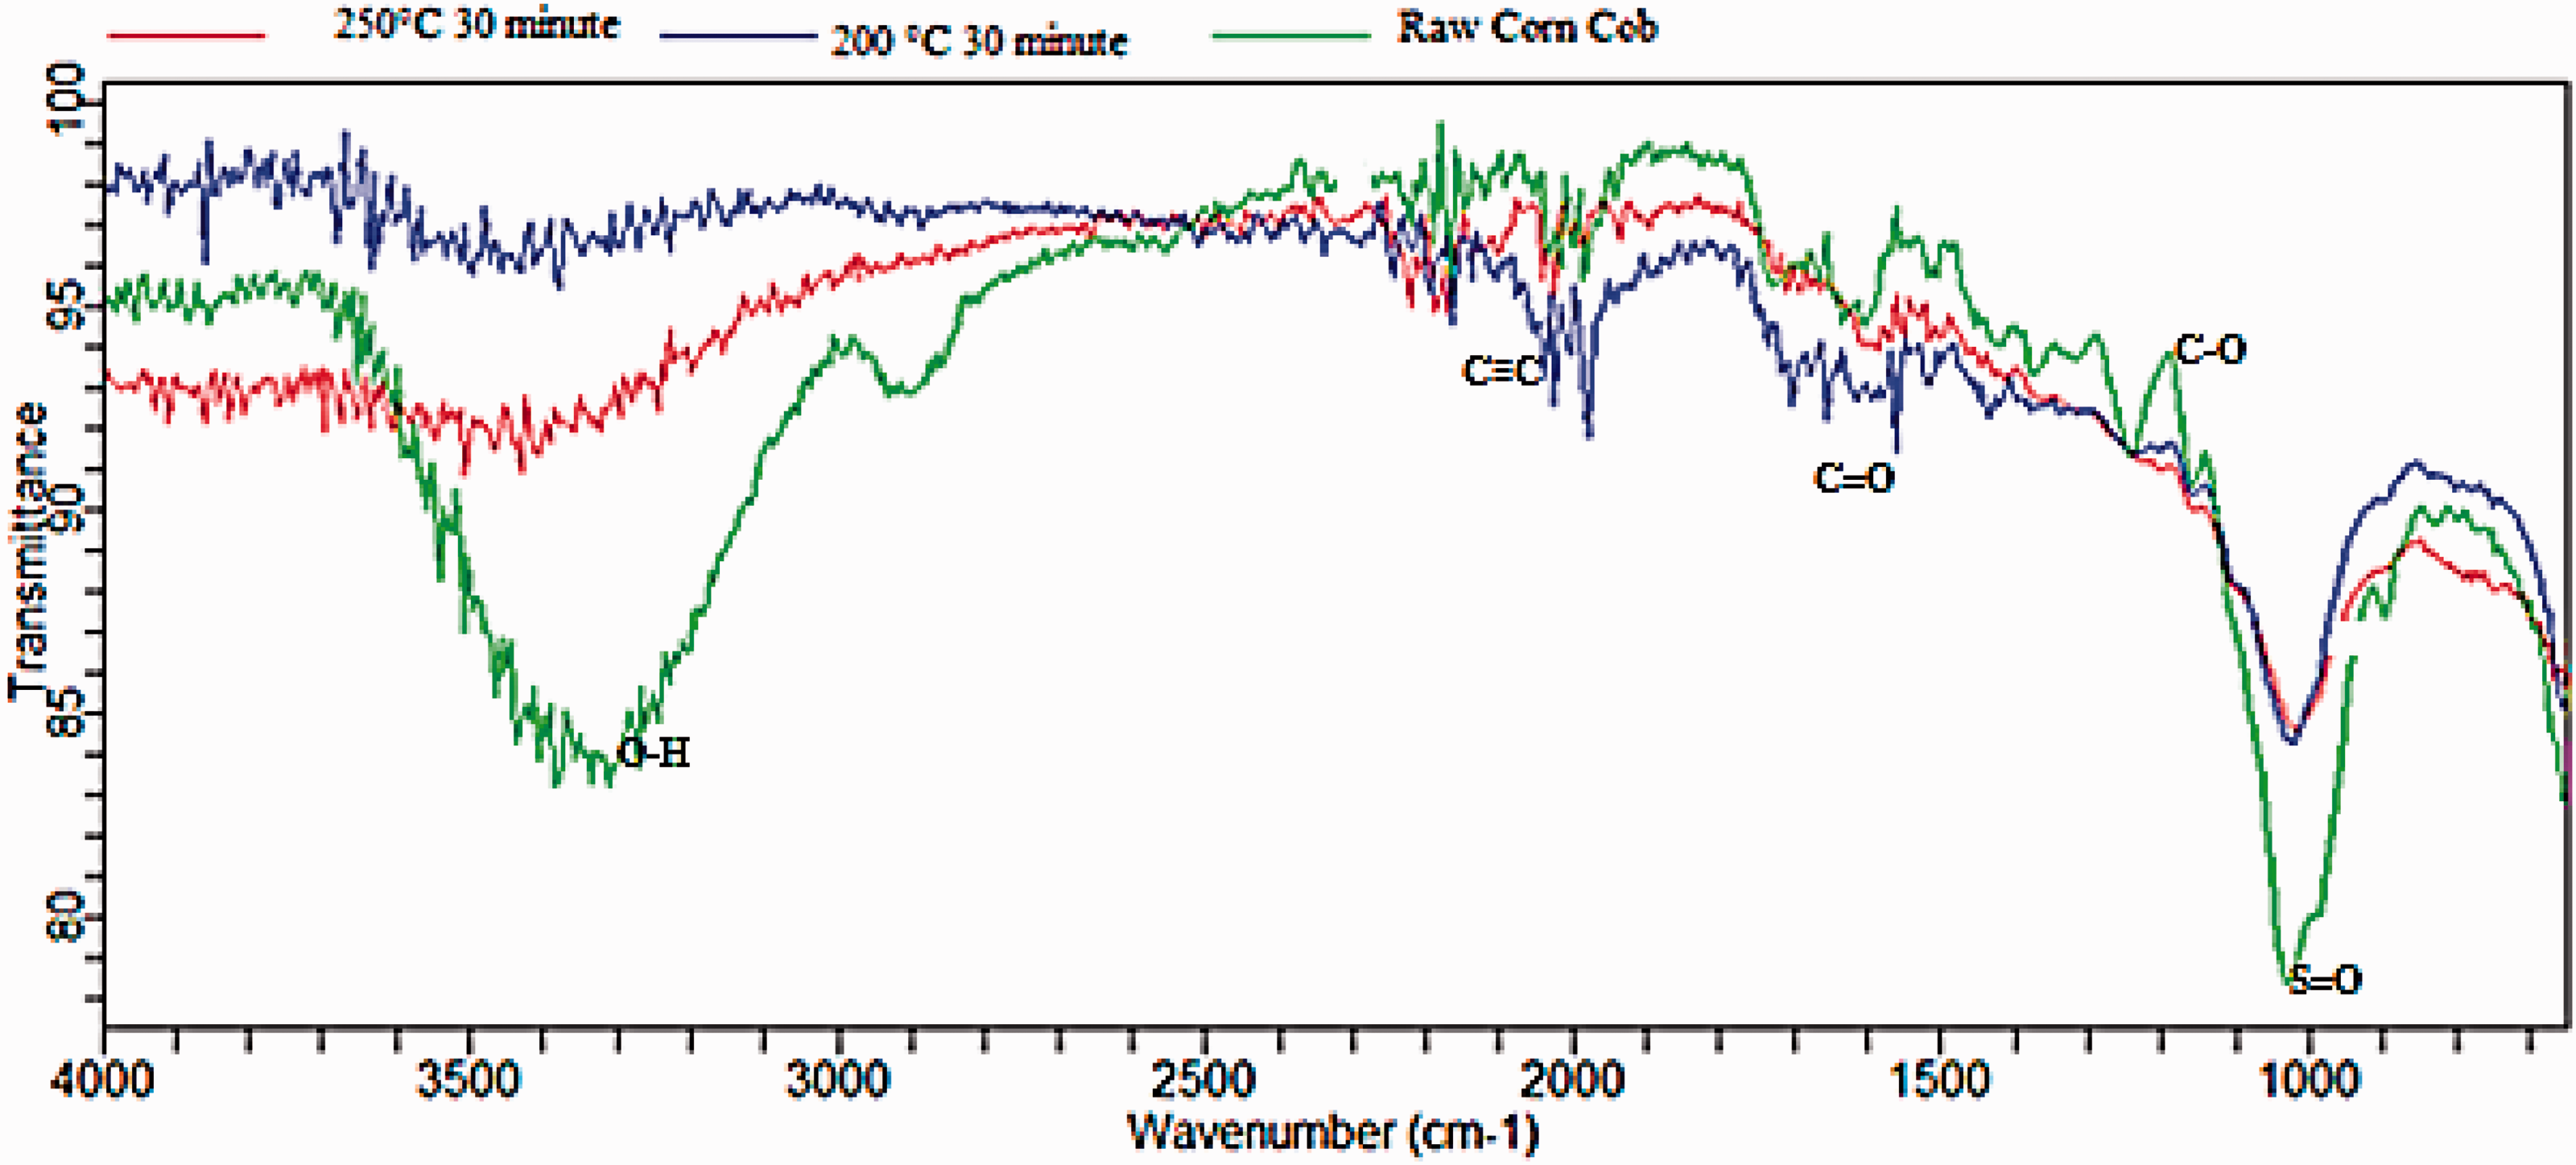
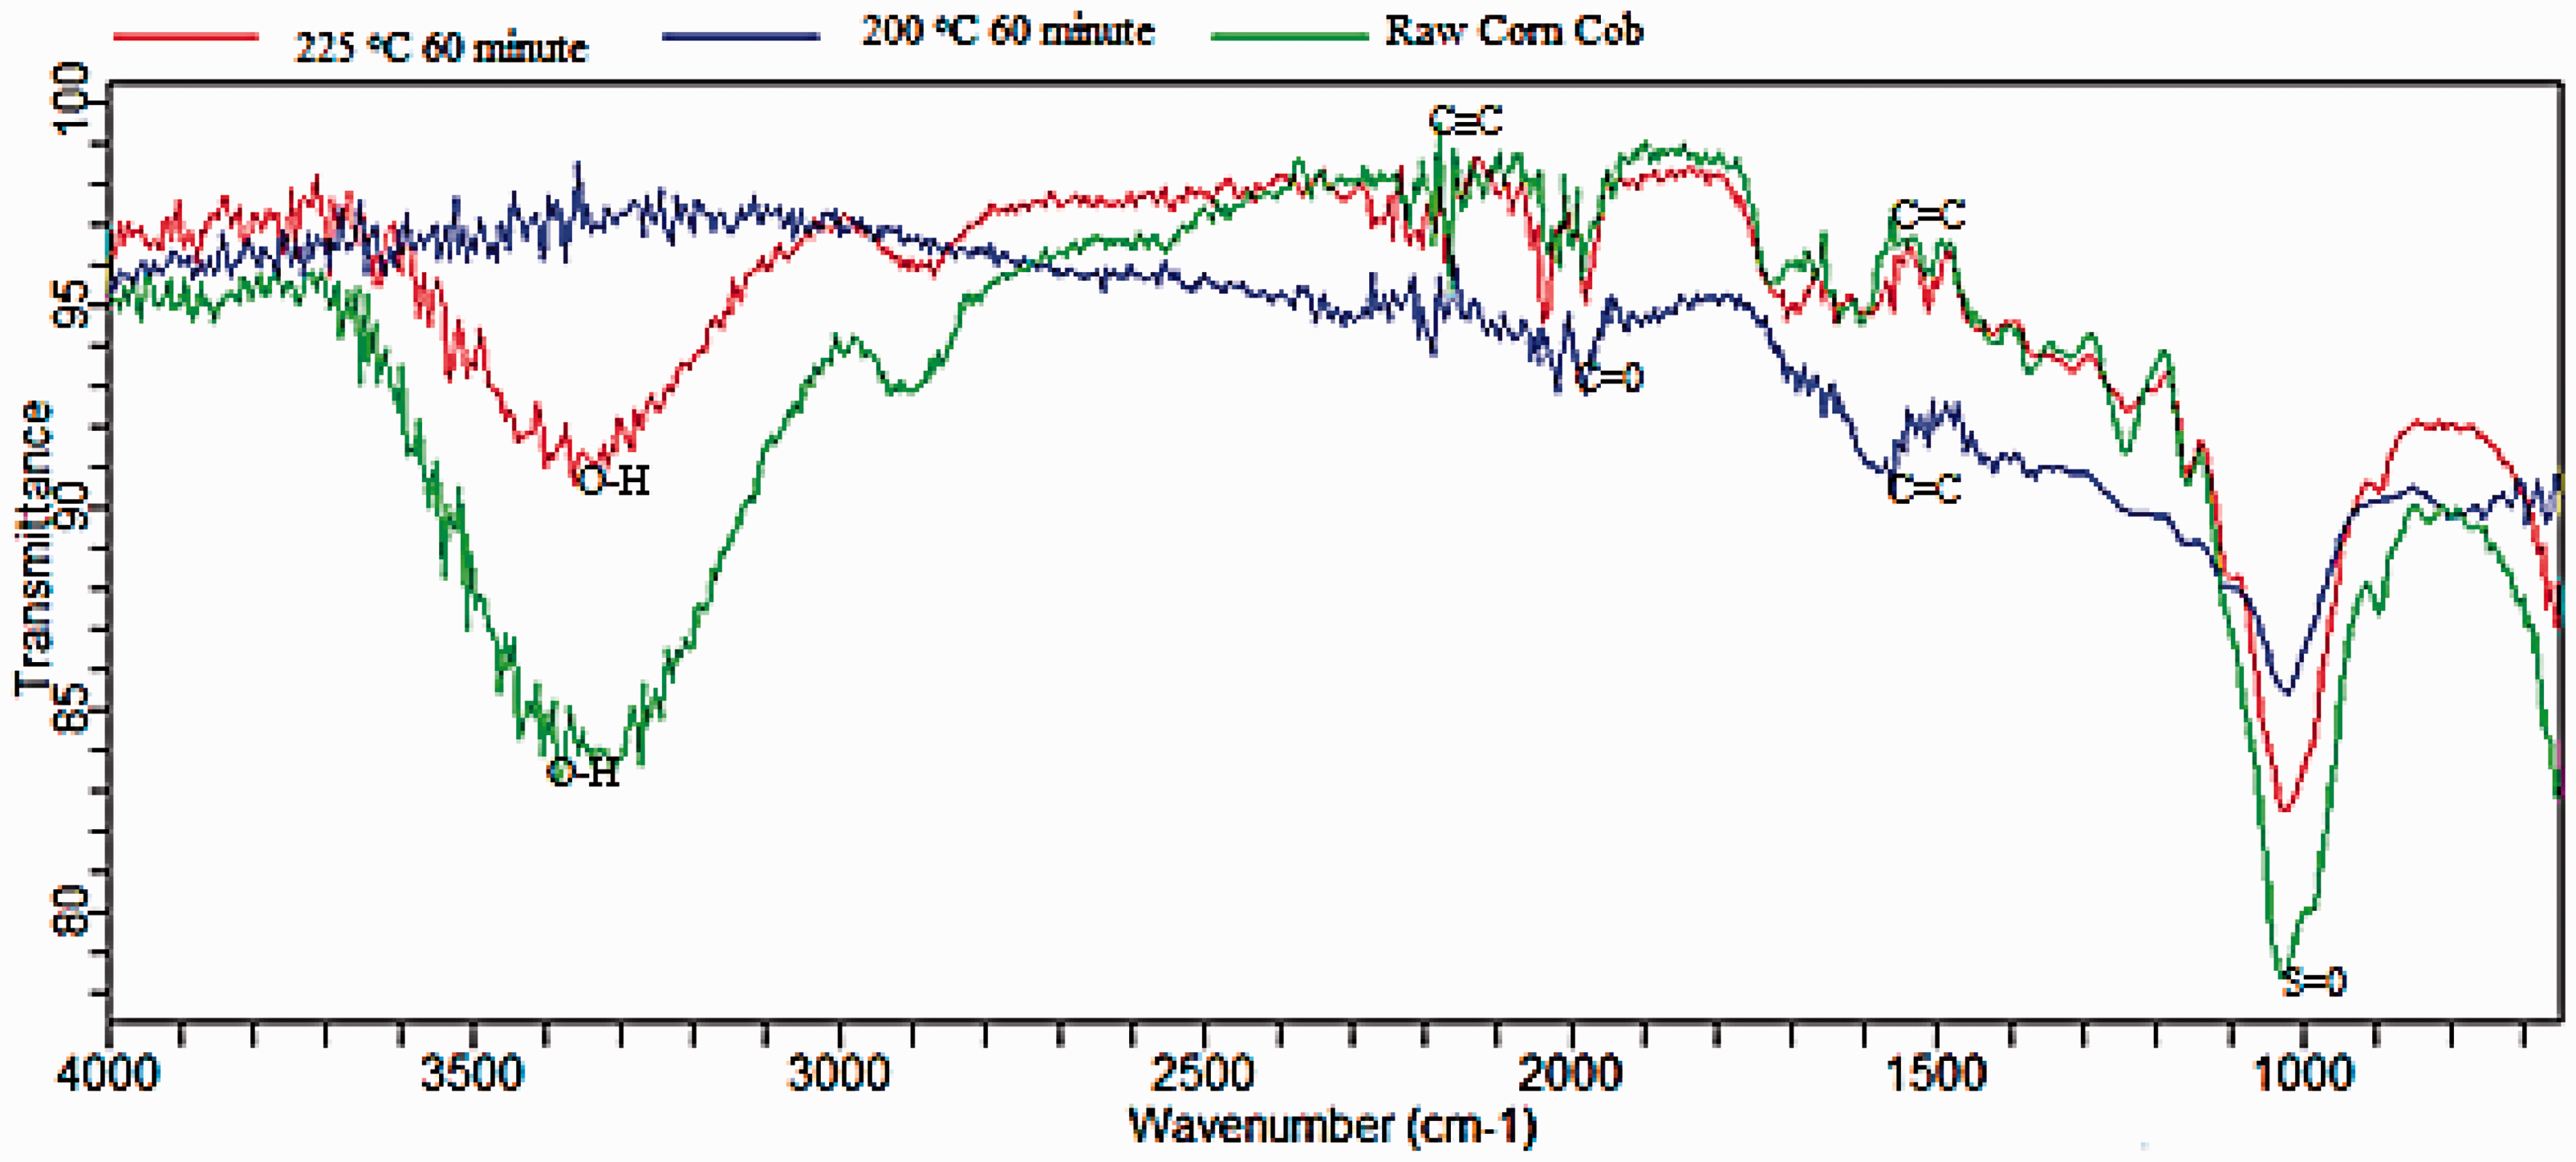
In raw corn cob, the vibrations could be due to the carboxylic acid in hemicellulose. Previous work suggests that during torrefaction, degradation of hemicellulose could be linked with the reduction of carboxylic acid and new products were found at lower wavenumbers (Shang et al., 2012). The loss of O–H group explains the improved hydrophobicity of the torrefied corn cob, and similar decrease in intensity of the OH vibrations had been reported previously for torrefied bamboo (Rousset et al., 2011).
It is evident from Figure 10 that Thar coal shows spectrum similar to corn cob torrefied at 300°C and 60 min. Coal is hydrophobic in nature and no distinct peak is observed at 3000–3500 cm−1. A sharp peak is found at 2900–2800 cm−1 and most of the functional groups are present at lower wavenumbers.
FTIR spectra of Thar coal.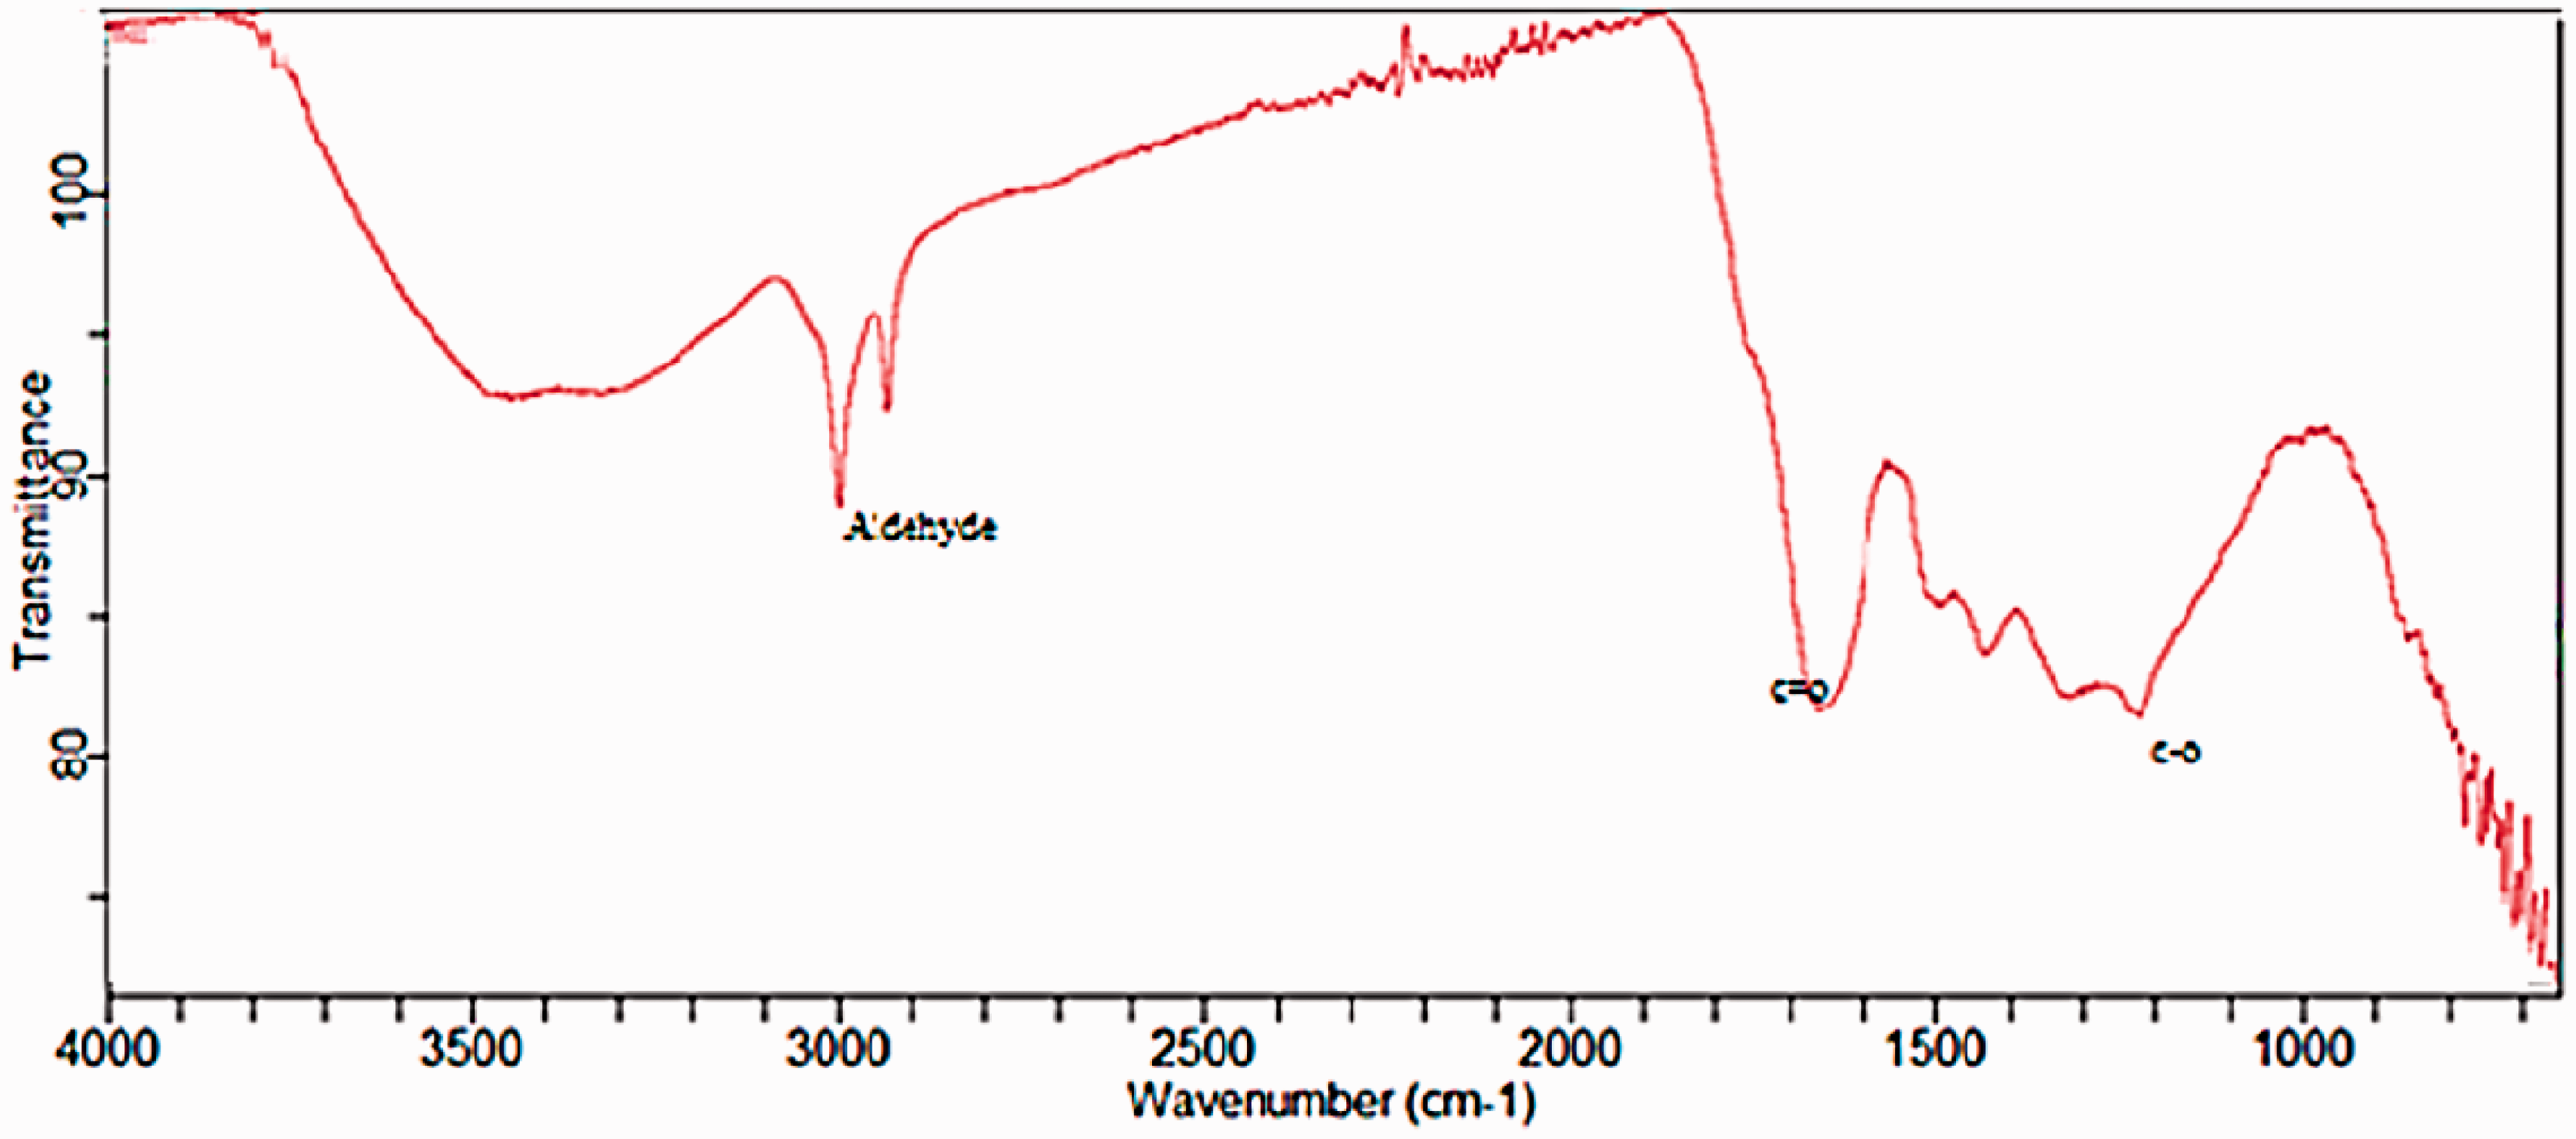
Combustion behavior of biomass and coal
The combustion behavior of raw corn cob, torrefied corn cob at (300°C and 60 min) and Thar coal in air atmosphere with 20°C/min heating rate was studied. The combustion characteristics such as ignition temperature (Ti), peak temperature (Tp) and burnout temperature (Tb) were calculated from TG/DTG curve according to literature.
Table 5 shows that torrefaction is able to increase char ignition temperatures (Ti). The ignition temperature (Ti) increased from 140°C to 170°C. This could be due to decrease in volatile matter during torrefaction. These slightly higher ignition temperatures may partially reduce the risk of self-ignition of the chars providing safer storage.
Combustion characteristics of raw, torrefied corn cob and Thar coal.
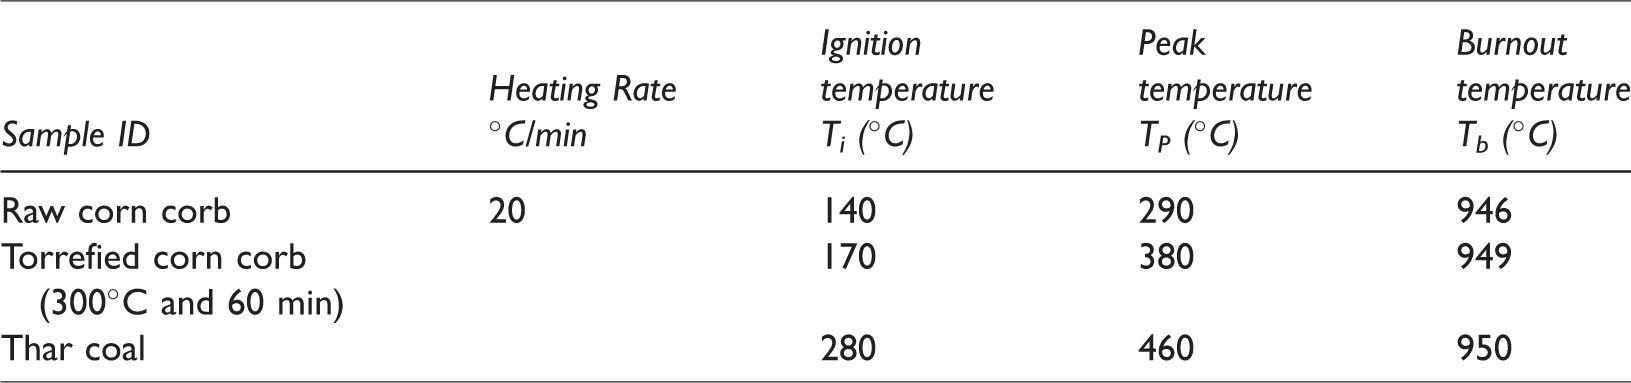
Torrefaction reduced the rate of combustion of pyrolytic products and shifted the peak and burnout temperatures to higher temperatures. The peak temperature (Tp) increased from 290°C to 380°C (Table 5). Although a very slight increase was observed in the burnout temperature of raw and torrefied corn cob, it is very closer to burnout temperature of Thar coal. Increasing the temperature of torrefaction resulted in lower reactivity (Valix et al., 2017). However, it is evident from Figure 11 that reactivity of torrefied corn cob is almost similar to Thar coal.
TGA (a), DTG (b) profiles of raw, torrefied corn cob and Thar Coal.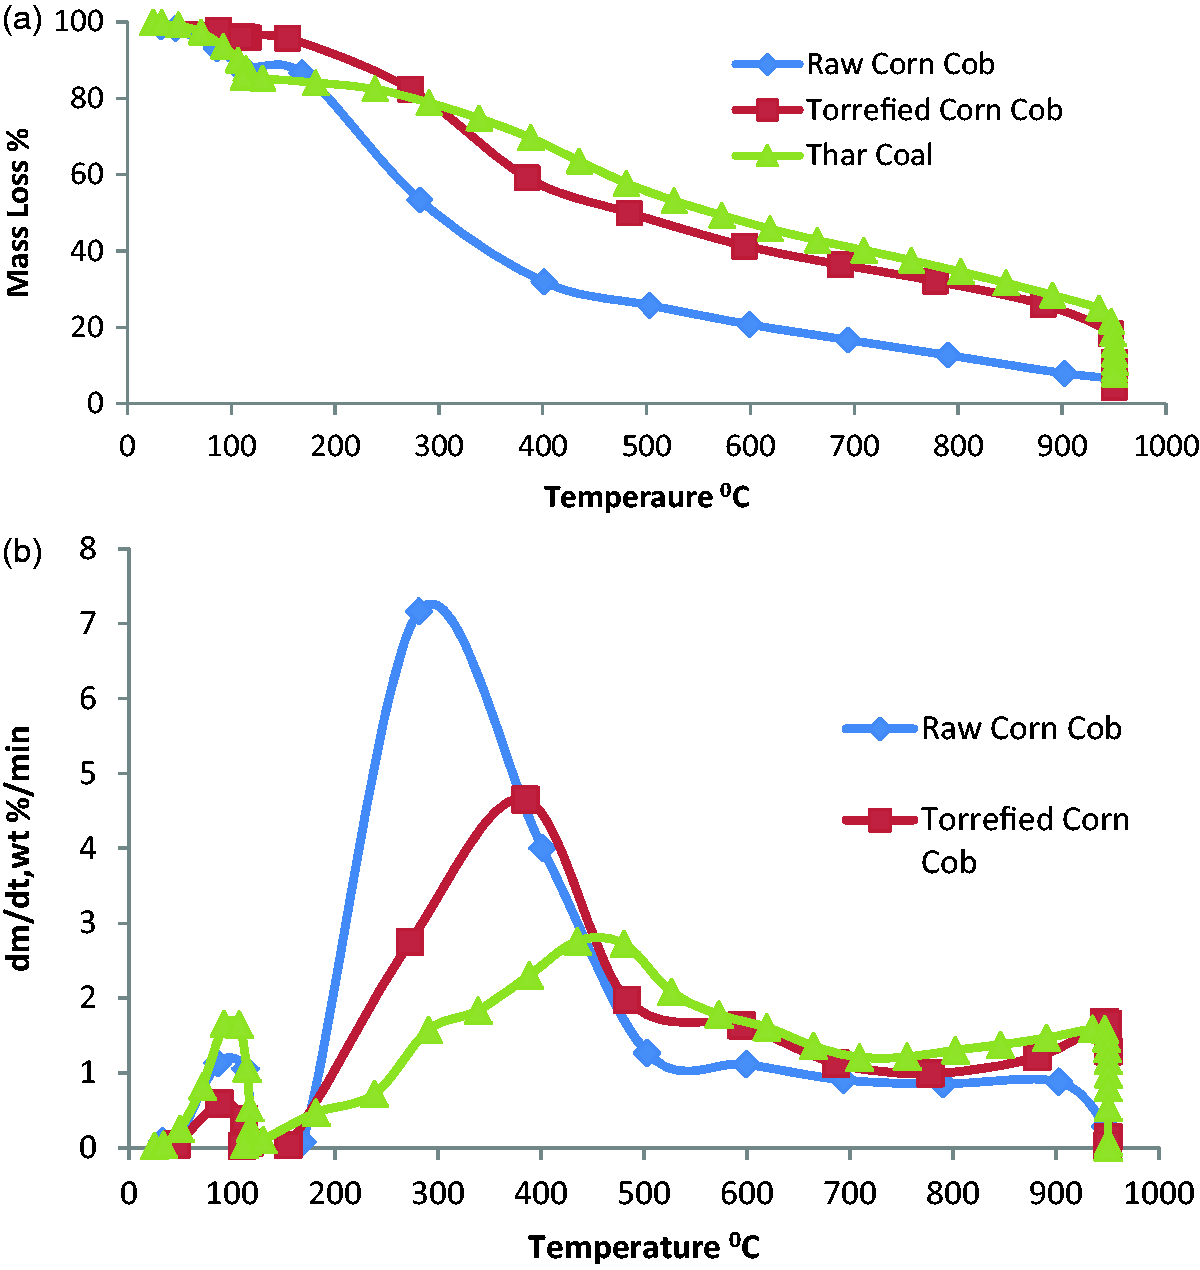
Conclusions
The results of corn cob torrefaction indicate that after torrefaction the corn cob has the properties similar to lignite coal. The % of VM and fixed carbon in torrefied corn cob at severe torrefaction conditions (300°C and 60 min) were 44.55% and 48.51%, respectively, that is almost equal to the values of Thar coal that were 43.17% and 45.96%, respectively. Similar trend has been observed in case of % of C, H, N, HHV (MJ/kg) and true density. Particularly, the HHV and true density of torrefied corn cob at severe torrefaction condition are almost equal to Thar coal. The particle size of torrefied corn cob had a tendency to decrease, as it becomes brittle and fragile after torrefaction. At mild torrefaction temperature, no significant improvement was observed, but at 275°C and 300°C, the characteristics of corn cob such as hydrophobicity, grindability and heating value improved with little loss of energy retained. The results of FTIR indicate that at severe torrefaction conditions the functional groups shifted towards lower wavenumber and due to loss of hydroxyl group biomass became more hydrophobic. As a result of torrefaction, the combustion profile of torrefied corn cob at severe torrefaction conditions (300°C and 60 min) becomes similar to Thar coal.
Footnotes
Declaration of conflicting interests
The author(s) declared no potential conflicts of interest with respect to the research, authorship, and/or publication of this article.
Funding
The author(s) received no financial support for the research, authorship, and/or publication of this article.