
Abstract
Temperature is an important factor that affects the stability of a gas hydrate. To investigate the geothermal characteristics in the gas hydrate drilling area, heat flow measurements were performed in the surrounding area of the SH2 well. The measured heat flow was compared with the bottom simulating reflector heat flow, which was calculated by using the depth of the bottom simulating reflector in the seismic data. Combined with the geological background of the Shenhu drilling area, we analyzed the reasons for the differences between the measured heat flow and the bottom simulating reflector heat flow. In addition to analyzing the differences caused by the calculation parameters, we calculated the 3-D topographic effects on the measured heat flow by using the finite element numerical simulation method. The results show that the measured heat flow was seriously affected by the topography and produced a −50–30% error in the study area. After terrain correction of the measured heat flow, we found that the data were greater than the bottom simulating reflector heat flow at almost all sites. Therefore, we considered the impact of fluid activity and calculated the relationship among the thickness of the gas hydrate stability zone, the fluid flux and the heat flow. The results show that when the base of the bottom simulating reflector was at a certain depth, the geothermal gradient increased with the increasing upward migration of the fluid flux. Therefore, when upward fluid migration is present, the measured heat flow in the seafloor sediments is greater than the heat flow in the deep layers. In general, we showed that the influences of the topography and fluid activity are the main factors leading to the inconsistency between the bottom simulating reflector heat flow and the measured heat flow in the Shenhu gas hydrate drilling area.
Introduction
A gas hydrate is characterized by clean, large, high-efficiency reserves, which will make it possible to replace increasingly exhausted traditional energy sources in the future (Jin et al., 2006; Kvenvolden, 1988). On the other hand, the decomposition of a gas hydrate is an important inducing factor of geophysical hazards such as submarine landslides (Kayen and Lee, 1991; Sultan et al., 2004). Methane released from hydrate decomposition is a greenhouse gas, which has an important influence on the climate and environment (Kvenvolden, 1993; Mienert et al., 2005). Therefore, research on gas hydrate has been one of the frontiers in scientific research (Boswell and Collett, 2011).
Temperature and pressure are the most critical factors for the formation and preservation of gas hydrates. Temperature is an especially sensitive factor. Therefore, the study of the geothermal field and heat flow is an indispensable area in the process of gas hydrate research. The physical conditions (temperature, pressure, etc.) of methane and water are basically clear on the basis of a large number of experimental and theoretical studies (Sloan and Koh, 2007). The formation of gas hydrates in the ocean usually requires a depth of 300–4000 m and a temperature of 2.5–25°C (Max and Dillon, 1998). When the temperature and pressure are determined, the gas hydrate stability zone (GHSZ) can be determined by using the known phase boundary equation (Figure 1). Consequently, the measured heat flow can be used to predict the bottom of the GHSZ, which can provide the basis for the exploration and resource evaluation of gas hydrate (Rao et al., 1998).
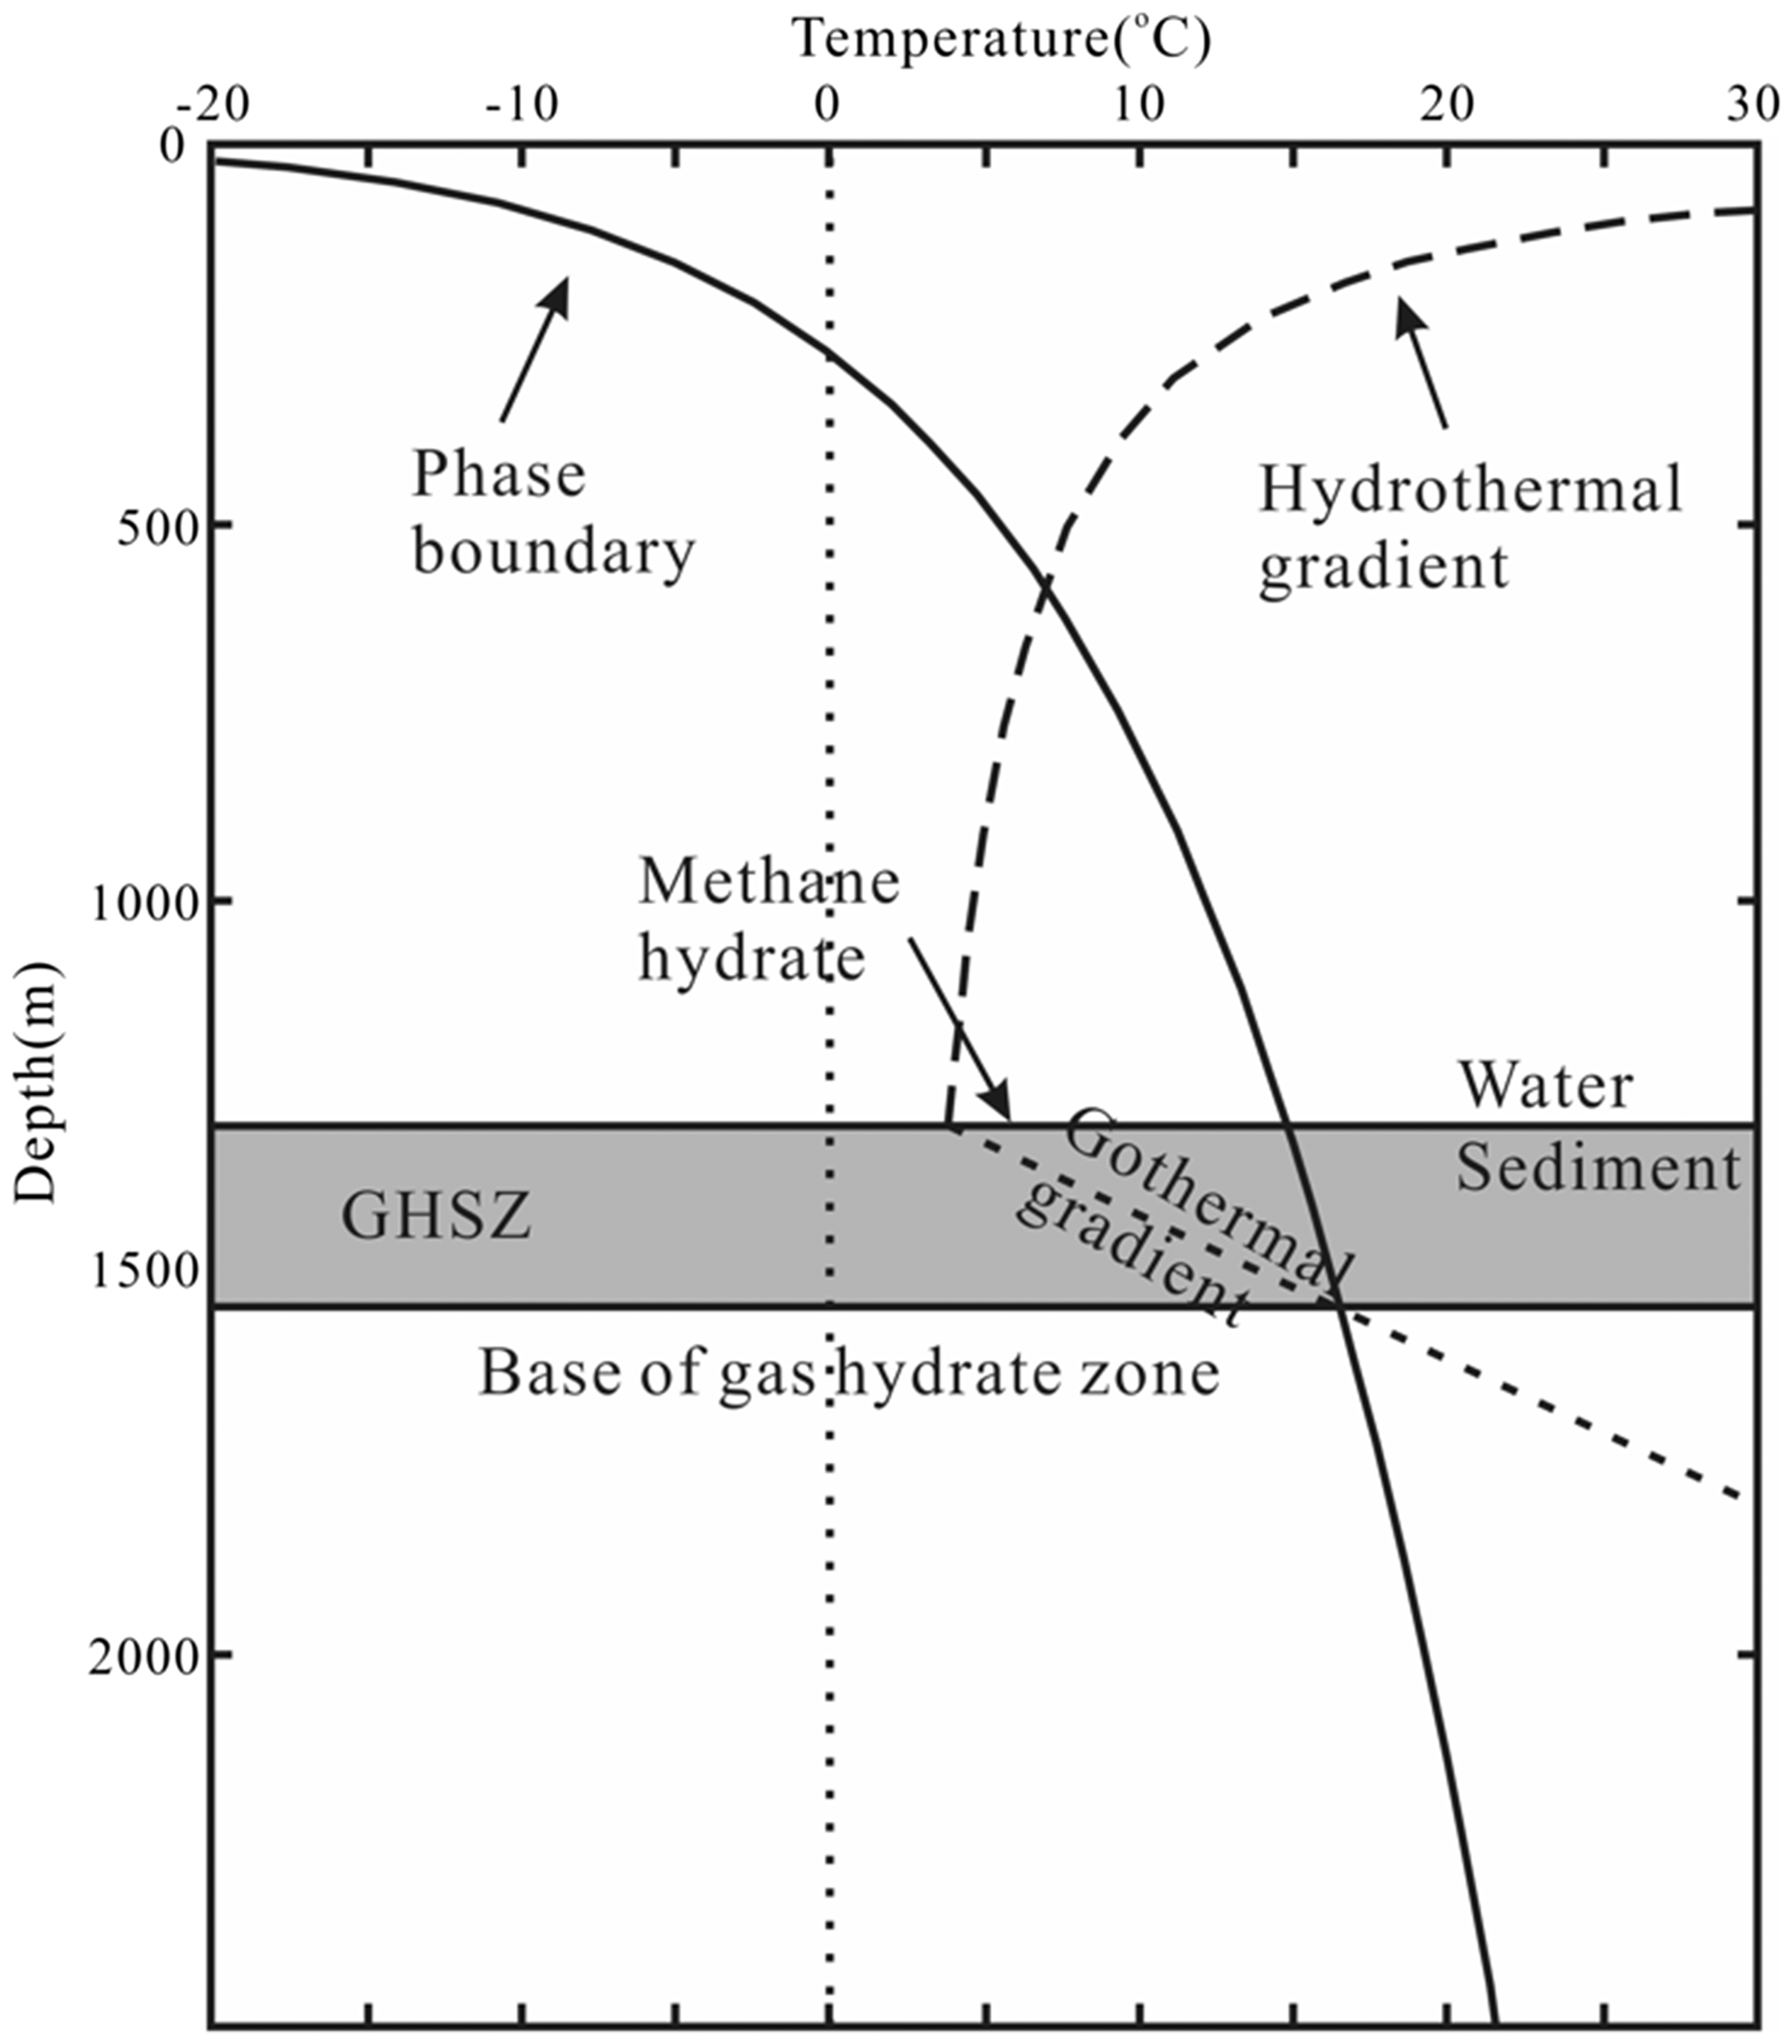
The principle of the base of gas hydrate zone calculation.
Based on the principle of the base of GHSZ being strictly controlled by temperature and pressure, we can calculate the seafloor heat flow by using the depth of bottom simulating reflector (BSR) (considered to be the base of the GHSZ in seismic data) and the relationship between thermal conductivity with depth (He et al., 2009). Scientists used this principle to calculate the geothermal gradient and heat flow and applied it to research on marginal basins, subduction zones and the maturity simulation of hydrocarbon source rocks in petroliferous basins and obtained good application results (Ashi and Taira, 1993; Ganguly et al., 2000; Kaul et al., 2000).
However, the measured heat flow is usually different from the heat flow derived from the BSR. Scientists used different treatments in different areas to explain this discrepancy (Davis et al., 1990; Golmshtok and Duchkov, 2000; Shyu et al., 1998; Townend, 1997). In recent years, the Guangzhou Marine Geological Survey has conducted a series of scientific drilling projects in the Shenhu area (Wang et al., 2014; Wu et al., 2011; Zhang et al., 2007) and successfully obtained gas hydrate samples in some boreholes (SH2, SH3, SH7, etc.). In this paper, the latest measured heat flow was compared with the BSR heat flow, which was calculated from seismic and drilling data. We analyzed the reason for the differences by using numerical simulation and provided theoretical guidance for the geothermal exploration of gas hydrates.
Geological setting
The Shenhu area is located in the middle of the northern slope of the South China Sea and is tectonically situated on the Zhu II depression of the Pearl River Mouth Basin (Figure 2(a)). In recent years, many heat flow measurements have been carried out in the Shenhu area (Figure 2(b)). Since the Miocene, the Shenhu area has entered the tectonic subsidence period. The high deposition rate created a favorable geological condition for the development of gas hydrates (Wu et al., 2009). The sedimentary layers are dominated by marine deposits. The content of organic matter was 0.46–1.9% (Wu et al., 2010) in the thick (1000–7000 m) sediments, which provided the material basis of the gas hydrate.
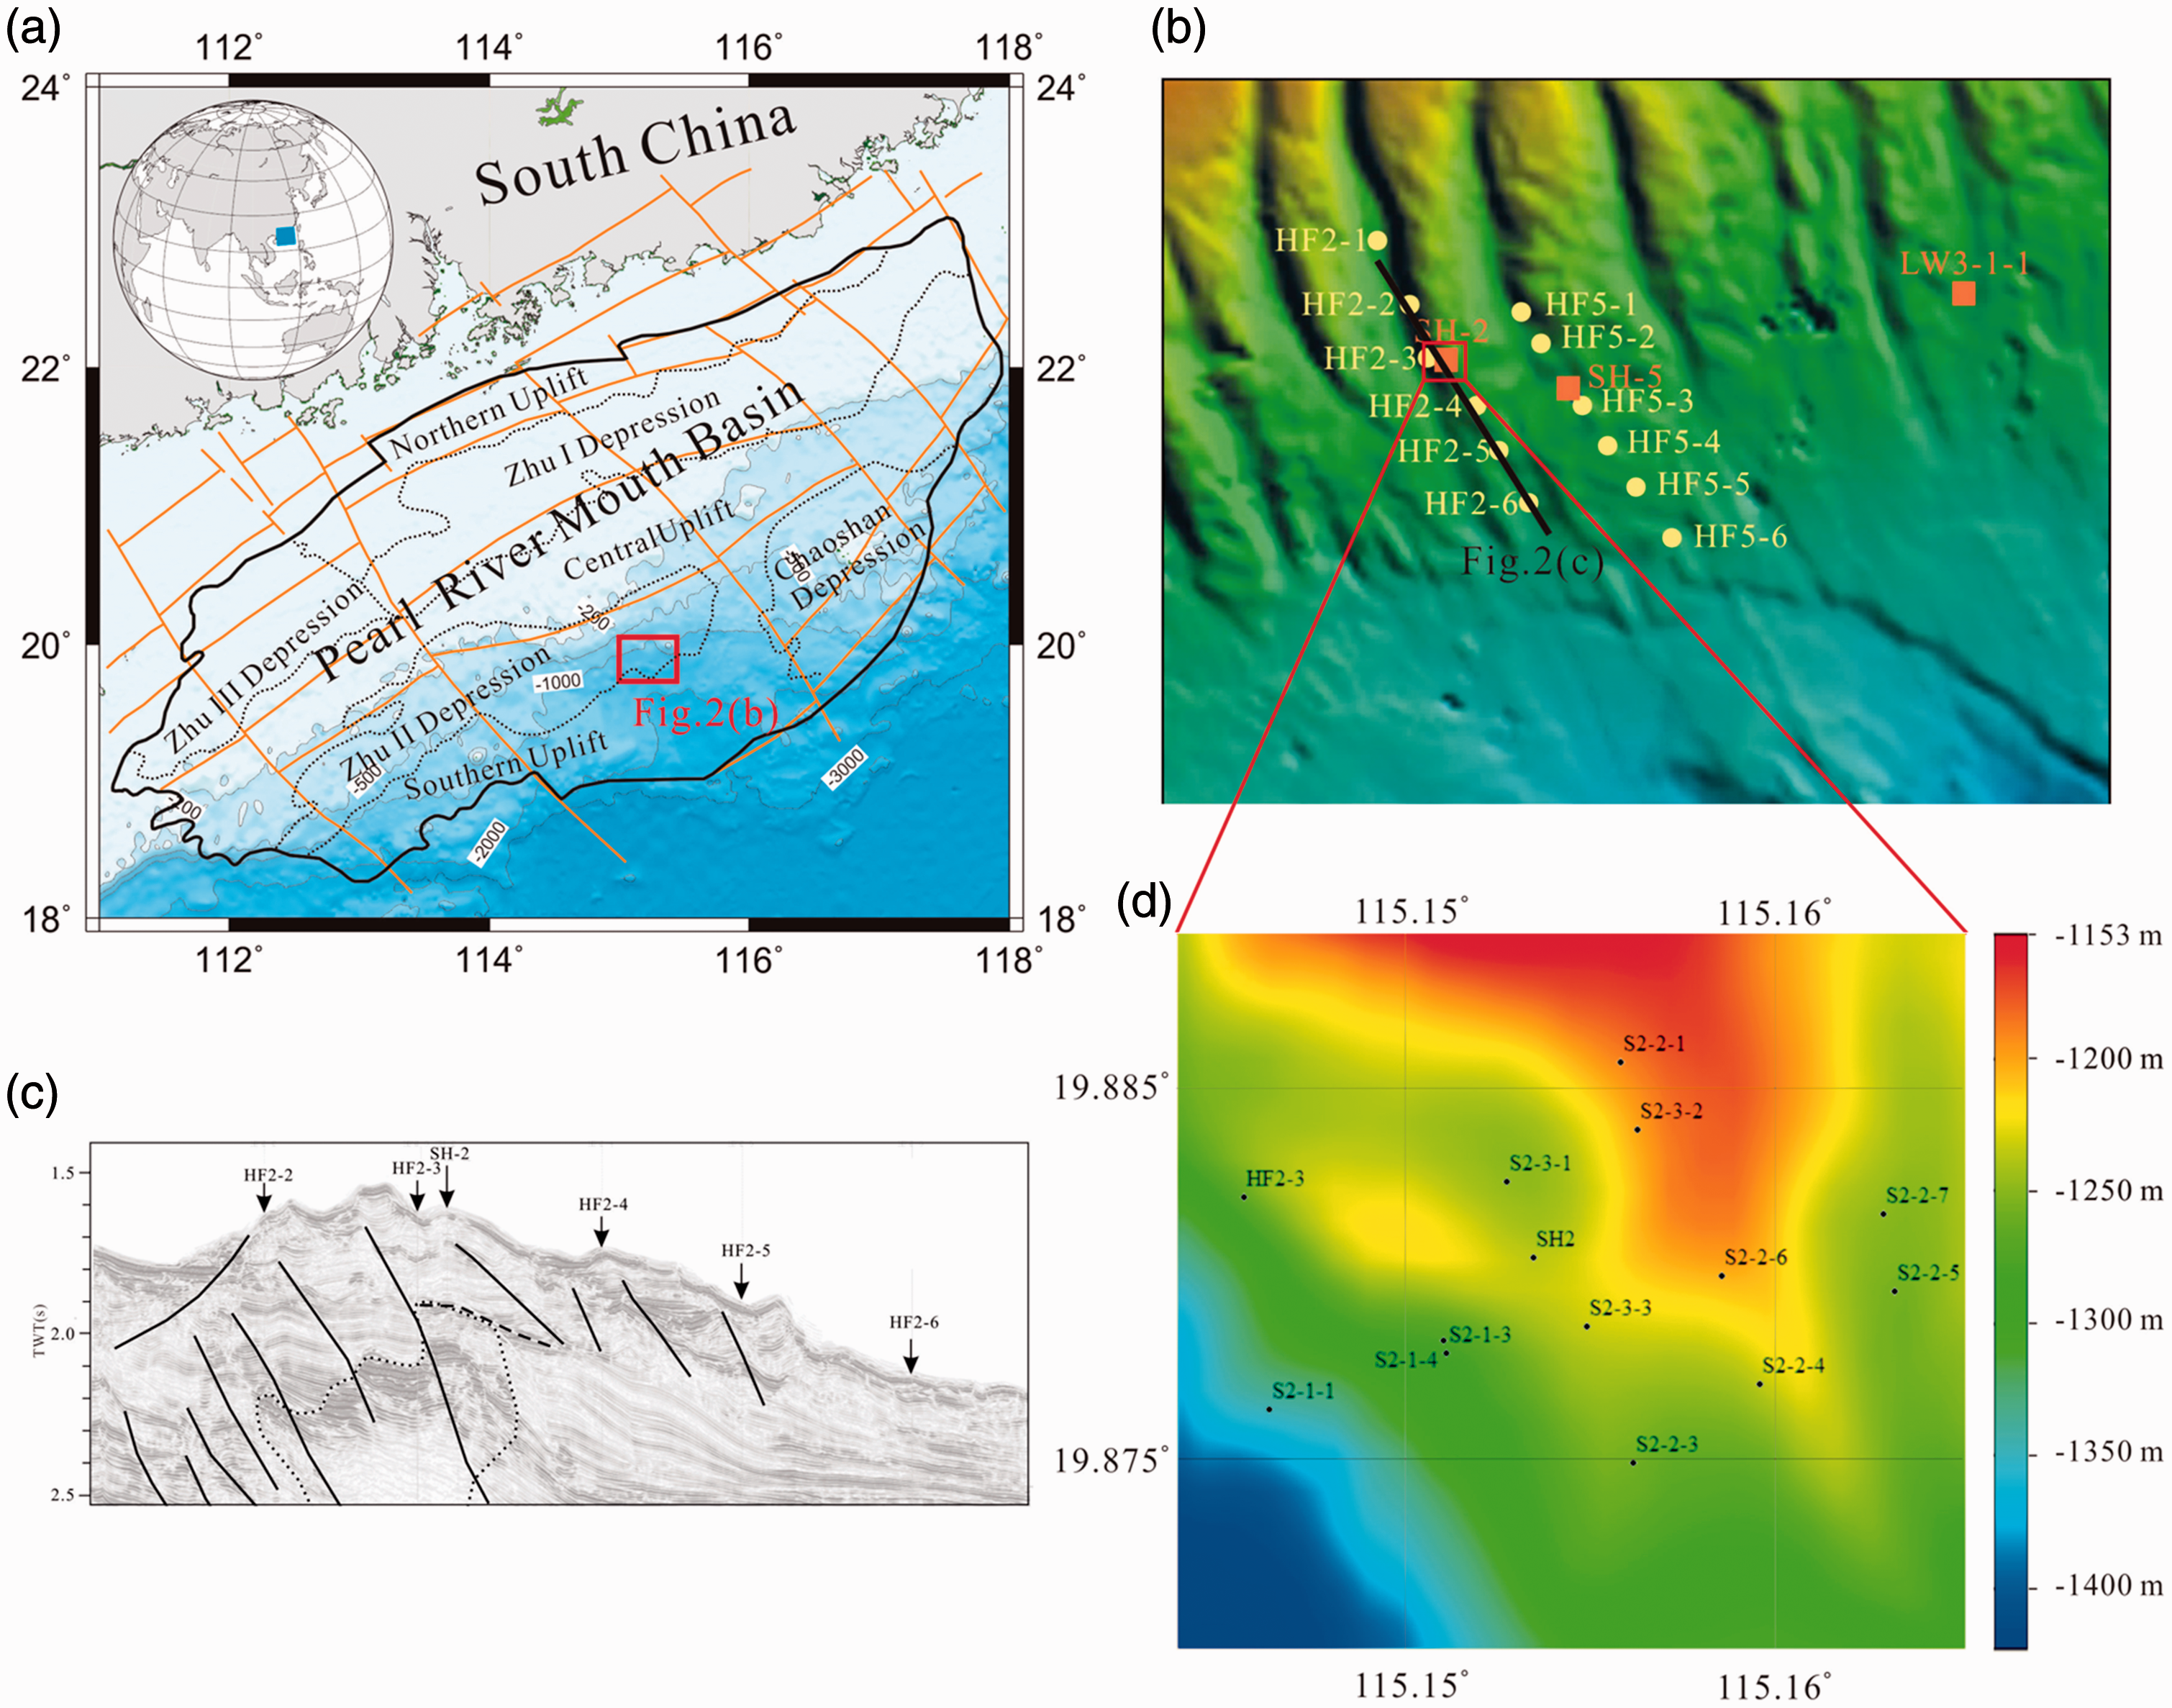
The location and topography of the study area. (a) The location and tectonic environment of the Pearl River Mouth Basin in the northern South China Sea. The red box represents the position of Figure 1(b). The orange lines show the faults. (b) Topography and heat flow measurement sites in the Shenhu area. The black line indicates the location of the seismic profile in Figure 1c. The yellow dots mark the heat flow sites measured previously. The orange squares represent the borehole location. (c) The seismic profile across the SH2 borehole. (d) The latest heat flow measurement sites and topography in the surrounding area of the SH2 borehole. The black dots mark the survey sites.
The faults in the northern slope of the South China Sea are mainly NE and NW trending (Figure 2(a)). The NE faults are tensional faults and the NW faults are shearing faults. Both fault types have good hydraulic conductivity. The faults in the Shenhu area were extremely active during the late period. The Cenozoic faults are well developed from the bottom up. The Paleogene basement fault was the main controlling factor for the rifting sediments. The basement faulting increased during the process of thermal subsidence. The Pliocene (2.0–1.5 Ma) is the peak period of faulting activity. The complex faulting activity made the sediments become a highly permeable fracture medium, which is beneficial to the extensive deep fluid flow and gas hydrate development (Wang et al., 2011). After the faulting activity, the surface of the seafloor was subjected to rapid sediment deposition (10–20 cm/ka). Moreover, the new sediments are not completely consolidated. The neotectonic movement has formed a large number of late structural traps and formed a massive mud diapir belt (Figure 2(c)), which is also believed to be related to the development of a gas hydrate in the Shenhu area (Liu et al., 2012).
Measured heat flow and BSR heat flow
Measured heat flow
The values of heat flow in the Shenhu gas hydrate drilling area range from 56 to 101 mW/m2 (Xu et al., 2016). Most sites have a heat flow value above 75 mW/m2. However, the values of the boreholes in which gas hydrate samples were successfully obtained range from 65 to 70 mW/m2. They are significantly lower than the average value of heat flow in the Shenhu area. During the formation process of this region, rapid deposition occurred due to the slump, and there was also undercurrent scouring that formed the erosion valley. There are many faults, fracture or diapirs under the erosion valley and gullies (Wu et al., 2009), and fluid activities can adjust the local temperature field. It is the combined effect of the above factors that caused large variations in the heat flow in such a small area.
To investigate the geothermal characteristics in the gas hydrate drilling area, the Guangzhou Marine Geological Survey has carried out intensive heat flow measurements within a 2 km radius around the SH2 borehole (Figure 2(d)). The EWING probe is used for measurements. EWING probes can only obtain geothermal gradients under water. The probe measurements method and data calculation method refer to Xu et al. (2006a, 2006b). Because the thermal conductivity cannot be measured in situ by this probe, thermal conductivity was obtained through indoor measurements. The samples were collected by the gravity-piston type corer when measuring the geothermal gradient. The thermal conductivity of the sediment samples was measured by a TK04 Thermal Conductivity Meter in the laboratory. Because the study area is very small, the values of thermal conductivity at each site are similar. Therefore, the values of thermal conductivity are set as a constant value of 0.96 W/(m·K).
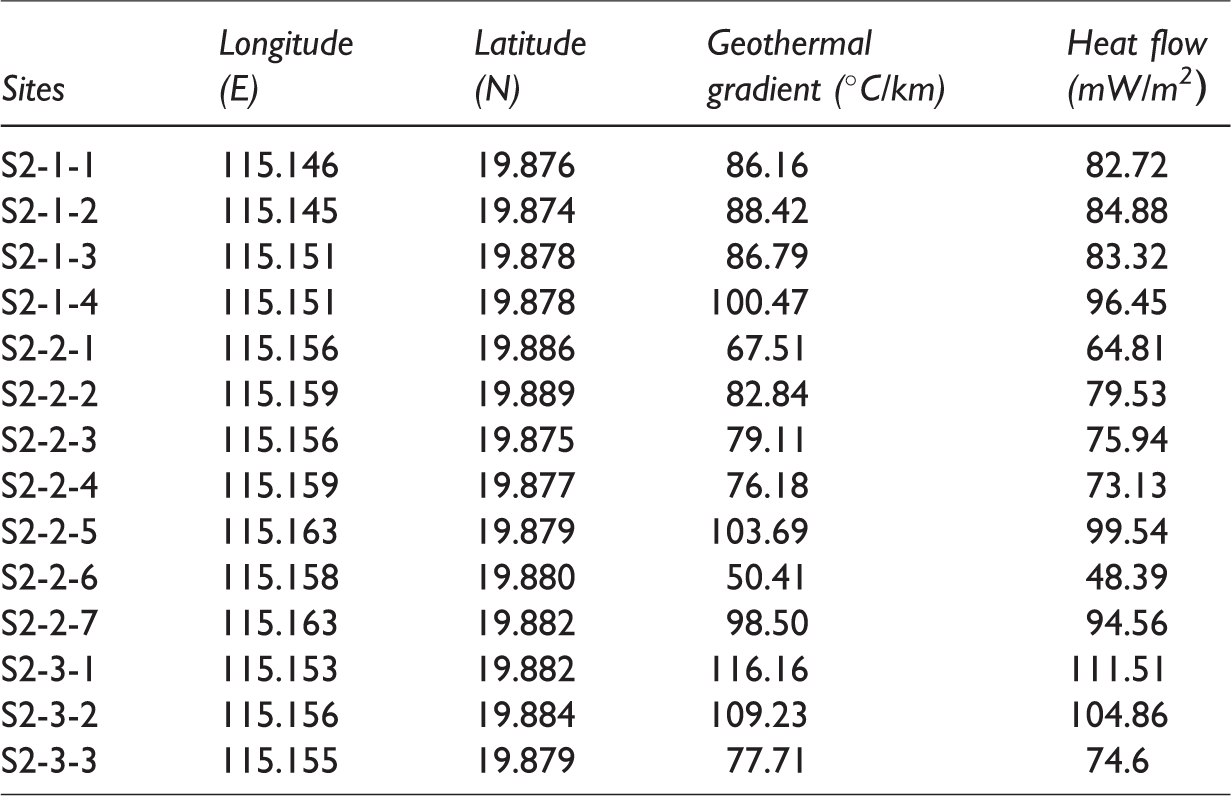
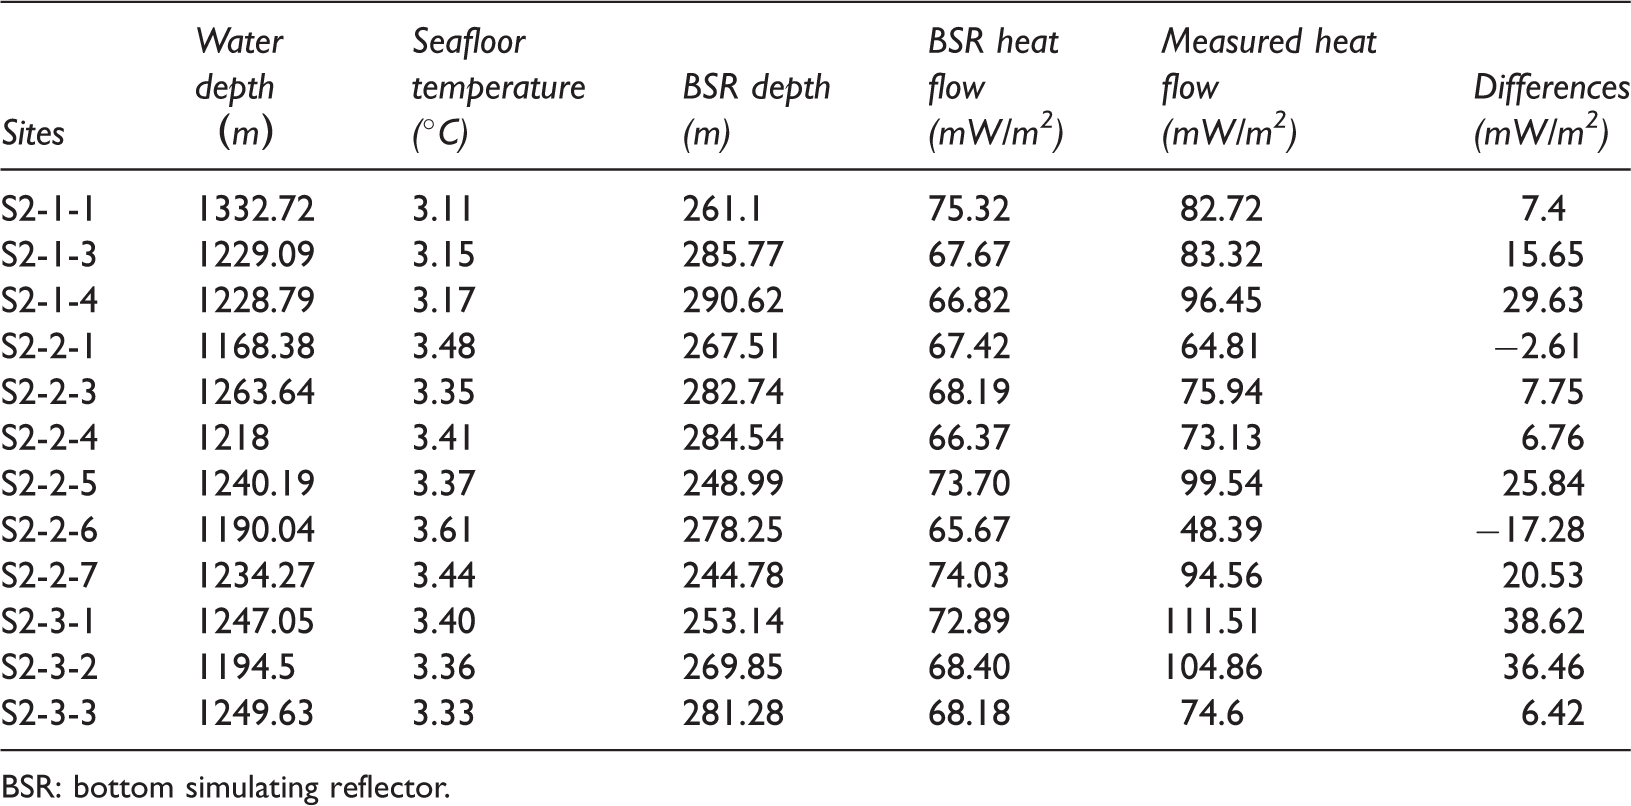
Table 1 shows the measured heat flow at each site. The measured heat flow in the study area varies greatly in the range of 48.4–111.5 mW/m2. The standard deviation of the measured heat flow is 16.71. The average value of the measured heat flow is 84.15 mW/m2. In the S2–2-6 site, the value of heat flow is substantially smaller than that in other sites. The contour map of measured heat flow is shown in Figure 3. The values of heat flow in most areas are between 70 mW/m2 and 100 mW/m2. There is a high heat flow northwest of the SH2 borehole. Southeast of the borehole, including the borehole location, the values of heat flow are low.
The results of measured heat flow in SH2 well surrounding area.
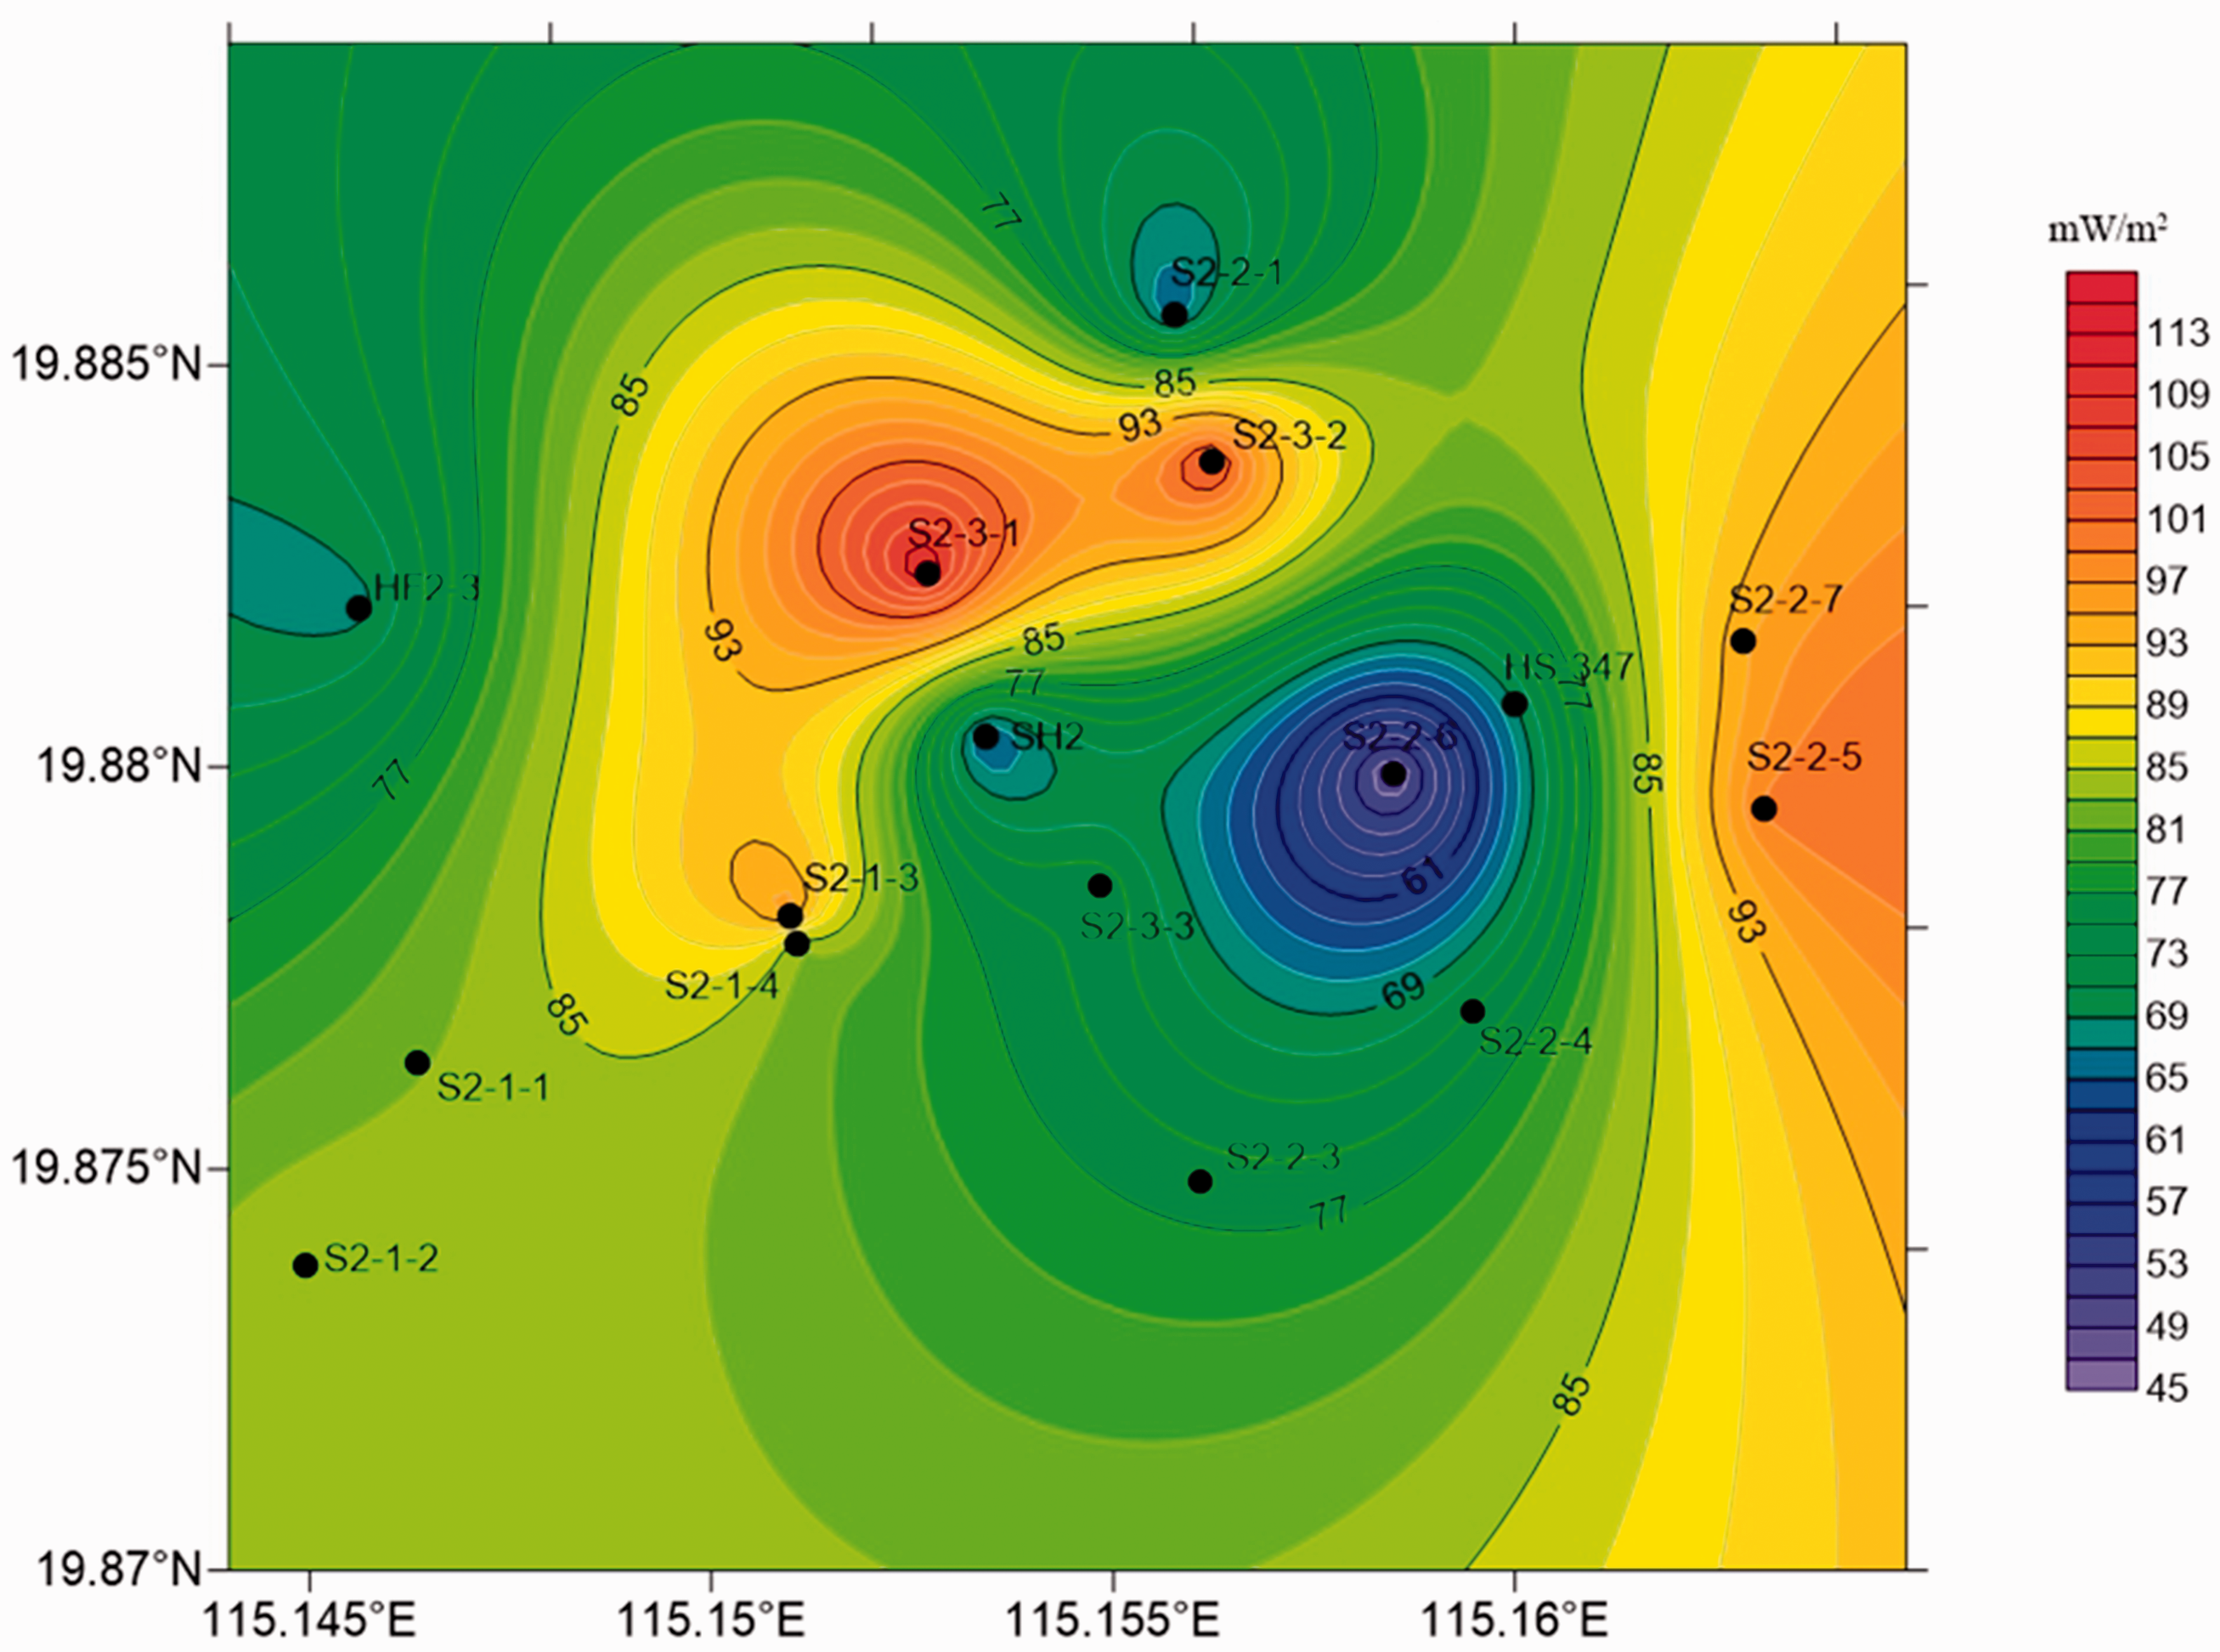
Heat flow contour of the study area. The black dots mark the survey sites.
Calculation of the BSR heat flow
The stability boundary curve equation of a gas hydrate (Dickens and Quinby-Hunt, 1994) was used when calculating the BSR temperature. The equation is as follows


In the absence of radioactive heat, the values of heat flow in the upper and lower layers should be the same. The heat flow can be calculated according to the calculated BSR temperature and thermal conductivity of the sediments and seafloor temperature.

Comparison of BSR heat flow and measured heat in each site.
BSR: bottom simulating reflector.
Table 2 illustrates that the differences between the BSR heat flow and measured heat flow have a range of −17.28 to 38.62 mW/m2. The values of the differences are mostly positive. The average absolute value of the differences is 17.91 mW/m2. The standard deviation of the BSR heat flow is 3.26, which means that the variation in the BSR heat flow is smaller than that in the measured heat flow. The average value of the BSR heat flow is 69.55 mW/m2, which is smaller than the measured heat flow. The correlation coefficient of the measured heat flow and BSR heat flow is 0.556.
Wang et al. (2005) found that there was a large difference (−87 to 59%) between the measured heat flow and BSR heat flow on two seismic lines in the northern margin of the South China Sea. They suggested that this may be related to tectonic sedimentary environments. Shyu et al. (1998) studied 23 heat flow sites in Southwest Taiwan. The difference was between −62% and 47%. When they used the hydrate phase equilibrium curve with the gas combination of 90% methane and 10% ethane in pure water, the calculated geothermal gradient was consistent with the measured geothermal gradient. Golmshtok and Duchkov (2000) found that the measured heat flow was higher than the BSR heat flow in Lake Backal. However, in areas with gas spill out, the difference is small. They believed that the inconsistency between the measured heat flow and BSR heat flow is caused by the instability of the hydrate due to the heat and fluid. Hence, scientists have different interpretations for the differences in different regions. In the surrounding area of the SH2 borehole, the differences are not large. According to the tectonic environment in the study area, we discuss the reasons for the differences in the following section.
Analysis and discussion
Parameter errors
Parameter errors are the inevitable factors that cause the difference between the measured heat flow and the BSR heat flow. Although many parameters, such as the seafloor temperature and thermal conductivity, used in the calculation are measured, other parameters including the depth of BSR reflection, lithostatic pressure model and the uncertainties in gas composition, pure water salinity and so on will produce errors. The error due to the time-depth conversion in seismic data is less than 5% (Ganguly et al., 2000). The reflection time in the BSR depth will cause approximately 2% error (Davis et al., 1990). The lithostatic pressure model will cause an error of 8–12% (Ganguly et al., 2000). In the pressure and temperature equation for the hydrate, the pure water/saline water and the different gas compositions produce errors in the range of 5–20% (Davis et al., 1990; Ganguly et al., 2000; Hyndman and Davis, 1992). The range of total errors caused by those factors is different for different scientists. Yamano (1982) used an error of approximately 25% in their research on the Nanki Trough and Blake Outer Ridge. Kaul et al. (2000) provided an error of approximately 10% in their research on the Makran accretionary prism. The research by Ashi and Taira (1993) at Nankai suggests that the error could be as high as 15–30%. Although the parameters used in the calculation are important factors that lead to the difference between the BSR heat flow and measured heat flow, the sum error of these factors is generally not more than 30%.
Topographic effects
The terrain in the Shenhu drilling area is mainly composed of a ridge, knoll, erosion gully and submarine canyon (Figure 2(b)). The undulating terrain is substantial in the study area. Because of the lack of high-density heat flow measurements and high-accuracy topographic data, when discussing the geothermal field and heat flow anomalies, the previous studies always focus on the deep and regional structures, and the influence of the topographic relief was often neglected or discussed simply.
We developed a 3-D finite element analysis model to calculate the seafloor topographic effect on surface heat flow. The model of the study area was limited to a rectangle with a width of 2107.57 m in the N-S direction and a length of 2181 m in the E-W direction (Figure 4). The top surface of the model was built on the bathymetry data. The boundary condition on the top surface was set to 3°C as the seafloor temperature. The thermal conductivity was set to the same value of 1.2 W/mK as the average measured thermal conductivity in the SH2 well. For the bottom of the model, we set a constant upward heat flux (80 mW/m2) as the boundary condition. The heat insulation boundary condition was applied to the four vertical sides of the model.
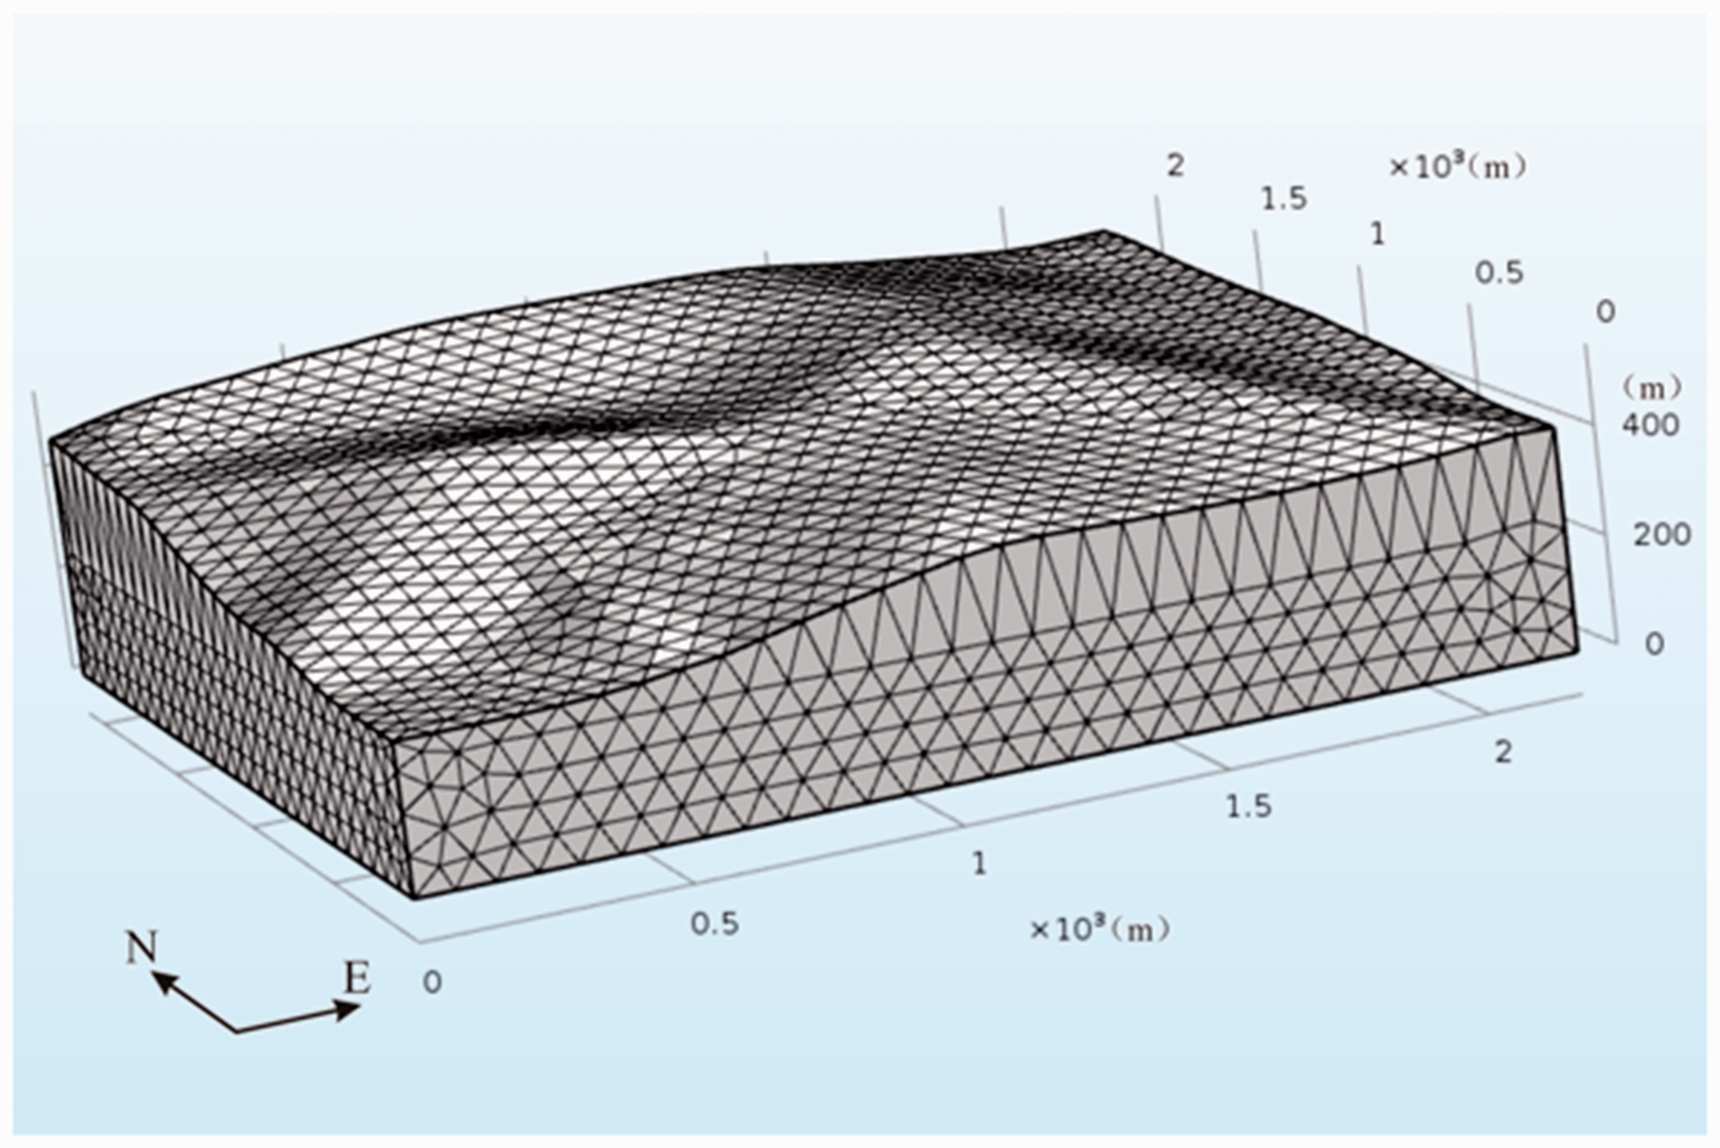
The meshing result of the topographic model.
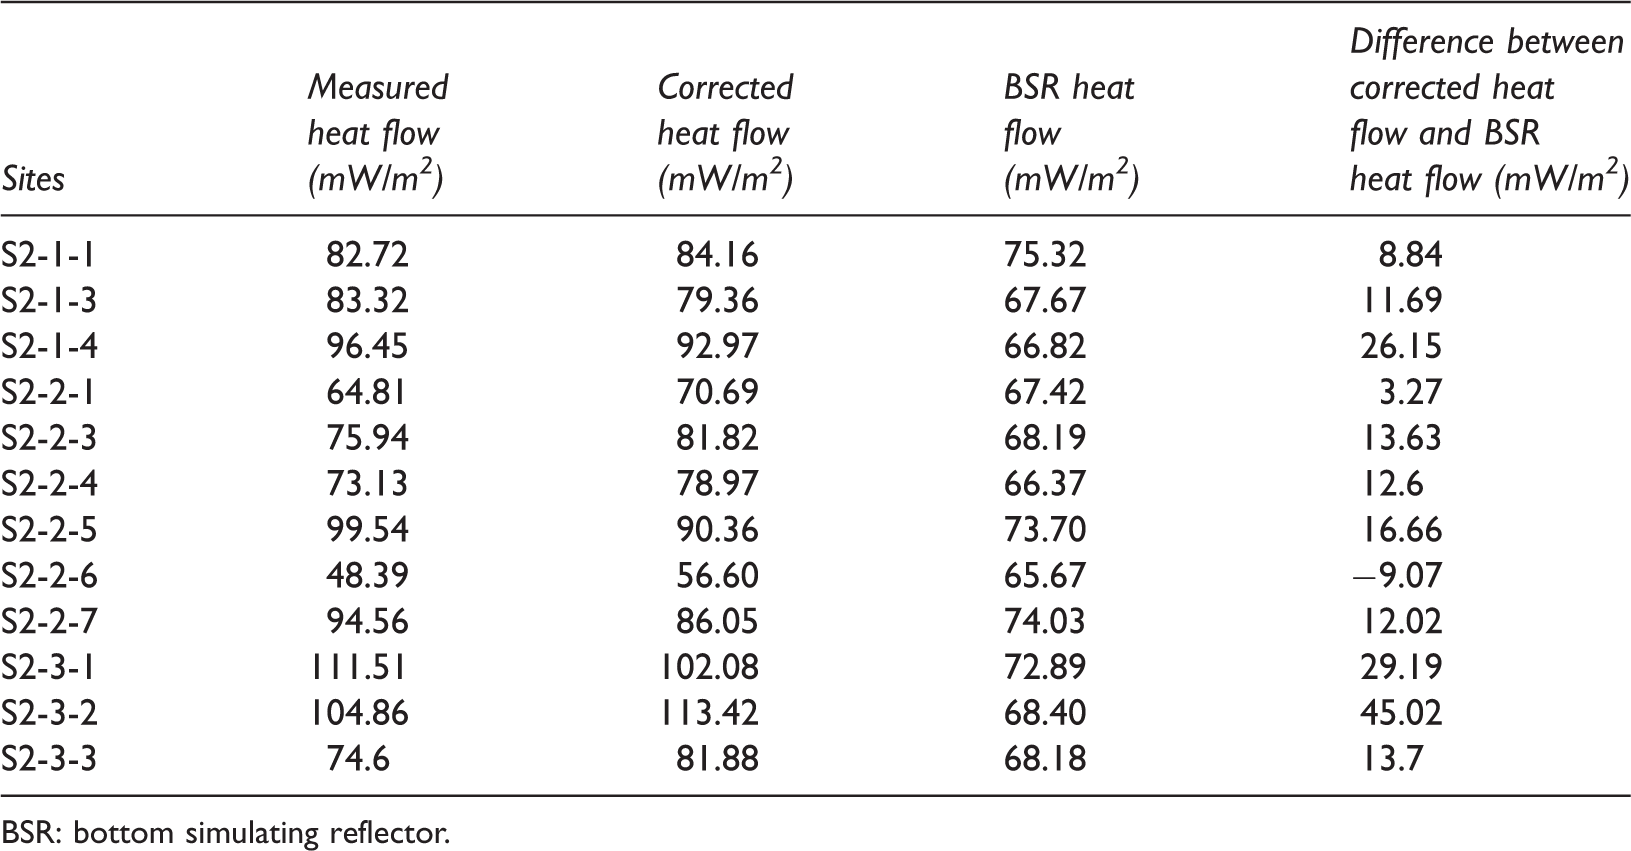
The results of the calculation are shown in Figure 5. It can be clearly seen from the graphic that the seafloor heat flow is severely affected by the topographic relief. In the case of the same deep heat flux, the value of heat flow in the raised area is high and that in the depression is low. The variation in the heat flow in areas with large bathymetric variations is also rapid (Figure 5(a)). The errors ((calculated surface heat flow-basal heat flow)/basal heat flow) caused by topographic relief in the study area are −50 to 30% (Figure 5(b)). We also calculated the error when the basal heat flow was given as 60 mW/m2 and 100 mW/m2. The results show that the errors are the same regardless of the basal heat flow value. Table 3 shows the results of the topographic correction of the measured heat flow at each site. From the table we can see that the corrected heat flow was substantially different from the measured heat flow. The standard deviation of the corrected heat flow is 13.82 less than that of the measured heat flow. As a result, a topographic correction should be applied to the heat flow measurements in the Shenhu drilling area, which has rapidly changing topography. As seen from the table, in addition to the S2–2-6 site, the differences between the heat flow after topographic correction and the BSR heat flow are positive. The range of differences is −9.07 to 45.02 mW/m2. The average absolute value of the differences between the corrected heat flow and BSR heat flow is 16.82 mW/m2 less than that of the measured heat flow.
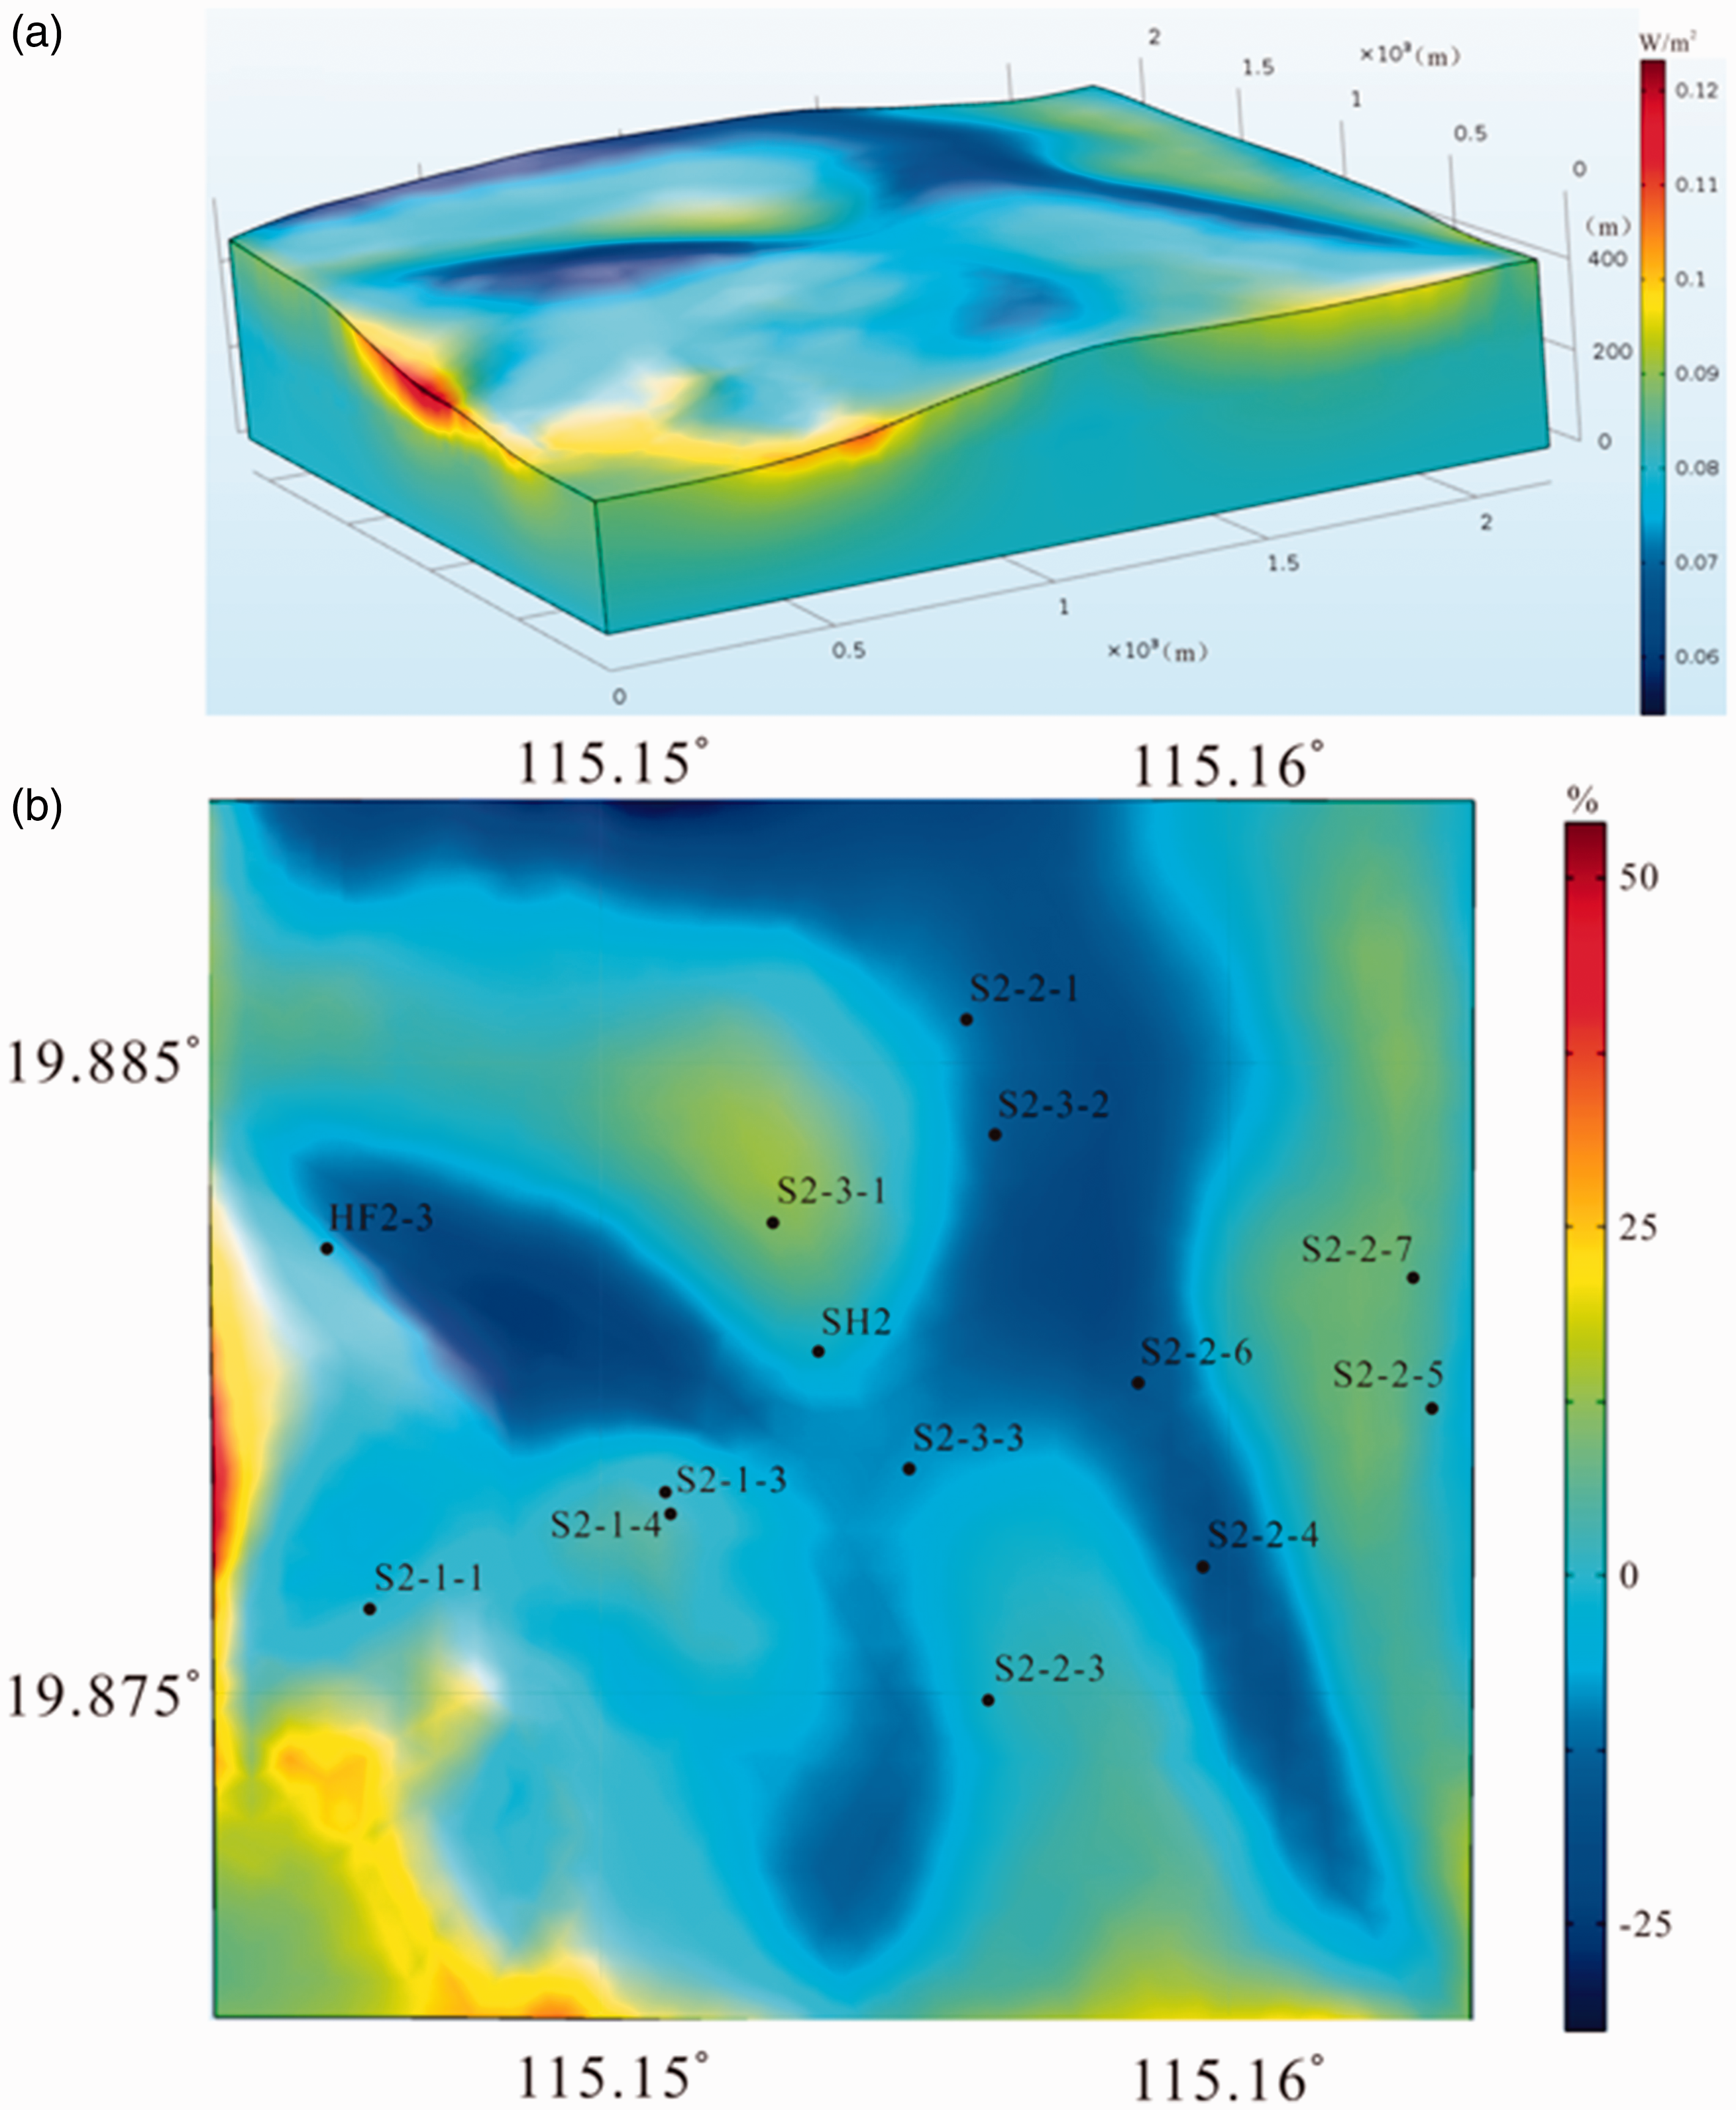
The 3-D topographic effects for the heat flow. (a) Numerical simulation results of the surface heat flow. (b) Errors between the surface heat flow and basal heat flow.
Comparison of the corrected heat flow and BSR heat flow in each site.
BSR: bottom simulating reflector.
Effect of fluid flux
A gas hydrate generally exists in shallow strata with high porosity in which there is a certain fluid activity. Moreover, a large number of Cenozoic faults in the Shenhu drilling area can easily form a tectonic channel for fluid activities. As a transmission medium of energy and mass, the flow of the fluid is an important factor for the distribution of the geothermal field. For a one-dimensional steady-state system, the heat flow values of the upper and lower strata should be the same. However, as a result of formation compaction, mineral dehydration, tectonic stress, seawater, cold and hot alterations between seawater and strata and other factors, the fluid activity can cause different heat flow values in the upper and lower strata.
To explore the influence of the fluid activity in strata, we can obtain the relationship among the GHSZ thickness, fluid flux and geothermal gradient based on Xu and Ruppel (1999).
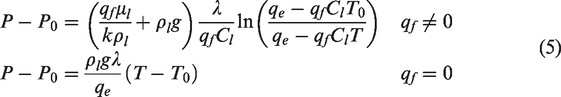
As shown in Figure 6, when the thickness of the GHSZ is certain, the geothermal gradient is higher with increasing fluid flux. For example, when the GHSZ is 275 m, the geothermal gradient is 70 K/km with no fluid flux. However, when there is a 3.13 × 10⁻⁷ kgs−1m−2 fluid flux, the geothermal gradient would increase to 80 K/km. Because of the upward migration of the fluid, the geothermal gradient is small in the deep strata and increases near the seafloor. The heat flow measured by the probe is that of the strata below the seafloor a few meters deep, which belongs to the higher geothermal gradient layer. It will cause the “apparent heat flow” on the surface of the seafloor to be greater than the “apparent heat flow” in the deep strata. If we do not consider the fluid activity, the measured heat flow would be greater than the BSR heat flow.
The relationship among the GHSZ thickness and fluid flux and the geothermal gradient.
Conclusions
By comparing the measured heat flow and the BSR heat flow in the Shenhu gas hydrate drilling area of the northern South China Sea, we reached the following conclusions:
In the Shenhu gas hydrate drilling area, the values of measured heat flow vary greatly in a very small region. The range of measured heat flow is 48.4–111.5 mW/m2. The average measured heat flow is 84.15 mW/m2. The standard deviation of the measured heat flow is 16.71. The range of BSR heat flow is 65.67–75.32 mW/m2. The standard deviation of the BSR heat flow (3.26) is smaller than that of the measured heat flow, which means that the variation in the BSR heat flow is smaller than that in the measured heat flow. The average value of the measured heat flow (84.15 mW/m2) is greater than that of the BSR heat flow (69.55 mW/m2). The correlation coefficient of the measured heat flow and BSR heat flow is 0.556. The absolute value of the differences between the BSR heat flow and measured heat flow is 17.91 mW/m2. The terrain changes strongly in the Shenhu area, and the topographic relief has a large influence on the measured heat flow. The numerical simulation results show that the errors caused by topographic relief are the same regardless of the basal heat flow value. The errors caused by topographic relief in the study area are −50 to 30%. The standard deviation of the corrected heat flow is 13.82 less than that of the measured heat flow. When the thickness of the GHSZ is certain, the geothermal gradient is higher with increasing fluid flux. The upward migration of fluid would cause the “apparent heat flow” on the seafloor surface to be greater than the “apparent heat flow” in the deep strata.
Footnotes
Acknowledgements
We would like to thank the reviewers and editors for their valuable comments on this article.
Declaration of conflicting interests
The author(s) declared no potential conflicts of interest with respect to the research, authorship, and/or publication of this article.
Funding
The author(s) disclosed receipt of the following financial support for the research, authorship, and/or publication of this article: This work was funded by the National Natural Science Foundation of China (no. 41574074; U1701245; 41430319).