
Abstract
In this paper, the mechanistic wall heat partitioning approach was used to capture the complex heat and mass transfer in sub-cooled boiling flows. In order to accommodate the changes of local variables to be relevant to the physical properties of sub-cooled fluids, the Wet-Steam (IAPWS-IF97) is used as the working fluid. Currently, the approach is evaluated based on the bubble sliding along the wall before lifting-off, which is usually found in the flow boiling situations. In the simulation, the closure mechanistic models, including the fractal analysis, the force balance and the mechanistic frequency, were coupled with the Eulerian–Eulerian two-fluid framework, while the Shear Stress Transport model was used as a turbulent modelling closure. The Multiple Size Group model was introduced to handle the bubble interactions and predict the bubble size distribution. Moreover, the effect of adopting the sub-cooled liquid properties into the modelling was investigated and compared with the experiments over a wide range of flow conditions. Specifically, the predicted void fraction and the sub-cooling temperature near the heated wall were precisely compared with the cases of using the constant-property liquid. Overall, the satisfactory agreements were found between the experiments and the predictions of the liquid temperature, void fraction, interfacial area concentration, Sauter mean diameter and bubble and liquid velocities with the exception of the case of high heat and mass fluxes. To enhance the current prediction accuracy for a situation of having a high superheating temperature, more bubble interactions on the boiling wall, such as merging of the bubbles while sliding, need to be considered. Furthermore, to assess the model capability, this mechanistic approach will be introduced to elucidate the sub-cooled boiling flow in situations of using different fluids in the near future.
Keywords
Introduction
Sub-cooled boiling phenomenon is usually found within two-phase thermal systems such as nuclear reactors, boilers and heat exchanger applications. As a ground requirement for safety and efficiency in operations, a fundamental knowledge and in-depth understanding of the sophisticated heat and mass transfer processes are necessary. During the past decades, the complexities of pool boiling and flow boiling have been investigated through a number of experimental works. Especially, the bubble characteristics, including the growth, the lift-off at the heated surface and its condensation in bulk liquid, as well as the influence of the local fluid temperature, velocities of liquid and vapour and bubble size distribution, have been observed and measured.1–6 Subsequently, many empirical correlations have been formulated, and the resultant data have been used to advance a development of proposed numerical methods.7–12
Based on the physical and mechanistic views, the sizes and frequency of bubbles generated at the heated rod surface can be used to explain how quickly the latent heat is transferred from the heated surface into the bulk liquid. Hence, these bubble parameters are usually involved in determining the wall heat flux partitions, including convective, conductive (quenching) and evaporative heat fluxes. In brief, the bubble nucleation sites, the departure diameters, the growth rates (frequency) and the waiting times are the main parameters considered to find the heat flux components. Afterwards, a number of proposed models have been developed and adopted into computational fluid dynamics (CFD) codes for predicting the nuclear system and boiling applications.13–15
The Rensselaer Polytechnic Institute (RPI) algorithm is available in many commercial CFD programs in order to dissipate the heat supplies at the wall into the bulk liquid domain, as proposed by Kurul et.al. 8 However, the availability of the sub-models for calculating the bubble parameters is currently linked with the use of some empirical correlations only. After reviewing the published literatures, it has been found that those available models are mostly suitable for predicting the pool boiling situations.5,8 Interestingly, the capabilities of some available empirical correlations for predicting the sub-cooled boiling flow at low pressure and at a wide range of heat and mass fluxes can be found from Cheung et al.’s 16 work along with some limitations from using them. To handle the complexity of the flow boiling, many researchers have recently studied and developed the individual mechanistic models based on the physical bubble behaviours, for instance, a sliding before lift-off, coalescence with neighbours to later become a mushroom bubble and also a reduction in the size while attaching to the wall due to its exposure to a cooler bulk liquid.3,17–25
To the best of author’s knowledge, there is no existing combination of empirical correlations which is able to predict a wide range of boiling flow conditions. Also, as mentioned by Warrier and Dhir, 26 using the correlation without physical mechanisms of bubbles could also sometimes lead to a significant difference between the prediction and experimental data. Recently, our group has investigated a combination of recent developed mechanistic models to study the boiling flow at low and elevated pressure; however, due to instability issues, the material employed in these works was a constant-property liquid,27,28 which does not represent the actual properties of the sub-cooled liquid.
Normally, to obtain the accurate bubble parameters for further calculations of the mass and heat transfers from the heated wall, the local fluid thermal and transport properties near the heated surface including saturation temperature, liquid temperature, liquid density, sensible and latent heats are crucial factors. 29 To avoid a possible instability problem, the constant property is frequently used in simulations. However, in reality, having varied pressures and saturation temperatures in flow domain could impact on the calculations of the coupled resultant terms at the wall boiling algorithm ( such as the superheating temperature). This kind of variation in the thermophysical properties sometimes can be difficult to be modelled. In addition, the locally realistic properties of the fluids can also influence on bubble-interaction mechanisms, i.e. breakup, coalescence30,31 and the condensation. 24 Consequently, through consideration of real fluid properties, a more precise prediction of vapour bubble size and its distribution could be expected.
In this study, the mechanistic model consisted of the fractal analysis, 32 the force balance method 17 and mechanistic frequency model 1 which was adopted for predicting the nucleation site density, bubble departure diameter and bubble departure frequency. During the model implementation, this mechanistic model has been preliminarily investigated.33,34 Nevertheless, the special attention in this research is to investigate the characteristics of sub-cooled boiling flow at low pressure through employing a material that could accommodate variable properties that depend on local pressure. For this purpose, Wet-Steam material is adopted in this numerical study. Hence, the performances between using the Wet-Steam properties and the constant-property liquid in the modelling are investigated.
The current capability of this proposed approach will be investigated under a wide range of the flow conditions (heat flux, mass flux, sub-cooling’s degree, etc.). The results from the experiments of Lee et al., 35 and Yun et al.,36,37 are introduced to perform the validation study. Mainly, the objectives of this research are (i) to evaluate the accuracy of this mechanistic wall partitioning model in terms of predicting the local parameters (i.e. void fraction, Sauter mean diameter (SMD), liquid velocity, vapour velocity, interfacial area concentration (IAC), superheating wall temperature and liquid temperature) under various conditions at low pressure and (ii) to compare some of the physical behaviours of the flow near the heated wall when the Wet-Steam is adopted as the working fluid against the constant-property liquid.
Sub-cooled boiling flow characteristics
A schematic illustrating the main phenomena of the sub-cooled boiling flow is shown in Figure 1. The sub-cooled liquid flow is introduced into the channel where the walls are heated. At the surface of the heated wall, the vapour bubbles start to nucleate. This point is called the onset of nucleate boiling point. The location, where the amount of vapour starts to significantly increase, is called the onset of significant void. At this stage, the sub-cooling temperature is still dominating the flow structure.
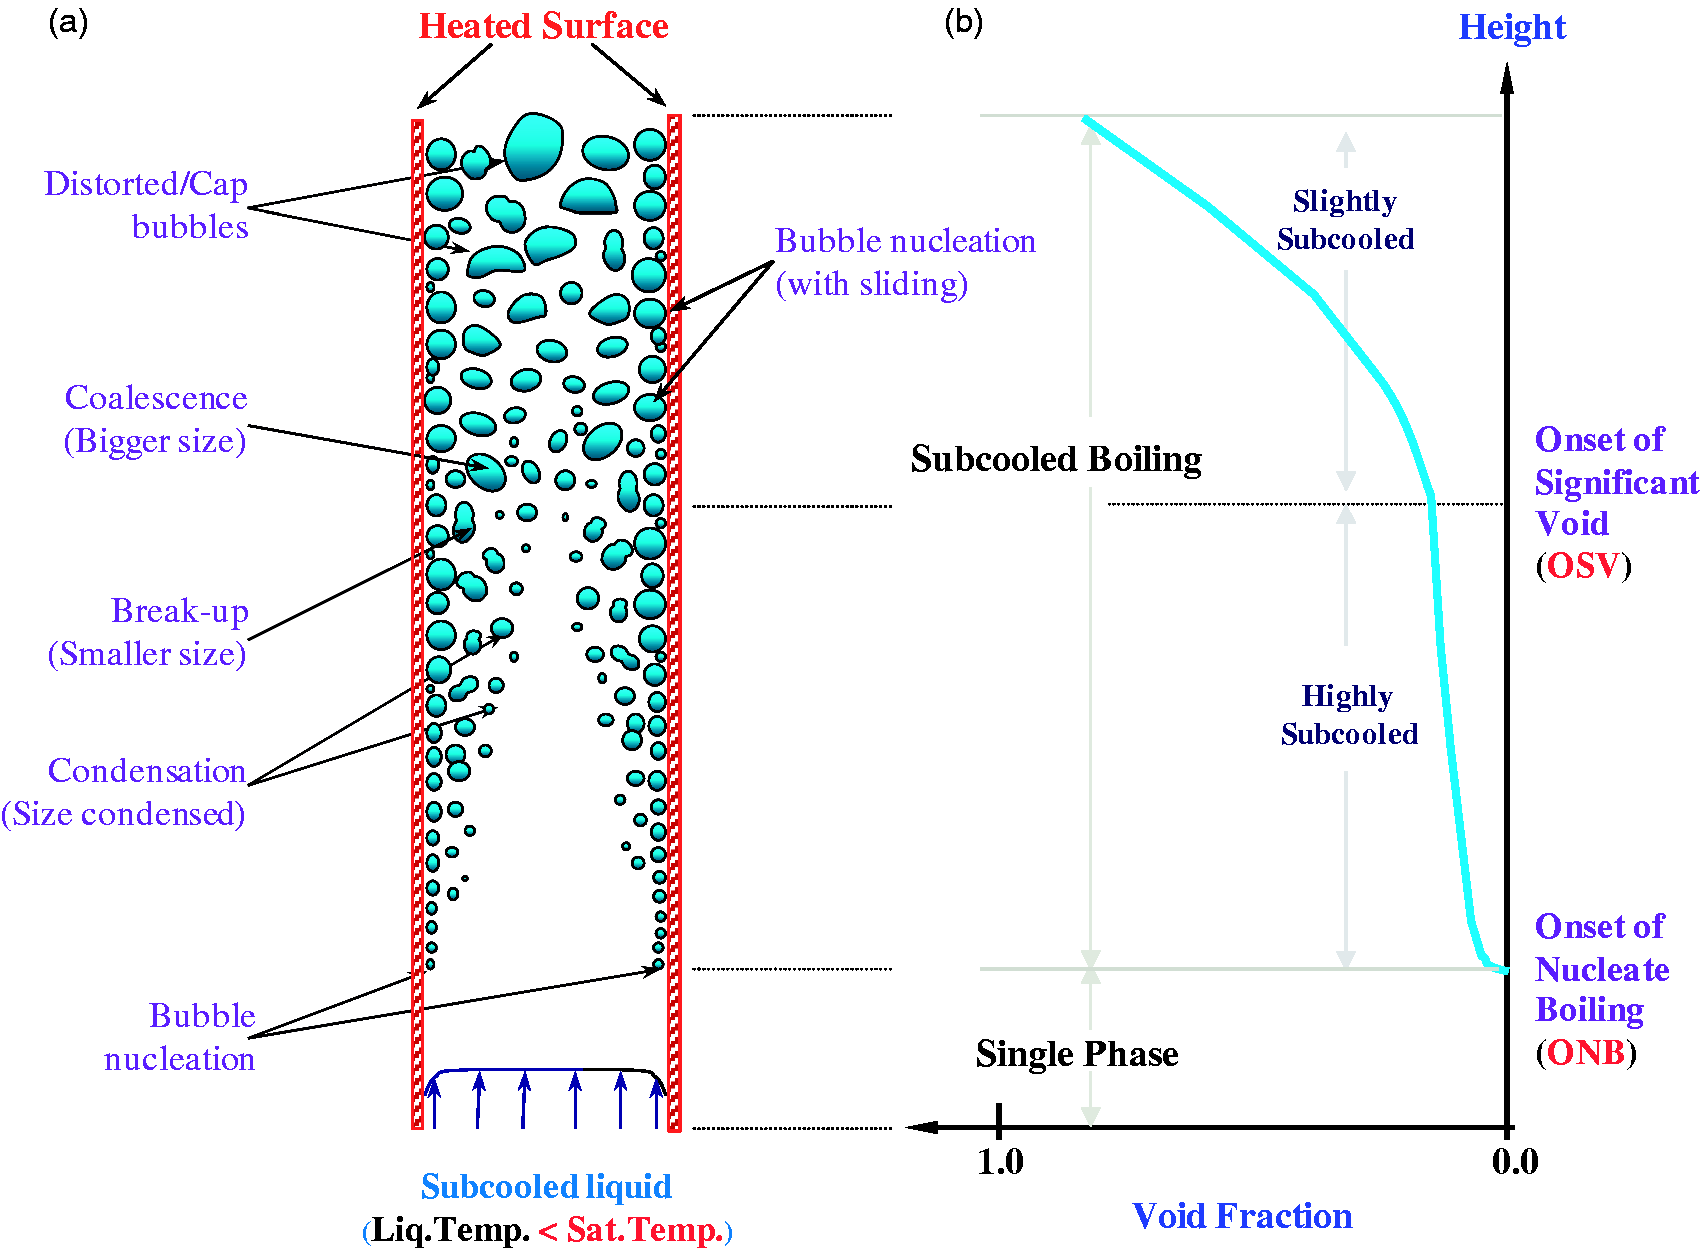
Phenomenological descriptions of sub-cooled boiling flow. (a) Bubble-interaction mechanisms and (b) bubble void fraction. OSV: onset of significant void; ONB: onset of nucleate boiling.
Figure 1(b) shows the change of bubble void fraction along the height of the heated section. As clearly seen, the void fraction of vapour gas may increase along the wall because of bubble generation and bubble interactions like the coalescence. Nevertheless, the bubbles might be reduced in size or even disappear because of break-up and condensation when they are exposed to the lower temperature bulk liquid.
Modelling equations
Two-fluid model
Physically, a sub-cooled boiling flow can be described based on the averaged governing equations of continuity, momentum and energy for each phase. These equations of gas and liquid are solved separately for each individual phase, which can be represented as disperse phase (
Continuity equation
Gas phase
Liquid phase
where


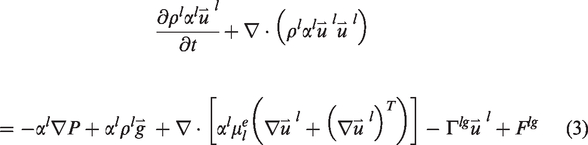
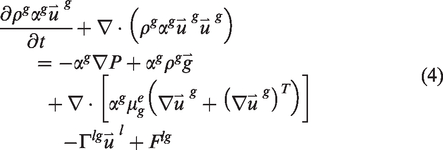
Momentum equations
Liquid phase
Gas phase
Turbulence model
where
Unlike single-phase fluid flow problem, some numerical investigations have revealed that the Shear Stress Transport (SST) model, developed by Menter,
38
has been shown to provide more realistic prediction of gas volume fraction or void fraction close to the wall of the flow domain. Basically, this model applies the two-equation
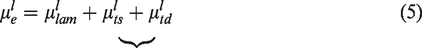
The shear-induced turbulence term is given by

Also, the bubble-induced turbulence can be calculated using

The constants Interfacial momentum forces
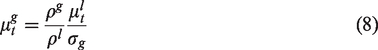
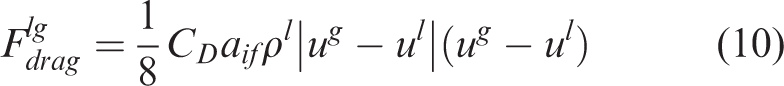
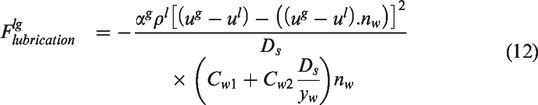
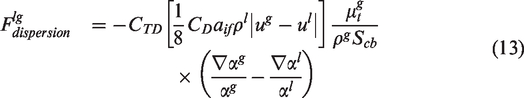
The total interfacial force

The total interfacial force in equation (9) is given by
For the lift force, it can be calculated based on the slip velocity and the curl of the liquid phase velocity, and it can be seen as follows

In equation (11), the constant
Energy equation
Liquid phase
Because the gas phase is assumed to be at saturation, the energy equation for the gas phase can be ignored. The energy equation of liquid phase may be expressed as
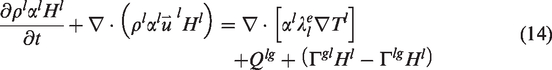
Equation (14) shows the interfacial heat transfer Interfacial energy terms
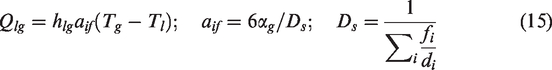
In order to calculate the heat transfer at the interface, the interfacial area term (
Population balance method
Population balance method (PBM) is widely applied to determine the coalescence and break-up phenomena of bubbles. In this study, homogeneous Multiple Size Group (MUSIG) model, originally developed by Lo,
43
was used to account for a non-uniform bubble size distribution.


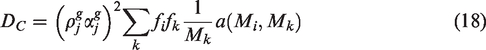


For the discretised contribution of the birth rate due to coalescence, it may be necessary to introduce the coalescence mass matrix as the fraction of mass due to coalescence between the kth bubble classes at which goes into the ith bubble classes. Defining the coalescence mass matrix as
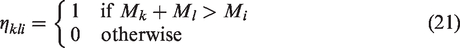
The birth rate due to coalescence was modified accordingly by multiplying the above matrix
Proposed mechanistic models for wall heat-flux partitioning algorithm
In order to calculate the constituted parameters at the heat-flux partitioning algorithm, the proposed models employed for nucleation site density, bubble departure diameter and bubble lift-off frequency calculations are required, which are detailed in the following sections.
Nucleation site density (
) –Fractal analysis
In this study, the fractal analysis, originally formulated by Mikic and Rosenow,
44
is employed for the calculation of active nucleation site density. Basically, this model considers the nucleation site density based on a power correlation of the active cavities on the heated surface. As shown in equations (22–25), the superheating (Tsup) and sub-cooling (Tsub) temperatures and other liquid properties, such as thermal boundary layer thickness (

From the above equations,
Bubble lift-off diameter (
) – Force balance approach
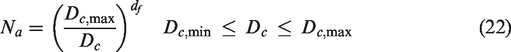
The force balance approach, formulated by Klausner et al. 17 and Zeng et al., 45 is introduced for calculating the bubble lift-off diameter. All the forces acting on the vapour bubbles are depicted in Figure 2, and the equations used for calculating the bubble diameter are shown in equations (26) and (27).
Schematic diagram of the forces acting on a vapour bubble before leaving the heated wall. 19
Along the x-direction


Along the y-direction

where Fsx and Fsy are the surface tension forces, Fdux and Fduy are the unsteady drag forces due to asymmetrical growth of the bubble,
Also,
The bubble lift-off diameter (
Bubble lift-off frequency (
) – Mechanistic frequency model
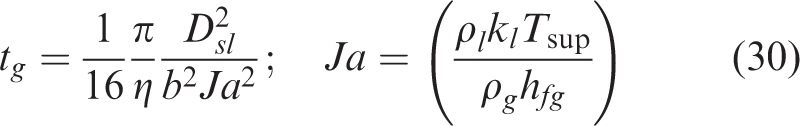
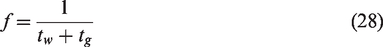
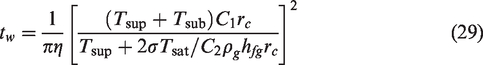
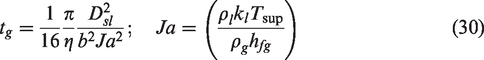
The bubble frequency term is calculated using a mechanistic approach proposed by Yeoh et al. 1 Generally, this frequency term is formulated by considering a life cycle of vapour bubble generation at the active cavity site. By substituting the waiting time and the growth time, the formula for the bubble lift-off frequency can be obtained as shown in equation (28).
Moreover, the consuming (waiting) time (
Experimental descriptions
Six cases of different flow conditions from Lee’s experiments (L152, L197 and L252) and Yun’s experiments (Y374, Y371 and Y567) were introduced for this validation study. Their operation details are presented in the Table 1. Working fluid used in the experimental study was demineralised water as mentioned in Lee’s paper. The uncertainties of the void fraction, liquid and gas velocities were 3% and the bubble SMD was 27%. For Yun’s experiments, the uncertainties of the void fraction, liquid and gas velocities were mentioned to be 10%. For the temperature and pressure, their uncertainties were at 1.2 K and 0.5 kPa, respectively.
Operating conditions of the selected experimental cases.
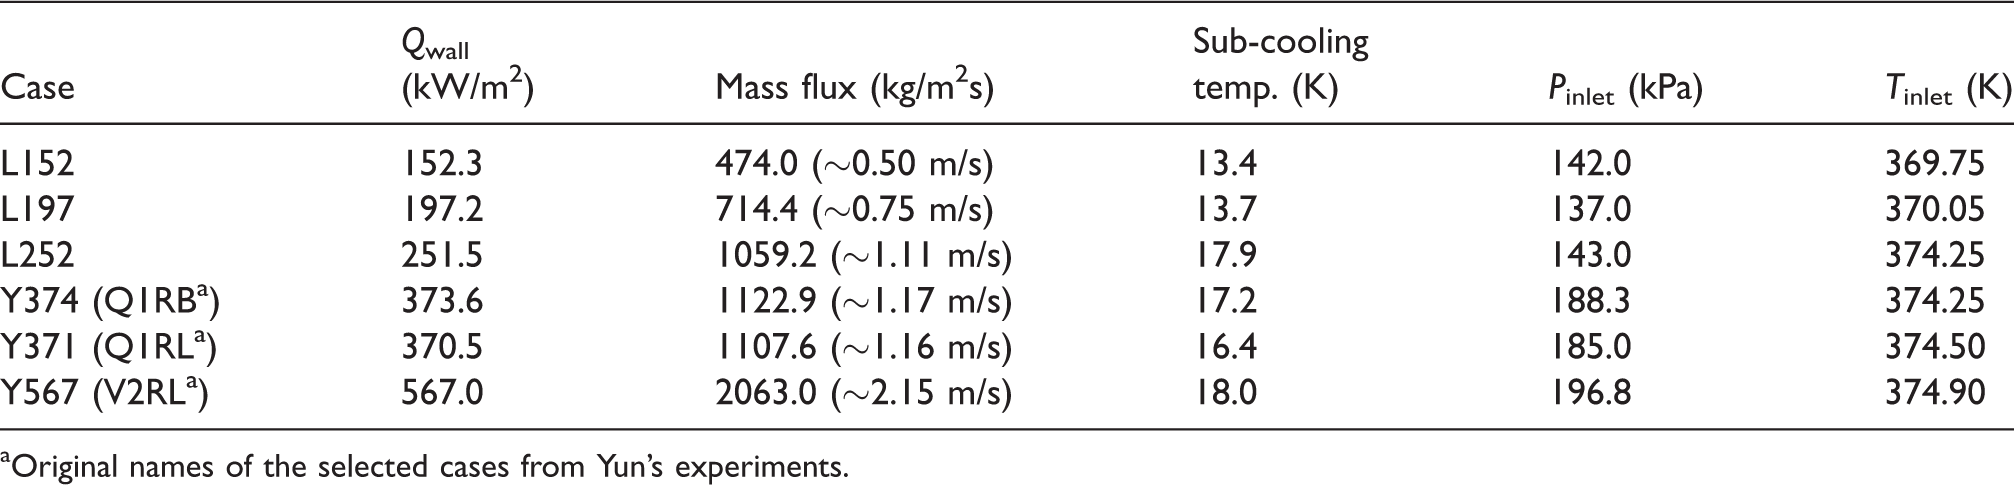
aOriginal names of the selected cases from Yun’s experiments.
As shown in Figure 3(a), the experimental configuration of Lee consists of a vertical concentric annulus with an inner heating rod of 19 mm outer diameter. The length of heated section is 1.67 m. This rod can produce a uniform heat using a 54 kW DC power supply. The diameter of outer wall is 37.4 mm, and there is a transparent glass connected for visual observation. The measuring plane for collecting the experimental data is 1.61 m, far from the inlet. Also, Yun’s experimental configuration consisted of a vertical concentric annulus with an inner heating rod of 9.98 mm outer diameter (Figure 3(b)). The diameter of outer wall is 35.5 mm. The lengths of heated section and unheated section were 3.087 m and 0.796 m, respectively. This rod could produce a uniform heat using a 934 kW DC power supply. As shown in the figure, totally, there are six measuring elevations of local radial parameter at the test section; five locations at the heated section (L/Dh =18.4, 43.3, 68.2, 93.1, 117.5) and one location at the adiabatic section (L/Dh =123.4). 37
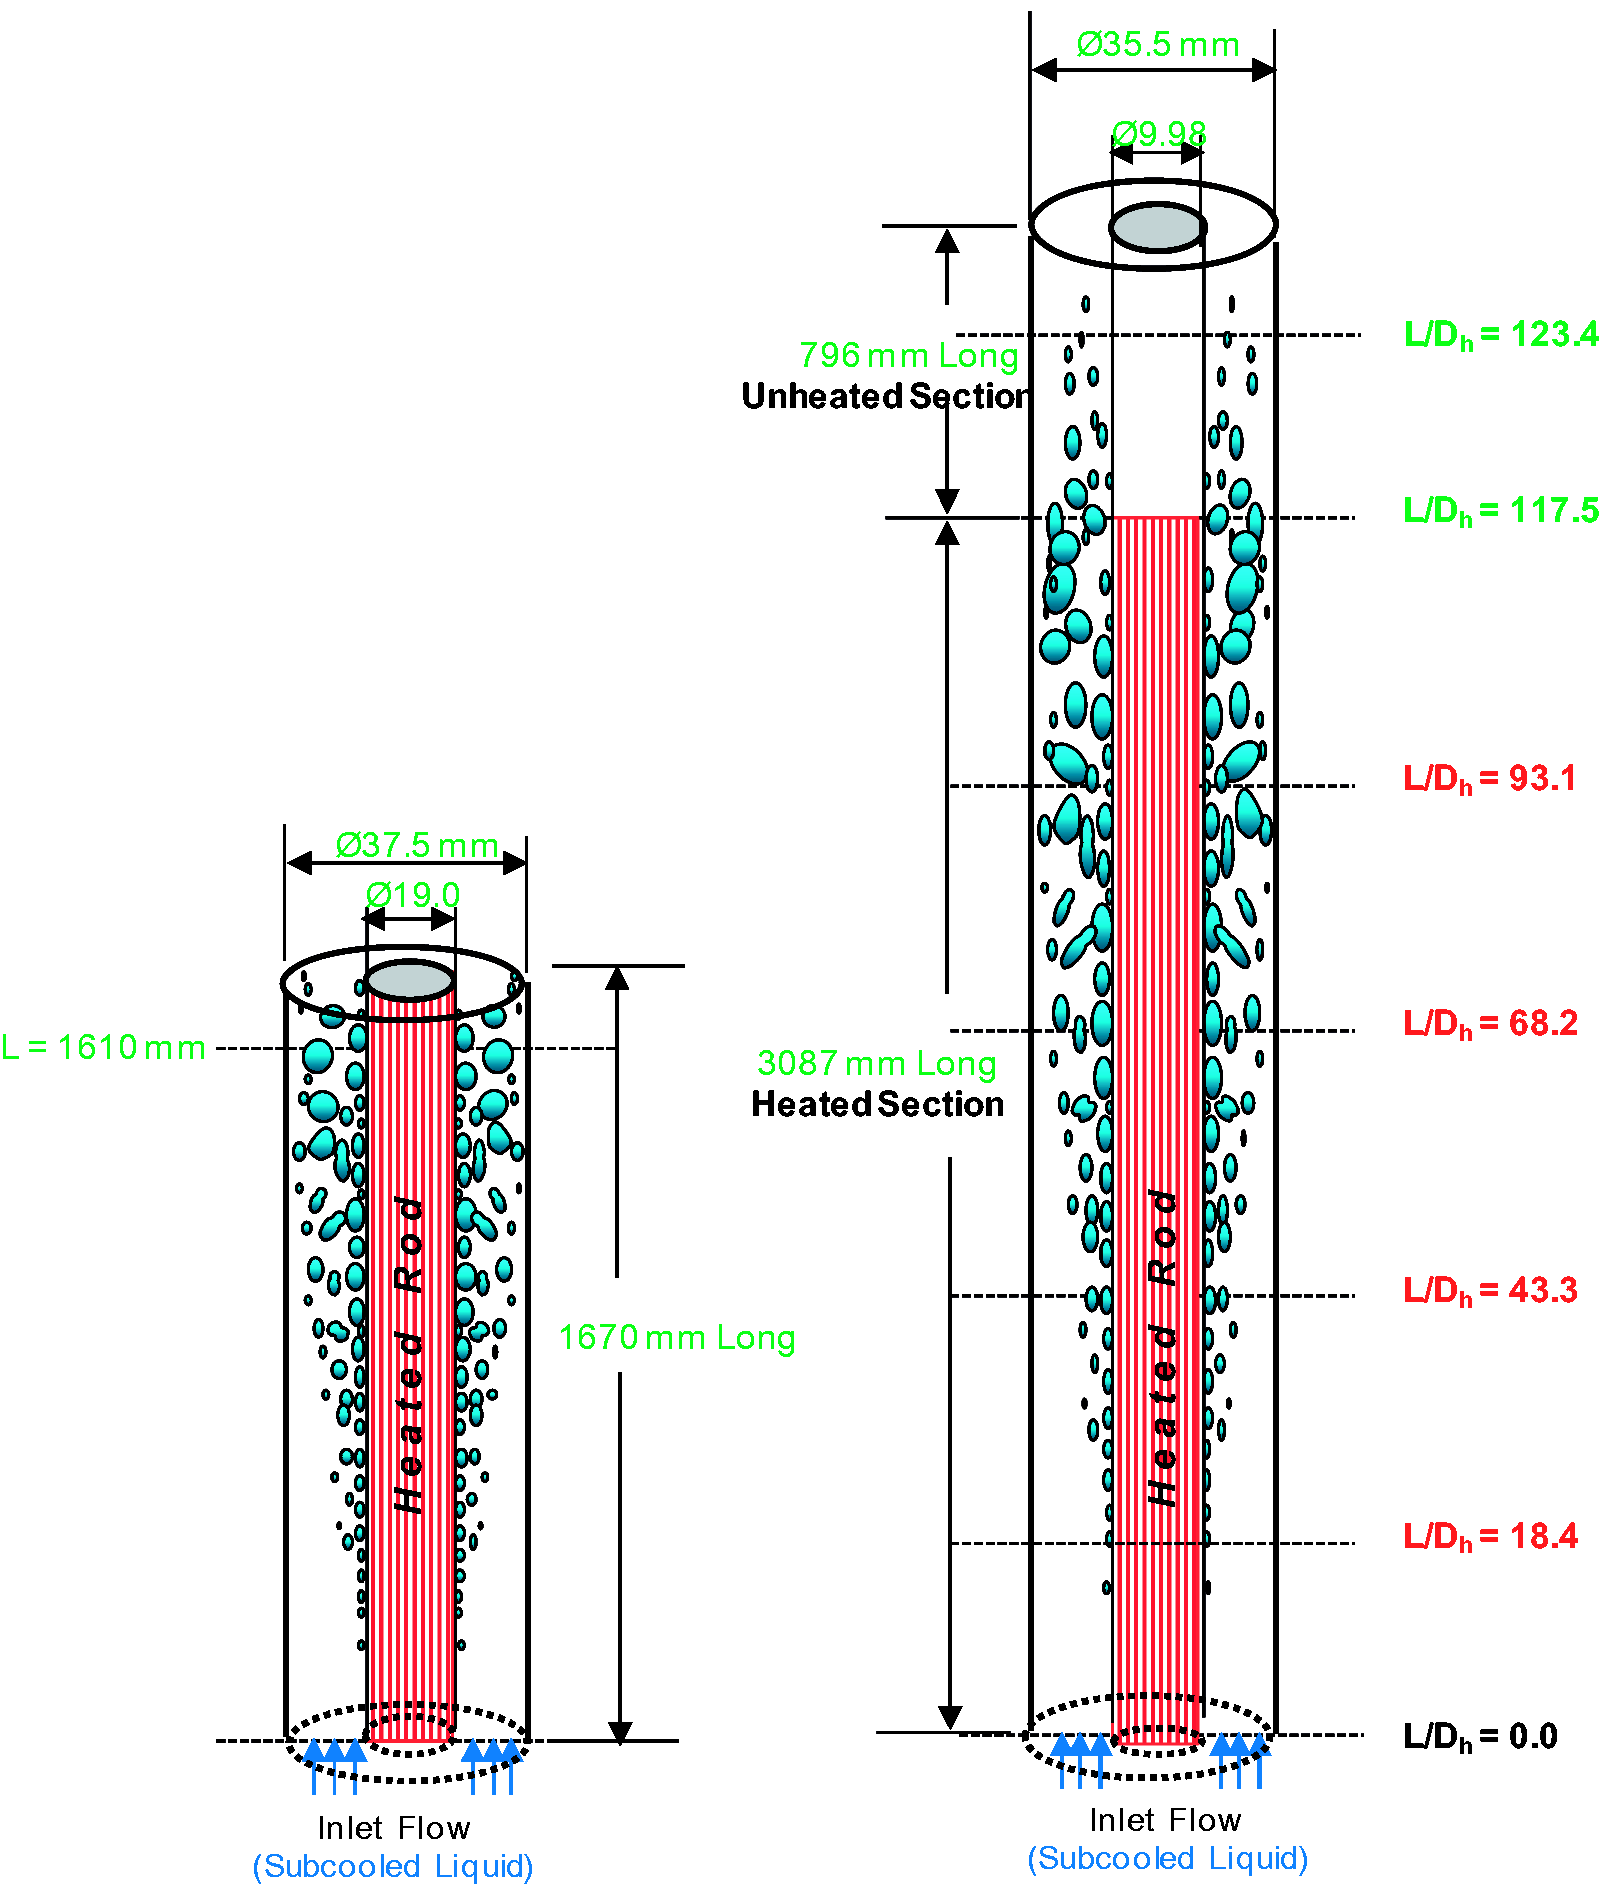
The measuring locations along the height of heated rod section and adiabatic sections of the selected experiments. 28 (a) Lee’s experiment and (b) Yun’s experiment.
Simulation details
Basically, two sets of the continuity equation, including momentum equations of each phase and one energy equation of liquid phase, were simultaneously solved based on the finite volume method. The Semi-Implicit Method for Pressure Linked Equations (SIMPLE) algorithm was used to handle the coupling of velocity–pressure calculation. 46 The PBM (homogenous MUSIG) was employed to monitor the size of vapour bubbles. Therefore, 15 extra transport equations were iteratively coupled with the flow equations. These bubble groups were equally divided for bubble sizes between 0 and 10 mm.
In this simulation, only a quarter of the annulus could be considered since the configurations of both experiments had the annular shape. The total grids used by Lee and Yun were 1170, with 13(radial) × 30(height) × 3(circumference) and 2652, with 13(radial) × 68(height) × 3(circumference), respectively. Wall heat fluxes, mass flux and sub-cooling temperatures from the experiments were adopted as the boundary and initial conditions.
To obtain the sub-cooled liquid properties, the Wet-Steam (IAPWS-IF97) at the considered ranges of temperature and pressure were carefully specified. So far, no standard turbulence model has been tailored for bubbly flows. Because the void fraction was considerably low and the bubble sizes were relatively small, the SST model was adopted for the liquid phase, and the dispersed phase zero equation was employed for the gas phase.
Apart from a modification of the RPI algorithm in order to account for the bubble sliding before lift-off, the mechanistic models named the fractal analysis (2002), the force balance approach (1993) and the mechanistic frequency model (2008) were implemented into the CFD code ANSYS CFX 14.5 via user FORTRAN files for calculating the wall heat partitioning. Due to an incorporation of the condensation effect into the modelling, an additional source term at each equation of the size fraction (except the smallest group(Group 1)) has been adopted. Moreover, at the heated wall, the nucleation terms were adopted at the size group equations, which have the mean diameter close to the lift-off diameter as the evaporative heat sources. The convergence of all the cases was below 1 × 10⁻⁵.
Results and discussion
In this section, the predictions of local mean radial profiles including void fraction, bubble SMD, liquid velocity, bubble velocity, liquid temperature and wall superheating temperature are discussed together with Lee’s and Yun’s experimental data. The heat flux supplies and mass flux conditions from their experiments were between 152.3–567.0 kW/m2 and 474.0–2063 kg/m2s, respectively. Based on this wide range of flow operational conditions, the accuracy of the proposed mechanistic approach can be investigated in this study.
So far, the simulations have been performed by employing a material that accommodates constant properties. In the present work, we are employing Wet-Steam material whose properties, such as density, viscosity, saturation temperature and latent heat, change following the local pressure and temperature values. Due to the upwards flow and the vertical concentric annulus geometry, the lower pressure and lower saturation temperature can be found at the higher location downstream; hence, all aforementioned properties definitely keep decreasing from the inlet to the outlet. It should be noted that this kind of physical fluid behaviour cannot be found from using the constant-property liquid. Moreover, the sub-cooled-liquid density in the fluid domain depends on the local liquid temperature, the results of the predicted bubble size distribution may differ from using the single constant density as well.
Generally, employing the sub-cooled liquid properties may reflect the results of the heat partitioning calculations and the flow structures near the boiling surface. Subsequently, the simulation results of using two different fluid properties are presented and discussed in the following topics, especially the values of void fraction near the heated wall. This comparison study is attempted to highlight the importance of adopting materials with variable properties in the numerical simulations.
Comparisons with Lee’s experimental data
The predictions of local mean radial profiles of the void fraction, bubble SMD, liquid velocity and bubble velocity at (L = 1.61 m) from using the Wet-Steam and the constant-property liquid are presented in Figure 4. Among these three cases (low and mid heat and mass fluxes), there is a peak of void fraction found in the vicinity of the heated wall, which may be due to nucleation of many bubbles at the hot surface, as shown in Figure 4(a). Physically, when the vapour bubbles departed from the heated area and exposed to lower temperature (sub-cooled liquid), their sizes became smaller. Hence, it was also resulted in lower void fraction in the radial direction away from the wall.
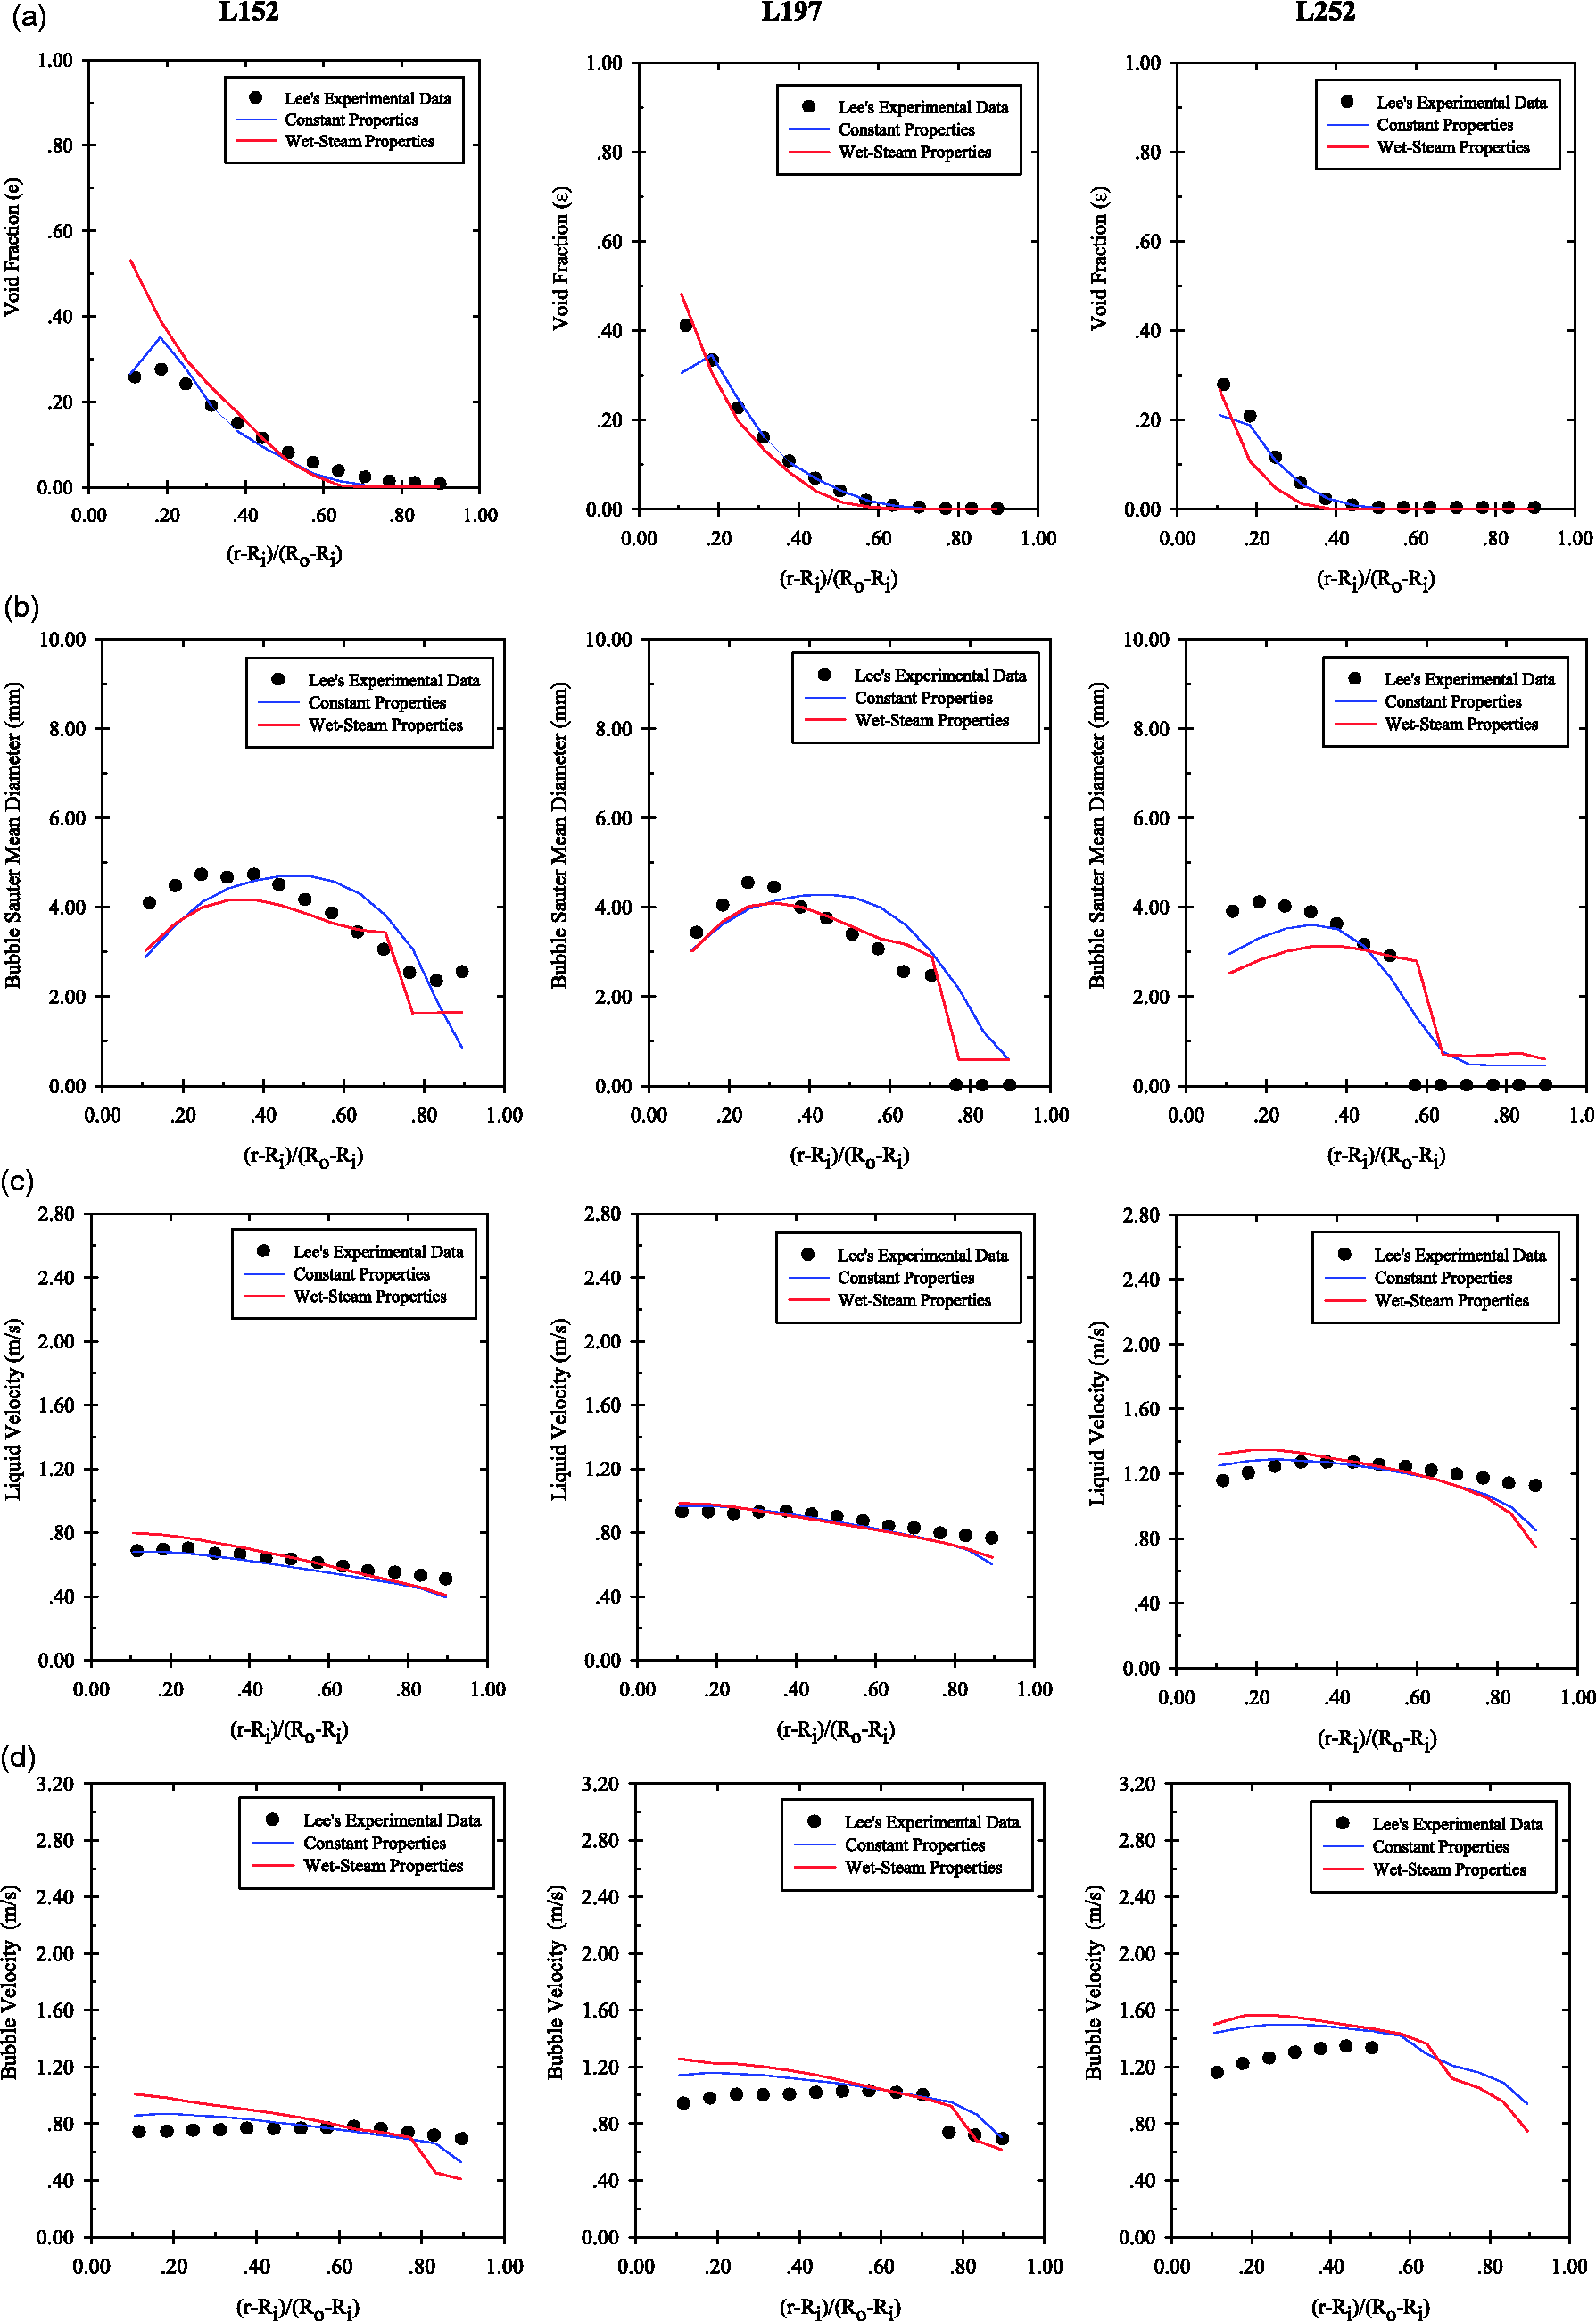
The comparisons of local mean radial profiles of void fraction, bubble Sauter mean diameter (SMD), liquid velocity and bubble velocity between Lee’s experimental data and the predictions. (a) Void fraction, (b) bubble SMD, (c) liquid velocity and (d) bubble velocity.
In general, the predicted void fractions from using between the Wet-Steam and the constant-property liquid were both captured well with the Lee’s experimental data. For the case L152, at the regions near the heated wall, a slightly higher predicted void fraction was found. This may be because of an over-estimation of a portion of the evaporative heat flux. Nevertheless, a better prediction from the Wet-Steam was found from the case L197 (Figure 4(a)), the void fraction near the wall from the case using the constant property is under-predicted at those area near the heated wall. A similar trend was found for the case L252, although the whole predicted void fraction of the Wet-Steam was lower than the experimental data.
As mentioned by Tomiyama et al.,
47
normally small spherical bubbles are preferably stayed close to the wall, whereas larger ones like distorted/cap bubbles are pushed towards the centre of the pipe due to the change of the negative sign in the lift force. Thus, in the future work, instead of adopting the current constant lift-force coefficient (
The comparisons between the predictions of the bubble SMD and the experiments at the measuring plane are shown in Figure 4(b). The experimental results of the bubble size near the heated wall are big, and this is due to lots of coalescence interaction at this region. Usually, their sizes are smaller with further distance from the wall. This may be because once the bubbles leave the wall; they will resist the bulk liquid which has lower temperature. Then, the heat and mass from the bubbles are transferred into the bulk liquid due to the condensation. Consequently, in most of the cases (e.g. L197 and L252), the bubble sizes are reduced in the regions far from the heated wall, and the bubbles may even disappear due to condensation.
Among the prediction results of Lee cases, the SMD from using the constant-property liquid and the Wet-Steam found to have a similar trend with the experimental data. From both fluid types, they gave a good agreement in capturing the bubble size distribution. However, for the cases using the constant property, the smooth change of the bubble size from the heated wall to outer wall are found, in contrast, the sudden reduction in the predicted SMDs is clearly seen from the cases using the Wet-Steam. It is possible that this discrepancy could be a result of having varying density in the flow domain. This is because currently lower density occurs near the boiling surface, while the higher density happens at the regions far from the heated wall because of the lower temperature.
Liquid density is one of the main factors involved in calculating the bubble interactions at the PBM, thus the non-uniformity of density in the flow domain may reflect on the values of the coalescence and break-up rates as well. Regarding the assessment works of Deju et al.,50–52 Cheung et al. 53 and Vahaji et al., 54 the performance of many proposed bubble-interaction kernels have been investigated and assessed; however, so far no any combination of them has been specially recommended for a simulation of sub-cooled boiling flow. It is advisable that the effects from using different coalescence and break-up kernels together with this realistic sub-cooled liquid, which directly influences the bubble size calculation, will be investigated further in order to enhance the current prediction accuracy.
As shown in Figure 4(c), the predicted liquid velocities of case L152, L197 and L252 of both liquid types are found to be higher than the experiment near the heated wall and the values match the experimental data at the locations far from the wall. This over-prediction of velocity near the wall region is due to high temperature at the heated wall. However, the simulations using constant-property liquid give slightly better predictions on velocity near the heated wall compared with the simulations using Wet-Steam. This could be because on that region the value of the constant-liquid density is higher than the density of the Wet-Steam. Also, for the case L252, the highest difference between the predicted velocity and the experimental data was found at the region near the outer wall. This may be due to having a high-mass flow rate, and it may then be less influenced by the wall temperature if compared with the other cases.
In the simulations, the scalable wall function was intentionally employed in order to lower the number of cells close to the wall. As a result, the complexity of the bubble-induced turbulence’s motion near the boiling surface may not be fully resolved by using them, especially for the case L252 which has high heat flux. Among the case studies, the differences between predicted and experimental values were less than 0.25 m/s. Generally speaking, as discussed in Lee et al.’s 35 and Yun et al.’s 55 papers, this current over-prediction of velocity near the heated wall was found to be similar with other previous investigations because of using the conventional CFD wall-function treatment. As mentioned by Končar and Krepper, 56 the upgrade of the mechanistic two-phase wall function is currently required to enhance the prediction accuracy. In order to better capture the velocity profiles, a recent attempt can be found from the work of Colombo and Fairweather. 57 Basically, the additional source terms have been suggested to implement into the turbulent equations due to a consideration of the bubble disturbance. As shown in Figure 4(d), the local mean radial profiles of predicted vapour velocities for cases of L152, L197 and L252 are found to have a similar trend. Clearly, the gas velocities close to the heated rod were slightly higher than the experimental results, especially for the case using the Wet-Steam. This may be because the predicted sizes of bubbles on that area were smaller than the experiments, then it could result in higher velocities. Nevertheless, in the reality, while the vapour bubbles flows up, they may merge/collide to the neighbours which are still attached the heated rod. As a result, they may become bigger bubbles and would result in lower vapour velocities at the regions near the boiling surface.
Interestingly, as shown in Figure 4, cases L197 and L252, both with two different fluid simulations could capture a sudden drop of the vapour velocity at locations far from the heated rod. Actually, this could imply that there were no flowing bubbles at those locations in the experiments. Overall, the vapour velocities were slightly higher than the liquid velocities; this was a result of lighter density (buoyancy force) of the vapour.
To particularly observe the difference in the local flow structure while specifying different liquid properties (Wet-Steam and constant-property liquid), the sub-cooling temperature and the void fraction profiles near the heated wall are selected for comparisons, as presented in Figure 5. The results were obtained from the first nodes parallel to the heated wall (∼0.000356 m) along the height of the annulus.
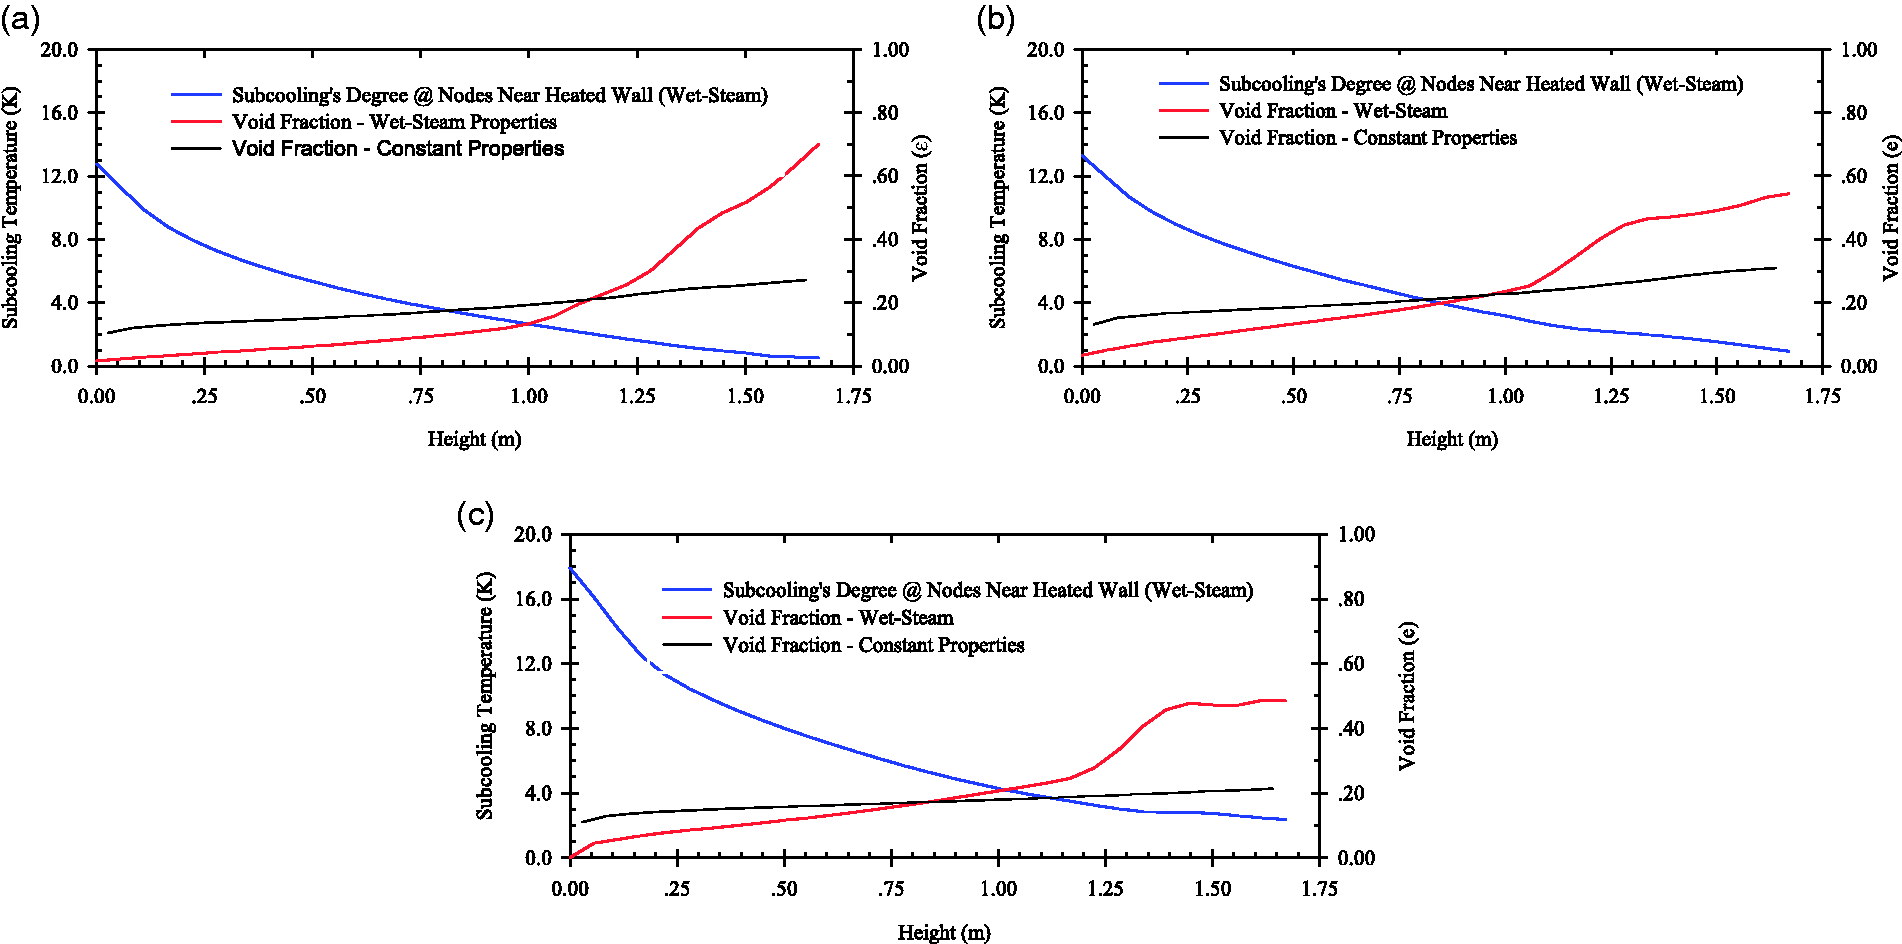
The predicted results of the sub-cooling temperature and the void fraction collecting near the heat wall along the annulus height. (a) Case L152, (b) case L197 and (c) case L252.
In Figure 5(a) to (c), the sub-cooling temperature of the bulk liquid at the inlet for all of the presented cases ranges from 13 to 18 K. The heat transfers from the heated wall to the liquid as the fluid flows along the wall, which leads to having a gradual rise in temperature of the liquid. As a result, by the time the fluid reaches the end of the heated section, it has changed from a highly sub-cooled liquid to a slightly sub-cooled liquid. Among the mentioned figures, the predictions of sub-cooling’s degree near the boiling surface at the outlet of the case L152 and L197 are found to be about 1–2 K, and for the case L252, the value is found at around 3 K.
At the locations parallel to the heated wall (Figure 5), the predicted void fractions of the cases using the constant-property liquid are found to have steadily increased from the inlet to the outlet, and the maximum value is less than 0.4 at near the outlet. Interestingly, the void fractions for the Wet-Steam cases are quite different from the constant-property cases. This is because the values of the void fractions are steadily increasing for a certain distance (height). However, it suddenly increases at the further downstream near the outlet of the annulus.
As shown in the figures, for the L152 and L197 cases, the point of a sudden jump of void fraction is around 1.1 m far from the inlet. The maximum of void fraction is found to be around 0.60–0.70 near the exit of the heating zone (Figure 5(a) to (b)). For the L252 case, the sudden increase in void fraction is found to be appeared at the higher location (∼1.25 m), and the maximum is found at 0.50 (Figure 5(c)). As recently explained by Ahmadi, 58 this sudden increase in void fraction could happen when the sub-cooling temperature becomes low enough for some bubbles to be reattached to the heated surface after the lift-off. Hence, beyond this point, a significant increase in the void fraction is begun.
Overall, the prediction results from using two different fluid types were quite comparable, and they are in very good agreement with Lee’s experimental data. Normally, adopting the constant-property fluids in the simulation should give different results from using the variable fluid materials. Nonetheless, since in the Lee’s experiment, the length of the heated section is short (1.67 m), the properties of the fluid might not vary significantly along the heated section. Therefore, the predictions of the simulations at the measuring plane using constant property and Wet-Steam might be very similar. Eventually, the present validation study could not be used to much reflect an outstanding potential of hiring the Wet-Steam for the boiling simulation.
So far, using the Wet-Steam could give an advantage in terms of a possibility in capturing a realistic behaviour of sub-cooled boiling flow. Nevertheless, to prove this numerical investigation, the experimental data regarding the local parameters (i.e. the values of void fraction and the sub-cooling’s degree) near the heated rod surface would recommend to be observed for a further validation purpose.
Comparisons with Yun’s experimental data
The mechanistic models are further investigated when the simulations of sub-cooled boiling flow are at mid to high mass and heat fluxes. Three cases from Yun’s experimental data were chosen for this investigation (Table 1). In the experiments, six locations along the height of the annulus were used to monitor the local interested parameters (Figure 3(b)). However, in the following comparisons, only the data from three locations at the heated region (L/Dh = 68.2, 93.1, 117.5) and one location at unheated region (L/Dh = 123.4) are selected to conduct this validation study.
In the first part of this section, the experimental data of the case Y374 including void fraction, IAC, bubble SMD and bubble velocities are compared with the predictions. To distinguish the effect from using different working fluid, the simulation results of the Wet-Steam properties and the constant-liquid properties are both presented together with the experimental data. Unlike the constant-property fluid modelling cases, the sensible and latent heats of the Wet-Steam cases physically change along the height of the boiling surface location. In fact, at elevated regions, less heat is required to change the phase from liquid to vapour. Therefore, by having a uniform heat flux along the heated section and using the Wet-Steam material, more bubbles are nucleated at elevated regions. As a result, simulations using Wet-Steam predict higher void fraction compared to the ones using constant-property material. In another meaning, using the Wet-Steam properties in modelling the behaviour of the sub-cooled boiling flow could expect to be seen realistically.
Due to the limitation of the availably experimental data of case Y371 and Y567, in the second part, the liquid temperature and liquid velocity are used to compare with the predictions. As aforementioned, this investigation is focused on an evaluation of the mechanistic model in terms of its prediction accuracy when modelling with the sub-cooled-fluid (Wet-Steam) properties at the mid to high operating conditions. Since it is no doubt that defining the saturation as a constant value over the entire flow domain can reflect on such an error when calculating the local liquid temperature, especially when having a long length of the boiling zone. Hence, only the predicted liquid temperature from the Wet-Steam cases is particularly discussed with the experimental data in order to assess the model performance.
Normally, the values of liquid temperature and wall superheating temperature can also be used to indirectly evaluate the prediction capability. This is because the wall temperature can represent the portion of heat served the nucleation sites for vapour bubble generation (the conduction), and similarly, the liquid temperature can also represent the amount of the heat transferred into the bulk liquid. Of course, comparing both of them with the experimental data at the last section, it would give a clearer view of the current status in terms of estimating the heat partitioning at the boiling surface.
As shown in Figure 6(a), the void fraction of the Yun’s case (Y374) increases along the height of the heated wall; however, at the unheated region (L/Dh = 123.4), there is a decrease due to condensation. This profile is quite similar with the Lee’s results, as the highest void fraction was represented near the heated wall due to the bubble nucleation. Also, the void fraction located far away from the wall decreased, and this reduction could be because of bubble condensation and/or disappearance.
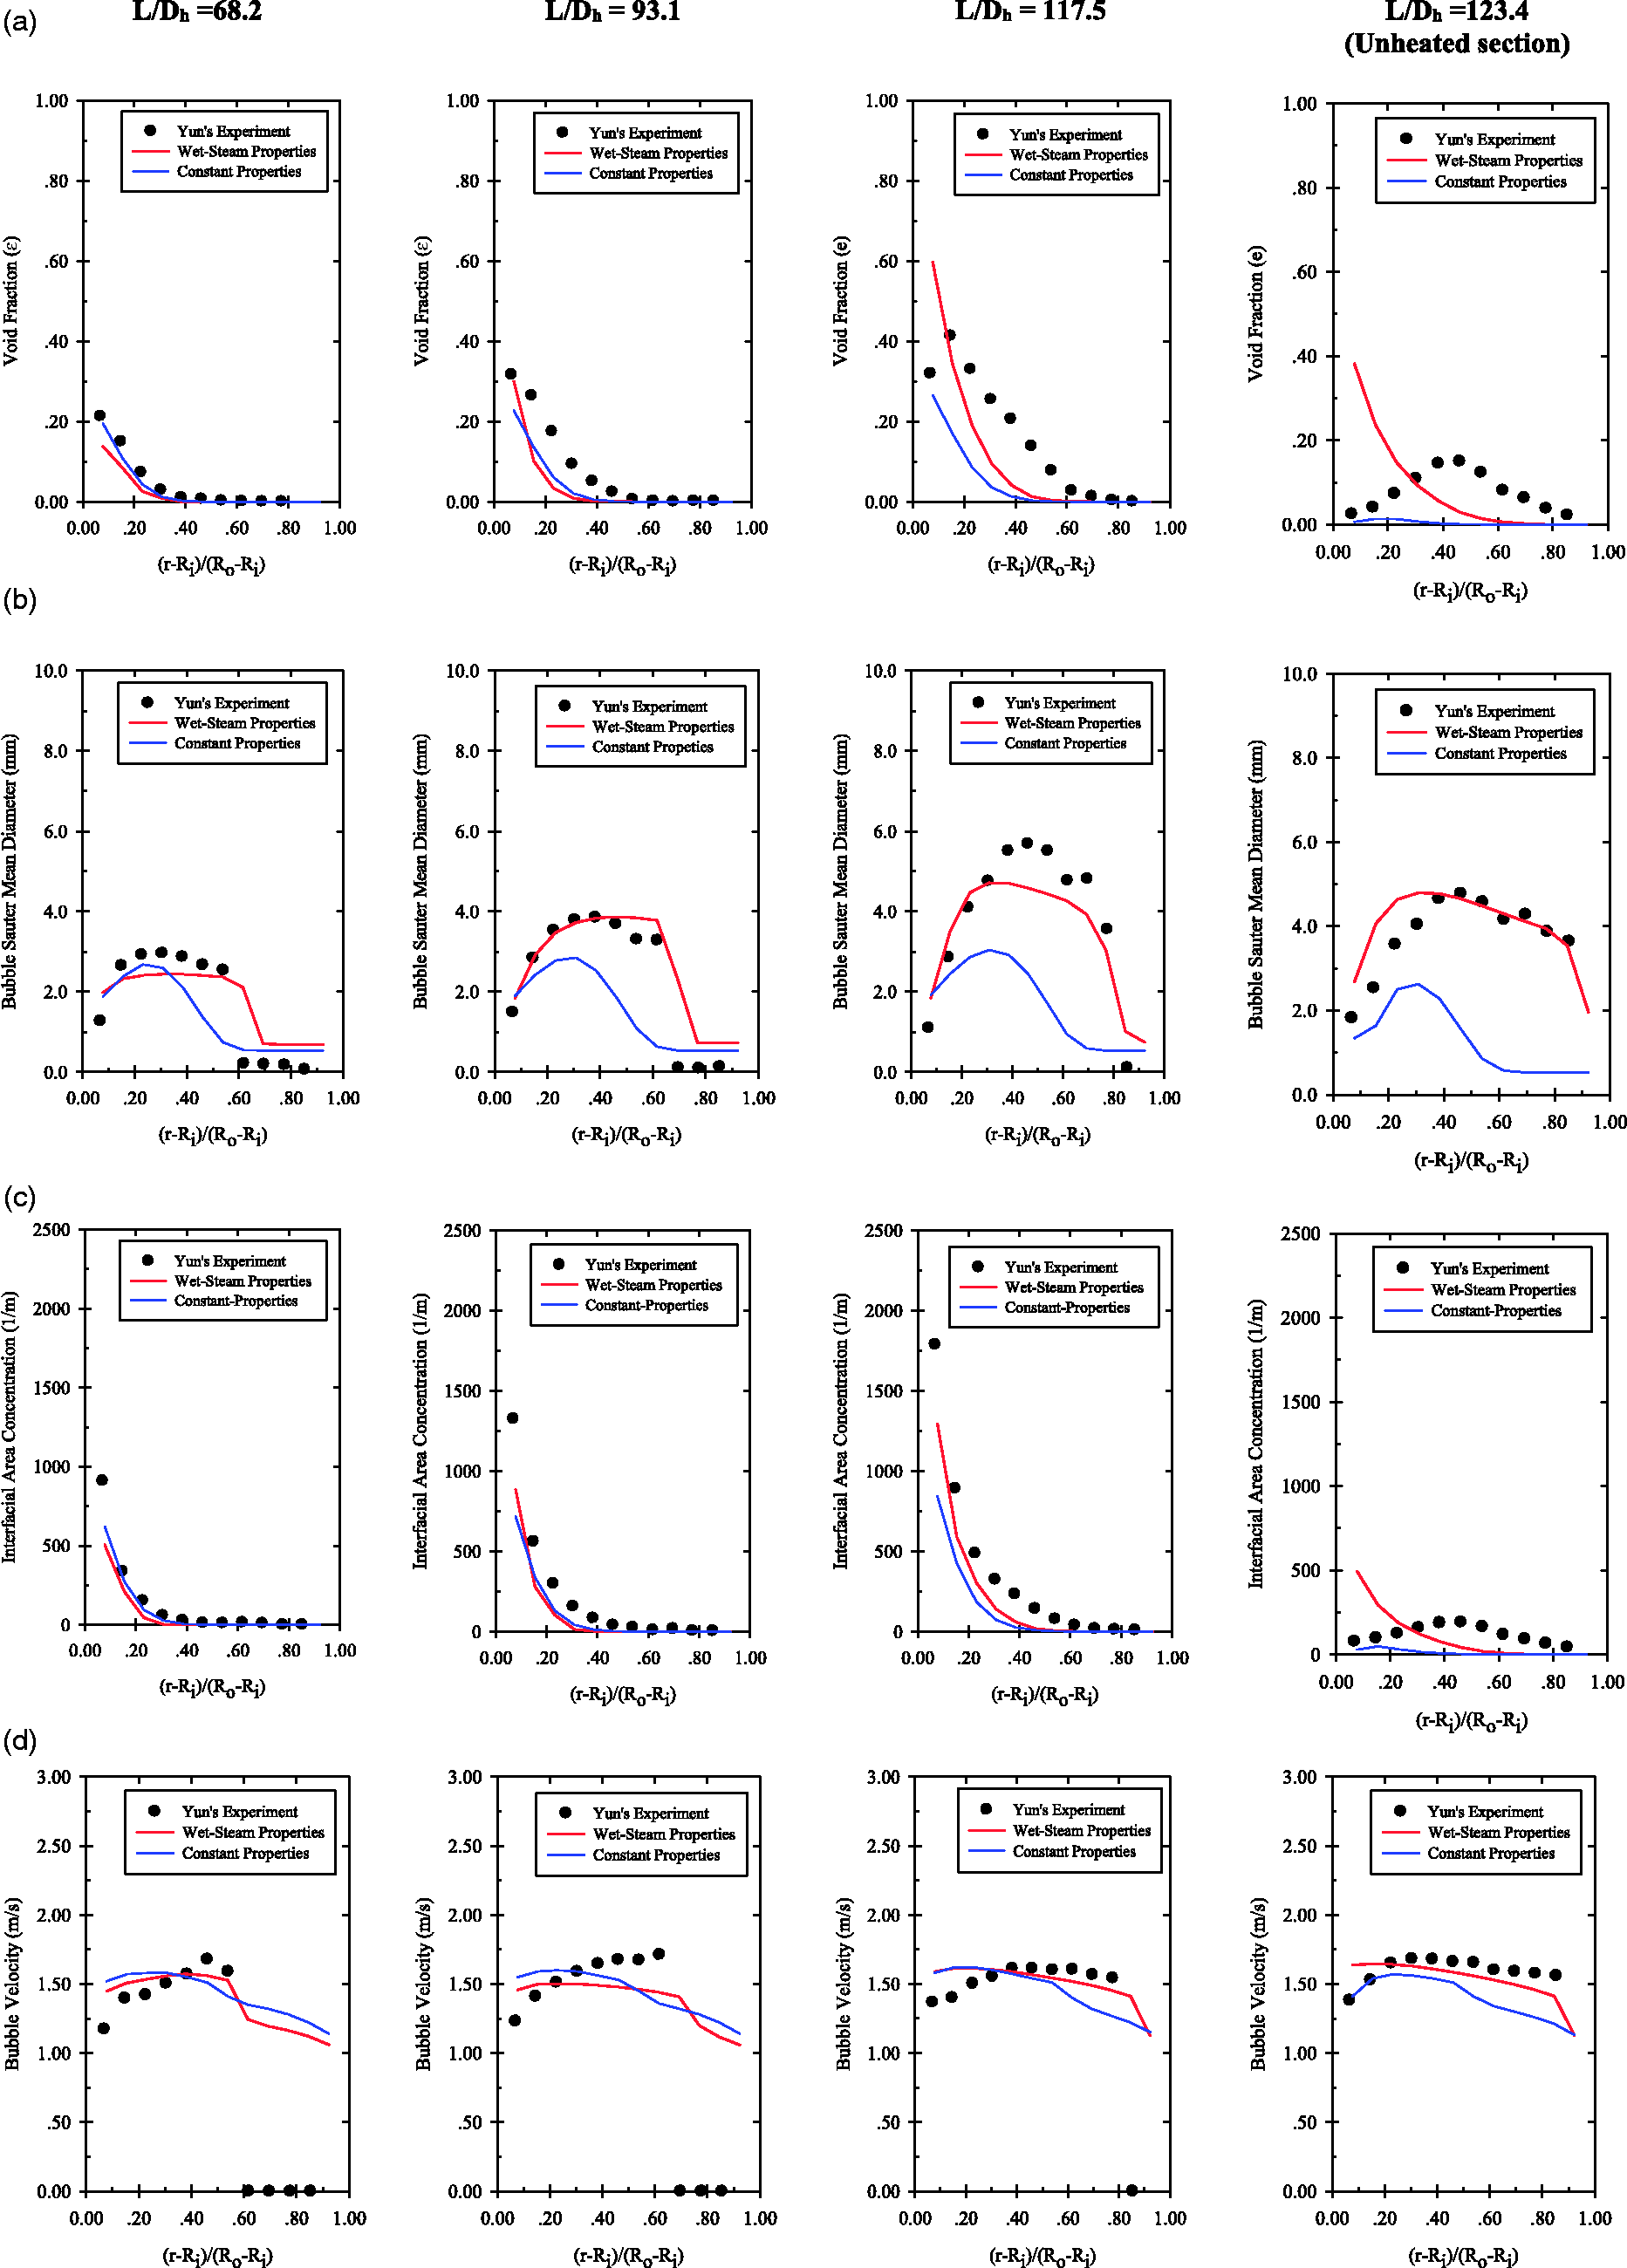
The comparisons of local mean radial profiles of predicted void fraction, interfacial area concentration (IAC), bubble Sauter mean diameter (SMD) and bubble velocity with Yun’s experimental data (case Y374). (a) void fraction, (b) bubble SMD, (c) IAC and (d) bubble velocity.
As shown in the figures, the resultant void fractions at the measuring locations (L/Dh = 68.2 and 93.1) are lower than the experimental data, especially for the case of using the constant fluid property. This may be due to an under-prediction of the evaporative heat from that wall region. However, at the highest measuring location (L/Dh = 117.5), the void fraction near the heated wall of the Wet-Steam simulation case is higher than the experiment. However, away from the heated wall in the radial direction, lower void fractions compared to the experimental data are observed. This discrepancy could be the result of low rates of bubble coalescence and/or high rates of bubble breakage in the prediction.
At the unheated region (L/Dh = 123.4), the predicted void fraction is significantly reduced from the heated zone due to the condensation process; however, this pattern is still beyond the profile of experimental void fraction. Altering the employed lift-force correlation could help to improve the void fraction predictions at the adiabatic region. Nevertheless, this might turn to be attended in the future work.
The comparisons of SMD between the predictions and the experiment are shown in Figure 6(b). Normally, after leaving the heated wall, the bubbles can coalesce with the neighbouring bubbles and/or break-up because of random collisions and turbulent impact, which could result in the change of their sizes. Some explanations regarding these bubble-interaction mechanisms can be found from Cheung et al.’s 59 paper. At the same time, at the far region from the heated wall, the bubble sizes usually become smaller/disappear because of the low-bubble interaction and condensation.
Using the Wet-Steam material, the predicted SMDs at L/Dh = 68.2, 93.1 and L/Dh = 123.4 were in good agreement compared to the experimental data. At this flow condition, the captured profiles were in good agreement compared to the cases using the constant-property liquid. This may be because of having realistic fluid properties over the entire flow domain. However, for the SMD at L/Dh = 117.5, a discrepancy in the peak size between the prediction and the experiment can be noticed (Fig 6). This could be a result of currently having an under-prediction in vapour void fraction in the middle of the annulus. Also, the predicted bubble diameters in the flow domain are obtained from the calculations of the break-up and the coalescence values at the PBM. In order to improve the void fraction predictions at the middle of the annulus, the authors are considering employing other coalescence kernels that encourage a higher coalescing rate of bubbles for future work.
It should be noted that unlike experiments, the minimum bubble size in the numerical prediction cannot be set at zero. The possible smallest size in the numerical simulation was possibly equal to the smallest bubble group size. The predicted bubble size is found to be around ∼0.6 mm at the heated section (L/Dh = 68.2 and L/Dh = 93.1), and this can be used to explain the discrepancy between the experimental data, which is equal to zero due to absence of bubbles at this location, and the numerical predictions.
As shown in Figure 6(c), the local radial profiles of predicted IAC are compared with the existing experimental data. Similar to void fraction profiles, the highest IAC is found near the heated wall. At L/Dh = 68.2 and 93.1, the predicted IACs of two different liquids give reasonable agreements with the experimental data except near the wall, which is slightly lower. Moreover, at L/Dh = 117.5, the highest value for IAC among all the measured locations is found (∼1250 m−1). Similar with the SMD comparison, the predicted IAC, especially for the case of using the Wet-Steam, is found in a better agreement with the experimental data when compared with the cases of using the constant-property liquid. At L/Dh = 123.4 (unheated section), the IAC profile is under-predicted for both simulations compared with the experimental data.
The local radial profiles of bubble velocities are shown in Figure 6(d). Practically, the bubble velocity cannot be equal to zero in the numerical predictions, and the minimum may be equal to the liquid velocity. For the selected elevations (L/Dh = 68.2 and 93.1, L/Dh = 117.5 and 123.4), the predicted velocities at near the heated wall are slightly higher than the experimental results. This could be a result of smaller bubble sizes predicted in that area. As a consequence, it could result in higher velocities. Noticeably, from the experimental results, there are sudden drops of vapour velocity at the region far from the boiling surface. Hence, this implies that there is no flowing bubble at suggested locations.
Because the length of the heated section in Yun’s experiment is almost twice of Lee’s case, the difference in the working fluid properties along the annulus height (i.e. saturation temperature, liquid density and latent heat) may reflect directly to calculations of the local flow parameters. The simulation results using the Wet-Steam of the Yun’s case (Y374), especially the predicted SMDs, are found in better agreement with the experiments than using the constant-property liquid. Currently, this investigation can reveal an outstanding performance of introducing the Wet-Steam together with the mechanistic wall portioning model for predicting the sub-cooled boiling flow. To clarify the prediction ability of the proposed mechanistic approach at higher flow conditions, further investigations are presented as follows.
In addition to the bubble dynamics, the liquid temperature can also be used to evaluate the numerical accuracy, especially the wall heat partitioning model. Since the impact of properties of the sub-cooled liquid on temperature is of interest, in this section, only the simulation results of the Wet-Steam cases and the existing experimental data are presented. It is worth to note that similar to the previous case (Y374), the case (Y371) is operated at medium range of heat and mass fluxes. The details regarding both selected cases (Y371 and Y567) are presented in Table 1. Their comparisons between the predictions and the experiments can be seen in Figures 7(a) and 8(a).
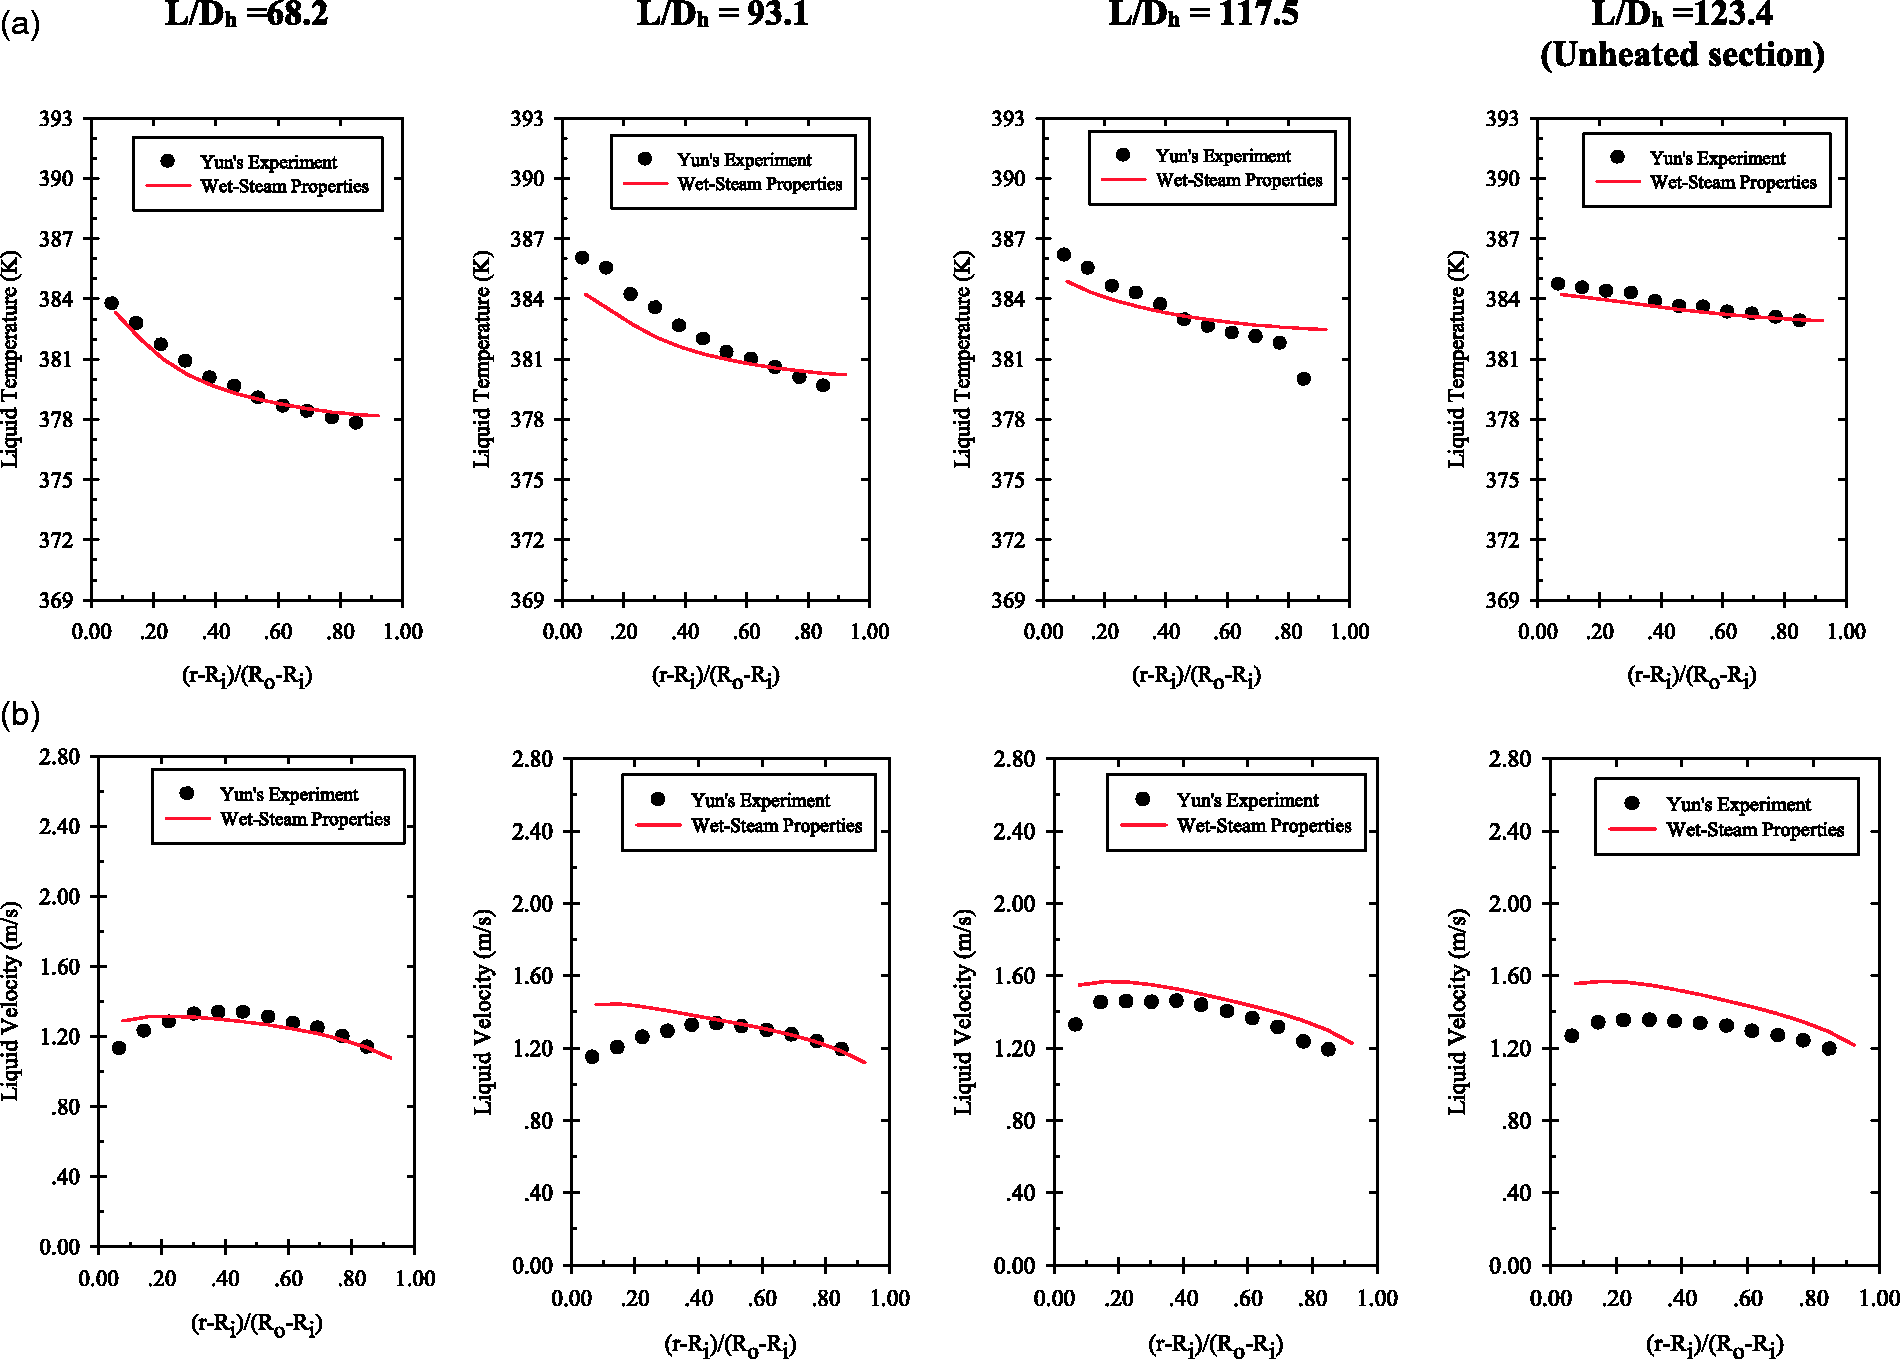
The comparisons of local mean radial profiles of predicted liquid temperature and liquid velocity with Yun’s experimental data (case Y371). (a) Liquid temperature and (b) liquid velocity.
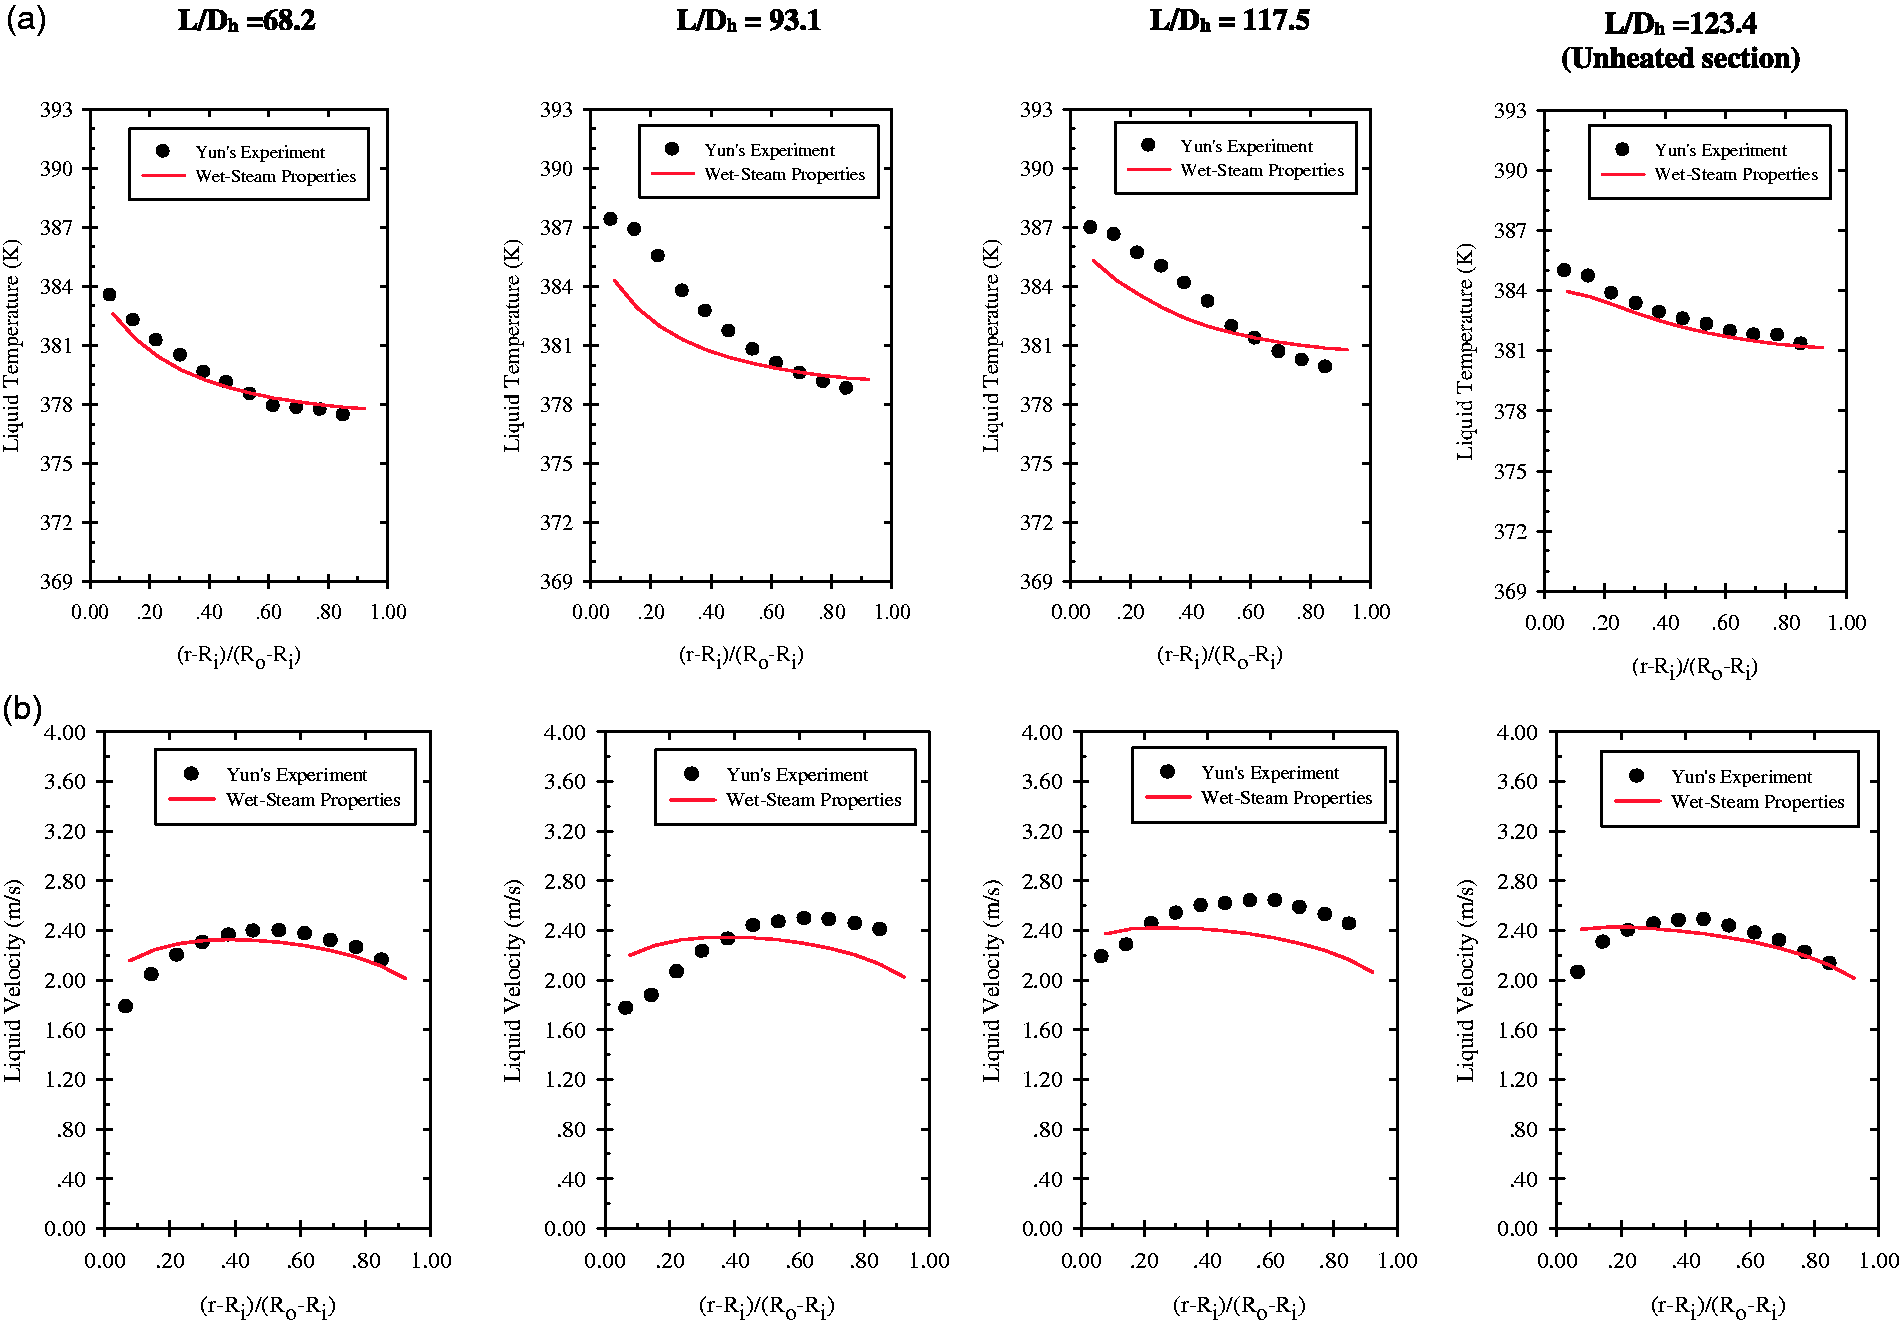
The comparisons of local mean radial profiles of predicted liquid temperature and liquid velocity with Yun’s experimental data (case Y567). (a) Liquid temperature and (b) liquid velocity.
Generally speaking, a higher liquid temperature usually occurs near the heated wall, and the lower values can be found at those regions far from the heated wall. For the axial direction, as the fluid absorbs more heat along the height of the boiling wall, the average liquid temperature of both cases should increase from the inlet to the further downstream. As shown in Figure 7(a) and 8(a) at L/Dh = 68.2, the predicted liquid temperatures of both cases are in very good agreement with the experimental values.
As depicted in Figure 7(a), a small discrepancy can be noticed at the higher measuring locations (L/Dh = 93.1 and 117.5) for the case Y371. In general, the predicted temperatures at these elevations were represented in a good agreement with the experimental data. At this flow condition, the maximum difference between the numerical predictions and the experiments among the considered locations is 1.9 K ( L/Dh = 93.1) presented near the heated wall. Moreover, the predicted liquid temperature at the unheated section currently agrees very well with Yun’s experimental data.
However, for the case of having high mass and heat supply (Y567), a significant difference in temperature (∼3.2 K) observed near the heated wall was found between the prediction and experiment (at L/Dh = 93). This may be because the portions of the heat transferred into the bulk liquid (in the forms of convective and evaporative heats) are lower than the reality. Thus, this discrepancy may be used to point out the lacking status of the current mechanistic approach.
As shown in Figures 7(b) and 8(b), the local radial profiles of the predicted liquid velocity at L/Dh = 68.2 is found in a good agreement with the experimental data. For other locations, the slight difference could be noticed, and this may be influenced by the temperature of the heated surface. Among the figures, the predicted velocity near the heated wall at L/Dh = 93.1, 117.5 and 123.4 is higher than the experimental data. Furthermore, the highest velocity in the experiment is observed in the middle of the annulus, despite the simulations that predict at the vicinity of the heated wall. By considering the mechanistic wall function in which the bubble-induced turbulence is taken into account, the predictions of radial velocity profiles could be greatly improved. 60
Usually, the portion of the heat remaining in the rod due to superheating the nucleation site can be represented by the value of the wall superheating temperature. Thus, investigations of the wall temperature can also give an idea on the prediction accuracy status of the proposed model. According to the mechanistic approach, this temperature value is mainly dominated by the amount of the conductive term (quenching heat) on the heated wall. High-predicted value of the superheating temperature can be found when the quenching term estimation is lower than the experiment. In such a situation, it can be implied that the portion of the predicted heat remaining in the rod may have to be higher than the actual experiment.
The predictions of the superheating temperature are then compared with the experimental data as shown in Figure 9. According to Yun’s experimental data (Y371 and Y567), the superheating temperatures were found to be between 16.5–24.5 K and 19.0–25.5 K, respectively. In fact, incorporating the physical mechanisms of bubble on the heated wall and variable fluid properties into the mechanistic model currently could help in enhancing the prediction accuracy of the quenching term. As shown in Figure 9, a very good agreement of the wall temperature results at the hot surface near the inlet can be observed in this study, especially for the case Y371.
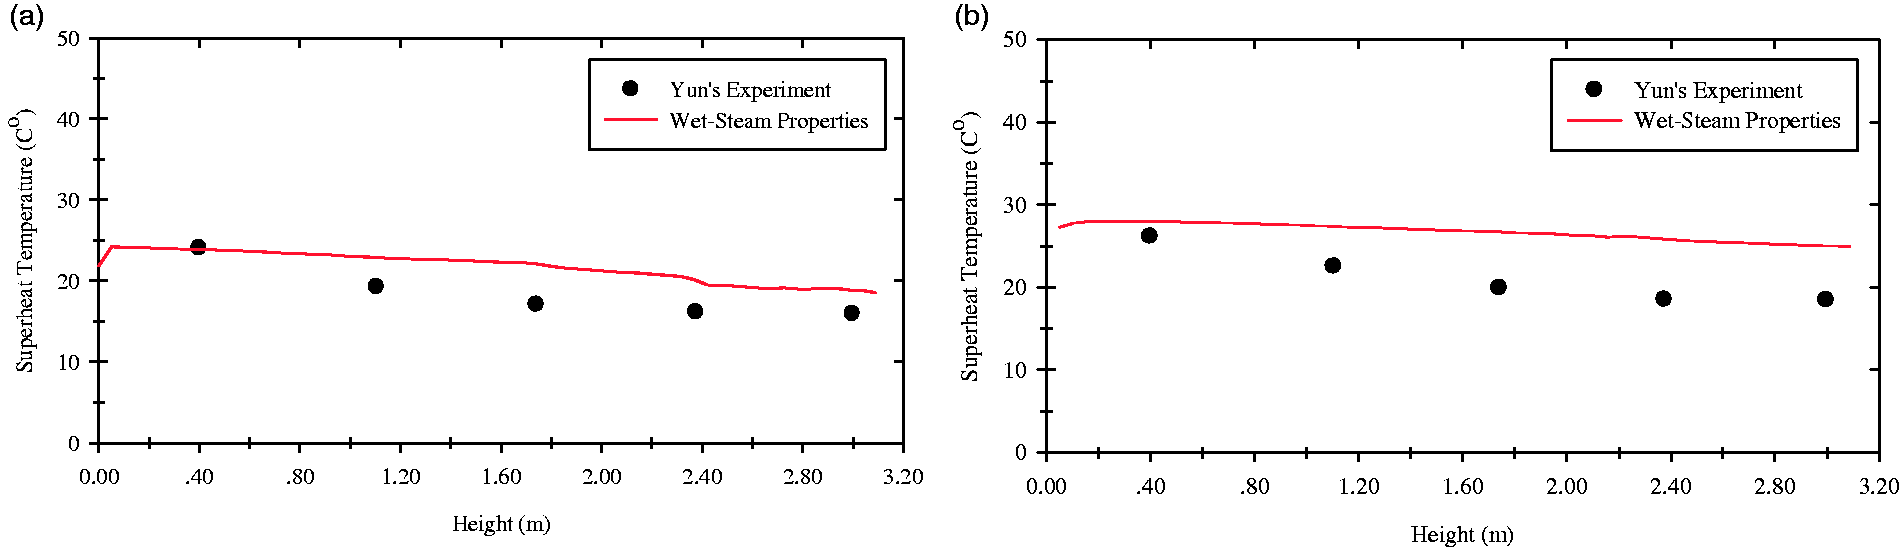
The comparisons of the predicted superheating temperatures occurred along the rod height with Yun’s experimental data. (a) Case Y371 and (b) case Y567.
However, further downstream, discrepancy between predicted and experimental data still exists, especially for the case Y567 which operated at high heat and mass fluxes (Figure 9(b)). A maximum difference around 6K was found at near the exit of the heated section. Physically, this may be because the heat still remains in the wall more than actual situation at those locations. Noticeably, using this mechanistic approach, it can predict a reduction in the wall temperature similarly to the experimental data. The temperature is reduced from the inlet to the exit of the test section due to higher quenching and evaporative levels at further downstream regions.
In order to enhance the current prediction accuracy for the case of having high heat and mass, the mentioned bubble-interaction mechanisms, such as merging during sliding, may need to be considered in the mechanistic model. Because this mechanistic incorporation may help in raising not only the quenching component but also the evaporative portion as can be seen in Basu et al. 5 Assuming that there has a higher amount of the heat transferred into the bulk liquid, consequently, the superheating temperature further downstream could be dropped due to the lower amount of the heat remained in the boiling rod.
Conclusion
The wall mechanistic heat partitioning approach, consisting of the fractal analysis, the force balance approach and the mechanistic bubble departure frequency, is successfully implemented into the RPI algorithm of the ANSYS CFX 14.5 for studying the sub-cooled boiling flow. In order to improve the predictions, a material whose properties change depending on pressure and temperature (Wet-Steam IAPWS-IF97) was introduced in this study. The model’s prediction capability was investigated by performing a validation study over a wide range of flow conditions at low pressure. According to the simulation results, the conclusions can be drawn as follows:
The proposed mechanistic model is capable of predicting the sub-cooled boiling phenomena over a wide range of flow conditions, except for the case of high heat and mass fluxes. Simulations of the sub-cooled boiling flow by using the constant-property liquid and the Wet-Steam were both showed a good agreement of the void fraction with Lee’s experiments. While introducing them for predicting the Yun’s cases, the void fraction and the SMD of the Wet-Steam cases gave better agreements with the experimental data. Overall, the prediction results, including the void fraction, bubble SMD, IAC and liquid temperature, are found in satisfactory agreement with the experimental data. Over-predictions of bubble and liquid velocities have been found near the heated wall, therefore, the effect of the bubble’s motion on the turbulence at the heated surface needs to be further elucidated.
For future work, our attention will be towards improving the insights of the current mechanistic model. This can be done by considering more physical behaviours of bubble interactions on the heated surface, i.e. bubble coalescence during sliding and the condition of sliding. Moreover, other fluids could be employed as the working fluid to investigate the capacity of the mechanistic approach in accommodating a wide range of fluid properties in addition to the flow properties that is currently being investigated.
Footnotes
Acknowledgements
Without numerical backgrounds, academic knowledge and research experiences learnt while the first author was working at School of Engineering and Resources, Walailak University, Nakhon Sri Thammarat, Thailand, the goals of the current research may not possibly be achieved. So, the author would like to thank Walailak University, Ministry of Science and Technology of Thailand (especially National Science and Technology Development Agency) and RMIT University for all the supports and thank all colleagues at the universities for their incredible encouragements as well. Special thanks go to Dr Pawika Mahasawat for tremendous helps during this manuscript preparation.
Declaration of conflicting interests
The author(s) declared no potential conflicts of interest with respect to the research, authorship, and/or publication of this article.
Funding
The author(s) disclosed receipt of the following financial support for the research, authorship, and/or publication of this article: The financial support was provided by the Australian Research Council (ARC project ID DP130100819).