
Abstract
This paper presents a study on the impact of well integrity failure on coalbed methane (also known as coal seam gas) production and potential shallow water contamination using numerical simulations with a finite-difference method. Two connection types and 12 cases were simulated: Type A – leakage through cement sheath and Type B – impaired zonal isolation at the aquifer interval. The effect of the distance between the aquifer and the coal seam, drainage area and desorption time on gas and water production was also inspected. Results show that both connection types have strong effects on the gas and water production; the cumulative water and gas production increases with increasing drainage radius; the distance between aquifer and the coal seam has a negative effect on the water production but a negligible effect on the gas production; desorption time, ranging from 5 to 30 days, has a negligible effect on the water and gas production. Connection Type A yields a potential water contamination but connection Type B does not. Gas concentration in the shallow aquifer decreases sharply with an increase of distance away from the producer and the unsafe area are within an area with a radius ranging from approximately 50 m to 90 m away from the producer in this study.
Introduction
A wellbore is a pathway through which water and coalbed methane (CBM) are produced. It is usually 200–1000 m in depth (APLNG, 2015) for a CBM well. Hence, the CBM well has to penetrate shallower strata, which may contain groundwater used by farmers, before reaching the target horizons (Davies et al., 2014). CBM wells’ completions are similar to conventional gas wells but with modifications incorporated into the completion procedures because of the coals’ unique properties, e.g. friable, a fractured system, swelling and shrinkage, and fines migration (Pike et al., 2008). In the CBM industry, the well completion programs include open-hole completion, open-hole cavitation and cased-hole completion (Pike et al., 2008). The open-hole completion has advantages that no casing is left to obstruct production; there is no damage to the coal face from cementing and there is unobstructed access to the coal face from the wellbore (Pike et al., 2008). The cavity completion is better for coalbeds with thick seams, good permeabilities, extensive cleats, low ash contents, overpressuring and high in situ stresses. However, if the well penetrated multiple thin coal seams and aquifers, a cased-hole completion is better because it offers the option of selective perforation intervals and avoids the connection between aquifer and borehole, etc. (Bellarby, 2009).
Wellbore integrity before and after production.
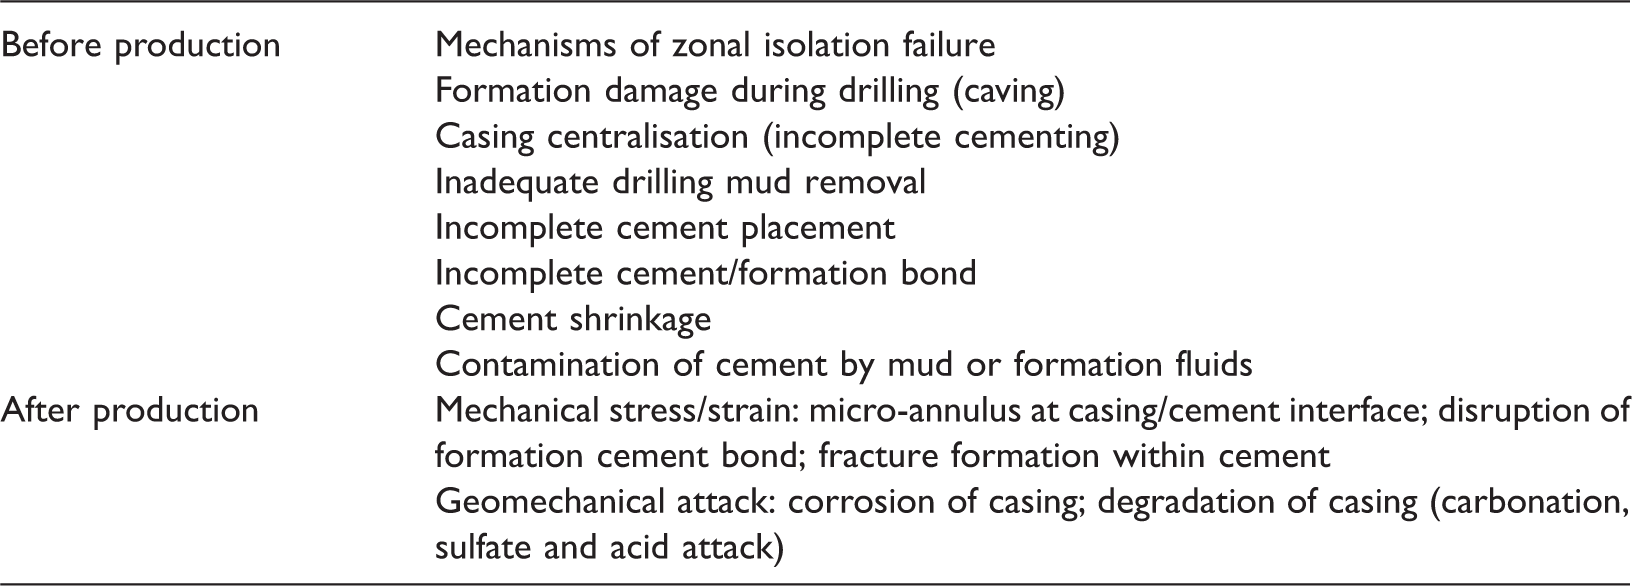
Adapted from McDaniel and Shadravan (2013).
There are environmental concerns related to the potential contamination of shallow aquifers caused by CBM production from well integrity failure (Cheung et al., 2010; CSIRO, 2012a, 2012b; Williams et al., 2012). The concentration limits for methane in water as defined by the US Department of the Interior, Office of Surface Mining are 10 mg/L of safe limit and 28 mg/L of immediate action limit (Water Research Center, 2011). High concentration of methane in water is potentially explosive because methane can outgas from water in 2 minutes which will yield a higher concentration of methane in the air than the flammable limit (5–15 v% for methane in the air; CSIRO, 2012a, 2012b; Williams et al., 2012). Osborn et al. (2011) reported the contamination of drinking water in 51 of 60 drinking-water wells (85%) by methane with methane concentration 17 times higher on average in shallow wells from active drilling and extraction areas than in wells from non-active areas; the measured highest methane concentration is 64 mg/L. The studied area by Osborn et al. is the Catskill and Lockhaven formations that overlie the Marcellus Shale in Pennsylvania and the Genesee Group that overlies the Utica Shale in New York. Osborn et al. (2011) also concluded that there is no evidence for contamination of drinking water from deep saline brines or fracturing fluid. Cheung et al. (2010) reported leakages of methane from coal seams into shallow groundwater wells in Alberta, Canada, by analysing the major ion and isotope geochemistry.
Currently, there are few studies on the impact of well integrity failures on CBM production and shallow aquifer’s contamination using numerical simulation. This paper presents a conceptual study on this topic. Two connection types and 12 cases were simulated: Type A – leakage through cement sheath (Boukhelifa et al., 2005), that is coal seam is connected with aquifer via the cement-formation interface (Agbasimalo and Radonjic, 2014; Gu and Qin, 2010; Ladva et al., 2005; Opedal et al., 2014; Teodoriu et al., 2013) which can be caused by the poor well completion practices or cement deterioration; and Type B – impaired zonal isolation at the aquifer interval, in which the wellbore is connected with aquifer through the middle section of cement and casing in an aquifer interval which may be caused by the corrosion of steel casing (Davies et al., 2014), cement deterioration (Teodoriu et al., 2013) and mechanical damage (Thiercelin et al., 1998). Effect of the distance between the aquifer and coal seam, the drainage area and the desorption time on CBM production and shallow aquifer’s contamination is also inspected.
Numerical simulation models
Mass conservation equations
Computer Modelling Group’s GEM, a finite-difference simulator, is used in this study. The CBM production simulation in this simulator is based on the following assumptions:
There are only two phases, water and gas, in the coal seam. The temperature is constant. Reservoir properties are homogeneous. The gas adsorption/desorption obey Langmuir equation. The gas is not dissolved in water.
Based on these conditions, the basic mass conservation equations are


Numerical model setup
Figure 1 shows a typical cased hole for a CBM well. In this well, two casings were installed to isolate aquifers from the ground surface and target zones. The true vertical depth at the top of coal seam is 530 m and the coal seam thickness is 10 m, while the true vertical depth at the top of shallow aquifer is varied with its distance to the coal seam, the thickness of the aquifer is 30 m.
Schematic diagram showing vertical formations and well completion structure.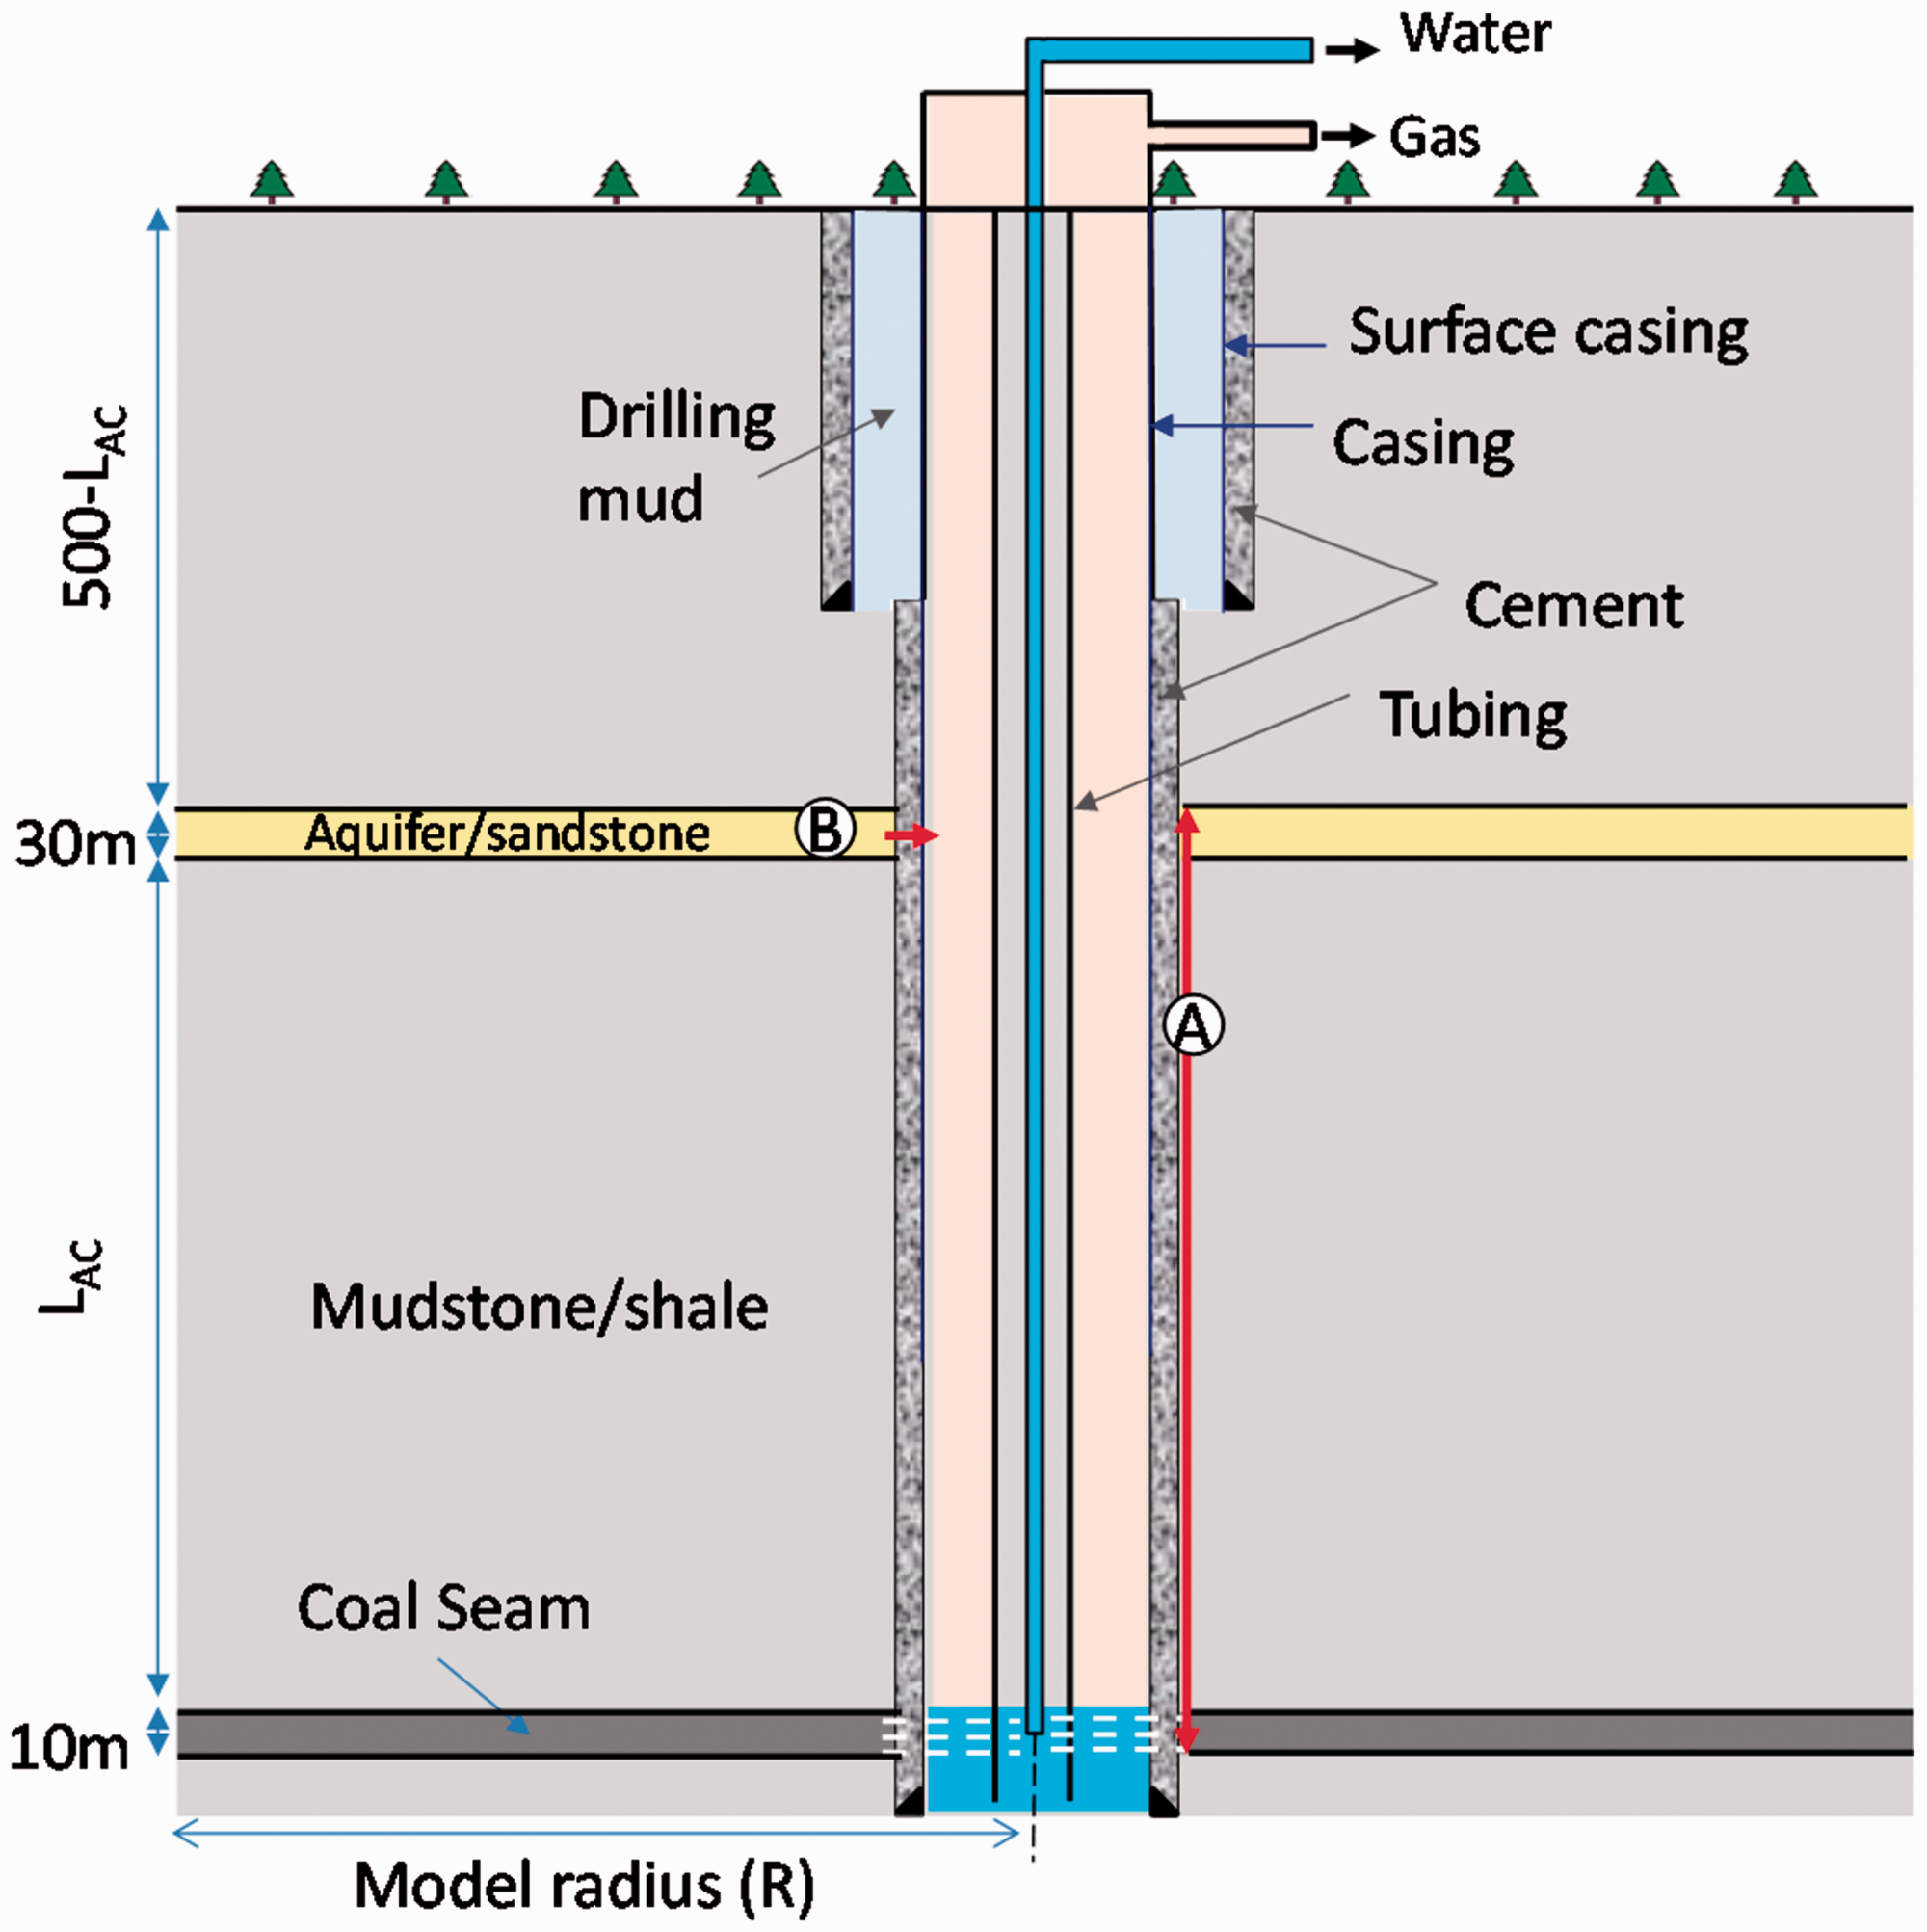
In order to simulate the impact of well integrity on CBM production and a shallow aquifer, a radial geometry with cell numbers of 40 and 36 in R and theta directions, respectively is used in simulations. Vertically, the grid size is 5 m, 10 m and 2.5 m for the sandstone, shale and coal seam, respectively. Vertical permeabilities were assumed as 1 mD and 200 mD, and porosities were assumed as 2% and 30% for the coal seam and sandstone, respectively. The shale formation is impermeable. A high permeability conduit caused by the failure of well integrity has an equivalent permeability of 100 D.
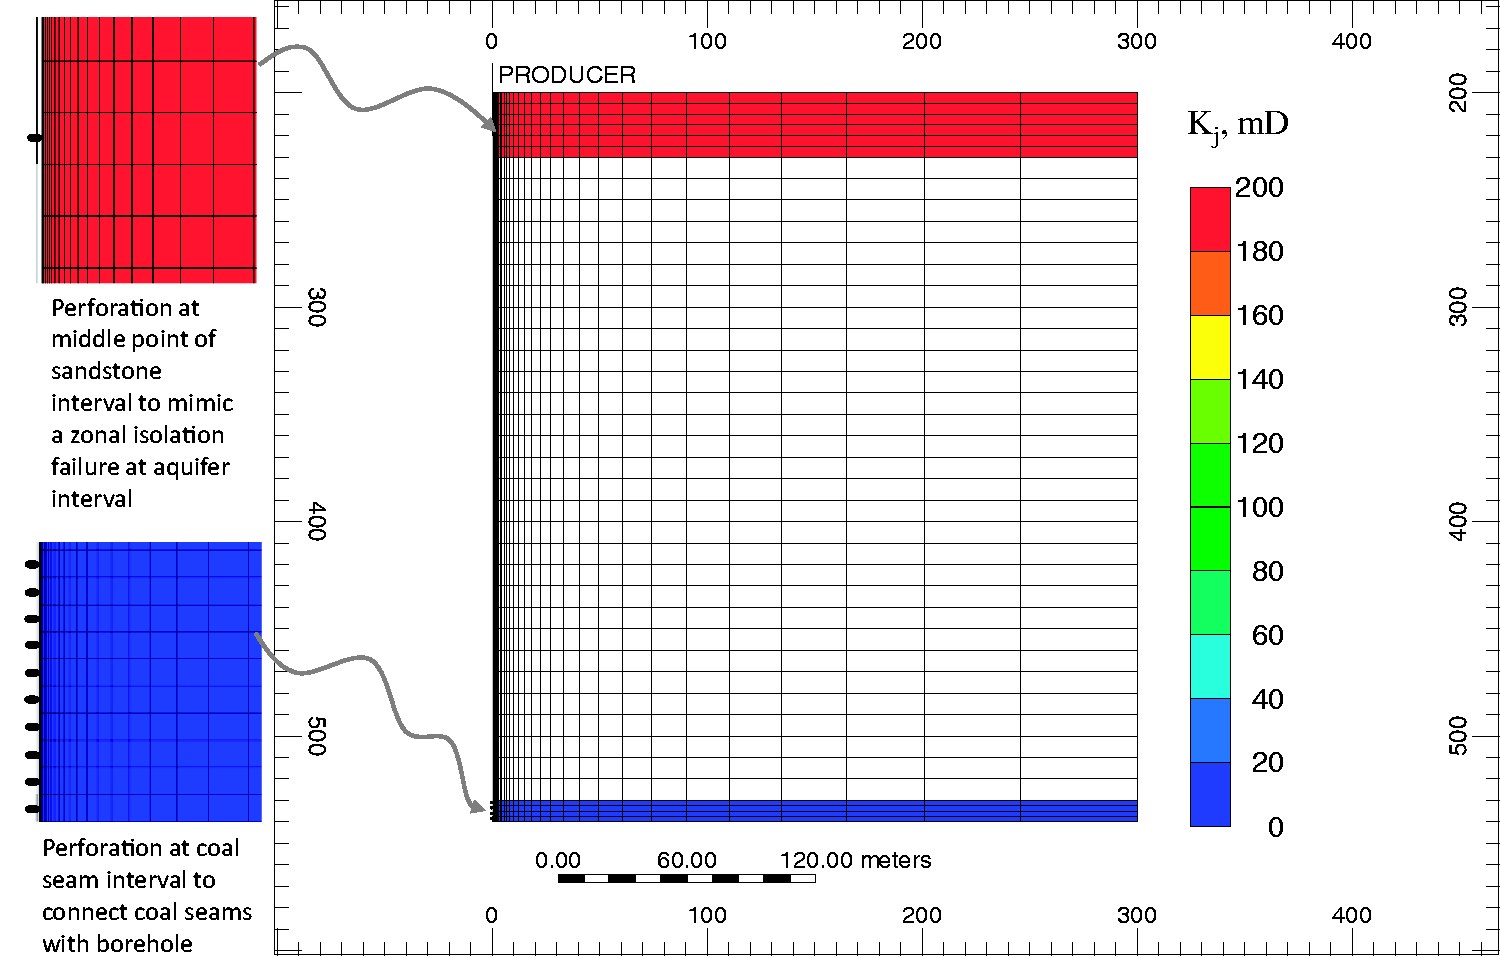
Figure 1 shows the two connection types which were studied in this study. Type A represents a leakage through cement sheath and Type B represents an impaired zonal isolation at the aquifer interval. For connection Type A, all grids with a number of two (red grids in Figure 2(b)) in radial direction were assigned a vertical permeability of 100 D. Figure 2 shows the built model for case No. S1-1. For connection Type B, integrity failures of cement (between casing and aquifer) and casing at the middle point of the aquifer were assumed. Figure 3 shows the built model for case No. S2-1.
2D areal grid system (a) and the conduit with high permeability (b) for case No. S1-1. Colour shows the vertical permeability for sandstone in green and the high permeability conduit in red. A vertical 2D section shows the horizontal permeability for case No. S2-1.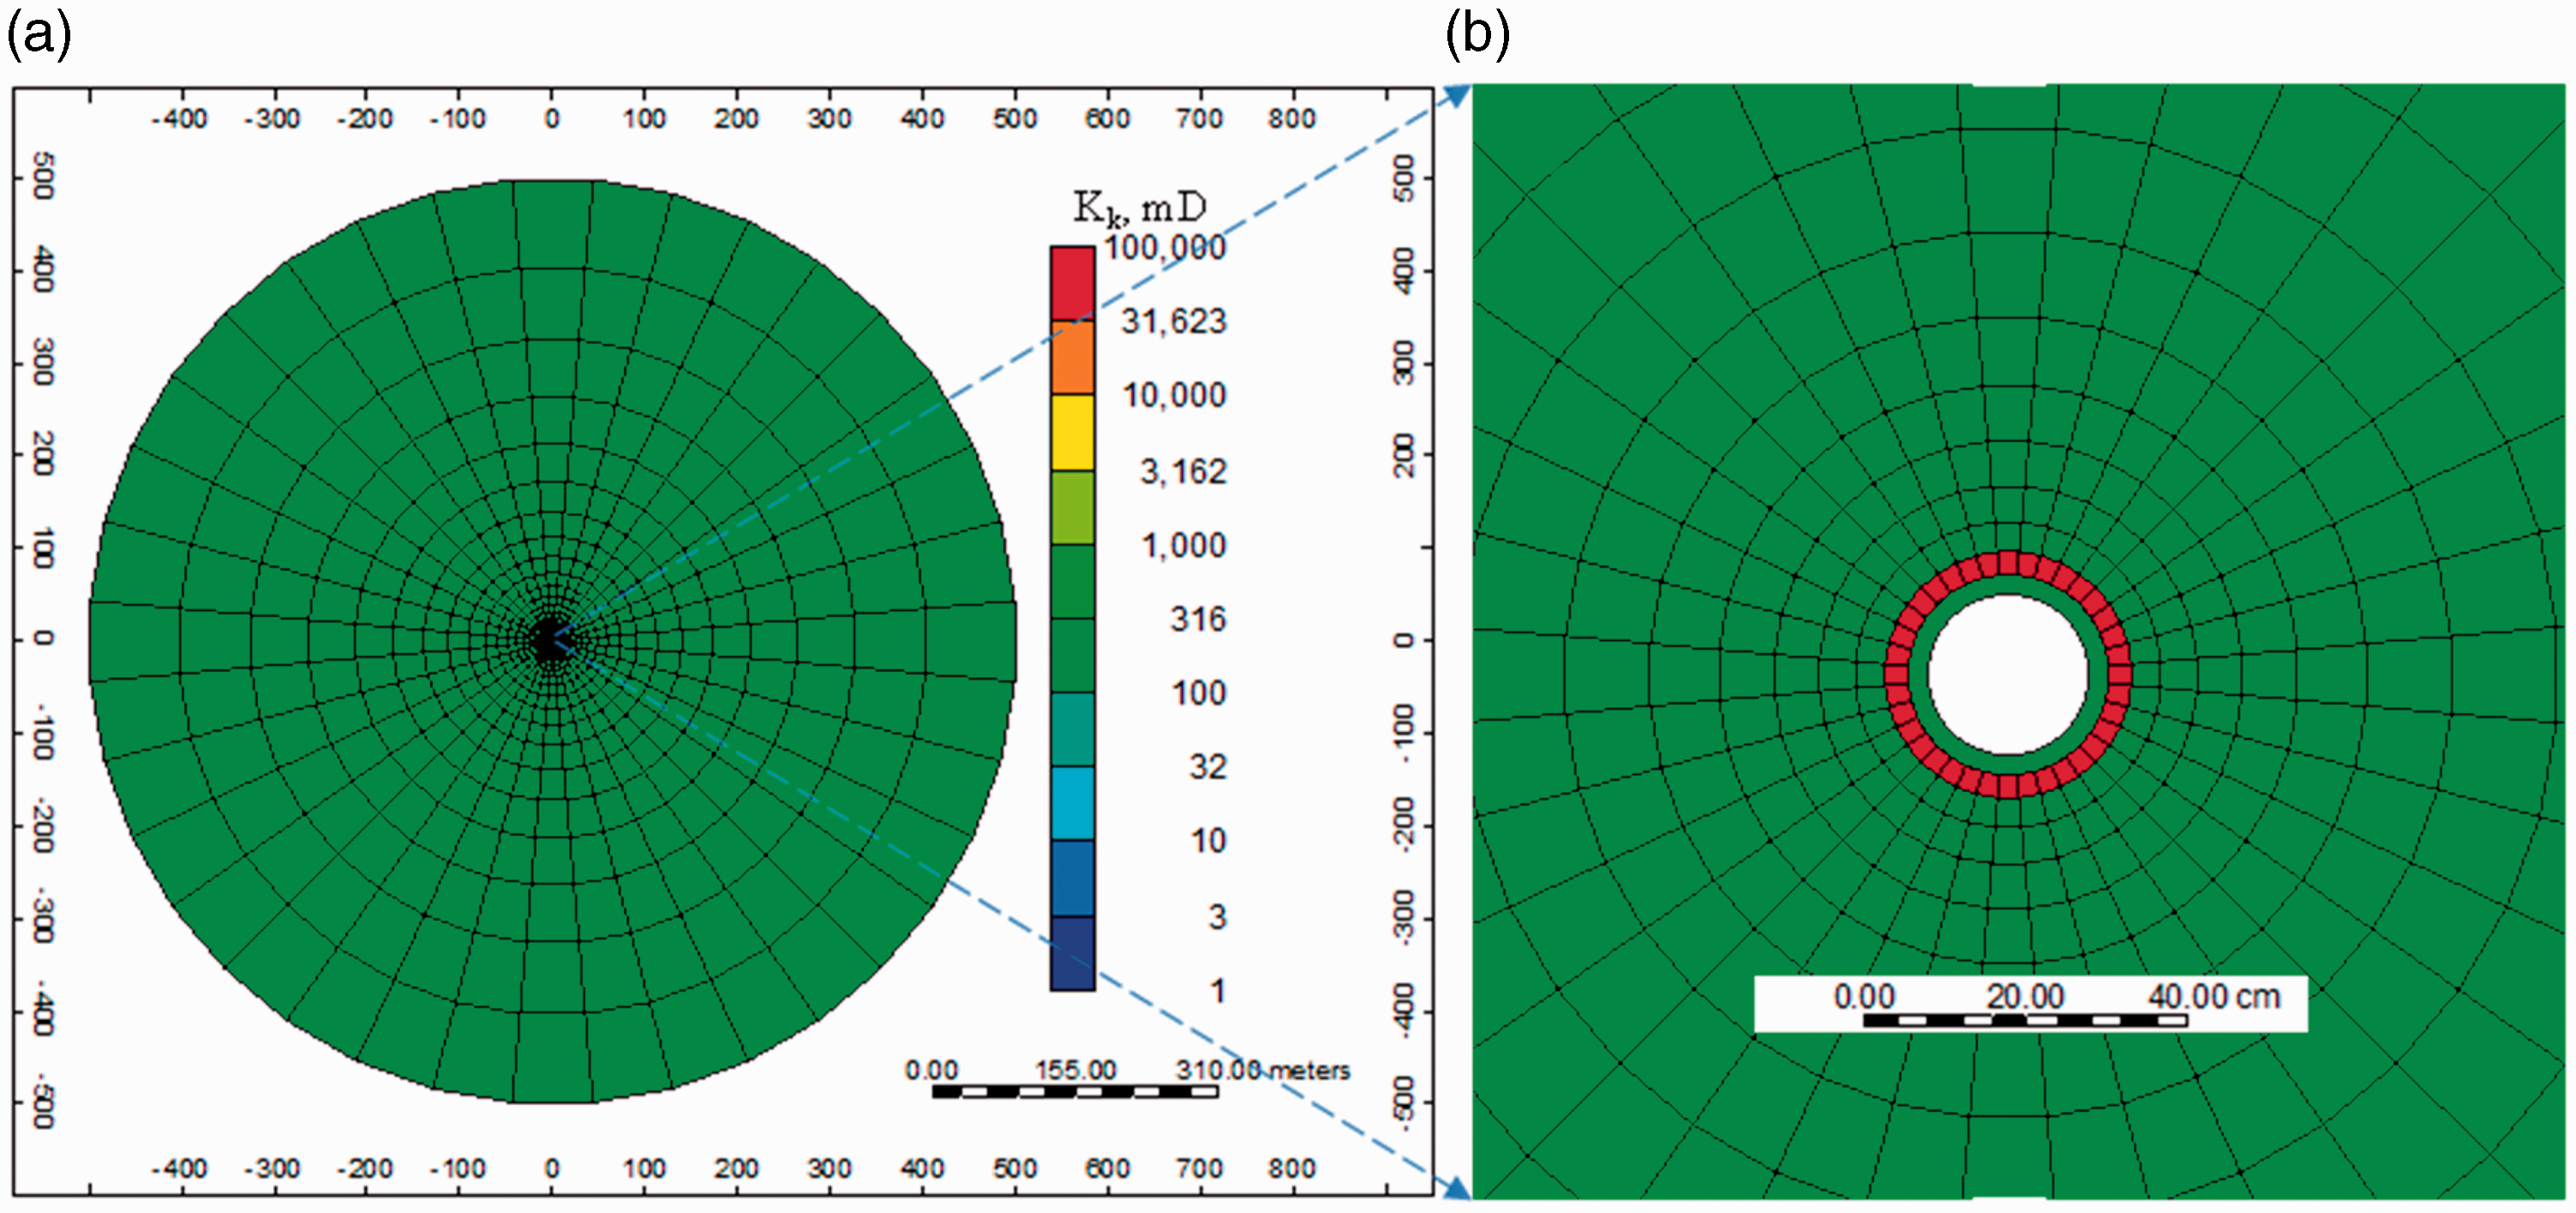
Simulation cases and parameters.
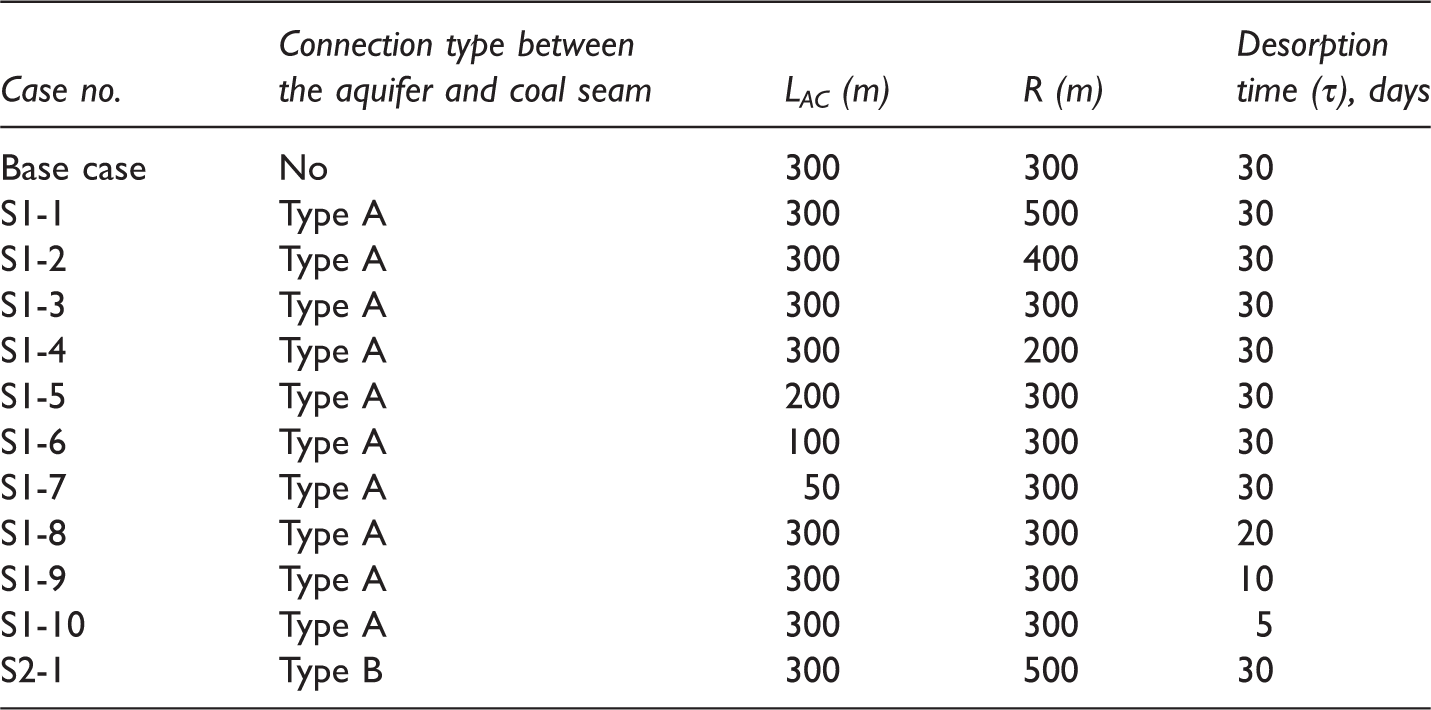
Note: LAC is the distance between the aquifer and coal seam; R is the drainage radius.
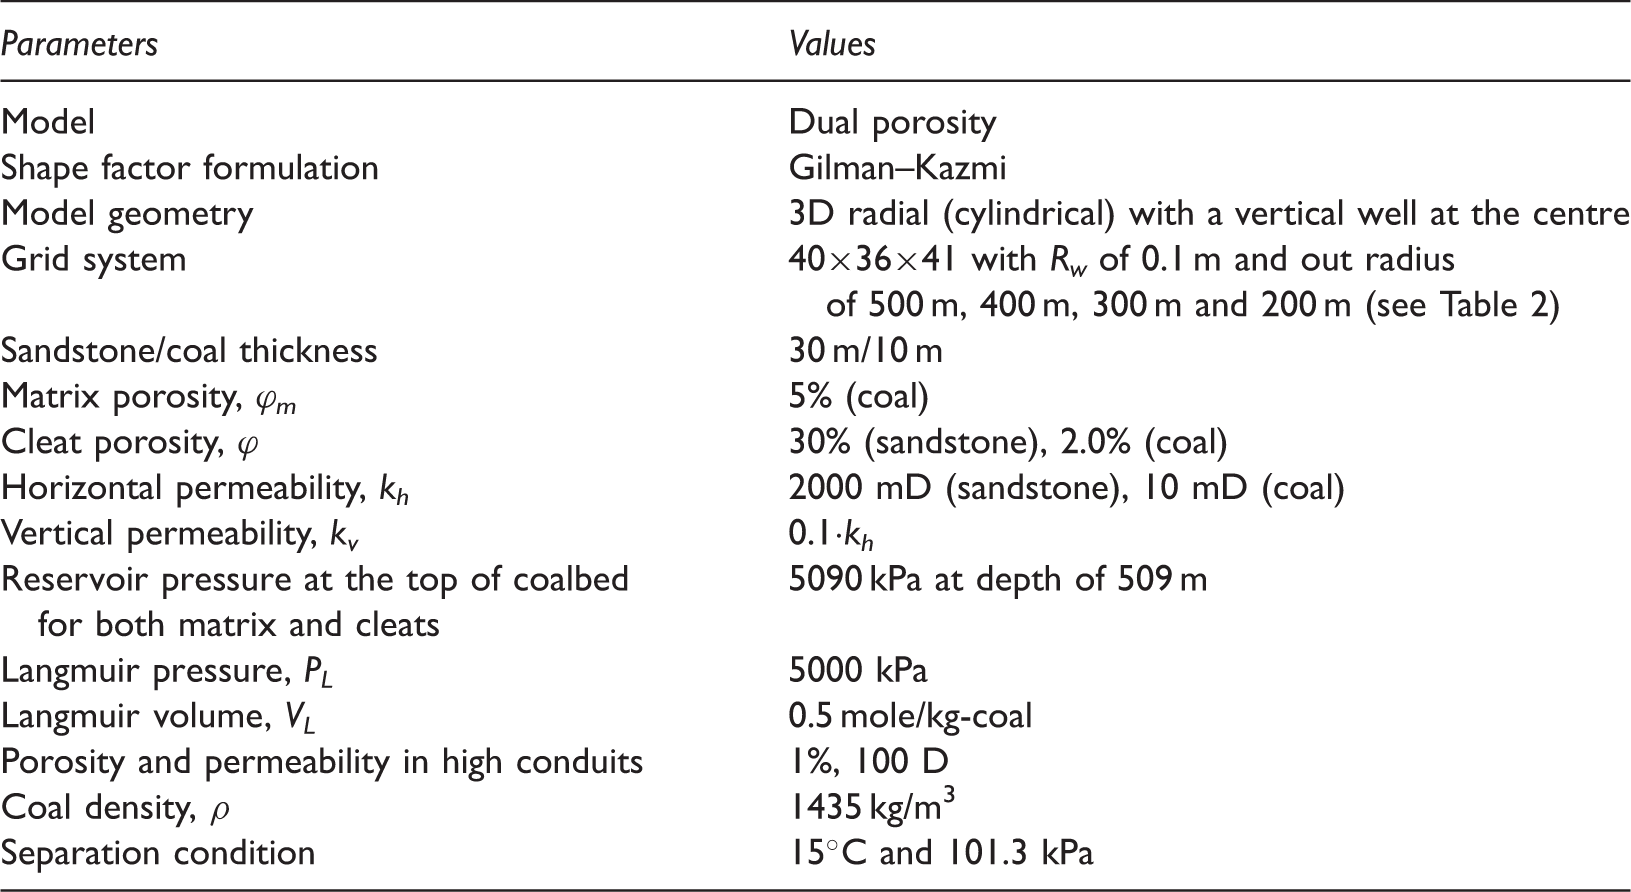
Basic parameters of all simulations.
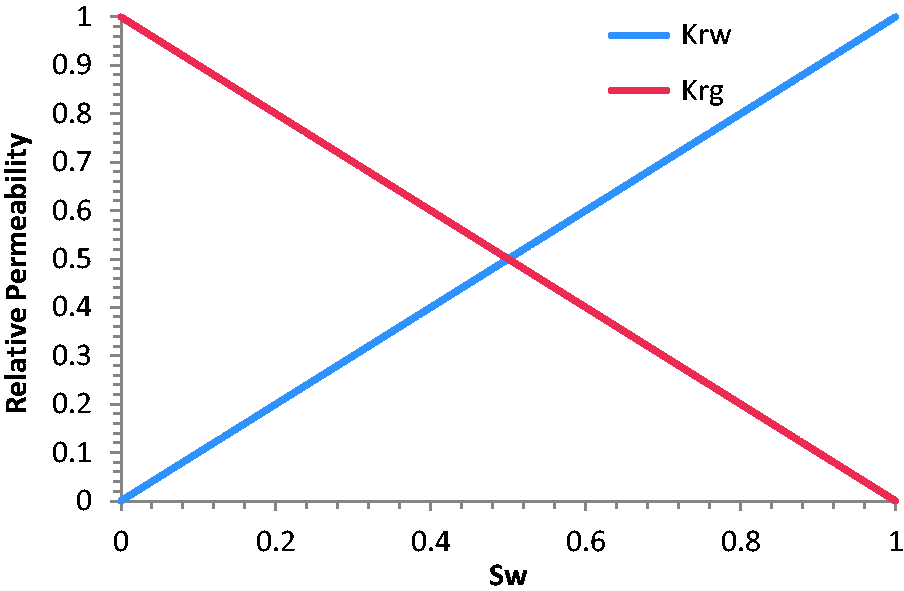
Relative permeability for water and gas in the fracture.
Results and discussion
Impact of the aquifer on CBM production
Figure 5 shows the simulated cumulative water and gas production between the base case, in which the coal seam is isolated with an aquifer by a thick mudstone, and the case No. S1-3 in which the coal seam is connected with the aquifer via the connection Type A. The water from the shallow aquifer first flows to the deeper coal seam then flows into the wellbore. Results show that the cumulative gas productions are similar but a higher cumulative water production in case No. S1-3 than that from the base case which has no connection between the aquifer and coal seam. This is because the producer is mostly constrained by BHP of 300 kPa during production which yields a similar cumulative gas production. More water is produced to maintain the same BHP as a higher feeder of water from the aquifer. The incremental water production, about 11,000 m3 at the end of the simulation, is contributed by the shallow aquifer.
Comparison of water production for models without (base case) and with connection Type A.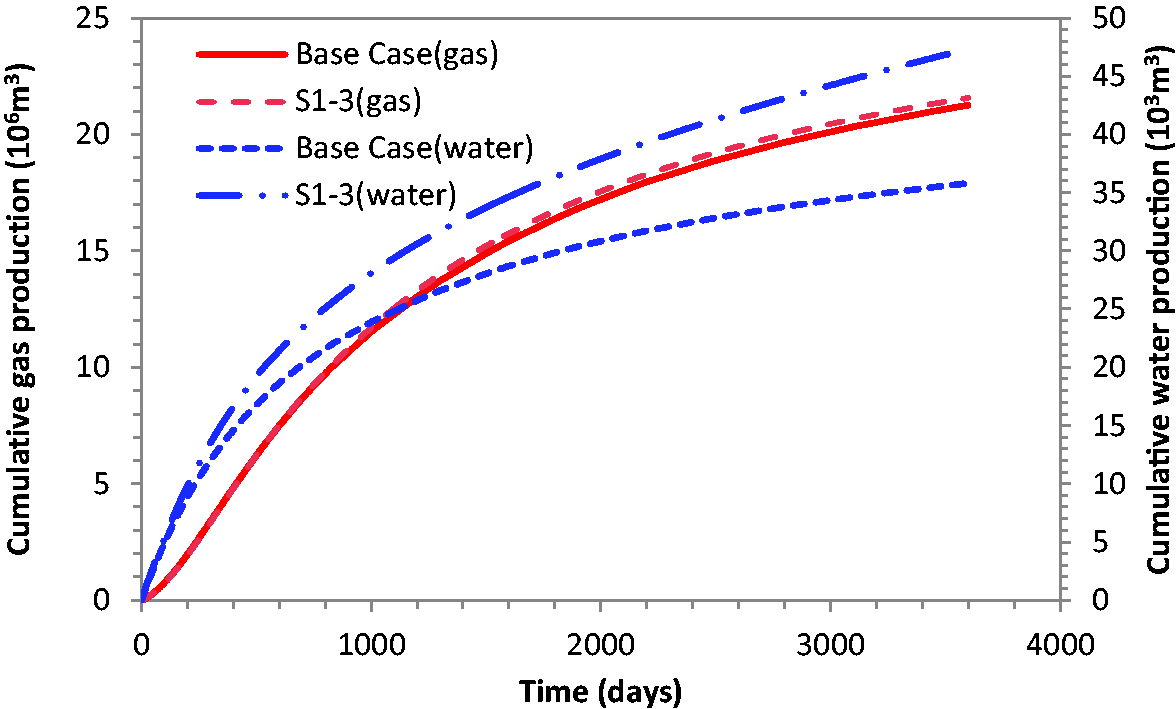
Figure 6 shows the comparison of cumulative gas and water production for case Nos. S1-1 through S1-4 which are in different drainage areas. The cumulative gas and water production at the time point of the 3600th day increases linearly with increase in drainage radius (Figure 7). This is because all simulations are simulated at the same BHP and the production reaches pseudo-steady state in the extended period.
Comparison of gas (a) and water (b) production for models with different drainage areas but with same connection Type A. Relationship of drainage radius with cumulative water and gas production at 3600th day.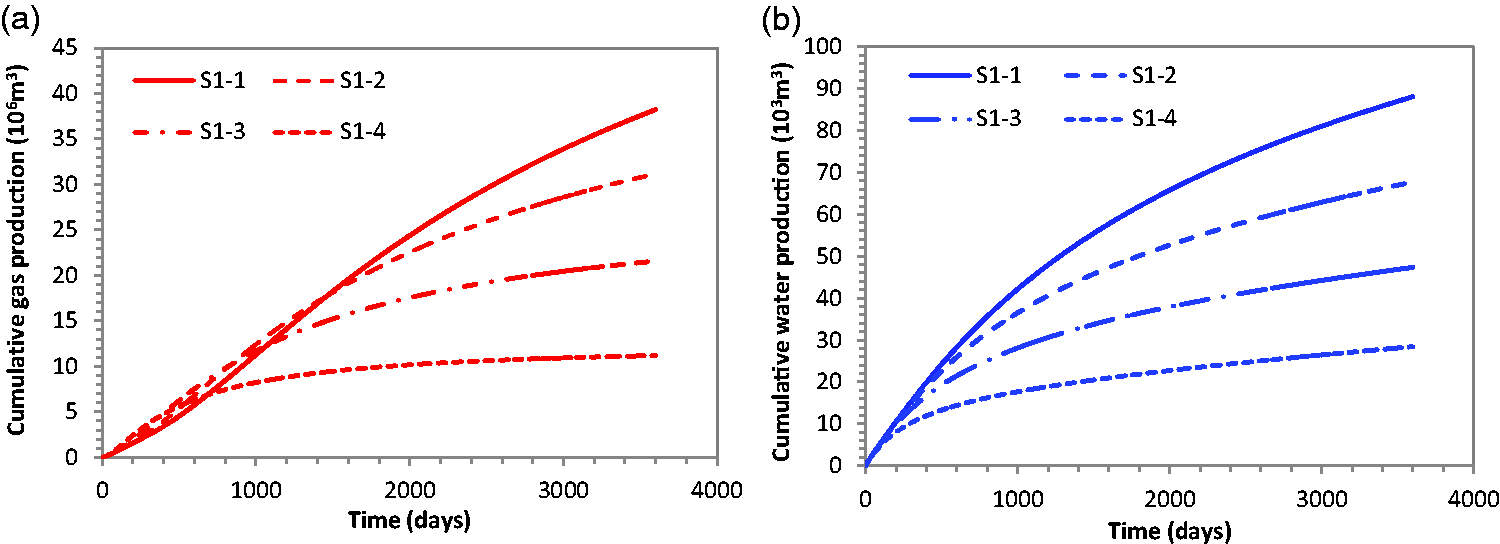
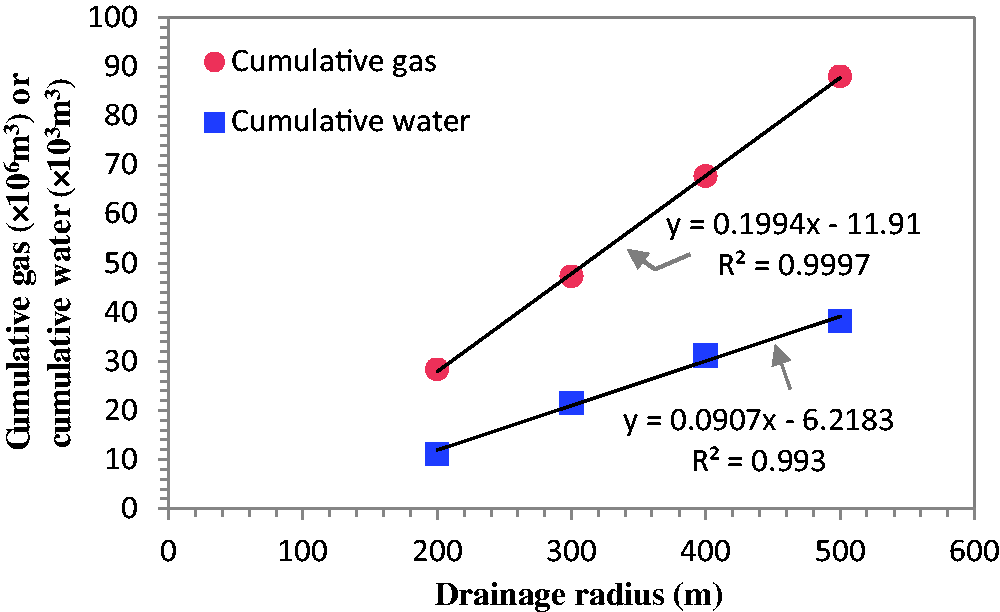
Figure 8 shows the comparison of cumulative gas and water production for case Nos. S1-3, S1-5, S1-6 and S1-7 which are in different distances between the aquifer and coal. Results show that the distance has no effect on the gas production but a minor effect on the water production because of gravity. The cumulative water production at the end of simulation decreases with the increase of the distance between the aquifer and coal seam (Figure 9). This is because the aquifer in case No. S1-7 has the highest initial pressure which yields a higher water potential and initial water volume in place.
Comparison of gas (a) and water (b) production for models with different distances between the aquifer and coal seam but in the same connection Type A. Inset: a portion of the figure zoomed. The relationship between the cumulative water production at 3600th day with the distance between coal seam and aquifer.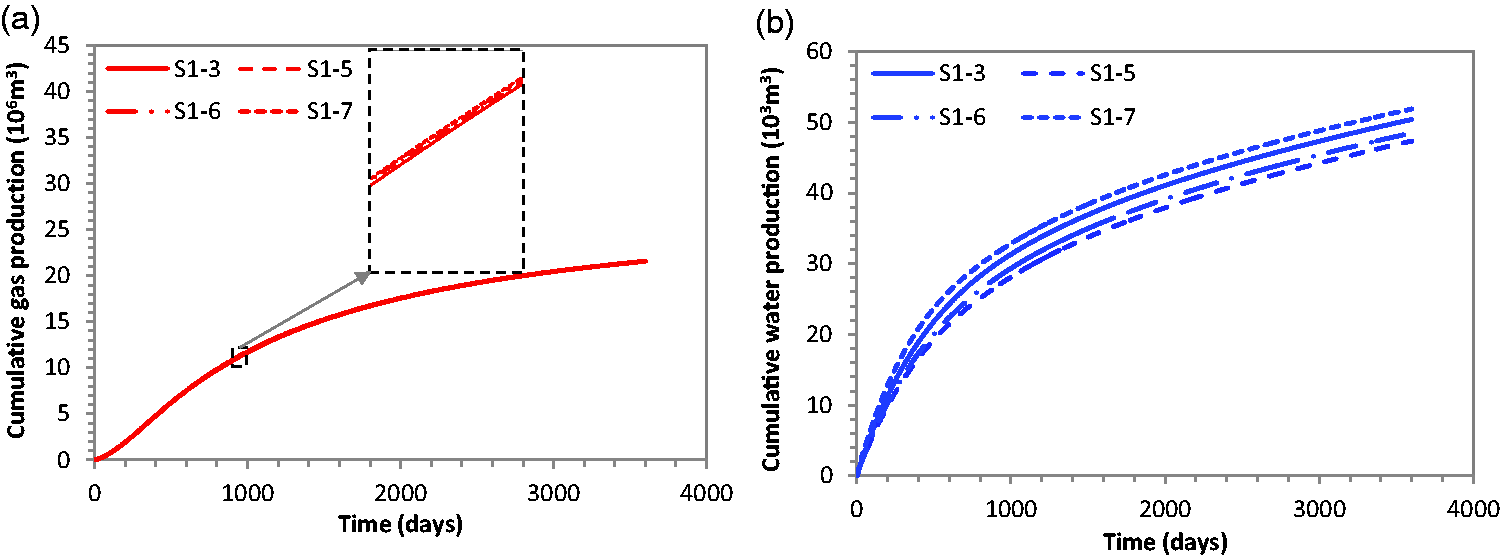
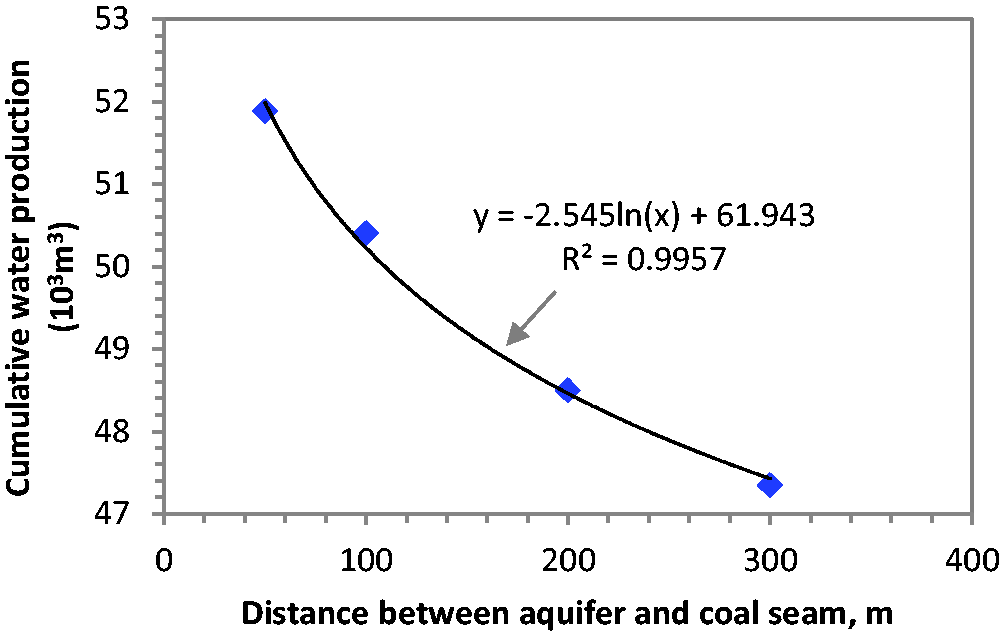
Figure 10 shows the comparison of the cumulative gas and water production for case Nos. S1-3, S1-8, S1-9 and S1-10 which are with different desorption times. Results show that the desorption time has a negligible effect on cumulative gas and water production. This is because the gas desorption time has a small cumulative sensitivity index to water and gas production compared to other parameters, e.g. permeability, coal seam thickness, etc. (Zhou, 2012).
Comparison of gas (a) and water (b) production for models with different desorption times but the same connection Type A. Inset: a portion of the figure zoomed.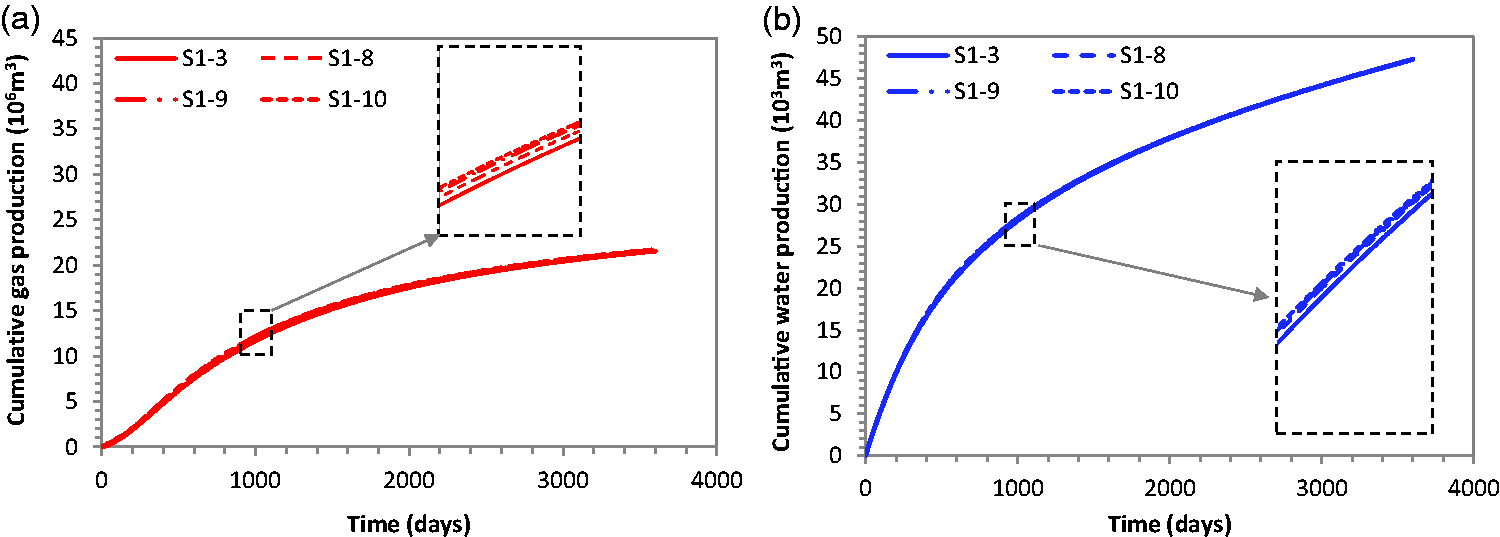
Figure 11 shows the comparison of the cumulative gas and water production rate between case Nos. S1-1 and S2-1 which have different connection types. Results show that the connection Type B yields lower cumulative water and gas production.
Comparison of gas (a) and water (b) production for models with different connection types.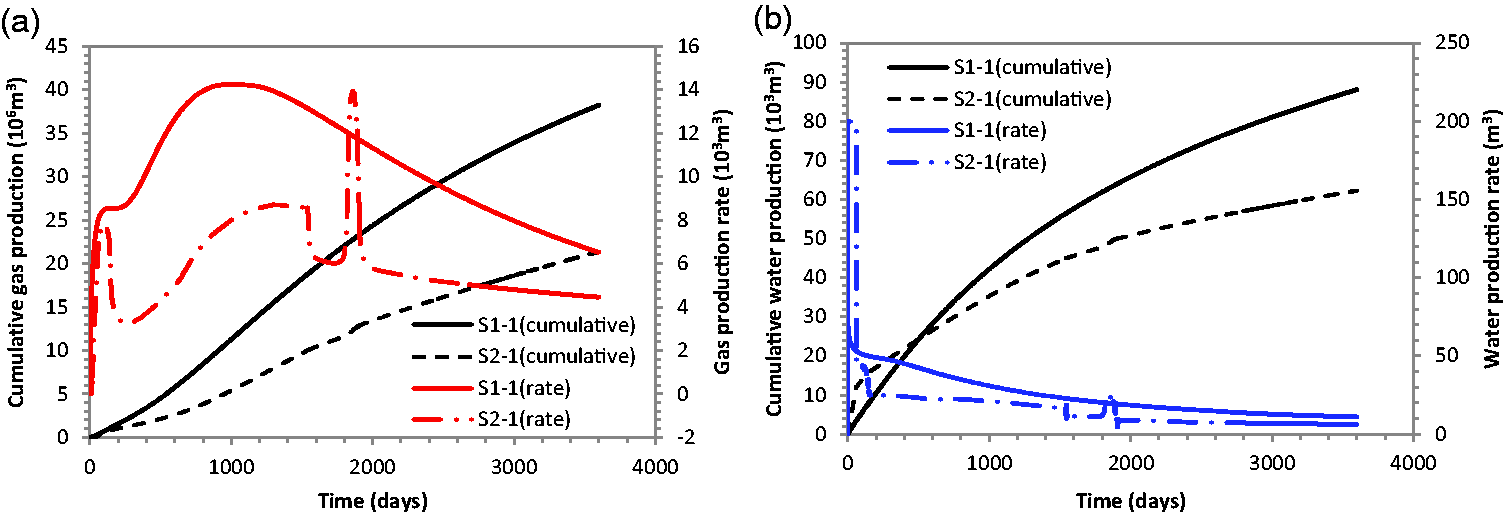
Methane concentration in the aquifer
In this study, we calculated gas concentration for each grid using equation (5) based on the simulated gas mass density which was calculated by the software using the equations of state (see Appendix 1), gas saturation and water saturation
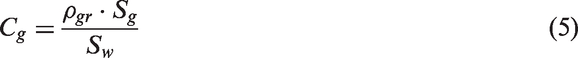
Figure 12 shows the variation of the grid-based average methane concentration along the radius of the top layer in the aquifer at the 3600th day. According to the hazard methane concentration limit of 28 mg/L, the safe radius should be greater than 90 m for case No. S1-10 while it is about 50 m for case No. S1-1. The methane concentration decreases sharply from 10,000 mg/L to approximately 10 mg/L within 100 m of the producer. Osborn et al. (2011) reported that the methane concentration also decreases sharply but the safe radius away from the wellbore is about 500 m which is longer than the results from this study. However, this comparison is very rough for the shortage of details about the reservoir properties, well conditions and operations, etc.
(a) Simulated average methane concentration from top layer grids vs. the radial distance to the producer at the 3600th day. (b) Measured methane concentration against distance to the producer from Osborn et al. (2011).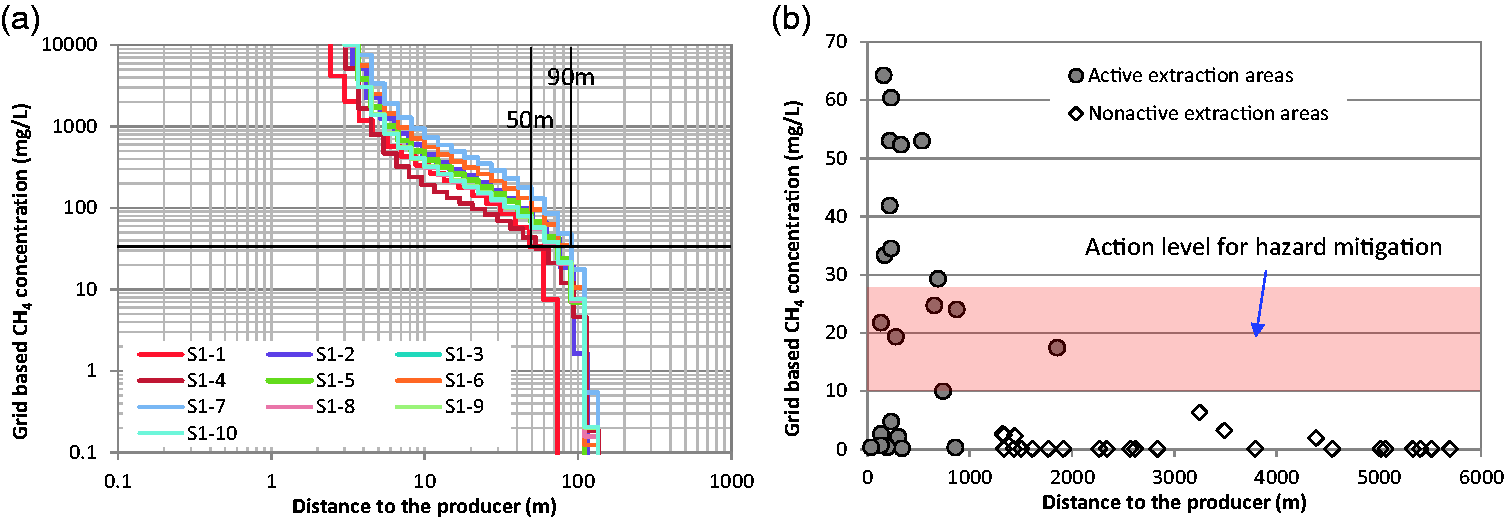
The connection Type B has no effect on shallow water quality because the gas in the wellbore is extracted directly from the annular space between the tubing and casing. However, if the well is abandoned, the gas in the wellbore may invade into the aquifer by the gravity and the density difference between gas and water.
Conclusions
Based on the numerical simulation of 12 cases, the effects of the connection type, the distance between the aquifer and coal seam, the drainage area and the desorption time on the water and gas production and the methane concentration in the shallow water were studied. Analysing a real field data to verify the methods used in this study need to be done in the future. Note that this is a conceptual study to address the consequence if there is a well integrity issue. But this rarely happens in CBM industry because of the matured well completion technologies. Following are the conclusions drawn based on this study:
Both connection types, Type A – leakage through cement sheath and B – impaired zonal isolation at the aquifer interval, impact the gas and water production. With the connection Type A, the cumulative water and gas production increases linearly with the increase of drainage radius; the distance between the aquifer and the coal seam has a negative effect on the cumulative water production but a negligible effect on the gas production and the desorption time, ranging from 5 to 30 days, has a negligible effect on the water and gas production. The Type A connection affects the water quality but Type B does not. The gas concentration decreases sharply with an increase of distance away from the producer and the unsafe radius ranges from approximately 50 m to 90 m in this study.
Footnotes
Acknowledgements
We thank the anonymous reviewer for the constructive comments. We also acknowledge the Computer Management Group for providing the simulator.
Declaration of conflicting interests
The author(s) declared no potential conflicts of interest with respect to the research, authorship, and/ or publication of this article.
Funding
The author(s) disclosed receipt of the following financial support for the research, authorship, and/or publication of this article: This work is supported by the National Natural Science Foundation of China (41472127, 41472129, 41502158), Key Coal-Based Technologies R & D Program of Shanxi Province (MQ2014-01) and the Joint Research Fund for Coalbed Methane Gas of Shanxi Province (2013012004).