
Abstract
Bio-precursors of organic matter, referring to formerly living precursors, can influence content and distribution of organic pores significantly. However, insufficient attention has been paid in previous studies. To research the impact of bio-precursors of organic matter on shale organic pores, we conducted palynology and thin section analysis, total organic carbon analysis, and N2 gas absorption experiments on the Wufeng and Longmaxi Formations shales and kerogen samples from the Shuanghe outcrop section in southern Sichuan Basin, China. Generally, there are three bio-precursor assemblages being developed from bottom to top in the Wufeng and Longmaxi Formation, namely benthic algae, benthic–planktonic algae, and planktonic algae assemblages. Porosity in kerogen contributes greatly to shale porosity, accounting for 13 − 53% of total porosity. The total porosity and mesopore volume of samples (kerogen and shale) dominated by benthic algae are higher than those by planktonic algae. Pore size distributions of kerogen samples containing mainly benthic algae and planktonic algae are unimodal and multimodal type, respectively, when the pore diameter is larger than 5 nm. The different features between benthic and planktonic algae assemblages could be attributed to their different hydrocarbon generation potential and biological structure. Smaller fractal dimension of pores in kerogen samples mainly containing planktonic algae suggested that the planktonic algae are responsible for smoother pores in shales.
Introduction
Bio-precursors of organic matters are formerly living organisms whose molecular organic components and part of organ fossils contributed to kerogen or dispersed organic matter and some of them generate consequently hydrocarbon during thermal alternation (Bian, 2006; Zhang et al., 2004). Remained debris of bio-precursors could be identified under optical microscope, scanning electron microscope, and transmission electron microscope and provide biological information about organic matters in source rocks (Bian, 2006; Cao et al., 2008, 2009, 2015; Derenne et al., 1993; Hu et al., 2012, 2014a, 2014b; Largeau et al., 1990; Zhang et al., 2004).
It has been indicated that organic pore may account for about 30% of the total volume in some shale reservoirs (Tang et al., 2016; Tian et al., 2013); however, factors influencing shale reservoirs remain controversial, such as organic matter type (Cao et al., 2015; Mastalerz et al., 2013), thermal maturity (Chen and Xiao, 2014; Curtis et al., 2012; Löhr et al., 2015; Loucks et al., 2009), and total organic carbon (TOC) (Cao et al, 2015; Chalmers and Bustin, 2008). Previous studies suggested that organic matter types significantly impact organic porosity and pore morphology (Cao et al., 2015; Mastalerz et al., 2013). Fishman et al. (2012) also suggested that organic pores of Kimmeridge Formation mudstones vary as a function of maceral type rather than thermal maturity. In fact, organic matter types are thought to be mainly controlled by bio-precursors, for example Type III kerogens are mainly derived from plants and macroalgae, whereas Type I kerogen dominantly is originated mainly from planktonic algae (Tissot and Welte, 1984). Therefore, the bio-precursors might be mainly responsible for organic pore in shale.
Recent studies have indicated that some organic matter particles have a large volume of nanopores (Curtis et al., 2012; Juliao et al., 2015). Most of organic particles are proved to be mainly remained particles of bio-precursors which are preserved in kerogen (Yang et al., 2016). Further studies suggest that the content and distribution of organic matter particles in shales could affect pore characteristics of shale reservoirs and gas migration significantly (Loucks and Reed, 2014). Therefore, bio-precursors play an important role in the formation and development of organic pores. However, little attention has been paid on how bio-precursors affected the development of organic pores in shales. Detailed studies on the correlation between bio-precursors and organic pores should shed light on the shale gas reservoir.
In this study, shales from the Wufeng and Longmaxi Formations were sampled in the Shuanghe outcrop section in the Changning, southern Sichuan Basin. Based on detailed organic petrology study, the development of bio-precursors of the Wufeng and Longmaxi Formation shales was built. Then pore characteristics of shale gas reservoirs were studied, and then the relationship between the organic pore volumes, pore size distribution, pore structure, and bio-precursor assemblages was discussed. The results might provide a better understanding of controlling factors of development of shale porosity.
Geological settings
The Yangtze plate was a part of the South China plate, lying in the tropical or subtropical regions of western margin Gondwanaland during the later Ordovician (Cocks, 2001). The studied region, Changning city, is located between the Dianqian and Chengdu uplift, southern Sichuan Basin (Figure 1(a) and(b)). In this region, the Wufeng and Longmaxi Formations marine shales outcrop widely (Liang et al., 2009).
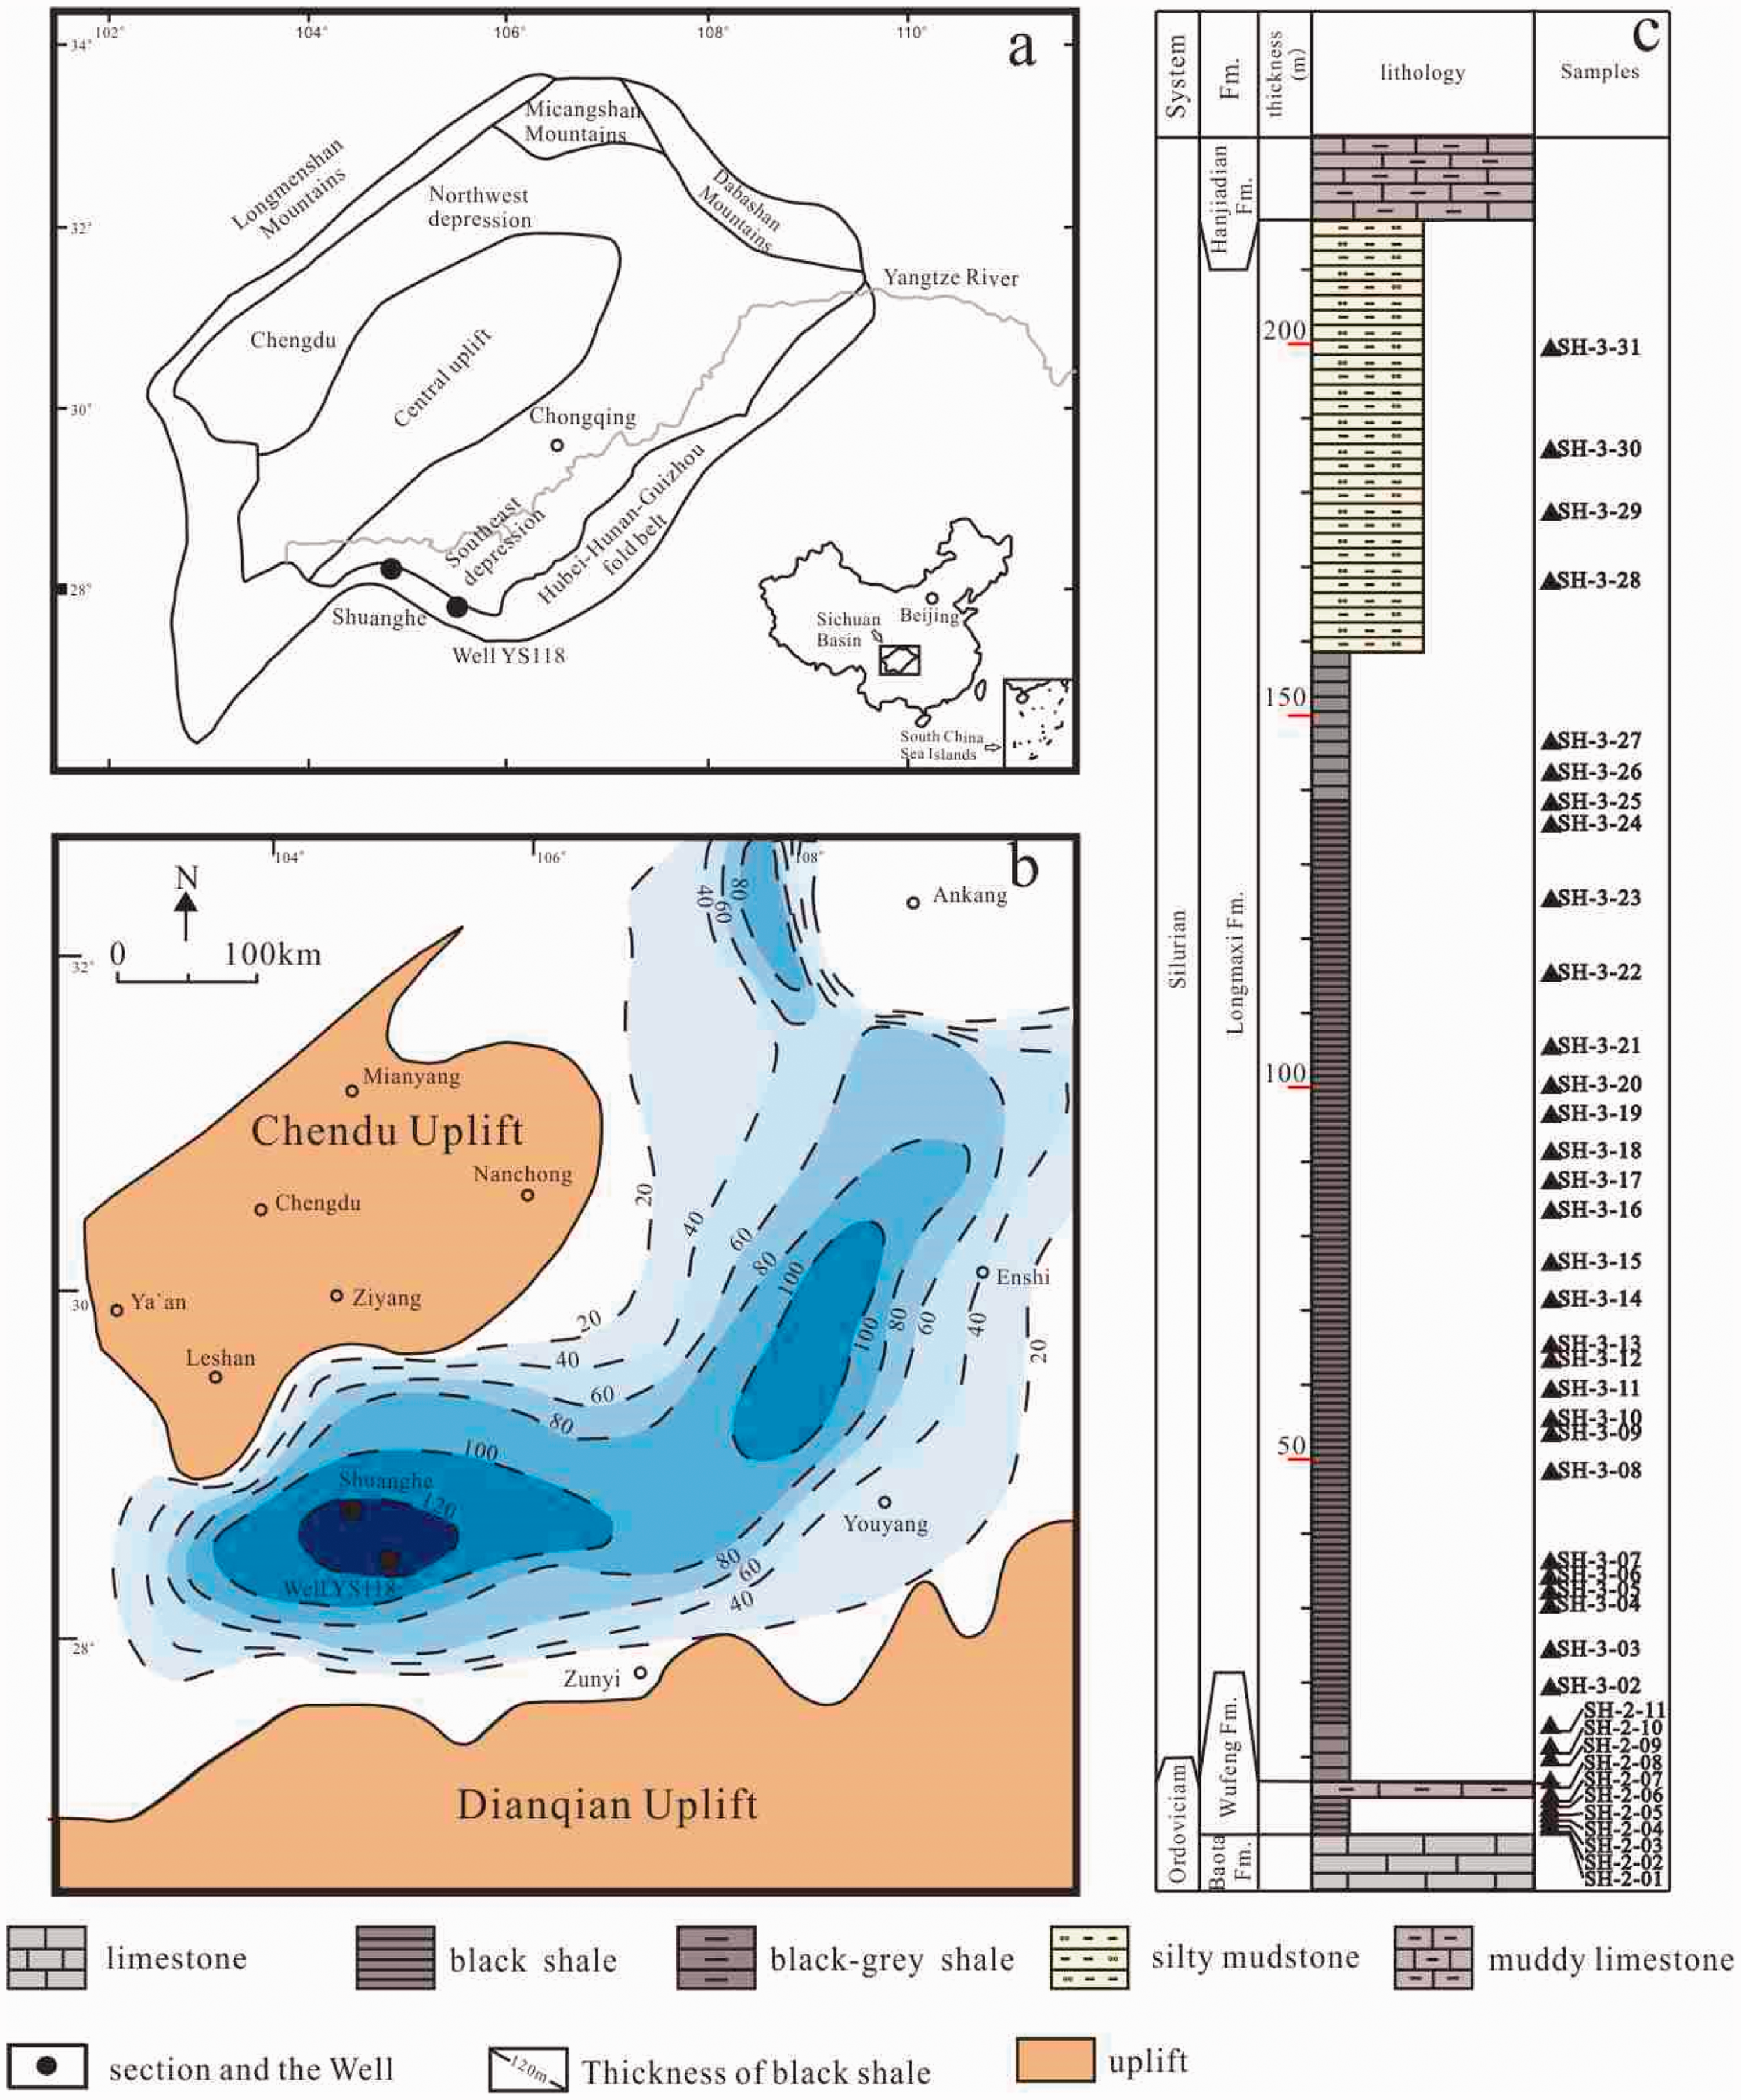
(a) Location of sampling sections, (b) thickness of Upper Ordovician Wufeng Formation and Lower Silurian Longmaxi Formation marine shales in southern Sichuan Basin (modified from Guo (2013) and Liang et al. (2009), (c) samples and lithological logs of Shuanghe Section, Changning Area.
The Wufeng Formation consists of the lower black shale member containing graptolites and the upper Guanyinqiao Member composed of carbonaceous limestone-bearing brachiopods, trilobites, and corals with the thickness of about 1 m. Longmaxi Formation can also be subdivided into two members. The lower section consists of black and gray-black shales, while the upper one is mainly composed of gray silty shales and siltstone (Li et al., 2017). Four sedimentary facies are formed during the deposition of Wufeng and Longmaxi Formations, including deep shelf facies, semi-deep shelf facies, shallow shelf facies, and shelf edge facies (Wang et al., 2015). The thickness of the Wufeng and Longmaxi Formations in the southern Sichuan Basin is between 100 and 600 m.
The TOC contents were generally higher than 2% in the Wufeng Formation and the lower part of Longmaxi Formation shales, whereas the TOC values were close to 1% in the upper part of the Longmaxi Formation (Wang et al., 2015). The equivalent vitrinite reflectance (1.8 − 4.2%) indicated that the organic matter of Wufeng and Longmaxi Formations is high–over mature (Dai et al., 2014).
Samples and methods
Samples
The thickness of the Wufeng and Longmaxi Formation in the Shuanghe Section is about 220 m. The main lithology includes siliceous shales, mudstone, muddy siltstone, and siltstone. A total of 42 fresh black shale samples were sampled from Shuanghe Section in southern Sichuan Basin (Figure 1(c)), and then they were prepared for thin section analysis, kerogen observation, low-pressure nitrogen gas adsorption measurement, X-ray diffraction, and TOC analysis.
Methods
Bio-precursor identification
Forty-two thin sections parallel to the bedding with size of 1 cm × 1 cm × 0.03 mm were made for identification of the type of bio-precursors and their contents estimation. Twenty-five samples were made for the analysis of bio-precursors by palynology method. Before palynology study, all samples were powered and then were dissolved in HCl for 6 h to remove carbonates and then washed three times with distilled water and treated with HF for 12 h to remove silicates. The residual HF was washed five times with distilled water (Guthrie and Pratt, 1994). Forty-five micrometer sieve and 10 µm nylon cloth were used to filter the insoluble residues, respectively. All thin sections were observed under Leica DM 2500P microscope at Southwest Petroleum University.
Bio-precursors were identified according to their morphology of remained debris and tissues (Bian et al., 2005; Xie et al., 2014; Yang et al., 2017; Zhang et al., 2007). Generally, most planktonic algae exhibit spherical, aggregate shapes (few had single filament appearance), and most amorphous appearance is usually considered to be features of organisms originating in planktonic biomass (Lewan, 1986; Tissot and Welte, 1984), and algae with lamellar fabrics are generally thought to be derived from cyanobacteria (Peniguel et al., 1989). However, most benthic algae including Rhodophyta Rhodophyceae, Chlorophyta Ulvophyceae, and Heterokontophyta Phaeophyceae have a plate-like thallus and filament aggregation thallus, which are significantly different from planktonic algae (Fott and Nováková, 1971; Lee et al., 2008). In addition, most types of benthic algae have particular reproductive organs and cell structures. For example, most type of Rhodophyta has spherical or zonal trisporangia or tetrasporangia, and Phaeophyceae have single chamber or multichamber sporangia (Fott and Nováková, 1971; Lee et al., 2008).
TOC contents
The TOC of eight samples was obtained from a Leco CS-200 carbon–sulfur analyzer at Wuxi Institute of Petroleum Geology. Before analyses, the crushed samples (about 100 mg and sieved by 120 mesh) were treated with HCl solution to remove carbonate impurities.
Organic pore analyses
Low-temperature N2 adsorption experiment was carried out on 16 samples (eight shale samples and eight kerogen samples) to obtain data concerning specific surface area, pore volume, and pore size distribution. Shale samples were crushed with agate into 60–80 mesh, while kerogen samples of 100–120 mesh were collected. Wei et al. (2016) proposed that grain size ranging from 60 to 140 mesh could be used for low-pressure N2 adsorption measurements. Before the experiment, 1 g mass from each sample was weighed and then treated with dehydration and vacuum degassing at 373.13 K for 6 h. Afterward, they were quickly connected to the analytical port for low-pressure N2 adsorption test at a temperature of 77.35 K. The samples were tested at the Chengdu University of Technology with Quantachrome Quadrasorb SI automatic gas adsorption system. Nitrogen adsorption data from shale and kerogen samples were interpreted using Brunauer–Emmett–Teller analysis for surface area and density functional theory (DFT) for pore volume and pore size distributions.
C ratios reflect the ratio of organic pore volume to the total pore, and it is calculated according to the experimental data and the simple mass model, C = (PVkerogen × organic matter content (OMC))/PVshale in which PVkerogen represents the total pore volume of kerogen, OMC is obtained by Tissot and Welte (1984) (OMC = 1.20 × TOC) and PVshale is the total pore volume of shale.
Results
Bio-precursor assemblages in the Shuanghe section
Five types of bio-precursors including benthic algae, planktonic algae, radiolarians, spores, and fauna debris were found in the Wufeng and Longmaxi Formation shales (Figure 2).
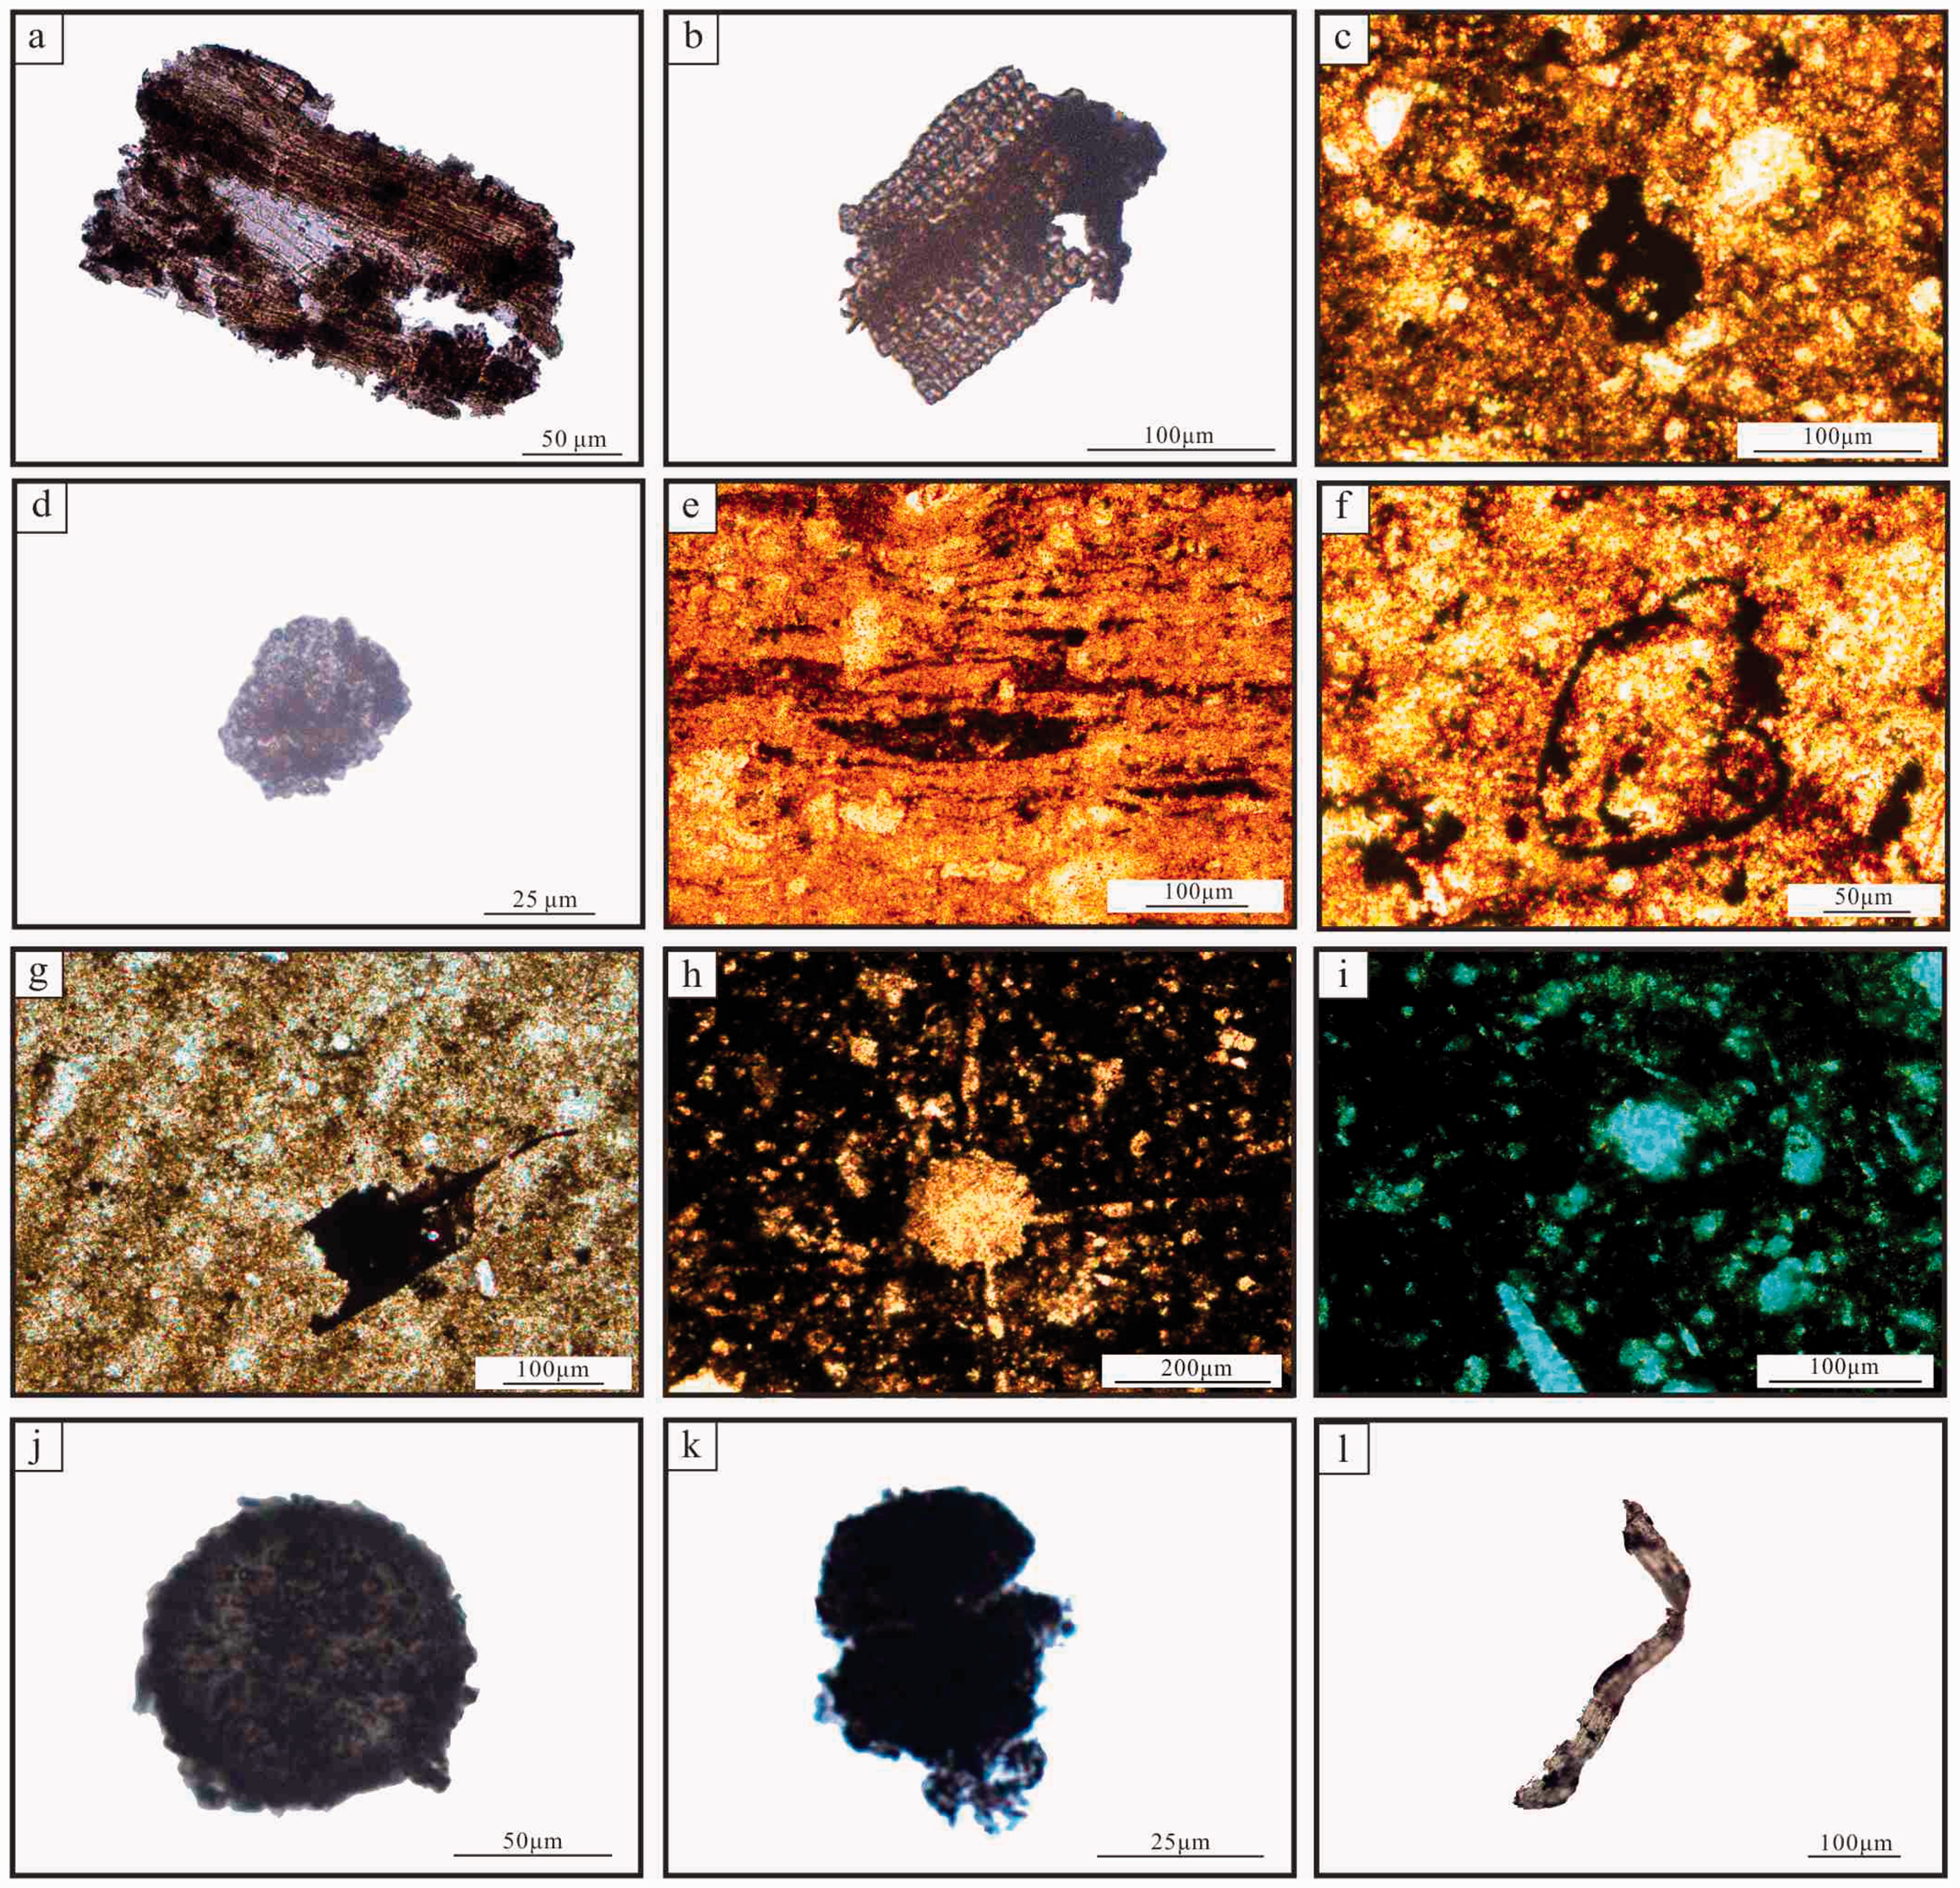
Micrographs of bio-precursors of organic matter. (a) The multicellular structure of benthic algae (plane-polarized light, sample SH-3-27); (b) benthic algae with grid cell structures (plane-polarized light, sample SH-3-27); (c) cystocarp of benthic algae (plane-polarized light, sample SH-3-14); (d) spongy amorphous organic matter in kerogen (plane-polarized light, sample SH-3-27); (e) lamellar structural planktonic algae (plane-polarized light, sample SH-3-31); (f) organic wall of planktonic algae (plane-polarized light, sample SH-3-15); (g) graptolite (plane-polarized light, sample SH-3-05); (h) well-preserved radiolarian with spines (plane-polarized light, sample SH-2-04); (i) fragments of a radiolarian (plane-polarized light, sample SH-2-06); (j) spores, P. laevigata Johnson, 1985 (plane-polarized light, sample SH-3-21); (k) dichotomous spores (plane-polarized light, sample SH-3-27); (l) Nematothallus (plane-polarized light, sample SH-2-04).
In the Wufeng and Longmaxi Formations, lots of benthic algae debris are observed under microscope. These tabulate-like benthic algae thallus are featured by their outside layers composed of pseudoparenchymatous tissues and their internal walls of filamentous aggregate (Figure 2(a) and (b)). Some benthic algae have typical reproductive organs with sporulation and reproductive nest can be found in the cortical layer of thallus (Figure 2(c)). Most of benthic cystocarp exhibited rarely clear inner structure because of high maturity.
Planktonic algae found in the Wufeng and Longmaxi Formation shales have three morphological types under microscope, including amorphous organic matter (Figure 2(d)), lamellar fabrics algae (Figure 2(e)), and spherical or ellipsoidal rings algae (Figure 2(f)). Amorphous groups have no recognizable structure. Lamellar structures are near parallel fabrics with the thickness of 5–50 µm. Spherical or ellipsoidal rings are speculated to be planktonic algal cell walls due to selective preservation, in which cell contents are entirely eliminated while the outer walls that consisted of lipids are still present and had fully retained their original morphology (Traverse, 2007) (Figure 2(d)).
In addition to the algae, there are a large number of graptolites and radiolarians, and a small amount of spores, Nematothallus and animal debris. Graptolites debris always remain intact and have tabular shapes (Figure 2(g)). Radiolarians found in the Wufeng Formation and the bottom of Longmaxi Formations are about 200 µm in length and have spinous edge (Figure 2(h) and (i)). Cryptosporidium is usually considered to be produced by bryophytes (Wellman et al., 2003), and the contents of Pseudodyoadospora laevigata Johnson, 1985 (Figure 2(j)) and dichotomous cryptospore (Figure 2(k)) preserved in the Wufeng and Longmaxi Formations are very low. Nematothallus can also be observed occasionally, and they are featured by residual tabular, twisting and bending debris which are composed of interwoven filaments (Figure 2(l)).
Three bio-precursor assemblages can be grouped from bottom to top of the Wufeng and Longmaxi Formation, namely benthic algae, benthic–planktonic algae, and planktonic algae assemblages (Figure 3). Generally, benthic algae assemblage only occupies the lowest part of the section. Benthic–planktonic algae assemblage is abundant for the middle part of the section and planktonic algae domain for the upper part of the section. However, benthic algae are also found in the samples from the top of the section.
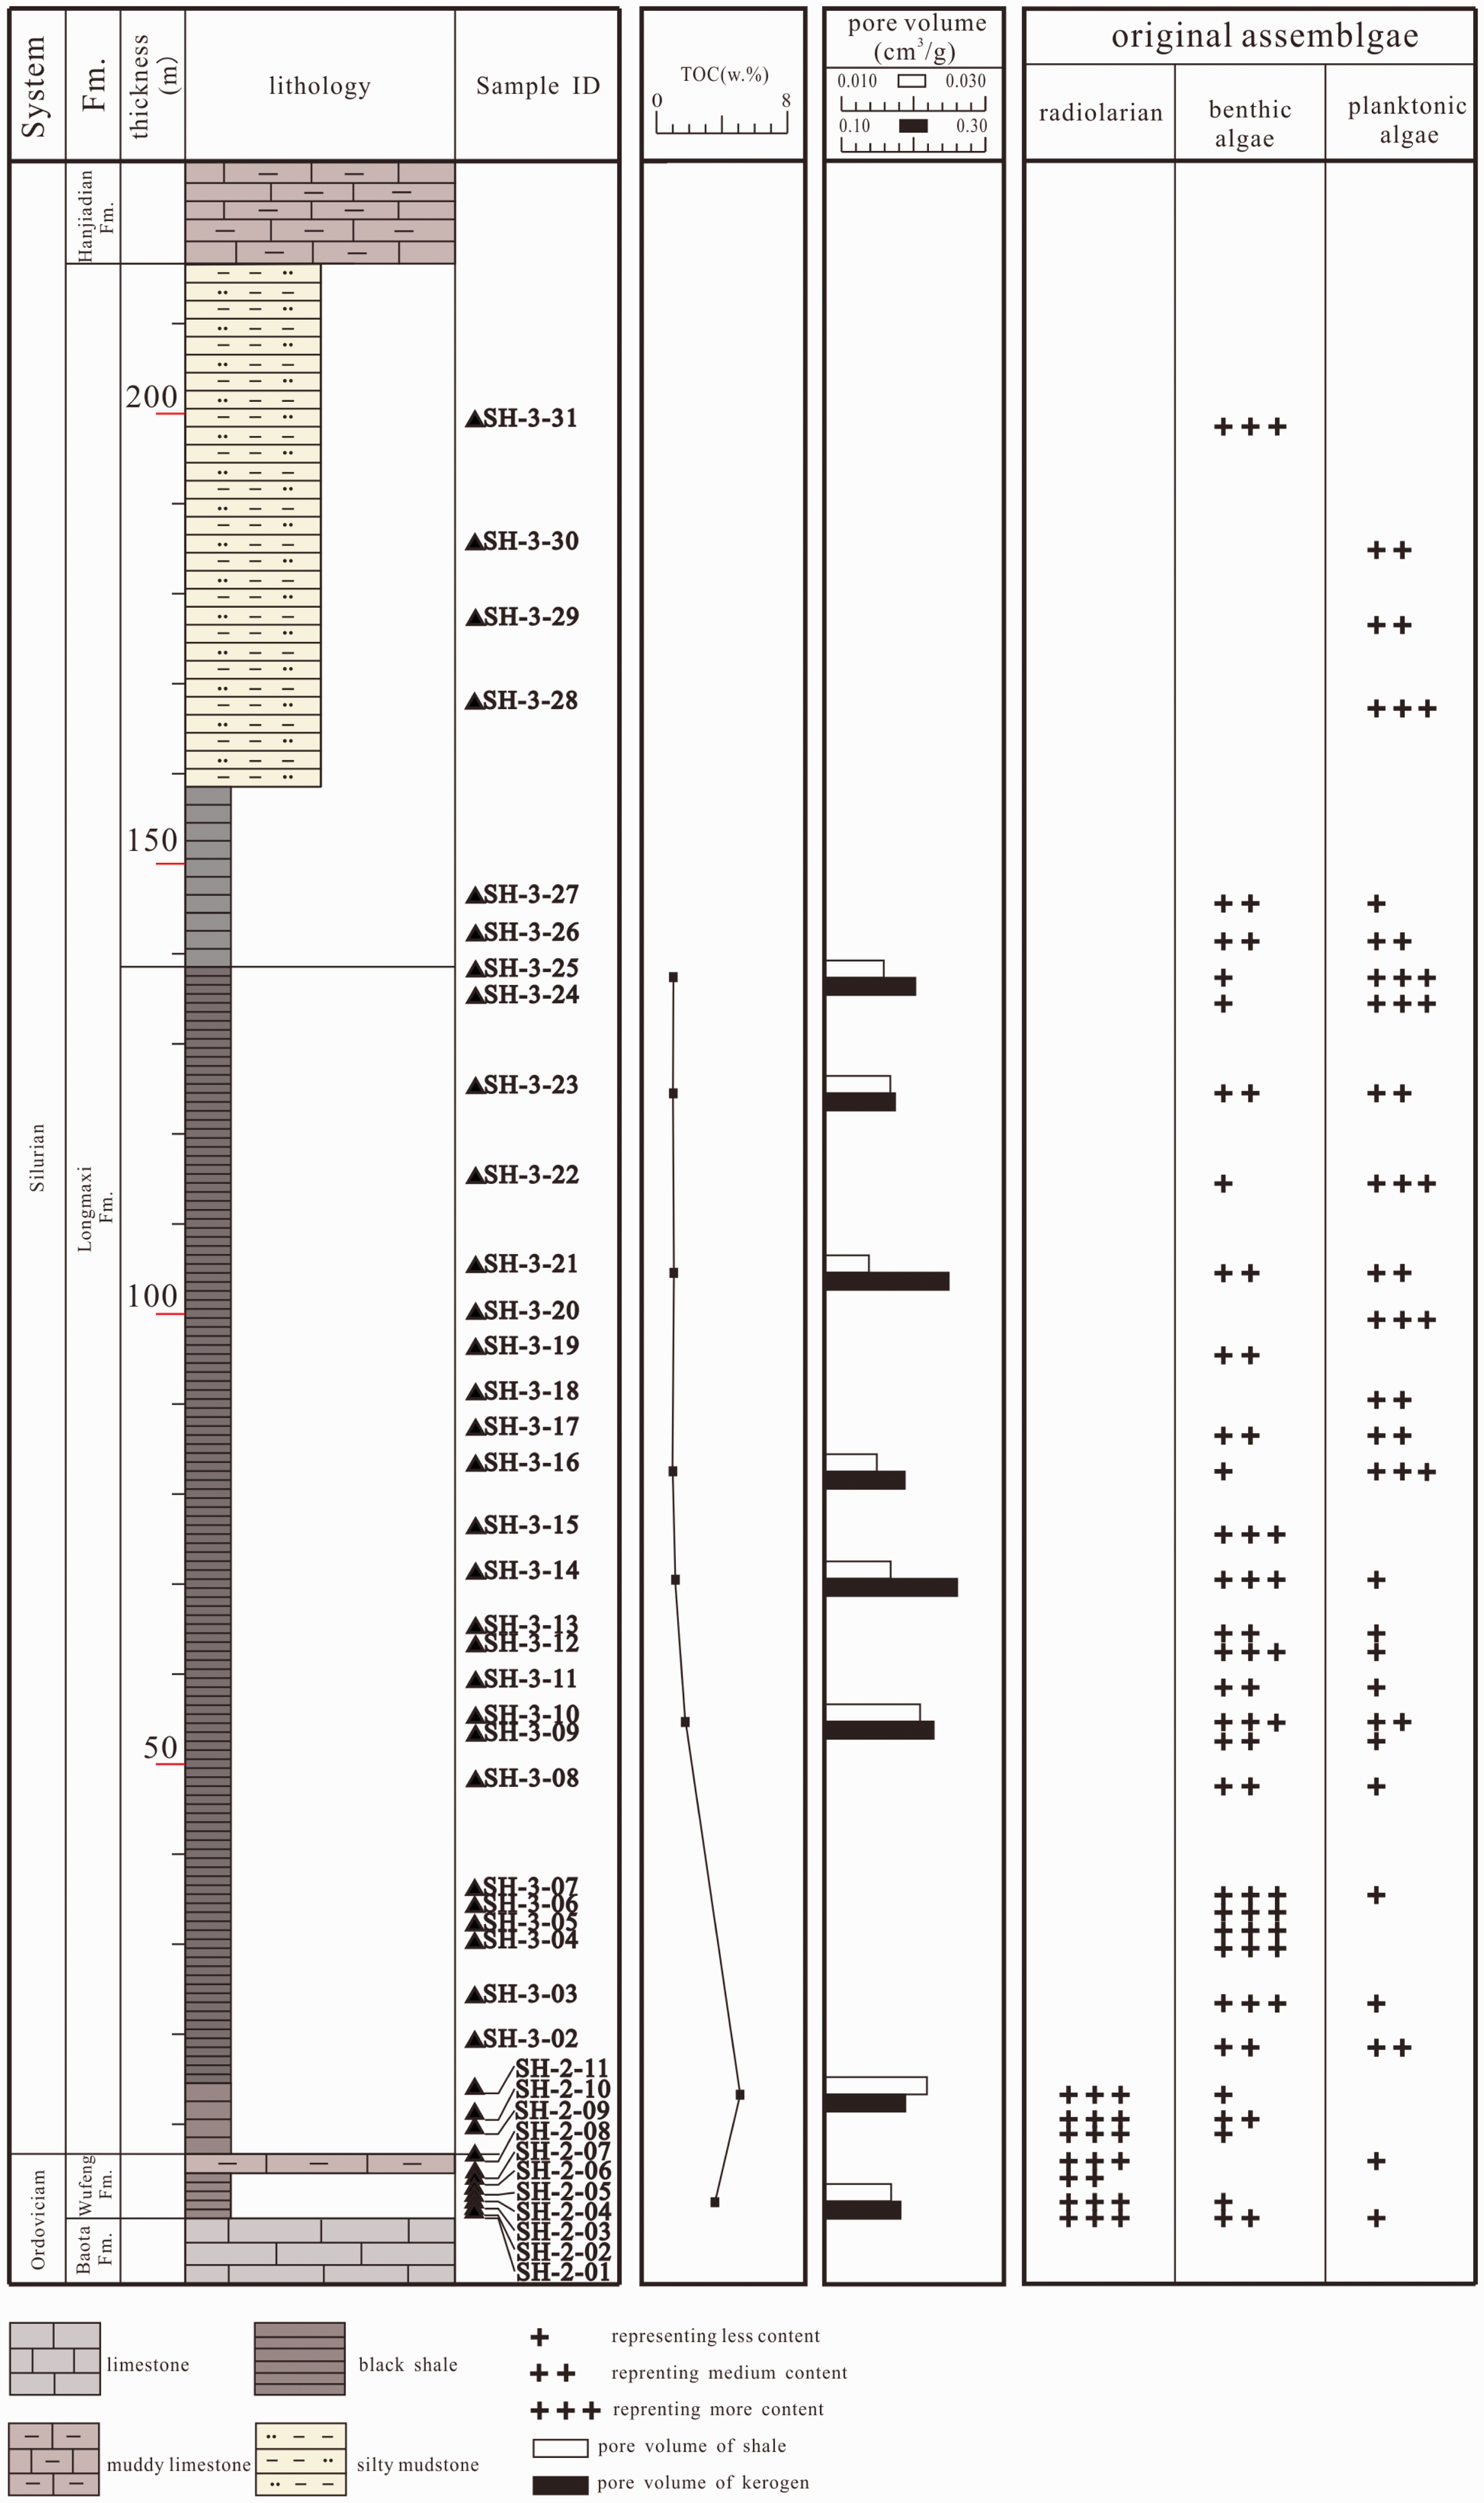
TOC, total pore volume and bio-precursors in Wufeng and Longmaxi Formations, Shuanghe Section.
Additionally, bio-precursor assemblages are clearly related with lithology. Benthic algae assemblage is dominated in the Wufeng Formation siliceous shales, benthic and planktonic algae mixture is associated with the Longmaxi Formation gray-black shales and muddy siltstone, and planktonic algae assemblage mainly is found in muddy siltstone.
TOC
The content of TOC can be affected by bio-precursors of organic matter. Liu et al. (2016) demonstrated the mudstones containing benthic algae to have higher TOC than those containing planktonic algae. On the other hand, previous works indicated TOC has important impaction on shale porosity (Cao et al., 2015; Chen et al., 2016; Milliken et al., 2013).
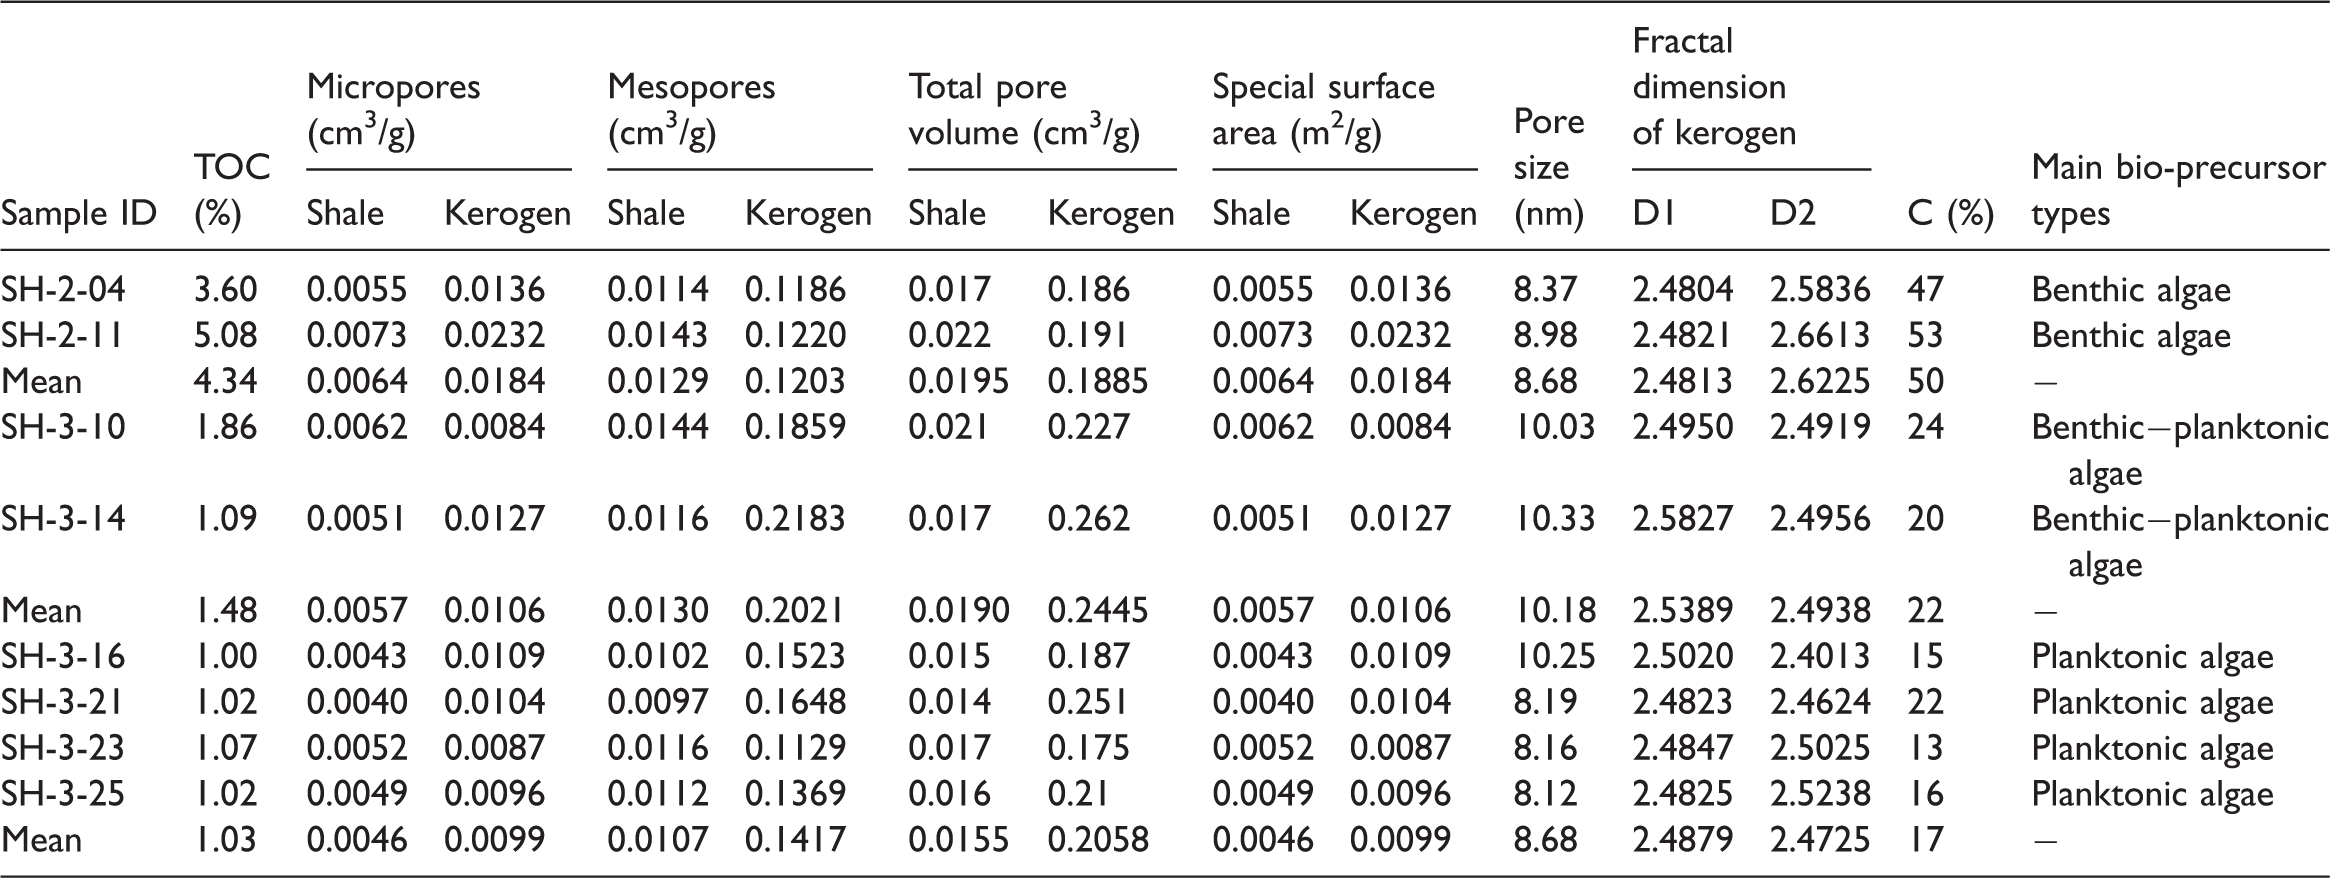
In this study, a total of eight samples were analyzed. As shown in Table 1, TOC contents range from 1.00 to 5.83% with an average of 2.88%. Generally, samples from the Wufeng Formation and lower Longmaxi Formation have higher TOC content, whereas the values of TOC from the upper part of Longmaxi Formation are relatively lower (close to 1%) (Figure 3; Table 1).
Organic pores of shales and kerogen containing different bio-precursors in Shuanghe Section.
TOC: total organic carbon.
Low-pressure nitrogen adsorption measurements
Low-pressure nitrogen adsorption measurement for shales
The adsorption and desorption curves of shales are shown in Figure 4. They are all Type VI-H3 according to the standard curves provided by the International Union of Pure and Applied Chemistry (Sing, 1985). It is indicated that pores in the Wufeng and Longmaxi Formations shales should be dominated by slit-like mesopores and micropores (Sing, 1985; Tian et al., 2015).
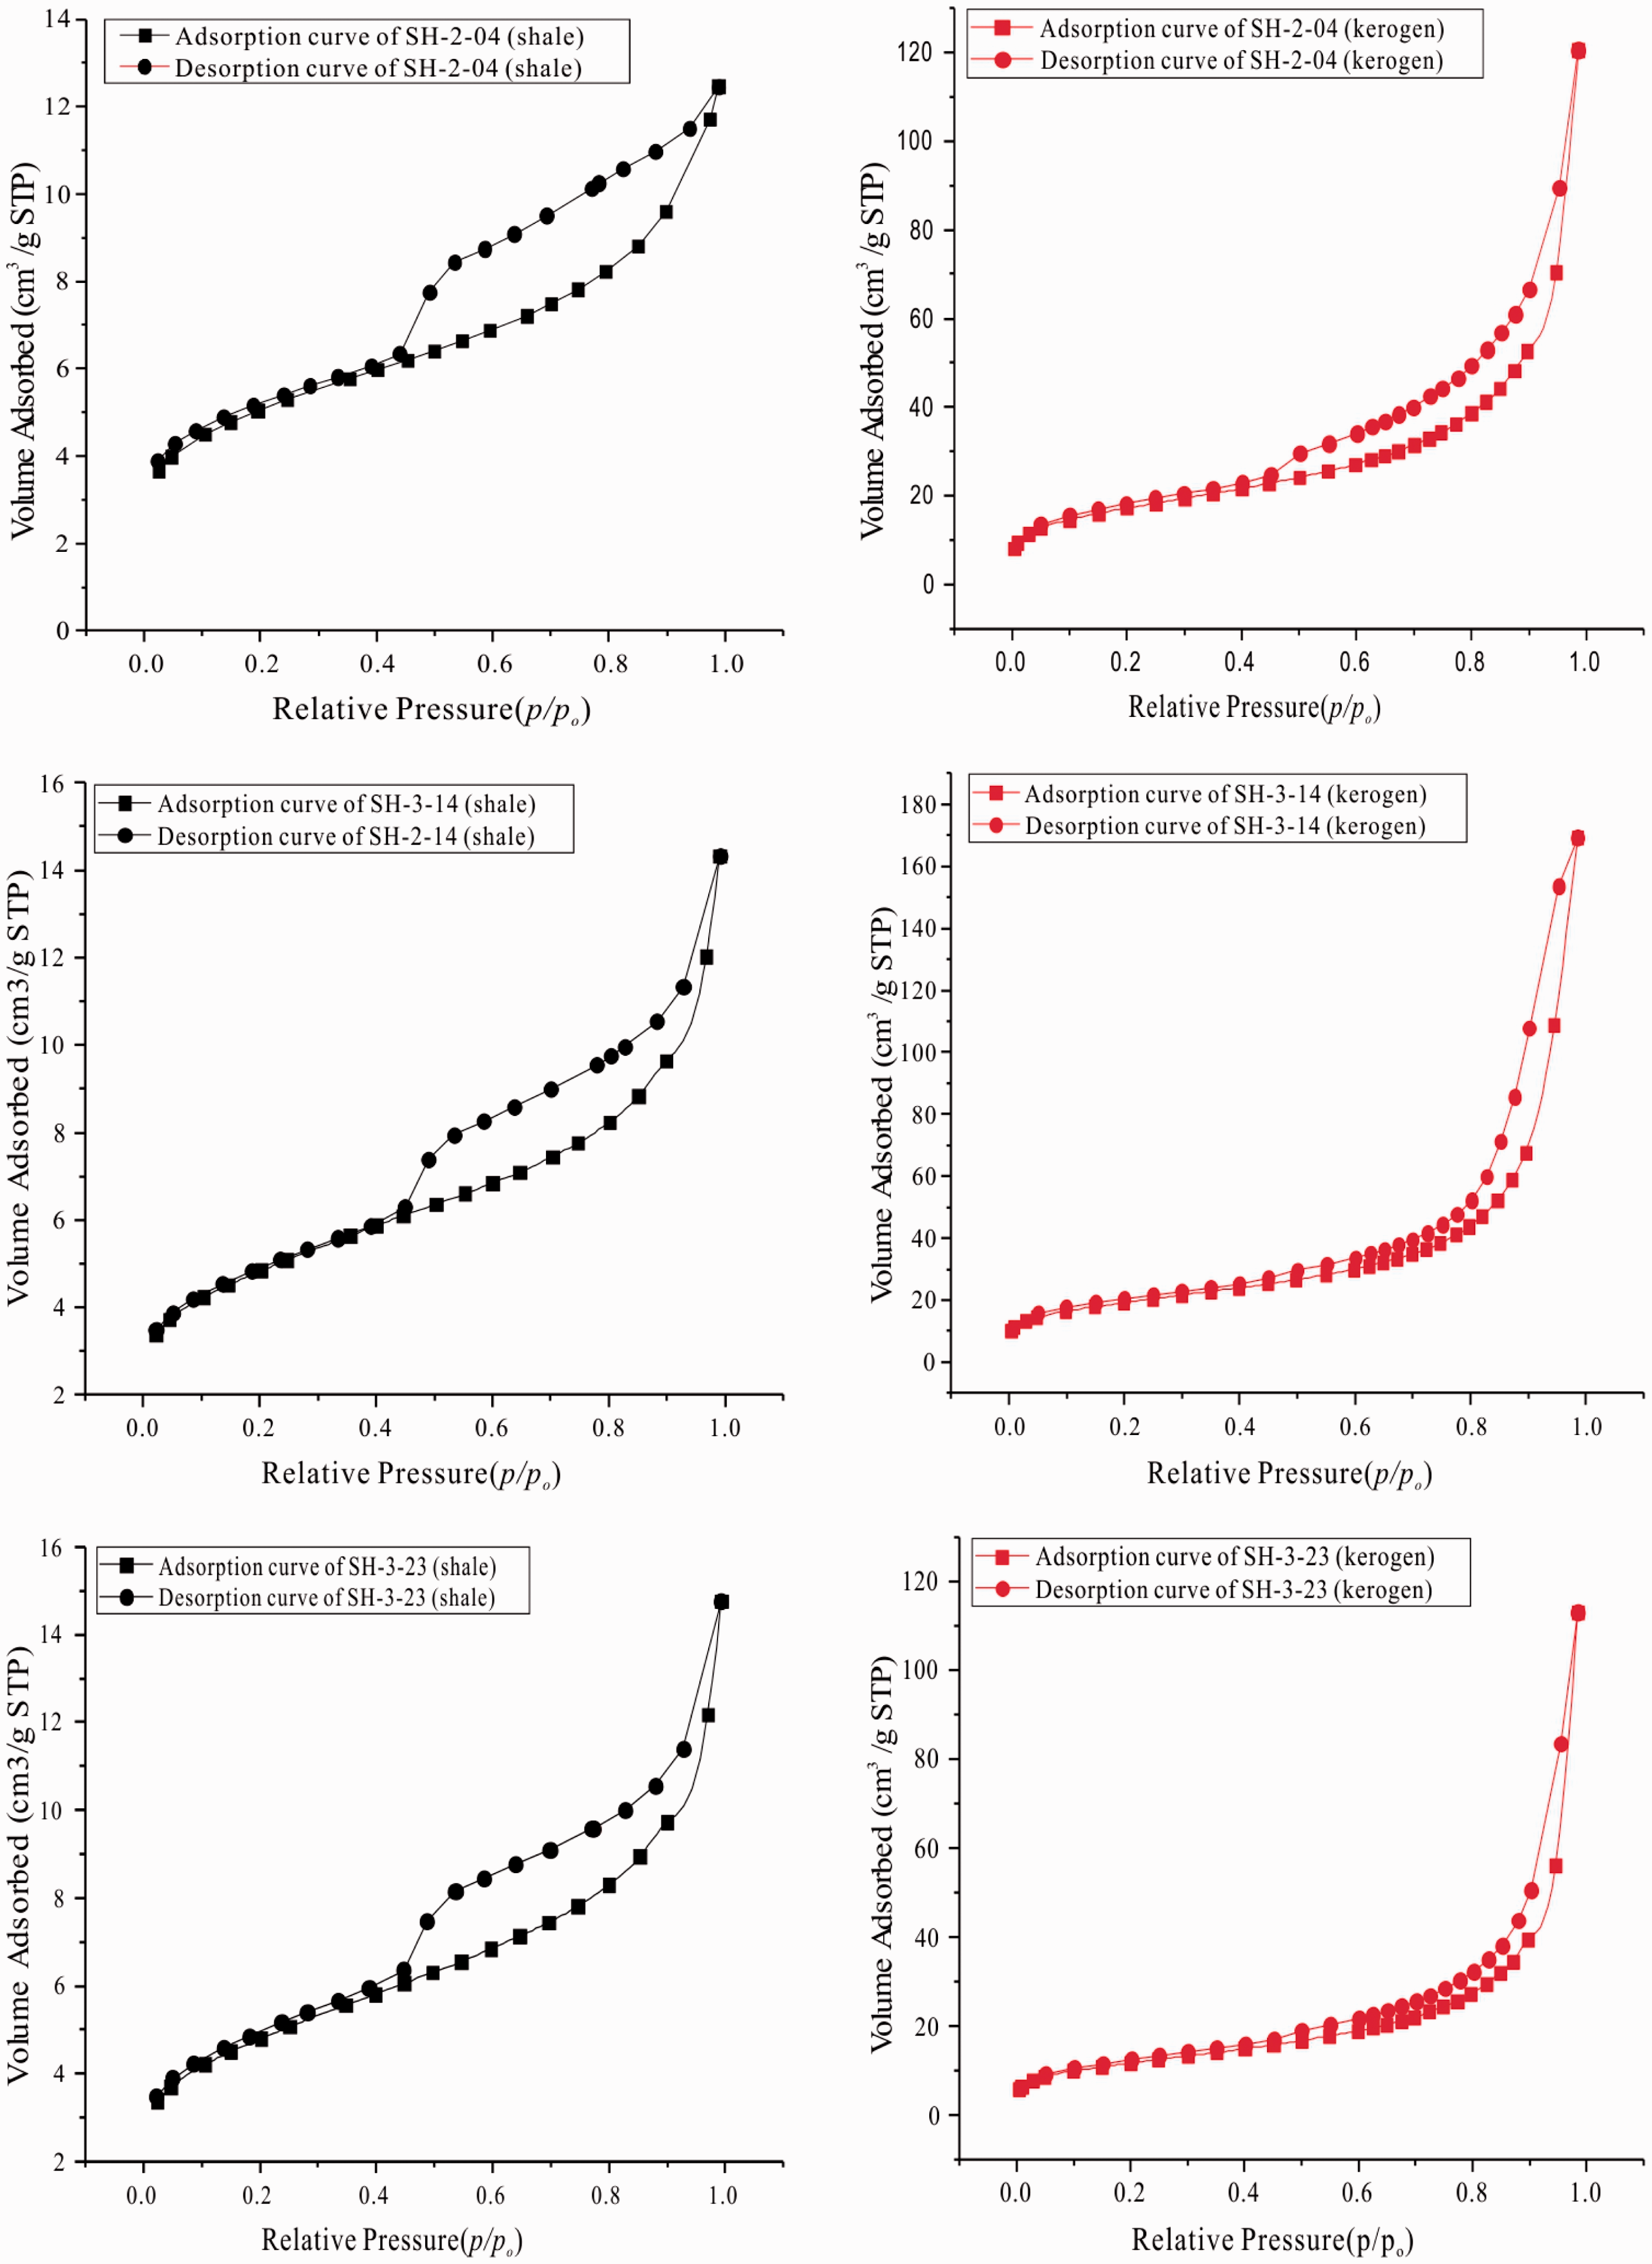
Low-temperature nitrogen adsorption−desorption curves of shale (on the left) and kerogen samples (on the right).
Specific surface area of shales is tested to be between 12.92 and 29.55 m2/g with the average of 19.98 m2/g, and pore volume in shales range from 0.014 to 0.028 cm3/g with an average of 0.0196 cm3/g. Pore size distribution of shales presents a bimodal spectrum with two peaks at the pore diameters of 0.852 and 3.385 nm, respectively (Figure 5(a) to (c)). Similar pore size distribution characteristics were also observed by Jiao et al. (2017).
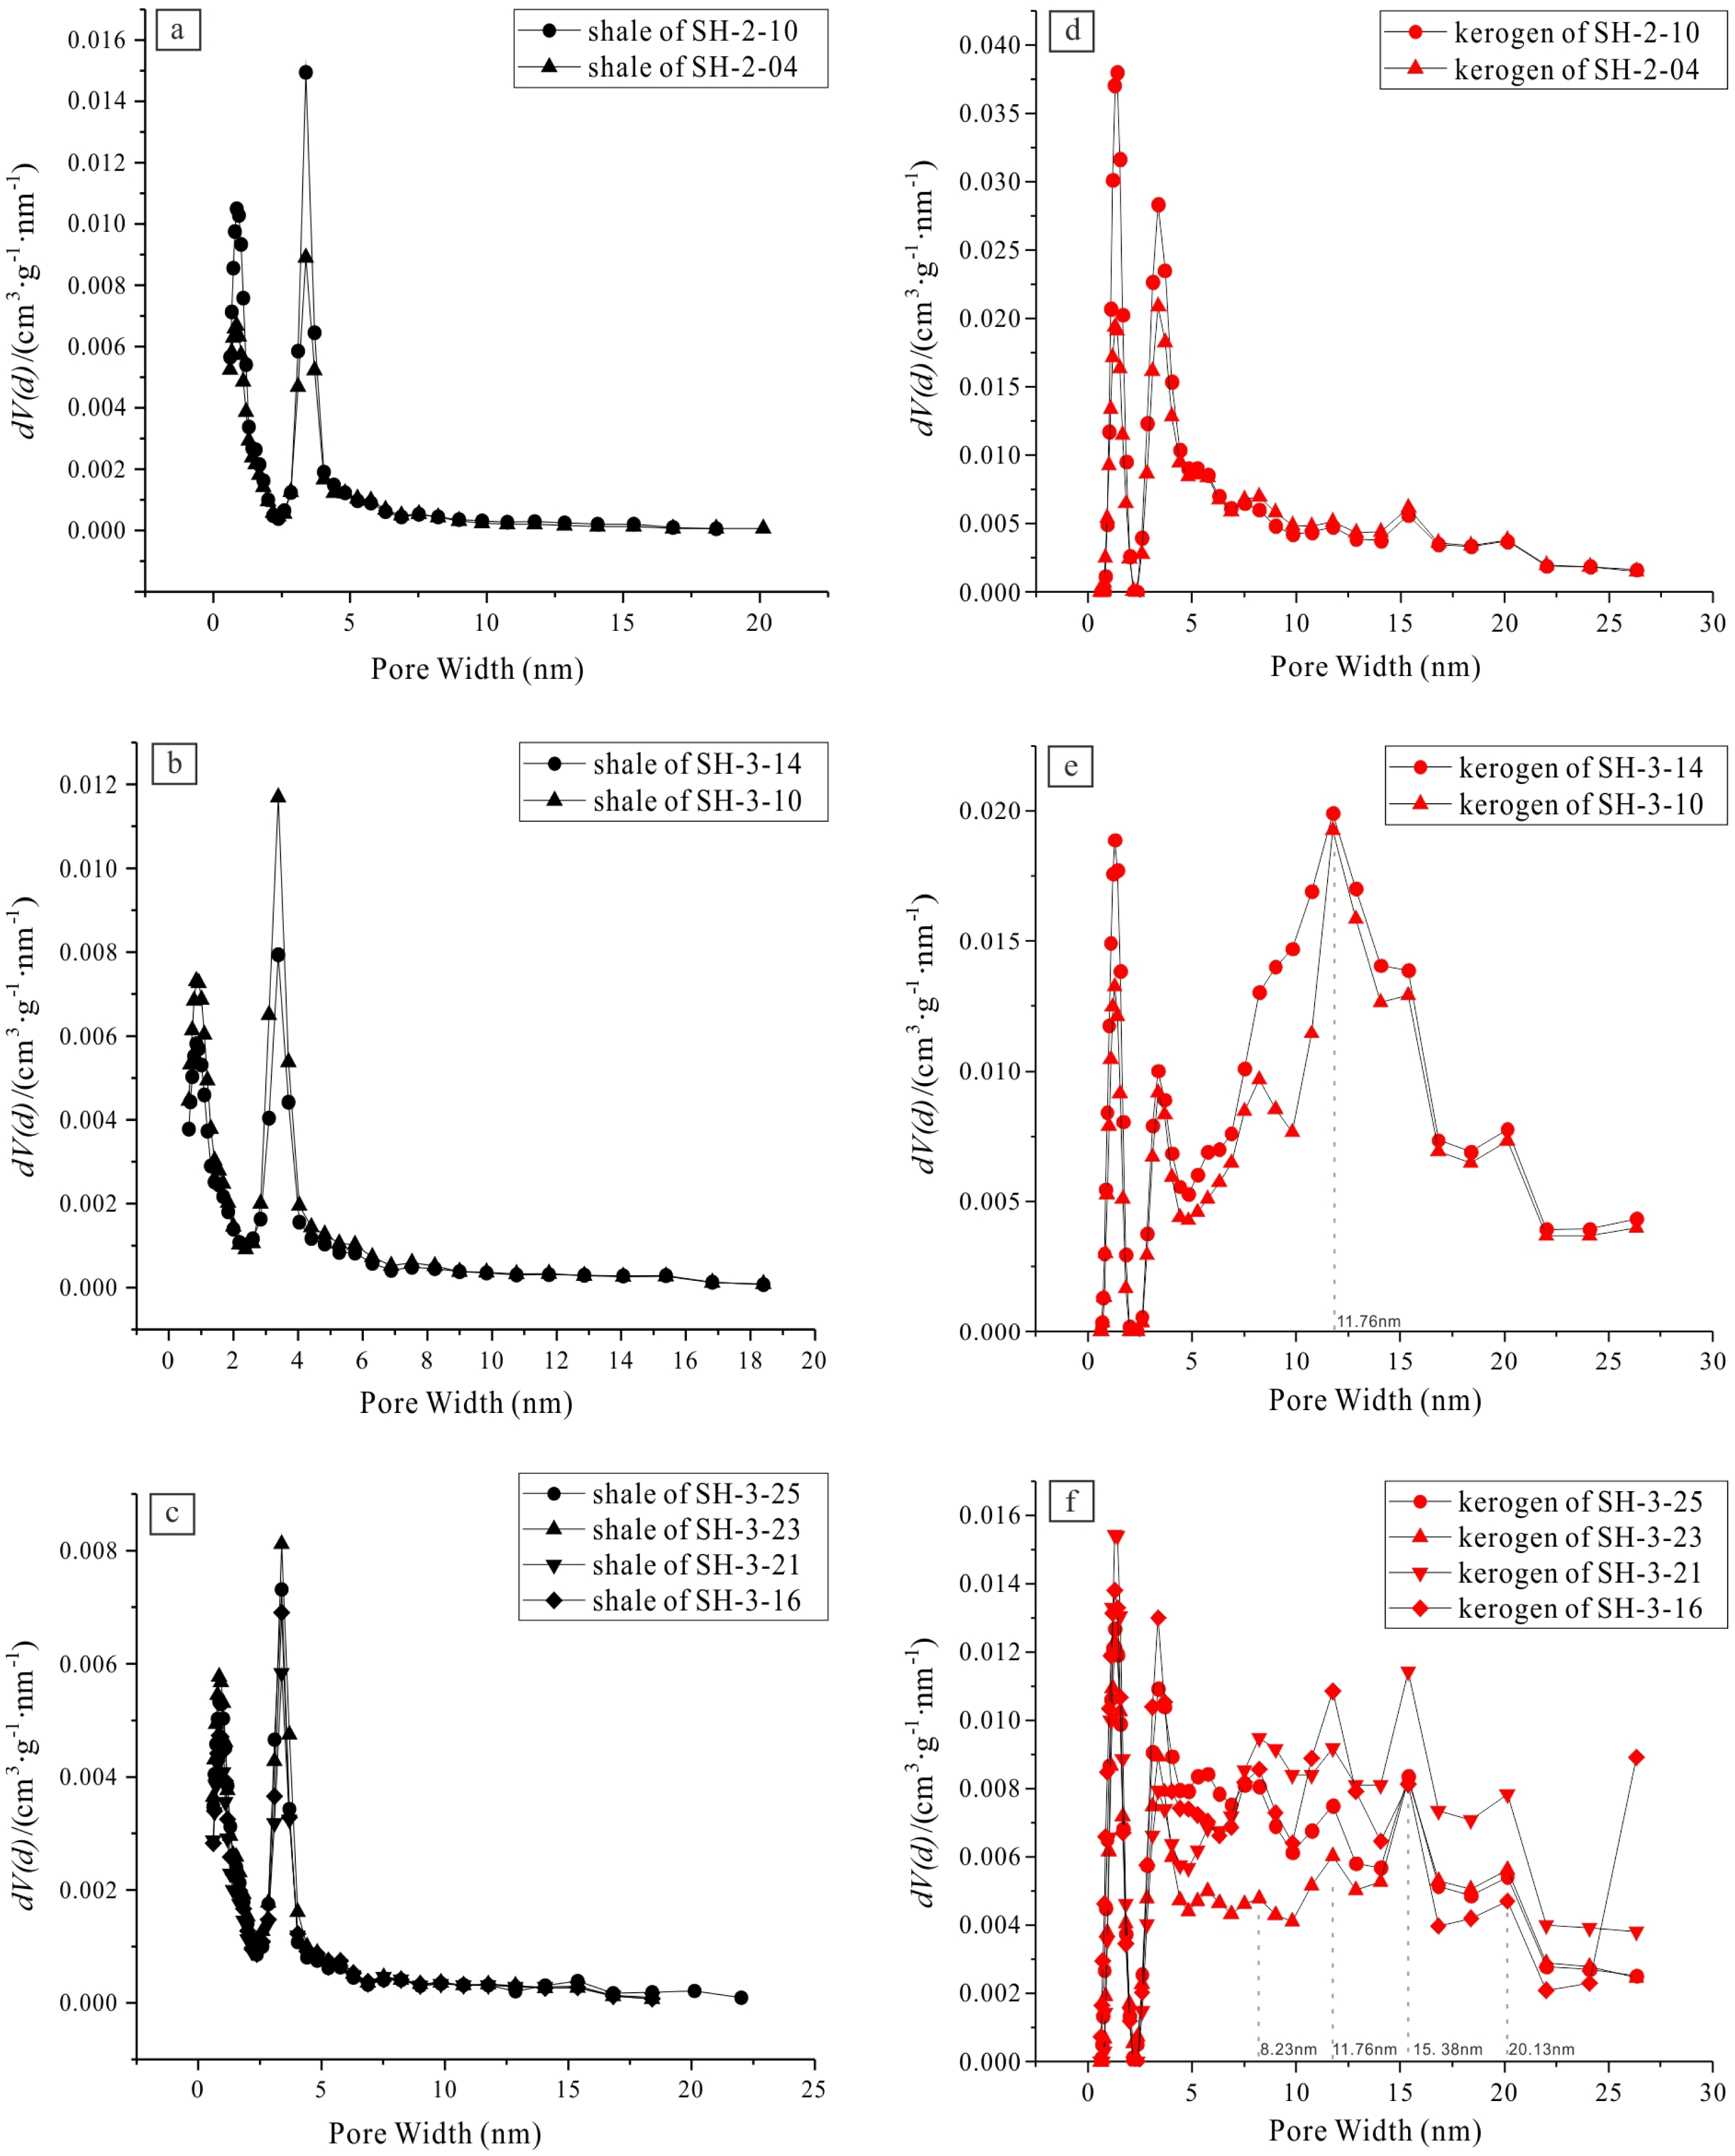
Pore size distribution of shale and kerogen samples by the DFT models. (a)–(c) The pore size distribution of shales and (d)–(f) the pore size distribution of kerogens.
Low-pressure nitrogen adsorption measurement for kerogen
From Figure 4, adsorption and desorption curves of kerogens samples are also Type VI-H3. Compared to shale, the maximum adsorption volumes of kerogens were higher than those of shales. When P/Po approached 1, it indicated that kerogen samples have higher porosity than shale samples (Zhang and Yang, 2013).
The specific surface area and pore volume of kerogen samples range from 41.46 to 80.57 m3/g and 0.175 to 0.262 cm3/g with the average values of 58.29 m3/g and 0.211 cm3/g, respectively (Table 1). The N2 adsorption curves of kerogen samples also present a bimodal spectrum when the pore size is less than 5 nm, but the pore diameters of kerogens samples are slightly larger than those in shales at the first peak (size 1.299 nm) (Figure 5(d) to (f)). However, the pore size distribution of kerogens samples can be grouped into three types when the pore size is larger than 5 nm, namely no peak type (Figure 5(d)), unimodal type (Figure 5(e)), and multimodal type (Figure 5(f)).
Discussion
Contributions of organic porosity in shales
According to the relationship between grains and pores, pores in the shale can be divided into intergranular pores, intragranular pores, and fracture pores (Loucks et al., 2012). Intergranular pores are found between mineral grains (quartz or clay), while intragranular pores are present in the organic matter grains, clay minerals, and carbonate grains. In these types of pores, the volumes of organic pores account for the largest proportion of shales (Chalmers and Bustin, 2008; Chen et al., 2017; Tang et al., 2016). In order to clarify the ratio of organic pore volume to the total pore volume (C ratio), eight samples from the Wufeng and Longmaxi Formations in Shuanghe Section were selected for low-temperature N2 adsorption experiments on shale and kerogen (Table 1). Thus, experiments on shale samples can provide information about the pore space in the shale, while those on kerogen samples can indicate organic pore space as there are rare minerals in the kerogen. Then, the C ratio can be calculated (Table 1). Generally, the ratio of organic pore volumes to the total pore volumes of the Wufeng and Longmaxi Formation ranged from 13 to 53%.
Previous statistical works based on focused ion beam scanning electron microscopy images suggested that the surface pore area within one organic grain could account for 20% of the whole single grain area (Hu et al., 2017; Tang et al., 2016). Based on microscopy images, Tian et al. (2013) also obtained the percent of organic pore range from 9.5 to 21.54% in the Wufeng and Longmaxi Formations shales (Tian et al., 2013). Their results are less than those of this study. It might be caused by insufficient amount of images or low image resolution (Milliken et al., 2013). However, linear regression of pore volume and TOC yielded a percentage of organic pores in shale of 62.6% in Wufeng and Longmaxi Formations (Tian et al., 2013), which were comparable to those in other shales such as Sigal, Mowry, and Woodford Formation shales (generally greater than 30%) (Curtis et al., 2012; Modica and Lapierre, 2012).
Although the dissolution of minerals and the extraction of chloroform asphalt “A” during preparation of kerogen samples could cause some damage to the kerogen structure so as to influence the estimation results, C ratios by low-temperature N2 adsorption experiments are proven to be reliable proxy to estimate the ratio of organic pore volumes to the total pore volumes of shales (Ji et al., 2017).
Correlation of the C ratio with bio-precursor types demonstrated that shales dominant by benthic algae have higher C ratios than those by planktonic algae, reflecting certain controlling effect of bio-precursor types on C ratios. C ratios in the benthic algae, benthic–planktonic algae, and planktonic algae are, respectively, 47 − 53% (averaging 50%), 20 − 24% (averaging 22%), and 13 − 22% (averaging 17%) (Table 1). Generally, C ratios in the shales with organic matter dominant by benthic algae are higher than those by planktonic algae, reflecting certain controlling effect of bio-precursor types on C ratios.
Effect of bio-precursors on shales porosity
Effect of bio-precursors on organic micropores
Generally, the proportion of micropores is the highest in shale and kerogen samples with benthic algae, followed by those with benthic–planktonic algae, and further followed by those with planktonic algae (Table 1). Although the micropore volume is significantly related to bio-precursor types, there can still be some other factors perplexing such relationship. The micropore volume in the shale samples is positively related to TOC with the correlation coefficient of 0.81. Similar relationships were also found for the kerogen samples (the correlation coefficient is 0.75). Recent researches indicated that the shales containing the benthic algae had higher content of TOC than those of planktonic algae (Liu et al., 2016). Therefore, the micropore volumes of kerogen positively related to the TOC content of shales imply that bio-precursors affect the development of organic micropores in shales. However, in some exceptional samples with high TOC (SH-3-10 and SH-3-14, TOC > 3.6%), their micropore volumes are negative related to the TOC content of shales (Table 1). Decrease of micropore in shales with high TOC might be caused by compaction. Generally, shales containing high TOC are more likely compacted than those containing low TOC (Milliken et al., 2013).
Although shale and kerogen samples have different volumes of micropore, they have same pore sizes at the peak of micropore volumes (Figure 5(d) to (f)). Thus, it could be inferred that bio-precursor types rarely influence the micropore size.
In general, because of the stronger compatibility of organic matter, the content of micropore volumes can be varied. However, bio-precursors can affect the micropores volumes in the shales with low TOC.
Effect of bio-precursors on organic mesopores
Although the dissolution of minerals in the preparation of kerogen samples has a significant effect on the volume and size of organic micropores, little effect is exerted on the mesopores (Liu and Peng, 2017). As indicated by the low-temperature N2 adsorption and desorption curves, both slit-shaped pores in shale and kerogen samples are slit shaped, indicating that there are no changes in terms of pore structures during the preparation of kerogen. Moreover, there are three kinds of repetitive pore size distributions, implying little influence of experimental process on mesopores (Figure 5(d) to (f)).
Except for the samples with high TOC content (SH-2-04 and SH-2-11), mesopore volumes in the shales with benthic–planktonic algae (mainly containing benthic algae) (0.0116–0.0144 cm3/g, averaging 0.0130 cm3/g) are much larger than those with planktonic algae (0.0097–0.0116 cm3/g, averaging 0.0107 cm3/g). Similarly, mesopore volumes in the kerogen with benthic algae (0.1859–0.2183 cm3/g, averaging 0.2021 cm3/g) are also larger than those with planktonic algae (0.1129–0.1648 cm3/g, averaging 0.1417 cm3/g) (Table 1; Figure 6).
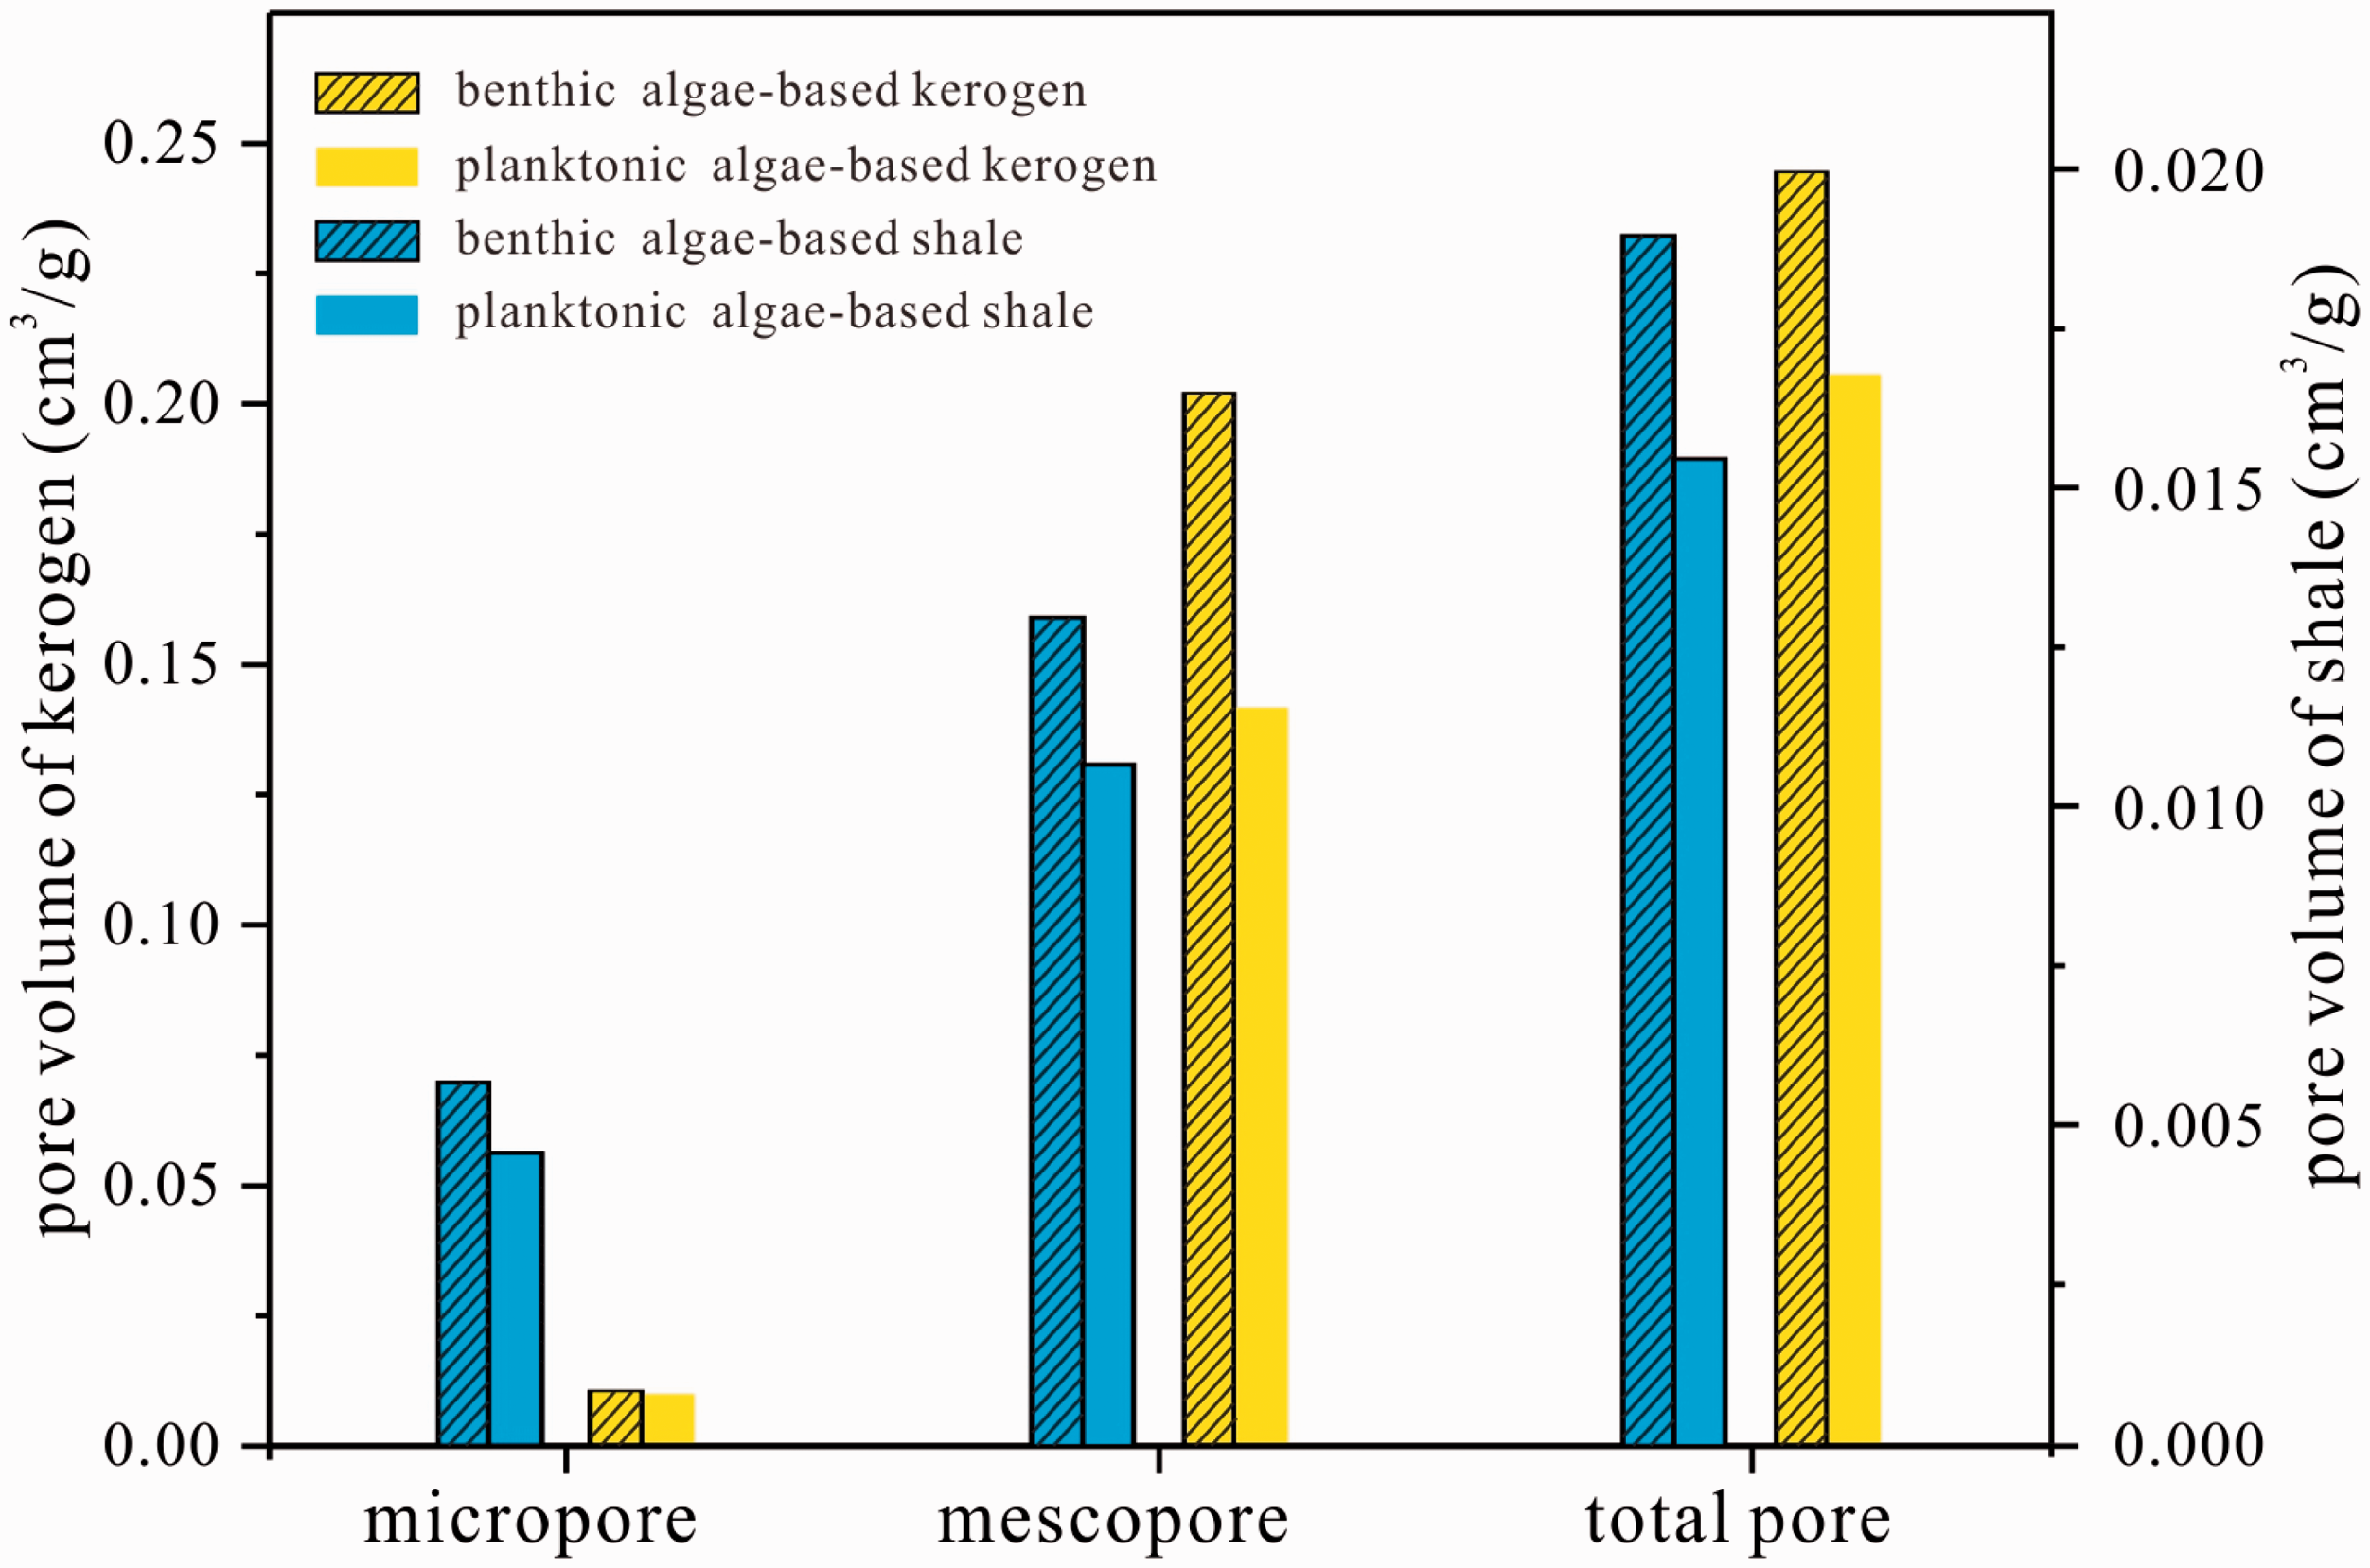
Average pore volume of different pore size distributions in kerogen and shale samples containing different bio-precursors. Micropore, mesopore, and total pore of shales and kerogens were obtained by low-temperature nitrogen adsorption.
In terms of mesopore size distribution, those in the kerogens with dominant benthic algae present unimodal characteristics (11.76 nm) in the range of 5–30 nm, while those in the kerogens with planktonic algae have several peaks (8.23, 11.76, 15.28, and 20.13 nm) (Figure 5(e) and (f)). In addition, the fractal dimension (D) can be an important parameter to quantitatively describe the pore structure and pore surface roughness (Jaroniec, 1995; Sun et al., 2015). Generally, D = 2 represents a smooth pore surface, while D = 3 represents a fairly coarse one. The fractal dimension of this study is obtained from N2 adsorption data using the FHH method (Avnir and Jaroniec, 1989; Jaroniec, 1995). The fractal dimensions, D1 and D2, are calculated with the N2 adsorption data in the two relative pressure (p/po) ranges of 0–0.45 and 0.45–1, respectively. The former range corresponds to the transition from monomolecular to multimolecular layer adsorption, while the latter range results from capillary agglomeration (Gregg and Sing, 1982). In general, the fractal dimensions (D1 and D2) in the kerogen samples with benthic algae are higher than those with planktonic algae (Table 1).
Therefore, it can be concluded that there are significant differences between shales and kerogens with benthic algae and those with planktonic algae in terms of mesopore volume and pore size distribution. Previous works indicated that kerogen type can influence the total volume, specific surface area, and pore size distribution of organic pores (Cao et al., 2015; Lu et al., 2015; Mastalerz et al., 2013; Milliken et al., 2013). For example, Lu et al. (2015) found that the content of organic pores in shales with Type II kerogen was higher than that with Type III kerogen in Cretaceous Tuscaloosa marine shale. Cao et al. (2015) showed that the Longmaxi Formation shale samples with Type II kerogen had higher specific surface areas than Niutitang Formation shales with Type I kerogen.
In fact, kerogen type is mainly related to the bio-precursor type. Studies on South China marine shale suggest that Type II1 kerogen corresponds to benthic algae, and Type II2 corresponds to fungi and bacteria, while Type I corresponds to planktonic algae (Qin et al., 2014). It can be seen that bio-precursor type might be an important factor that actually affects the development of organic pores (especially organic mesopores). Therefore, it is of great scientific significance to explore the effect bio-precursors have on the organic pore development and deepen the understanding of organic pore (especially mesopore) formation mechanisms.
The cause of bio-precursors effect on mesopore volume and size distribution
Differences in the total porosity as well as mesopore volume and mesopore size distribution of organic matter are thought to be related with bio-precursors type probably due to the influence of hydrocarbon generation process.
Under the microscope, fracture shaped and irregular pores in benthic algae fragments and cystocarps can be clearly seen (Figure 2(a) to (c)) (Loucks et al., 2009, Figure 5(c)), which are developed within the cellulose framework during the immature stage. The planktonic algae are usually a single cell or cell aggregate with fat and starch, which can be easily degraded during the kerogen formation. Therefore, there are seldom primary pores in it (Figure 2(f)). Moreover, Bao et al. (2012) found that shales dominated by benthic algae have a higher degree of aromatic ring condensation than the shales dominated by planktonic algae. Teng et al. (2017) suggested that the inertinite within the coals has higher degree of aromatic ring condensation and larger porosity and pore size than the other maceral composition. Their studies are consistent with our results that benthic algae-based shales and kerogens have larger porosity and pore size distribution than the planktonic algae-based ones. Furthermore, the shales dominated by planktonic algae have more hydrocarbon potential compared to the shales dominated by benthic algae (Qin et al., 2014). It might imply that there is less amount of residual planktonic algae, thus less primary organic pores (Figure 6).
In addition, the formation of secondary pores can also affect the preservation of primary pores. Löhr et al. (2015) showed that a large number of primary pores are preserved in the structural organic matters (such as structural alginate, Li et al., 2012). However, primary pores within spherical aggregate organic matter are disappeared in organic matter thermal alteration (Löhr et al., 2015). Analyses of transmission electron microscopy and carbon isotopes showed that the biological precursors of spherical aggregate organic matters are predominantly planktonic algae (Stasiuk, 1999). The disappearance of primary organic pores in kerogens dominated by planktonic algae might be related to the transformation of pores in the hydrocarbon generation and expulsion stages. Lower hydrocarbon potential of benthic algae results in the better preservation of primary pores in the benthic algae. Therefore, it can be concluded that the generation and preservation of primary pores in shales and kerogens dominated by benthic alga are better.
The cause of bio-precursors effect on mesopore structure
Fractal dimension is an important parameter to reflect the geometric characteristics of shale pores. The value can be influence by micropore volume, TOC, pore size, and pore surface roughness (Liu et al., 2015; Yang et al., 2014). A large number of studies have shown that the shale pore size was negatively related with fractal dimension, while micropore volume is positively related with it (Liu et al., 2015; Yang et al., 2014). However, this study demonstrates that the samples with higher fractal dimensions are featured by larger organic pores and less micropore volumes.
According to the relationship between fractal dimensions and bio-precursors, D1 and D2 of benthic algae-based kerogen samples (SH-3-10 and SH-3-14) are, respectively, in the range of 2.4950–2.5827 and 2.4919–2.4956. As for the planktonic algae-based kerogens (SH-3-16 to SH-3-25), D1 and D2 are, respectively, in the range of 2.4823–2.5020 and 2.4013–2.5238 (Table 1; Figure 7). Therefore, it is inferred that organism types can be one important factor to affect the fractal dimension of organic pores. That is, the value of D in benthic algae-based kerogens should be larger than in planktonic algae-based kerogens.
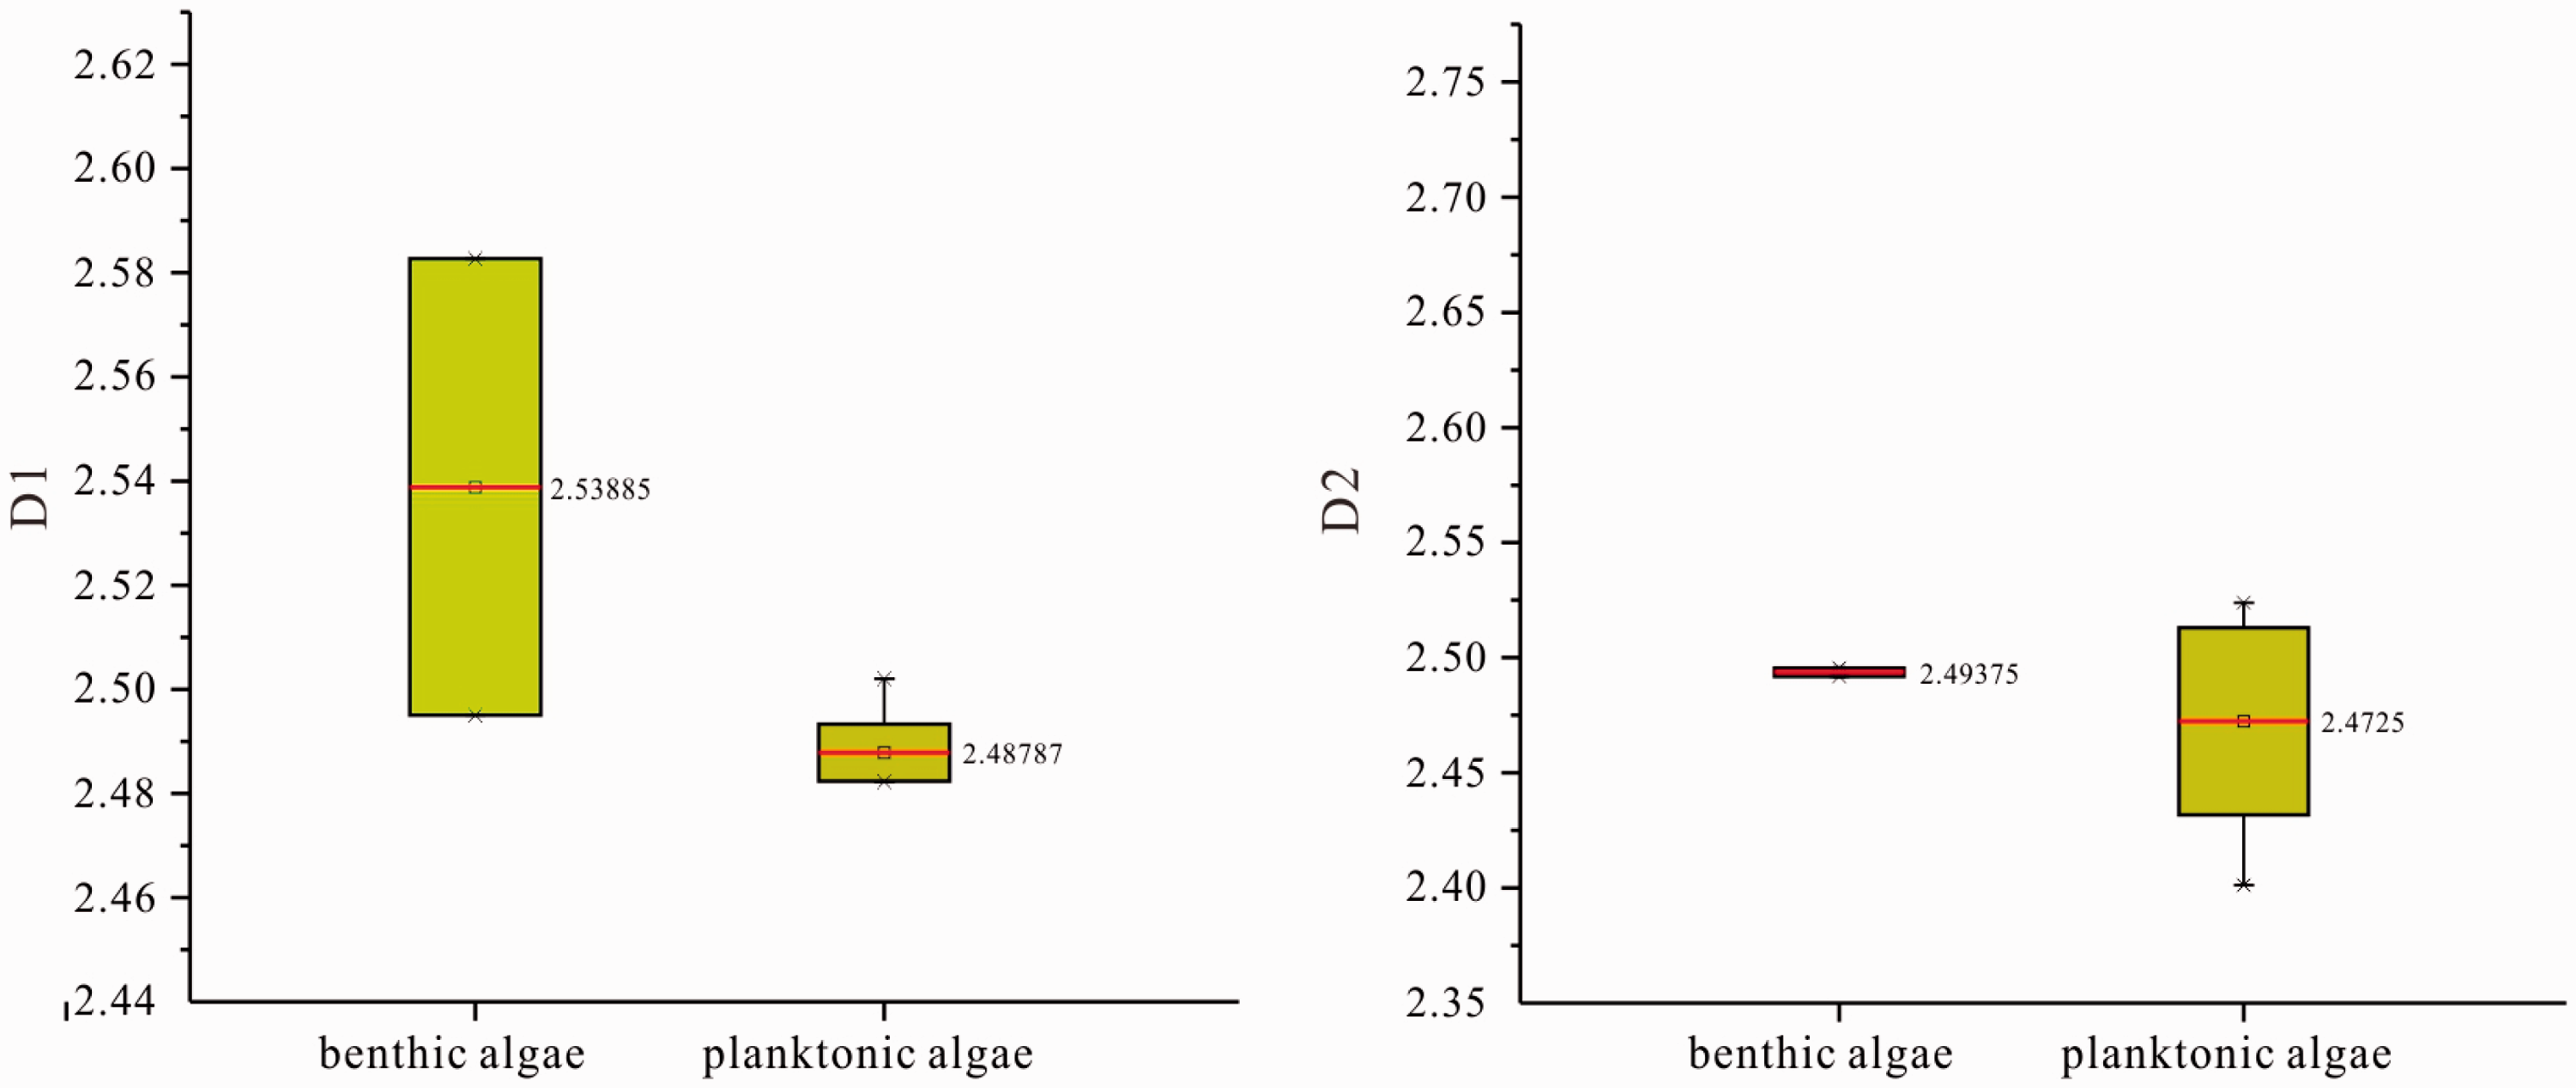
Box plots of kerogens containing different bio-precursor assemblages with D1 and D2. D1 and D2 represent the values of fractal dimensions obtained by FHH method. The red line indicates the mean value.
The effect of organism types on the fractal dimension of organic pores might be also reflected in the difference of primary porosities. As discussed above, the total pore volume and the preservation of rough primary pores are better in the benthic algae-based shale and kerogen samples (Figure 2(a) and (b)). In contrast, primary pores in planktonic algae-based shales and kerogens are usually not preserved (Löhr et al., 2015), and abundant circular and ellipsoidal pore forms during the extensive hydrocarbon generation process were preserved (Curtis et al., 2012; Yang et al., 2016). Therefore, the fractal dimension of organic pore in the benthic algae-based shales and kerogens should be larger than that in the planktonic algae-based ones.
Conclusion
Three bio-precursor assemblages are developed from bottom to top in the Wufeng and Longmaxi Formations, namely benthic algae, benthic–planktonic algae, and planktonic algae assemblages. Pore volumes of shales and kerogens calculated from N2 adsorption isotherms indicate that the pore volume in the kerogen accounted for 13–53% of the total pore volume of shale, and organic pores might be the major contributor to shale porosity. Shales containing benthic algae have higher total pore volumes, larger mesopores proportion, and rougher pore morphology than those containing planktonic algae. The pore size distributions of the shales containing benthic algae and planktonic algae are unimodal and multimodal, respectively. Bio-precursor assemblages might be responsible for these distinctive differences in organic pores in shales.
Footnotes
Acknowledgements
We would like to thank Prof. Jian Cao and an anonymous reviewer for constructive reviews. Senior engineer Feng Lin and the experimenter Meimei Han are thanked for help in the kerogen analysis experiments.
Declaration of conflicting interests
The author(s) declared no potential conflicts of interest with respect to the research, authorship, and/or publication of this article.
Funding
The author(s) disclosed receipt of the following financial support for the research, authorship, and/or publication of this article: This study was jointly funded by CNPC Innovation Foundation (2016D-5007-0102), Education Office of Sichuan Province of Unconventional Oil & Gas Program, the National Natural Science Foundation of China (Grant No. 41572119), and “the mechanism of hydrocarbon generation and expulsion and resource evaluation in the marine facies strata in the Sichuan Basin”(Grant No. P16079).