
Abstract
Diffusion ability is an important indicator of shale gas reservoir quality. In this paper, the diffusion coefficient of the Longmaxi Formation is measured via the free hydrocarbon concentration method, and the diffusion ability, influencing factors, and seepage flow are discussed. Results show that the diffusion coefficient of the Longmaxi Formation is between 1.23 × 10⁻⁵ and 2.98 × 10⁻⁵ cm2 s−1 with an average value of 2.19 × 10⁻⁵ cm2 s−1 (confining pressure 3.0 MPa). The diffusion coefficient is calculated for various pressures using an empirical formula (D = 0.339K0.67/M0.5) and experimentally measured data. The estimated, temperature-corrected diffusion coefficient of the Longmaxi Formation is 3.94 × 10⁻⁶–7.24 × 10⁻⁶ cm2 s−1 with an average value of 5.28 × 10⁻⁶ cm2 s−1 for depths from 1000 to 3000 m (confining pressure 16.7–39.7 MPa). The diffusion coefficient increases with increasing depth of the reservoir due to the changes in pressure and temperature. Fitting parameters show that the porosity of the reservoir and clay minerals is positively correlated with the diffusion coefficient, and the diffusion coefficient is also related to factors such as total organic carbon and the maximum reflectance of vitrinite (Ro). The diffusion flow rate is 0.177–0.204 m3 d−1 with an average of 0.182 m3 d−1. Linear seepage flow is 4.95 × 10⁻⁴–14.29 × 10⁻⁴ m3 d−1 with an average of 8.87 × 10⁻⁴ m3 d−1, calculated from the diffusion coefficient and permeability per unit flow. These results indicate that the migration of shale gas in the deep region of the reservoir is mainly by diffusion. Therefore, diffusion is an important shale gas flow mechanism.
Keywords
Introduction
Generally, shale gas reservoirs have poor porosity and low permeability due to the development of micropores (Wang et al., 2016). Gas desorption–diffusion is a fundamental mechanism of the shale gas production process. Evaluation of gas diffusion ability is an important parameter for predicting productivity and development of shale gas wells (Li et al., 2016b). Therefore, shale diffusion is an important indicator of shale gas reservoir quality and is commonly measured by a diffusion coefficient.
Shale gas is essentially “natural gas” stored in shale. Therefore, diffusivity studies of shale gas can be used for reference to study the diffusion of natural gas in the reservoir. Determination of the diffusion coefficient is the basis for the study of reservoir diffusion capacity. Calculation of the diffusion coefficient of natural gas in the reservoir includes experimental determination of the diffusion coefficient, simulation calculation, and empirical formula calculation. Other methods to study reservoir diffusion capacity include examination of the relationship between diffusion coefficient and geological parameters, and the evaluation of natural gas diffusion (Bashar and Tellam, 2011; Krooss and Leythaeuser, 1988; Krooss and Schaefer, 1987; Takeda et al., 2011). In addition, there are other ways to evaluate diffusion capacity such as diffusion activation energy and diffusion rate coefficient. The diffusion activation energy gives the relationship between energy and diffusion coefficient based on molecular dynamics (Eyring, 1936; Krooss et al., 1986). Diffusion rate coefficient refers to the speed of diffusion, and diffusion efficiency refers to the cumulative diffusion ratio of gas to the original gas saturation (Li et al., 2016b).
There has been significant development of shale gas in the Sichuan Basin (Chen et al., 2014; Guo and Zeng, 2015; Huang et al., 2015; Jiang et al., 2016; Zhang et al., 2015). However, diffusion in shale reservoir has been less studied (Li et al., 2016b). In this work, we use the free hydrocarbon concentration method to test samples of the Longmaxi Formation in Shizhu area of the southern Sichuan basin to simulate the diffusion behavior of shale gas in the reservoir and examine the dark shale diffusion coefficient. The diffusion coefficient is calculated for the actual formation according to fitting and empirical formulas. The diffusion coefficient and permeability are calculated to obtain the daily flow. The diffusion flow rate and the linear seepage flow rate are calculated, and the contribution to the seepage process is also examined.
Samples and methodology
Samples and geological background
Samples were collected from the Qiliao profile in Shizhu area in the southern Sichuan basin (Figure 1). The profile is located in the high and steep structures in East Sichuan area, Shizhu synclinore eastern margin, Qiyueshan anticline core complex, in the southern Sichuan basin. The Longmaxi shale is 500–600 m thick, composed of gray and dark gray shale, and contains a high content of total organic carbon (TOC). Source rock thickness is more than 100 m (Fu et al., 2013). The regional depositional environment is a deep shelf environment (Wang et al., 2015b). TOC of the shale is between 1.73 and 6.63%, with an average of 3.63%, and quartz content is between 38.0 and 48.0%. Clay mineral content ranges from 38.0 to 49.0% with an average of 43.5%. The value of Ro (maximum reflectance of vitrinite) ranges from 2.18 to 3.61%, indicating maturity of organic matter (Fu et al., 2013).
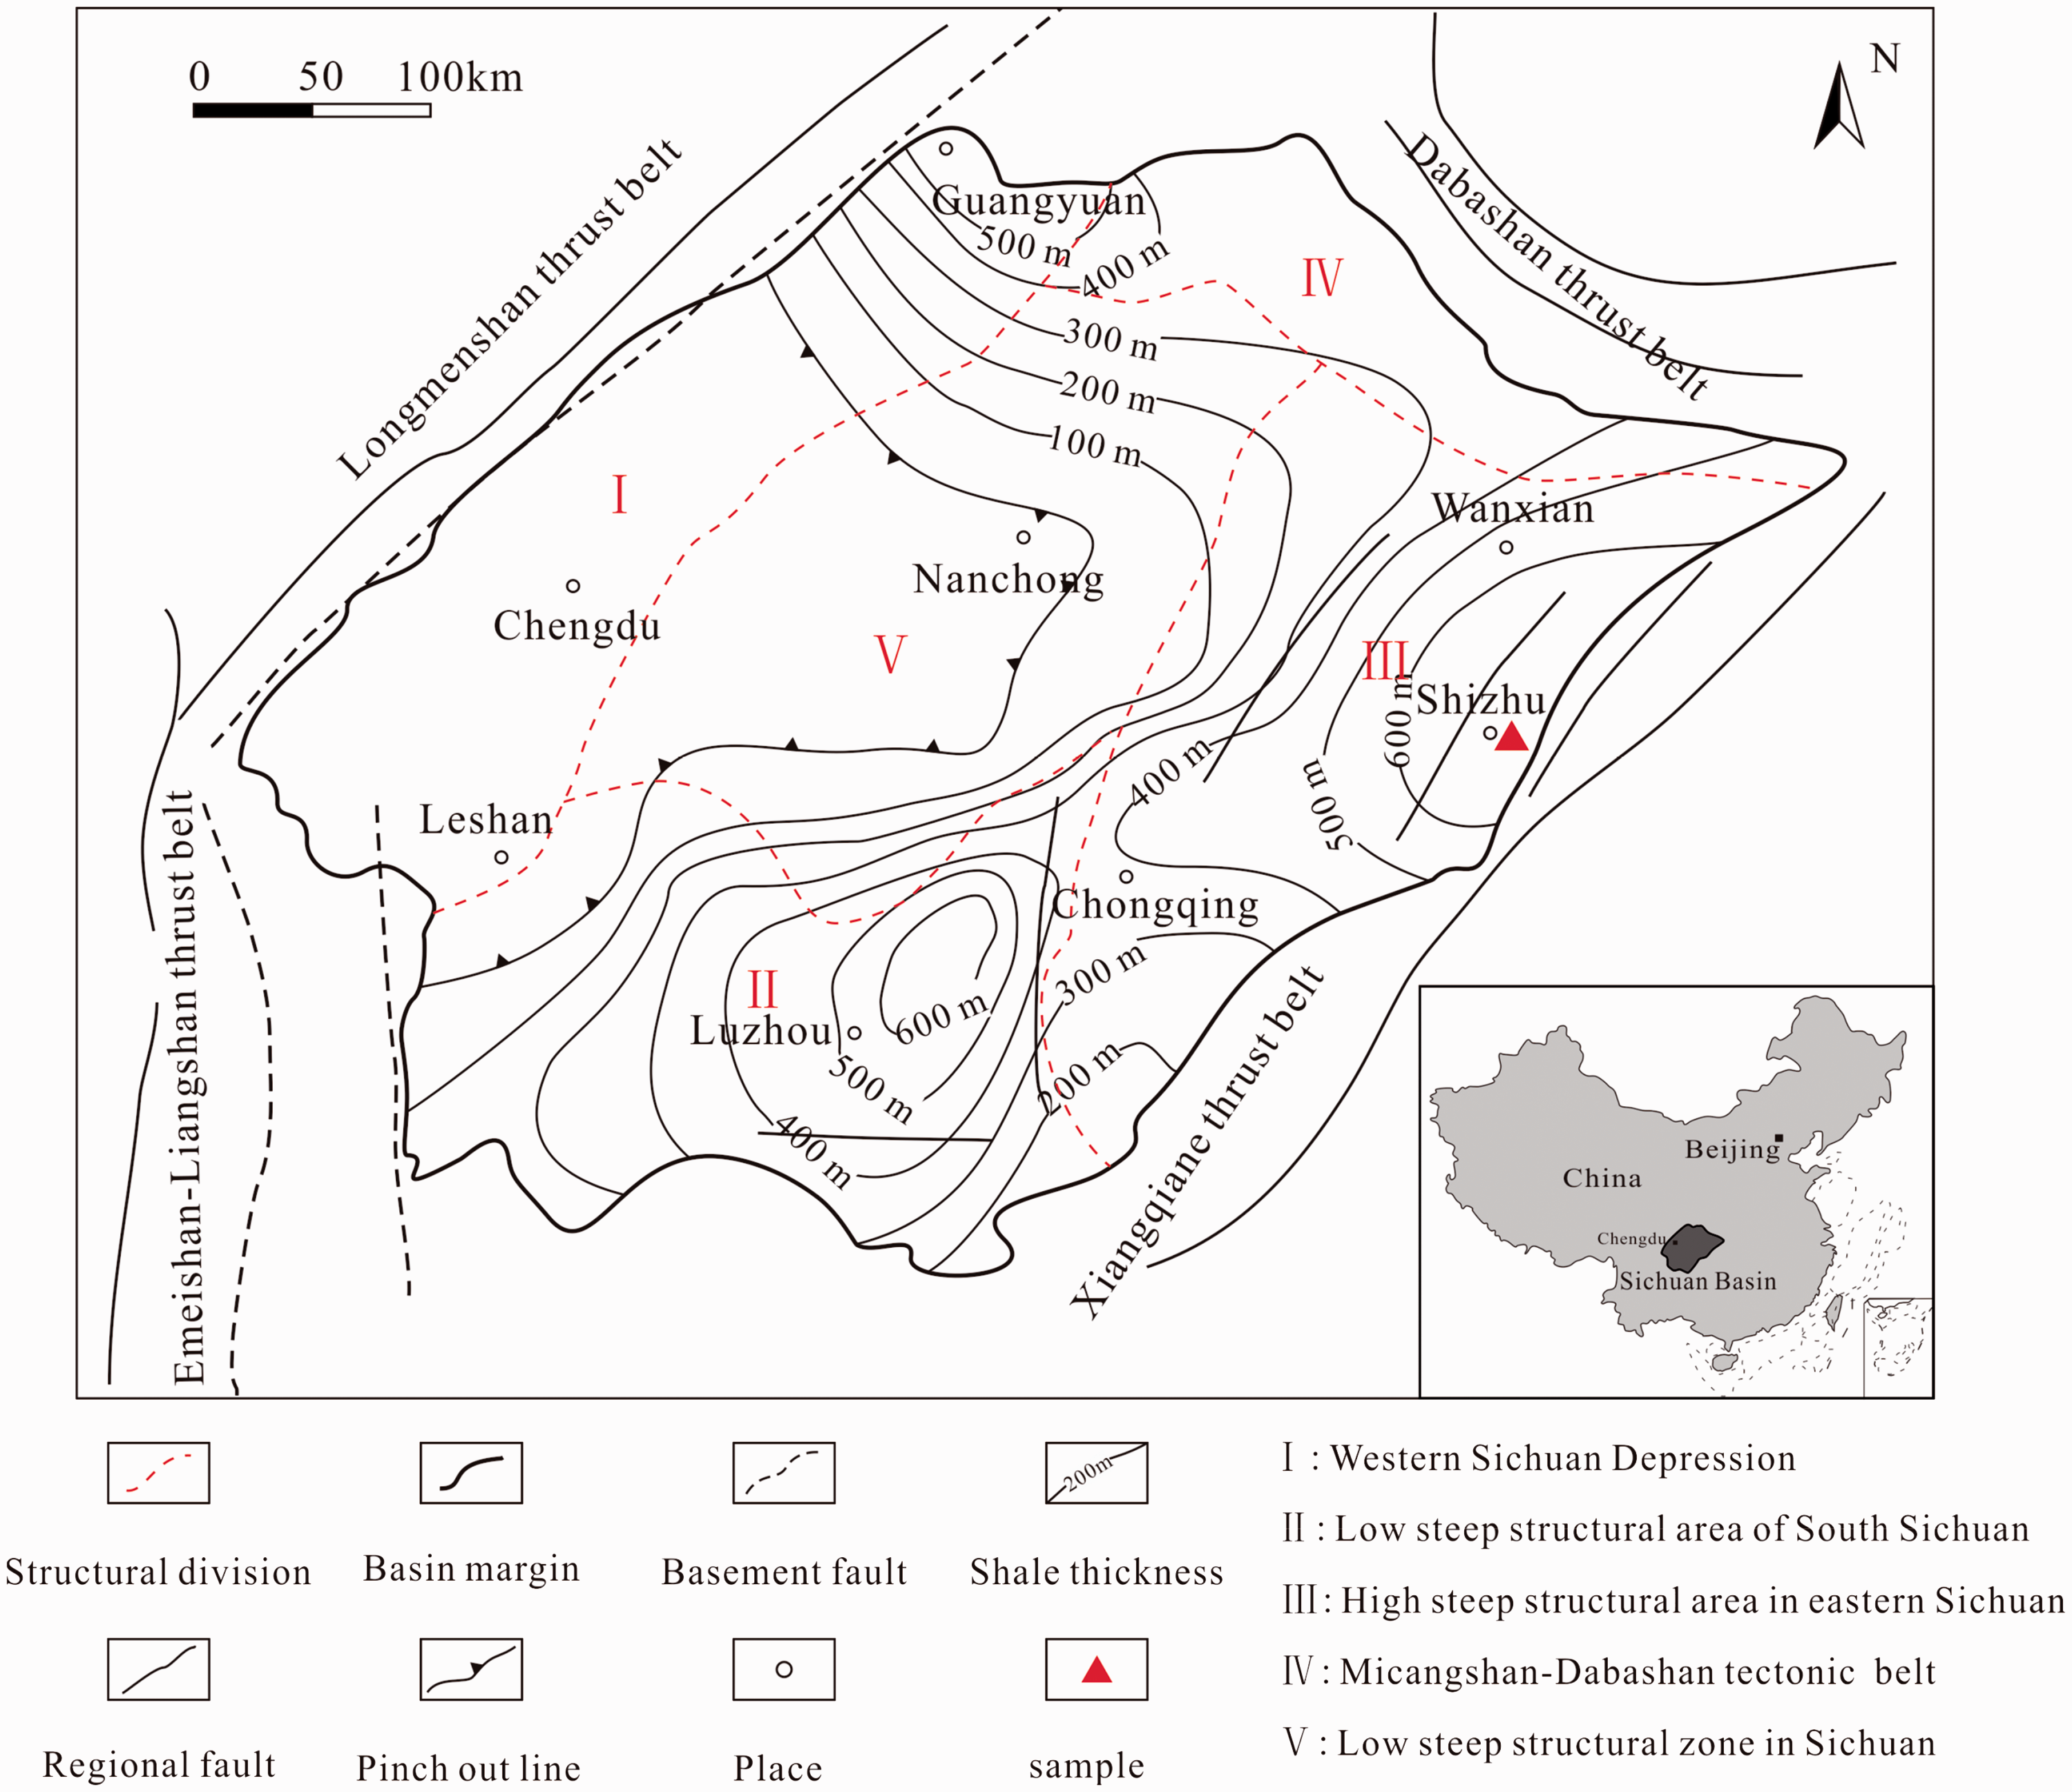
Tectonic and sedimental framework of Sichuan basin, China.
Samples were numbered from bottom to top as QL-6, QL-8, QL-14, and QL-18. Samples were homogeneous and without visible cracks (Figure 2). Samples were selected by geological parameters that conform to the national standard DZ/T 0254–2014 (2014) (TOC ≥ 1.0%, brittle mineral ≥ 30%, Ro ≥ 0.7%).
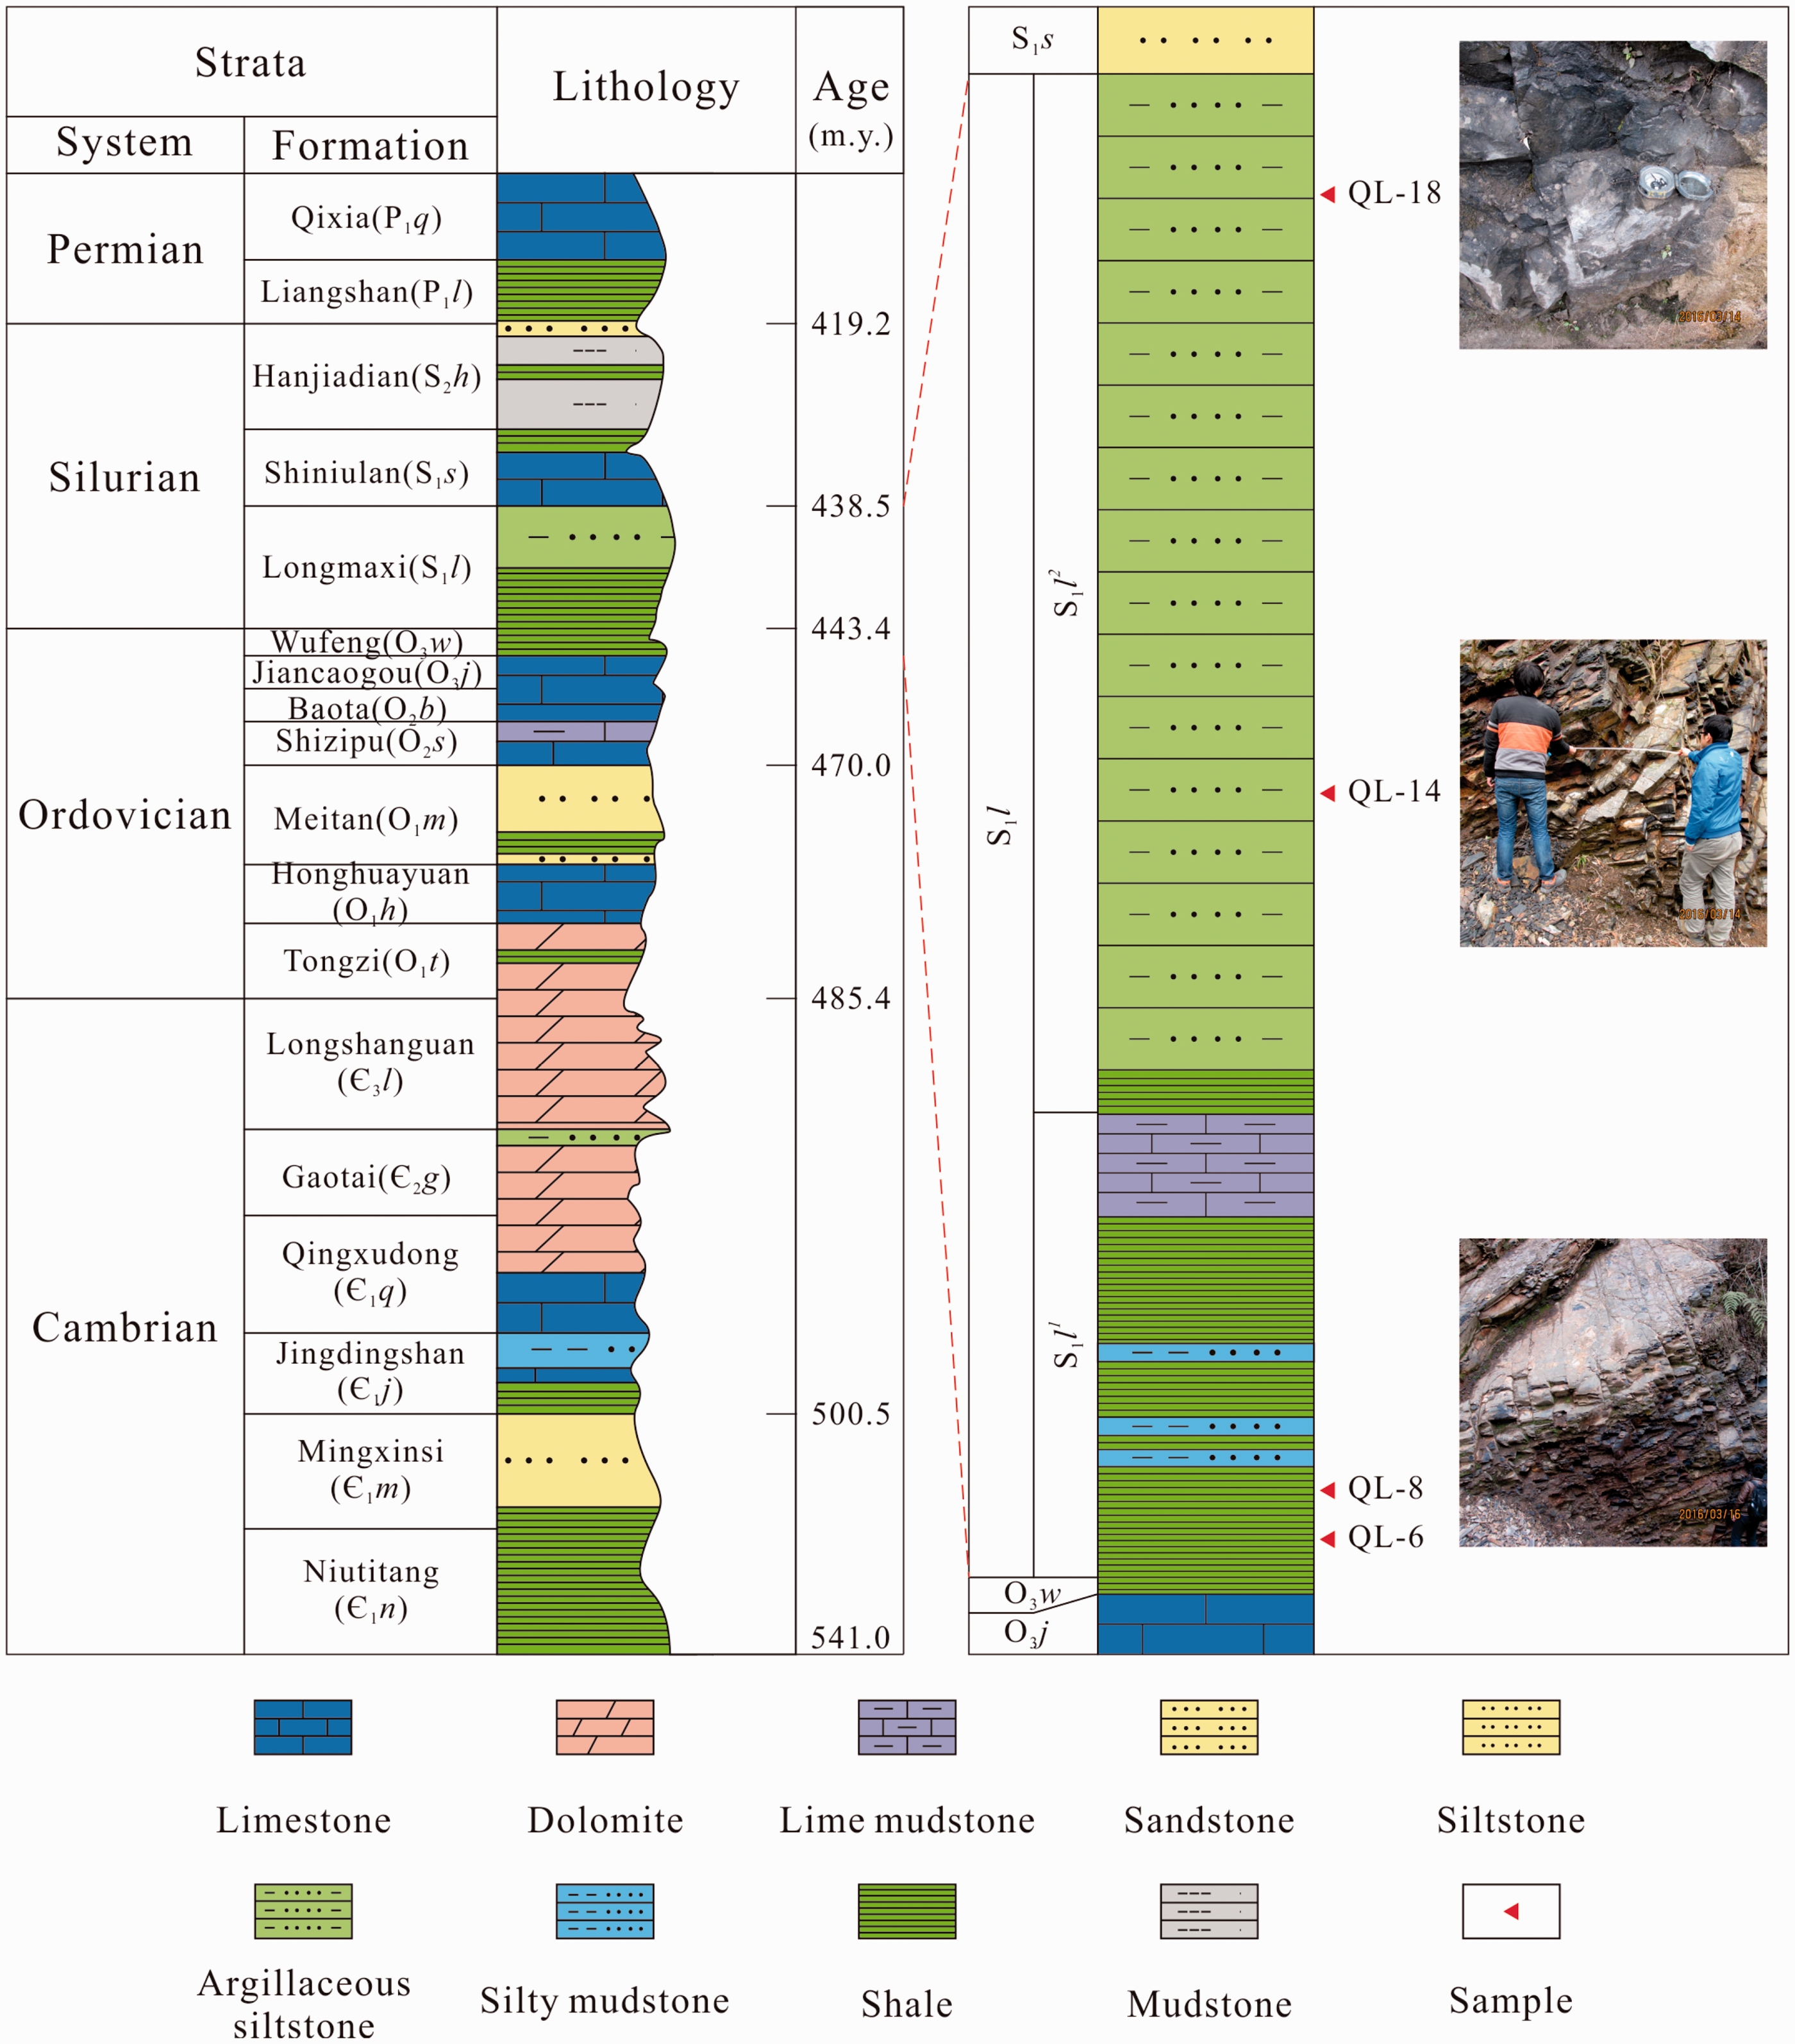
Longmaxi Formation section.
Corrected diffusion coefficient and pressure fitting.
Methodology
The methane diffusion experiment was carried out using KY-2, a rock diffusion coefficient tester at the Langfang Branch of China National Petroleum Corporation. The instrument and experiments were designed according to the national standard SY/T 6129-1995 (1996). The experimental samples were prepared in a cylindrical shape with diameter of 2.5 cm and length of 2.5 cm. The samples were soaked in brine (each liter contains 70 g sodium chloride, 6 g anhydrous calcium chloride, and 4 g magnesium chloride hexahydrate) at normal pressure and temperature. Samples were placed in a core holder with a 3 MPa confining pressure to ensure that the gas experiences one-dimensional diffusion in the vertical direction. Both sides of the gas chamber were filled with methane gas and nitrogen, which were more than 99.99% pure. Both sides of the air chamber were aerated with gaseous fluid with a pressure of 0.2 MPa. A pressure differential of 0.1 kPa was applied across the core. The experimental core diffusion coefficient was obtained according to the change in gas concentration on either side of the core.
Permeability experiment was performed by the Key Laboratory of Coalbed Methane Resources and Reservoir Formation Process of the Ministry of Education (China University of Mining and Technology). Permeability experiment was designed with four pressure points (2.76, 5.52, 8.27, and 11.03 MPa). Samples were successively pressed at test pressure point for experiment (axial compression 2.07 MPa). Other experiments were performed by the Yangzhou branch of China National Petroleum Corporation.
Results
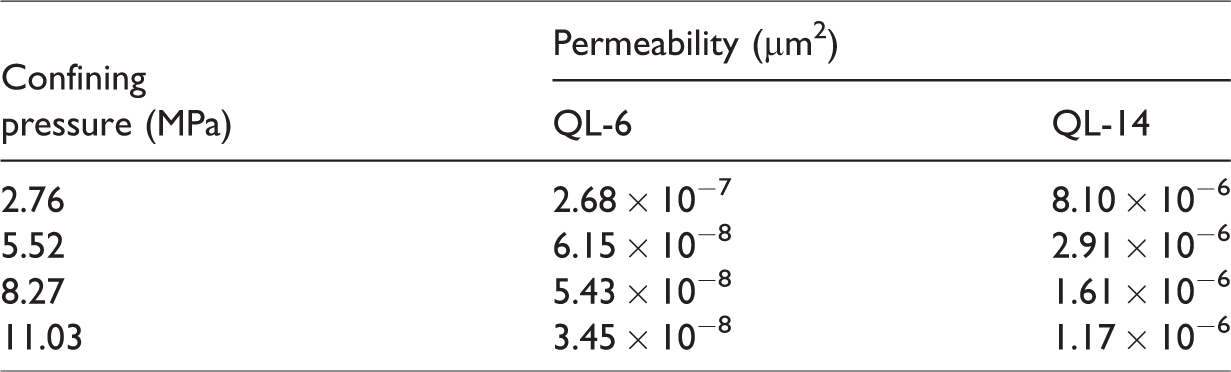
Results show that the diffusion coefficient of the Longmaxi Formation shale is 1.23 × 10⁻⁵–2.98 × 10⁻⁵ cm2 s−1, with an average value of 2.19 × 10⁻⁵ cm2 s−1, which is larger than that of the Ordos basin (Liu et al., 2012) where the diffusion coefficient of shale is 1.24 × 10⁻⁸–5.76 × 10⁻⁵ cm2 s−1 (Table 1). Porosity is 4.14–11.08%, with an average value of 7.73%, which is relatively high. TOC is 1.38–5.25%, with an average value of 2.76%. TOC is larger at the bottom of the Longmaxi than at the top. Clay mineral concentration is 8.0–27.0%, with an average of 16.8%. Quartz concentration is 49.0–71.0%, with an average of 55.8%. Feldspar content is 10.0–22.0%, with an average of 15%, while dolomite content is 2.0–30.0%, with an average of 10.3%. The rock brittleness index is 0.66–0.86. Permeability tests indicate that the confining pressure is between 2.67 and 11.03 MPa. Results show that the permeability of sample QL-6 is 3.45 × 10⁻⁸–2.68 × 10⁻⁷ µm2 and the permeability of sample QL-14 is 1.17 × 10⁻⁷–8.10 × 10⁻⁷ µm2 (Table 2).
Longmaxi Formation shale composition, porosity, and diffusion coefficient.
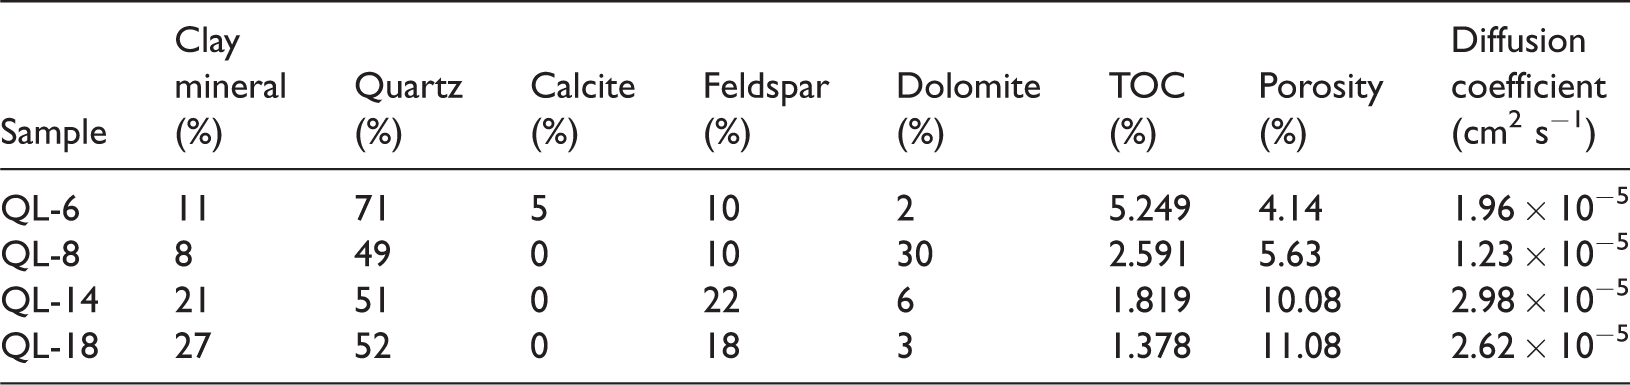
TOC: total organic carbon.
Longmaxi Formation shale permeability test results (with different confining pressures).
Discussion
Suitability of the free hydrocarbon concentration method
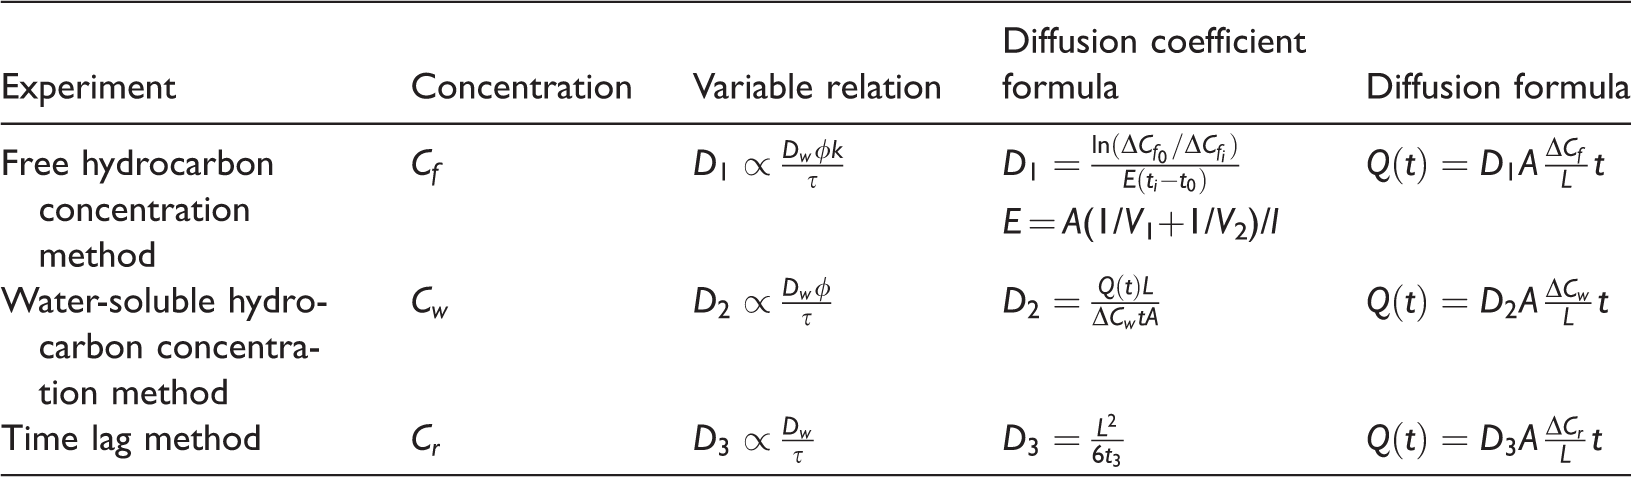
Measurement of the shale gas diffusion coefficient is based on the free hydrocarbon concentration, water-soluble hydrocarbon concentration, and the time lag methods (Table 3). The closed measurement is mainly a free hydrocarbon concentration method in which gas diffuses in the sample chamber sealed at both ends (Liu et al., 2012). The gas concentration tends to reach a balance at both ends of the chamber with the passage of time. The diffusion coefficient is calculated from gas component concentrations of the sample chamber. In the time lag method, gas from one end of the sample spreads into a zero density open air chamber (Schloemer and Krooss, 2004; Zhang and Krooss, 2001). The water-soluble hydrocarbon concentration method calculates diffusion coefficient based on the dissolved gas in pore water within the sample (Li et al., 2001). Rocks have different physical and geochemical characteristics for each region. The experimental design needs to account for the characteristics of the sample. It is necessary to study a particular area of the reservoir because of significant regional petrophysical and geochemical variations.
Calculation methods of diffusion coefficient (Liu et al., 2012).
Cf —concentration of free hydrocarbons in rocks below the diffusion interface (%);
Cw —concentration of dissolved hydrocarbons in pore water below the diffusion interface (%);
Cr —concentration of dissolved hydrocarbons in rocks below the diffusion interface (%);
D —diffusion coefficient (cm2 s−1);
D1 —diffusion coefficient of free hydrocarbon concentration method (cm2 s−1);
D2 —diffusion coefficient of water-soluble hydrocarbon concentration method (cm2 s−1);
D3 —diffusion coefficient of time lag method (cm2 s−1);
Dw —diffusion coefficient in pure water (cm2 s−1);
k —solubility coefficient of natural gas (cm3 cm−3);
τ —rock tortuosity (cm cm−1);
A —cross sectional area (cm2);
φ —porosity of rock (%);
ΔCf0 —concentration difference of hydrocarbon gas in initial time (cm3 cm−3);
ΔCft —concentration difference of hydrocarbon gas in i time (cm3 cm−3);
ti —diffusion at i time (s);
t0 —diffusion at initial time (s);
t3 —time lag (s);
ΔCw —concentration difference of water-soluble hydrocarbon at both ends of sample (cm3 cm−3);
Q(t) —cumulative diffusion (cm3);
V1, V2 —chamber volume (cm3);
L —sample length (cm).
The shale gas is a self-contained gas reservoir. The time lag method is an open diffusion test, which is geared toward examining diffusion at the time of mining. Experiments by Krooss and Leythaeuser (1988), Krooss et al. (1986), and Krooss and Schaefer (1987) have shown that the relationship between time lag method and physical phase is not obvious. The water-soluble hydrocarbon concentration method examines gas diffusion in water. Calculation of the diffusion must account for pore structure, mineral composition, and other factors. However, the water-soluble hydrocarbon concentration method emphasizes the diffusion in the water without considering the internal structure of samples. According to the experimental characteristics, the closed experimental free hydrocarbon concentration method is more suitable to study diffusion in shale gas reservoirs.
In the southern Sichuan region, the deep shale reservoir has high water content (Fang et al., 2014; Shen et al., 2017). Therefore, the diffusion coefficient of water-saturated samples is close to the actual diffusion coefficient. However, it is difficult to obtain the diffusion coefficient without experimentation. This paper estimates the diffusion coefficient in situ for natural gas by the summary of previous empirical formulas.
Calibration of the diffusion coefficient
There is a difference between the diffusion coefficients measured in the laboratory (27°C, 0.2 MPa, 3 MPa) and in the actual formation (50°C, 1500 m, 20 MPa). Therefore, in order to obtain the diffusion coefficient for the shale gas reservoir under natural conditions, pressure and temperature corrections must be applied for the laboratory diffusion coefficients.
(1) Pressure correction
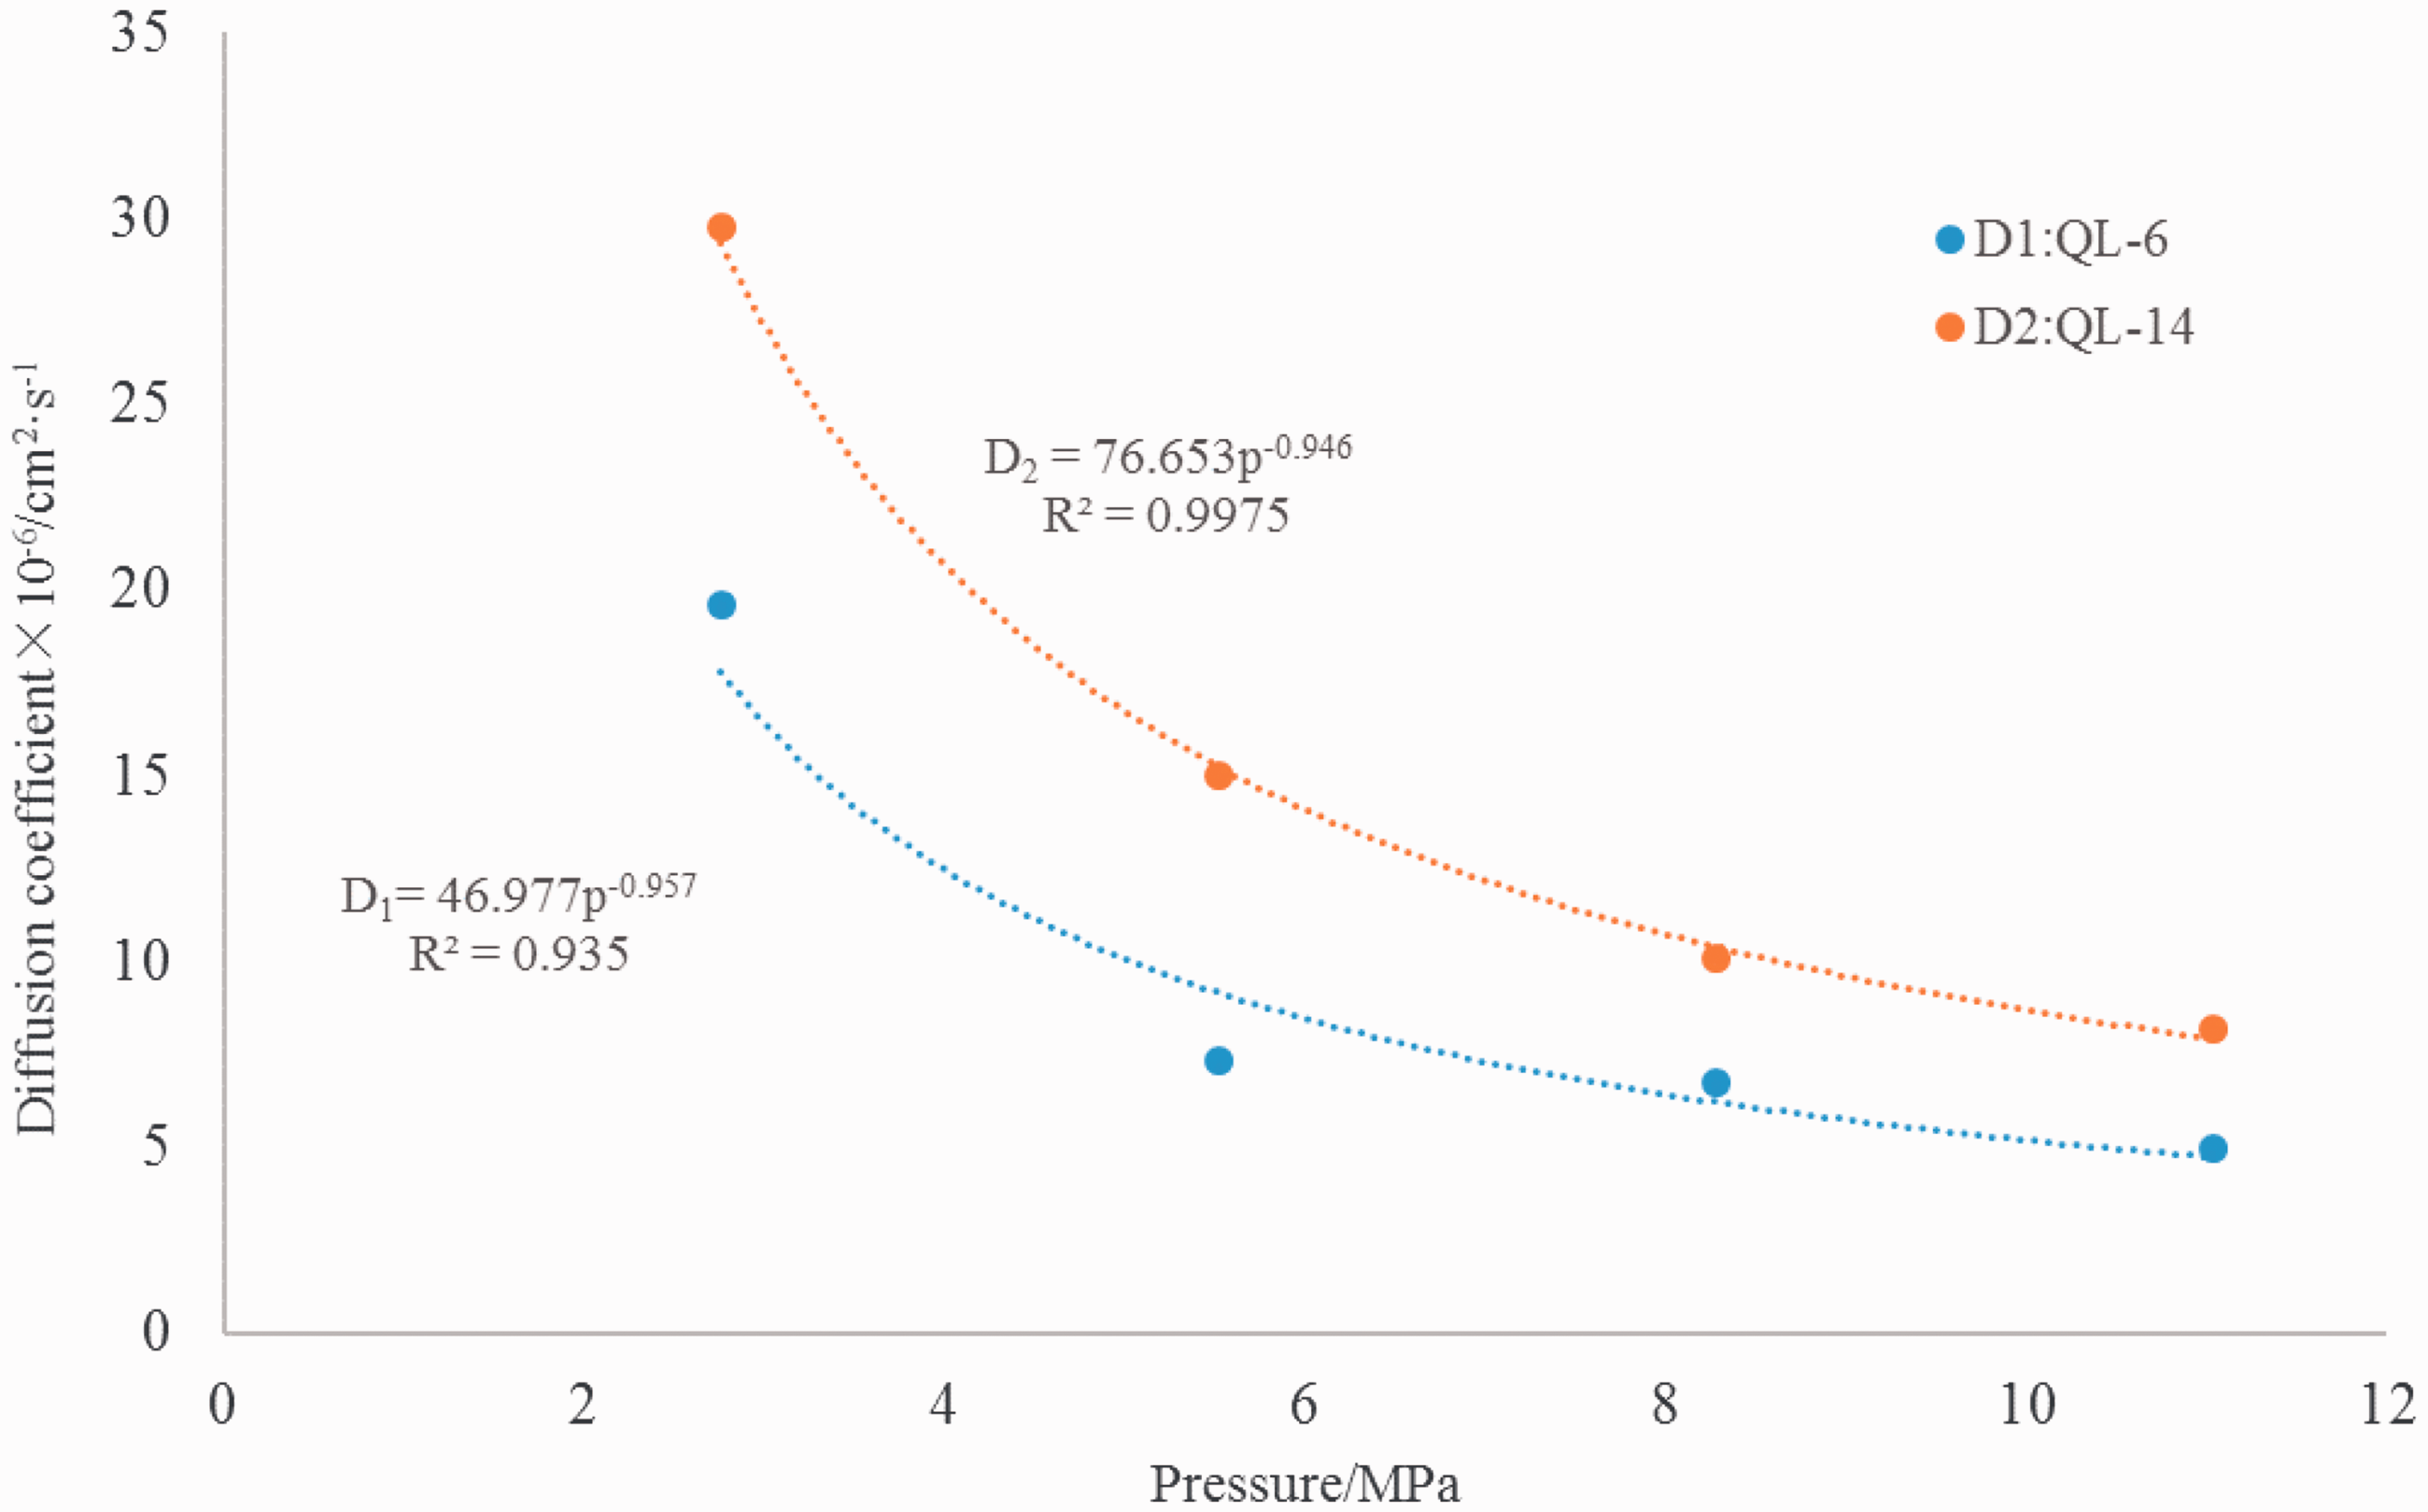
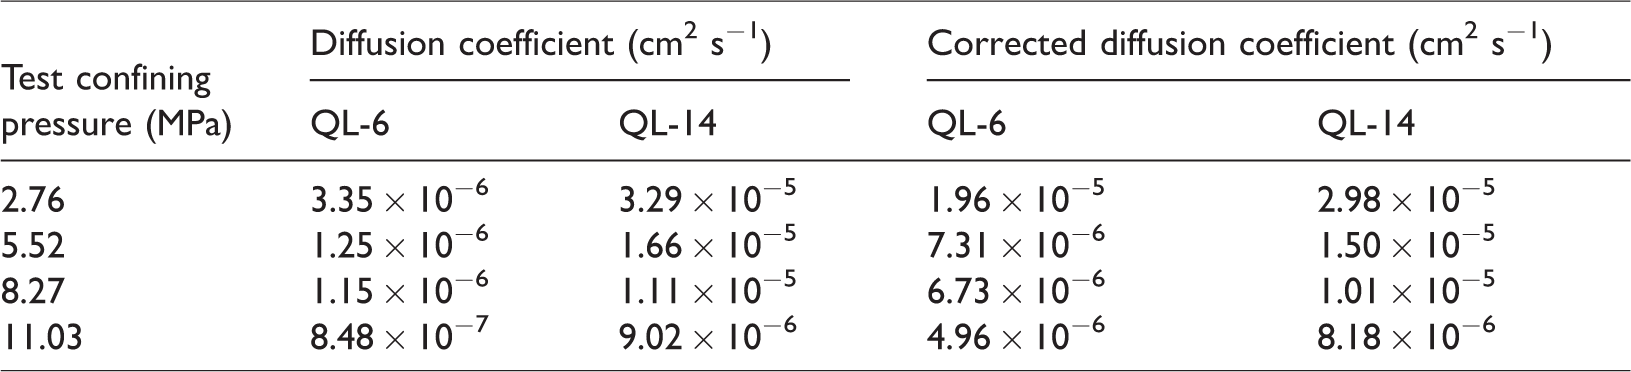
The diffusion of shale gas mainly occurs through pore space. The holes and fractures in shale close with increasing pressure, which prevents diffusion of shale gas and reduces the diffusion coefficient. In order to study the diffusion characteristics during formation of the shale, we use an empirical formula (Ertekin et al., 1986) for hydrocarbon gas diffusion coefficient and permeability, and obtain pressure conditions of the shale gas by calculating the diffusion coefficient under different pressures and permeabilities measured from samples (Table 4) (Figure 3).
Diffusion coefficients and corrected numerical values for QL-6 and QL-14.
Empirical formula of permeability and diffusion coefficient
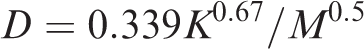
K—permeability, µm2;
M—molecular weight, dimensionless.
As the experimental permeability is determined using a dry sample, the calculated diffusion coefficient should also be calculated using a dry sample. We employed permeability data obtained from tests at confining pressure of 2.76 MPa as a corrected benchmark. Then, the experimental data were divided by calculated data to obtain the correction coefficient of diffusion coefficient (CD=DE/DC). Along with the above terms, a QL-6 correction factor of 5.85 and a QL-14 correction coefficient of 0.91 were applied in the empirical formula to calculate the diffusion coefficient
CD —correction coefficient of diffusion coefficient, dimensionless;
DE —experimental diffusion coefficient, cm2 s−1;
DC —calculated diffusion coefficient, cm2 s−1.
Pandey and Tek (1974) used the free hydrocarbon concentration method to determine the diffusion coefficient of helium in a rock under different pressure conditions. Their results showed that the diffusion coefficient of helium decreases logarithmically with increasing pressure (Figure 4(a)). The diffusion coefficient of methane in rocks was measured under different pressure conditions by the time lag method (Schloemer and Krooss, 2004). The authors found that the diffusion coefficient of methane decreases logarithmically with increasing pressure (Figure 4(c)). Other researchers have reached the same conclusion (Liu et al., 2012) (Figure 4(e) and (g)). However, logarithmic functions do not conform to actual diffusion curves for methane in shale. Shale gas diffusion takes place through the molecular skeleton when the pressure is sufficiently high to seal fractures and pores, so the diffusion coefficient should reach a small fixed value. It is found that an exponential function or power function matches experimental diffusion curves more closely (Figure 4(b), (d), (f), and (h)). The power function fits well with experimental data (R2 is 0.78–0.99). Therefore, the diffusion coefficient decreases with increasing pressure by power function.
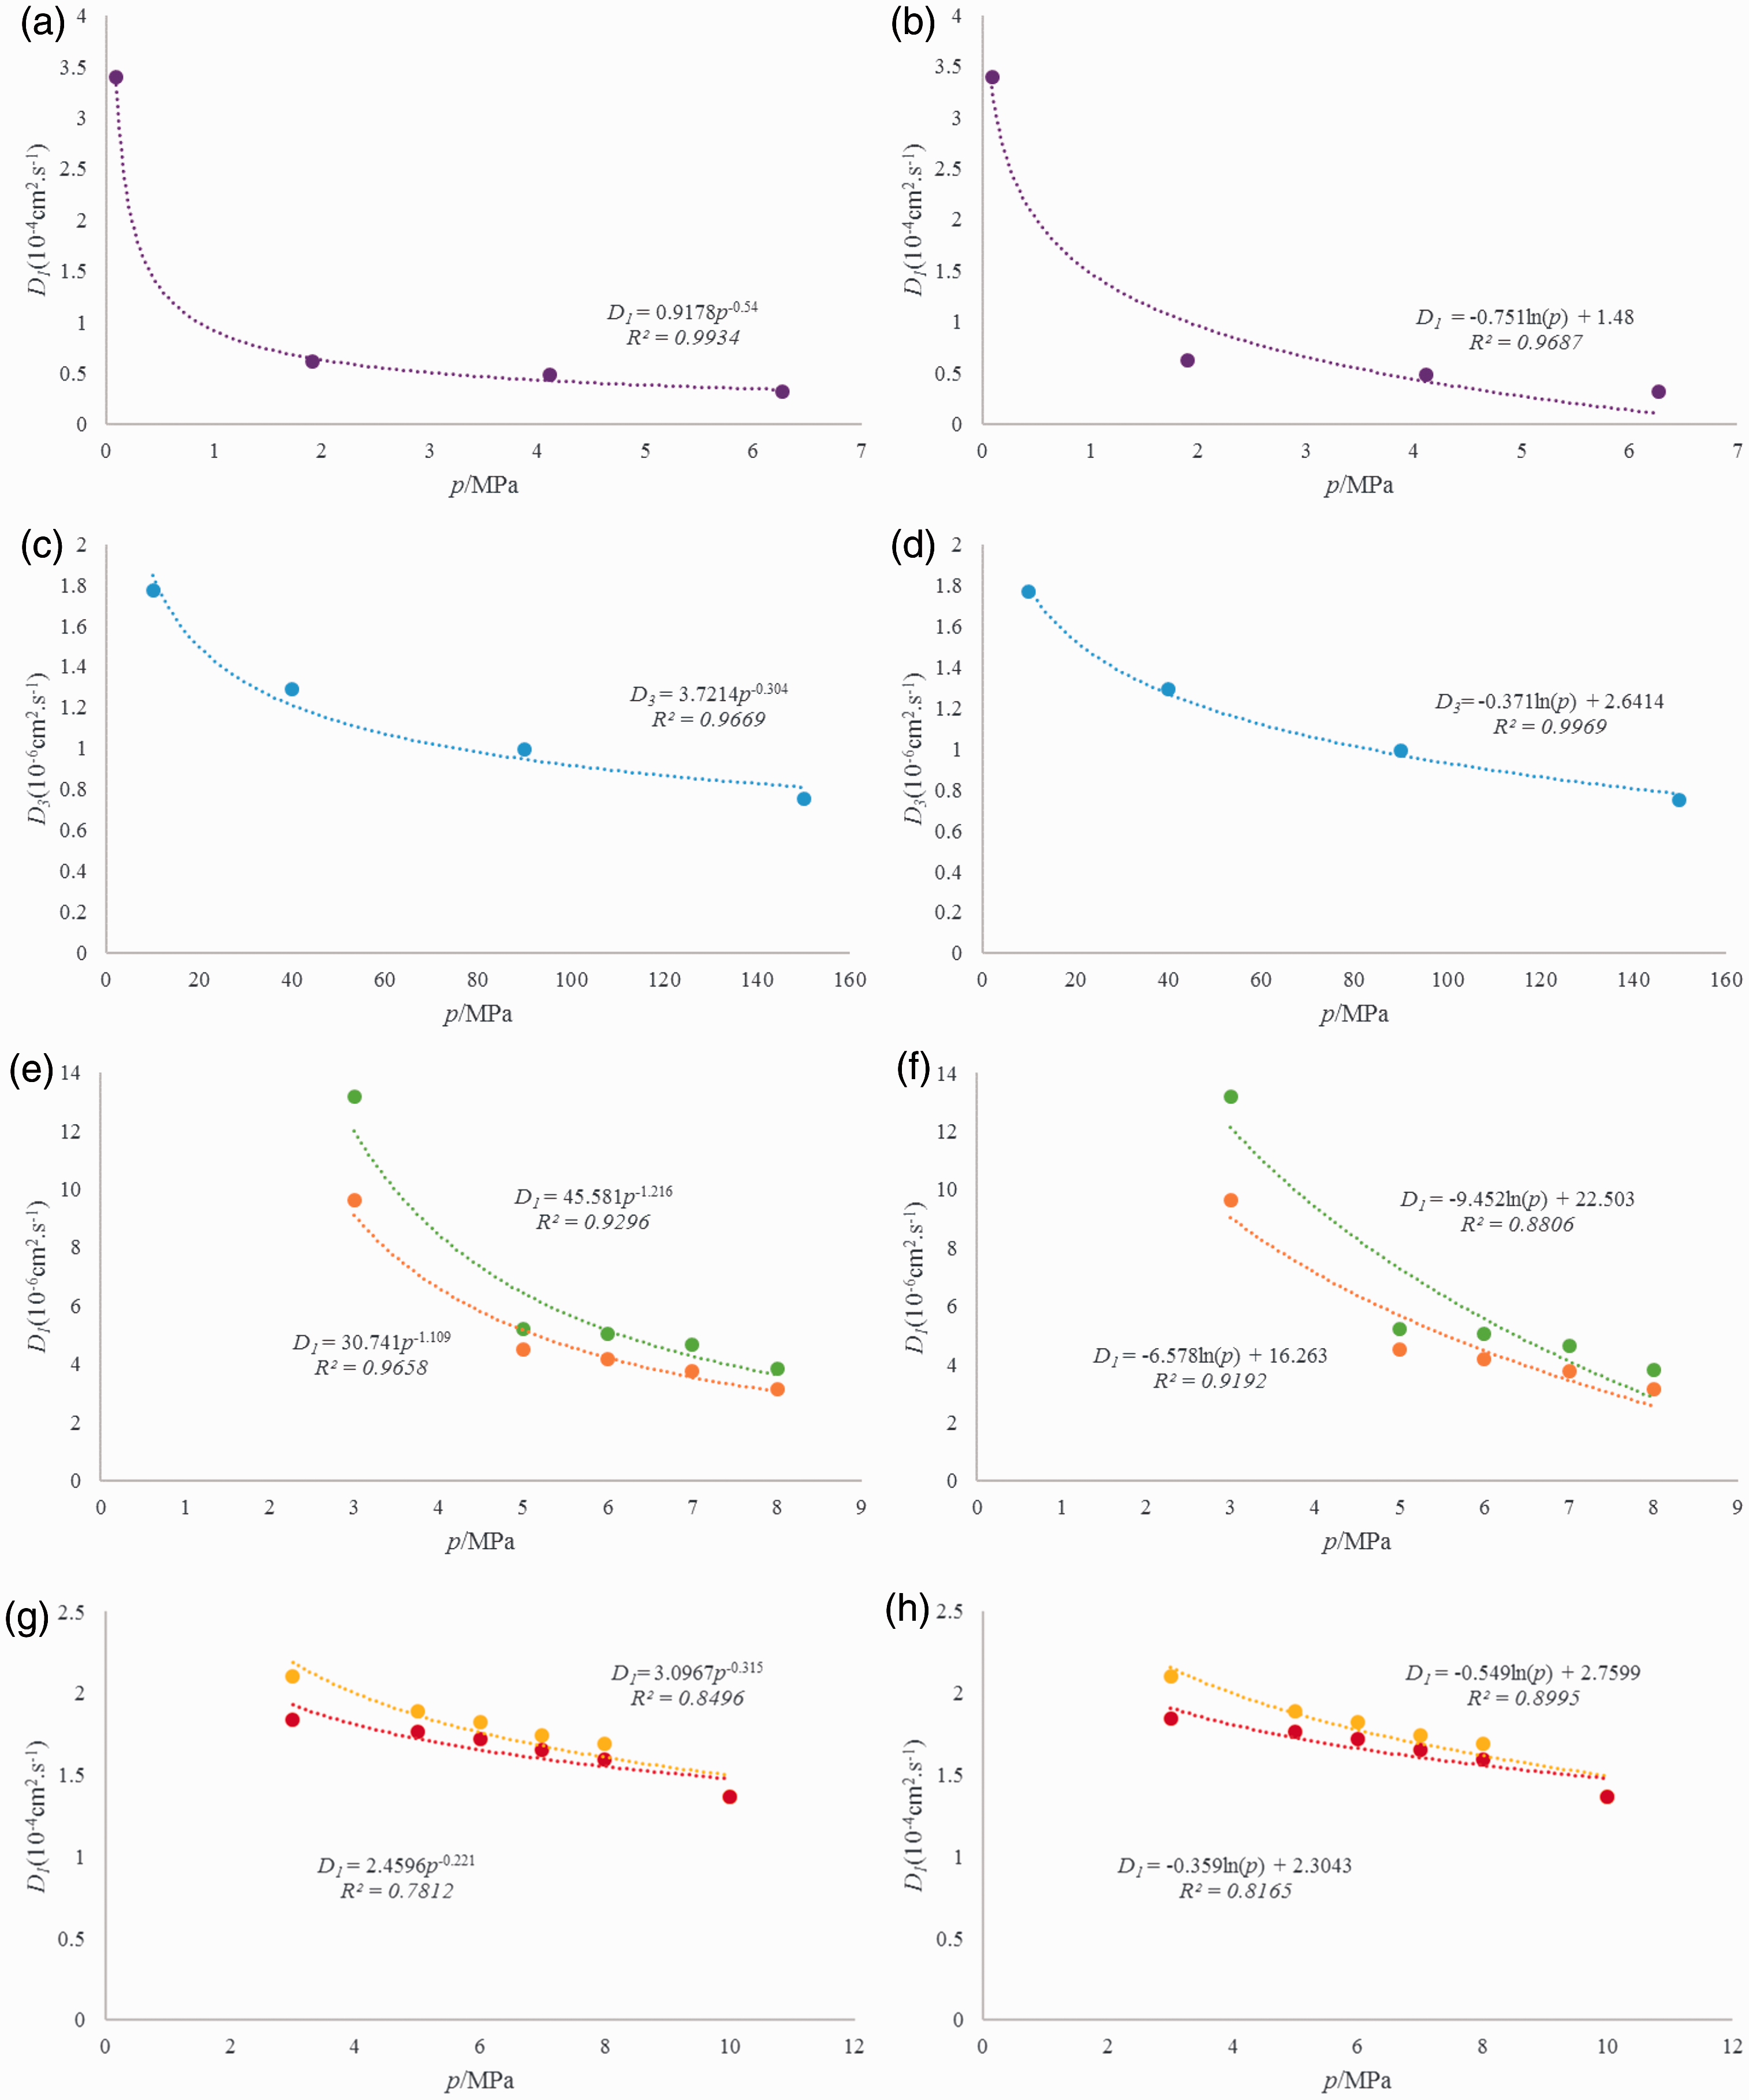
Fitted results of power and logarithmic functions (a, c, e, and g are power functions and b, d, f, and h are logarithmic functions, data come from Pandey and Tek (1974)).
(2) Temperature correction
The diffusion equation operates on the molecular level, and the equations of motion within kinetic molecular theory are influenced by temperature. The formulas for calculating the diffusion coefficient of shale gas through water are as follows (Xue et al., 2010)
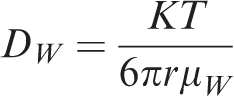
The diffusion coefficient of natural gas in water in the laboratory is given by
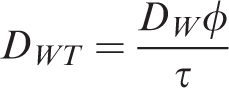
The diffusion coefficient of shale gas in water-saturated rock is given by
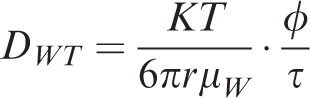
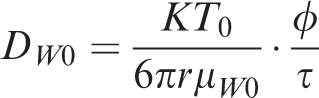
The relationship between the diffusion coefficient of shale gas in saturated water and the diffusion coefficient under experimental conditions is given by
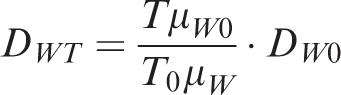
Therefore, the relationship between the actual formation conditions and the measured diffusion coefficients in the laboratory can be obtained.
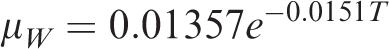
The regression equation for viscosity of water with temperature is given by (Hao et al., 1994)
DWT —Diffusion coefficient in rock, cm2 s−1;
DW0 —Experimental diffusion coefficient, cm2 s−1;
T0 —Experimental temperature, K;
T —Formation temperature, K;
μW —Viscosity of water in formation, Pa s;
μW0 —Viscosity of water in experiment, Pa s.
Thus, the shale gas diffusion coefficient corresponding to the actual formation pressure can be obtained in the laboratory with two corrections.
The pressure coefficient of the Silurian formation in Shizhu area is 1.75–2.00. The overlying formation pressure coefficient is between 0.99 and 1.31 (Yang et al., 2014). The geothermal gradient of the Upper Paleozoic–Mesozoic strata is 25.10–28.01°C/km (Huang et al., 2012). The geothermal gradient of the Longmaxi Formation is 41.47°C/km (Yang et al., 2015). The Longmaxi Formation depth is 500–4000 m, and its thickness is between 200 and 600 m with the general thickness of 300 m (Huang et al., 2012). This paper takes the average value or general value as the calculation parameter. The lithostatic pressure coefficient is hypothetically taken as 1.15, the Longmaxi Formation lithostatic pressure coefficient is hypothetically taken as 1.87, and the temperature gradient of the overlying strata is 26.56°C/km. The diffusion coefficient is calculated using experimental diffusion coefficients from various samples (Table 5).
The diffusion coefficient decreases with increasing pressure; however, the rate of decrease slows down gradually. The diffusion coefficient increases because the molecular kinetic energy of shale gas increases with increasing temperature and depth. Therefore, pressure and temperature correction method is reliable and consistent with the variation of the diffusion coefficient. This method can be used to estimate the diffusion coefficient of shale gas.
Factors influencing the diffusion performance
The description of fluid flow is commonly divided into three levels. First is the molecular level controlled by molecular dynamics (Tournassat et al., 2016). Second is the kinetic level of nonequilibrium statistical physics controlled by the Boltzmann equation (Gao et al., 2017). Third is the macro level controlled by hydrodynamics. Migration of natural gas commonly falls under the category of fluid mechanics (Merletti et al., 2017). However, the shale gas reservoir is compact and microscopic pores are present. Diffusion of shale gas in the reservoir is defined by motion on a molecular level. Shale reservoirs have a complex internal structure and also deep portions of the reservoirs are water saturated. The diffusion coefficient must account for solubility characteristics, adsorption of clay minerals, and organic matter (Kim et al., 2016; Li et al., 2016a). Therefore, the shale gas diffusion coefficient, temperature, and pressure should not be the only variables taken into account. Organic characteristics of the reservoir should be considered as well.
Software was used for fitting the relationship between geological parameters such as porosity, clay minerals, TOC, brittle minerals, and the diffusion coefficient (Figure 5). The fitting results show that the diffusion coefficient, porosity, and clay minerals are positively correlated. The relationship between diffusion coefficient and TOC or brittle minerals was unclear.
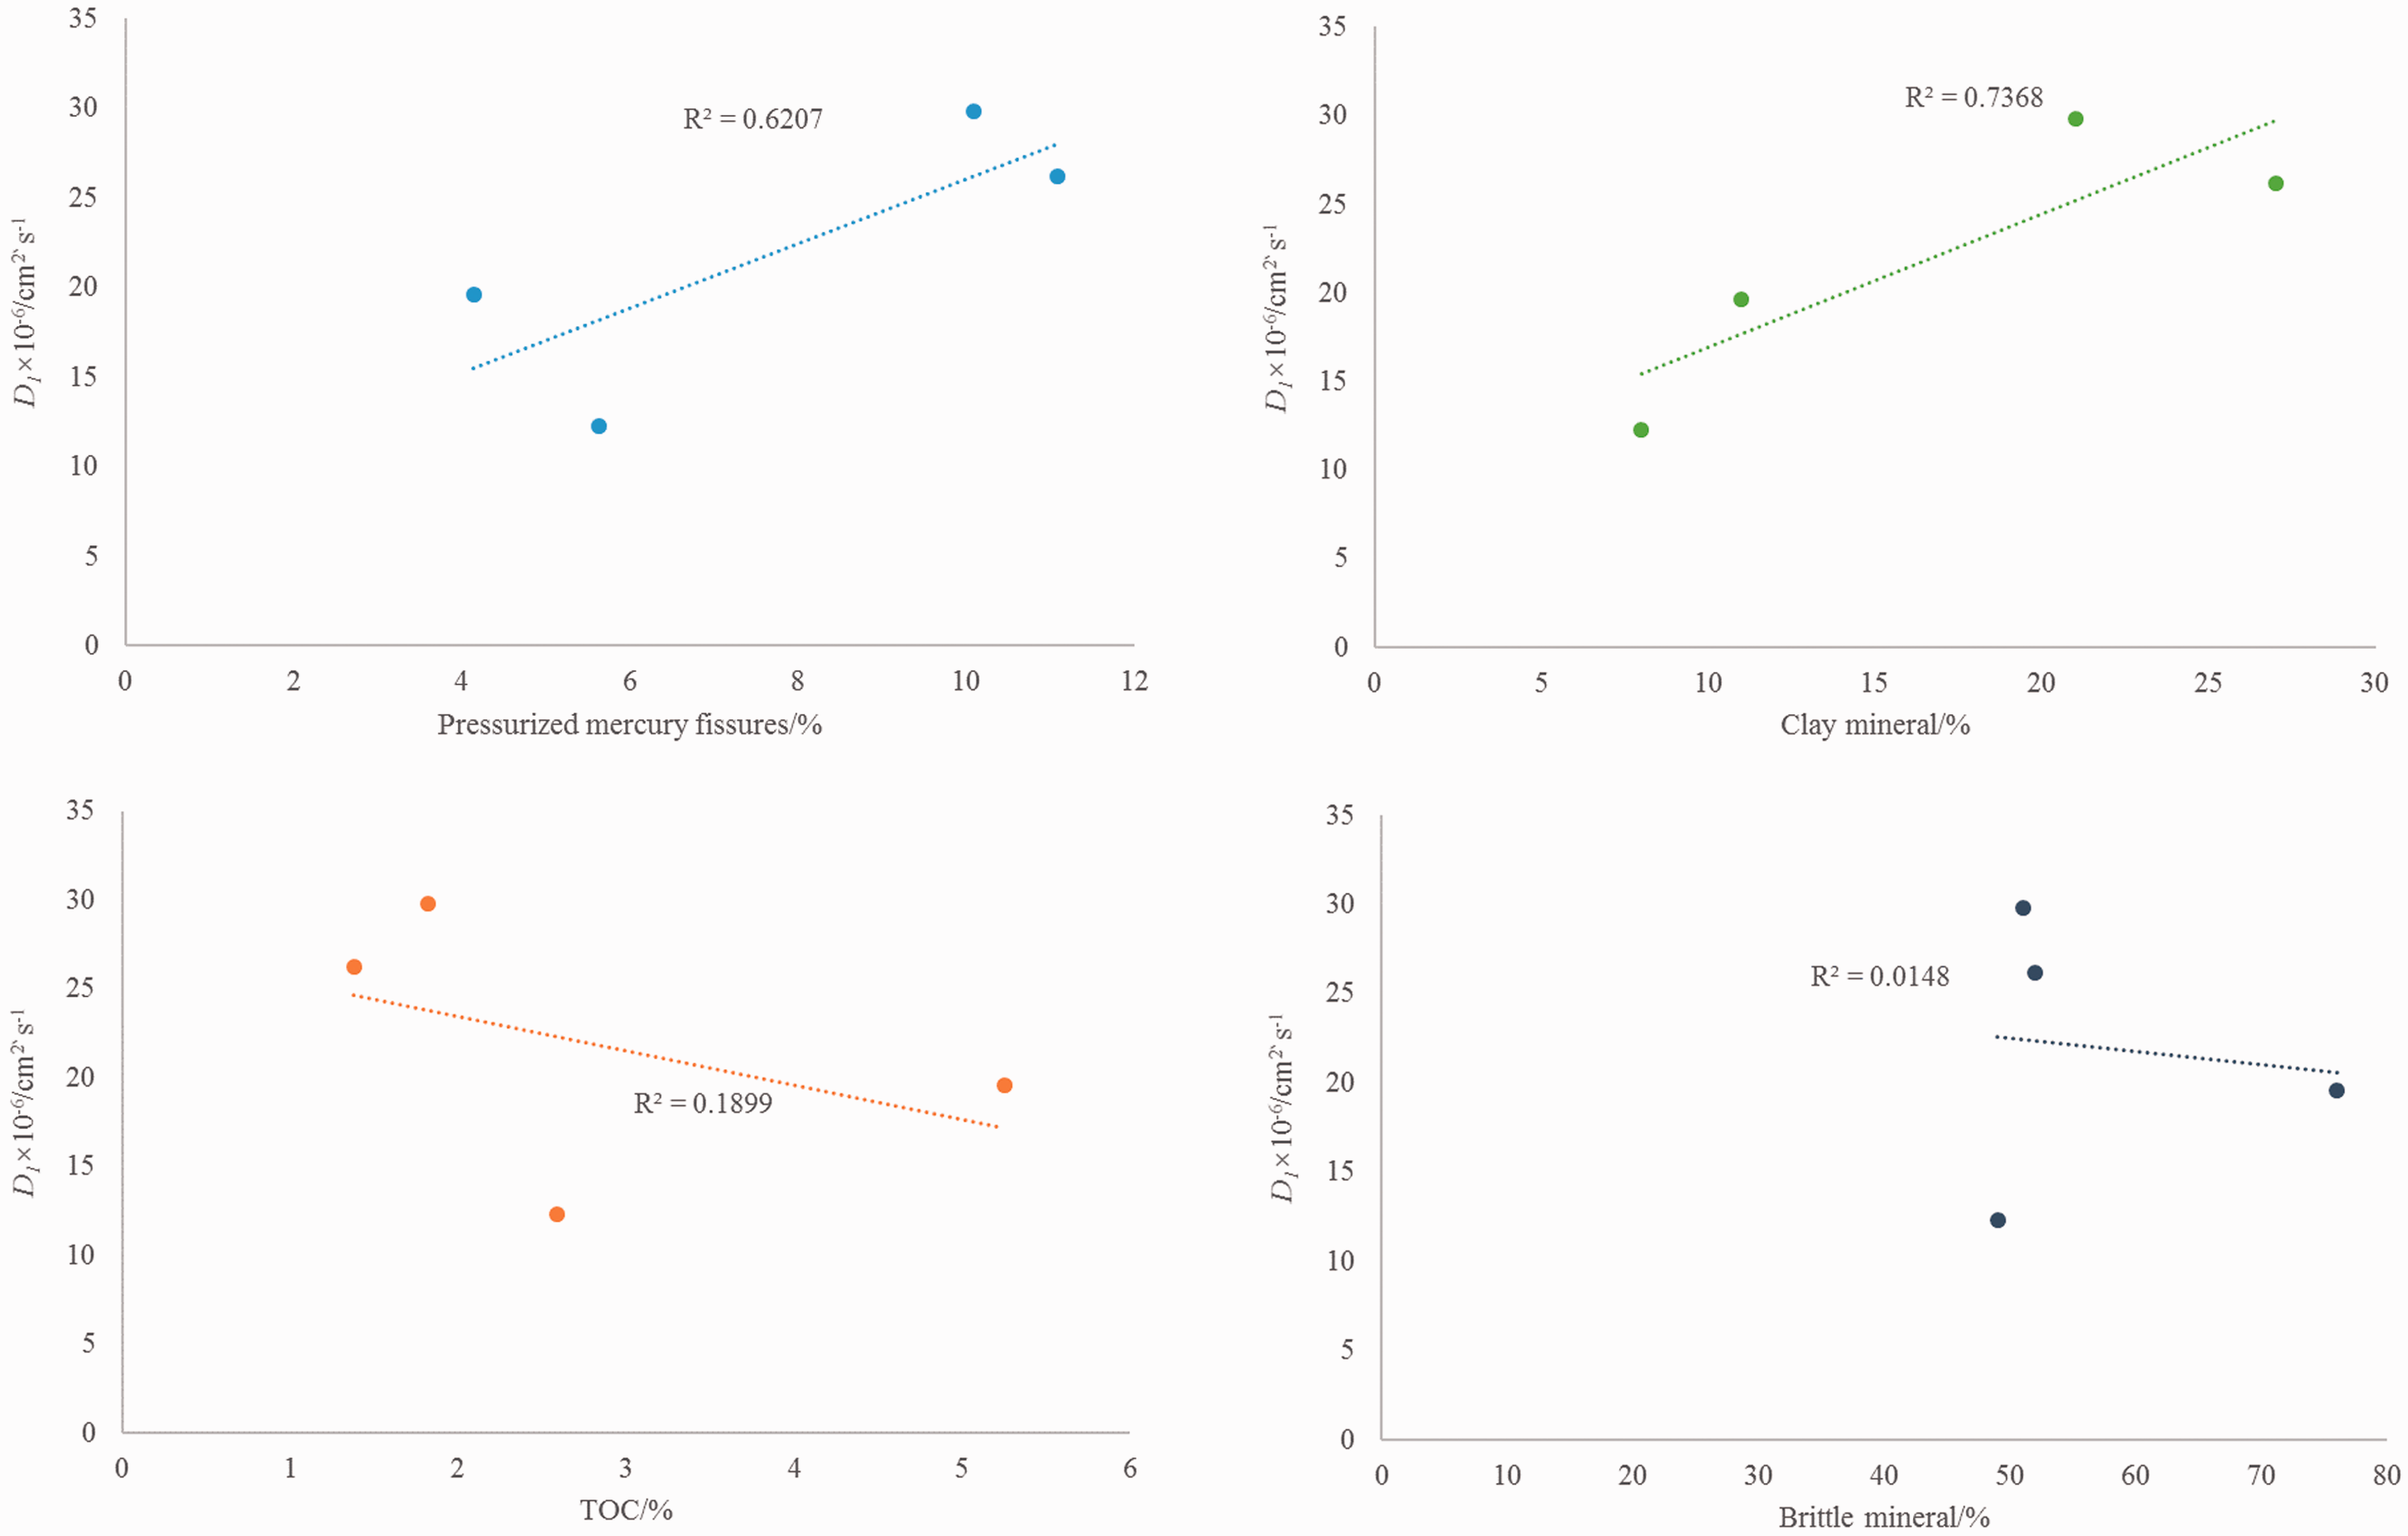
Relationship between geological parameters and diffusion coefficient.
There are two main mechanisms of shale gas diffusion through a reservoir, diffusion through the shale molecular skeleton and diffusion through pores. Diffusion through shale pores is more common than diffusion through the shale molecular skeleton. Thus, porosity is one of the significant factors that affect the diffusion coefficient. Fitting results from mercury intrusion porosity and diffusion coefficient give a goodness of fit of R2=0.62. Although the fitting is not exact, the diffusion coefficient varies with porosity (the average porosity of samples QL-6 and QL-8 is 4.88%, the average diffusion coefficient is 1.59 × 10⁻⁵ cm2 s−1, the average porosity of samples QL-14 and QL-18 is 10.58%, and the average diffusion coefficient is 2.80 × 10⁻⁵ cm2 s−1). Therefore, the diffusion coefficient is positively correlated with porosity. The permeability of the reservoir operates at the macro level. The permeability is related to fractures and open pore space in the reservoir. A higher permeability indicates the development of fractures in the reservoir, and micro fractures are also favorable for the diffusion of shale gas. Therefore, reservoir permeability is a significant factor to be considered in calculating the diffusion coefficient.
Clay minerals are the primary components of dark shale in this area. Experimental results show that clay minerals and porosity are positively correlated in the Longmaxi Formation samples. The porosity and diffusion coefficient are positively correlated because clay minerals are positively correlated with porosity. It can be considered that clay minerals affect the diffusion coefficient by controlling porosity. The relevance of the diffusion coefficient and clay minerals is 0.74, which is a positive correlation (Figure 5(b)).
Slight negative relationships are observed between TOC/brittle minerals and diffusion coefficient. However, the fitting degrees are quite low. The relationship between organic geochemical parameters and diffusion coefficient needs to be researched further (Aertsens et al., 2017; Cervik, 1967; Gao et al., 2017; Thimons and Kissell, 1973; Villa, 2016). Organic matter has a strong adsorption capacity for methane gas (Sang et al., 2016; Wang et al., 2015a). If the TOC content is high, the organic matter may adsorb more methane, thus affecting the diffusion coefficient. The maturity of organic matter also has an effect on pore structure (Tang et al., 2016). Results show that the porosity of shale increases with increasing maturity of organic matter (Ko et al., 2017; Loucks et al., 2017). Thus, maturity should be positively correlated with the diffusion coefficient.
Main controlling factors of gas migration in deep reservoir
It is generally accepted that the mechanism of shale gas migration has three stages: desorption, diffusion, and percolation (Chen et al., 2011; Heffer, 2015; Sang et al., 2016). The influence of shale gas diffusion on migration is still largely unknown (Detlev Leythaeuser, 1982; Krooss and Leythaeuser, 1992; Li et al., 2016a). The effects of diffusion and percolation on the deep reservoir of shale gas can be directly compared to the influence of diffusion and seepage on shale gas migration, using the measured diffusion coefficient and permeability to calculate the gas accumulation per unit time.
Diffusion cumulant through rock
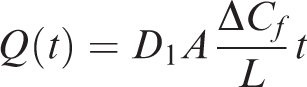
During the initial process of migration, shale gas will continue to be desorbed. Therefore, the change in ΔCf in the short term can be regarded as fixed. During the initial time, the shale matrix has a flow concentration of 0 and a methane gas concentration of 1. Therefore, the above equation can be solved for ΔCf by taking L = 2.5 cm, A = 106 cm2, and the value of D1 is taken from Table 5.
Longmaxi Formation diffusion coefficients.
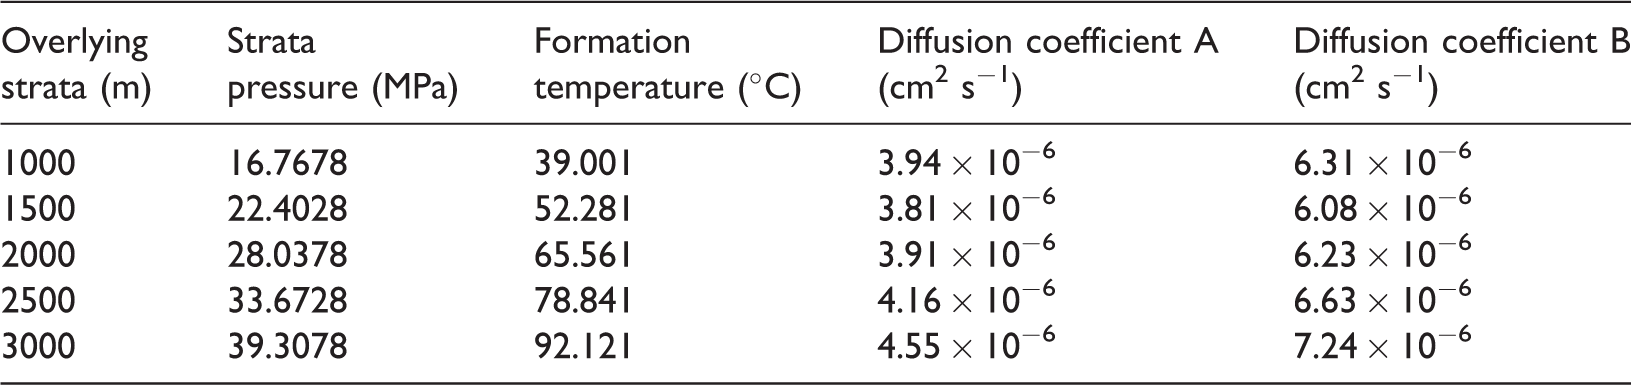
The diffusion coefficient A was calculated by using sample QL-14, which comes from the middle section of the Longmaxi Formation. Diffusion coefficient B was calculated from sample QL-6, which comes from the lower part of the Longmaxi Formation.
Specific contributions of diffusion volume and permeability volume.
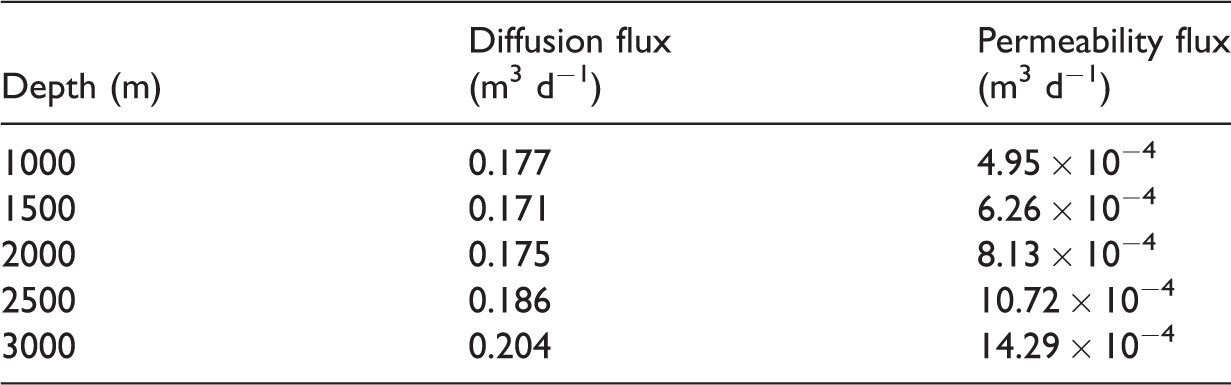
Diffusion flux is a vector form of diffusion flow rate. Permeability flux is a vector form of linear seepage flow. They are numerically equal.
Seepage cumulant through rock
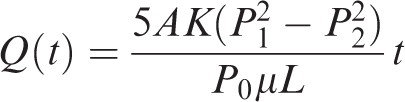
To solve the above equation, we take L = 2.5 cm and A = 106 cm2. The value of P1 is taken from Table 5, and P2 is calculated by the equation L (P2=P1−cgL × 10−4). The term K is calculated from Table 5 using the empirical formula (D = 0.339K0.67/M0.5) and taking the average value. The other terms are μ = 0.011 mPa s (methane viscosity at normal atmospheric temperature), and c = 1.87 (lithostatic pressure coefficient of the Longmaxi Formation).
ΔCf —concentration difference, dimensionless;
P1, P2 —strata pressure, MPa;
P0 —atmospheric pressure, MPa;
μ —methane gas viscosity, mPa s;
c —lithostatic pressure coefficient, dimensionless.
Reservoir flow units are calculated through experimentation and fitting of diffusion coefficient and permeability data. Results show that the diffusion rate is 0.177–0.204 m3 d−1, with an average of 0.182 m3 d−1, while the linear seepage flow is 4.95 × 10⁻⁴–14.29 × 10⁻⁴ m3 d−1, with an average of 8.87 × 10⁻⁴ m3 d−1. The shale gas diffusion flux is greater than linear seepage in the Longmaxi Formation reservoir. Permeability in the Longmaxi formation is 3 × 10⁻⁷ µm2, hence the migration of shale gas in the deep region of the reservoir is mainly by diffusion (Table 6).
Conclusion
The free hydrocarbon concentration method within a closed system is suitable for measurement of the shale gas diffusion coefficient. The Longmaxi shale gas reservoir in the southern Sichuan Shizhu area has a diffusion coefficient between 1.23 × 10⁻⁵ and 2.98 × 10⁻⁵ cm2 s−1, with an average of 2.19 × 10⁻⁵ cm2 s−1. The hydrocarbon concentration method effectively uses the formation pressure and the calculated diffusion coefficient to obtain the diffusion coefficient for actual conditions within the shale gas reservoir. The diffusion coefficient is between 3.94 × 10⁻⁶ and 7.24 × 10⁻⁶ cm2 s−1 with an average of 5.28 × 10⁻⁶ cm2 s−1 at a depth of 1000–3000 m. Fitting parameters show that the porosity of the reservoir, presence of clay minerals, and diffusion coefficient are all positively correlated. Diffusion coefficient is also related to TOC and Ro. Predicted diffusion flux is 0.177–0.204 m3 d−1 with an average of 0.182 m3 d−1. Linear seepage flow is 4.95 × 10⁻⁴–14.29 × 10⁻⁴ m3 d−1 with an average of 8.87 × 10⁻⁴ m3 d−1, calculated from the diffusion coefficient and permeability per unit flow. These results show that the shale gas diffusion flux is greater than linear seepage in the Longmaxi Formation reservoir. The migration of shale gas in the deep reservoir is mainly by diffusion.
Footnotes
Declaration of conflicting interests
The author(s) declared no potential conflicts of interest with respect to the research, authorship, and/or publication of this article.
Funding
The author(s) disclosed receipt of the following financial support for the research, authorship, and/or publication of this article: This work was jointly supported by the National Natural Science Foundation of China (No. 41402124, No. 41772141), the Fundamental Research Funds for the Central Universities (No. 2017CXNL03), and the Priority Academic Program Development of Jiangsu Higher Education Institutions (PAPD).