
Abstract
The desorption of shale gas is dynamic and multistage processes. Dividing desorption process, describing the desorption stages, and analyzing the main factors in each stage are the research emphasis. The desorption process is described by mathematical models and divided into several stages according to desorption rate and its change rate. The results show that shale gas desorption can be divided into the slow desorption stage, the large desorption stage, and the final desorption stage. The increase of organic matter content not only has a significant effect on extending the production peak but also may lead to arrival of final desorption stage in advance. The increase of clay mineral content can accelerate the arrival of production peak and extend the production peak. It may be possible to analyze the shale gas production process and adjust the production plan on the basis of analyzing the material composition of reservoir.
Introduction
The Bohai Bay basin is rich in oil, gas, and coal resources (Yang et al., 2014). Geological explorations have found that an area located in the northern part of Hebei province, which is in the northwestern part of Bohai Bay basin, contains many layers of black carbonaceous and gray shale. This area has good potential for shale gas development: the coal seams have the important characteristics of multiple layers, small single layer thicknesses (there is a large thickness of black shale in some areas), and high proximity to shale strata, and coalbed methane and shale gas are available for joint mining (Jia et al., 2012; Li et al., 2016a; Zhang et al., 2016). When shale gas can be reasonably developed, surrounding cities can make full use of shale gas, reducing the use of coal, and thereby the rate of environmental pollution. On the other hand, the local government and energy organization devote efforts to developing shale gas and coalbed methane. Because of reservoir particularity, developing shale gas or coalbed methane solely has low economic benefit in China. Many researchers are beginning researching the reservoir (coal and shale). Coalbed methane had developed well but shale gas is in early stages in China. At present, some researchers and local government want to develop simultaneously shale gas and coalbed methane under certain conditions and they are researching industriously certain conditions. Desorption of shale gas is one of the important research points.
In China, research methods and development techniques for coalbed methane are mature. However, those for shale gas are in the beginning stages, and research on shale gas depends on the current theory of coalbed gas (Li et al., 2016b; Zou et al., 2016). Thus, detailed study of the desorption process of shale gas is a prerequisite to shale gas development.
Previous studies focused on the effects of total organic carbon (TOC) and clay minerals on the Langmuir constant. Most of the analyses are static and qualitative analyses of desorption parameters. Domestic and foreign scholars think that organic matter and clay minerals can adsorb a large amount of shale gas (Li et al., 2016c; Wang et al., 2014). Many environmental and external factors, especially pressure, temperature, and moisture, can influence adsorption capacity of shale gas (Ross and Bustin, 2009; Wang et al., 2015; Zhu et al., 2016). Internal factors are TOC, maturity of organic matter (Sang et al., 2016), and adsorption capacity of different clay minerals (Cao et al., 2015; Hou et al., 2014; Ji et al., 2014; Kuila and Prasad, 2013; Zhao et al., 2016). In addition, many scholars have also compared characteristics of adsorption/desorption of shale gas with that of coalbed methane (Guo et al., 2013; Li et al., 2014; Lu et al., 1995; Zhao et al., 2013). The results showed that adsorption/desorption of coalbed methane is similar to that of shale gas. Langmuir model can be applied to both of them and there are various desorption hysteresis phenomena for shale gas. Ma et al. (2015) had conducted experimental research on desorption constants and derived an equation based on Langmuir model and mathematical method. The objective of this paper is to study the desorption process in more detail. This paper describes the change of desorption rate finely and the main influencing factors of each stage. In the actual reservoir, moisture content and mechanical properties are complex, which can affect the gas desorption (Chen et al., 2015; Han et al., 2015; Ma and Chen, 2014), and gas desorption also affects reservoir properties. In the experimental analysis, we assumed this paper ignores these factors.
Desorption process of shale gas is the result of synchronous desorption from different substances. The responses of different desorption stages differ with changing influence factors and that is the dynamic behavior in desorption process. To better describe the dynamic change, different stages characteristics should be quantitatively studied. Therefore, under this geological conditions and energy background, dividing desorption process, describing desorption stages, and explaining influence factors are research emphasis and innovation points. To this end, pore structure is analyzed first. Second, we researched desorption rate based on Langmuir model and divided particularly desorption process based on desorption rate and its change. Third, based on analyzing desorption, we discussed the meaning of inflexion points at each stage.
Samples and experimental methods
Strata information and sample sources
Target formations are the Middle Proterozoic Jixian County Department Hongshuizhuang Formation (Jxh), the Upper Proterozoic Qingbaikouan System Xiamaling Formation (Qbx), the Upper Paleozoic–Lower Permian Shanxi Formation (P1s), and the Upper Carboniferous–Lower Permian Taiyuan Formation (C2–P1t). Seven black shale samples were collected from the target formations. The strata histograms of the sampling locations are shown below map of research target area in Figure 1.
Map of the study area and stratigraphic columns of sample collection sites.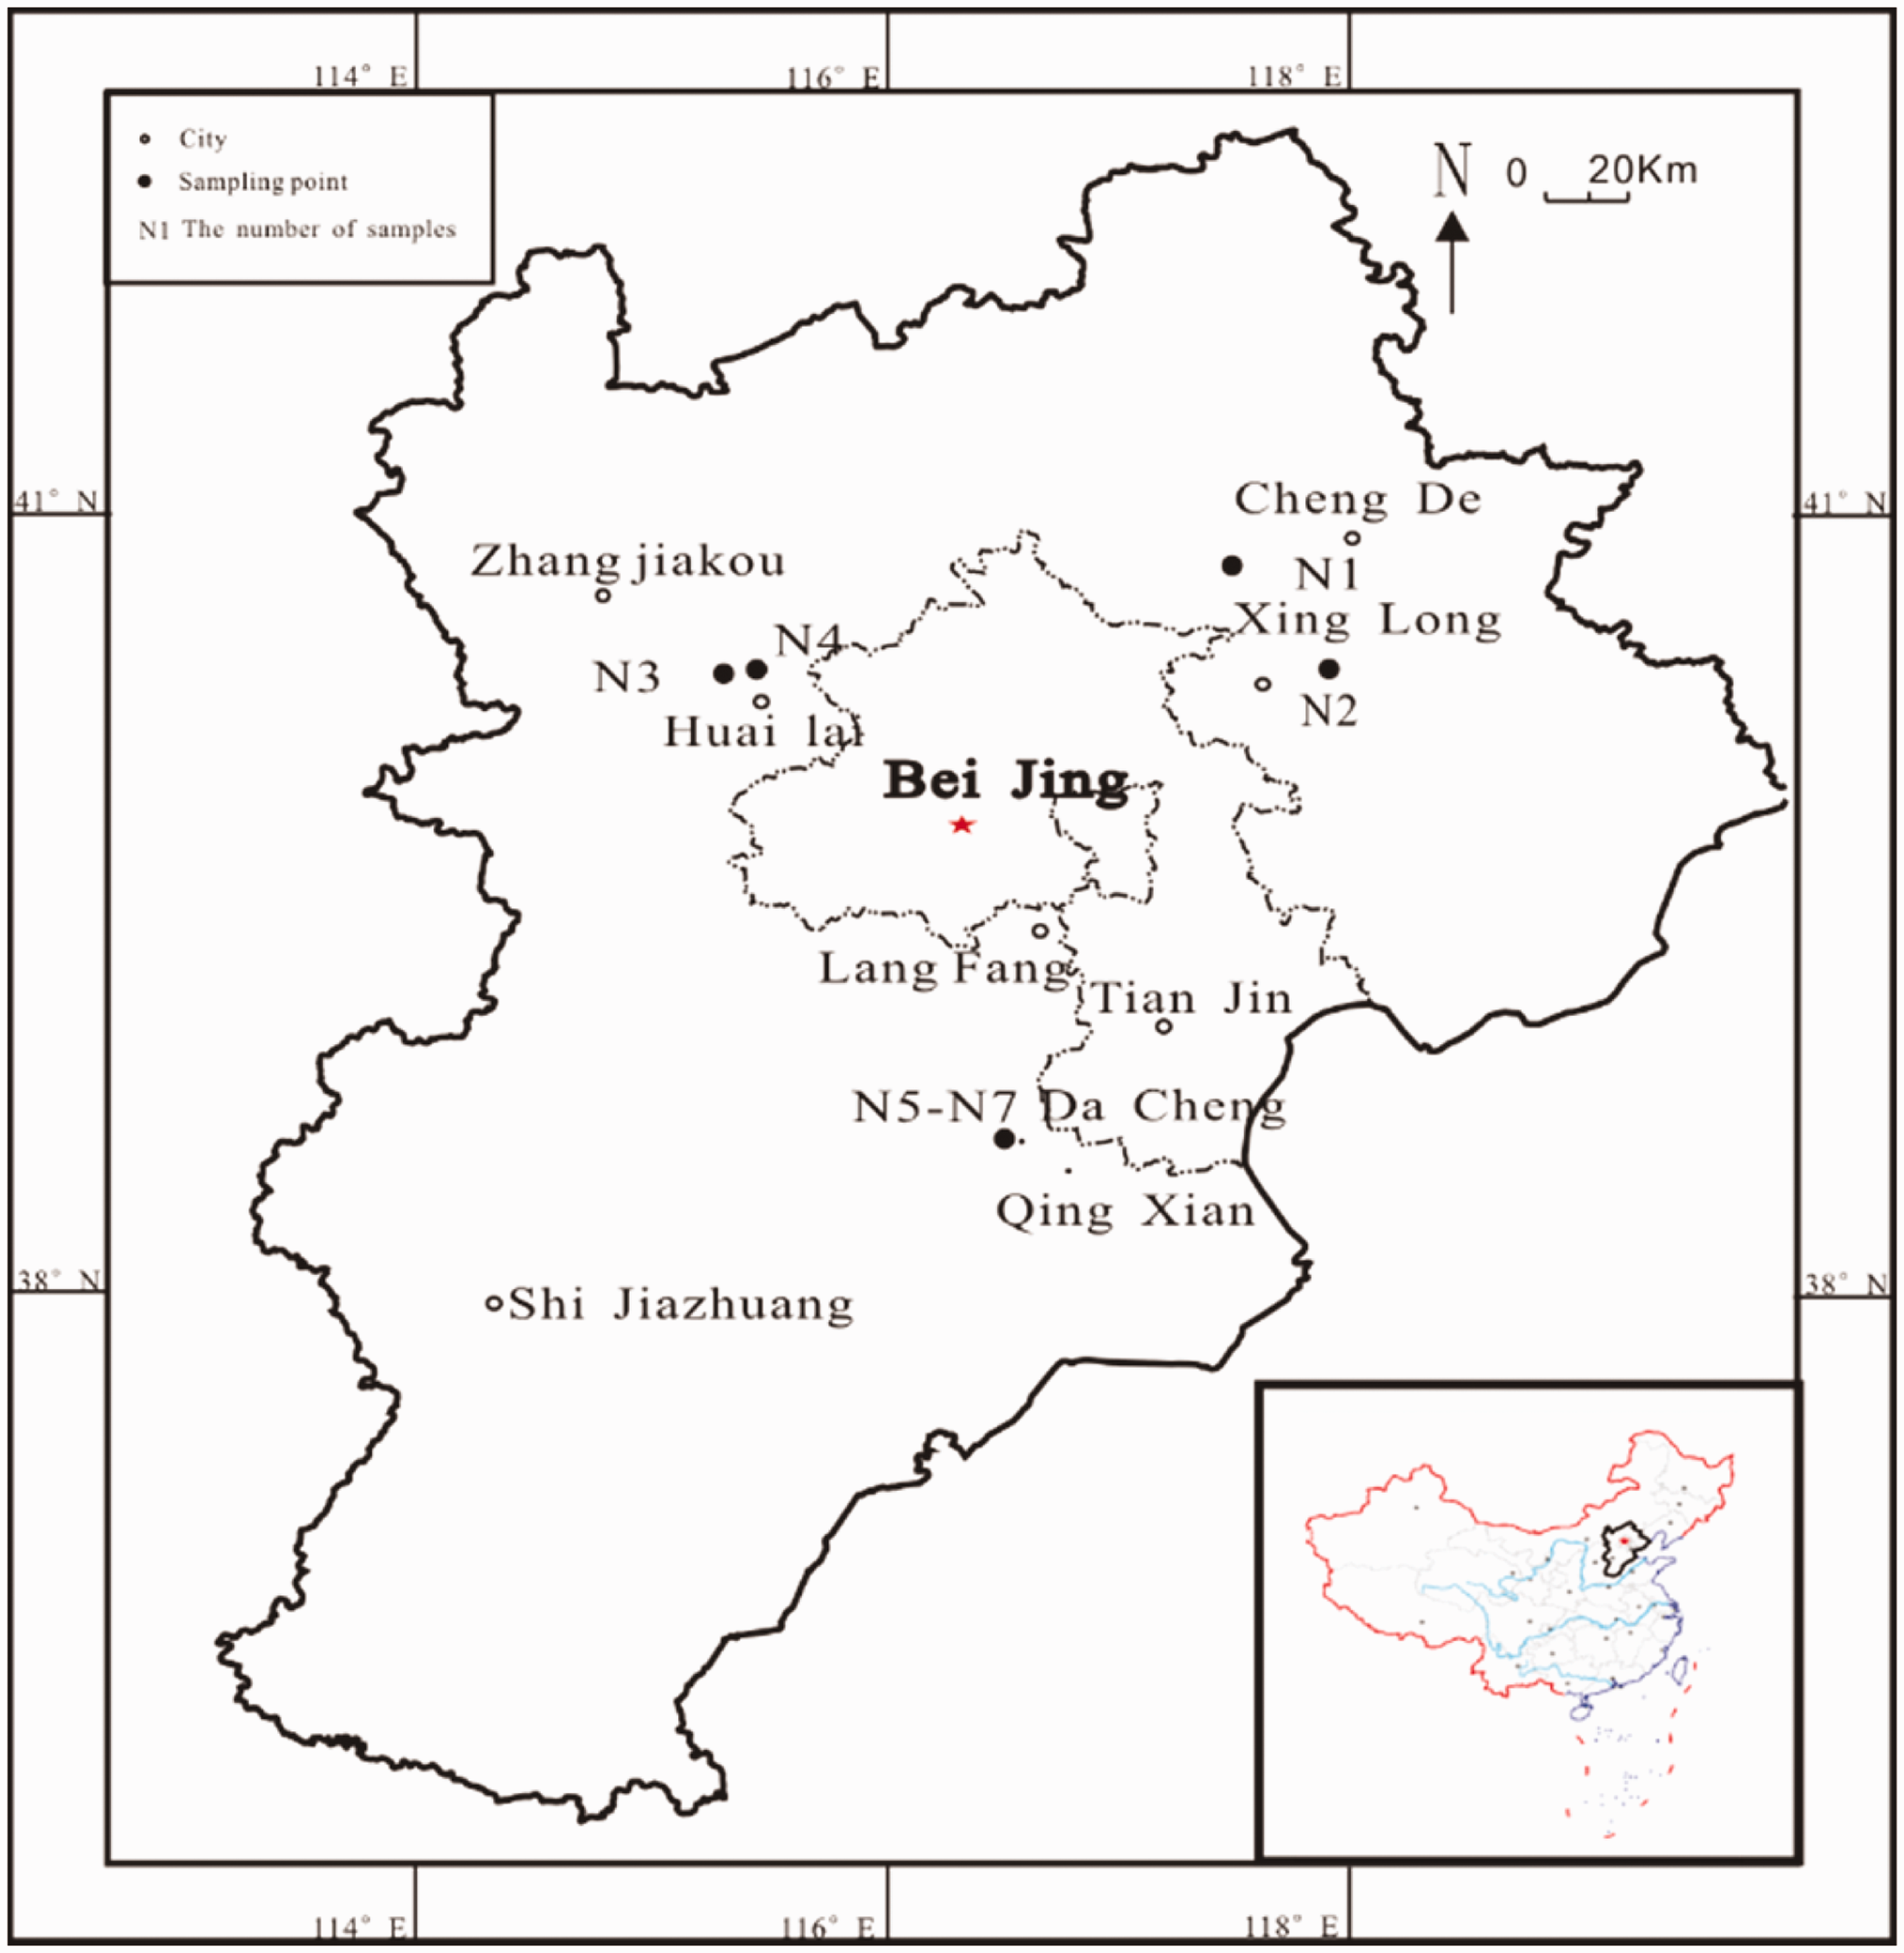
Sample handling and experiments
Samples were divided into five parts for (1) isothermal adsorption testing, (2) determination of TOC, (3) clay mineral analysis, (4) pressurized-mercury testing, and (5) low-temperature nitrogen adsorption testing.
Adsorption/desorption testing: Following Chinese national standard GB/T19560-2008, the samples were ground to size 0.2–0.3 mm and dried to approximately 5 g. Experimental apparatus was a gas isothermal adsorption/desorption apparatus IS0SORP-GAS (Ankersmid, Nijverdal, NLD). Pressure range is 0–70 MPa and temperature range is 20–200℃. The gravimetric method was used as experimental method and temperature was 30℃. Determination of TOC: TOC was measured using the CS-230 (LECO, Saint Joseph, MO, USA) type instrument. Samples were ground to size 0.2 mm and dried to 10 g. Samples were treated with 5% HCl at 80℃ to remove any carbonate and then washed six times with deionized water to remove residual HCl. The treated samples were mixed with iron powder and a tungsten–tin alloy as additives, using O2 as the combustion-accelerating gas and N2 as a carrier gas. The combustion temperature of the instrument was raised to 3000℃. The TOC was calculated by integrating the area of the peak representing the CO2 generated from the combustion of organic matter. Clay mineral analysis: Following Chinese national standard SY/T 5163-2010, the samples were ground to 0.074 mm in size, and each had a mass of 150 g. The experimental instrument was an Ultima IV (Rigaku Innovative Technologies, Auburn Hills, MI, USA) clay mineral analysis apparatus. For the experimental conditions, the scan rate was 1° (2θ)/min, the slit system width was 0.6 mm, the current was 40 mA, and the voltage was 40 kV. Pressurized mercury testing: The samples were cut into 1 cm cubes with masses of 5 g for drying, and the samples were put into the Autopore9500 (Micromeritics Instrument Corporation, Norcross, GA, USA) for the experiment. According to Chinese national standard GB/T 21650.3-2011, the dried samples were put into the dilatometer, and then the dilatometer was sealed and weighed. Subsequently, the dilatometer was put into low- and high-pressure devices to operate continuously and record data. Low-temperature nitrogen adsorption testing: The instrument model used was a NOVA2000e (Quantachrome Instruments, Boynton Beach, FL, USA). The measuring range was 2–200 nm and the measurement error was less than 3%. The isothermal physical adsorption–desorption from samples was conducted in liquid nitrogen of 77.3 K. The relative pressure (p/p0) ranged from 0.001 to 0.998. The specific surface area was obtained by the linear regression model of the Brunauer–Emmett–Teller model and the pore size distribution was calculated using the Barrett–Joyner–Halenda model.
Experimental results
Experimental results of macroscopic property tests.
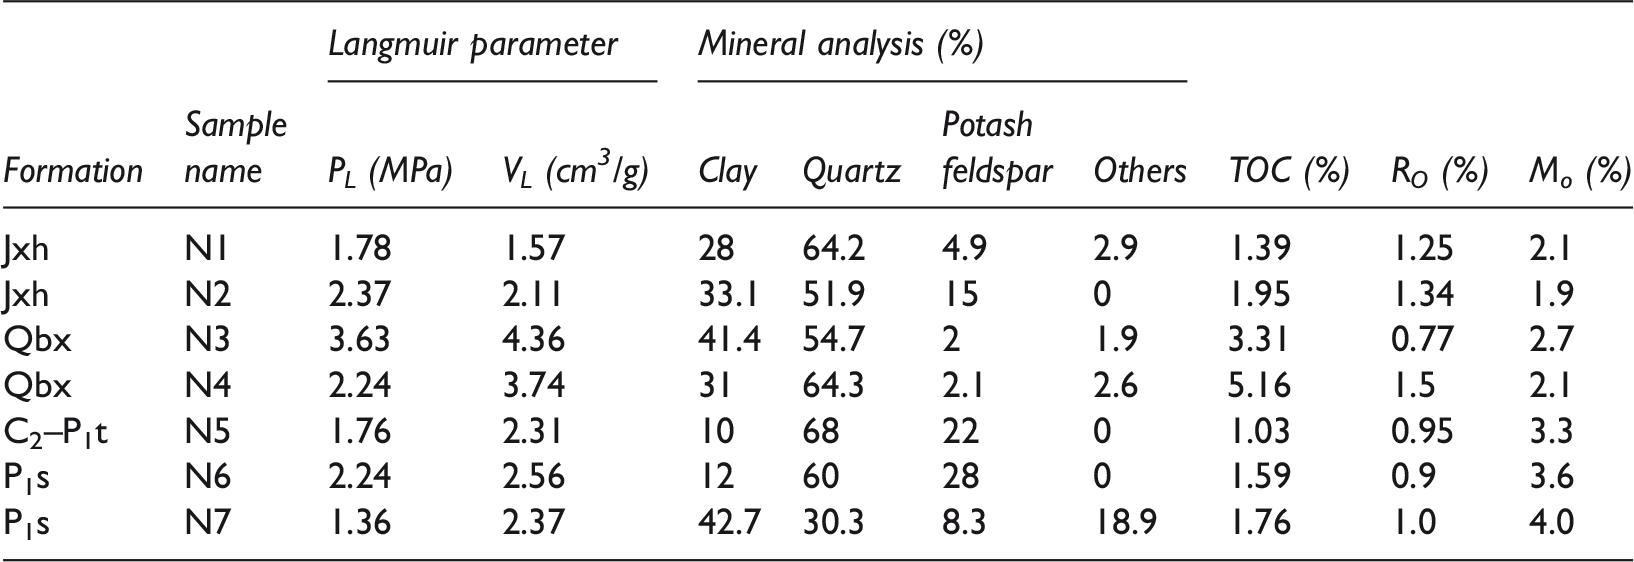
TOC: total organic carbon.
Experimental results of clay analysis.
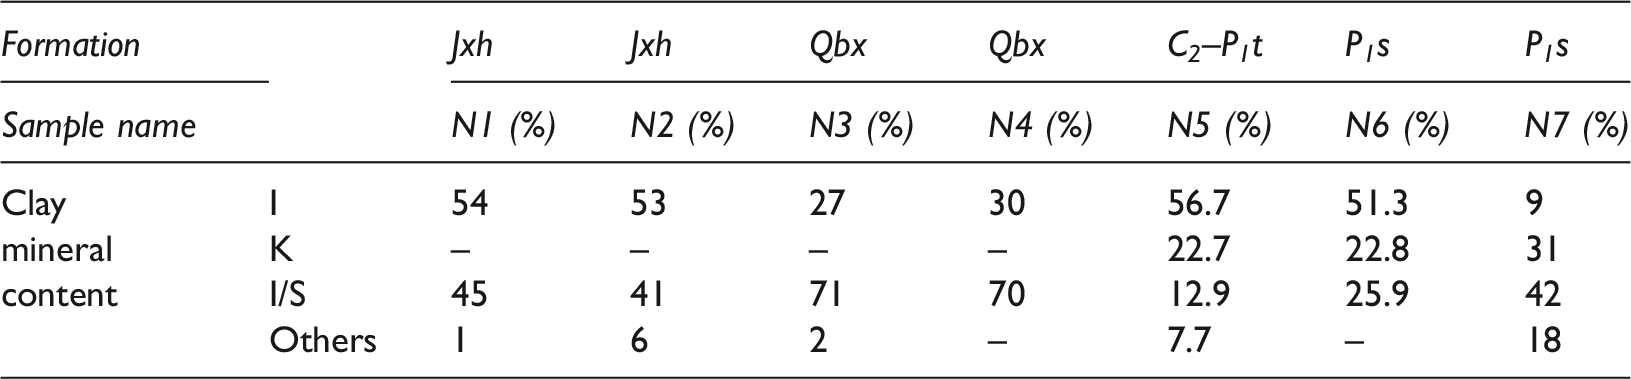
Sample locations: N5, N6, and N7 are from Dacheng County; N3 and N4 are from Zhangjiakou City; N2 is from Xinglong County; N1 is from Kuancheng County. PL is Langmuir pressure, VL is Langmuir volume, I is illite, K is kaolinite, I/S is mixed illite–smectite, TOC is total organism carbon, RO is the maturity of organic matter and Mo is moisture.
Langmuir volume (VL) of the samples increases as TOC and clay mineral content are increasing. Organic and clay mineral are the adsorbent and there is a mass of pore that can adsorb shale gas. When TOC increases, organic adsorbs more gas and VL increases (Figure 2).
Effect of the TOC (a), clay minerals (b) and on the adsorption capacity of samples. TOC: total organic carbon.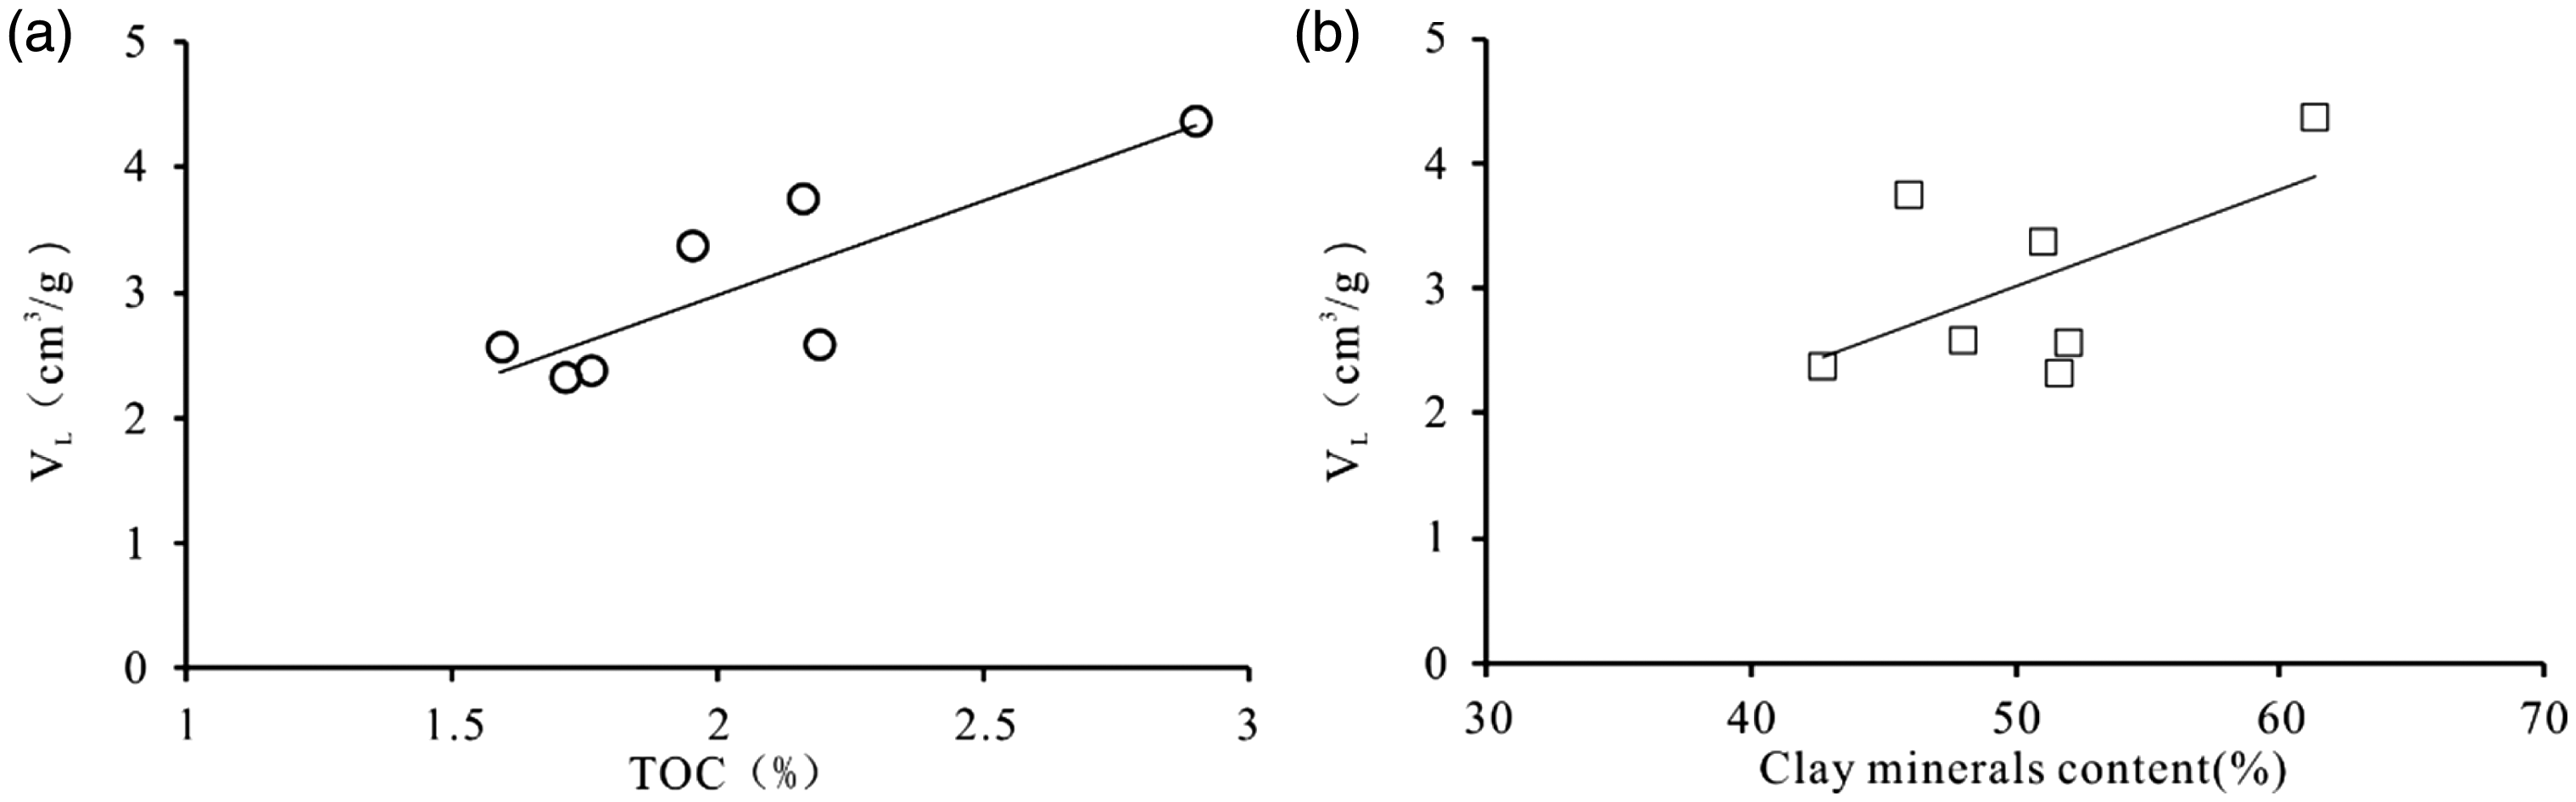
The pore classification is based on B.B.Ходот. S1 corresponds to mesopore-specific surface area (1000 nm>ф>100 nm). S2 corresponds to transition pore-specific surface area (100 nm>ф>10 nm). S3 corresponds to micropore-specific surface area (10 nm>ф>2 nm).
Pore-specific surface area of shale samples.
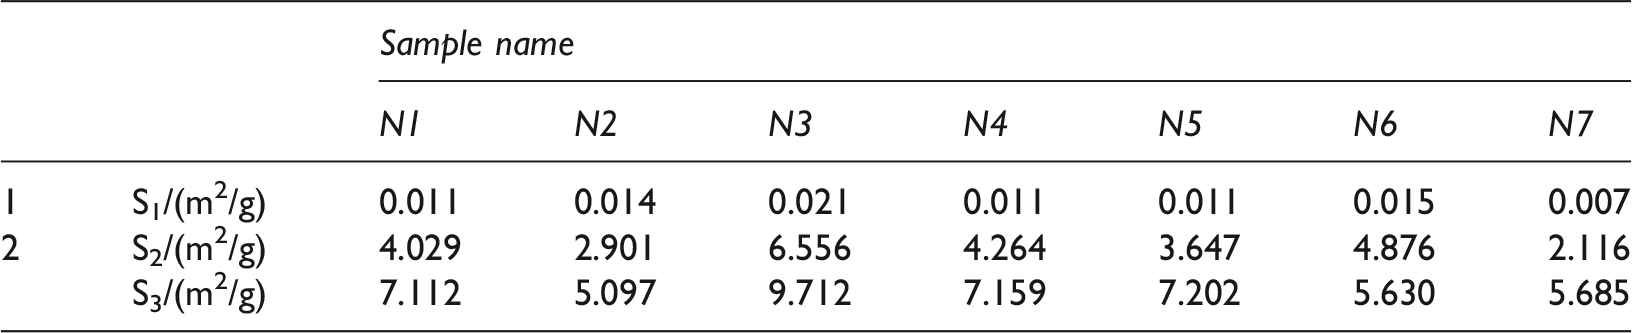
Number 1 is from pressurized mercury testing and number 2 are from low-temperature nitrogen adsorption.
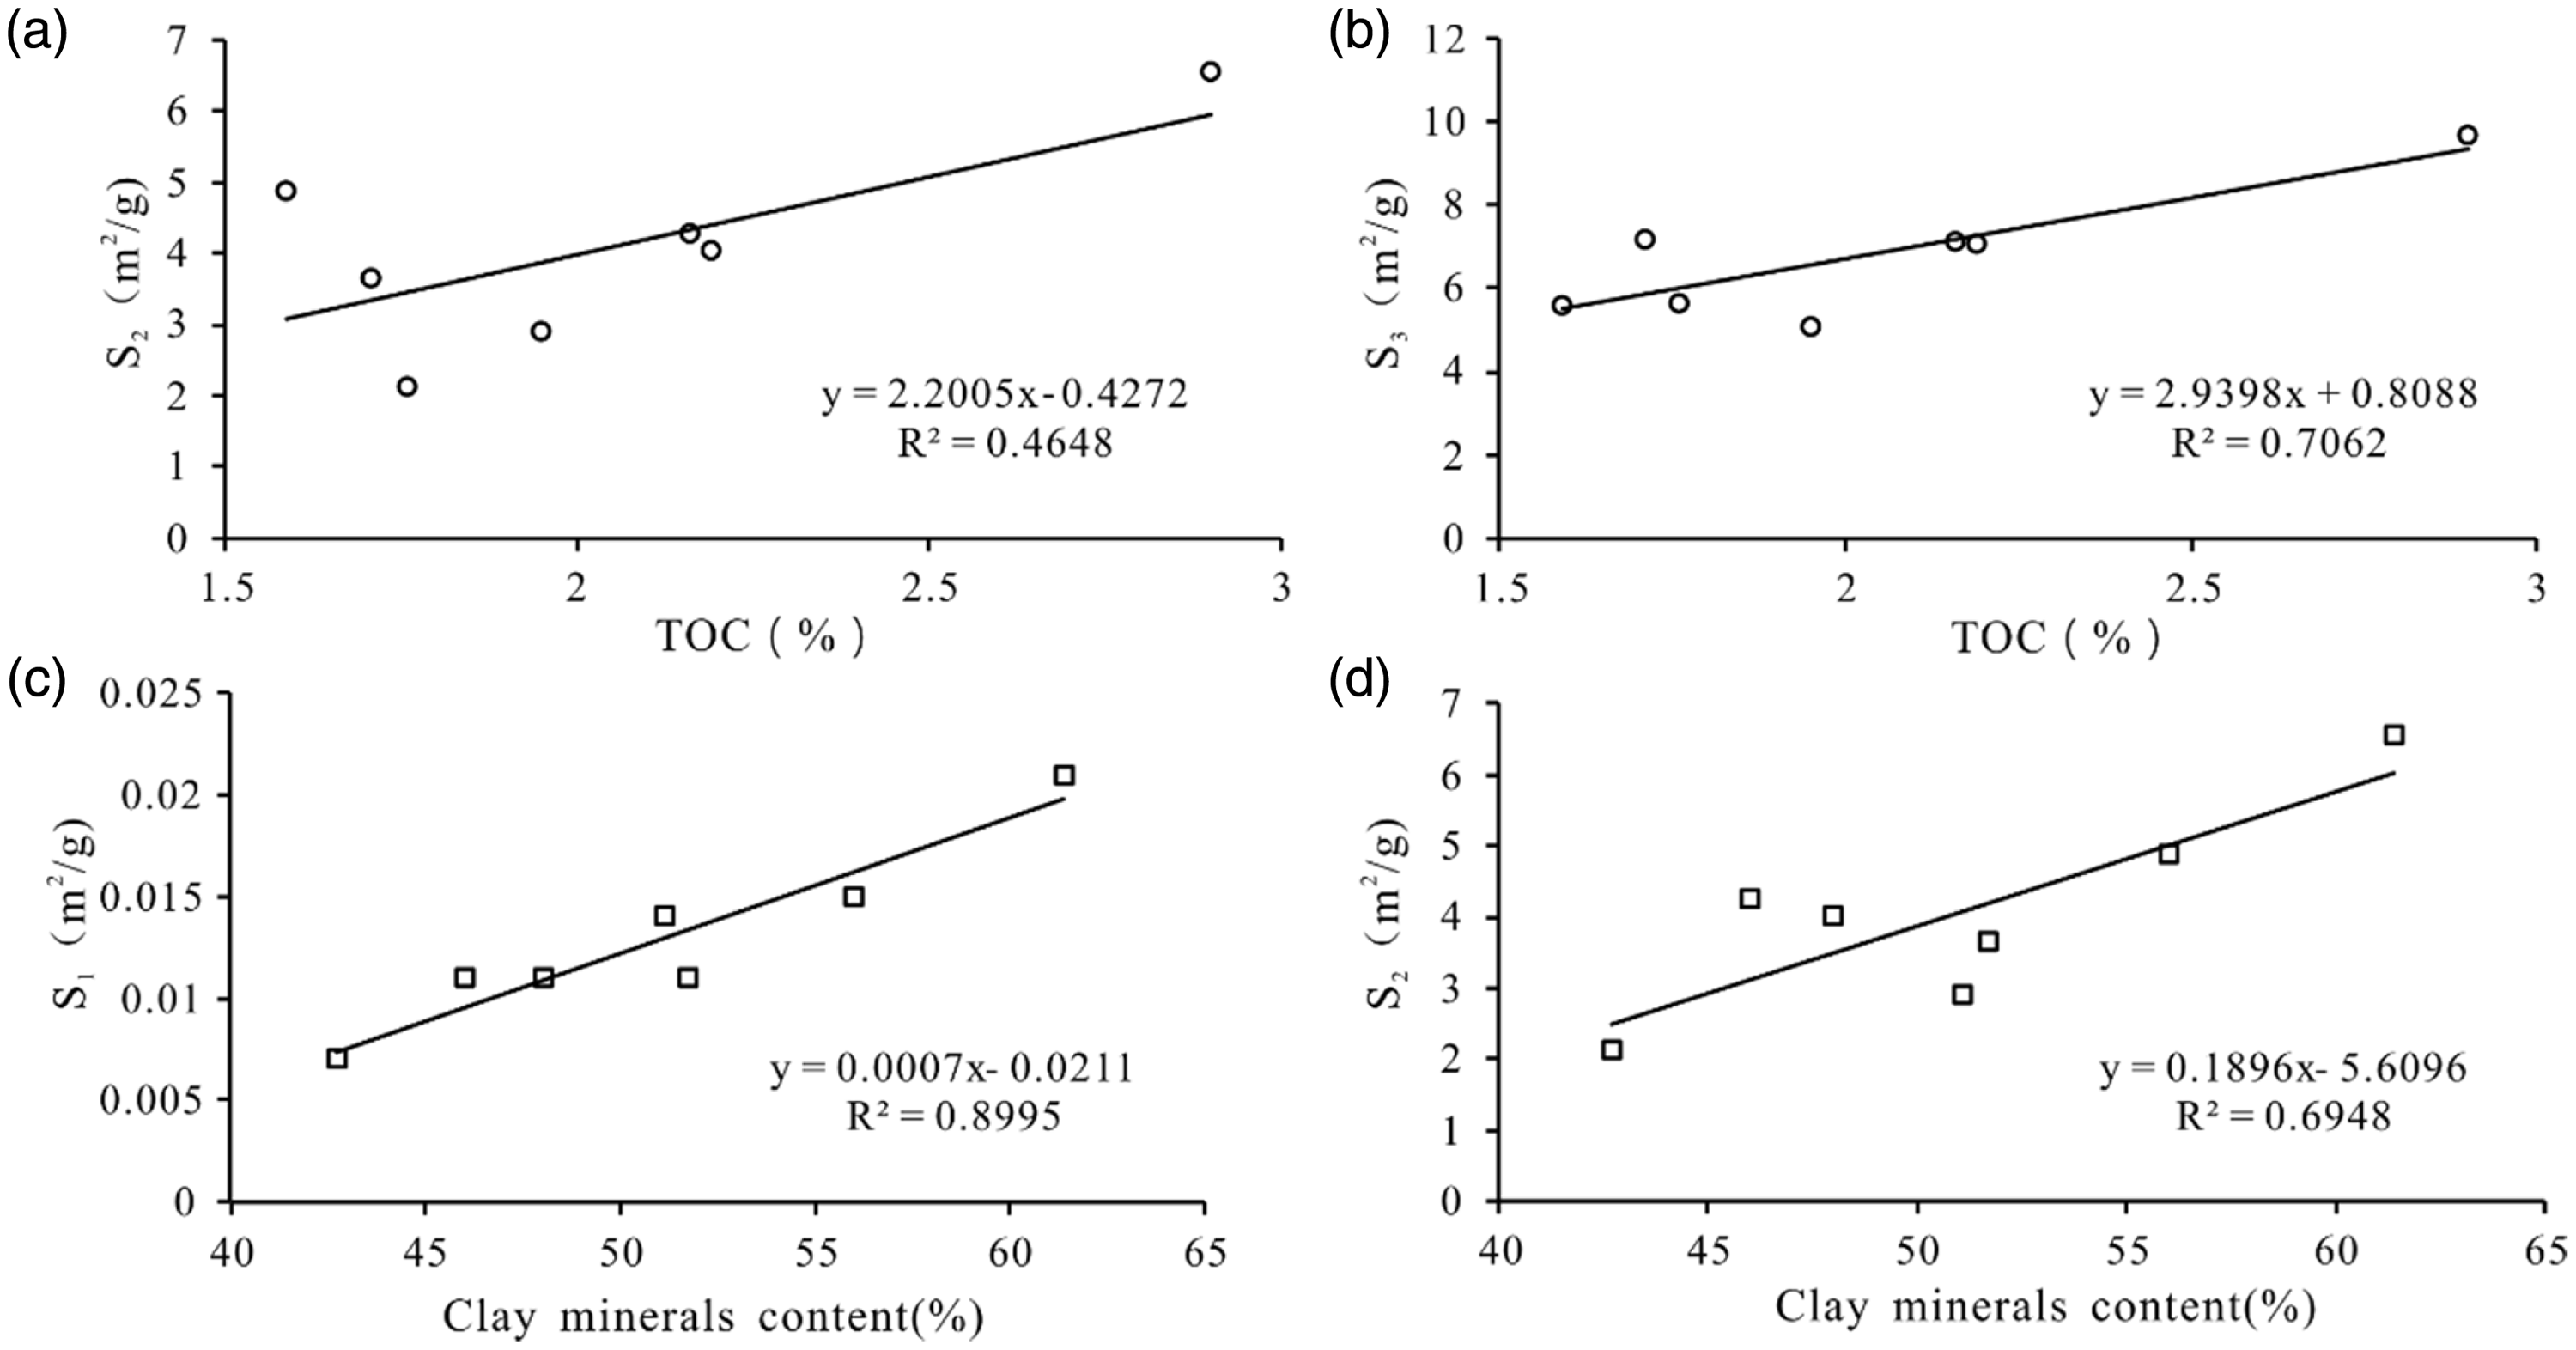
The relations between pore-specific surface area and TOC (a, b) and clay minerals content (c, d). TOC: total organic carbon.
Analytical evaluation
Establishing desorption model of shale gas
The multiple stages of desorption process are reflected by significant changes of the desorption rate. Therefore, the desorption stages characteristics should be analyzed in detail. It is assumed that the adsorption and desorption of gas production accord with Langmuir model. The Langmuir model is a classic model, and this model has been accepted widely and applied by the experts in this field. Experimental conditions are ideal conditions. On the one hand, that the samples were dried and this study did not consider the effects of moisture, on the other hand, under the experimental conditions, the sample size is small and the gas desorption is continuous.
Previous researchers have found that adsorption on pore surface of shale gas can be described by the Langmuir model (Guo et al., 2013; Ma et al., 2015a, 2011; Zhang et al., 2013b), which is

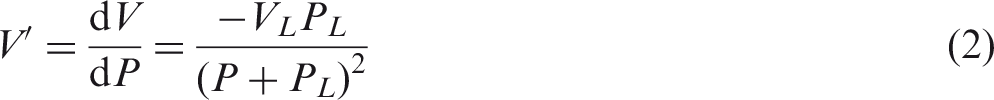
Desorption rates of shale increase as the pressure decreases, but the change rates differ during desorption process (Figure 4). Desorption rates observably increase after the pressure is less than 2 MPa.
Desorption rate curves of different shale samples.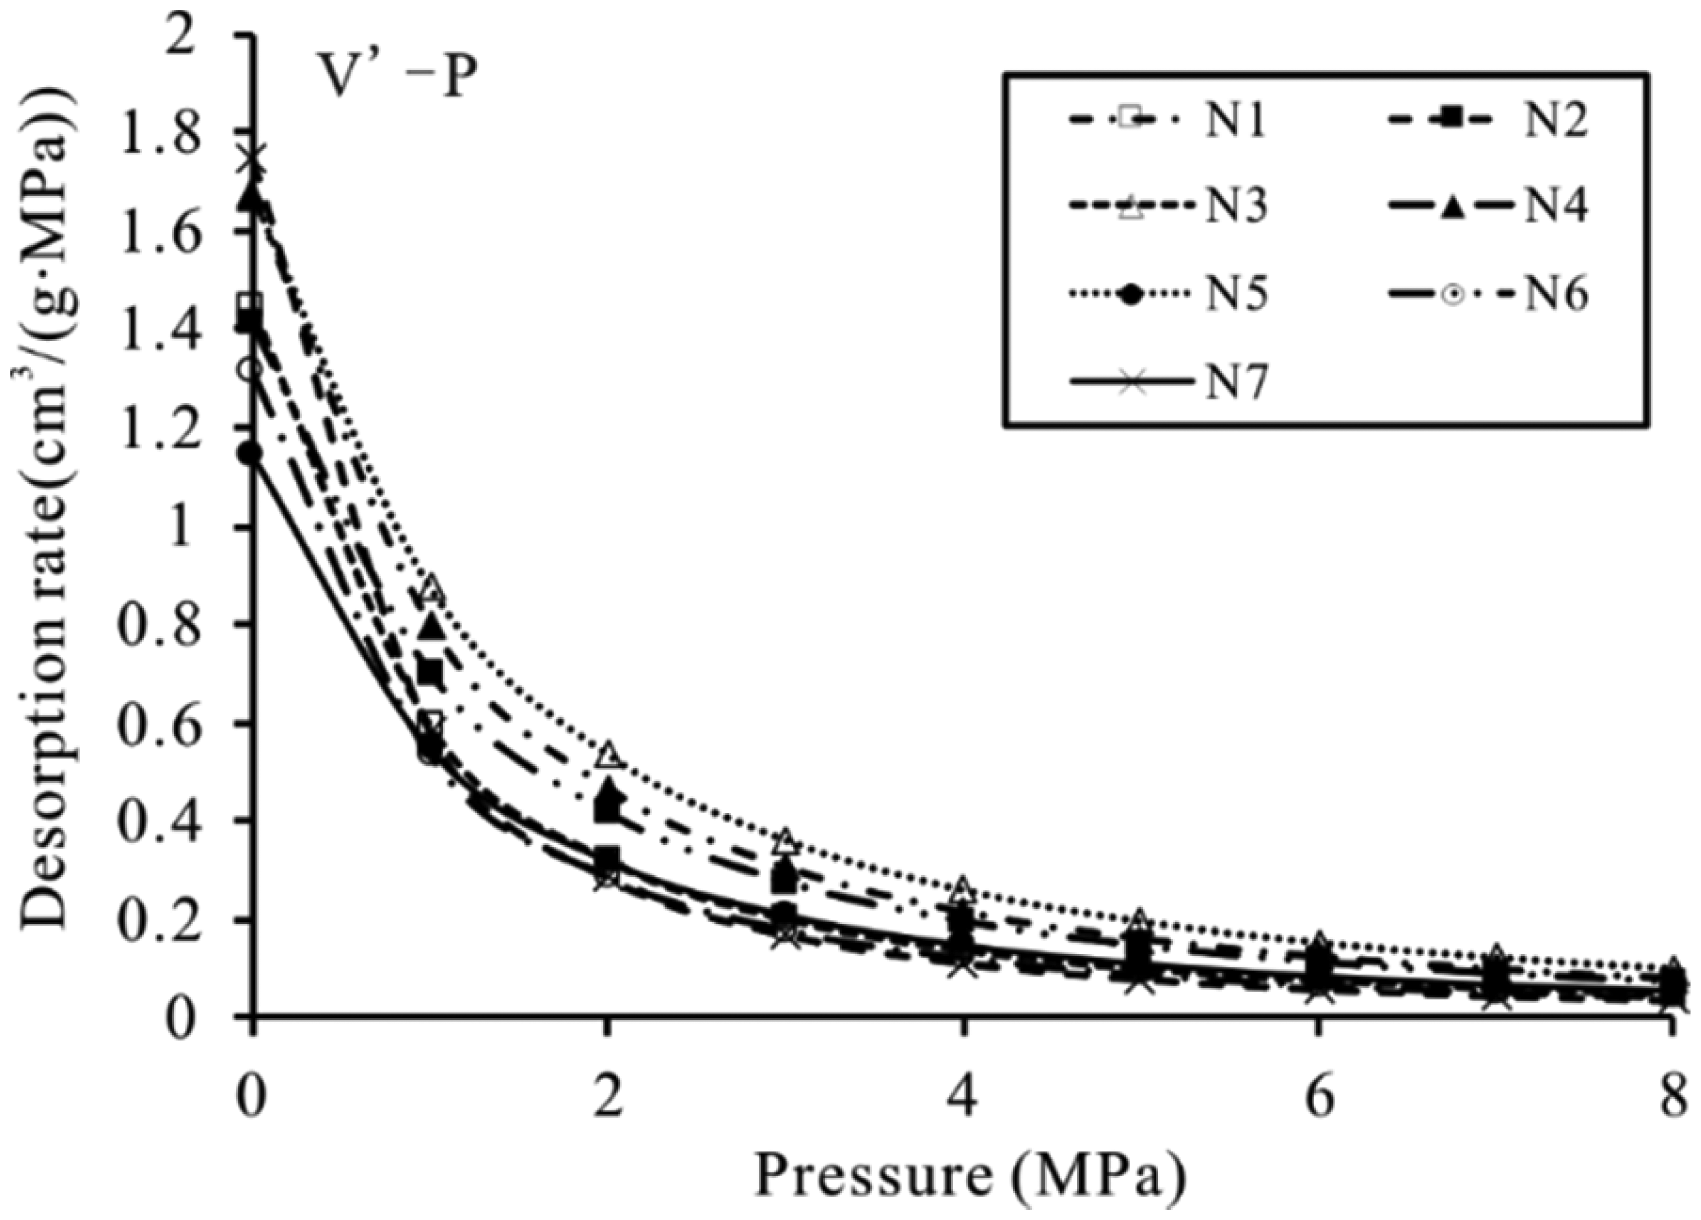
To better analyze the change in desorption rate, the curvature (K) of desorption rate is introduced
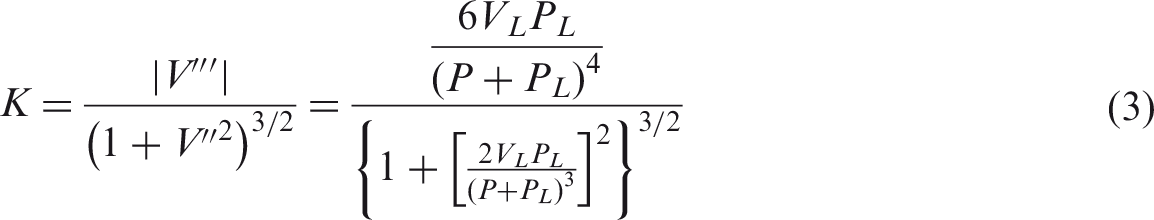
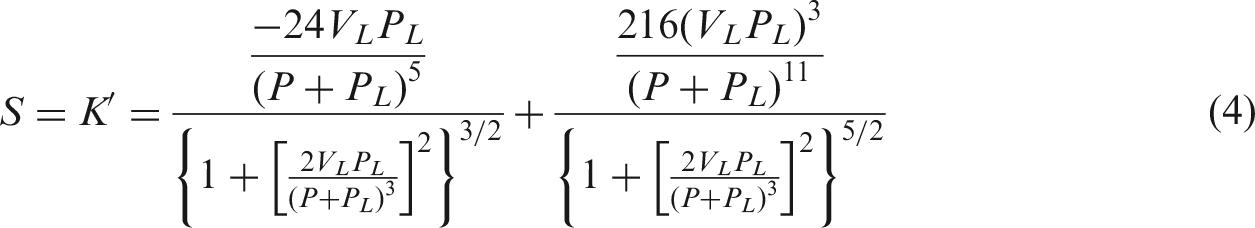
Additionally, the slope (S) of this curvature is given by
The curves show that the curvatures of desorption rates are different (Figure 5). The curves change slowly after the initial variation. However, the curvature cannot fully describe the pressure where desorption rate changes significantly. Therefore, the slopes of curves are introduced to analyze change rate of the curve. When the slope of the curve is large, desorption rate changes rapidly. The inflexion points of the curve are the important pressure points where the desorption rates change significantly (Figure 5(b)). There are two inflexion points (Q2 and Q3, shown in Figure 5) and an initial pressure point Q1 (critical desorption pressure) on the curves and the desorption rates vary significantly in Q2 and Q3.
(a) Curvature of desorption rate curve and (b) its first derivative.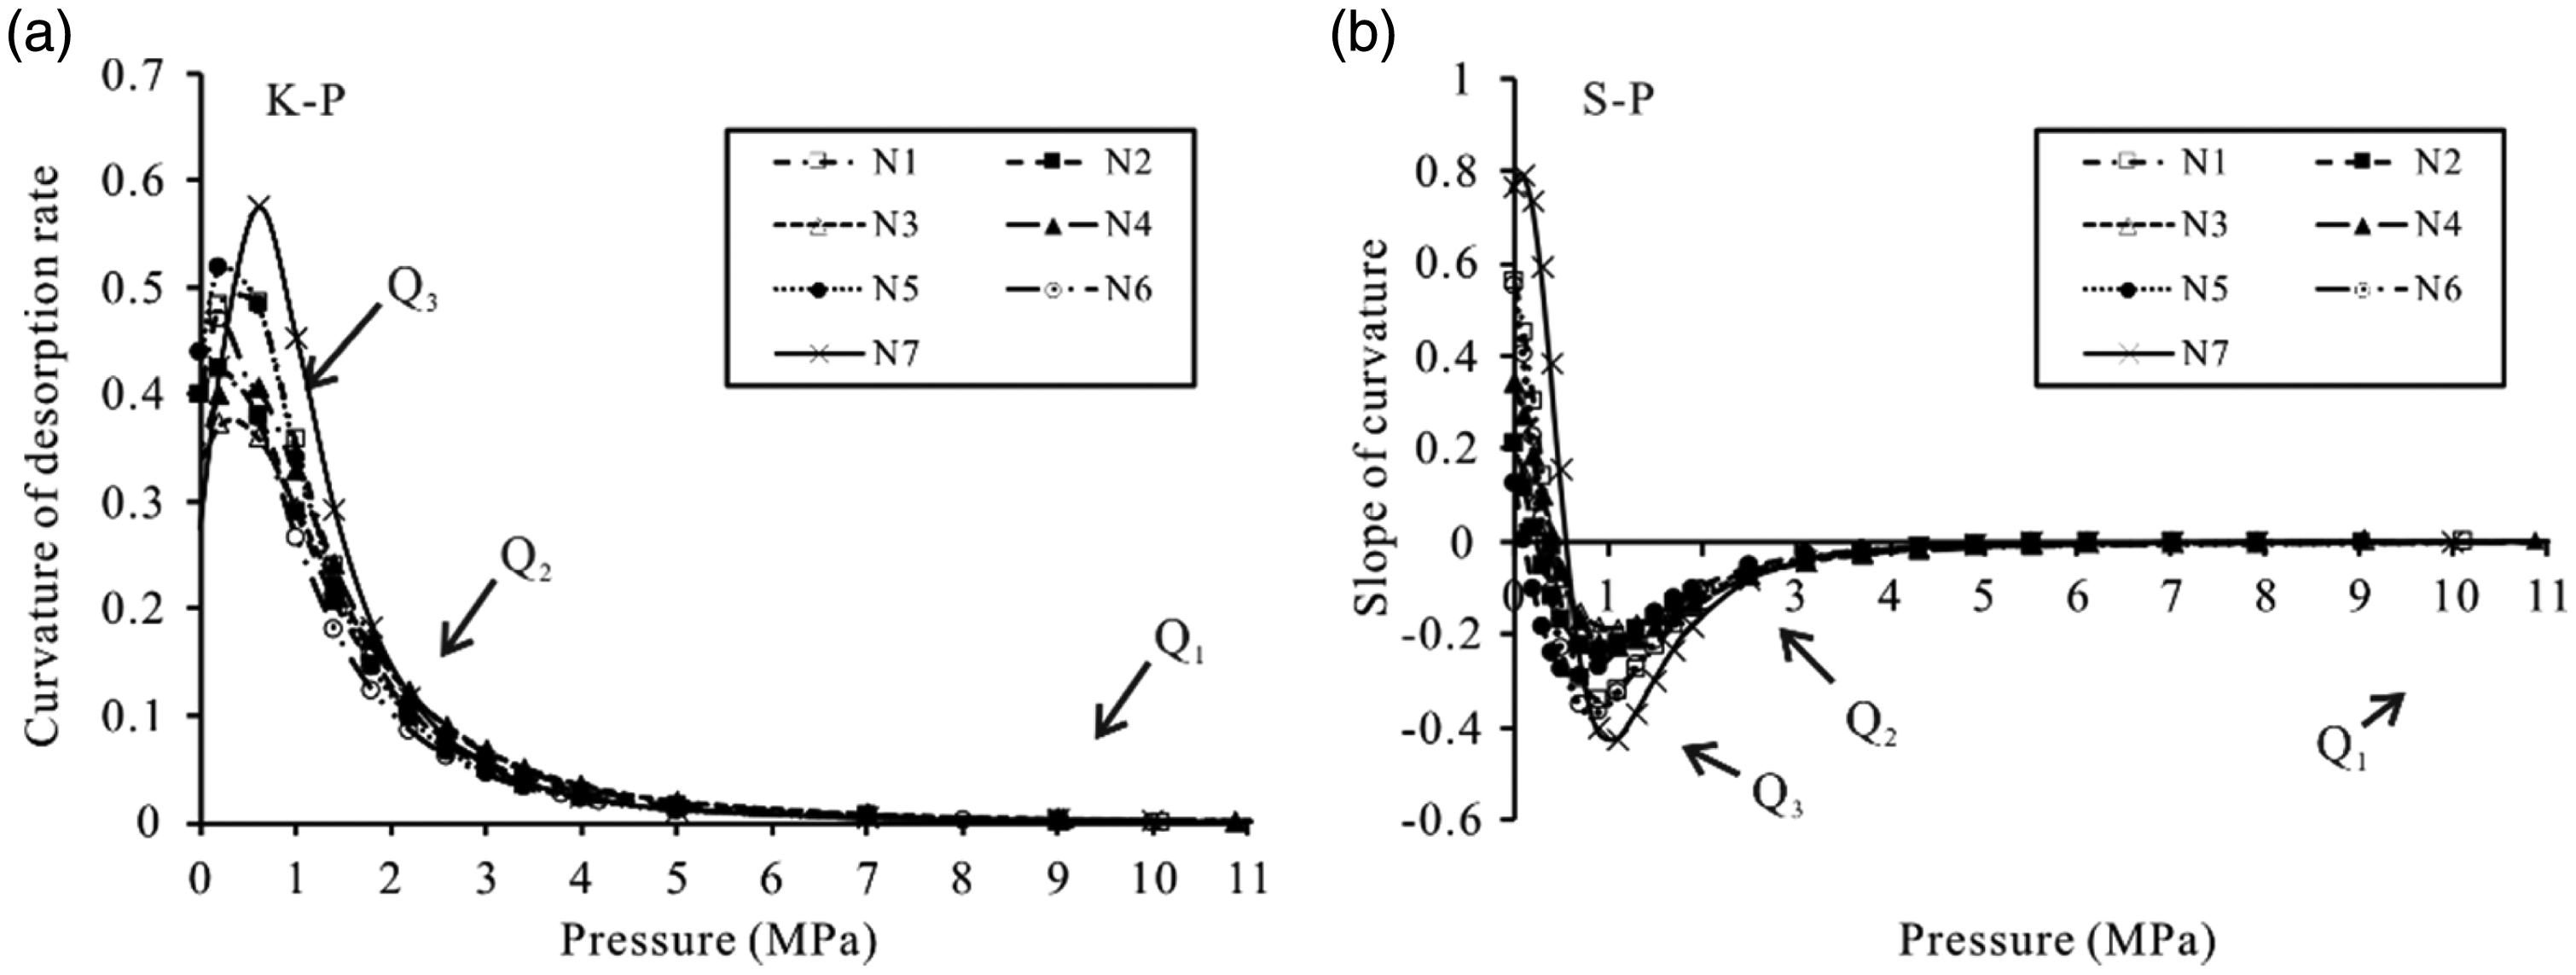
Because of a slight change of curve amplitudes in the early stages of desorption, Q2 pressure points are not easy to identify. Thus, the derivative of S needs to be calculated in order to clearly identify the position of Q2
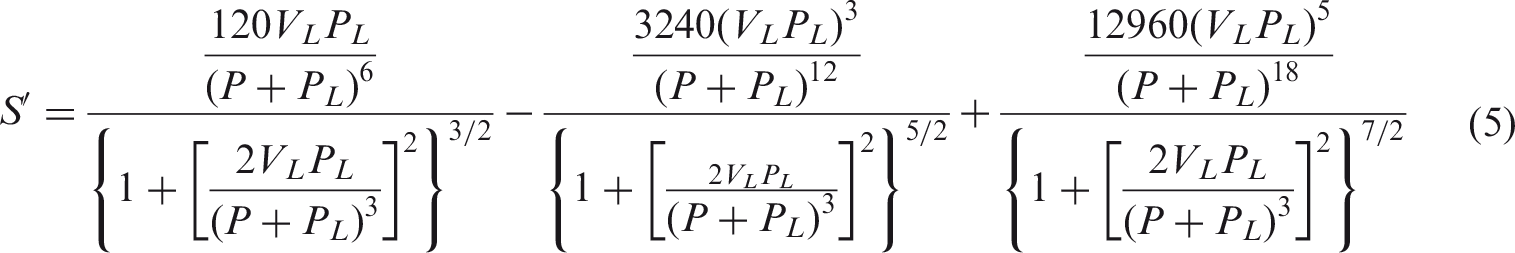
These curves are plotted in Figure 6. The ordinate of Figure 6 represents S′—the slope of the slope curve (S–P).
The relations between desorption pressure and change rate of slope of curvature.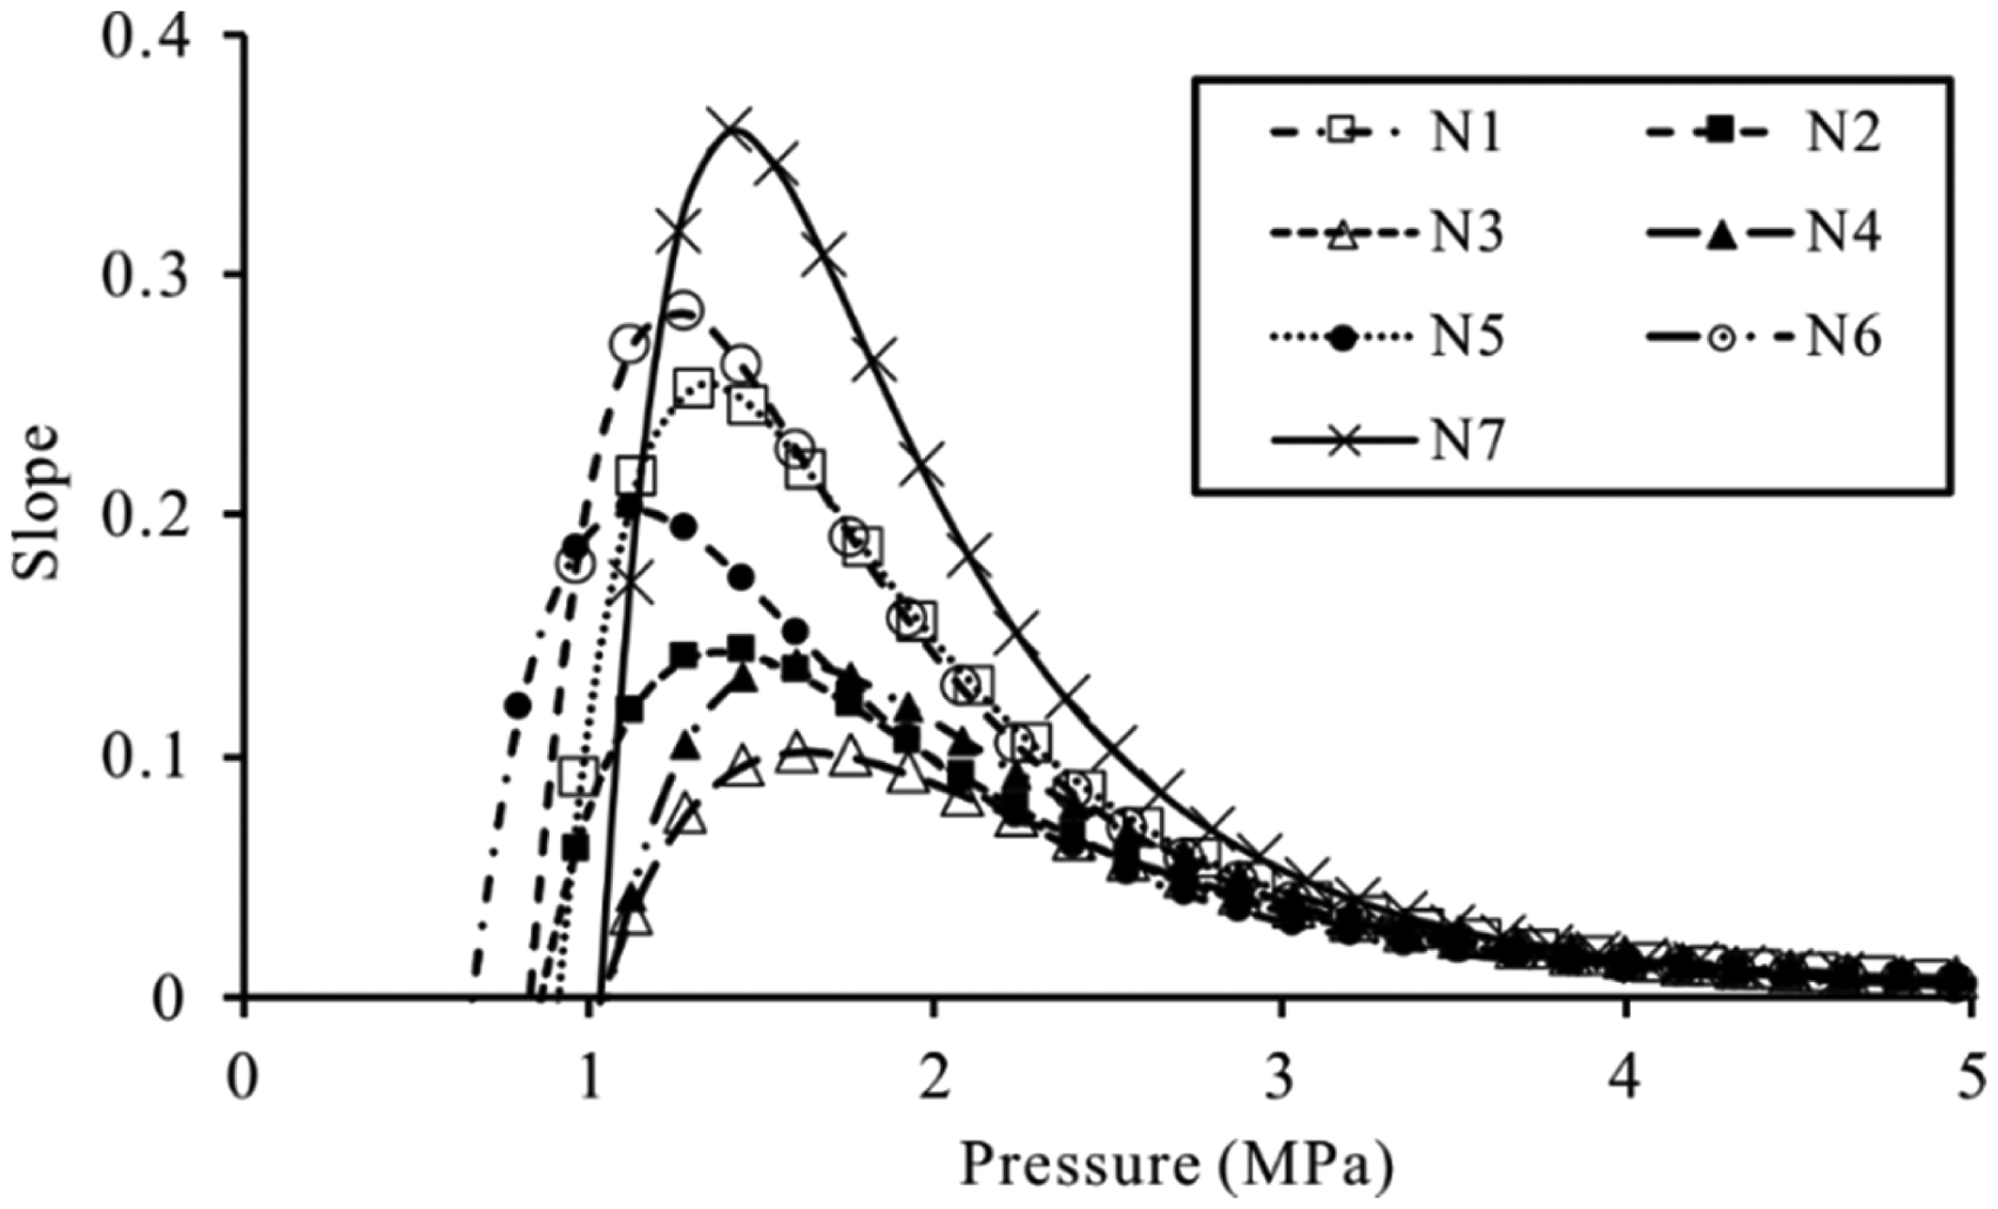
Numerical description of shale gas desorption process
The pressure of inflexion points.
Slow desorption stage (Q1–Q2)
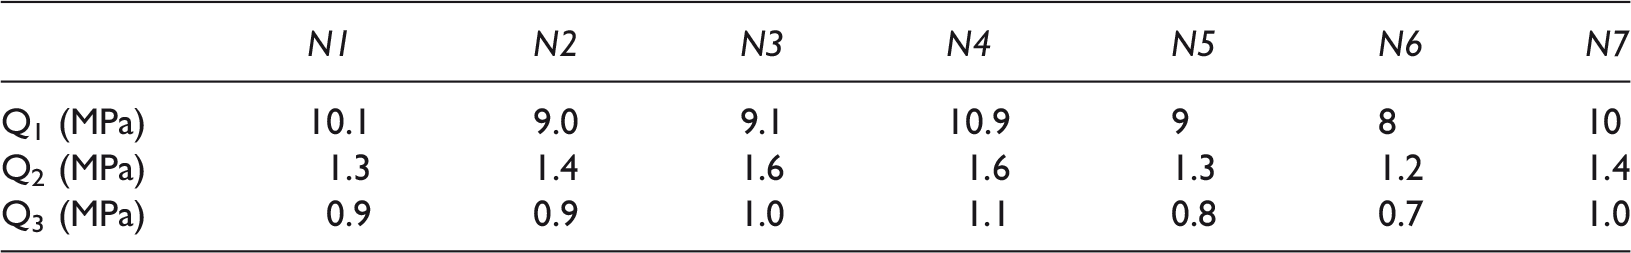
Pressure range of Q1–Q2 is the first desorption stage and desorption rate is low. In this stage, a small amount of gas will be produced as pressure is decreasing. Some researchers believe that clay mineral content has a significant impact on the adsorption/desorption of shale gas (Ji et al., 2012a). Clay mineral and TOC are main research targets (Figure 7). The ordinates represent pressure difference between Q1 and Q2.
The relations between (a) TOC and (b) clay minerals content and the pressure difference between Q1 and Q2. TOC: total organic carbon.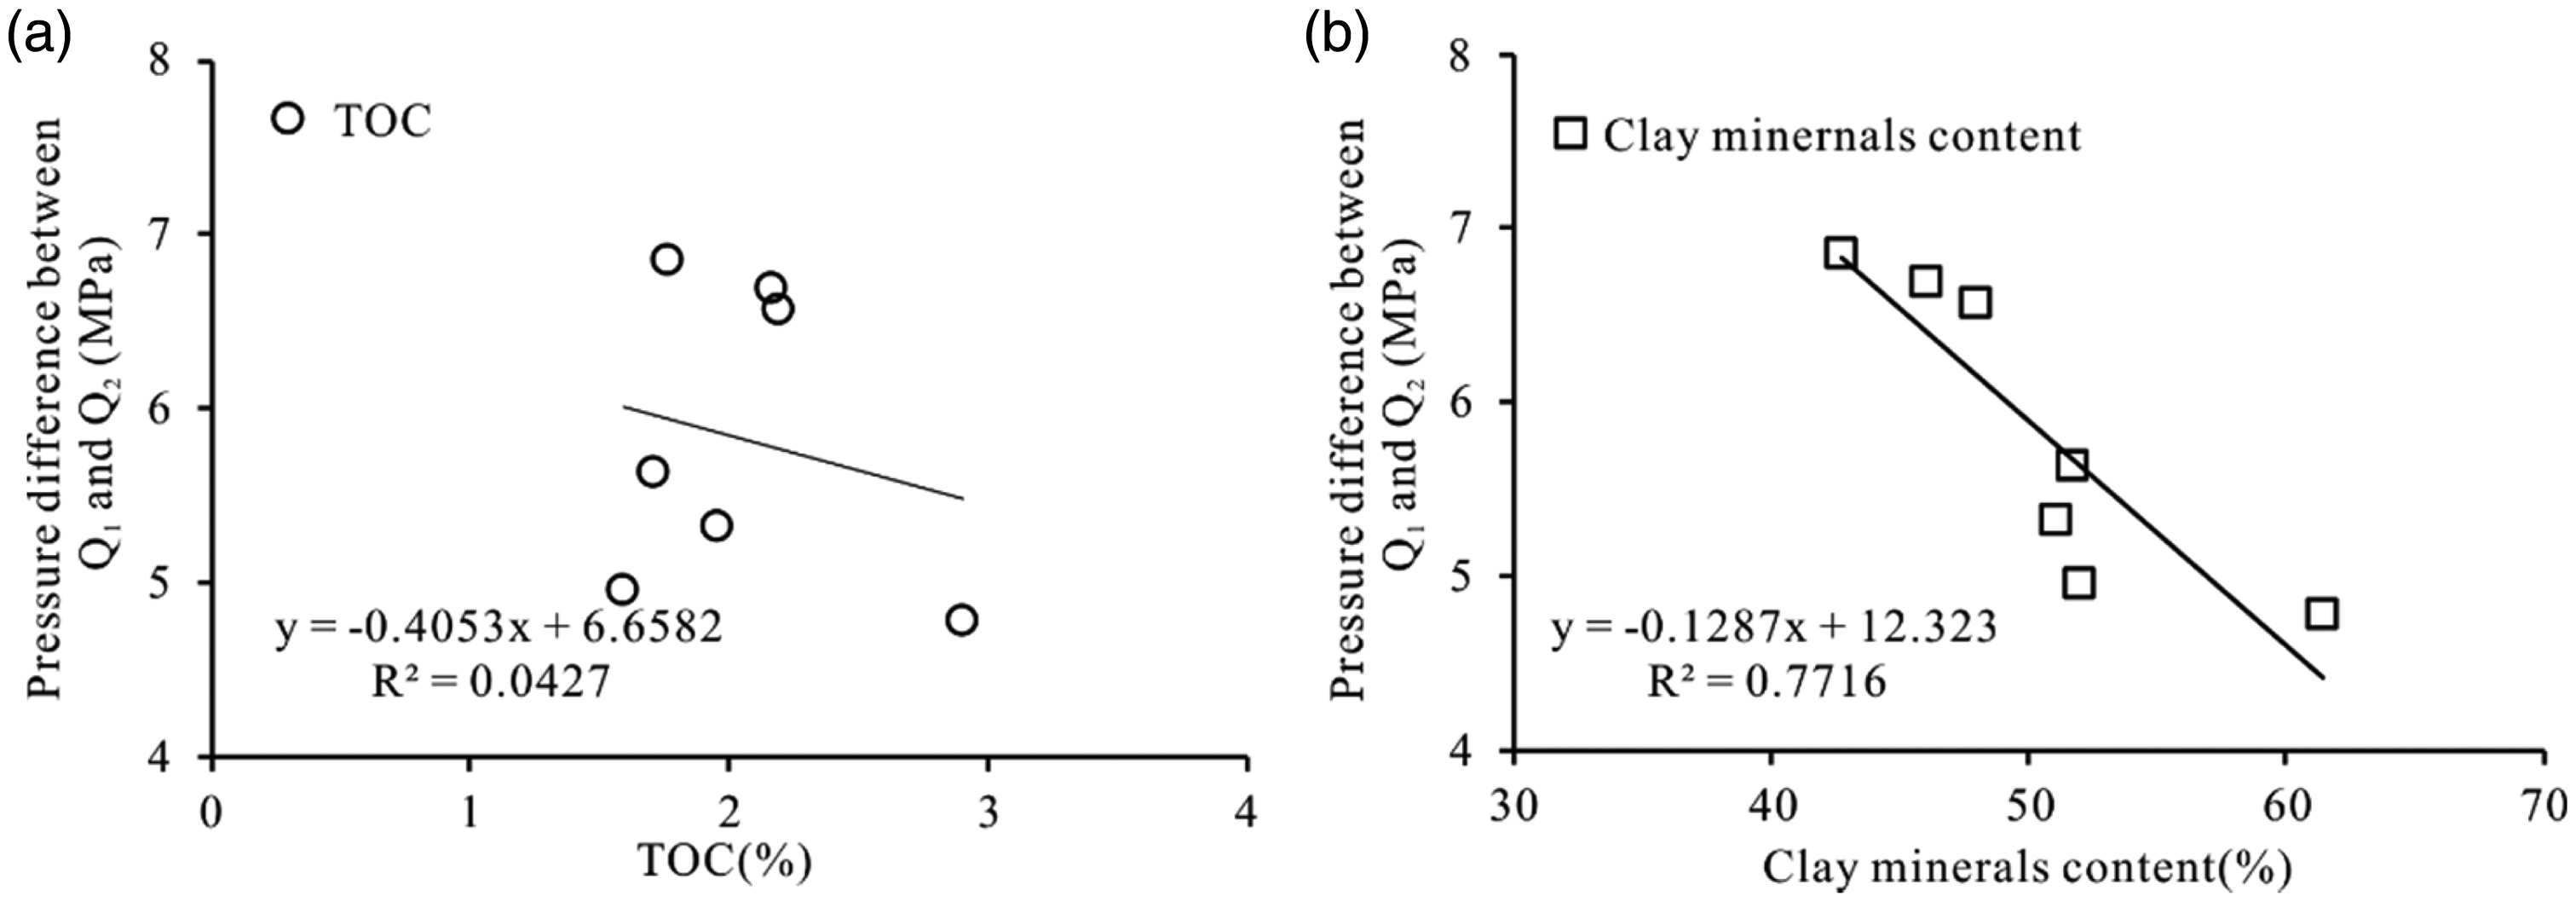
The first desorption stage increases as TOC but it decreases as clay mineral content increases. Clay mineral content has an observable effect on the pressure difference between Q1 and Q2, and effect of TOC is weaker than that of the clay mineral. When TOC decreases and clay mineral content increases, slow desorption process will get shorter and large desorption stage will come quickly.
Some scholars have studied the adsorption and desorption of shale gas. Adsorbents with strong adsorption capacity have preferential adsorption and hysteretic desorption properties (Sheng et al., 2014). The large pore is earlier than small pore and desorption occurs preferentially on the surface of macropores and mesopores (Ji et al., 2012b; Zhang et al., 2013a). Therefore, when pressure decreases, clay minerals desorption occurs earlier. And because of the weak desorption capability of clay minerals, desorption rates and corresponding curvature are low during the first desorption stage.
Large desorption stage (Q2–Q3)
The second desorption stage (Q2–Q3) is referred to as the large desorption stage. The pressure difference between Q2 and Q3 increases linearly with increases in TOC and clay mineral content (Figures 8). Comparison and analysis are conducted in two groups with TOC and clay mineral content as independent variables and the pressure difference as the dependent variable. It shows that there is an obvious binary linear relationship between independent variables and dependent variables and the correlation coefficient R square is 0.73. Partial regression coefficients of TOC and clay mineral are 0.03 and 0.008. The partial regression coefficients ratio is approximately four times between TOC and clay mineral content. Therefore, TOC has a stronger influence on large desorption stage than clay mineral. The desorption gas primarily consists of organic matter desorption gas and clay mineral desorption gas.
The relations between (a) TOC and (b) clay minerals content and the pressure difference between Q2 and Q3. TOC: total organic carbon.
In this stage, desorption rate and corresponding curvature are high. This stage is the stable desorption process and a large amount of gas will be produced. Clay mineral and organic matter develop substantial transition pore and micropore. Specific surface area of that pore is big and large desorption gas primarily comes from those pores. When pressure decreases, gas will be produced fast and largely.
Final desorption stage (Q3–0)
The Q3–0 pressure section is the third desorption stage. As pressure decreases, the curvatures and desorption rates are larger and faster. As clay mineral decreases or TOC increases, the pressure of Q3 increases (Figure 9). Unlike TOC, relativity between clay mineral and pressure is weak.
The relations between (a) TOC and (b) clay minerals content and the pressure in Q3. TOC: total organic carbon.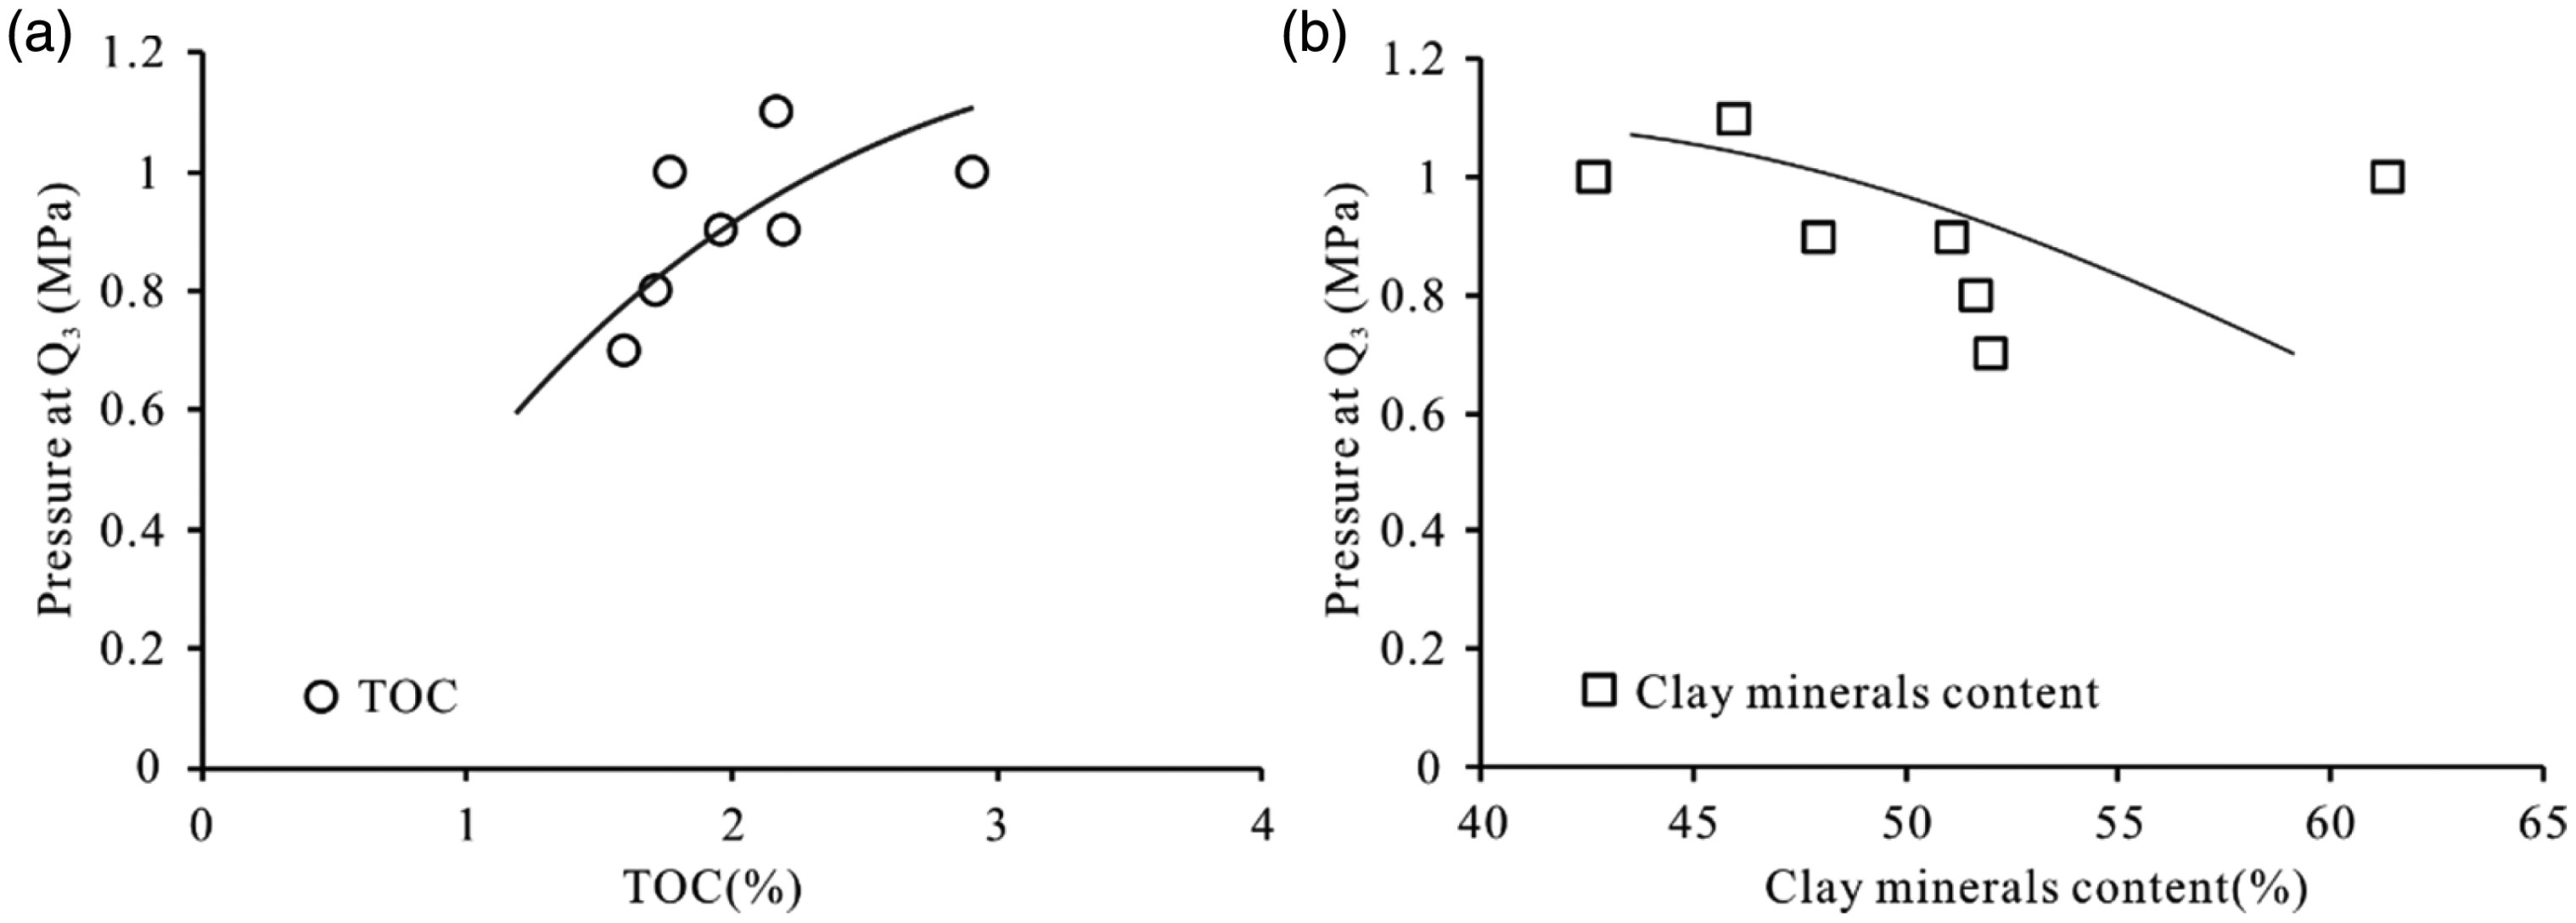
This stage is final desorption stage and gas mainly originated from the micropore. Organic mineral develops substantial micropore and clay mineral has unobvious contribution to micropore. Therefore, this stage will extend as TOC increases, and this stage has no significant extension as clay mineral content increases.
Discussion of meaning of inflexion points
In the actual production, the gas desorption can be divided into an initial depressurization stage, a stable production stage, and a production decline stage. The Q2 indicates the arrival of desorption peak and the Q3 indicates that the gas desorption rate decreases gradually. In experimental analysis, the reason why desorption rate did not decrease is that samples are small so that all gas can continuously produce without production interruption. In Figure 10, the Q2 pressure will increase as VL increases and the Q3 pressure will increase as VL/PL increases. It shows that the advent of gas production attenuation may be early as VL increase, meanwhile, the cycle of large gas production may be shortened.
The relations between VL (a), VL/PL (b), and pressures of inflexion points.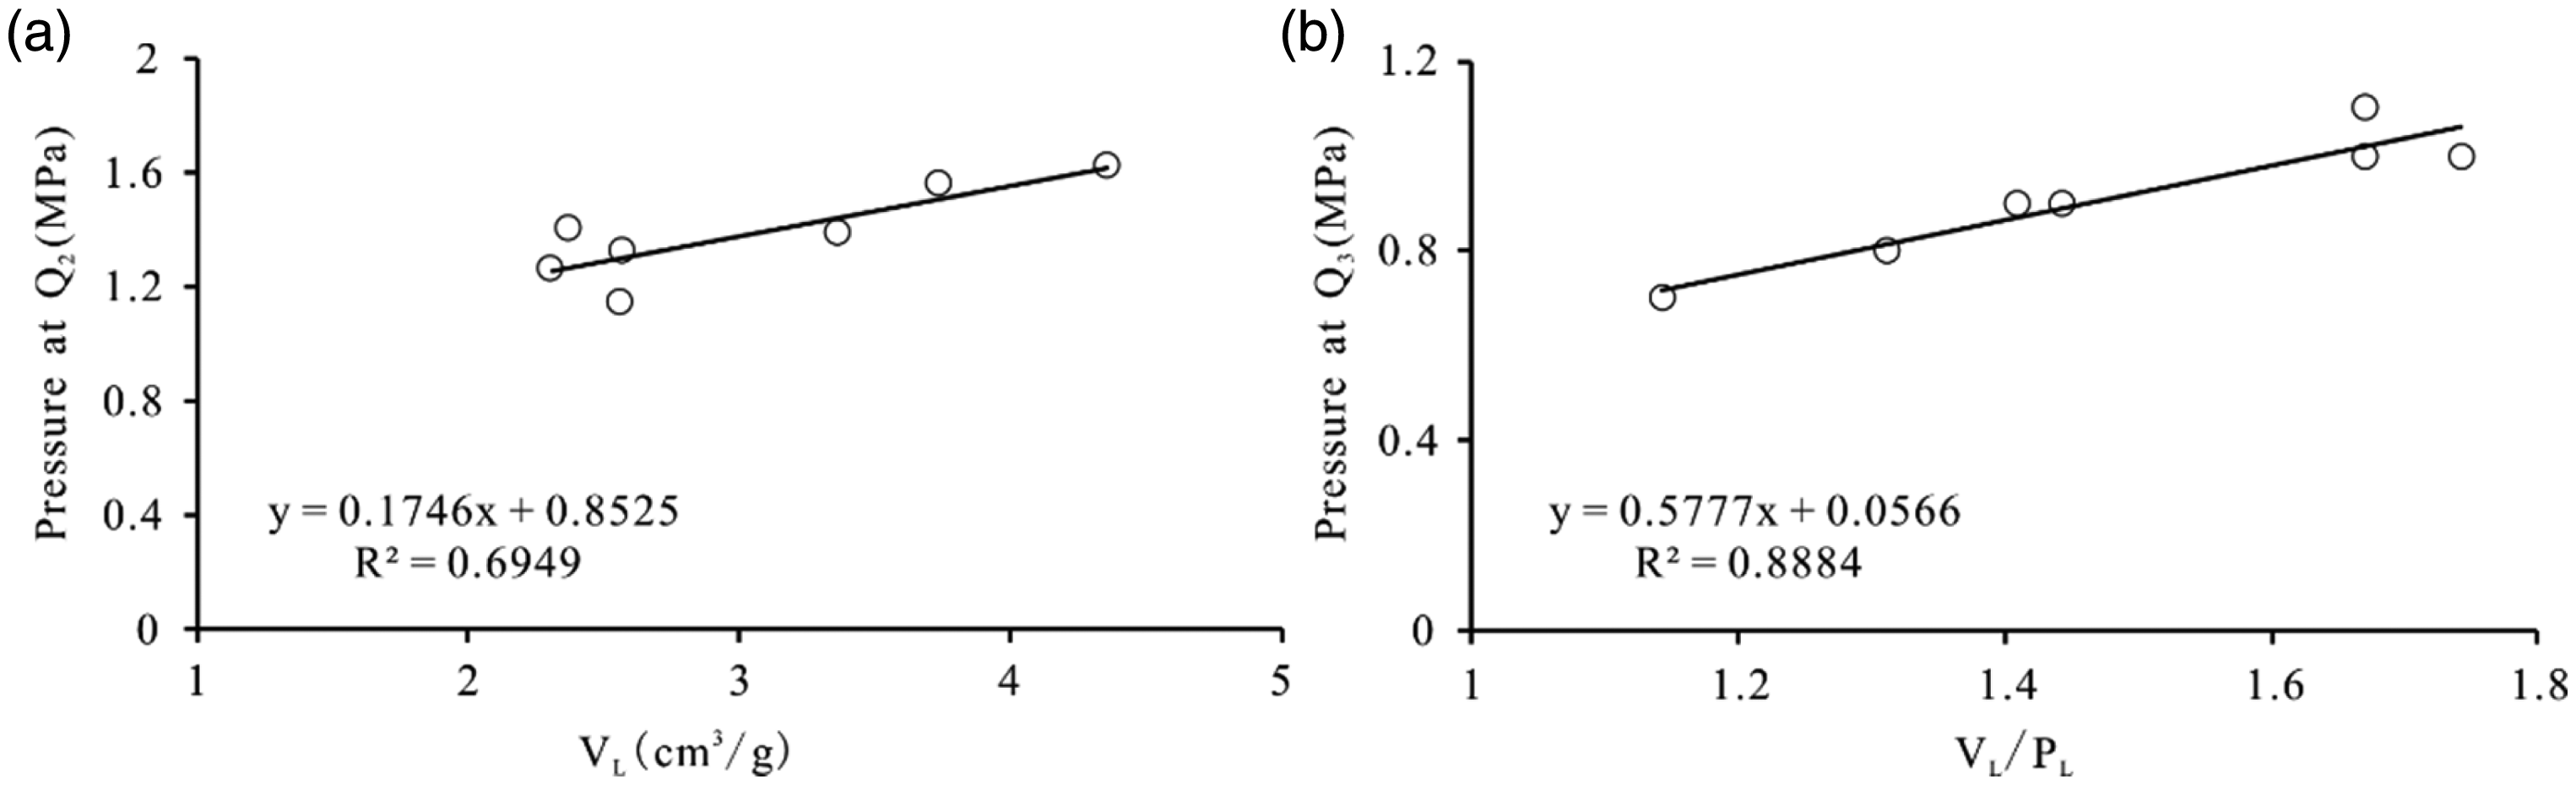
The primary cause of inflexion points change is the change of Langmuir constants that are caused by TOC and clay minerals. The high content of TOC and clay minerals can increase production and it is consistent with current knowledge. However, the increase of organic matter content not only has a significant effect on extending the production peak but also may lead to arrival of final desorption stage in advance. The increase of clay mineral content can extend the production peak and accelerate the arrival of production peak.
Conclusion
This paper finely described desorption process and discussed the major influence factors. The desorption process of shale gas can be divided into three stages. The slow desorption stage has a small amount of desorption and a low desorption rate, and the large desorption stage has a large amount of desorption and a high desorption rate. With the increase of clay mineral content, the desorption peak can arrive quickly and the desorption peak can be extended. The increase of organic matter content will extend the desorption peak but also lead to the arrival of production decaying in advance. In actual production, the moisture content has a great influence on the desorption of clay minerals. Different clay minerals have different desorption properties and the content ratio of different clay minerals and organic matter will affect the properties of shale reservoirs. Therefore, the two factors may affect the arrival and duration of the desorption peak time of actual production. Combined with various factors, it may be possible to evaluate and analyze the shale gas production process and adjust the production plan on the basis of the material composition of reservoir.
Footnotes
Acknowledgments
We would like to thank Advanced Analysis and Computation Center of CUMT and Key laboratory of Coalbed Methane Resources and Reservoir Formation Process, Ministry of Education for providing the experimental instruments. We also would like to thank Shi Qingmin for helping me to collect samples.
Declaration of conflicting interests
The author(s) declared no potential conflicts of interest with respect to the research, authorship, and/or publication of this article.
Funding
The author(s) disclosed receipt of the following financial support for the research, authorship, and/or publication of this article: This work was supported by the National Natural Science Foundation of China (U1361207).