
Abstract
X-ray computed tomography is an efficient method for quantitatively estimating the characteristics and heterogeneity of shales in three dimensions. A threshold is commonly used to separate pore-fractures from the background image. However, few studies have focused on the multi-component segmentation of computed tomography images. To obtain the distribution characteristics of different components in three dimensions, a segmentation method was proposed that combines a multi-Otsu thresholding algorithm with scanning electron microscopy. The gray value distributions of different components were first determined using this method. Then, the shale components were divided into several groups based on these gray values. The threshold of each component group was determined using the multi-Otsu thresholding algorithm. The computed tomography image stacks of two shale samples were processed using this segmentation method, and another computed tomography image stack was used to verify the method. The results showed that (1) the multi-component segmentation method can successfully segment computed tomography image stacks using the calculated values determined by computed tomography, which agree well with the measured values obtained from X-ray diffraction, total organic carbon, and porosity tests in the laboratory; (2) samples with similar provenances and mineral compositions have the same gray value distribution in the back scattering scanning electron microscopy and computed tomography images; (3) this method is superior in both the effectiveness and efficiency of the computed tomography image stack segmentation of samples according to the gray value distribution, as determined by samples with similar provenances and mineral compositions.
Keywords
Introduction
Shale formations are complex and heterogeneous media with complex porosity distributions. The porosity, permeability, and pore size distribution are important parameters for characterizing the shale pore structure (Chalmers et al., 2012; Curtis, 2002; Guo et al., 2015; Loucks et al., 2009). As a typical tight reservoir, it is necessary to determine the shale pore structural characteristics to understand the storage and transport mechanisms of shale oil/gas (Fishman et al., 2012; Wang et al., 2016). Three methods have commonly been used to characterize a shale pore structure: the mercury intrusion capillary pressure, gas adsorption, and scanning electron microscopy (SEM) methods (Kalkreuth et al., 2013; Kim et al., 2016). These methods can provide some local information such as the pore types, pore size and volume, and specific surface area. However, they cannot be used to evaluate the shale pore structure in three dimensions (3D). They are also destructive tests. As a non-destructive test method, X-ray computed tomography (CT) provides an efficient way to quantitatively detect the pore structures of shales in 3D. Three processes are required in a CT-based 3D pore structure evaluation, including image acquisition, image processing, and result detection.
In image processing, the image characteristics are analyzed to obtain the pore structure characteristics. This includes two steps: image segmentation and pore-fracture extraction. Image segmentation is the most important and challenging procedure in the image processing (Yuan et al., 2015). Two methods can be used for pore structure segmentation: the dual scan (Mayo et al., 2015; Wang et al., 2009) and thresholding methods (Andrew et al., 2014; Boruah and Ganapathi, 2015; Desbois et al., 2016; Fu et al., 2015; Guo et al., 2015; Li et al., 2012; Liu et al., 2013; Peng et al., 2012; Wang et al., 2016; Yao et al., 2009). A threshold is a commonly used criterion in image segmentation to extract the pore structure from the background image (Alamri et al., 2010). Thresholding techniques can be categorized into global thresholding and local thresholding methods (Yazid et al., 2011). Local thresholding uses localized gray-level information to select multiple threshold values. Although it can deal with non-uniform illumination, the process is complicated and slow. Global thresholding, which uses a single threshold for the entire image, is easy to implement and widely used in CT image segmentation.
Numerous thresholding methods have been used to extract pore-fractures from CT images, such as manual thresholding (Li et al., 2012; Shu et al., 2011; Yao et al., 2009) and the watershed (Andrew et al., 2014), isodata (Liu et al., 2013), and Otsu methods (Desbois et al., 2016; Yang et al., 2014). However, few studies have focused on the multi-component segmentation of CT images using a digital core, which is important to investigate the effects of different components on the seepage of fluids. Multiple components of CT and SEM images were segmented using a manual inspection method by Wang and Ni (2012). However, a manual inspection method based on human vision is time-consuming and subjective.
Otsu thresholding (Ohtsu, 1979), which selects threshold values for the maximum between-class variance or the minimum within-class variance from the image histogram, is one of the most commonly used methods for selecting a threshold for general images (Sezgin, 2004). To segment multiple components in the images, a multi-Otsu thresholding algorithm was proposed (Cao, 2008). Based on this multi-Otsu thresholding algorithm, this study developed an effective and accurate multi-thresholding method that is combined with SEM for the multi-component segmentation of CT images.
Samples and methods
Samples
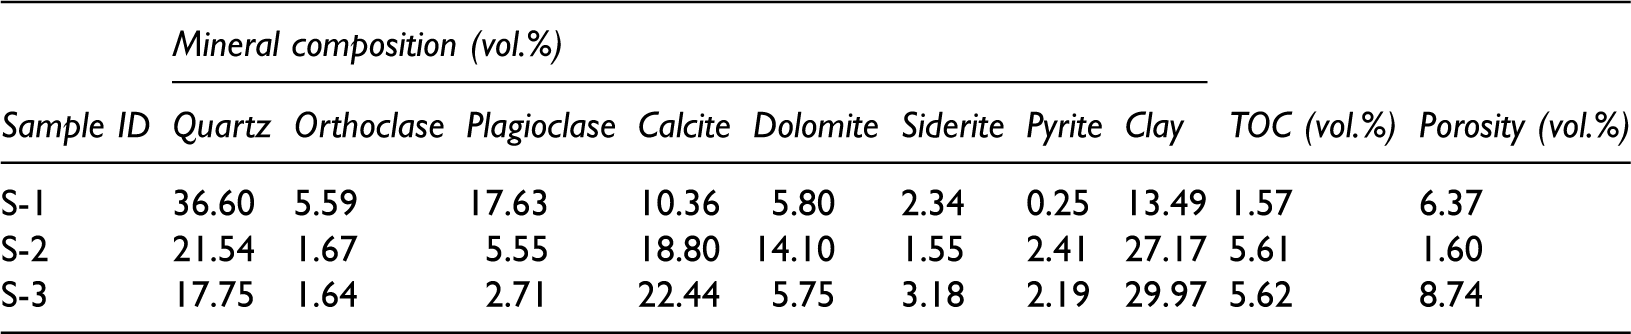
Sample properties of three different samples with mineralogy, TOC, and porosity.
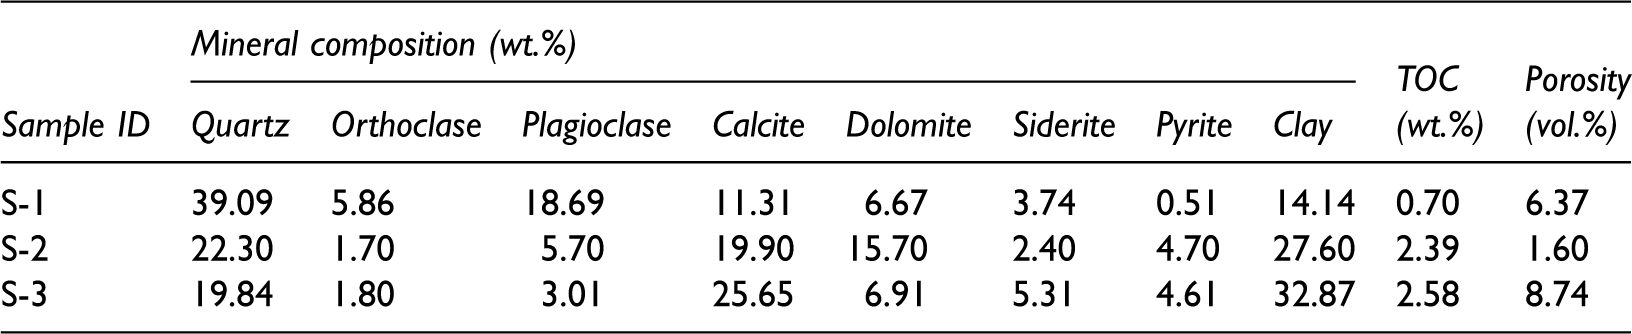
wt.%: weight content; vol.%: volume content.
Experiments
X-ray computed tomography
X-ray computed tomography measurements were performed using a MicroXCT-200 instrument manufactured by Xradia (USA). The X-ray source was a 40–150 kV FeinFocus focal spot, which allows for a resolution of up to 0.7 µm for an object of 1 mm. Projection data with a cone beam geometry were collected as the specimen rotated through a full 360°. The cylindrical core sample was placed perpendicular to the sample couch and aligned in the center of the scanner’s field of view. The sample was scanned with the X-ray set to a source voltage of 150 kV and a power of 10 W at the target. Reconstructed slice-images from the projections had a resolution of 2028 × 2048 pixel2 and a pixel-size of 13.7135 × 13.7135 µm2; the inter-slice spacing was also 13.7135 µm, which produced a voxel volume of 2578.96 µm3. Under this condition, three cylindrical samples were scanned: 1571 slice-images were stacked to generate a 3D data set corresponding to a total sample volume of 16.8275 cm3.
Scanning electron microscopy
To obtain the gray-level distributions of the compositions of the shale samples, SEM tests were performed on samples S-1 and S-2. Prior to the SEM observation, core cuttings of the two shale samples were Ar-ion milled. An FEI Quanta 200 F field emission-scanning electron microscope (FE-SEM) was used after carbon coating following China Standard GB/T 5162-1997. Carbon coating significantly improves the image quality and resolution by enhancing the conductivity of the surface. The images were magnified by up to 8000 times, allowing for a resolution of up to approximately 10 nm. The mineral composition was quantitatively determined using characteristic energy-dispersive X-ray spectroscopy (EDX) with an acceleration voltage of 10 kV.
Methods
Mechanism of CT and backscattered electron (BSE) imaging
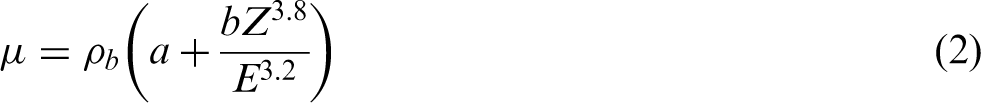
X-rays attenuate to varying degrees when they penetrate different minerals, because of the photoelectric effect, Compton effect, electron pair effect, and other complex physical processes (Peng et al., 2012; Wang et al., 2015). This can be defined by Lambert–Beer’s law


The principle of SEM is the use of high-energy electron bombardment of a sample surface to generate secondary and BSEs. The secondary electrons (SE) are sensitive to the sample surface, and they can effectively reveal its microscopic morphological characteristics. Thus, SE images are commonly used for pore investigation (Klaver et al., 2012; Rine et al., 2013). The BSEs refer to atomic particles reflected from the sample surface with an angle of more than 90°. The reflected intensity of the BSEs depends on the density of the sample. A higher material density results in a higher reflected intensity of the BSEs and greater brightness for the BSE image. The gray values of pixels in BSE images are typically associated with the rock sample density, which is similar to CT images. Therefore, BSE images can be used to verify the grayscale distributions of different components within CT images.
Multi-Otsu thresholding algorithm
Otsu thresholding is one of the most commonly used methods to select a threshold for general images (Ohtsu, 1979; Sezgin, 2004). The Otsu thresholding method is based on the idea of finding the threshold that maximizes the between-class variance. A brief description of the use of Otsu thresholding as an automatic optimal global thresholding method is presented next.
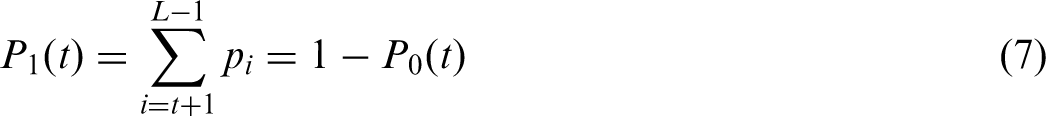
An image can be described as I(x,y), with a gray level that ranges from 0 to L −1, where L is the number of distinct gray levels. Let the number of pixels with gray level I be ni, and the total number of pixels in the gray image be n. The probability of occurrence of gray level i is defined as follows

The average gray level of the entire image is computed as follows
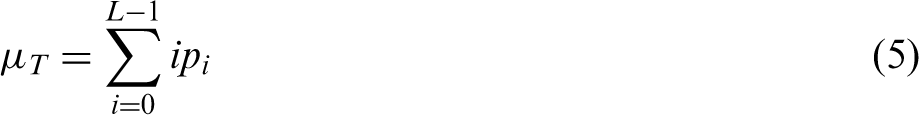
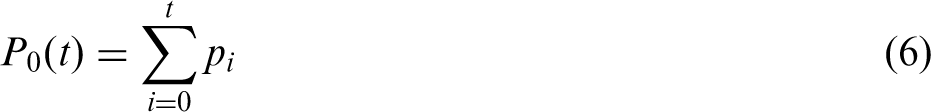
For a threshold t, Otsu shows that the between-class variance σ2
B
(t) of Do and D1 is as follows

The optimal threshold T of the Otsu method can be determined as follows

The variance formula of the multi-Otsu thresholding algorithm can be determined based on the formula of the double-threshold Otsu method. When an image is divided into (k + 1) classes, k different thresholds (t1, t2, t3, t4, … tk) are used. The variance for k different thresholds can be expressed as follows

The optimal thresholds (T1, T2, T3, T4, … Tk) of the multi-Otsu method can be determined as follows

In this study, the multi-Otsu thresholding algorithm was used to obtain the thresholds of different components within CT images.
CT and SEM image processing
Single BSE image and CT image stacks were analyzed using the public domain digital image processing and analysis software ImageJ (http://rsb.info.nih.gov/ij/). The component phases (including pore-fractures, organic matter (OM), and minerals) were identified using gray value patterns from the BSE images validated by a combination of EDX and XRD investigations. The average gray values of different component phases were obtained manually using histograms. The thresholds of different components within the CT slice images were determined by utilizing the multi-Otsu thresholding algorithm. After the segmentation, all the component phases were analyzed in ImageJ using the analyze-particles tool. The resultant segmentation image stacks were then imported to ImageJ for the reconstruction of 3D digital cores.
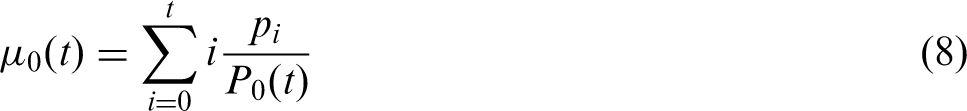
Weight contents of minerals and OM converted to volume contents
The mineral contents obtained from the XRD analyses were the mineral quality percentages without OM and fluids. Moreover, the TOC content was the OM contributing to the total quality of the rock. However, the mineral and OM contents obtained from the CT image stack analyses were the volume contents accounting for the rock volume. Thus, the quality contents of the minerals and OM should be converted to volume contents and then normalized.
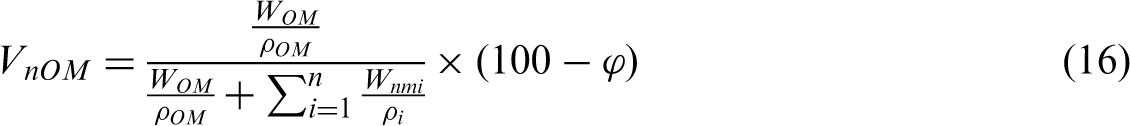
To eliminate the influence of OM, the quality contents of the minerals should first be normalized as follows

Volume contents of minerals, OM, and pore-fractures.
vol.%: volume content.
Results and discussion
Composition identification and gray level determination
In the BSE images, pyrite (the brightest polygonal grains), OM (the dark amorphous particles), and pore-fractures were recognizable because of their particularly high or low density (Chen et al., 2016). Other components (e.g., quartz, carbonate mineral, feldspar, siderite, and clay mineral) with similar elementary compositions cannot always be separated simply based on their gray level. Specifically, particularly dark or bright areas may be caused by regional electron charges or discharges as a result of the poor conductivity of some mineral particles or surface irregularities (Figure 1(c)).
Mineral, OM, and pore-fracture identification and gray level determination in BSE mode for samples S-1 (upper) and S-2 (lower). C: calcite; O: orthoclase; OM: organic matter; P: pyrite; Pl: plagioclase; Q: quartz; S: siderite.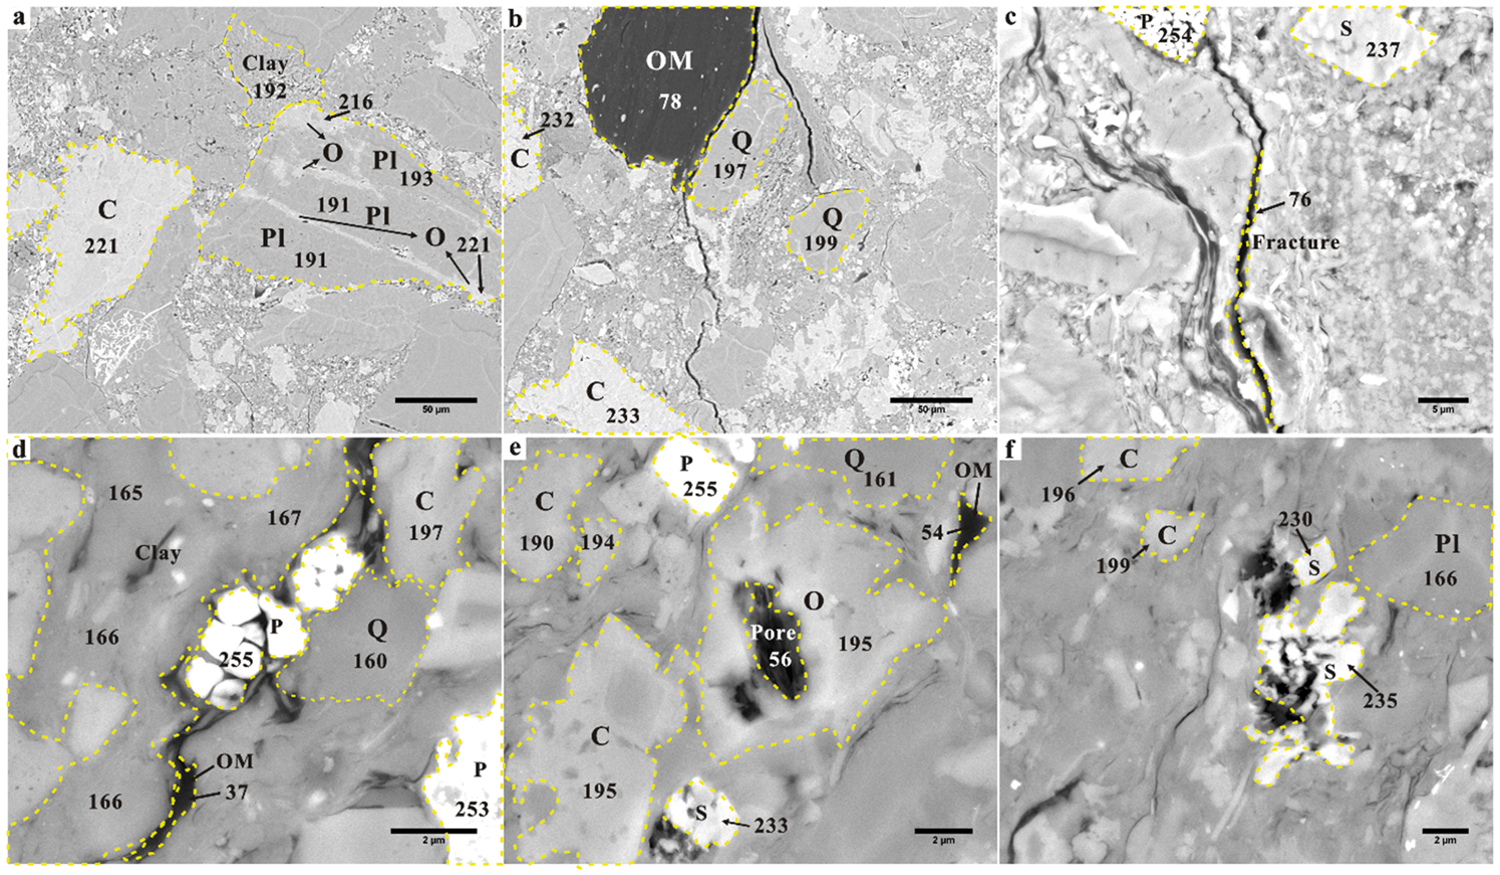
Other minerals were identified based on the gray level in the BSE micrographs, EDX map, and XRD measurement results. Each of the eight minerals and OM was characterized by its own shape and gray level (Figure 1). The brightest polygonal grains are pyrite, which are also present as clusters of framboidal pyrite in the BSE images (Figure 1(c), (d), and (e)). OM and pore-fractures are seen as black areas in an amorphous form in the BSE images (Figure 1(b), (c), (d), (e), and (f)). Siderite appears as a bright parallelogram in the BSE image and is distinguished by the presence of Fe using EDX (Figure 1(c), (e), and (f)). Carbonate minerals (mostly calcite) have a light gray irregular grain (Figure 1(a), (b), (d), (e), and (f)). The dark gray rounded grains are quartz (Figure 1(b), (d), and (e)). Orthoclase appears as light gray rounded grains or stripes in the plagioclase (Figure 1(e)). Plagioclase can be identified as dark gray rounded grains in the EDX maps (Figure 1(a) and (f)). Clay minerals are generally dark gray irregular long-striped assemblages with an inner lamellated micro-structure (Figure 1(a) and (d)).
Based on the average gray value of each component shown in Figure 1, eight minerals, OM, and pore-fractures can be divided into six groups (OM and pore-fractures, quartz, clay minerals and plagioclase, carbonate minerals and orthoclase, siderite, and pyrite). For sample S-1, the average gray values of the six groups have the following descending order: pyrite (254, average gray value), siderite (237), carbonate minerals and orthoclase (221–233), quartz (197–199), clay minerals and plagioclase (191–193), and OM and pore-fractures (<78). In contrast to sample S-1, the average gray values of the six groups of S-2 have the following descending order: pyrite (253–255), siderite (230–235), carbonate minerals and orthoclase (190–199), clay minerals and plagioclase (165–167), quartz (160–161), and OM and pore-fractures (<56).
CT image segmentation
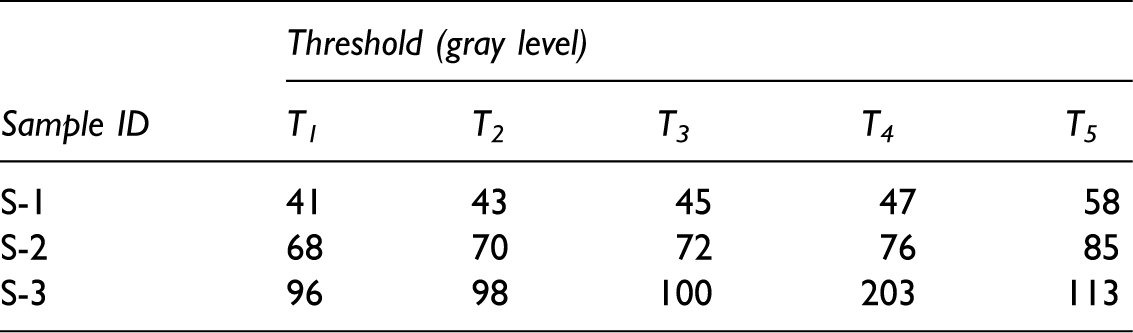
A sub-volume with an area of 1300 × 1300 pixel2 was first extracted around the center to eliminate the peripheral area around the core plug in the original CT slice image. To distinguish the six component groups, five global thresholds (T1, T2, T3, T4, and T5) had to be determined. These five thresholds and segmentation images could be obtained using the multi-Otsu thresholding algorithm (Figure 2). In this work, to obtain the five global thresholds, the multi-thresholding segmentations were performed for every 50 slice images, and a total of 30 slice images were segmented for each CT image stack. Finally, the global threshold of each component in the CT images was determined by averaging the thresholds of the 30 slice images (Table 3). The threshold of each component could be determined based on the gray level distributions found using the BSE images. For example, for sample S-1, the thresholds of pyrite, siderite, carbonate minerals and orthoclase, quartz, clay minerals and plagioclase, and OM and pore-fractures were 58–255, 47–57, 45–46, 43–44, 41–42, and 0–40, respectively.
Segmentation processing of CT slice image. Threshold of each component group in CT image stacks. T1, T2, T3, T4, and T5 are the five global thresholds used to distinguish the six component groups in the shale CT image stacks.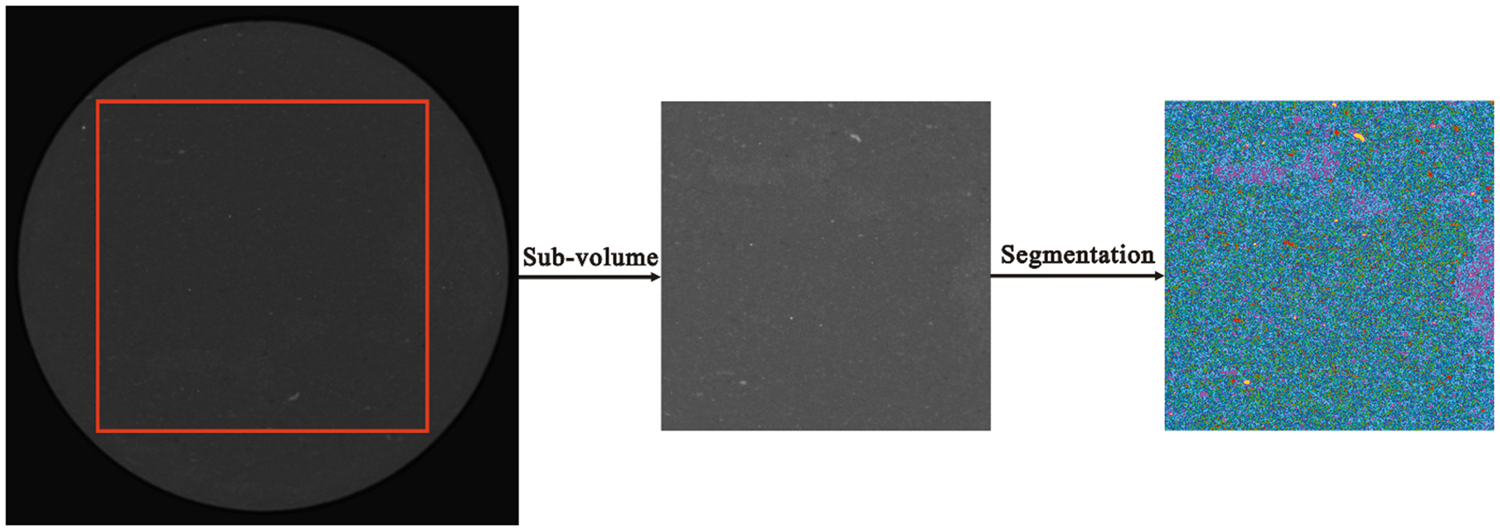
Based on these thresholds, the area proportions of the six group components could be calculated using the analyze-particles tool in ImageJ. This process was used for a single slice and yielded a plane content. Finally, the volume content of the six group components was calculated by averaging the plane contents of all the slices. After determining the sub-volume, a total of 1571 gray images with 1300 × 1300 pixel2 was used as a sample. In a gray image, each pixel has a gray value between 0 and 255. Each group component had certain gray value intervals. To obtain the gray value domain for each group component, a Boolean calculation method was used for the gray image (Yao et al., 2009). For the six group components, the method can be defined as follows
Relationship between calculated CT values and measured values for shale samples. C: calcite; O: orthoclase; OM: organic matter; P: pyrite; Pl: plagioclase; Q: quartz; S: siderite.

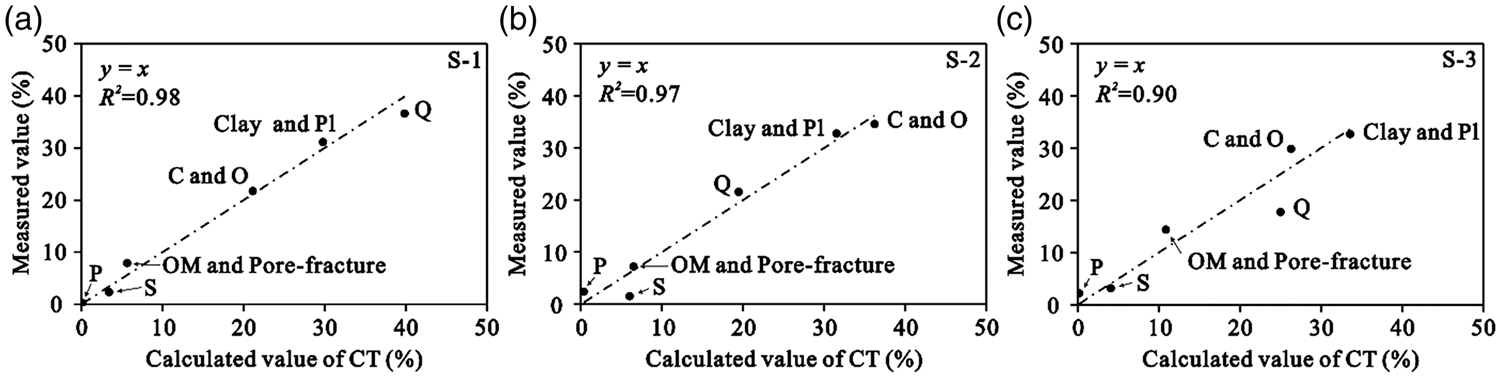
The calculated volume contents of the six component groups of samples S-1 and S-2 were compared to the volume content results obtained from the XRD, TOC, and porosity measurements (Figure 3(a) and (b)). It was found that the calculated CT values showed strong (R2 = 0.98 for S-1 and R2 = 0.97 for S-2) correlations with the measured values, which indicated that the thresholds determined by the multi-Otsu thresholding algorithm could accurately be used for CT image segmentation.
Application of this method to sample S-3
Sample S-3 was used to verify the multi-component segmentation method for the CT image stack that combined the multi-Otsu thresholding algorithm and BSE image. Samples S-2 and S-3 were collected from the same well in the same formation and had similar provenances and mineral compositions. Therefore, sample S-3 could have the same grayscale distributions of different components in the CT image stack as sample S-2, such as pyrite, siderite, carbonate minerals and orthoclase, clay minerals and plagioclase, quartz, and OM and pore-fractures, in descending order. The thresholds and volume contents of the six component groups of sample S-3 were determined utilizing the same method (Table 3 and Figure 3(c)). Figure 3(c) indicates that the calculated CT values show strong (R2 = 0.90) correlations with the measured values. It can be concluded that samples with similar provenances and mineral compositions have the same grayscale distributions of different components in the CT image stack, and the segmentation method could accurately be used for CT image quantitative identification.
Three-dimensional reconstruction of different components
To obtain more information about the distribution characteristics of the six component groups of the three samples in 3D, CT image stacks were used for reconstruction in 3D. Considering the computer performance and processing time, a sub-volume with a volume of 500 × 500 × 500 pixel3 was extracted from the CT image stack. The CT slice images were transformed into segmentation images based on the thresholds of the six component groups. The segmentation images were then imported to ImageJ to generate a view of different components in 3D using the 3D viewer tool (Figure 4). The reconstructed images in 3D could distinctly reveal the distribution and heterogeneity characteristics of the different components. Sample S-1 had a slight heterogeneity, and the pores, OM, and minerals were obviously homogeneous in the spatial distribution (Figure 4(a)). However, samples S-2 and S-3 had stronger heterogeneity. The pore-fractures, OM, and minerals were mostly distributed in stratification (Figure 4(b) and (c)).
Three-dimensional reconstruction for different components (500 × 500 × 500 pixel3).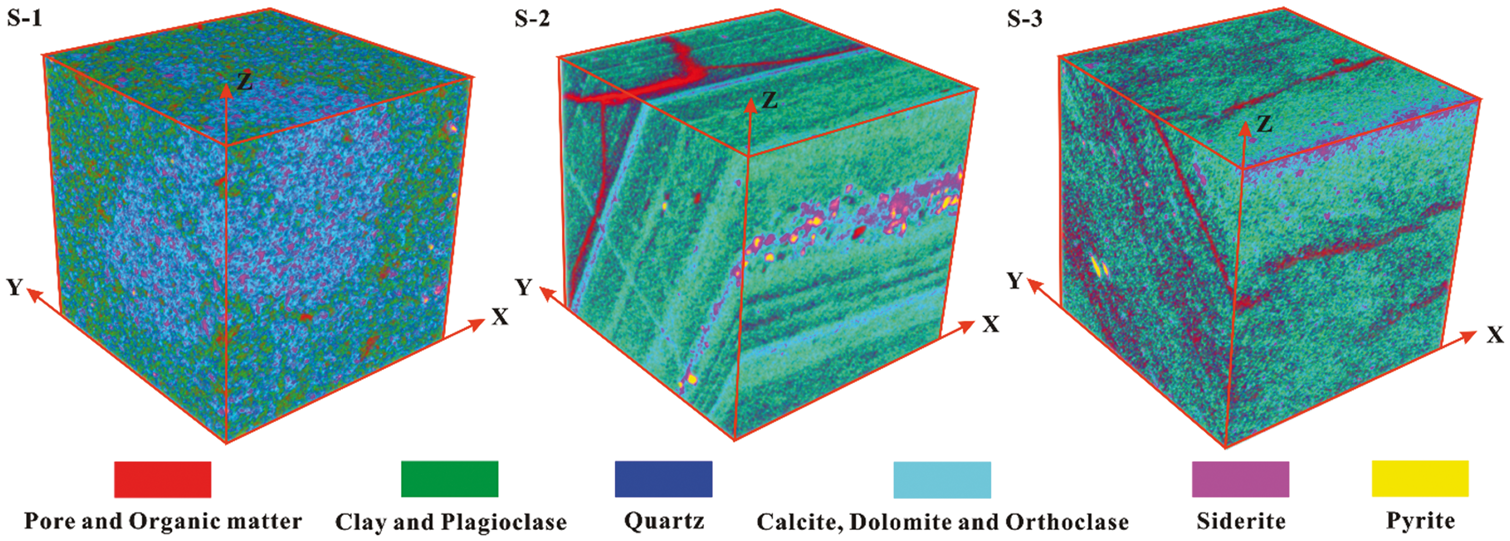
As previously discussed, the multi-component segmentation method for a CT image stack could accurately determine the grayscale distributions and thresholds of the six component groups. This method is much more effective than manual inspection and can eliminate the influence of artificial factors. However, it also has some associated technical limitations. First, it cannot efficiently distinguish each of these components in the CT image stacks, especially the pore-fractures and OM, because their gray value distributions overlapped (Boruah and Ganapathi, 2015). The other limitation relates to the partial-volume effects (Ketcham and Carlson, 2001). Because each gray value of a pixel in a CT represents the attenuation properties of a specific material volume, the resulting gray value represents the average of their properties when the volume is comprised of many different substances (Yao et al., 2009). The partial-volume effect makes the identification of shale components much more difficult.
Conclusions
An effective segmentation method for CT images based on BSE images and the multi-Otsu thresholding algorithm was established in this paper. The gray value distribution of each component is determined based on BSE images. Then, the CT images are segmented using the multi-Otsu thresholding algorithm, after which the threshold of each component group is obtained.
Two CT image stacks were processed using this multi-component segmentation method, and the results showed that the method could successfully segment the images, with the calculated CT values agreeing well with the measured values. Another CT image stack was used to verify this segmentation method. The results showed that samples with similar provenances and mineral compositions have the same gray value distribution in the BSE and CT images, and this method was superior in both its effectiveness and efficiency for CT image segmentation.
Footnotes
Declaration of conflicting interests
The author(s) declared no potential conflicts of interest with respect to the research, authorship, and/or publication of this article.
Funding
The author(s) disclosed receipt of the following financial support for the research, authorship, and/or publication of this article: the Key Program of the National Nature Science Foundation (grant no. 41330313), National Natural Science Foundation (grant no. 41602131), Research Project Funded by SINOPEC (grant no. P14068), Natural Science Foundation of Shandong Province (grant no. ZR2014DP007), and China Postdoctoral Science Foundation (grant no. 2016M590671).