
Abstract
The use of micro-CT in small animals has increased in recent years. Although the radiation levels used for micro-CT are generally not lethal to the animal, they are high enough where changes in the immune response and other biological pathways may alter the experimental outcomes. Therefore, it is important to understand what the doses are for a specific imaging procedure. Monte Carlo simulation was used to evaluate the radiation dose to small animals (5–40 mm in diameter) as a result of X-ray exposure. Both monoenergetic (6–100 keV) and polyenergetic (15–100 kVp) X-ray sources were simulated under typical mouse imaging geometries. X-ray spectral measurements were performed on a mouse imaging X-ray system using a commercially available X-ray spectrometer, and spectra from high-energy systems were used as well. For a typical X-ray system with 1.0 mm of added Al at 40 kVp, the dose coefficients (dose to mouse per air kerma at isocenter) were 0.80, 0.63, 0.52, and 0.44 mGy/mGy for mouse diameters of 10, 20, 30, and 40 mm, respectively. A number of tables and figures are provided for dose estimation over a range of mouse imaging geometries.
Introduction
Anatomical evaluation of the mouse, rat, and other small animals using micro-computed tomography (micro-CT) has proved useful in a number of research applications [1–5]. However, to achieve high signal-to-noise ratio (SNR) images with extremely small voxels (e.g., 50 × 50 × 50 μm), relatively large radiation doses are required. Previous studies [1,6] have suggested that mouse imaging using micro-CT delivers between 100 and 300 mGy, about a factor of 10 larger than typical human CT examinations. Radiation doses for diagnostic imaging of the small animal in general are not lethal, but the dose levels may be sufficient to induce deterministic effects in the animal that could confound the biological outcome of the experiment [7–10]. In this study, we employed validated Monte Carlo procedures coupled with spectroscopic analysis of a micro-CT X-ray source to determine radiation dose levels as a function of the diameter of the animal scanned.
We report here both dose coefficients (air kerma to tissue absorbed dose) as well as tissue doses for typical mouse dimensions and micro-CT examination parameters. These data should allow investigators to precisely calculate the radiation dose to small animals when scan parameters are known or to estimate doses when the exact scan parameters are not available.
Materials and Methods
Measurement of X-ray Spectra
X-ray spectra were measured using a cadmium zinc telluride (CdZnT) spectrometer (Model XR-100T-2T, Amptek, Bedford, MA) and an X-ray system typical of mouse CT (Oxford X-ray tube, tungsten anode, 0.04 mm beryllium window, Scotts Valley, CA, Spellman X-ray generator model SL50P300, Hauppauge, NY). X-ray spectra were measured from 15 to 50 kVp in 5-kVp intervals, with no added filtration to the X-ray system except for thin Be window of the X-ray tube. Each X-ray spectrum was acquired using approximately 106 photons. An analog-to-digital converter (Model DT 3010, Data Translation, Marlboro, MA) was used to acquire the signal output from the spectrometer. Custom software, utilizing the Data Translation Measurement Foundry software toolkit, was written for this application.
X-ray spectral measurements were made at differing applied tube voltages (kVp's), at the same tube current setting (0.5 mA). The X-ray spectrometer was placed 40.3 cm from the X-ray source, and spectral acquisition times ranged from approximately 200 to 1000 sec. The energy scale of the spectrometer was calibrated using both the known kVp of the X-ray generator and the emission lines of several radioactive isotopes (e.g., Ba- 33 and Co-57). The L emission lines of the tungsten anode were also useful for energy calibration purposes. The tube output (air kerma per mA at each kVp) was measured using a recently calibrated ionization chamber designed for mammographic applications (MDH Model 9010, Monrovia, CA). Kerma values were made at each kVp, and were corrected for different source to isocenter distances using the inverse square law.
A previously reported spectral modeling technique based on polynomial interpolation [11,12] was used to generate X-ray spectra which were subsequently used for dose computations. By modeling the measured spectra, it was possible to compute spectra from 15 to 50 kVp in 1-kVp intervals, instead of the 5-kVp intervals that were measured. Raw (unfiltered) X-ray spectra were physically measured and modeled, and filtered X-ray spectra were calculated from the modeled spectra using mathematical calculations and tabulated mass attenuation coefficients [13].
The mouse X-ray system was capable of operation between 15 and 50 kVp. In some micro-CT scanners and imaging applications, X-ray sources with a higher kVp range are used. To provide dose coefficients for X-ray beams up to 100 kVp, a previous spectral model whose range was 40 to 140 kVp was used [12]. This model was based on an X-ray source from a cardiac catheterization laboratory, and thus the inherent filtration of the metal X-ray tube was much higher (about 2.0 mm Al) than the spectral model below 50 kVp (which used a Be-windowed tube). Several different thickness values (0.5, 1.0, and 2.0 mm) of added aluminum filtration were added mathematically to the lower kVp X-ray spectral measurements made on the Be-windowed X-ray system. Because the X-ray tube had only a thin Be window, the added Al filtration represents essentially the total (added + inherent) Al filtration of the spectrum. For some assessments, the modeled spectra from the Be-windowed X-ray system were mathematically filtered to match the inherent filtration of the cardiac tube (see Appendix).
Monte Carlo Simulation
The SIERRA (Simple Investigational Environment for Radiology Research Applications) Monte Carlo code was used to compute the absorbed X-ray energy in unit-density muscle, and the animal was modeled as a cylinder. Although this simple homogeneous solid-cylinder geometry does not accurately represent the more complex anatomy of the lungs or more attenuating bones of the animal, including such structures reduces the generality of the dose coefficients, probably has a very small effect, and is beyond the capability of the SIERRA code. The simulation included the 360° rotation of the X-ray source around a small animal as in micro-CT applications, and this simulation is valid for both stationary X-ray/detectors with a moving specimen stage, or a stationary specimen with moving X-ray source and detector system. Indeed, the data generated are also valid for radiographic imaging of the small animal. Most small-animal micro-CT systems make use of cone-beam geometry [1], and z-axis collimation lengths of 1, 4, 8, 12, and 16 cm were studied here. For a 30-cm source-to-isocenter (SIC) distance, these z-axis fields of view (zFOV) correspond to cone half-angles of 0.9°, 3.8°, 7.8°, 11.3°, and 14.9°, respectively (see Figure 1 for the geometrical details).
The geometry for the Monte Carlo computation of absorbed dose in the mouse is illustrated. The mouse was modeled as a cylinder of a specific diameter (Dia), located with the center of the cylinder a distance away (source-to-isocenter, SIC) from the X-ray tube. The field of view along the z-dimension of the animal (zFOV) is also illustrated, and this relates to the cone angle used for mouse radiography or cone-beam CT imaging procedures.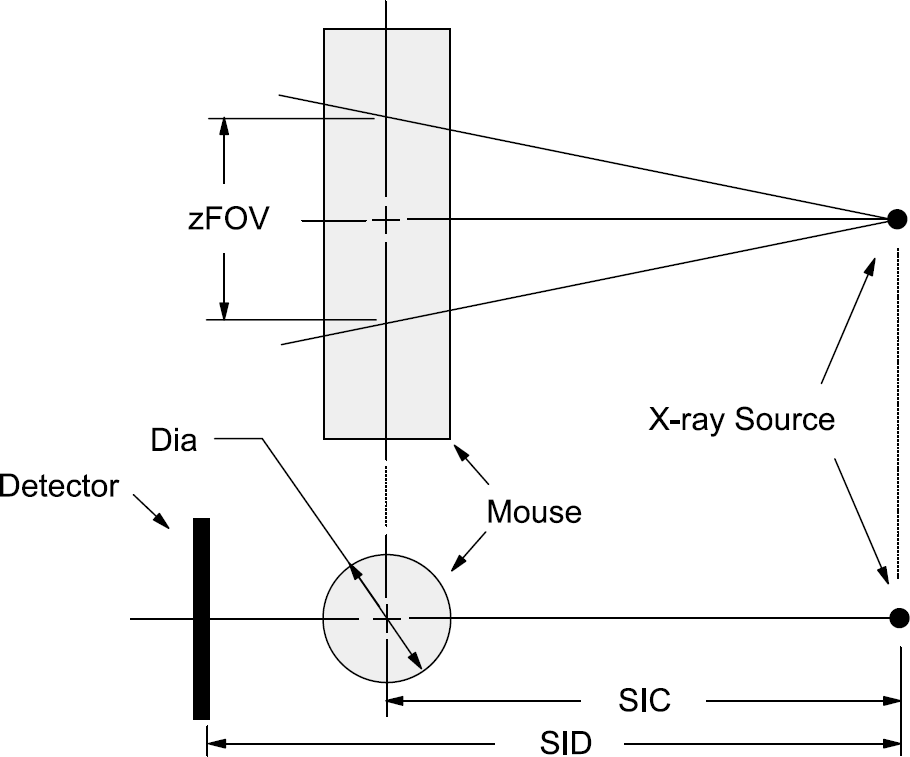
The methodology for computing dose (energy/mass) was similar to that used for human dose computations: The z-dimension of the field of view (at isocenter), combined with the animal diameter, defines the tissue volume and (given a density of 1.0) its mass. The X-ray energy imparted throughout the animal's tissues (except in the dermal layer) was tallied and included in the dose computation, including X-ray energy scattered “outside” the tissue volume. This geometry therefore assumes that the animal will be scanned over multiple contiguous volumes, since adjacent scans would contribute the same scattered energy to the volume under study as the modeled scan contributes to energy scattered outside this volume. This geometry has relatively small influence in this study, due to the low X-ray energies typically used in mouse imaging and due to the small scattering volumes involved (compared with humans).
The SIERRA Monte Carlo code was written in C (C6.0 SP5, Microsoft, Redmond, WA). The Monte Carlo studies were performed on a 2.5-GHz Pentium-based personal computer. The tissue-equivalent cylinders ranged from 10 to 40 mm in diameter. A 1-mm-thick layer of dermis (and fur) was modeled, and X-ray energy deposition interior to the dermal/fur layer was tallied. For example, for a 20-mm mouse diameter, the dose was tallied to a concentric cylinder 18 mm in diameter. The fur and metabolically inactive dermis are relatively insensitive to the effects of ionization, and the dose of interest to the mouse is that deposited in the internal organs. This approach is similar to that used in mammography, except human skin layer is typically modeled as being 4.0 mm thick [14]. X ray photons were evaluated at each monoenergetic energy from 6 to 100 keV, in 1-keV intervals. For each X-ray photon energy and mouse phantom diameter, the energy deposition from 106 incident photons was tallied. The radiation dose to the mathematical phantom due to the monoenergetic X-ray exposure was normalized to the units of μGy per 106 photons/mm2 incident on the animal at the plane of the isocenter (in air). Let this function be Dm(d, E), where Dm is the monoenergetic dose, d is the animal diameter, and E is the X-ray energy (keV). The unit (μGy/106 photons per mm2) for Dm(d, E) was used because it provides for relatively easy computation of polyenergetic dose deposition, when the X-ray spectrum is known.
The function Dm(d,E) was used to compute the polyenergetic dose coefficients, Dp(d,kVp), using the modeled polyenergetic X-ray spectrum, Φ(E).

where k is a normalization constant. In practice, the spectrum Φ(E) is normalized such that it corresponds to 1 mGy of air kerma, and then k is simply 10−9. With this normalization, the polyenergetic dose coefficients Dp(d,kVp) are in the units of absorbed tissue dose per air kerma measured at the plane of the isocenter (mGy/mGy). The Dp(d,kVp) coefficients can then be used to convert measured air kerma values at isocenter of a micro-CT scanner to mean absorbed dose in the animal.
It is useful to review the basic properties of an X-ray system for readers who may not use X-ray radiation routinely. A stable X-ray system when operating at a constant kVp will produce a relatively constant air kerma rate (formerly called exposure rate), which is a linear function of the mA (e.g., double the mA, and the air kerma rate will double as well). The kerma rate is also strongly dependent (r−2) upon distance r from the X-ray focal spot, obeying the inverse square law. The air kerma is a linear function of the product of the tube current (mA) and the exposure time in seconds (sec), typically called the mAs. Thus, air kerma rate (mGy/sec) × exposure time (sec) equates to air kerma. Precise calculation of the radiation dose to the mouse requires that the air kerma rate per mA, or the air kerma per mAs, at the kVp of interest be determined at the isocenter of the scanner. Thus, to accurately measure the X-ray dose to the small animal, it is necessary to make air kerma measurements (in air) using an ionization chamber positioned at the isocenter of the micro-CT scanner. The imaging parameters (kVp, mAs per projection image, number of projections, SIC distance, and mouse diameter) need to be recorded as well. Exposure measurements, X, made in mR, can be converted to air kerma, K, using K (mGy) = 0.00873X (mR).
Monte Carlo Comparisons with Measured Data
The SIERRA code used for this investigation is a direct daughter-code of the previously validated [14–16] Monte Carlo routines. An extensive set of physical measurements were made and were compared against the SIERRA Monte Carlo (MC) derived coefficients for polymethyl methacrylate (PMMA) cylinders ranging from 10 to 20 cm in diameter [14]. Physical measurements were performed by placing a long thin pencil ionization chamber in a 10-mm diameter concentric hole drilled into each cylinder. Although the presence of the hole caused minimal perturbation of the PMMA attenuation for these large diameter cylinders, the influence of a 10-mm diameter concentric hole would have significant influence on dose measurements in phantoms in the 2- to 3-cm diameter range. Due to this limitation, it was not feasible to make physical measurements using the pencil chamber for comparisons in this study.
Goertzen [17] measured the dose in a 30-mm PMMA phantom using thermoluminescent dosimeters (TLDs) placed at six different depths (radii) within the phantom. Dose measurements were performed for a 40-kVp W-anode spectrum filtered with 1.0 mm Al, and for a 50-kVp W-anode system filtered with 2.0 mm Al using 800 projection images. The mean absorbed dose (averaged over the whole phantom) was computed in the current study by weighting the dose values measured at each radii by the area of the annulus corresponding to each TLD position. The air kerma measured at the isocenter reported in Goertzen was combined with the appropriate Monte Carlo coefficient developed in this study, and these computed values were used for comparison with Goertzen's measured TLD dose data.
Results and Discussion
The raw (unfiltered except by the thin Be-window) X-ray spectra typical of an X-ray system used for mouse imaging are illustrated in Figure 2. In the absence of added metallic filtration to the X-ray tube, the raw X-ray spectra emitted from a tungsten anode tube demonstrate very high peaks corresponding to tungsten's characteristic L-shell X-rays. These peaks, visible at 8.4 and 9.7 keV, would lead to exceptionally high doses to the animal if unfiltered spectra were used for imaging. The low-energy X-rays contribute to dose, but play little role in image formation because very few are transmitted through the animal. For example, a 10-keV X-ray photon has a 1 in 45,900 chance of penetrating a 20-mm-thick mouse. Therefore, metallic filters (usually aluminum) need to be placed over the X-ray source to attenuate the low-energy X-ray fluence corresponding to the L-emission lines. We have found that a minimum of 0.5 mm of added aluminum filtration is necessary to eliminate the L-fluorescence radiation from tungsten, when a beryllium windowed X-ray tube is used. The dashed lines i Figure 2 correspond to spectra with 0.5 mm of total Al filtration.
Two X-ray spectra (solid lines) measured on a typical mouse X-ray imaging system are illustrated. Corresponding spectra mathematically filtered with 0.5 mm of total filtration are illustrated as dashed lines. (A) The 30-kVp tungsten anode X-ray spectra, with and without added filtration, are illustrated. The spectra without aluminum filtration demonstrate the very significant L-emission lines of tungsten. (B) The 50-kVp X-ray spectra are illustrated.
The monoenergetic dose Dm(d,E), as a function of X-ray energy is illustrated in Figure 3, for different imaging geometries and mouse diameters. The curves labeled “A” in Figure 3 correspond to a 20-mm mouse diameter and a field of view (zFOV defined in Figure 1) of 8 cm. The results for three different SIC distances are shown (10, 20, and 30 cm) in curve A. The similarity in the profiles for the three different SICs demonstrate that dose has little dependence on the SIC, and this is because the ordinate parameter is normalized to the same incident fluence. The curve marked “B” in Figure 3 corresponds to a 30-mm diameter mouse imaged at SIC = 15 cm. The curves for four zFOVs are shown (4, 8, 12, and 16 cm). These curves show small variations as well, and thus dose is not a strong function of the zFOV. From geometrical considerations, there will be greater dependence on zFOV for bigger animals (larger diameter) and smaller SICs, and the full extent of this is illustrated by the arrow marked “C.” The upper curve corresponds to a 40-mm diameter animal, with SIC = 15 cm and zFOV =16 cm. The lower curve corresponds to a 40-mm diameter animal, with SIC = 15 cm and zFOV = 1 cm.
The results of the monoenergetic Monte Carlo dose evaluations are illustrated. The graphs labeled A illustrate the dose coefficients Dm(d,E) for a 2-cm diameter mouse with an 8-cm zFOV, for three different SIC distances (20, 30, 40 cm). The curves labeled “B” are for a 3-cm diameter mouse and SIC = 15 cm, and show four overlapping curves for different zFOV values (4, 8, 12, and 16 cm). The arrow labeled “C” shows the maximum dependency on FOV, for a 4-cm diameter animal, SID = 15 cm, and zFOVs from 1 to 16 cm.
Figure 4 illustrates the dose profiles for different animal diameters, ranging from 10 to 40 mm. Low energy X-rays (<10 keV) contribute little dose to the animal due to the 1-mm thick dermal layer assumed in these dose computations. The dermal layer acts to essentially protect the animal's deeper tissues from X-ray dose deposition for very low X-ray energies. Smaller diameter animals demonstrate higher relative (normalized to unit air kerma at isocenter) dose because they experience less self-shielding (self-attenuation) than larger diameter animals. This is similar to the dose coefficients for mammography, where the coefficients for thinner breasts are higher [18]. Although these coefficients are larger, the overall doses to smaller animals are actually lower, because substantially less radiation is needed to penetrate the animal and deliver adequate X-ray signal levels to the detector. The data illustrated in Figure 4 are the <i>Dm(d, E) functions for monoenergetic X-ray beams, and are the direct output of the Monte Carlo computations. The dotted lines emanating from the origin of the graph in Figure 4 correspond to the situation where all X-ray energy incident upon the animal is absorbed and contributes to dose—these are marked “total absorption curves.” These data result from simple calculations where no dermal layer exists, and where no X-ray transmission or scatter escape from the mouse occurs.
The monoenergetic dose coefficients Dm(d,E) are shown as a function of X-ray energy for eight mouse diameters ranging from 10 to 80 mm. The two dotted lines correspond to 15 and 25 mm mouse diameters. These data are for a zFOV of 8 cm, and an SIC of 30 cm.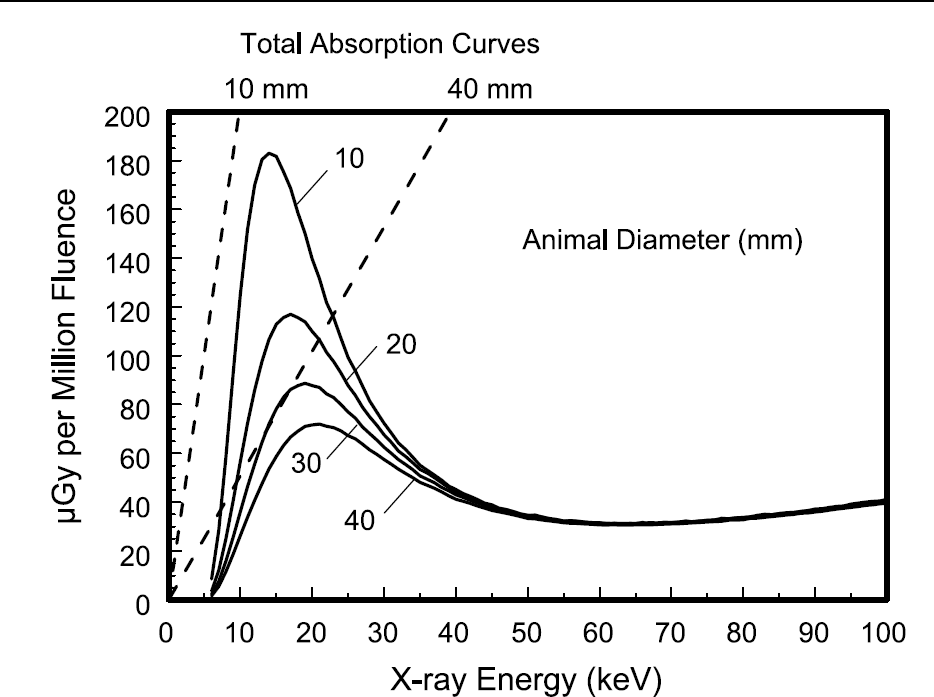
Figure 5 illustrates the normalized dose profiles Dp(d,kVp) as a function of X-ray tube voltage for polyenergetic X-ray spectra. The curves illustrated in Figure 5A–C correspond to an X-ray tube with 0.5, 1.0, and 2.0 mm of total (inherent + added) aluminum filtration, respectively. The normalized dose profiles are shown for animal diameters ranging from 10 to 40 mm. These coefficients, multiplied by the air kerma values measured or calculated at the isocenter of a specific CT system, allow investigators to compute the absorbed dose to the animal.
The curves illustrated in Figure 6 show the mean dose to the animal as a function of X-ray tube voltage (kVp), for small animals ranging in diameter from 10 to 40 mm. As with Figure 5, Figure 6A–C shows the curves for 0.5, 1.0, and 2.0 mm of total aluminum filtration, respectively. These data were computed assuming that the mean air kerma to the detector under the thickest part of the animal was 10 μGy (1.145 mR). An SIC distance of 30 cm and a source-to-detector distance of 35 cm was used for the computation of the curves in Figure 6. The dose profiles in Figure 6 illustrate two relatively strong trends: (1) larger diameter animals experience significantly higher doses than smaller diameter animals when appropriate technique factors are chosen such that the signal to the detector is the same, and (2) higher X-ray tube voltages result in substantially lower mean doses to the animal than lower kVps, a well-known trend found in human imaging as well. While going to higher energies reduces dose, X-ray contrast is reduced as well. Different X-ray detector systems have different response functions to X-ray exposure, and the dose curves shown in Figure 6 are valid for an X-ray detector with a response such that 10 μGy (1.14 mR) to the detector delivers a useful imaging signal near the low end of the detectors characteristic curve (this corresponds to the signal under the thickest part of the mouse). For X-ray detectors which have different sensitivities, the mean dose levels will vary. High-resolution detector systems with small pixels may require exposures on the order of 20 to 40 μGy per frame to produce high-quality images. For example, the detector described in Goertzen et al. [1] required on the order of 30 μGy per image. Thus, the curves in Figure 6 will probably need to be adjusted upwards for most X-ray detector systems used in small-animal imaging. For the purposes of approximation, if an X-ray system is 10 times more sensitive (requires 10 times less radiation to produce the same signal level) than that described for Figure 6, the mean dose levels will be reduced by a factor of 10.
The normalized dose coefficients Dp(d,kVp) as a function of the X-ray tube voltage for polyenergetic X-ray spectra are shown. The data for mouse diameters ranging from 10 to 40 mm are illustrated, and the two dotted lines correspond to 15 and 25 mm mouse diameters. These data are shown for a tungsten anode X-ray system with a beryllium window. The normalized dose coefficients Dp(d,kVp) are the mean absorbed dose to the entire mouse (mGy) per air kerma (mGy) measured at the isocenter of the micro-CT scanner. The data shown in these figures are for an 8-cm zFOV and an SIC of 30 cm. The three figures are for (A) 0.5 mm total aluminum filtration, (B) 1.0 mm aluminum filtration, and (C) 2.0 mm of total aluminum filtration to the beam. The mean absorbed dose as a function of X-ray tube voltage is illustrated for mice ranging from 10 to 40 mm in diameter. These graphs assume that the air kerma to the detector under the center of the mouse was 0.010 mGy (or 10 μGy). These values are for SIC = 30 cm, and the source-to-detector distance was 35 cm. The curves are for (A) 0.5 mm added aluminum filtration, (B) 1.0 mm added Al, and (C) 2.0 mm of added Al filtration. The dose in (B) is referred to in the text (see Discussion). In (C), the doses were smoothed to reduce small differences imposed by the transition in spectral models at 40 kVp.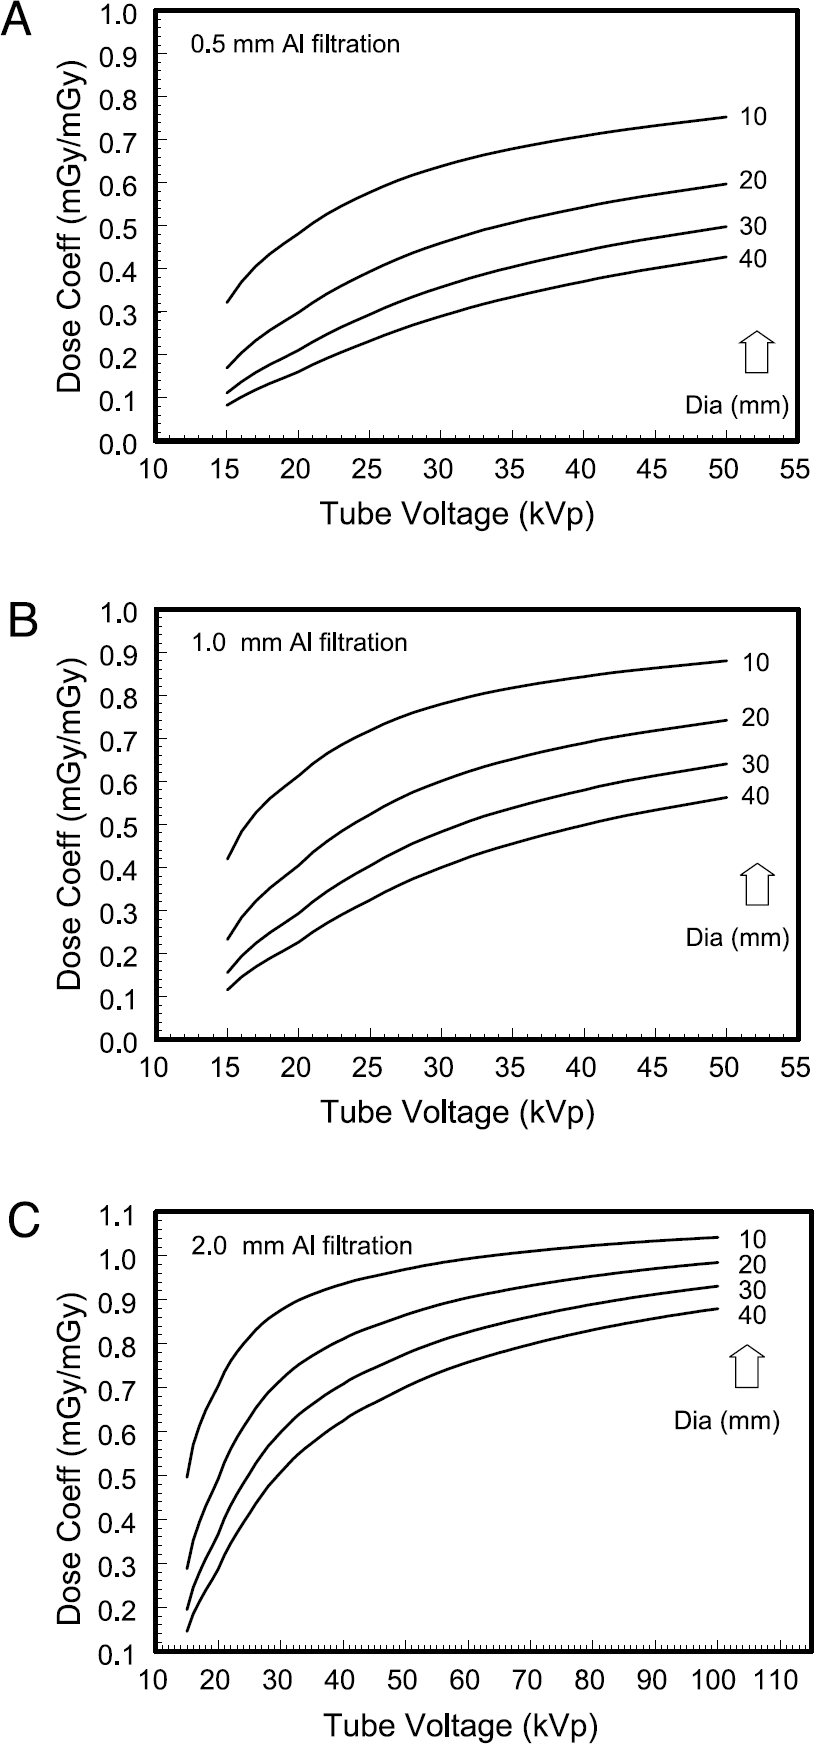
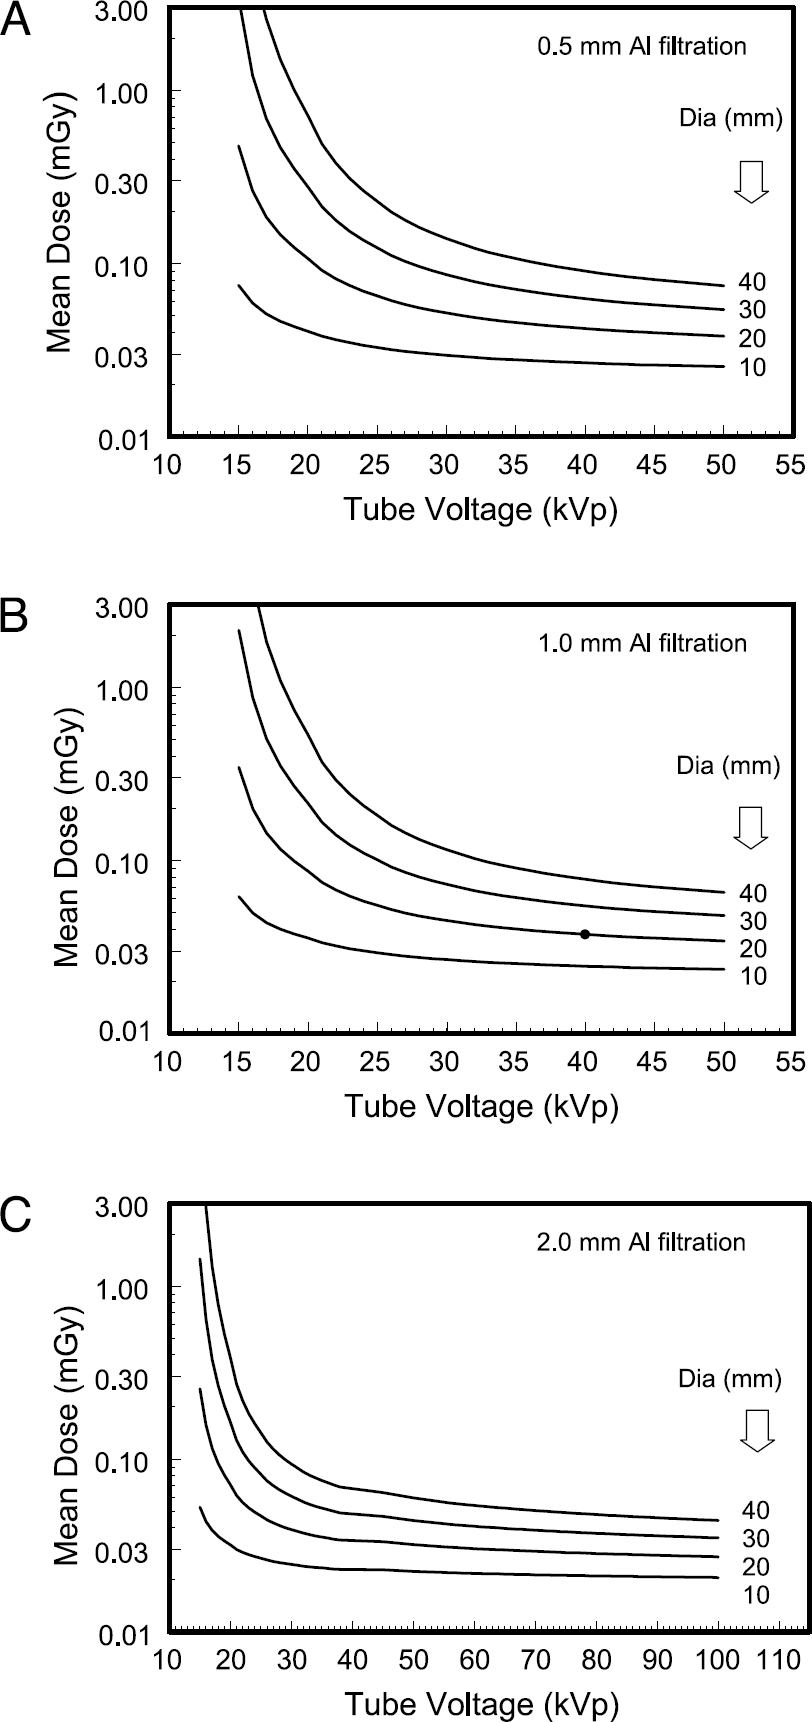
It is very important to note that the mean dose values illustrated in Figure 6 correspond to the acquisition of only “one” projection image on a micro-CT scanner. Micro-CT scanners typically acquire between 300 and 1000 individual projections, which are necessary to calculate the CT images. The dose from all of the individual projection images needs to be summed to evaluate the total dose from CT. The dose per projection discussed here assumes that the X-ray tube was shuttered or turned off between the acquisition of individual projection images, while the system or mouse is being rotated. If, however, X-ray exposure occurs between the acquisition of projection data, the integrated entrance kerma from the entire procedure (all projection acquisitions and total dead time in between acquisitions) should be included in the computation.
Previously reported comparisons [14] between SIERRA Monte Carlo dose measurements and physically measured results for the same CT geometry as that studied here but with larger cylinder diameters (10 to 20 cm) demonstrated excellent correlation (r = .9877) over the 60 data points compared, and the Monte Carlo and measured data were not significantly different from each other (p = .743). Using a 40-kVp/1.0 mm Al spectrum and a 30-mm polycarbonate cylindrical phantom, the mean absorbed dose (averaged over six different depths in the phantom) reported by Goertzen [17] was 30.9 mGy. A dose of 26.3 mGy was computed using the air kerma measured at the phantom's isocenter and the appropriate coefficient in Table 3, a difference of about 15%. For a 50-kVp/2.0 mm spectrum, Goertzen's TLD measurements gave a dose of 22.2 mGy, which compared well to the dose of 23.5 mGy computed using the appropriate coefficient in Table 4, with only a 6% difference. These comparisons suggest that the coefficients reported in this study are capable of reasonably accurate dose assessment in the mouse.
Discussion
Mean Dose (μGy) per 106 photons/mm2 at Isocenter

These data were computed for a 30-cm SIC and a 12-cm zFOV. The monoenergetic coefficients Dm(d,E) are given in the units of μGy per 106 photons/mm2 where the fluence is determined at the plane of the isocenter of the scanner.
Dose Estimation (from Figure 6)
Mean Dose to Animal (mGy) Per Unit Kerma at Isocenter (mGy)

These data are for a 30-cm SID and 12-cm zFOV. The units are mGy/mGy. The polyenergetic coefficients, Dp(d,kVp) for a W-anode X-ray beam with 0.5 mm of added aluminum filtration.
Mean Dose to Animal (mGy) Per Unit kerma at Isocenter (mGy)

These data are for a 30-cm SID and 12-cm zFOV. The units are mGy/mGy. The polyenergetic coefficients, Dp(d,kVp) for a W-anode X-ray beam with 1.0 mm of added aluminum filtration are provided.

Dose Computation (from Table 4)
For more precise computations of dose, air kerma measurements and the technique factors specific to the CT scan are required. Air kerma measurements should be determined at the plane of the isocenter without backscatter, using “free-in-air” measurement geometry (structures which cause scatter should be removed before the kerma measurements are made). The following parameters are assumed in the calculation:
beam energy = 80 kVp
mouse diameter = 15 mm
field of view (along z-axis) = 12 cm
SIC distance = 30 cm
inherent filtration = 2.0 mm Al
air kerma at isocenter = 1.64 mGy/mAs
product of tube current and exposure time
per projection image = 0.32 mAs
number of projection images per CT scan: 500 images
Mean Dose to Animal (mGy) Per Unit Kerma at Isocenter (mGy)

These data were computed for a 30-cm SIC and a 12-cm zFOV. The units are mGy/mGy. The polyenergetic coefficients Dp(d,kVp) are given for W X-ray spectra with 2.0 mm of added al.
Table 4 (where inherent filtration is 2.0 mm Al, and SIC = 30 cm) is consulted at the entry corresponding to a 15-mm mouse diameter and 80 kVp, and this value (bolded on the table) is 0.9946 mGy/mGy.
The kerma for the CT acquisition is:

The dose to the mouse is computed as:

Summary
Monte Carlo simulations combined with physical measurements of X-ray spectra typical of mouse imaging were used to compute mean absorbed dose coefficients [Dp(d,kVp)], normalized to kerma at isocenter. These coefficients will allow investigators to compute the radiation dose to small-animals from X-ray exposure in radiography or micro-CT. Dose computations were performed over a range of realistic mouse imaging geometries. Table 1 gives the dose coefficients (μGy per 106 photons/mm2) for monoenergetic X-ray beams. Tables 2, 3, and 4 are dose coefficients (mGy/mGy) for X-ray systems with differing inherent filtration.
Coefficient tables for a more comprehensive range of parameters are available by e-mail request to the first author. The available tables include dose calculation coefficients [Dm(d,E) for E = 6 to 100 keV, and for d = 5 to 40 mm]. The polyenergetic dose coefficients, Dp(d,kVp), are available for kVps ranging from 15 to 100 kVp, and for d from 10 to 40 mm. The polyenergetic tables are also available for differing amounts of added aluminum filtration.
Footnotes
Abbreviations:
Appendix
Two X-ray spectral models were used in this investigation, a previously reported model which was tuned to emulate a cardiac catheterization system (40–100 kVp, CATH spectra) [12] and the other was produced from the X-ray spectra measured (15–50 kVp) in this study (MOUSE spectra), as described in the Materials and Methods section. To adjust the unfiltered MOUSE spectra to the same level of inherent filtration as the CATH spectra, aluminum filtration was added mathematically to the MOUSE spectra and the resulting half value layer (HVL) was computed. It was found by iteration that 2.0 mm of added filtration to the MOUSE spectra provided HVLs that were consistent with the unfiltered CATH spectral model. Figure A1 illustrates the HVLs for the X-ray spectra discussed in this study.
This figure illustrates the half value layer (HVL) as a function of tube voltage for three different levels of added filtration, 0.5 mm, 1.0 mm, and 2.0 mm Al. This figure is provided for readers to compare their relative beam quality to the spectra used in this study. The 2.0-mm curve represents the combined results of two spectral models, one from 15 to 45 kVp, the other from 45 to 100 kVp. The dotted lines adjacent to the 2.0-mm curve (from 15 to 45 kVp) were filtered with 2.1 mm Al (top dotted line) and 1.9 mm (bottom dotted line).
Acknowledgments
We thank the reviewers for their comments. This research was supported in part by a grant from the California Breast Cancer Research Program (7EB-075), from the National Cancer Institute (R01 CA89260), and from the National Institute for Biomedical Imaging and Bioengineering (R01 EB002138 and EB00230). The UC Davis Cancer Center also provided funding for this project.