
Abstract
In this paper, the mathematical model of production performance analysis for horizontal wells in composite coal bed methane reservoir is introduced. In this model, two regions with different formation parameters are distinguished, and multiple mechanisms are considered including desorption, diffusion, and viscous flow. Then the solution of horizontal well performance analysis model is obtained by using point source function method, Laplace transform, and Stehfest algorithm comprehensively. The solution of the proposed model is verified with previous work thoroughly. The pressure transient analysis for horizontal well when producing at a constant rate is obtained and discussed. At last, different flow regimes are divided based on pressure transient analysis curves. They are early wellbore storage period, skin factor period, first radial flow regime, transition regime, second radial flow regime, transfer regime, and late pseudo-radial flow regime. The effects of related parameters such as storativity ratio, transfer coefficient, adsorption coefficient, ratio of vertical permeability to horizontal permeability, skin factor, horizontal well position in vertical direction, and inner region radius are analyzed as well according to pressure transient analysis and rate transient analysis curves. The presented work in this paper can give a better understanding of coal bed methane production performance in composite reservoir.
Keywords
Introduction
Coal bed methane (CBM) which is an unconventional gas resource (Law and Curtis, 2002) has emerged as an important energy source worldwide over the last several decades and will play an important role in the future energy industry (Flores, 1998; Letcher, 2013; Moore, 2012; Rightmire, 1984). Taking the U.S. as an example, by the end of 2013, the proved reserve of CBM was 12,392 billion cubic feet which took up about 3.5% of U.S.’s domestic natural gas reserves. The estimated production was 1466 billion cubic feet which accounted for about 4.75% of U.S.’s domestic natural gas production (Source: http://www.eia.gov/dnav/ng/NG_ENR_COALBED_DCU_NUS_A.htm).
The pore structure, gas storage, and flow mechanisms for CBM reservoir are different from that of conventional gas reservoirs. CBM reservoir is composed of the matrix, micropores, cleat system, and gas (Anbarci and Ertekin, 1991; Gong et al., 2014; Nie et al., 2012; Remner et al., 1986). CBM reservoir is always taken as a dual porosity media (Warren and Root, 1963)—the macropores in the cleat system and those in the coal matrix (Pillalamarry et al., 2011; Yu-long et al., 2014). Most gas stores as adsorption gas in matrix (Gray, 1987; Pillalamarry et al., 2011). To describe the flow mechanisms in CBM reservoir, three processes are distinguished: (1) Desorption. The decrease of reservoir pressure will result in the desorption of gas from coal grains. (2) Diffusion. The gas will diffuse in micropores of matrix. (3) Viscous flow. The transport of gas in the cleat network is Darcy flow because the diameter of the cleat network is large enough (Nie et al., 2012; Yu-long et al., 2014). To analyze the flow characteristics and well performances of CBM reservoir, production performances such as pressure transient analysis (PTA) and rate transient analysis (RTA) are always used as effective tools (Doublet et al., 1994; Nie and Ding, 2010; Yu-long et al., 2014).
Besides vertical wells, horizontal wells are also commonly employed in CBM development (Palmer, 2010; Palmer et al., 1993). Many scholars have studied the PTA or RTA for horizontal wells. Sarkar and Rajtar (1994) presented an analytical solution for pressure transient behavior of horizontal wells in a coal bed reservoir considering wellbore storage and skin. A semi-infinite, anisotropic CBM reservoir was assumed. Engler and Rajtar (1992) studied the pressure response for horizontal wells in CBM gas reservoirs, and both analytical solution and numerical simulation results were given in their work. The effects of the diffusion coefficient and desorption coefficient were also analyzed in detail. Clarkson et al. (2009) studied the production performance analysis workflows for both single- and two-phase flow and for both vertical well and horizontal well. King and Ertekin (1988) developed the CBM numerical simulator to study the flow characteristics of vertical fractured well or horizontal well and it can be used for two-phase flow (water and gas). Nie et al. (2012) studied horizontal well production performance analysis method in coal bed seam. Their model was solved using Laplace transform method. The rate decline and pressure transient curves were used to analyze single- and two-phase gas flow. All above works assumed the CBM reservoir to be homogenous and none of them considered composite CBM reservoirs.
For composite reservoirs, Shi et al. (2012) demonstrated the equation for horizontal well pressure response in composite oil reservoirs considering the whole horizontal well located in the inner region. However, the type curves were not presented. Zhang et al. (2010) introduced a new well testing model in composite oil reservoirs and the reservoirs were assumed to be linear and have two zones. Formation properties were assumed to be different in different zones. Raghavan (2012) analyzed the pressure transient behaviors in a two-region composite system using the Green's function method and the method of sources and sinks. Jiang et al. (2014) presented the rate transient behavior of fractured horizontal well in tight oil reservoir and Zhao et al. (2014) gave the performance of multistage fractured horizontal wells considering stimulated reservoir volume (SRV) for both tight gas and shale gas. The PTA and RTA were presented considering multiple effect parameters. Zhao et al. (2014) illustrated the PTA and PTA behaviors for vertical fractured wells considering multiple transport flow mechanisms including adsorption/desorption, diffusion in matrix, and Darcy flow in cleat fractures. Chen and Raghavan (1995) presented some solving methods for fractured well and horizontal well in composite oil reservoirs. As can be seen, though many scholars have done great jobs on PTA and RTA in composite system, little is related to horizontal well of CBM.
This article studies the production performance behavior for single-phase CBM horizontal wells in composite CBM reservoir. The goal is to demonstrate the PTA and RTA results for the better understanding of the production performances in CBM development. The rest of the article is organized as follows: In the next section, the physical model including the transport mechanisms and the production scenario of the CBM reservoir are introduced. In the following section, the mathematical model is established, and the solution of the mathematical model is described in “Model solution” section. “Result and discussion” section will demonstrate the type curves and flow regimes based on the solution. Later, the difference among the composite CBM model, the homogenous CBM model, and the composite noncoal reservoir model will be presented. At last, sensitivity analysis will be made on several important parameters affecting CBM production.
Physical model
The CBM is always taken as a dual-porosity media which contains the matrix and cleat, and they generally have different properties. In our model, four flow stages are considered in CBM production process (see Figures 1 and 2). They are as follows: (1) Desorption. The pressure drop in the cleats will result in the gas desorption from the matrix grain. This phenomenon can be described using Langmuir isotherm theory (Gong et al., 2014; Nie et al., 2012; Zhao et al., 2014). (2) Diffusion in matrix micropores. After desorption from the matrix grain, gas will diffuse into the cleat. In this paper, the pseudo-steady diffusion is used. (3) Flow in cleat. Flow in the cleat network is viscous flow which obeys Darcy's law. (4) Flow between the cleat and wellbore. The gas will flow into the wellbore from the cleat due to the decline of wellbore pressure; the flow process among different systems is illustrated in Figure 2.
Gas storage and transport in the coal seam (modified from Remner et al. (1986)). Flow process in CBM reservoir. CBM: coal bed methane.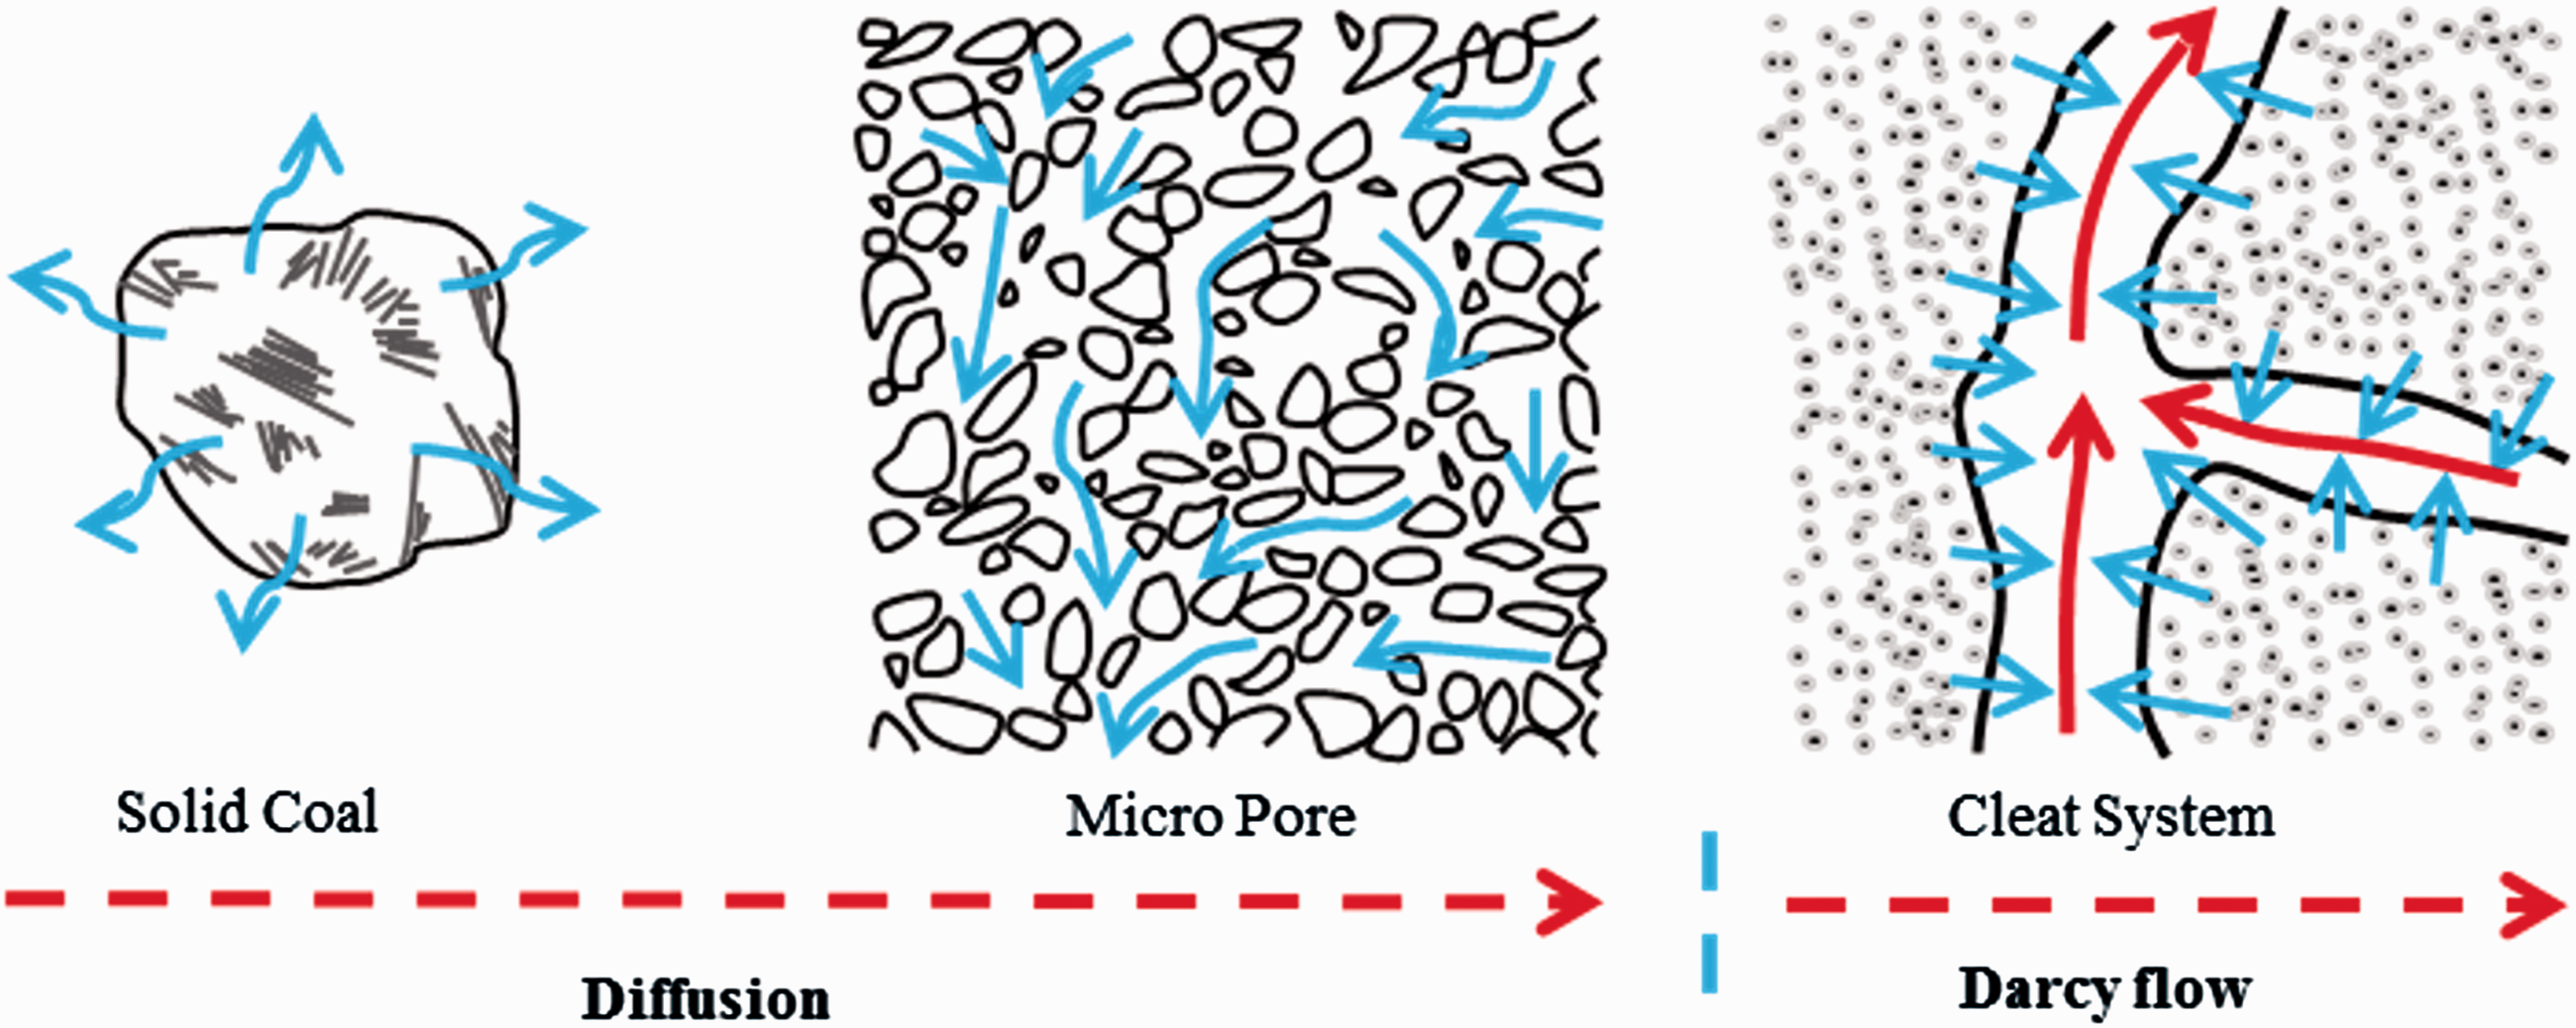
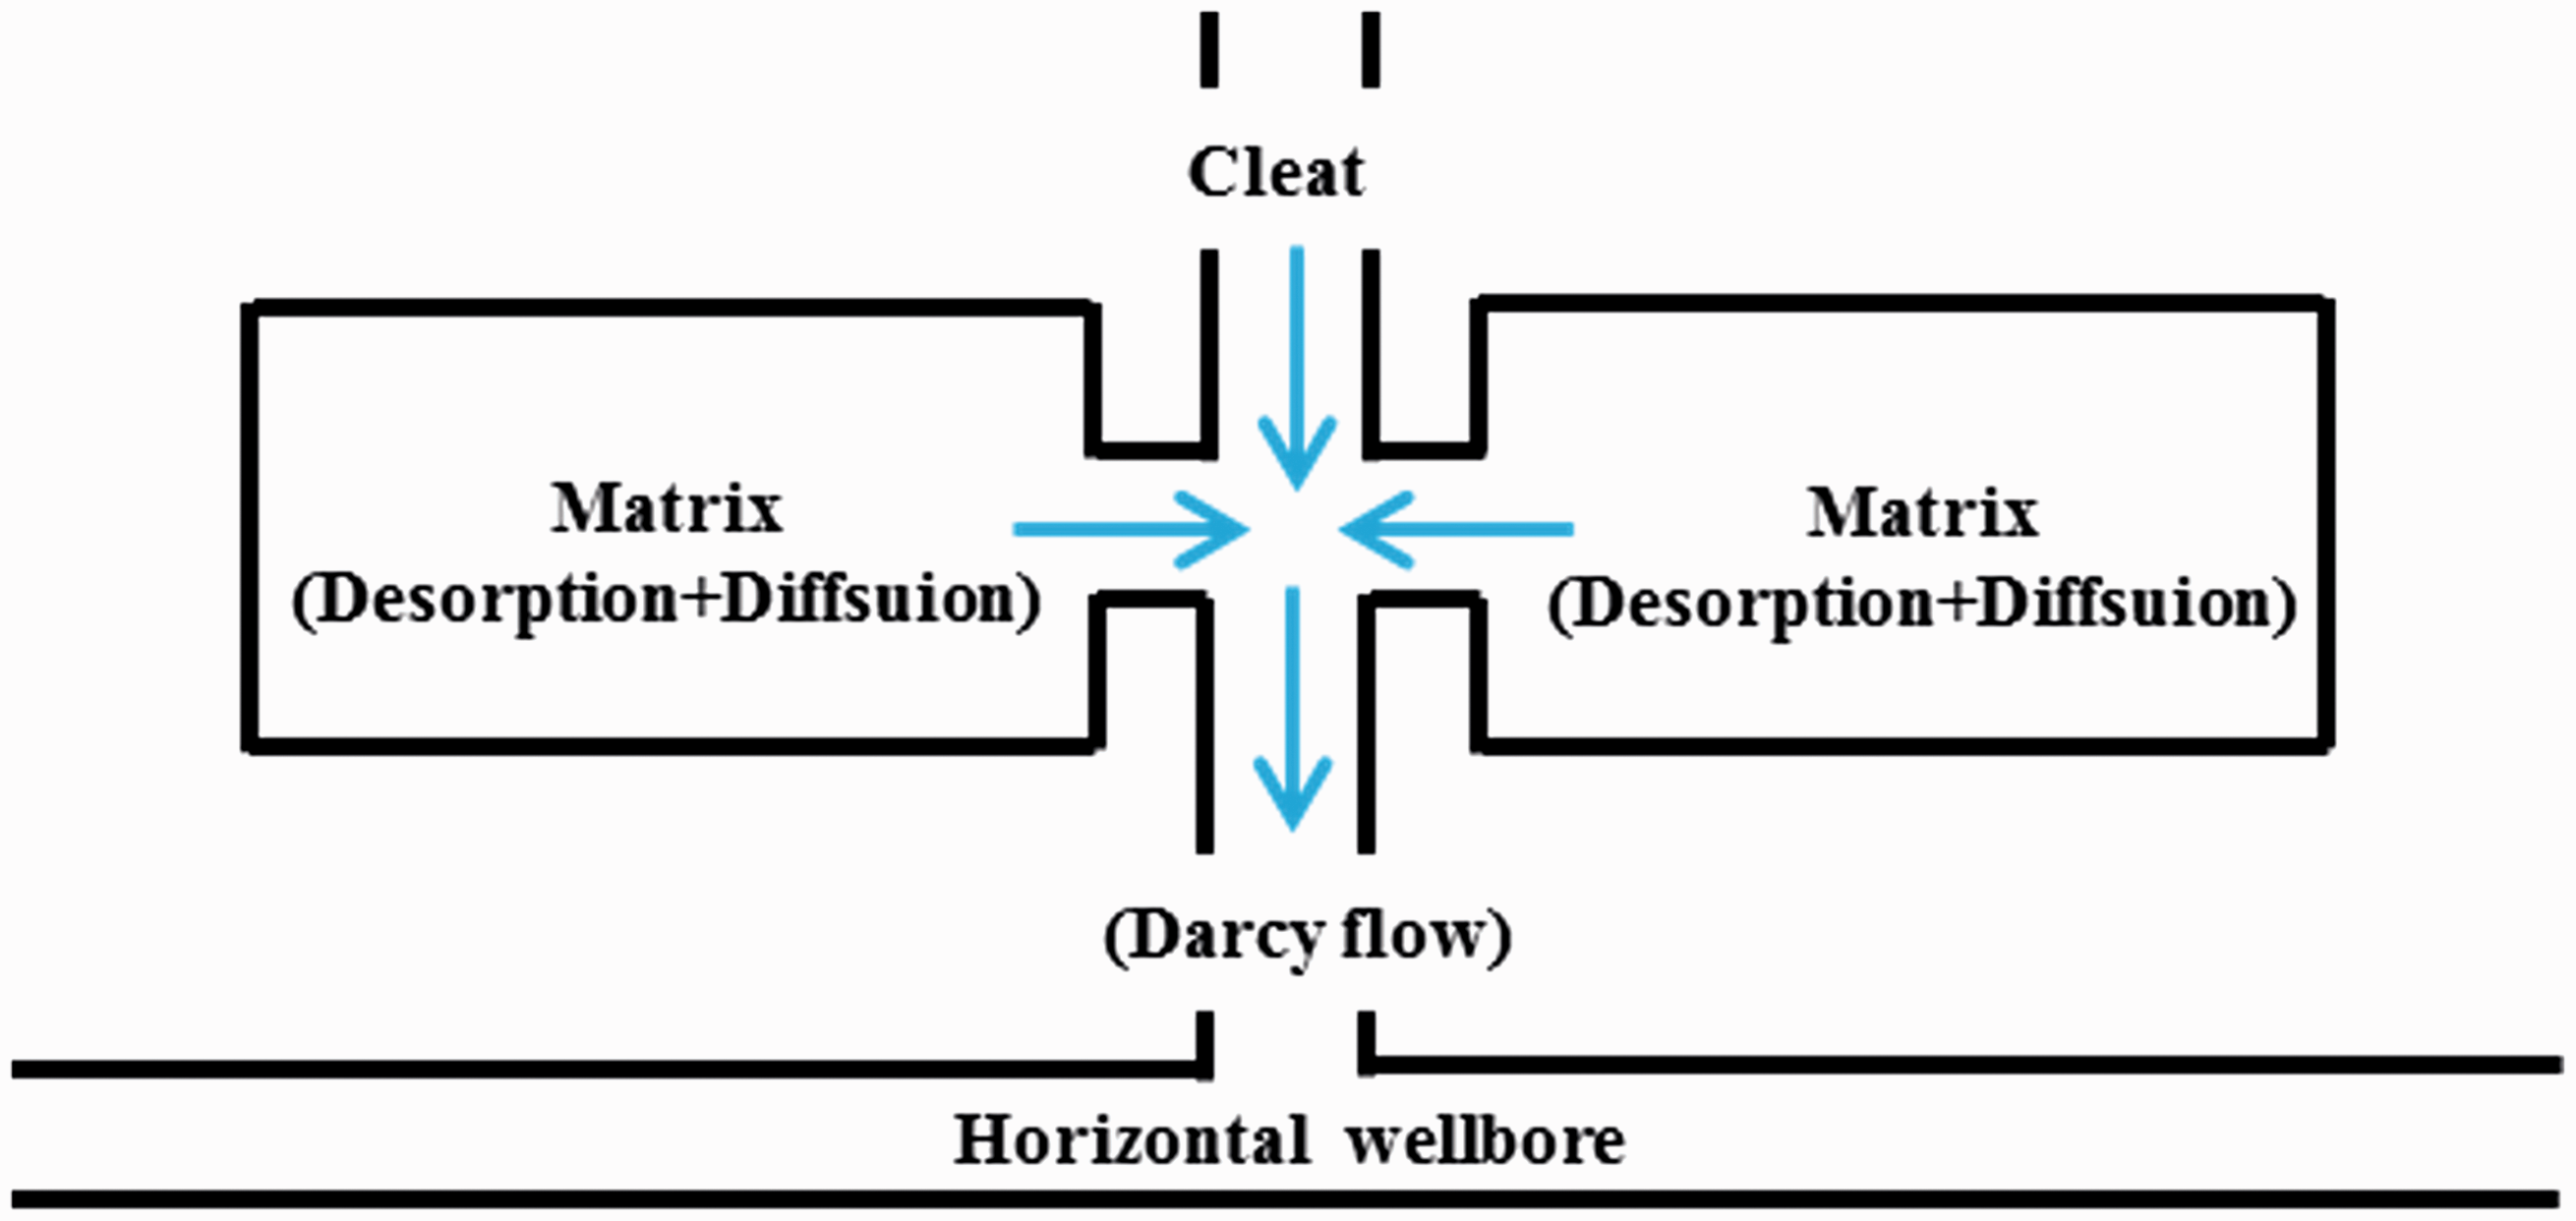
Because the well is always drilled in a region with best reservoir properties, the reservoir properties near the production well are always better than that far away from the well. In order to characterize the heterogeneity of the CBM reservoir, the reservoir in this work is set to be a composite system containing an inner region and an outer region. Also composite models can be applied to describe hydraulic fracturing wells with SRV; however, the proposed model in this work is only developed for characterizing the heterogeneity of CBM reservoir but not for fractured reservoirs. The permeability of inner region is assumed to be larger than that of outer region, and the horizontal well is in the inner region completely (see Figure 3).
Production scenario of CBM used for mathematical model.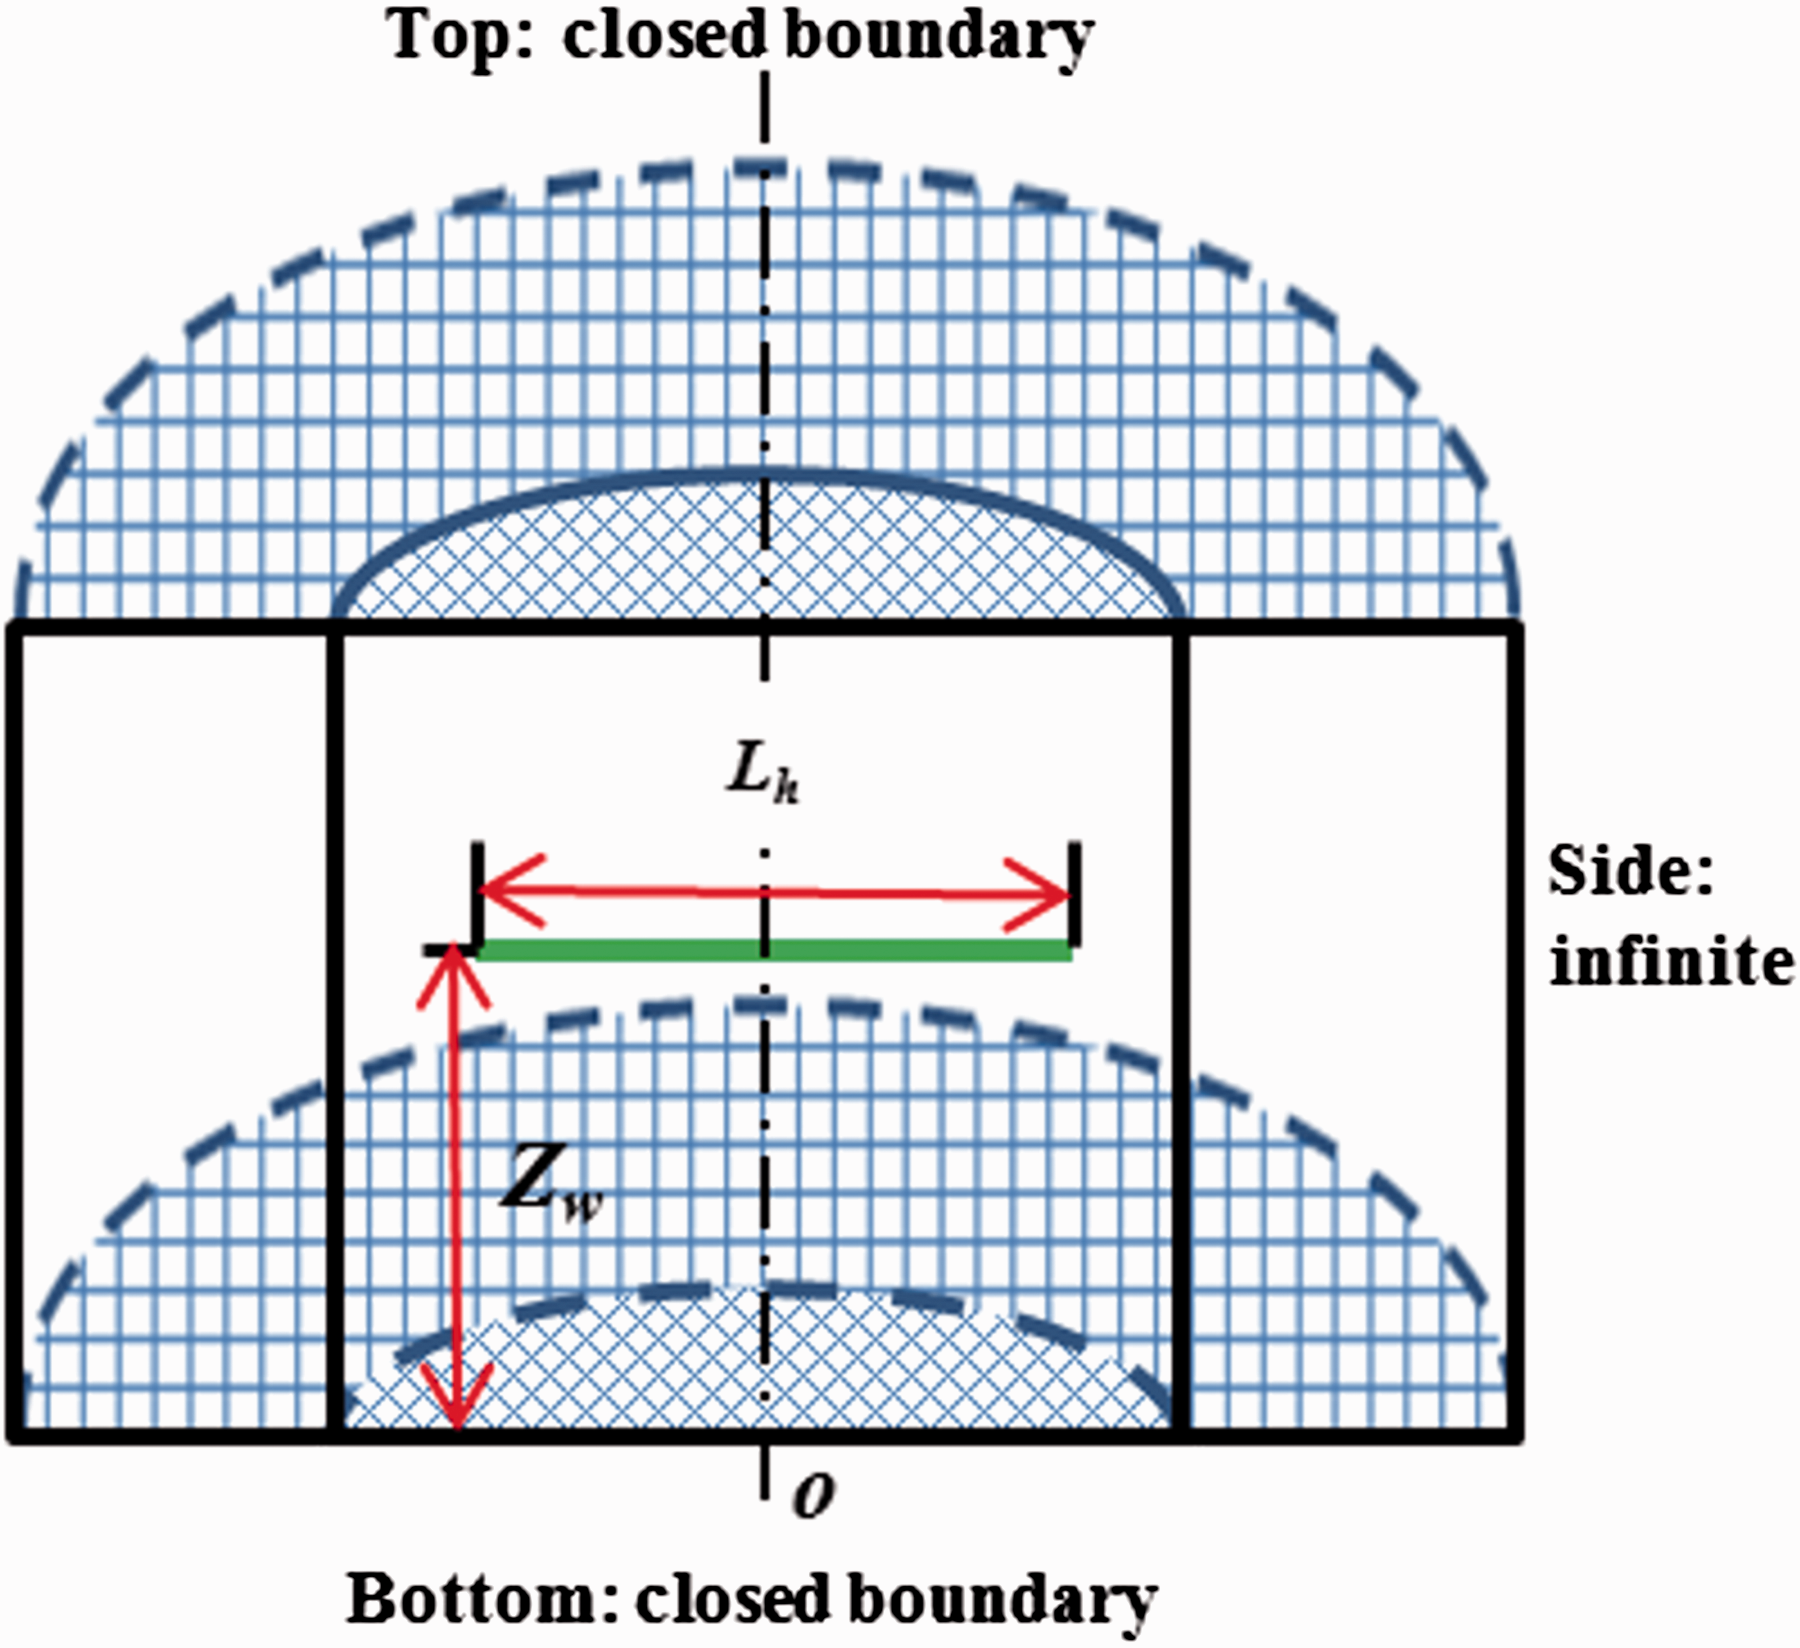
Mathematical model
Mathematical model
The production scenario is a radial cylindrical composite reservoir and the cylindrical coordinates are used in model description. Some assumptions are made as follows:
Well produces at a constant rate or at a constant wellbore pressure. The outer boundary is assumed to be infinite for the outer region and the top and bottom boundary to be closed. The inner region radius is r
1
(see Figure 3). The CBM flux along the horizontal wellbore is assumed to be uniform. This assumption makes it possible to use point source method. Wellbore storage phenomenon and skin factor are considered. The reservoir is horizontal with uniform thickness of h and initial pressure p
i
. For the inner region, the horizontal permeability is k
h1
, the vertical permeability is k
v1
, the compressibility C
t1
, and the porosity is φ
1
; while for the outer region, they are k
h2
, k
v2
, C
t2
, φ
2
.
For the fracture system, according to the assumptions of the physical model, the diffusivity equation for flow of CBM in fracture system can be derived by coupling mass conservation equation, equation of state, and equation of motion

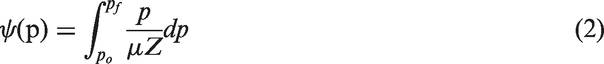
To linearize gas-flow equations, the pseudo-pressure approach is applied. The pseudo-pressure is defined as follows
The mathematical model in the radial cylindrical coordinate system is established.
Flow equation in the inner region is

Flow equation in the outer region is

The Langmuir isotherm adsorption theory is used to characterize the adsorption characteristics for CBM (Langmuir, 1916)
The diffusion can be described using the pseudo-steady model as follows

Outer boundary


Interface condition


To describe the point source, the spherical coordinate system is utilized and the radial coordinate is R, the inner boundary condition can be described as


The conversion relationships of all coordinate systems


Dimensionless mathematical model
The dimensionless variables are presented in Appendix 1. According to Appendix 1, the dimensionless equations can be obtained.
For inner region, with equations (3), (5), and (6), the following equations can be derived


For outer region, with equations (4) to (6), the following equations can be derived


Taking the Laplace transformation with respect to


Substituting equation (21) into (19) and equation (22) into (20), we get


For equations (7) to (10), the dimensionless model is


M is the mobility ratio of inner region and outer region. Note that the conventional mobility ratio is defined between two different fluids and here, we use the definition to characterize the CBM mobility ability of inner region and outer region. Equations (11) and (12) and (23) to (30) are the mathematical model for composite CBM reservoir.
Model solution
To solve the model, the point function method is used. The detailed derivation is shown in Appendix 2. By integrating the point source regarding


According to the above analysis, the wellbore pressure distribution can be obtained. The integral average method is applied

With the method of Duhamel's principle (Van Everdingen and Hurst, 1949), the solution considering well storage effect and skin effect can be obtained

Using Stehfest numerical inversion algorithm (Stehfest, 1970), the pressure distribution in the real space can be solved and production performance type curves can be plotted. When the well is producing at a constant bottom-hole pressure, the dimensionless rate can be calculated as follows
Result and discussion
The code of the framework is programed by Matlab2013a.
Model verification
In this paper, the CBM reservoir is assumed as a composite one which contains two regions with different formation parameters. If some parameters are set to satisfy certain conditions, the new model proposed in this paper can be converted into some other models. For instance, if f1 = f2 = f, this new model can be simplified as triple-porosity model in a homogenous reservoir; this simplified model is similar with the model proposed by Zhang et al. (2010). f can be described as equation (A-28) in the paper by Wang et al. (2013). Figure 4 depicts the bottom-hole pressure and bottom-hole pressure derivative curves. As can be seen from Figure 4, this new model can match perfectly with the existing model, which indicates that this proposed model is reliable.
Comparison between this study and the result proposed by Wang et al. (2013), and the basic parameters are as follows: (S = 0,2,4; CD = 10; LD = 10; rwD = 0.0001; zwD = 0.5; ωf = 0.01; ωm = 0.85; ωv = 0.1; λvf = 10; λmf = 1; λmv = 0.2)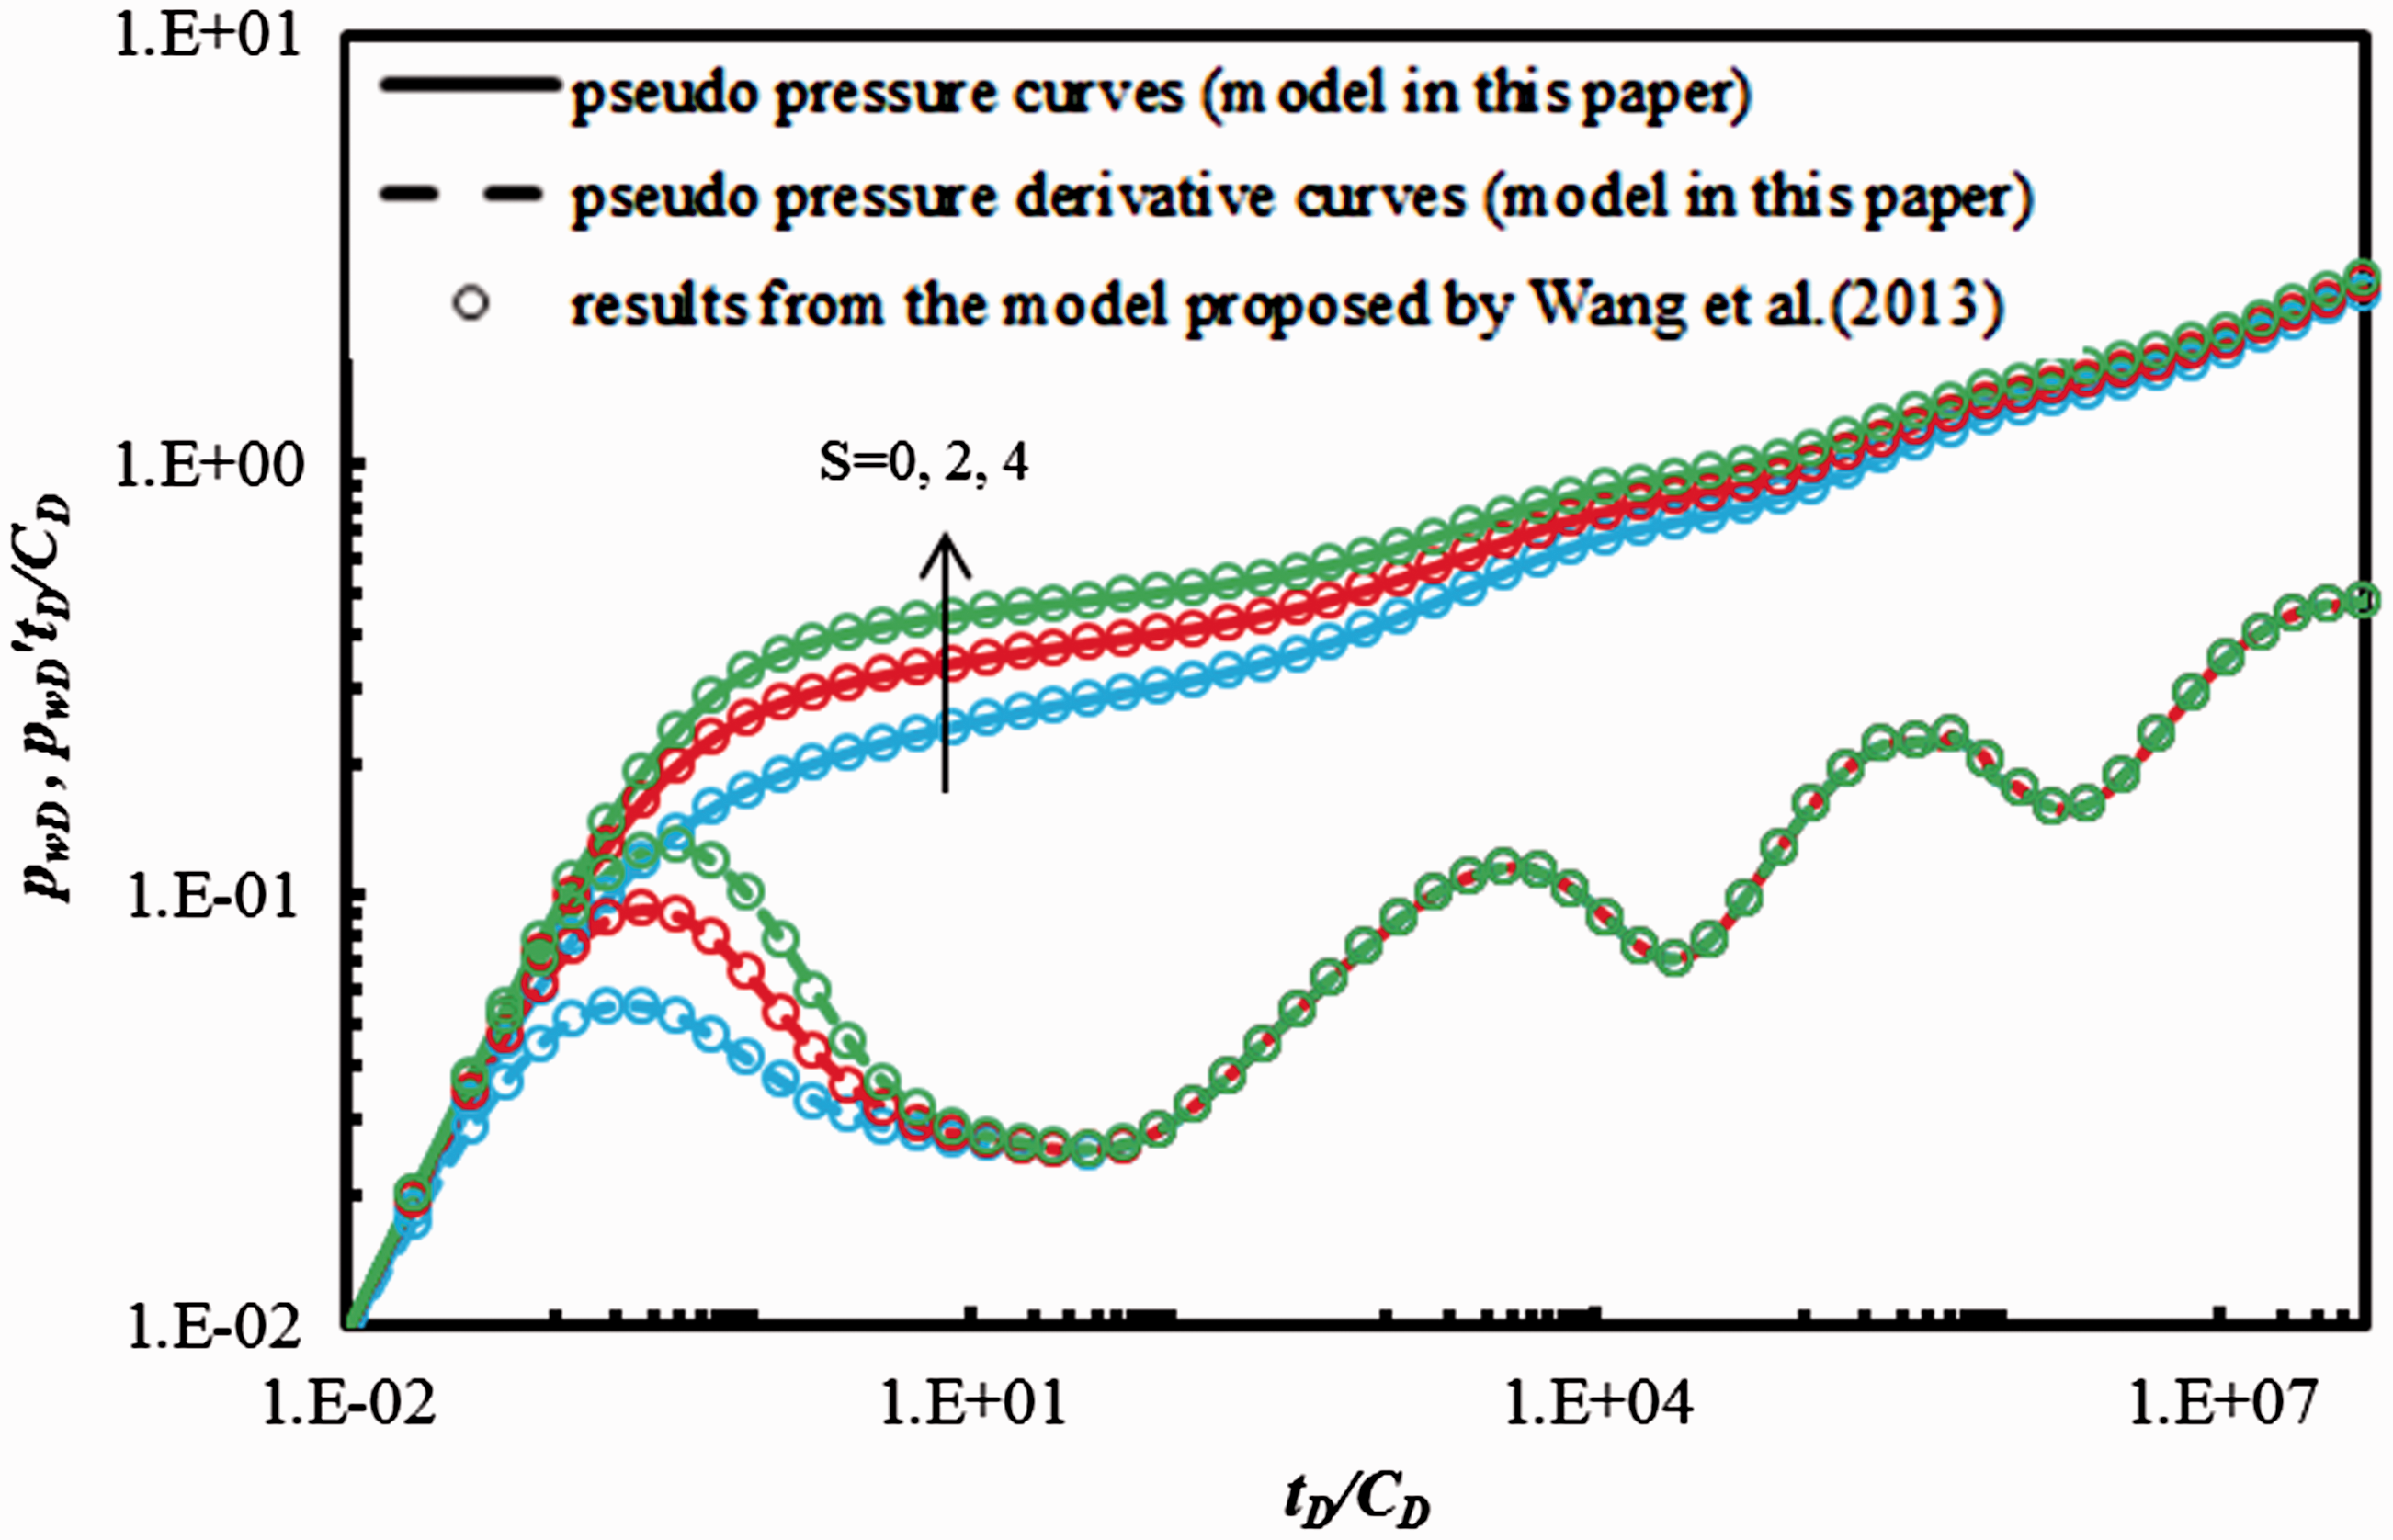
Type curves of horizontal wells in CBM reservoir
In this section, the production performance curves are analyzed in detail. The dimensionless wellbore pseudo-pressure curve (ψ
wD
) and the pseudo-pressure derivative curve ( Regime I: The early wellbore storage period (Guo et al., 2012; Liu et al., 2015; Wang, 2014). The slope is 1 in both the pressure and pressure derivative curve in log-log coordinates.
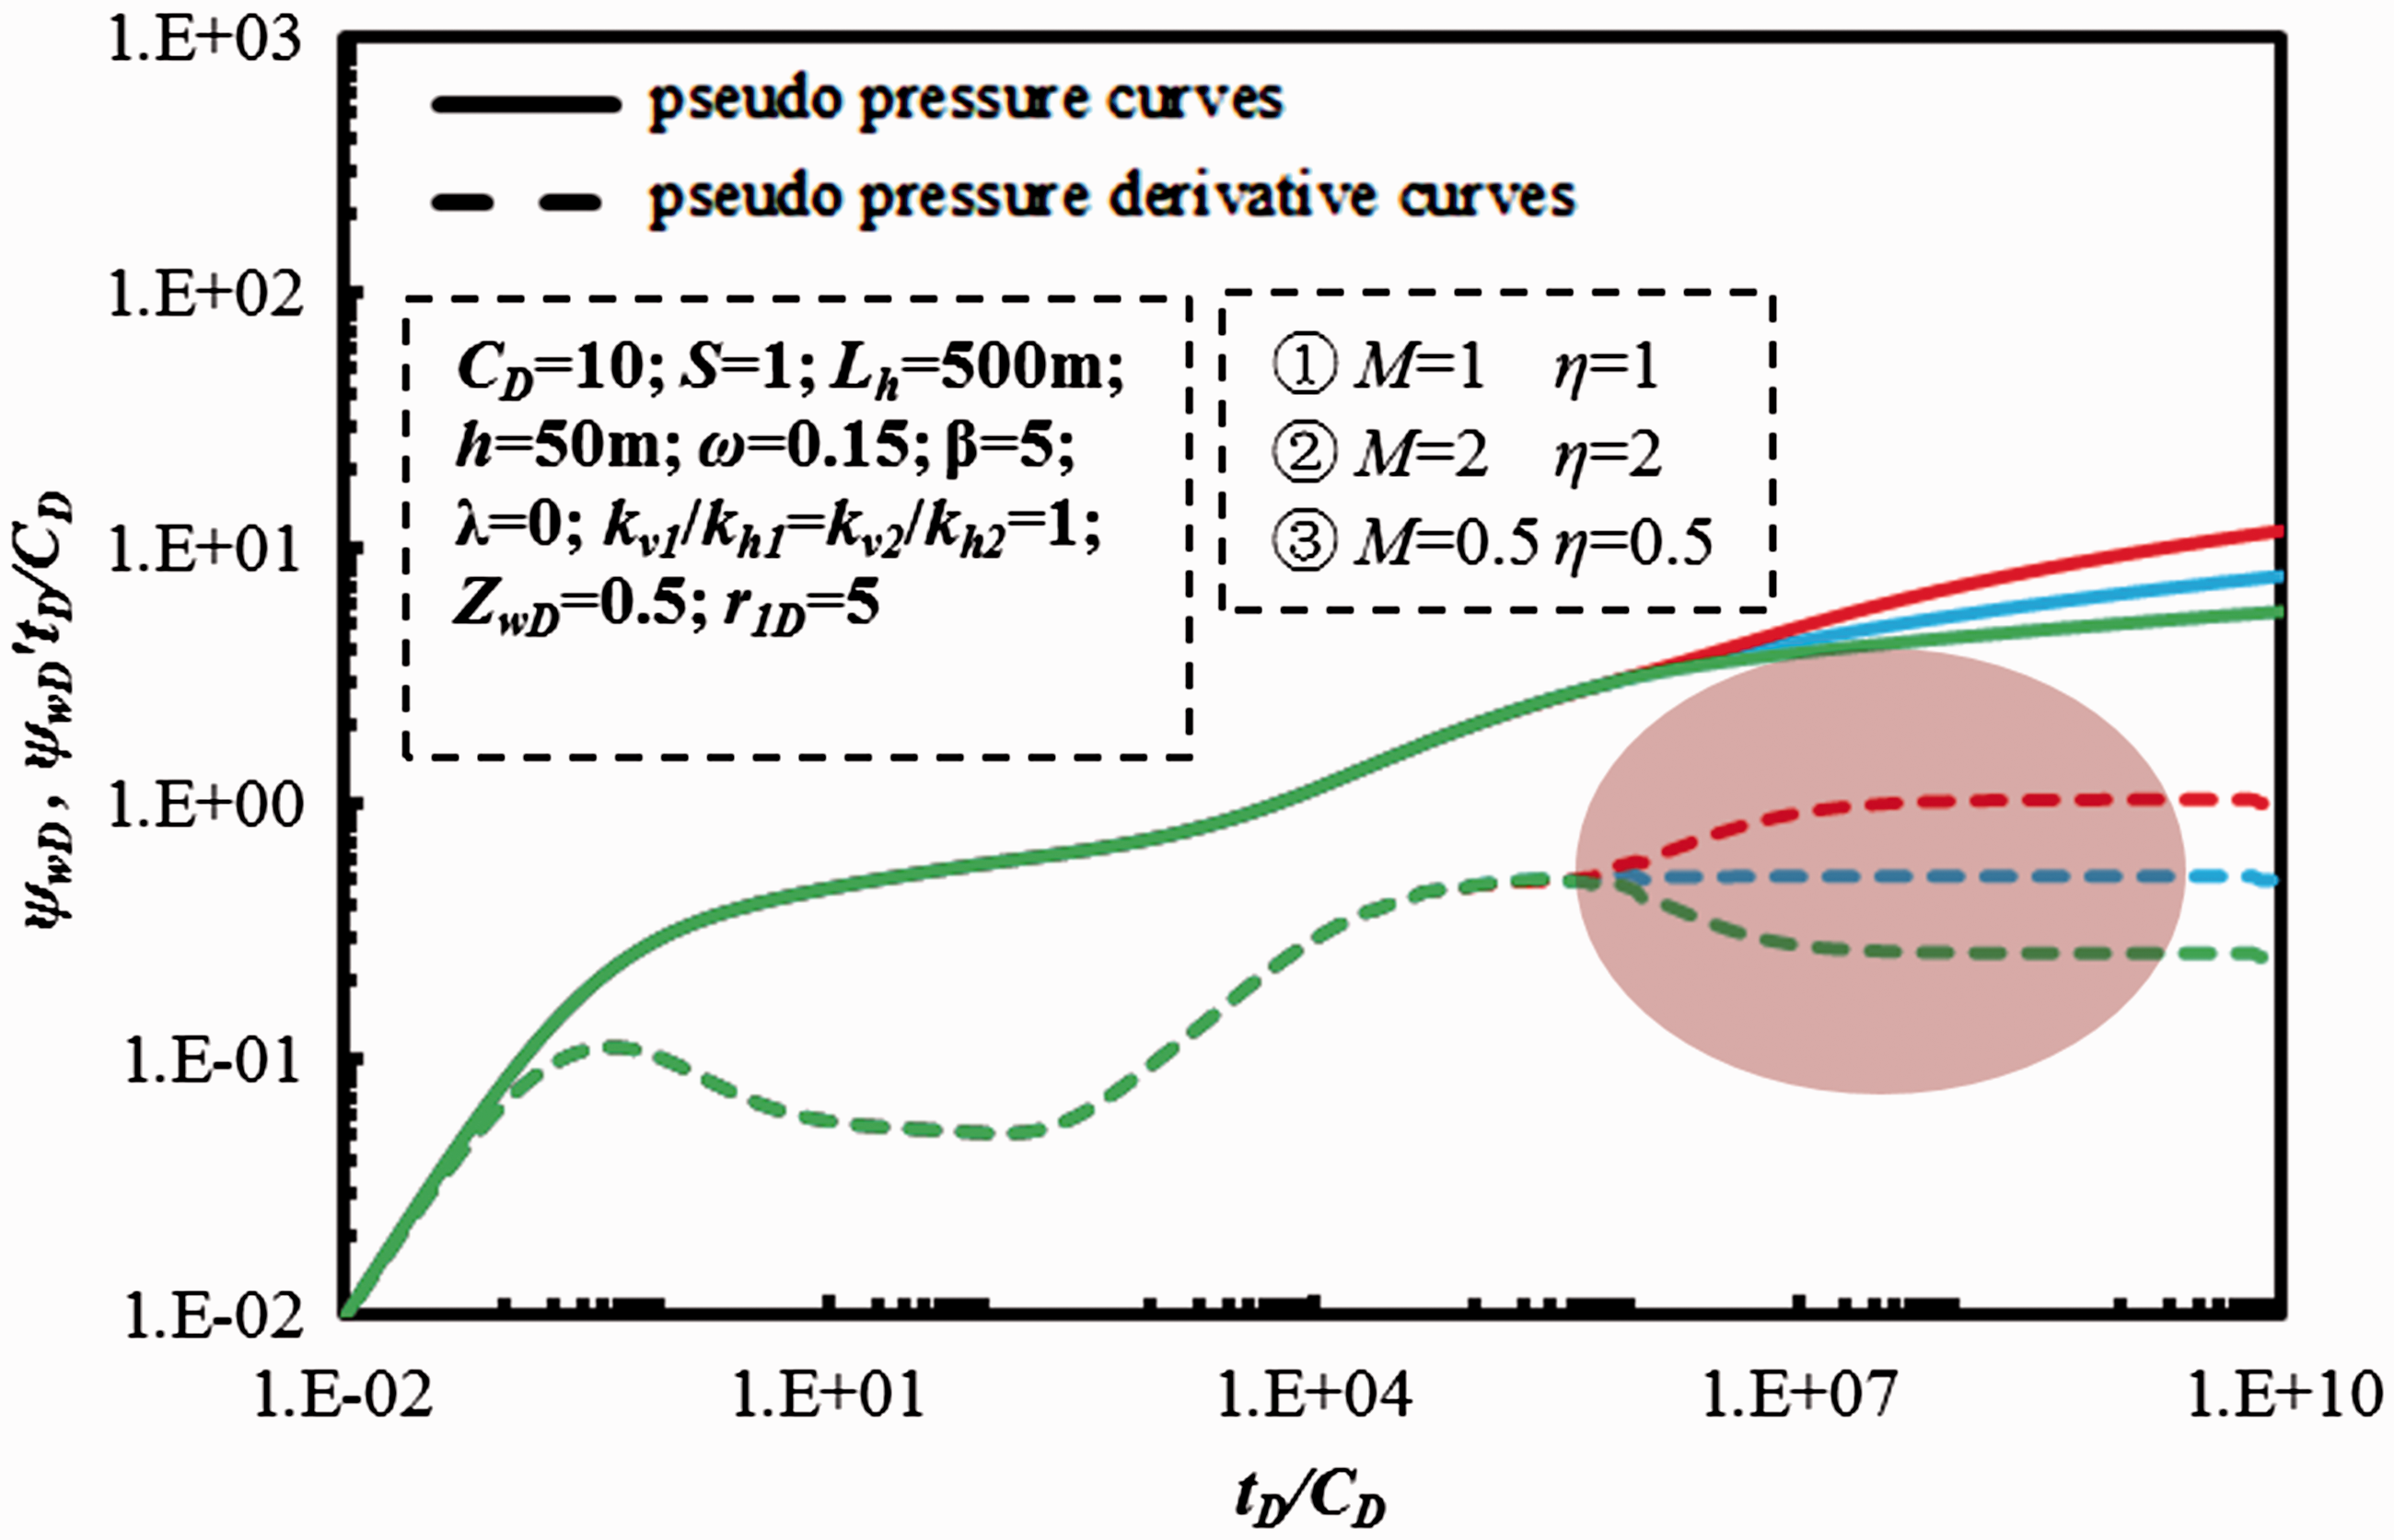
Pressure-transient-type curves of horizontal well in the inner region. Pressure-transient-type curves for noncoal reservoir of horizontal well in the inner region. Regime II: The skin factor period (Zhang et al., 2014). This period is between wellbore storage and the early bilinear flow. Regime III: The first radial flow regime. As can be seen, this regime follows regime II. The value of pseudo-pressure derivative curves is constant which is h
1D
/4. This regime may not be obvious if the thickness of the reservoir is relatively small. Regime IV: Transition regime. When the pressure spreads to the top or bottom boundaries, the first radial flow regime ends and the transition regime happens. For a homogeneous formation, this regime is also called “linear flow regime” (Nie et al., 2012). Regime V: Second radial flow regime. The value of pseudo-pressure derivative curves in this regime is a constant which is 0.5. Regime VI: Transfer regime. In this regime, the gas will flow from matrix to cleat because the pressure in cleat decreases significantly and the diffusion/desorption gas becomes an important supplement flowing into the cleats. There is a “V” shape concave that appears in pressure derivative curves in this regime, which is a typical characteristic for dual porosity media. Regime VII: Late pseudo-radial flow regime. Following regime VI, this regime starts when the gas flow from matrix to cleat and that from cleat to wellbore reach a dynamic balance state. The value in pseudo-pressure derivative curves is constant which is 0.5*M.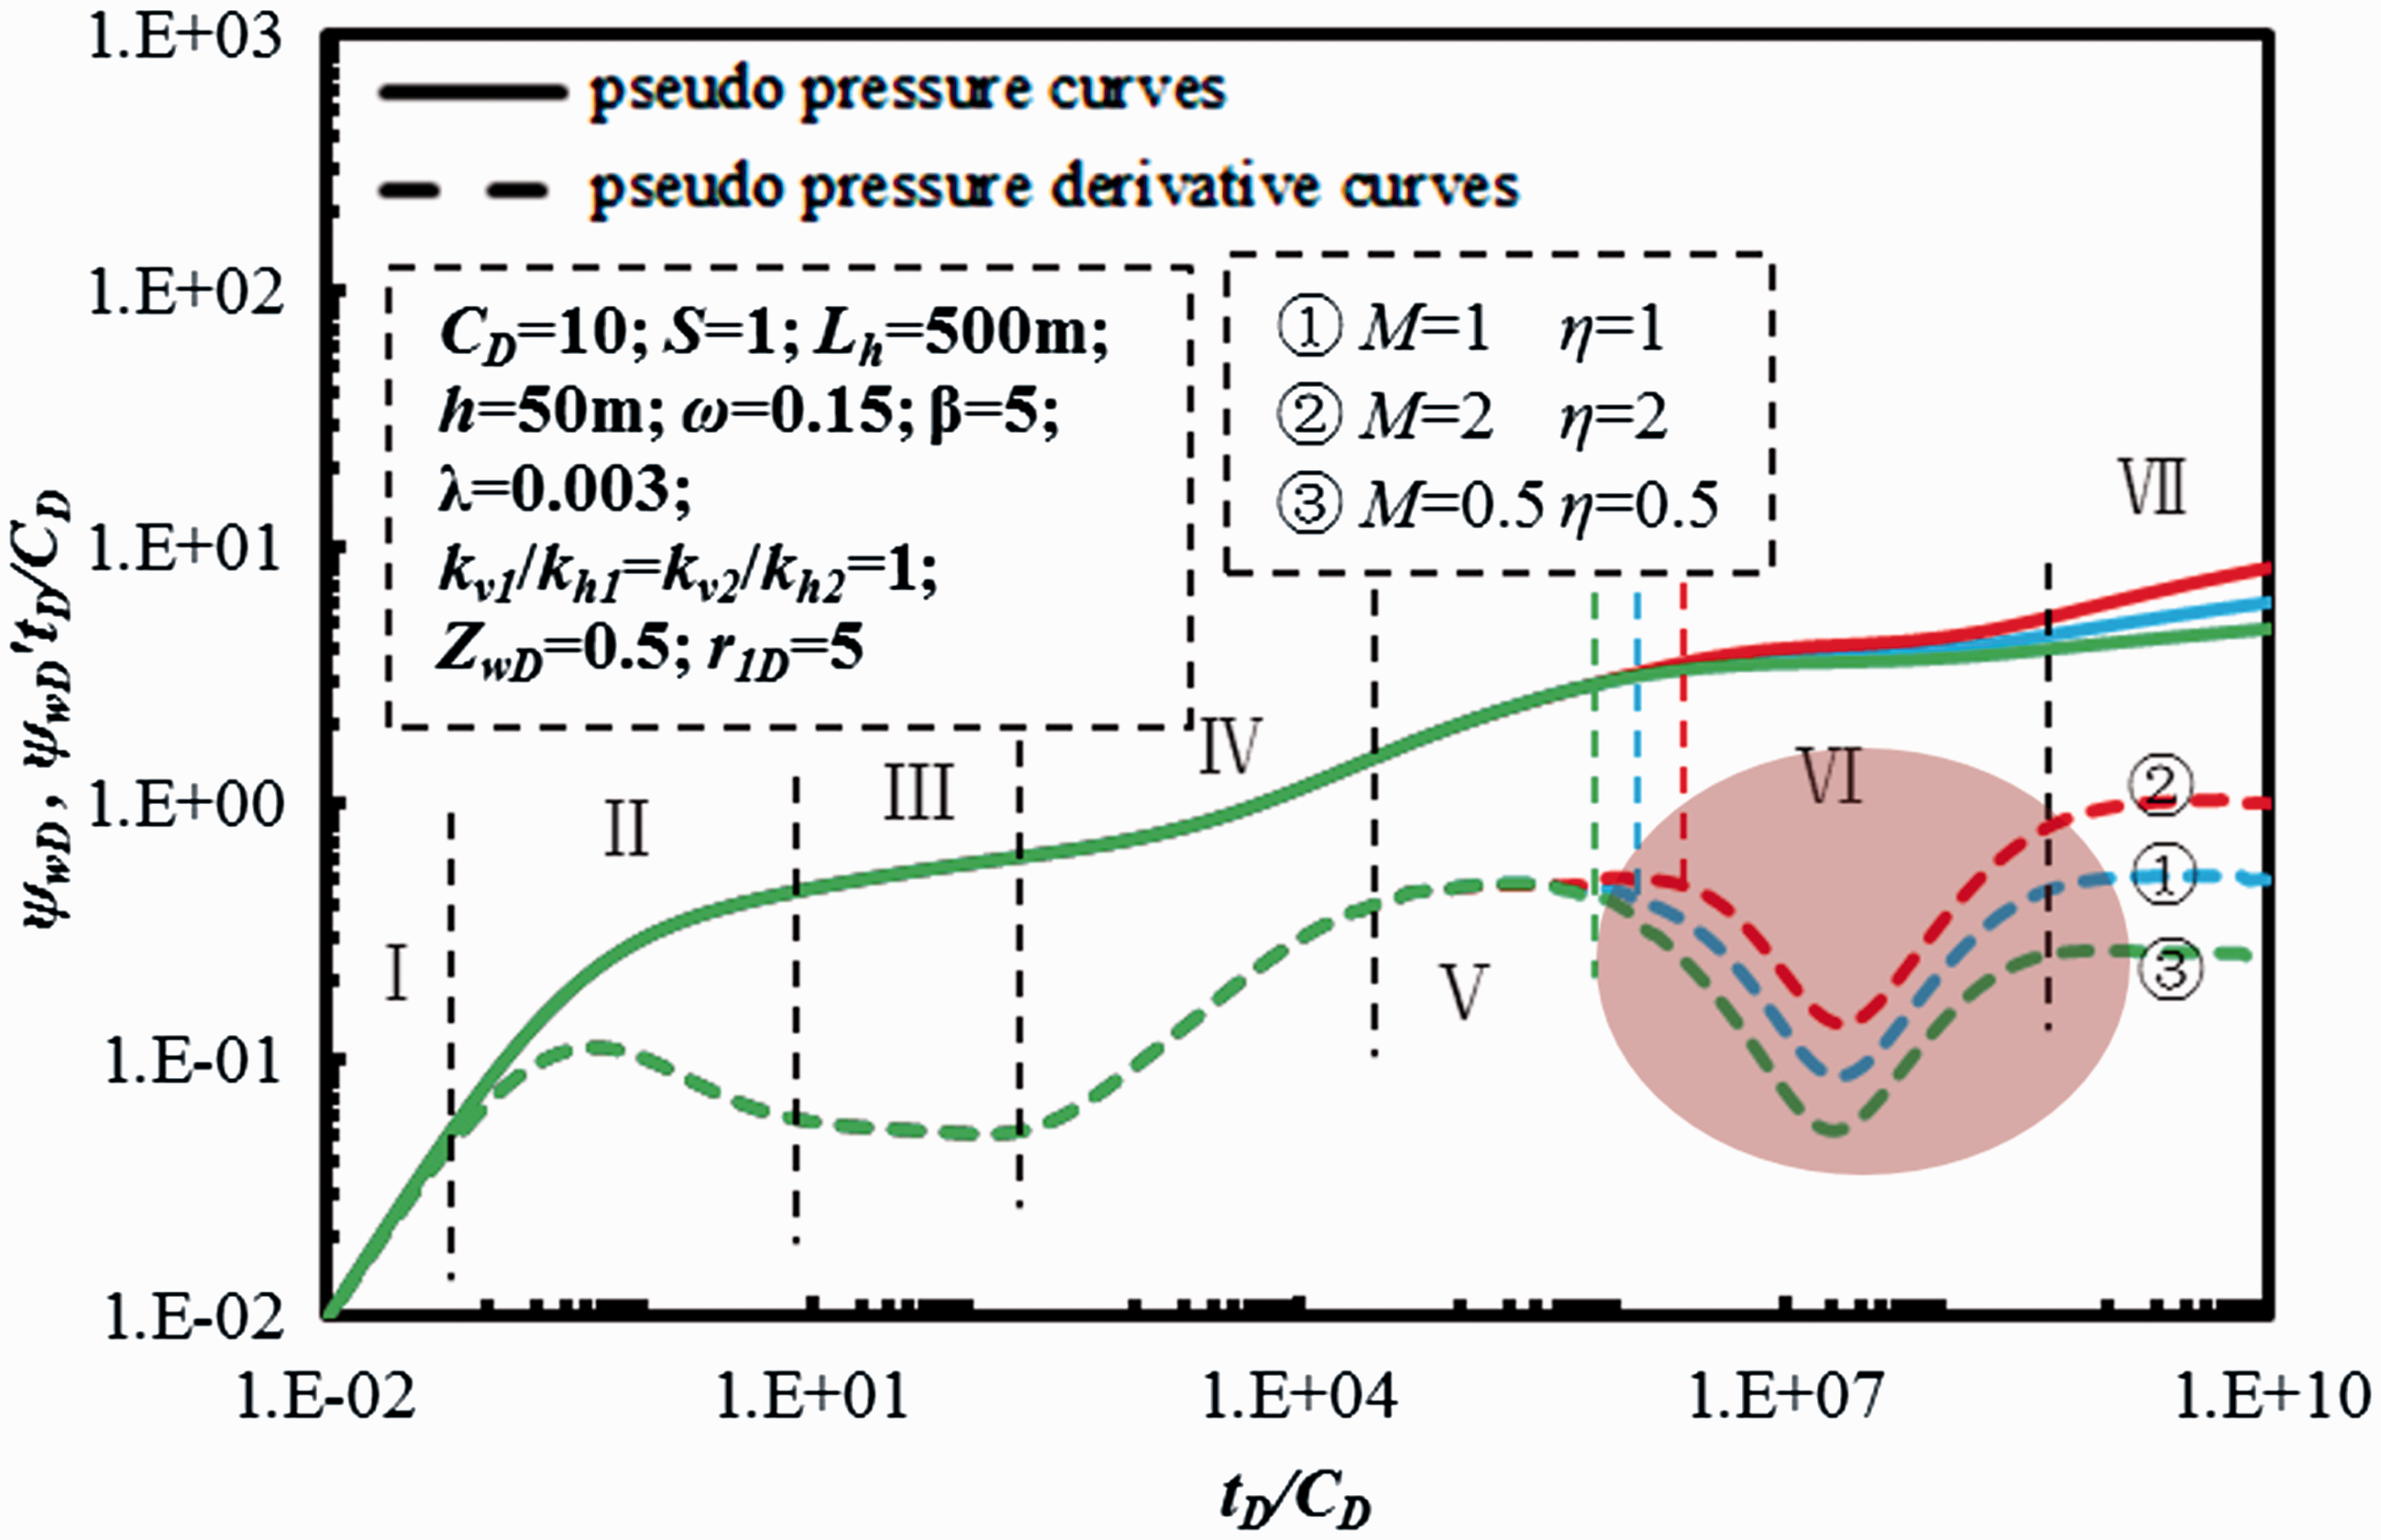
Type curves for noncoal composite reservoir
Until now, the PTA for composite CBM reservoir has been obtained. In addition, when M = η = 1, the PTA can also be applied to homogeneous reservoir. Actually, little work has been done on PTA and RTA curves in detail for horizontal well in circular composite reservoir. In our model, if λ is set to be zero, the PTA or RTA curves can be calculated for the horizontal well in circular composite reservoir without considering the desorption and diffusion flow mechanisms, i.e. the PTA or RTA curves for single porosity reservoir. Figures 5 and 6 are type curves for noncoal gas without desorption and diffusion mechanisms. As can be seen, for the noncoal curves, the regime VI disappears as shown in the brown ellipse.
Sensitivity analysis
In this section, the influences of seven sensitive parameters are analyzed. Besides the dimensionless wellbore pseudo-pressure curve and the pseudo-pressure derivative curve, the RTA-type curves of the Q
D
and Effect of storage coefficient ω.
Figure 7 shows the effect of storage coefficient of cleat ω on PTA-type curves. According to the analysis in “Type curves of horizontal wells in CBM reservoir” section, there are seven flow regimes for CBM PTA curves. From Figure 7, we can see the storage coefficient mainly affects regime II, regime IV, and regime VI. A smaller storage coefficient indicates relatively smaller reserves in cleat. When producing at a constant production rate, the pressure spreads quicker than that with a bigger storage coefficient. This leads to earlier appearance of regime IV and regime VI. On the other hand, a smaller storage coefficient causes a deeper “V” shape concave in regime VI. Figure 8 shows the effect of storage coefficient of cleat ω on RTA-type curves. When the storage coefficient increases, the production rate grows bigger, which reflects a high supply capacity for the CBM to flow from cleat to wellbore with the constant wellbore pressure. Also, similar to the PTA curves, a smaller storage coefficient causes a deeper “V” shape concave in regime VI in RTA-type curves.
2. Effect of transfer coefficient λ. The effect of storage coefficient on pressure-transient-type curves. The effect of storage coefficient on rate-transient-type curves.
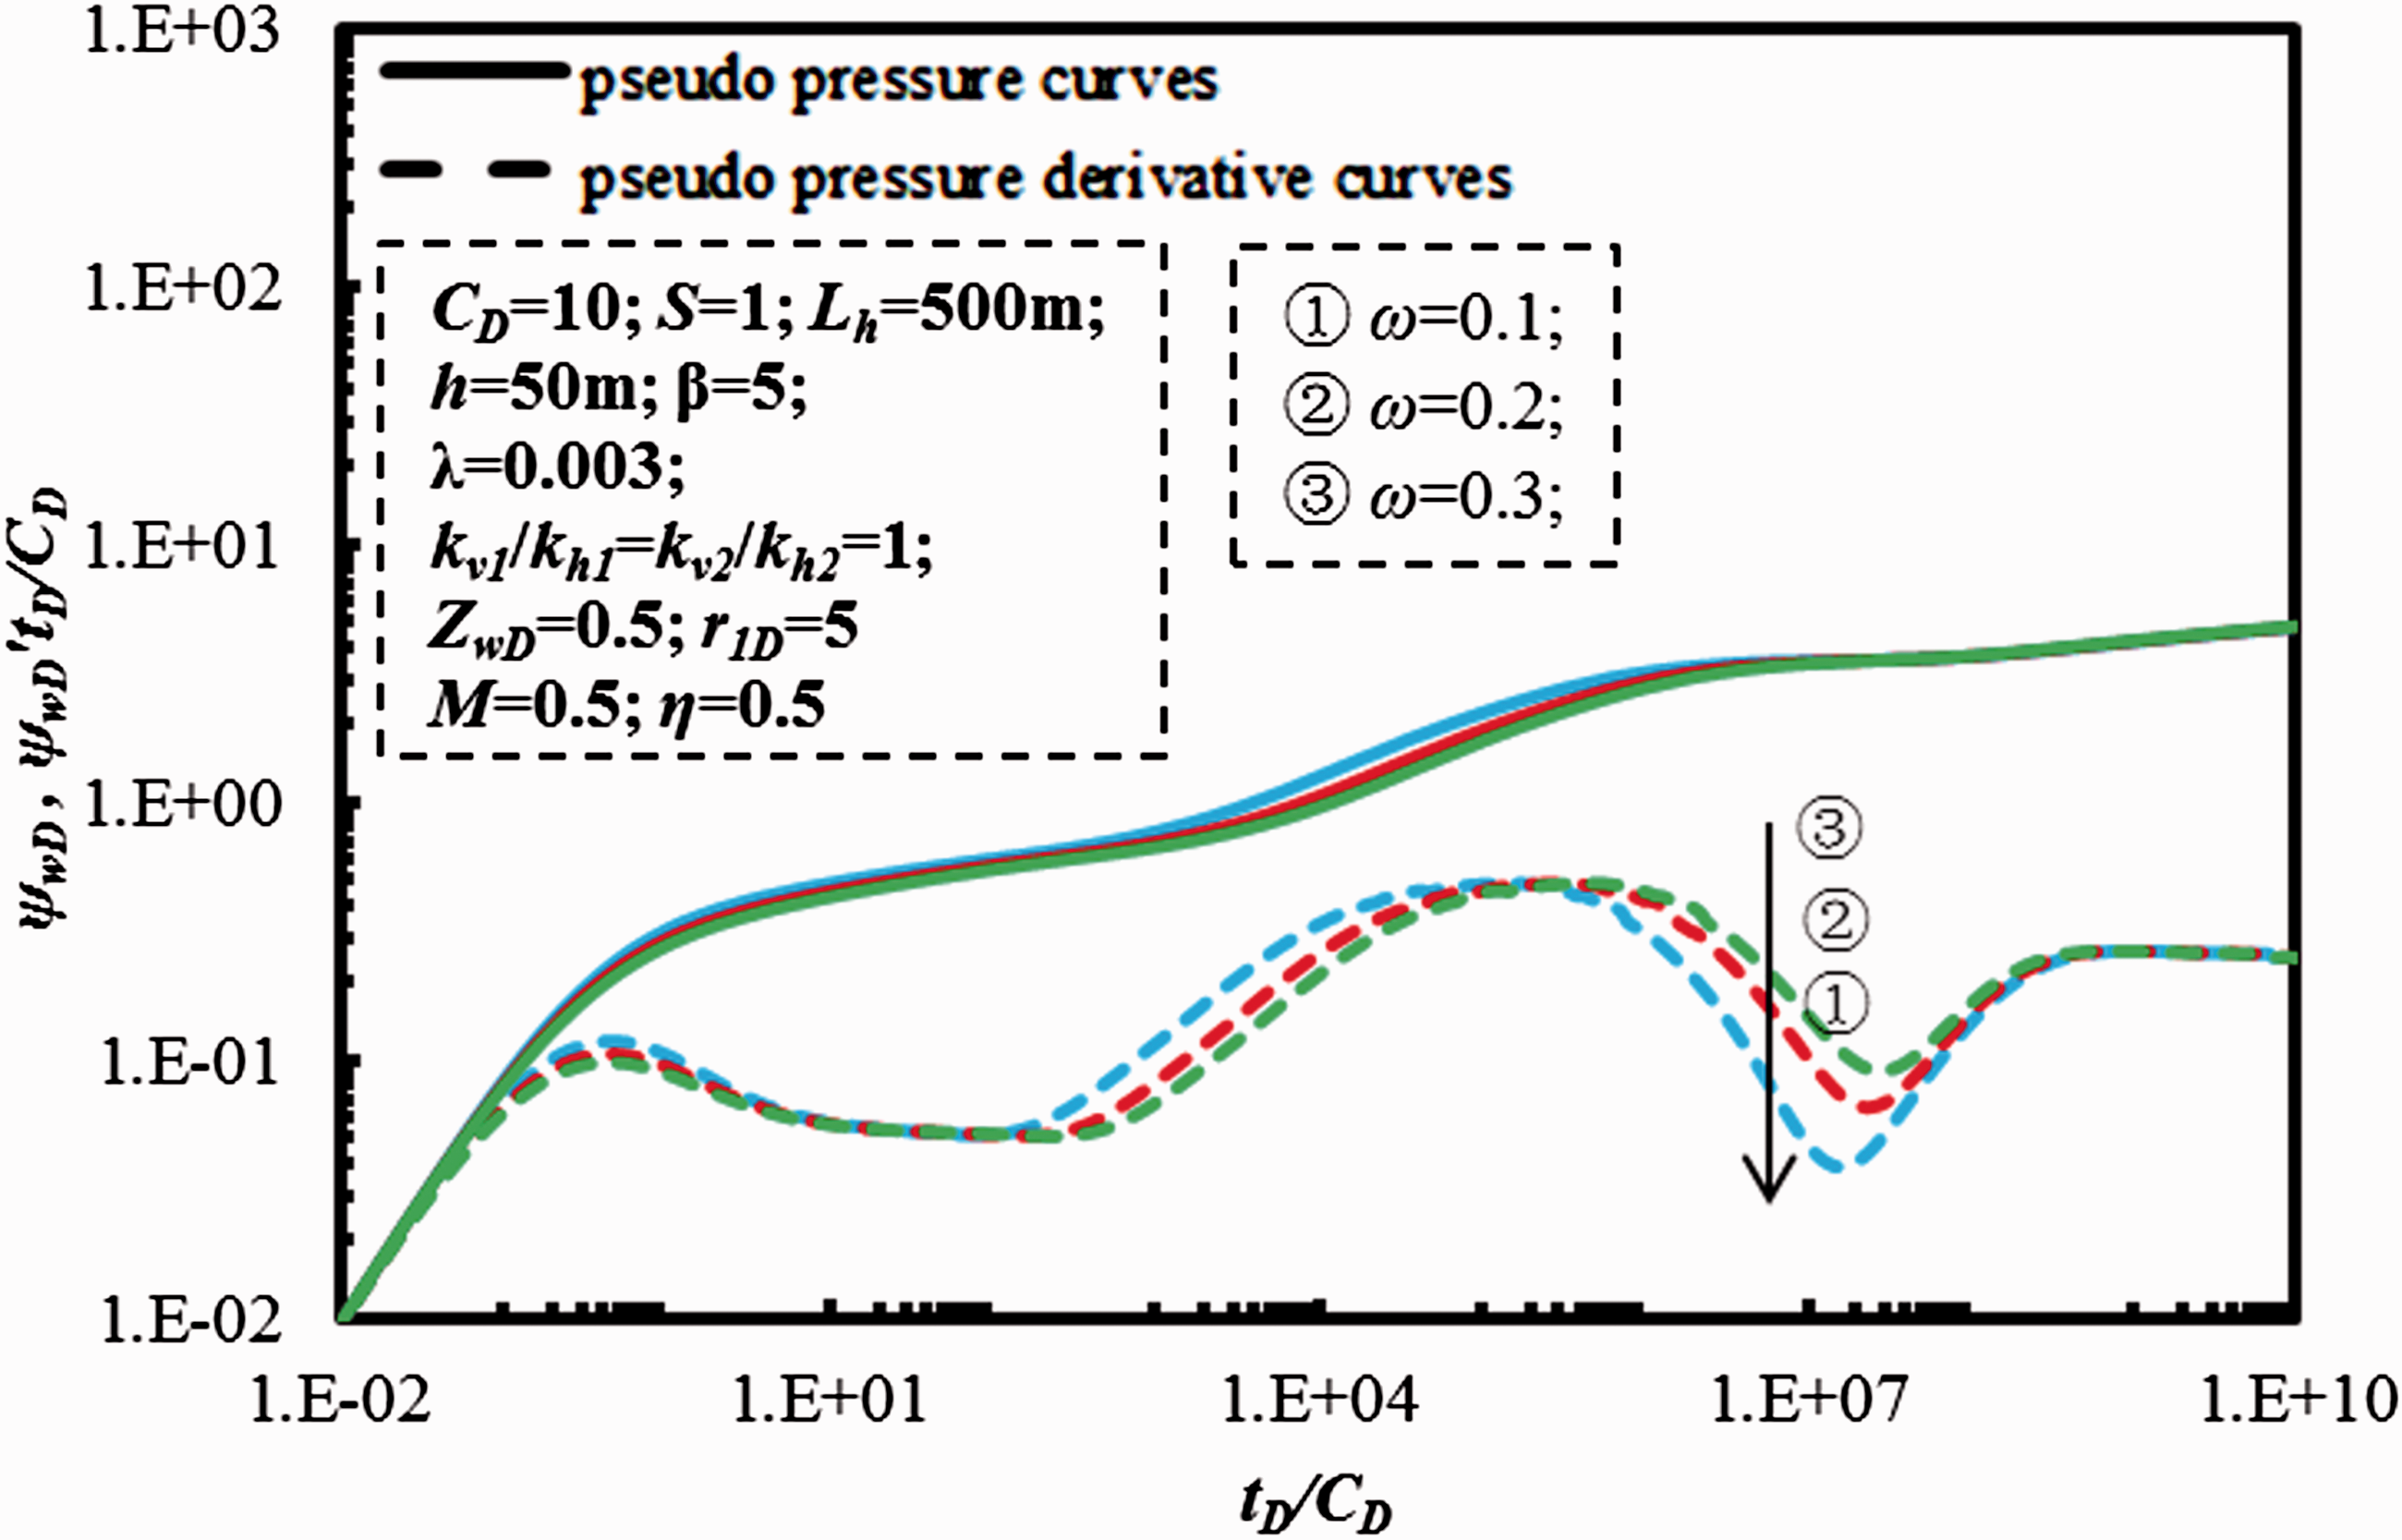
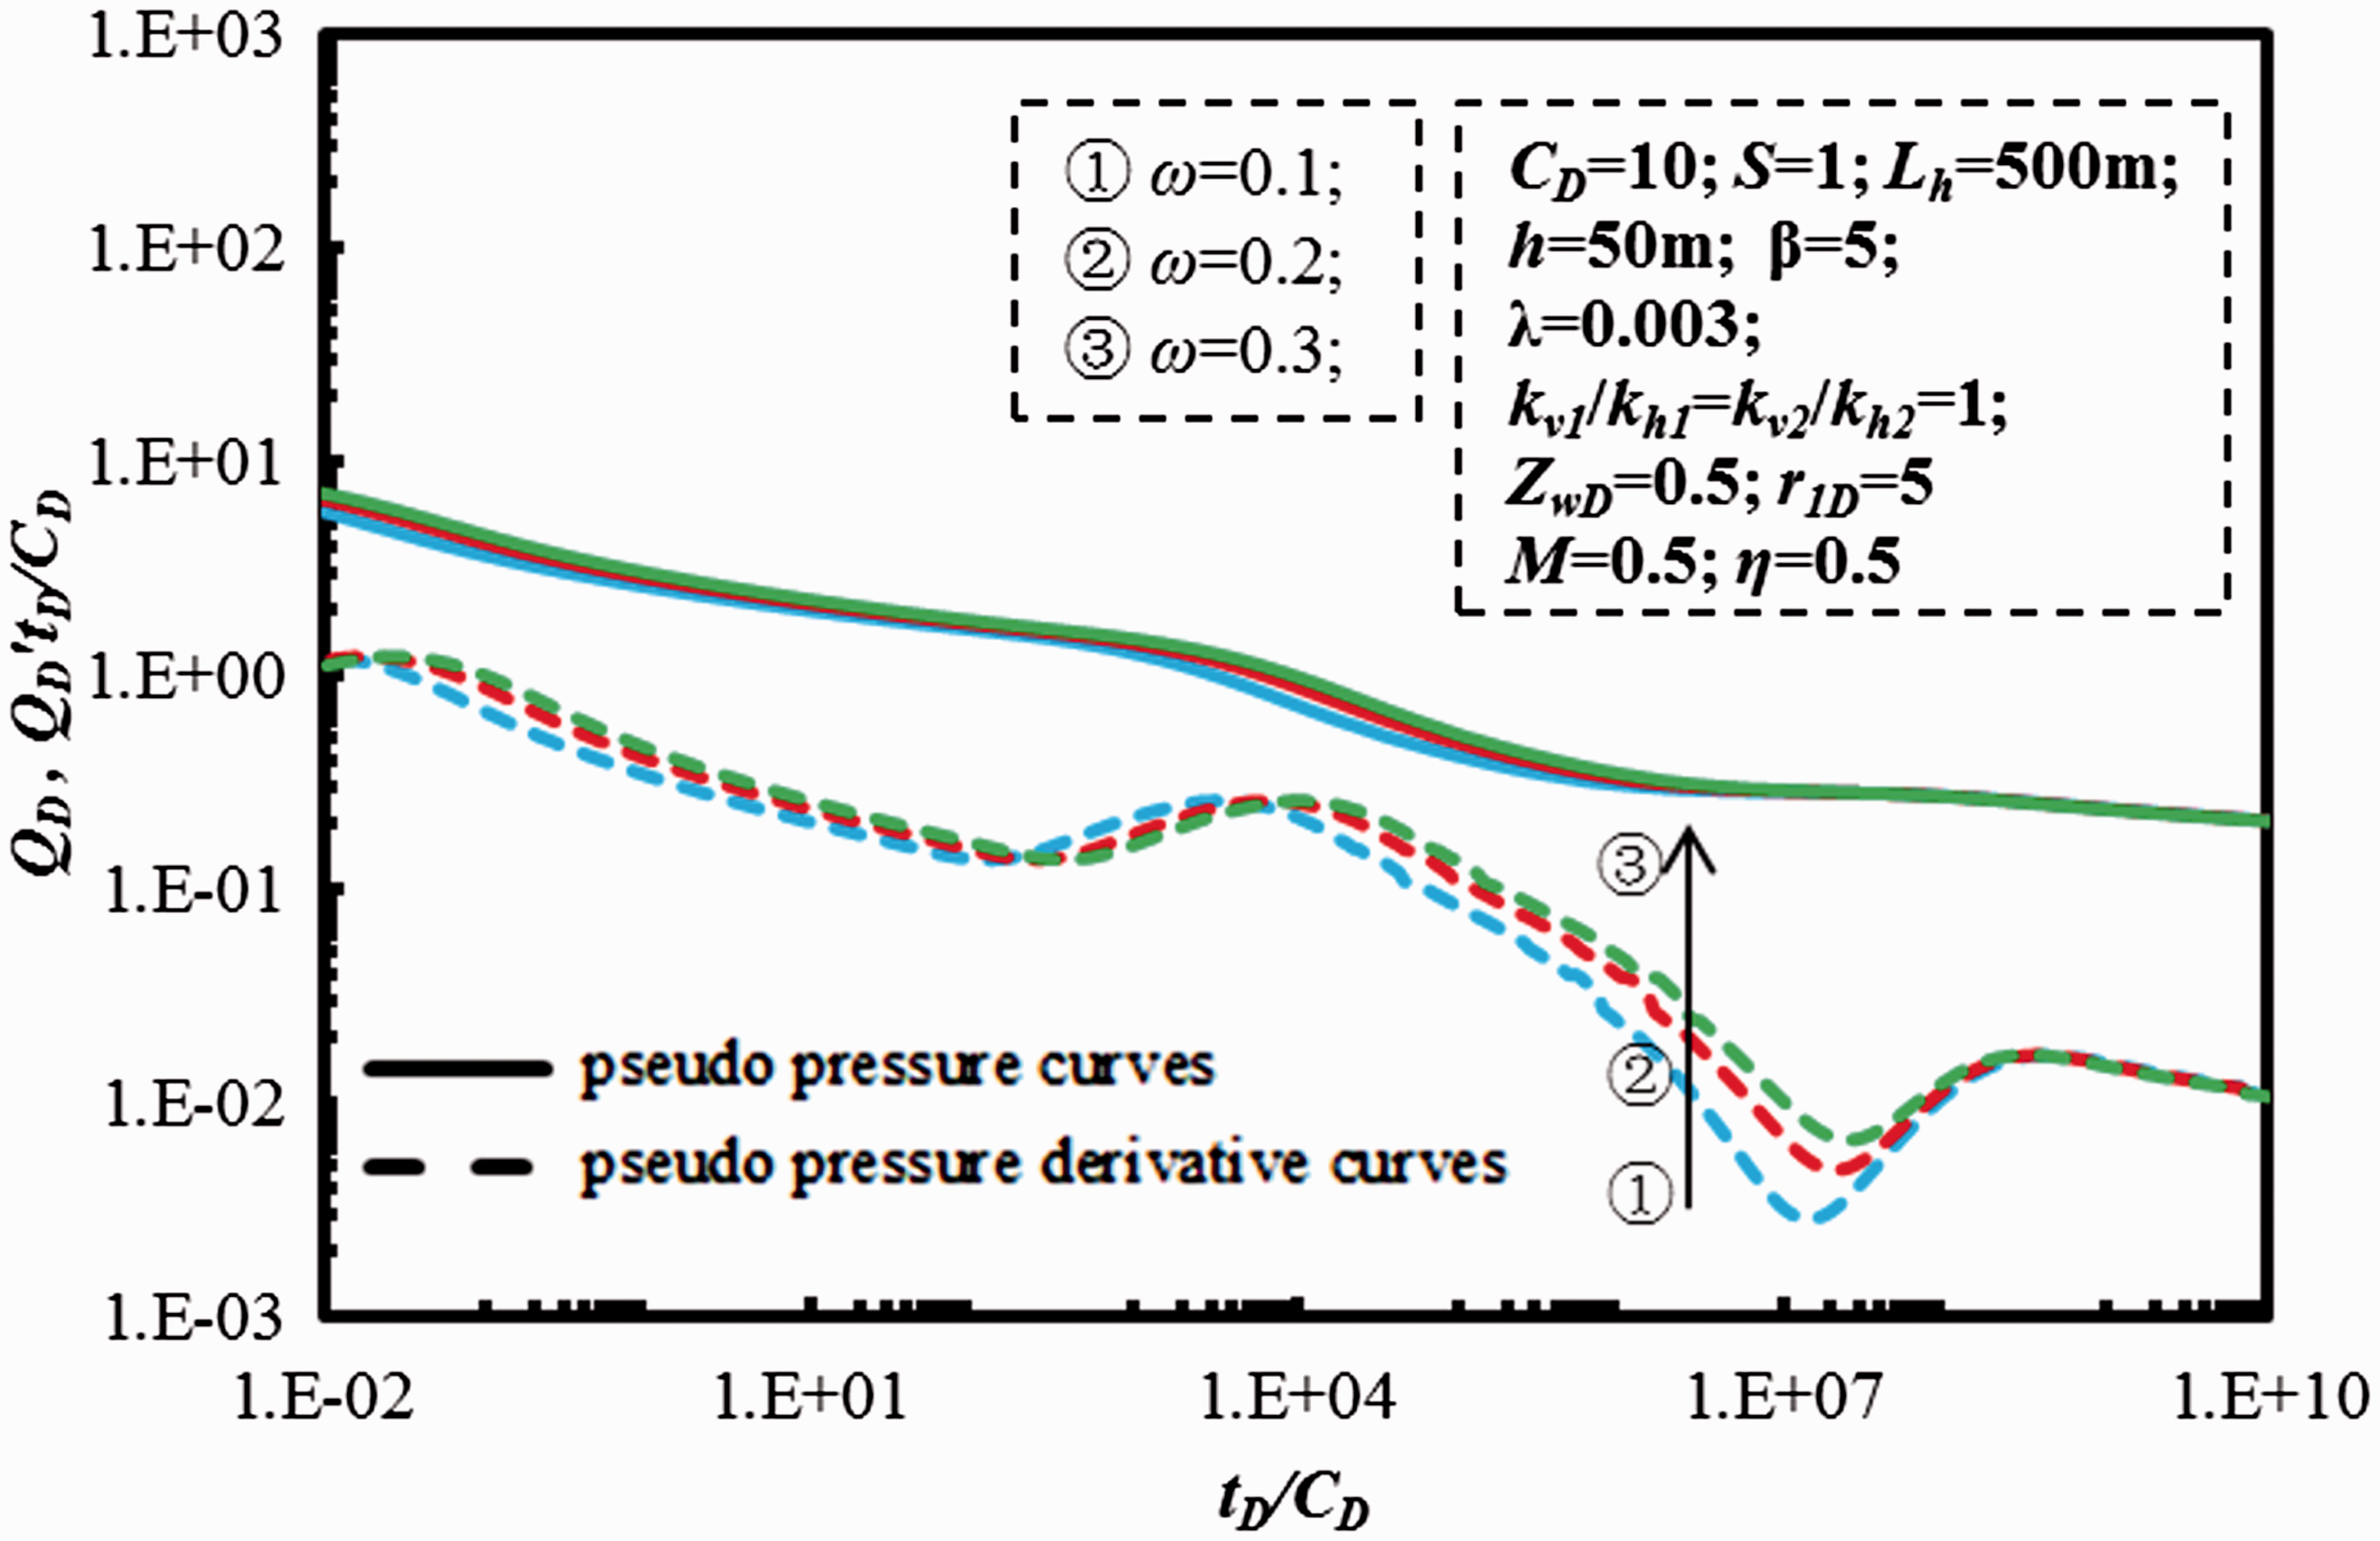
Figure 9 shows the effect of transfer coefficient on PTA-type curves. From Figure 9, we can notice that the transfer coefficient mainly affects regime VI. A smaller transition coefficient means relatively smaller diffusion coefficient for CBM. When the diffusion coefficient is small, the CBM is difficult to flow into the cleat from CBM matrix, which makes the beginning time of regime VI to be late. Figure 10 shows the effect of transfer coefficient on RTA-type curves. When the transfer coefficient increases, the production rate will increase accordingly in regime VI. This reflects a high flow capacity from matrix to cleat with the constant wellbore pressure.
3. Effect of adsorption coefficient β. The effect of transfer coefficient on pressure-transient-type curves. The effect of transfer coefficient on rate-transient-type curves.
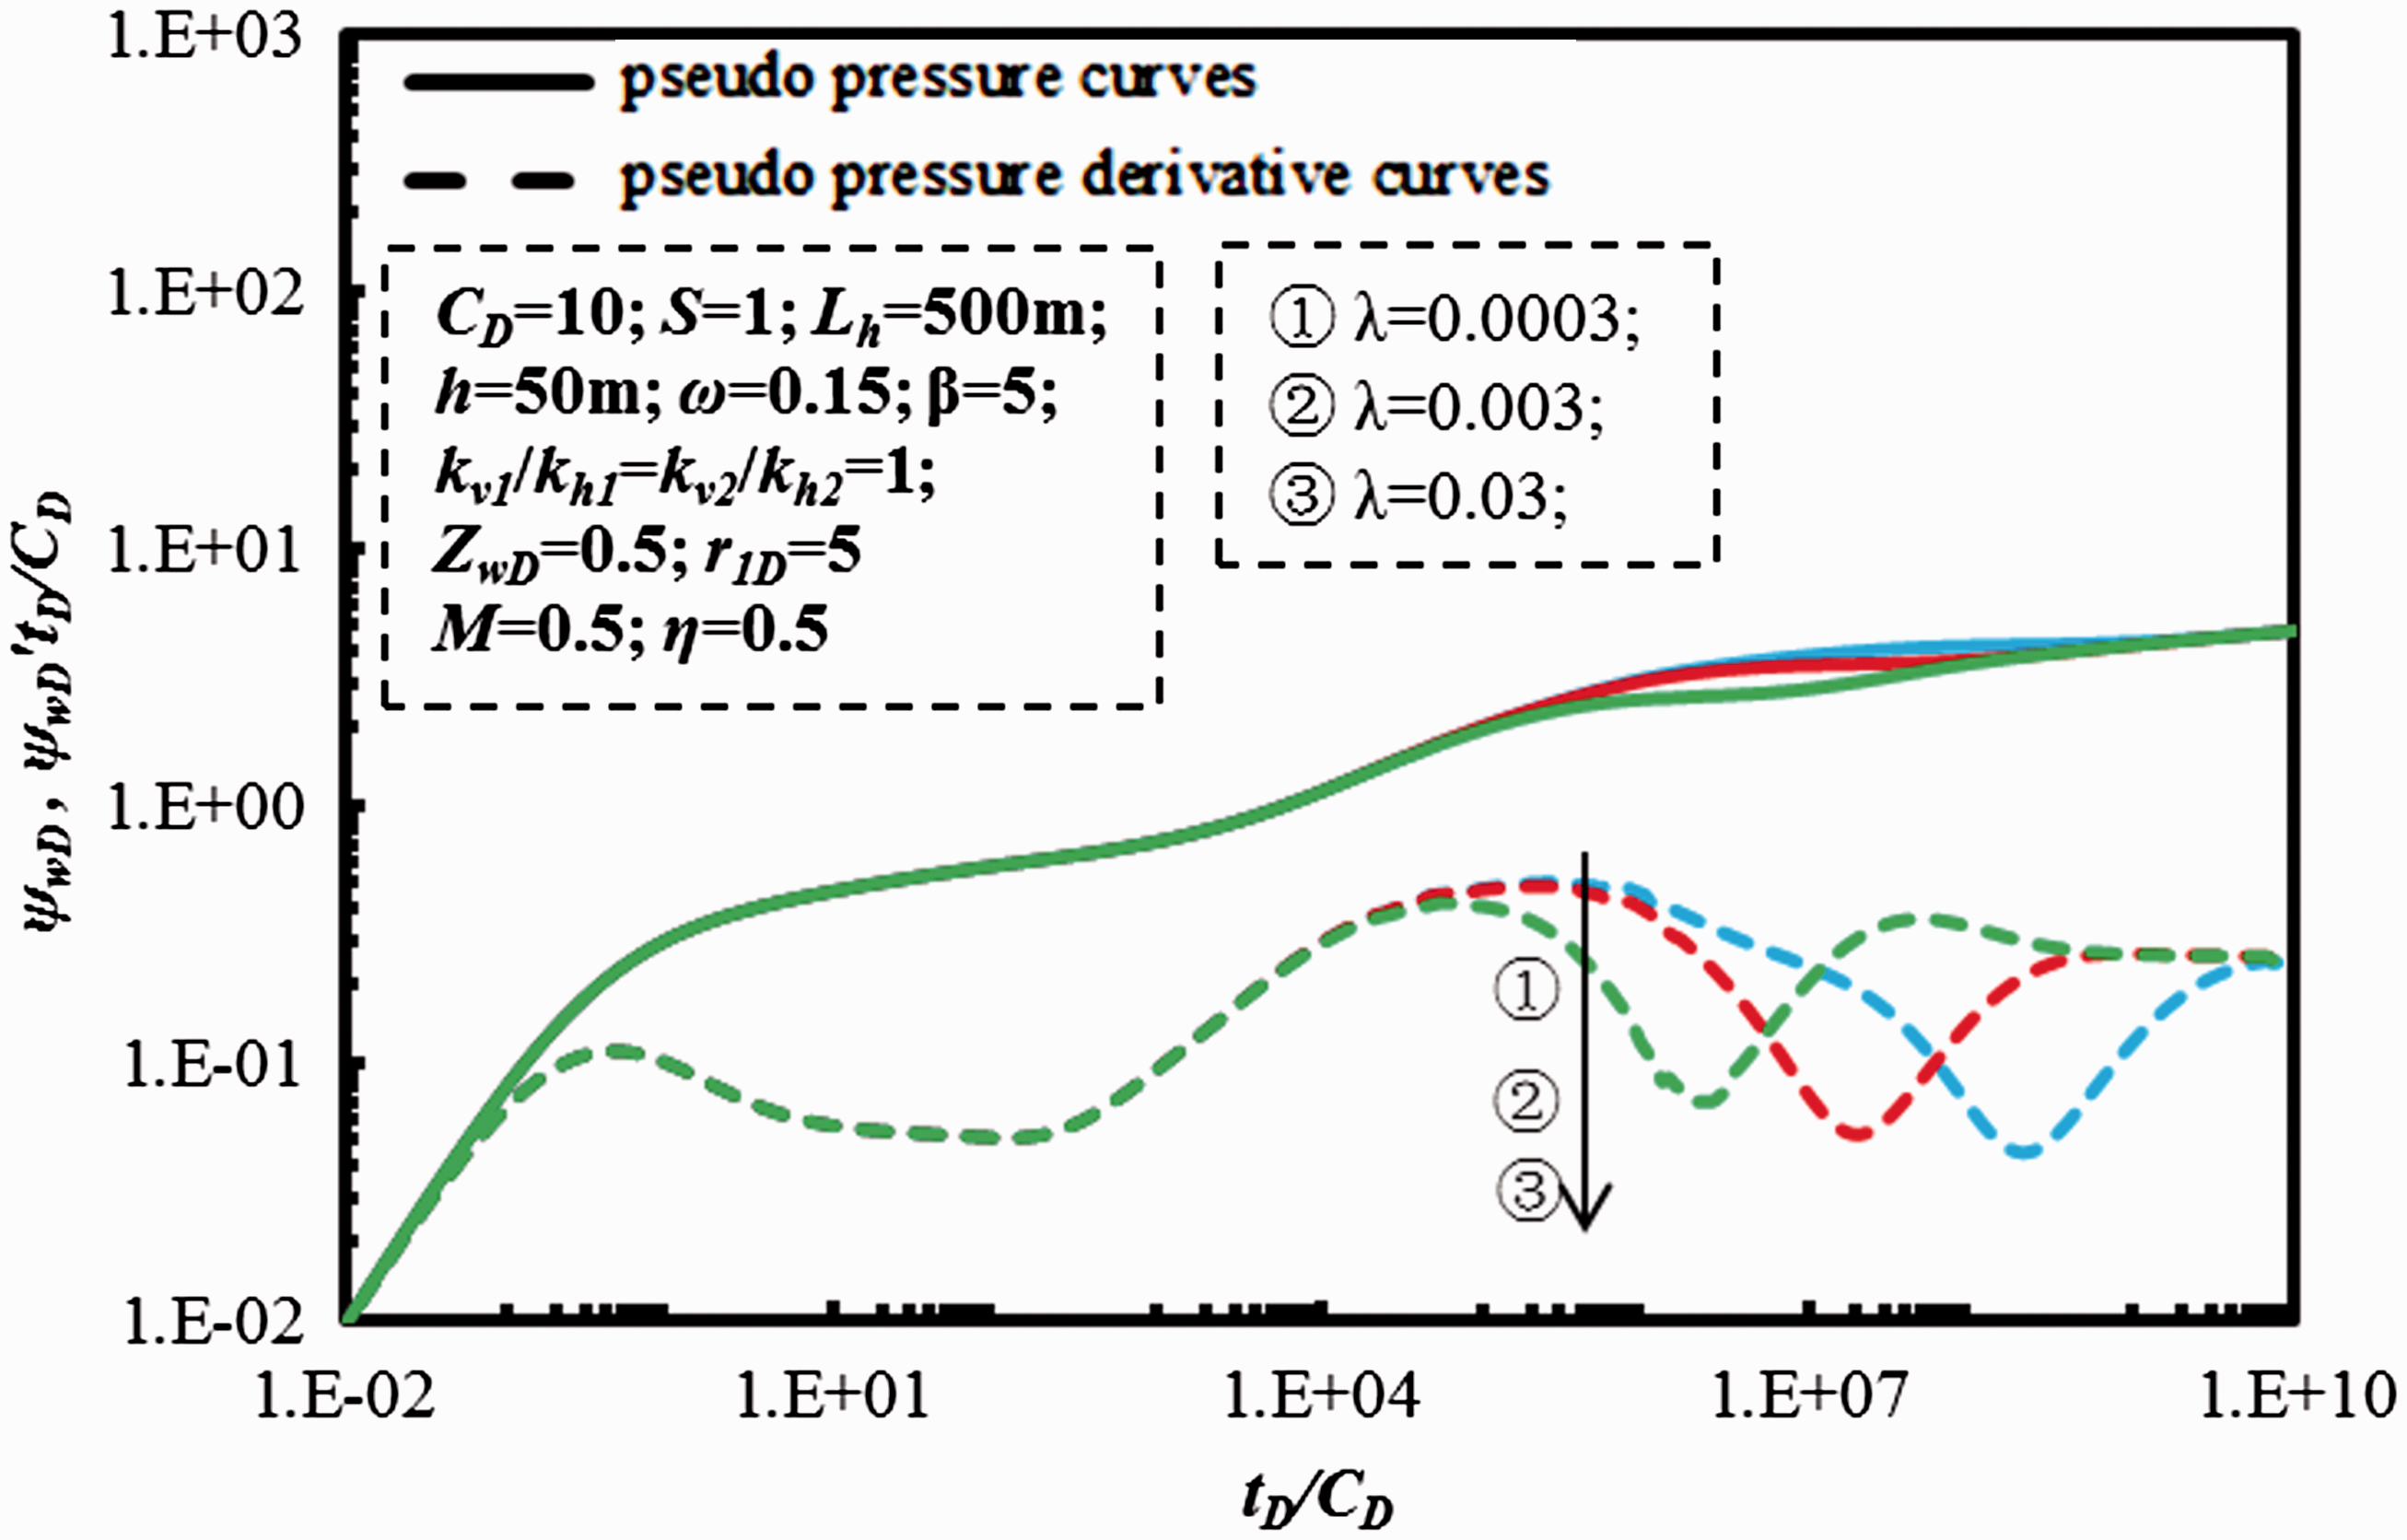
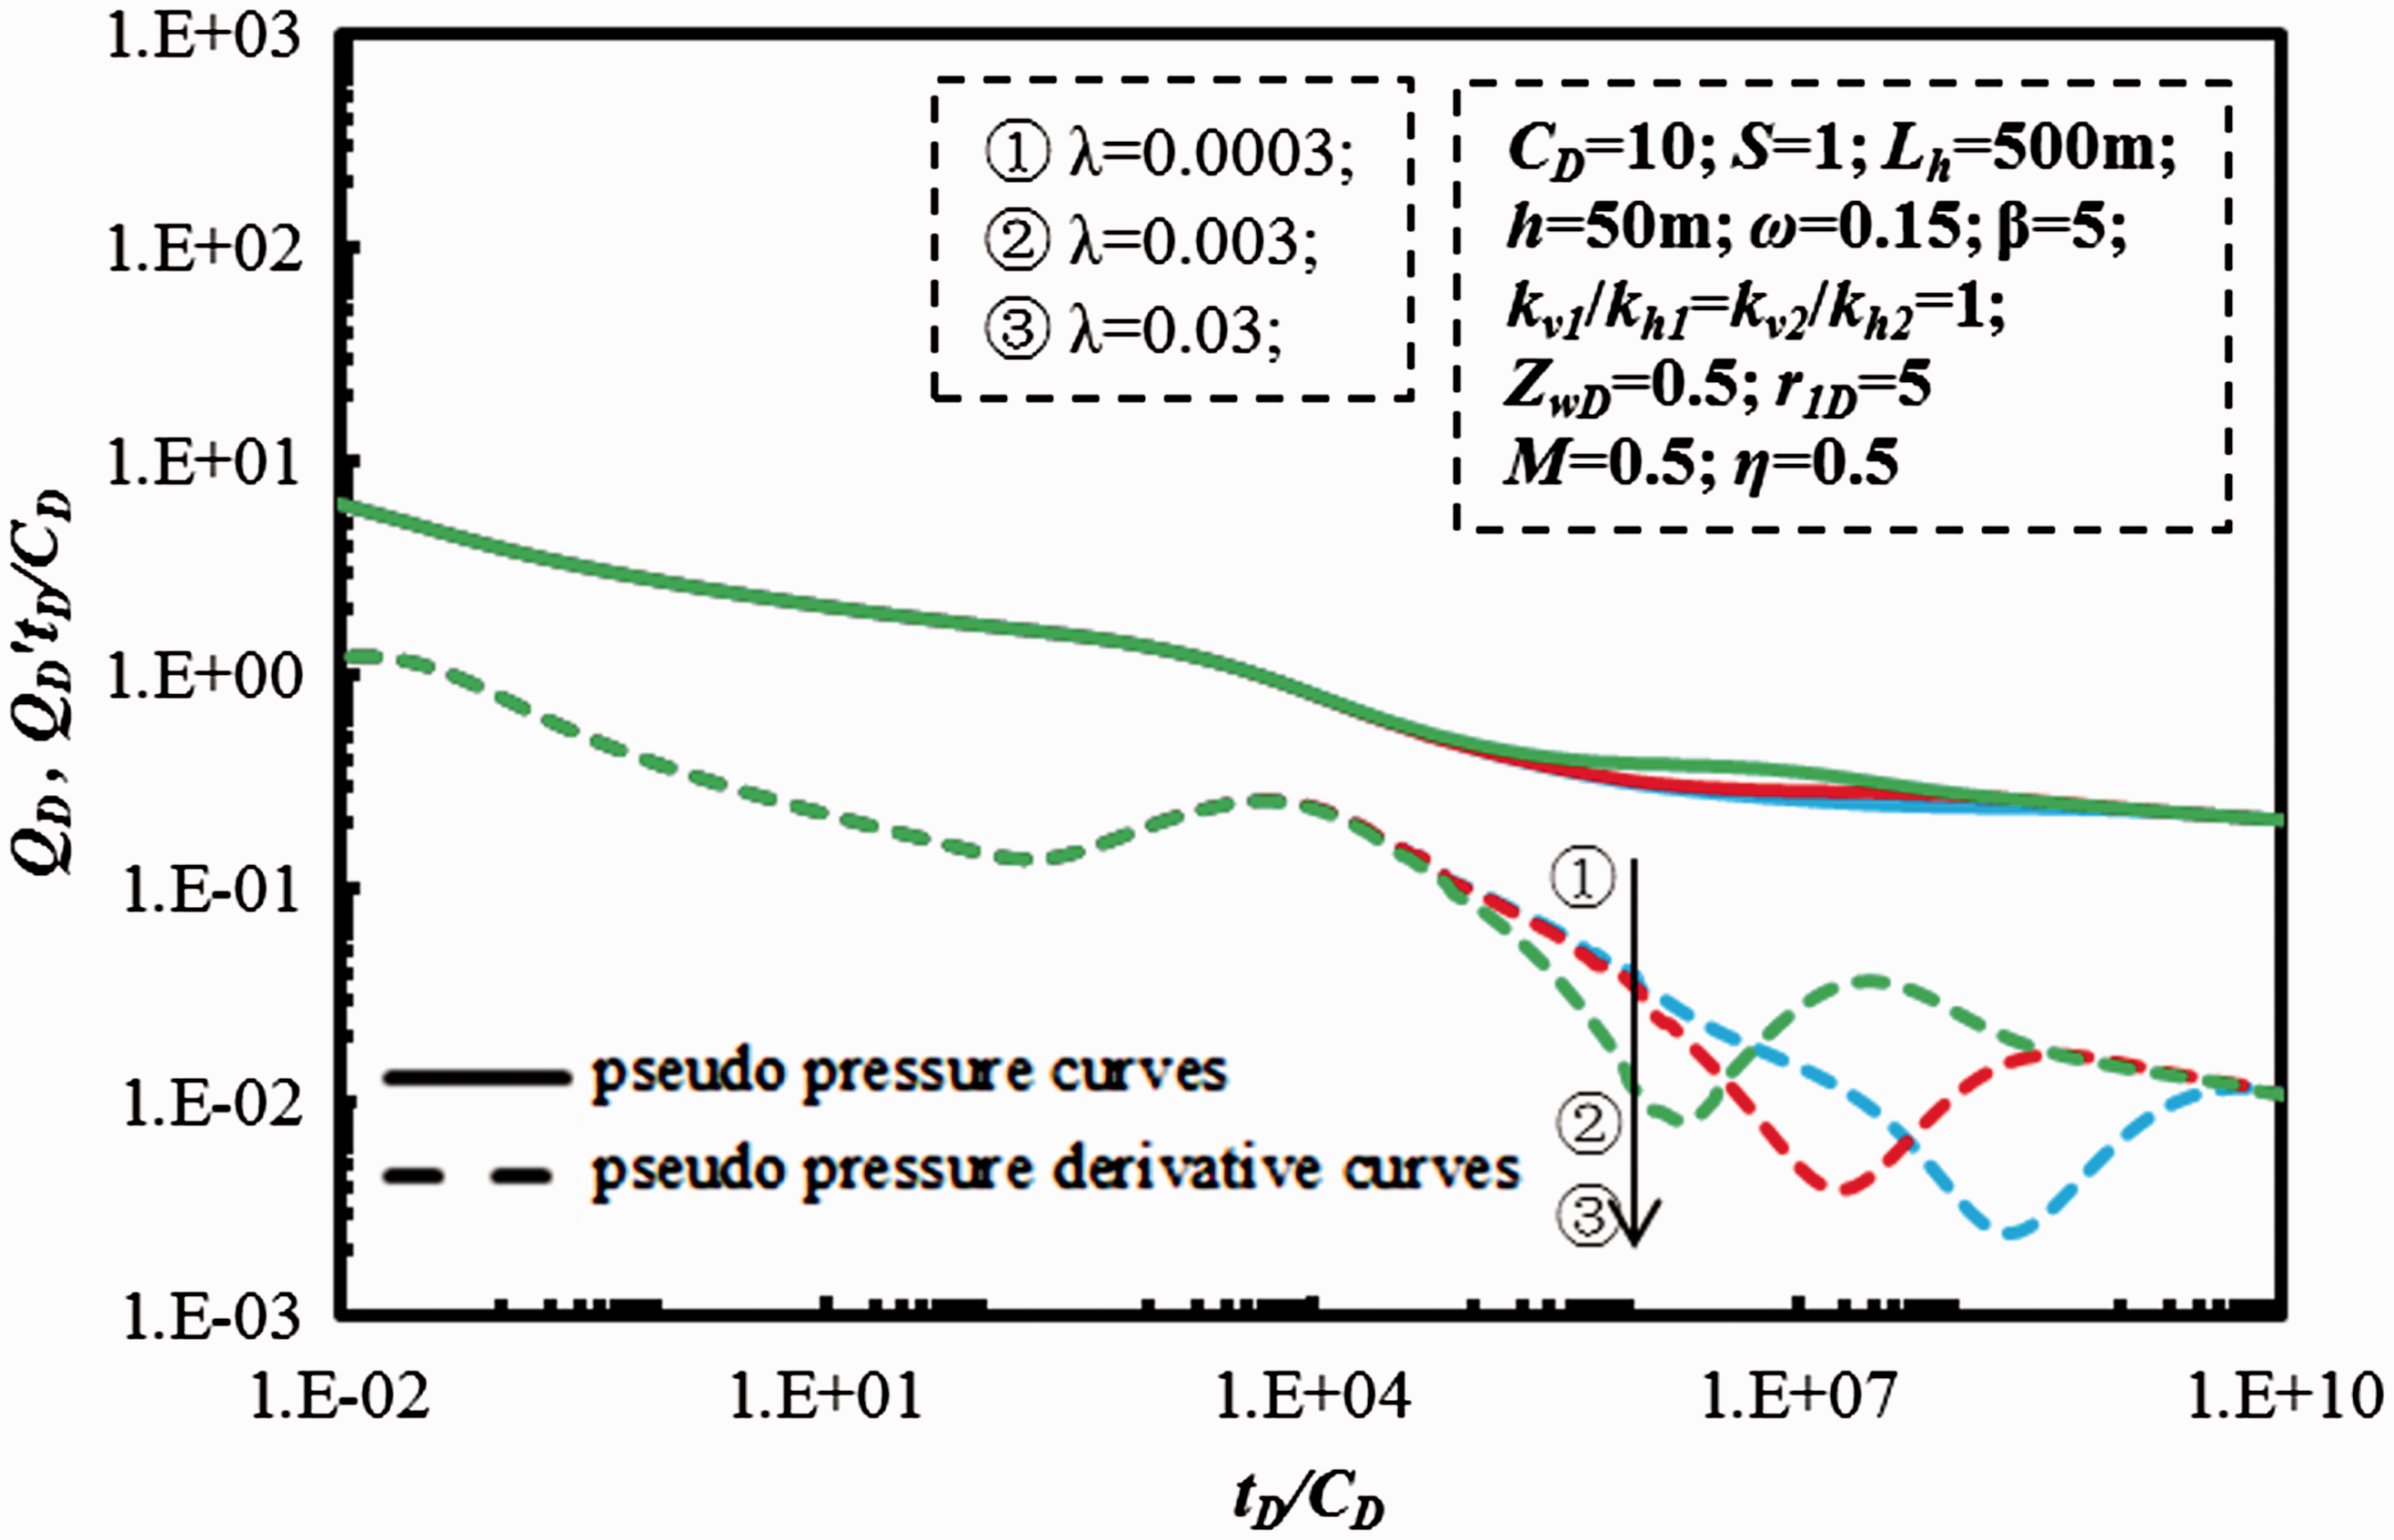
Figure 11 shows the effect of adsorption coefficient on PTA-type curves. From Figure 11, we can see the adsorption coefficient mainly affects regime VI. When the adsorption coefficient is small, the CBM is difficult to flow into the cleat from CBM matrix. This results in the late appearance of regime VI and shallow “V” shape concave in the transfer regime. The effect of adsorption coefficient on RTA-type curves is shown in Figure 12. When the adsorption coefficient is big, the production rate is big in regime VI. This manifests that the CBM has a high flow capacity from matrix to cleat with the constant wellbore pressure.
4. Effect of ratio of vertical permeability to horizontal permeability k
v
/k
h
. The effect of adsorption coefficient on pressure-transient-type curves. The effect of adsorption coefficient on rate-transient-type curves.
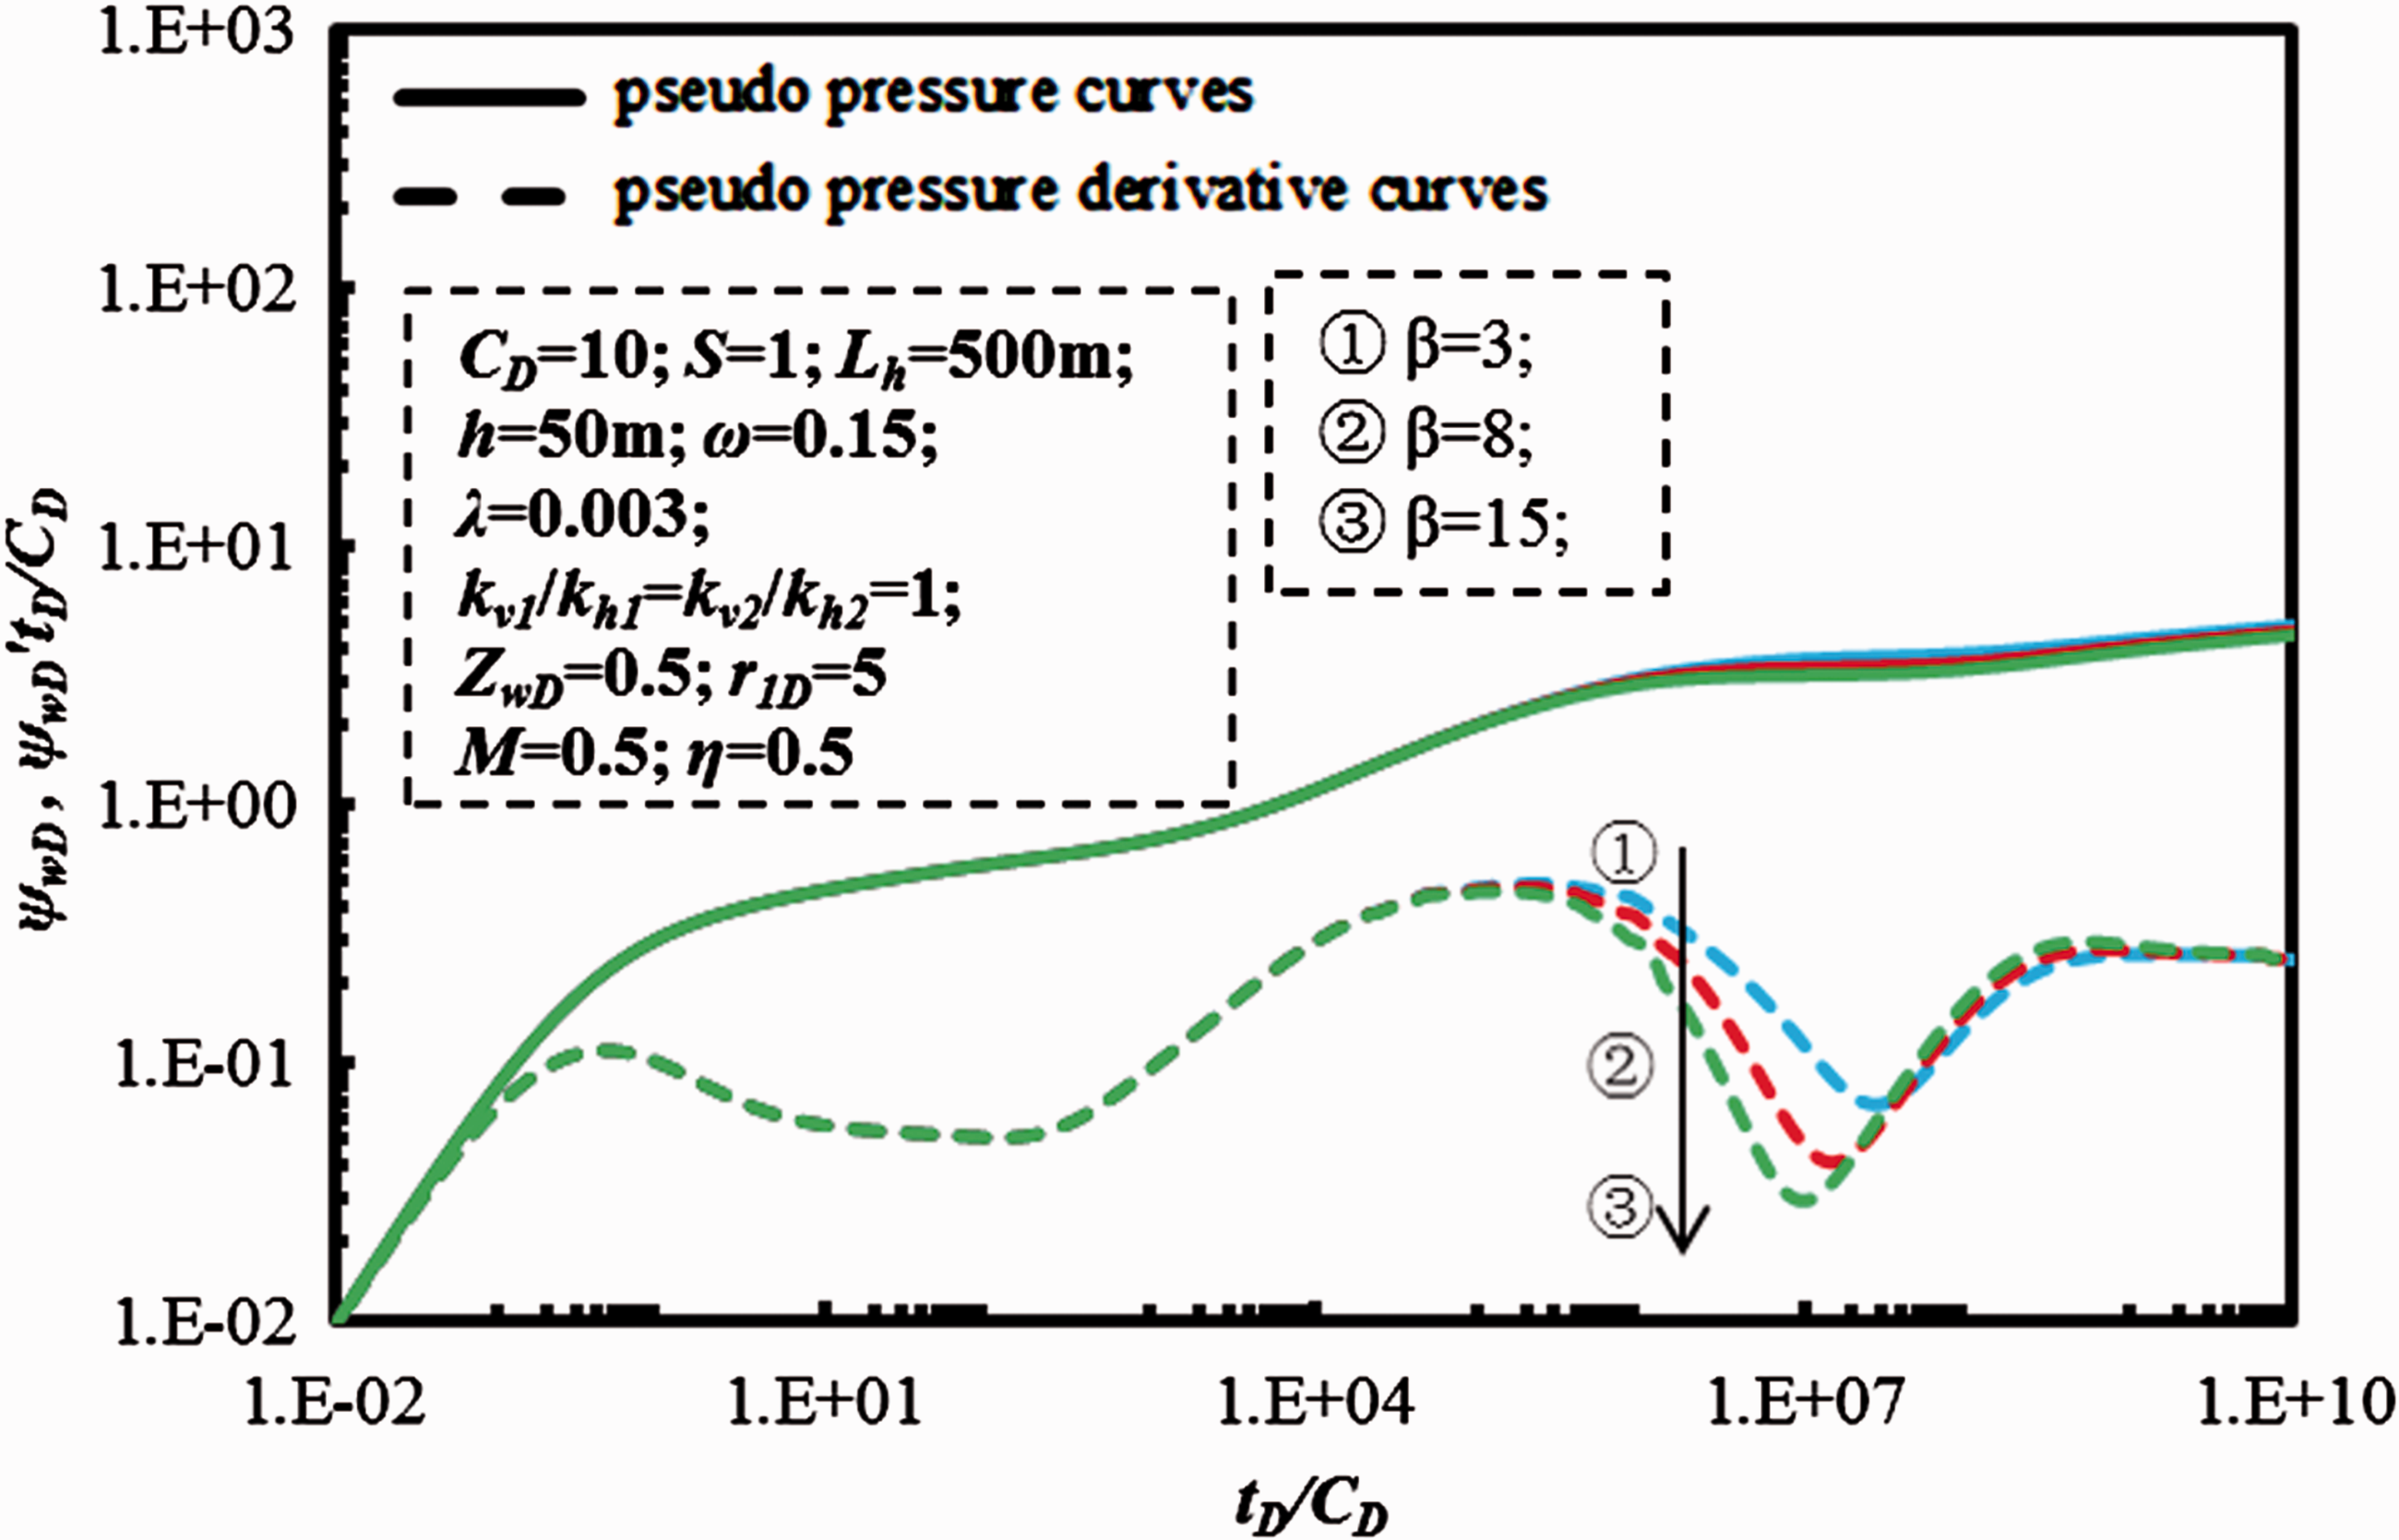
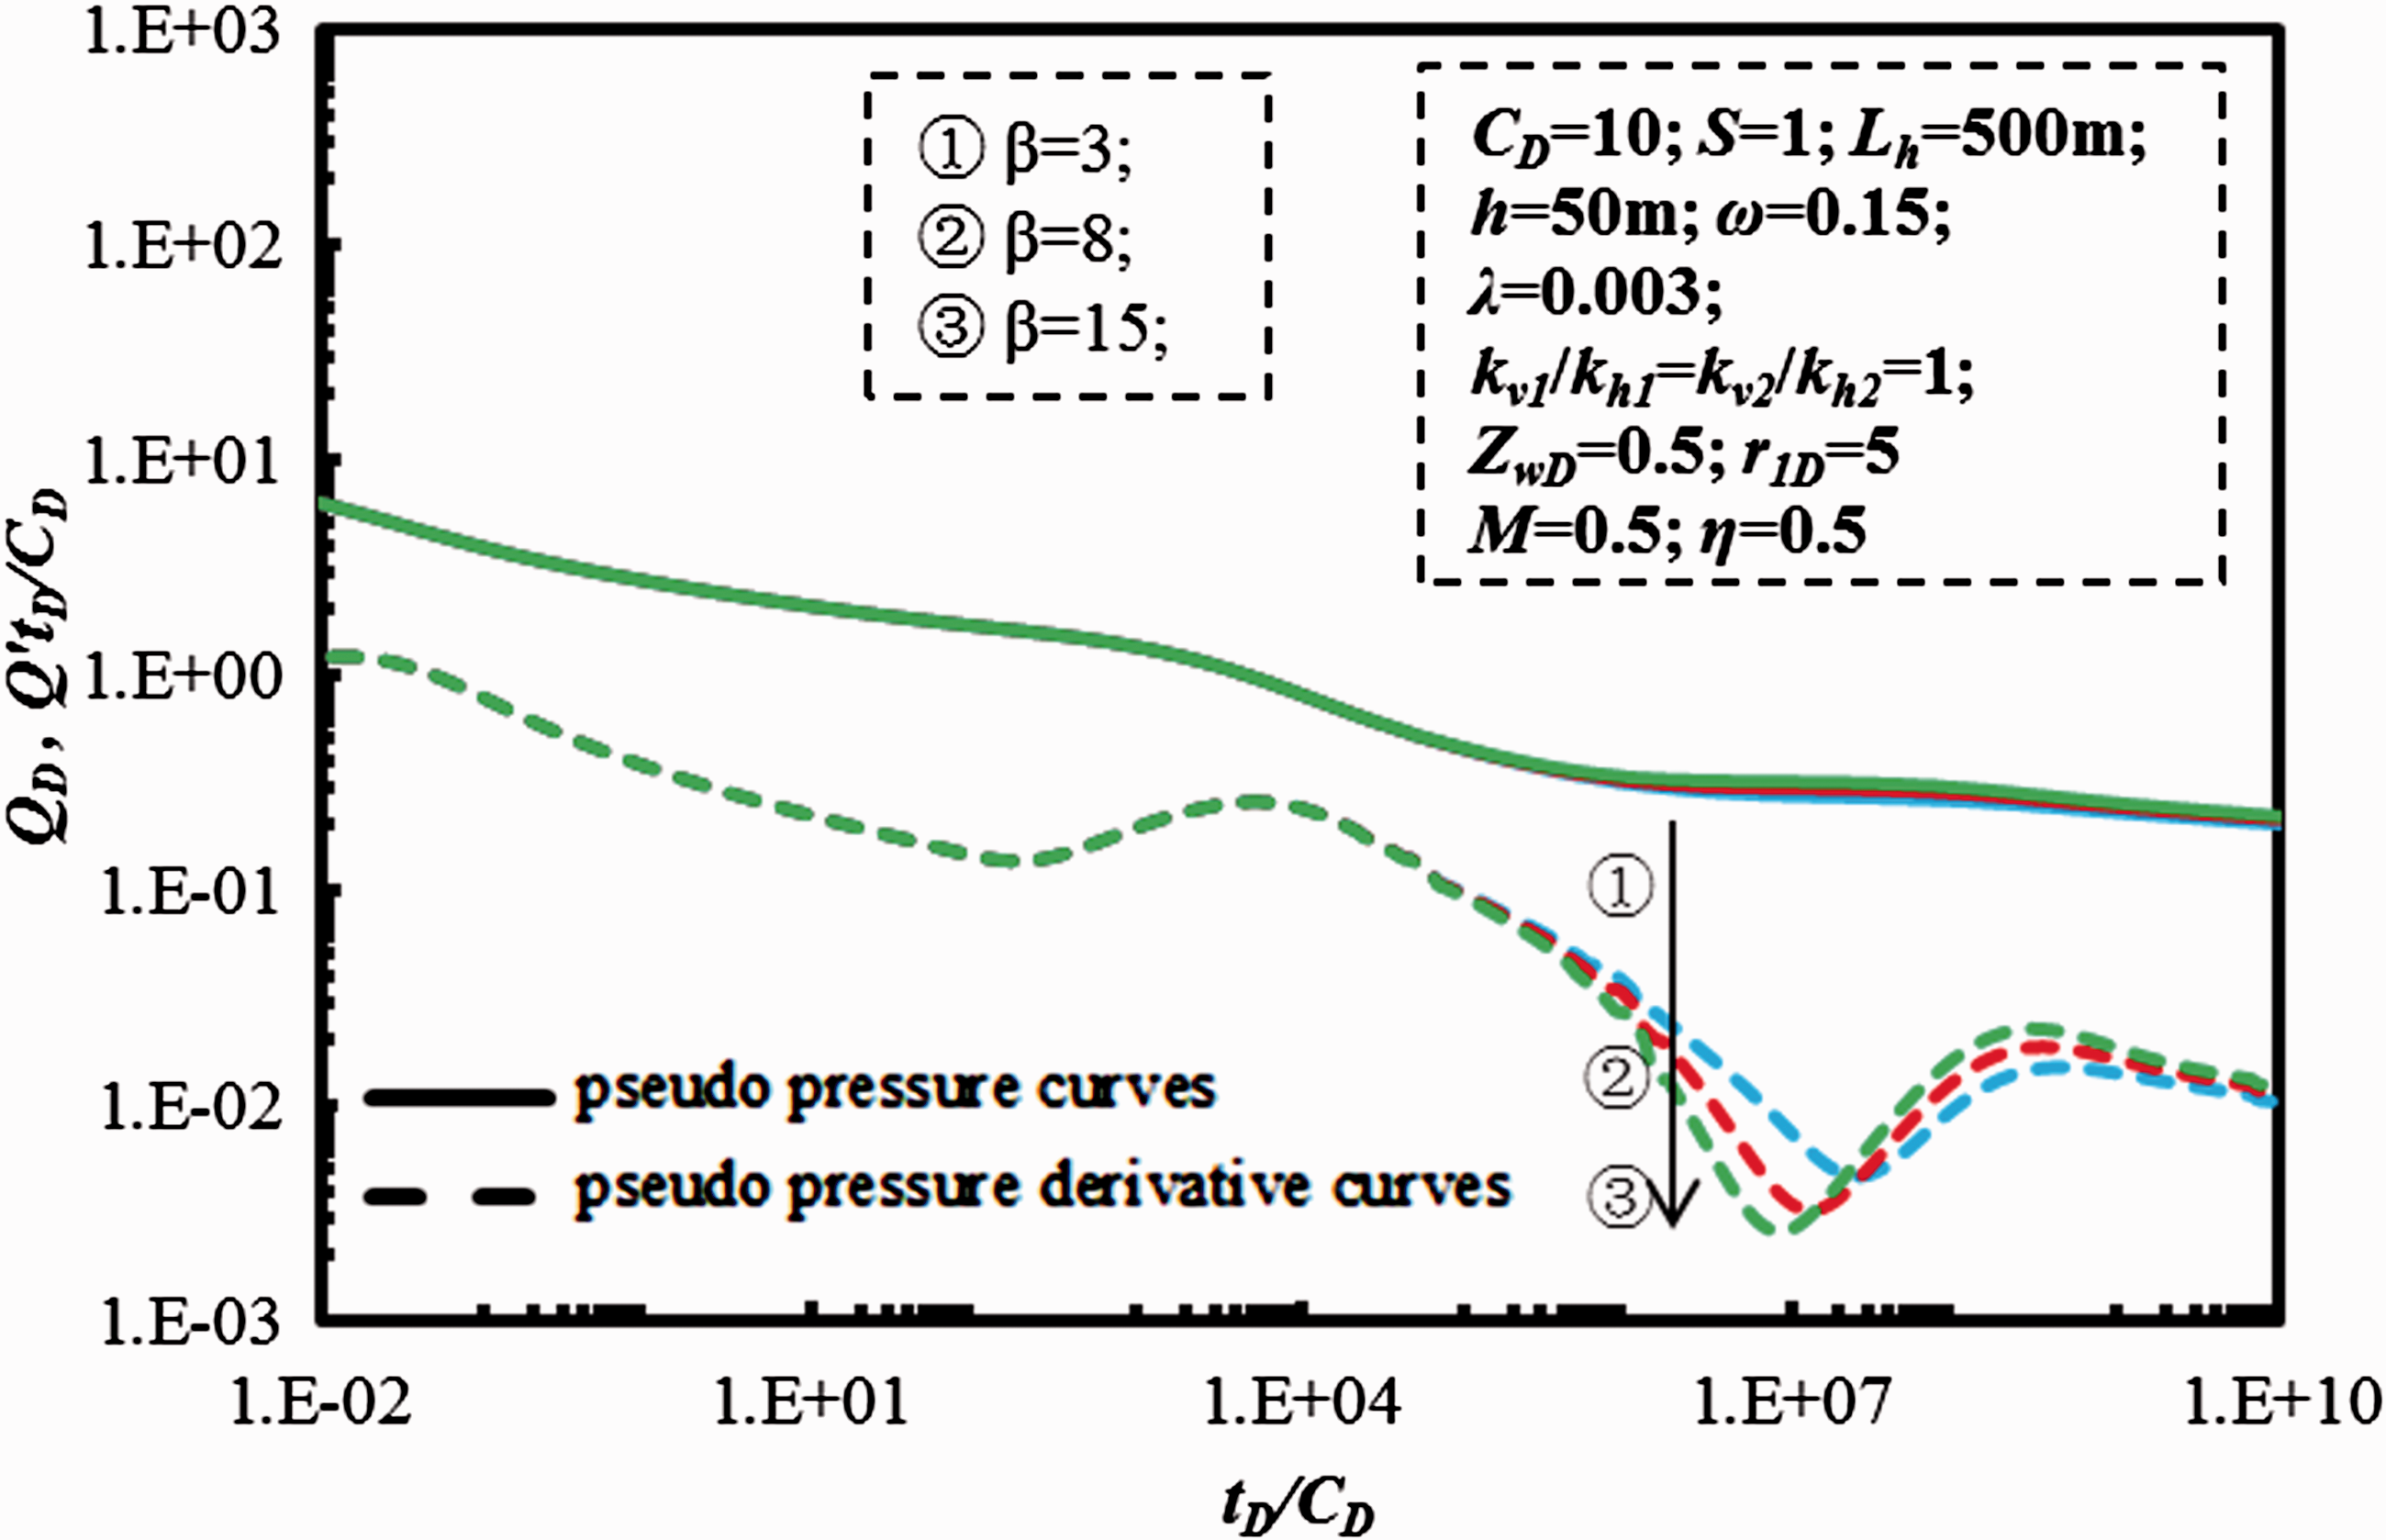
Figure 13 presents the effect of ratio of vertical permeability to horizontal permeability on PTA-type curves. From Figure 13, we can see the ratio of vertical permeability to horizontal permeability mainly affects regime II, regime III, and regime IV. When the ratio of vertical permeability to horizontal permeability is small, the horizontal permeability is much larger than the vertical permeability. This results in great difficulty for gas to flow in vertical direction and consumes more energy when the well is producing at a constant gas rate. Consequently, the value of first radial flow in pressure derivative curve becomes big, and this value equals approximately to (h
1D
)/4. Figure 14 shows the effect of ratio of vertical permeability to horizontal permeability on RTA-type curves. When the vertical permeability to horizontal permeability ratio increases, the production rate will increase accordingly in the whole production lifetime.
5. Effect of skin factor. The effect of ratio of vertical permeability to horizontal permeability on pressure-transient-type curves. The effect of ratio of vertical permeability to horizontal permeability on rate-transient-type curves.
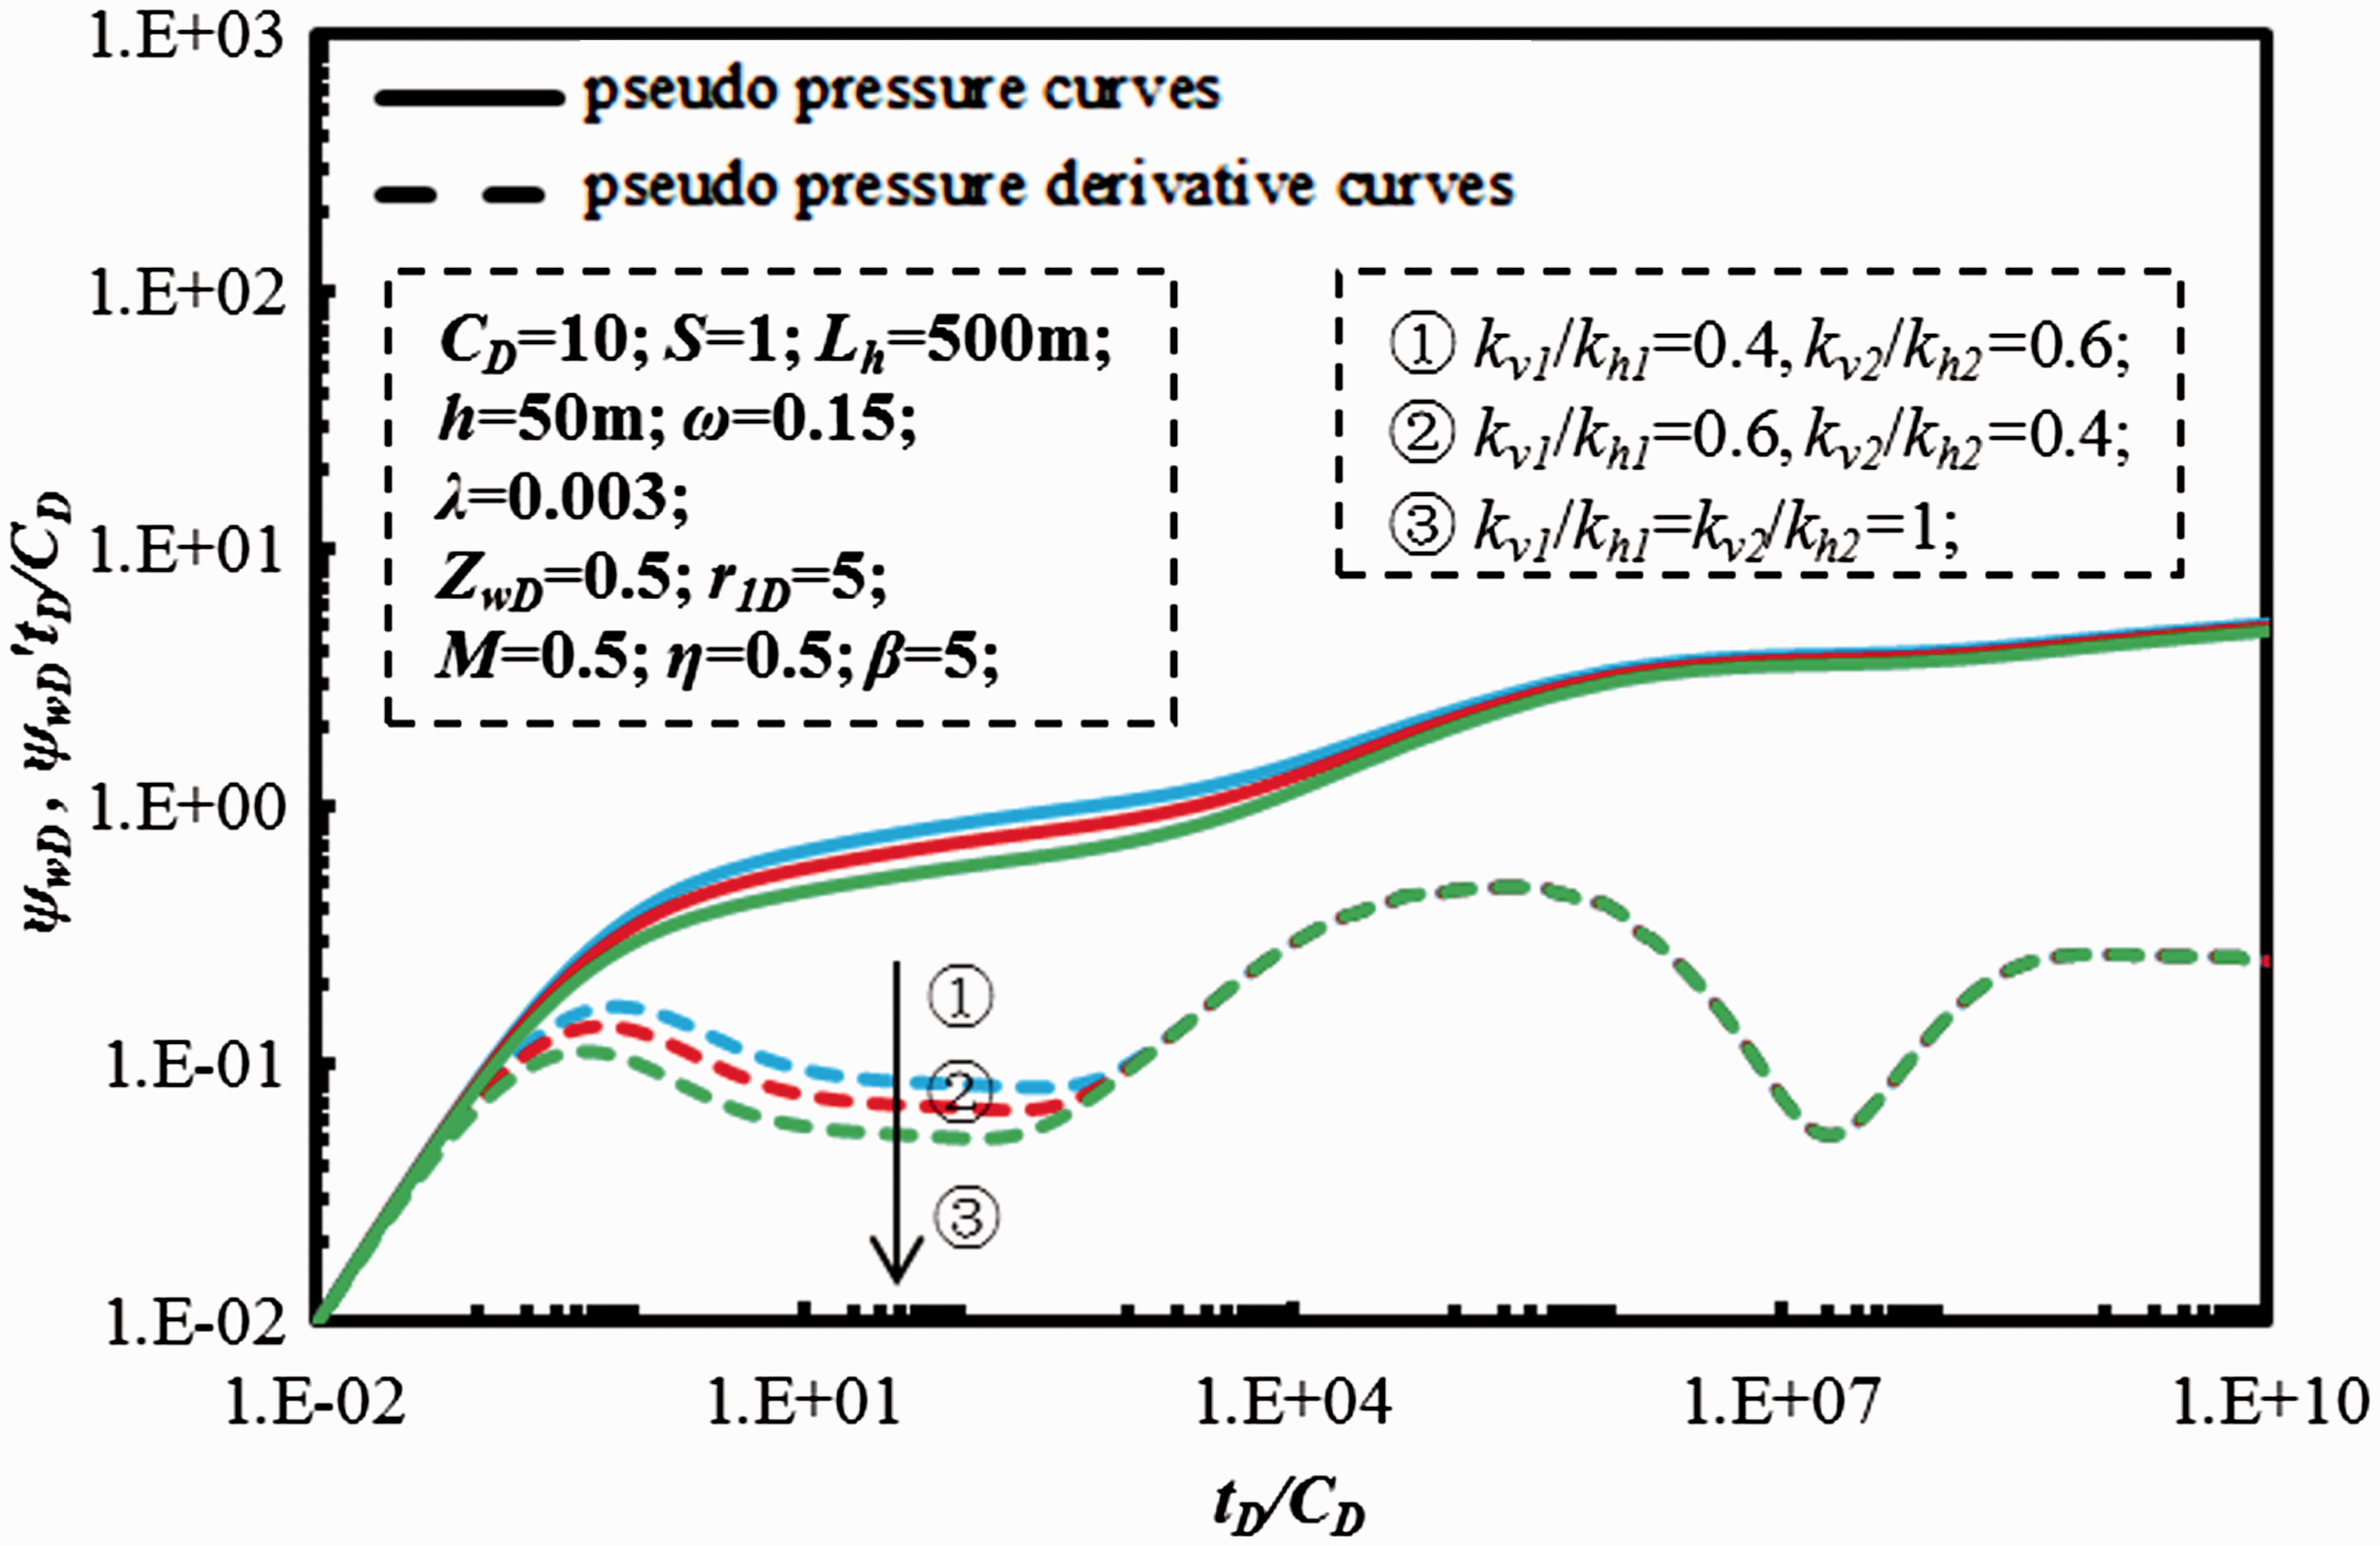
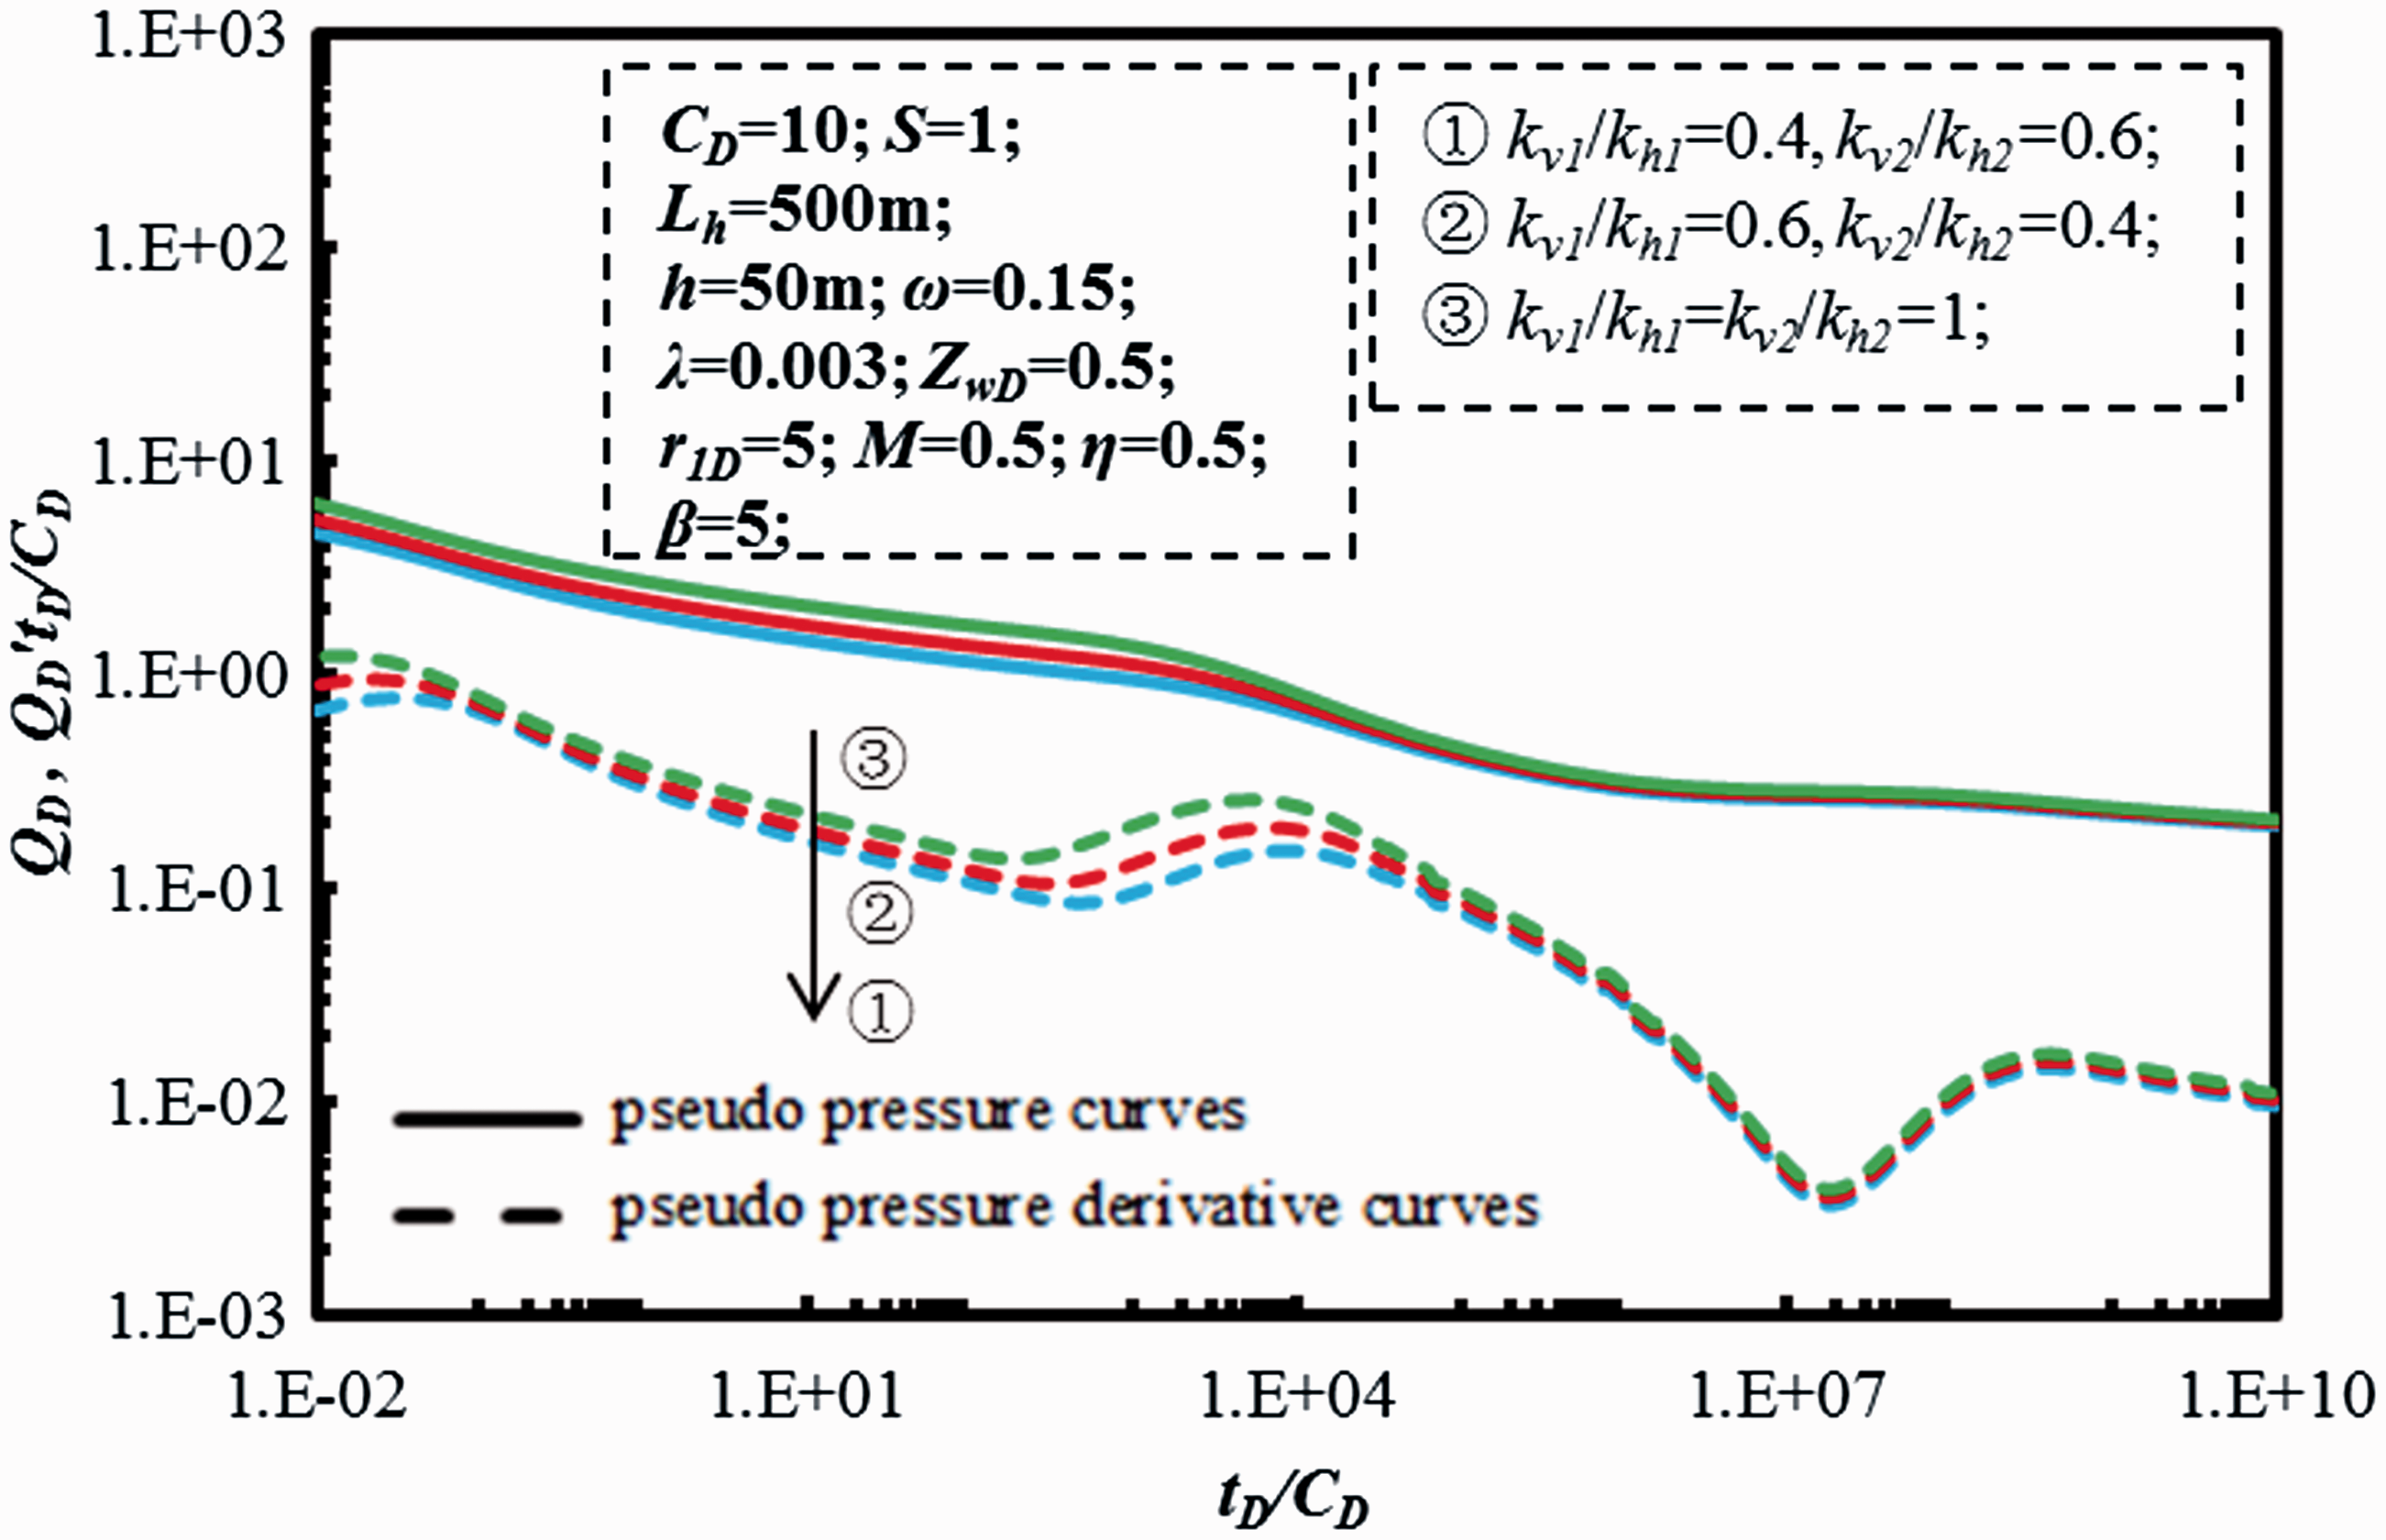
Figure 15 shows the effect of skin factor on PTA-type curves. In the proposed model, the negative skin factor which is difficult to deal with for horizontal well testing is considered. This problem can be solved by bringing in effective wellbore radius (Wang et al., 2013). Skin factor mainly affects regime I and regime II as shown in Figure 15. When the skin factor increases, the resistance around wellbore will increase, engendering greater difficulty for gas stream to flow into the wellbore. Figure 16 shows the effect of skin factor on RTA-type curves. When the skin factor increases, the production rate will decrease accordingly in all time for well production lifetime.
6. Effect of inner region radius. The effect of skin factor on pressure-transient-type curves. The effect of skin factor on rate-transient-type curves.
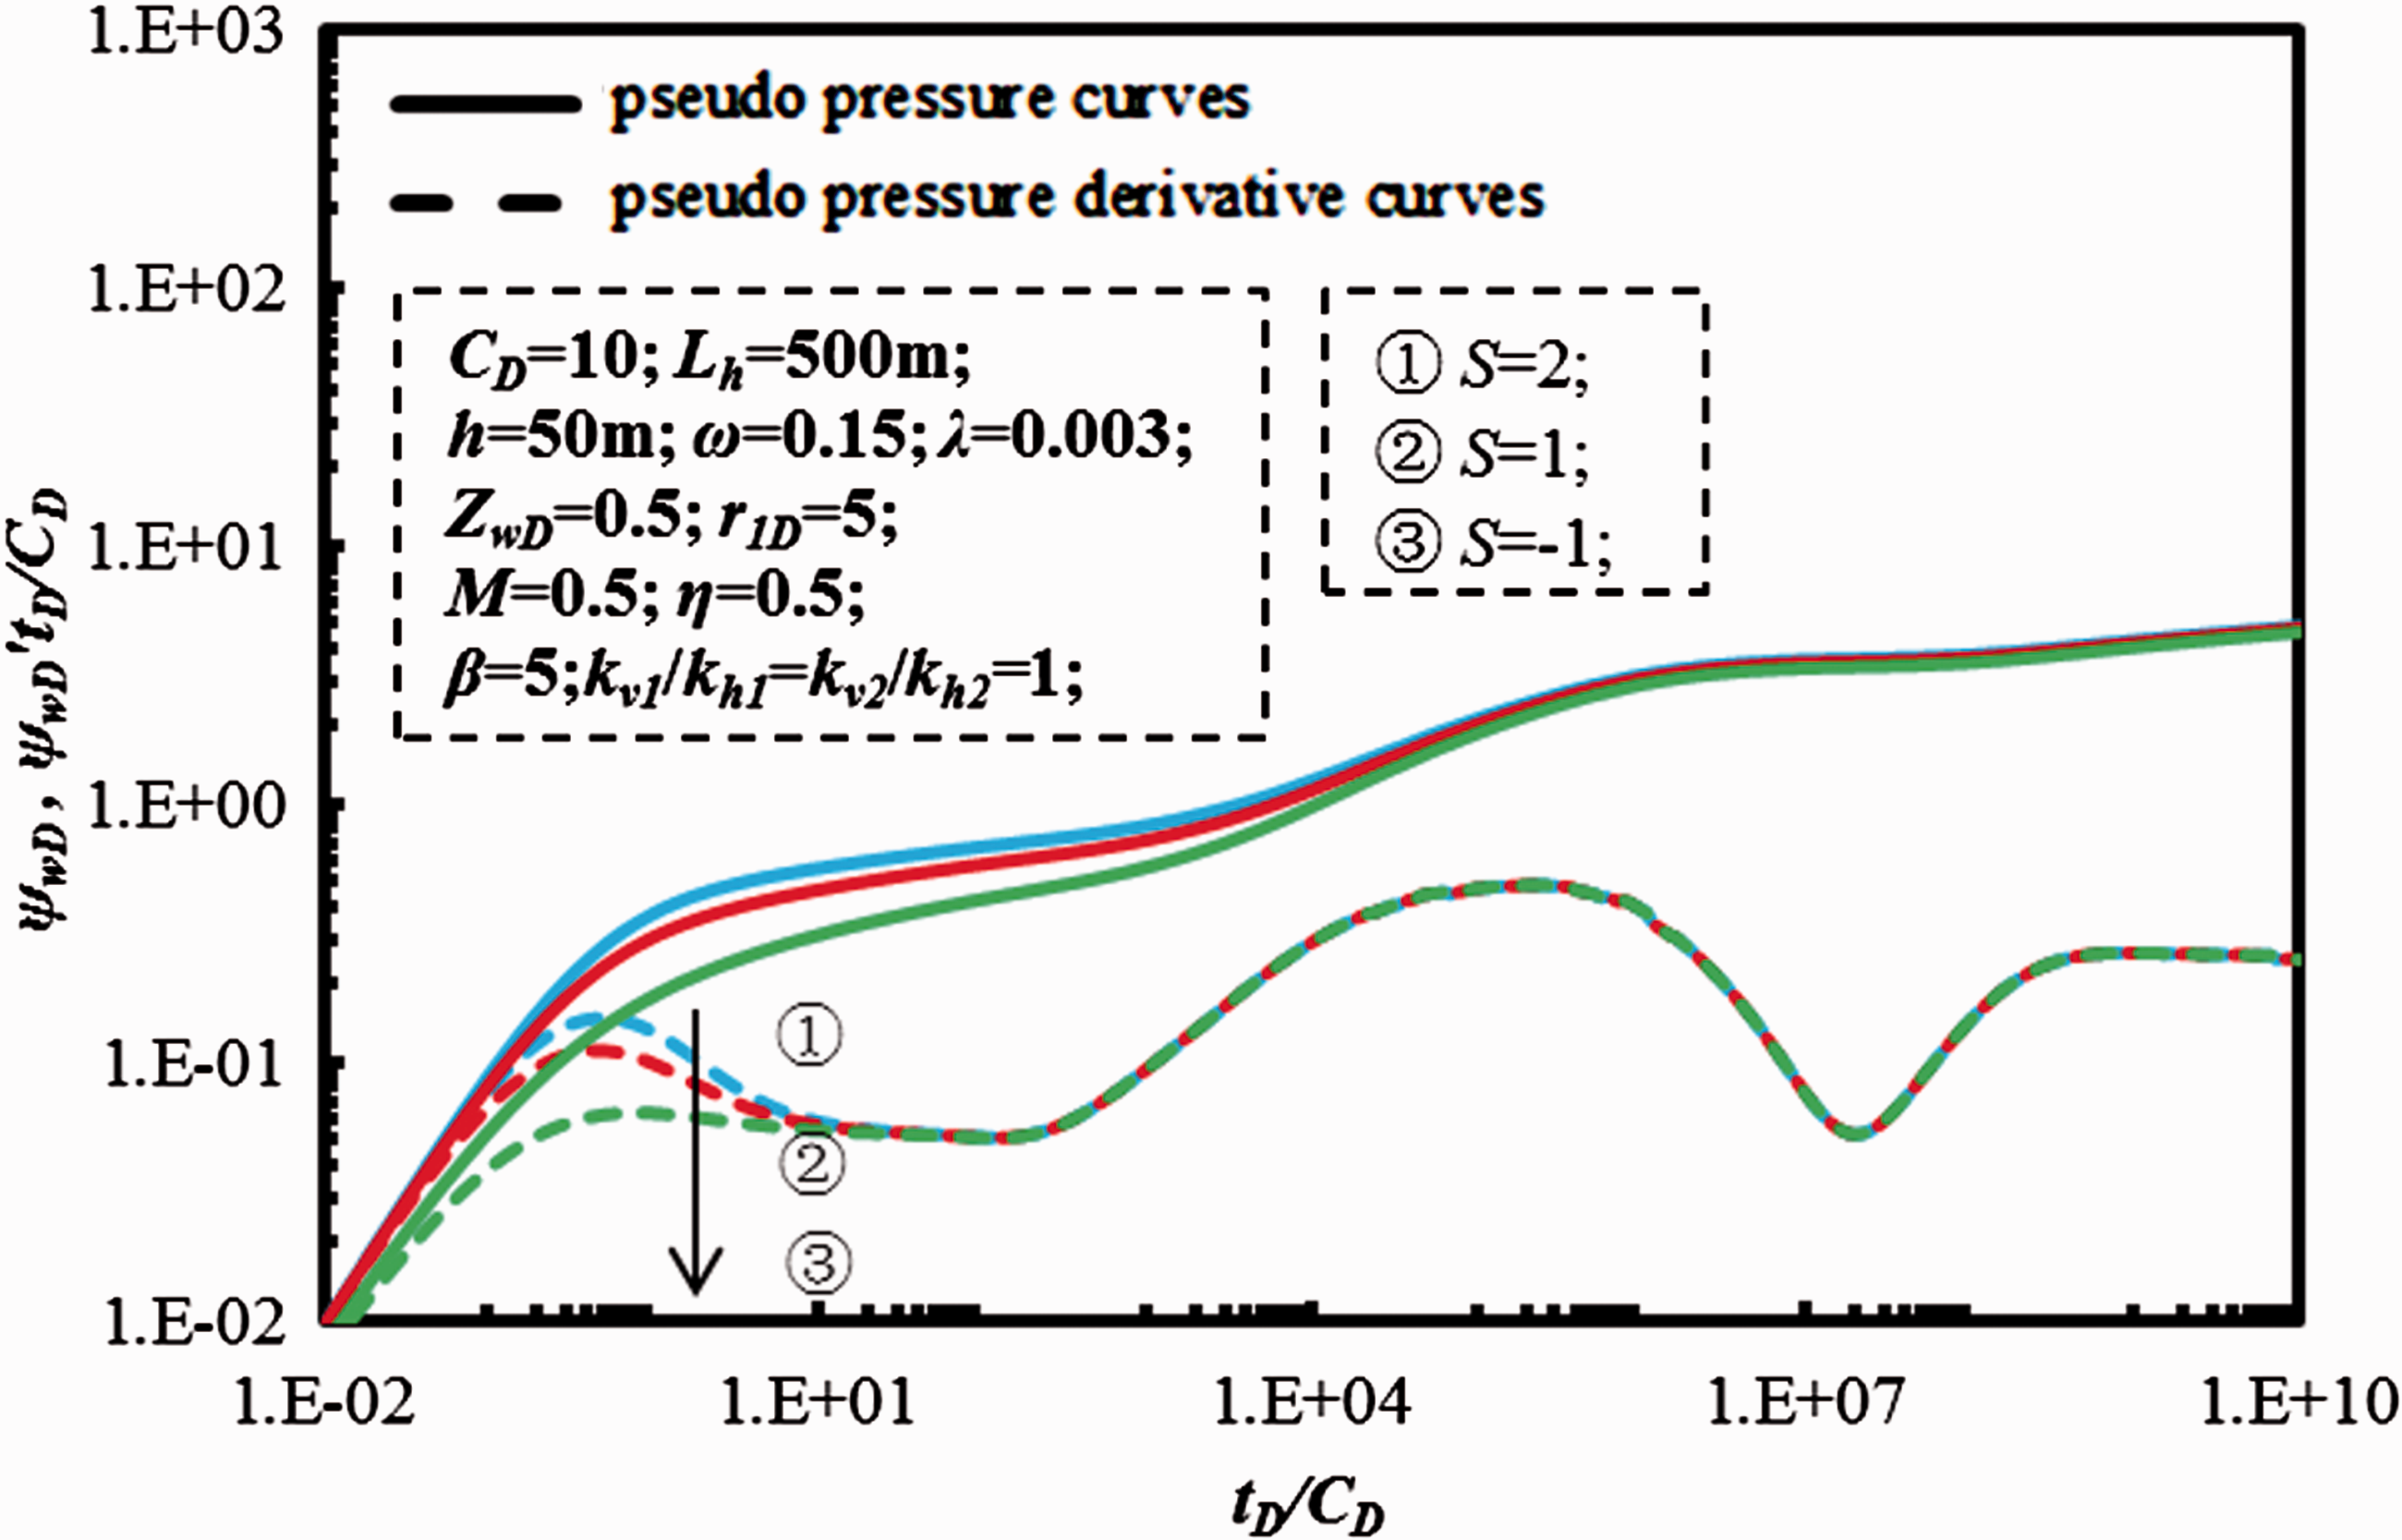
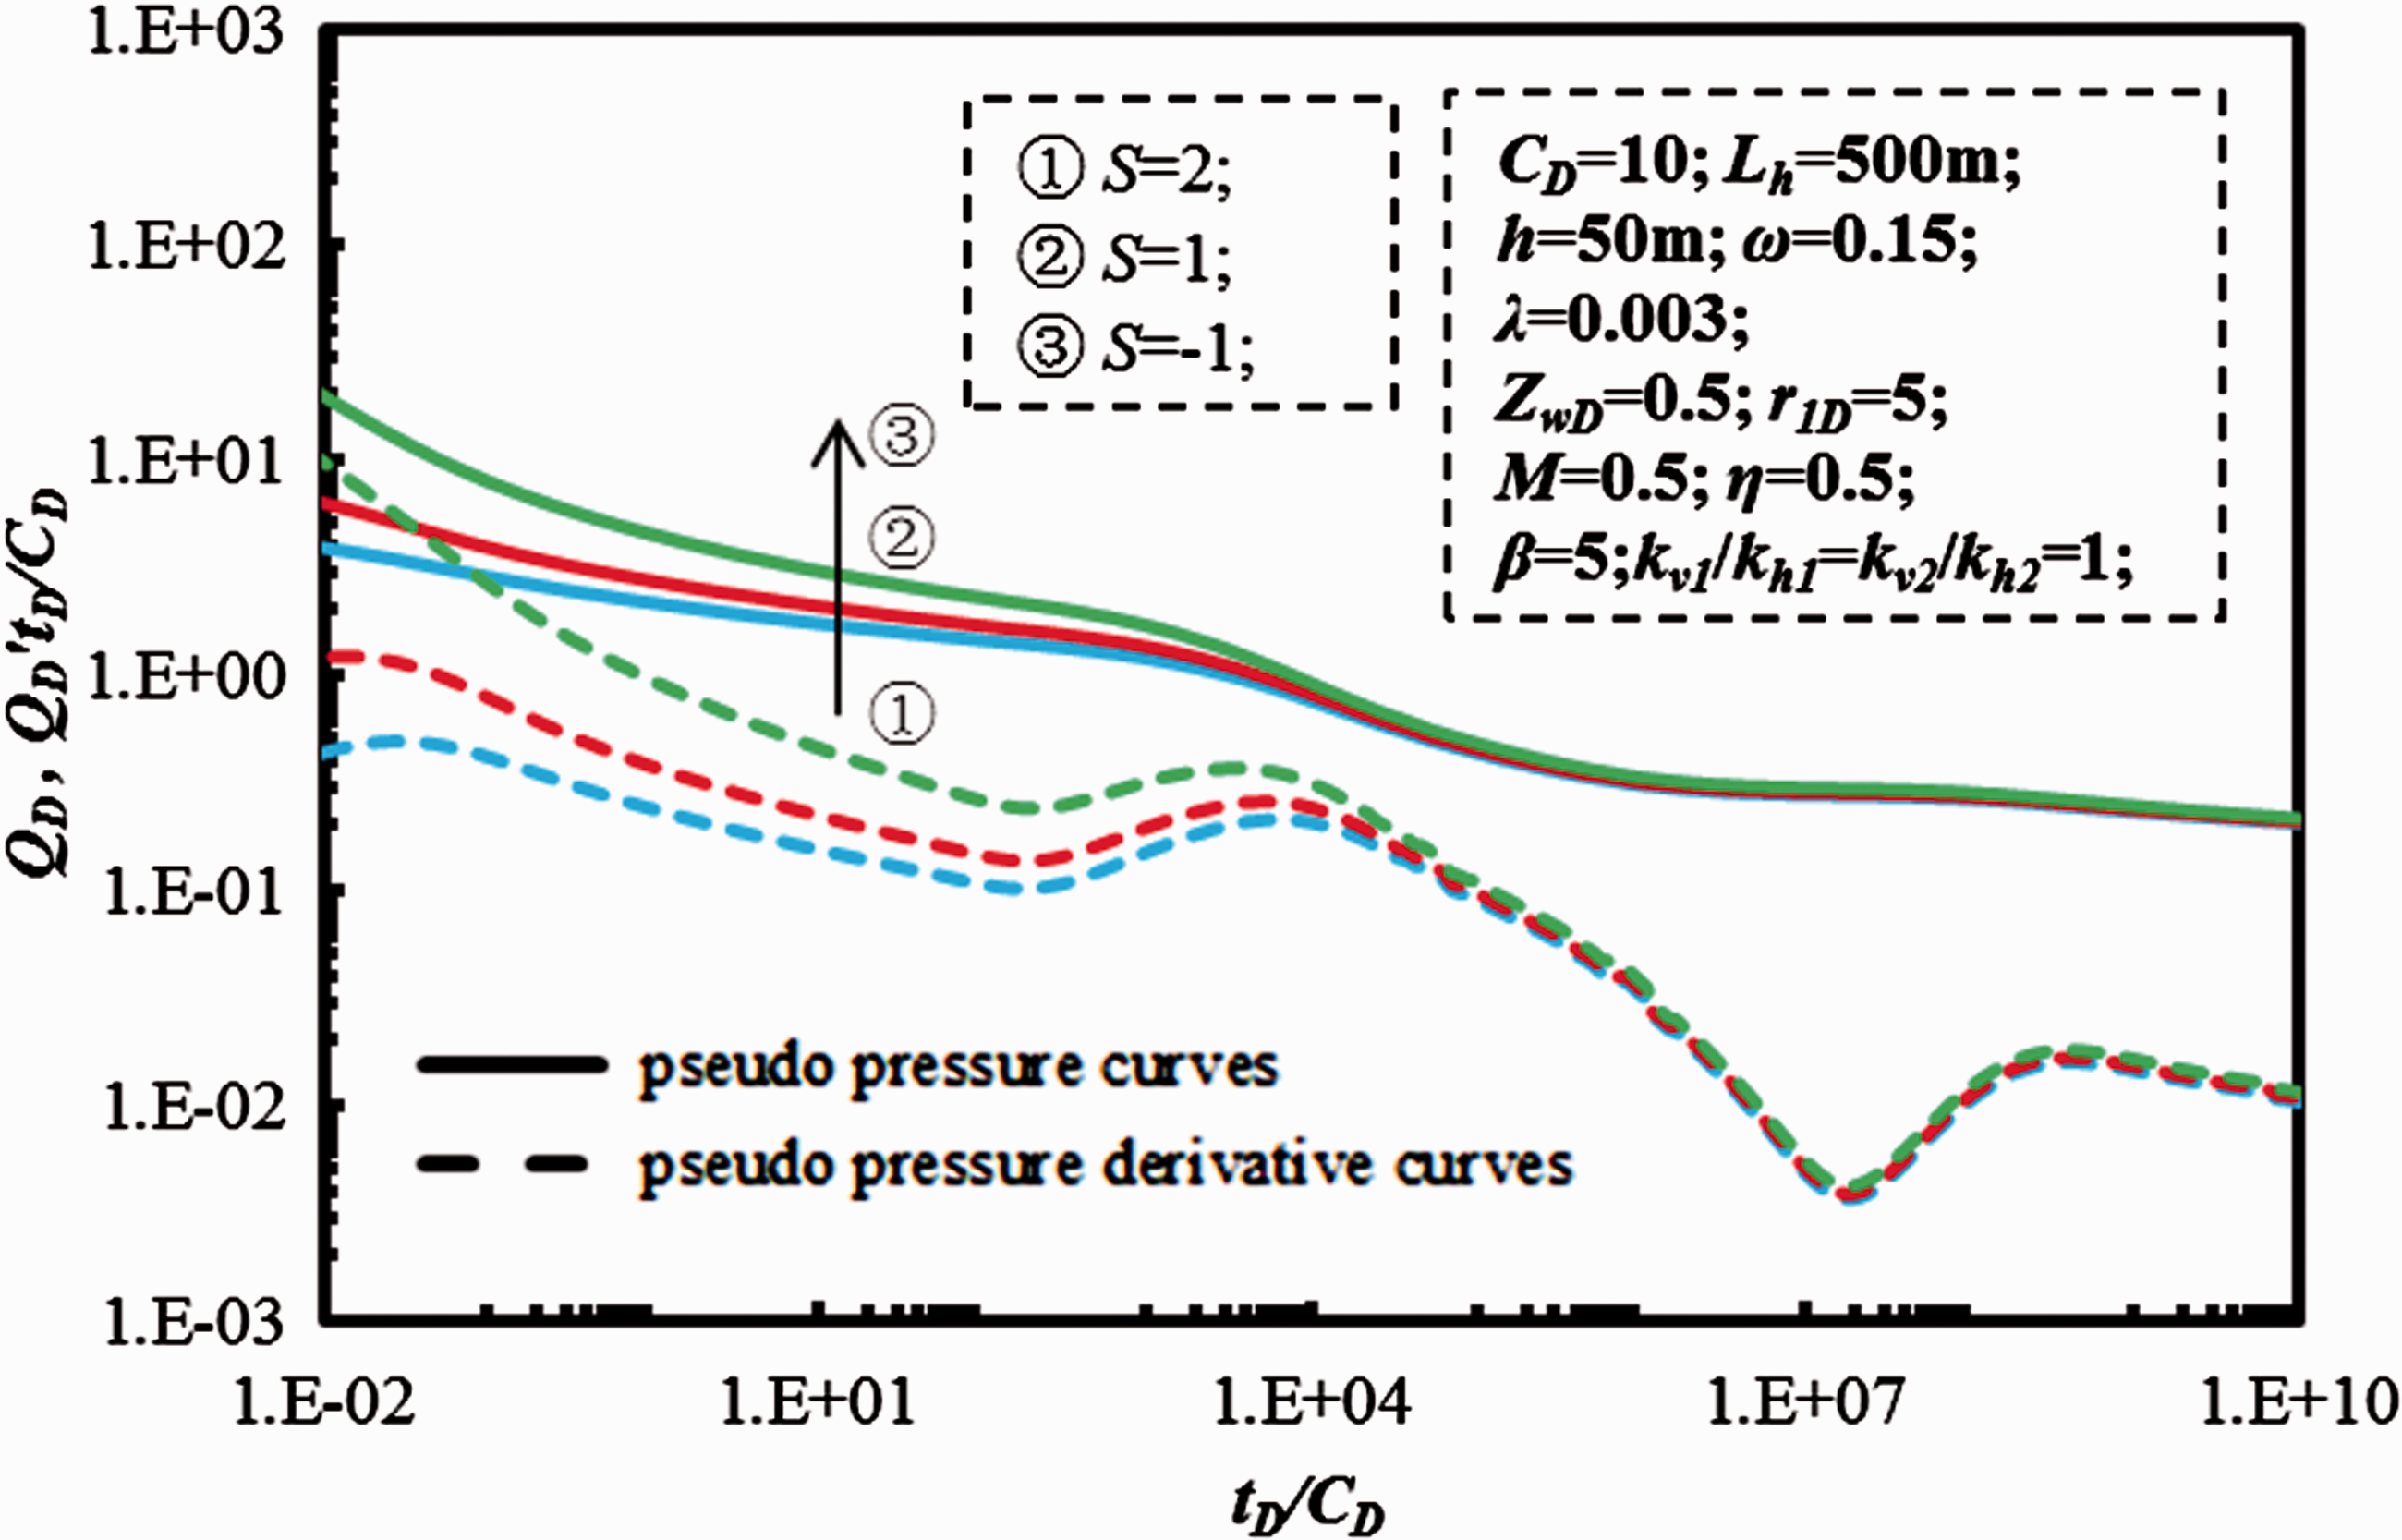
Figure 17 shows the effect of inner region radius on PTA-type curves. It can be seen that inner region radius mainly affects regimes V and VI. If the inner radius is small, e.g. r
1D
= 2, the second radial flow will last short and there will be a deep “V” shape in regime VI. A smaller inner region radius will decrease the duration of second radial flow. Besides, seen from Figure 18, smaller inner region radius will lead to high production rate in regimes V and VI. When M = 0.5, the outer region permeability is bigger than that of inner region. A smaller inner region radius will lead to smaller flow resistance for gas after the pressure spreads to the inner region boundary, therefore resulting in higher production rate at the late time.
7. Effect of horizontal well position in vertical direction. The effect of inner region radius on pressure-transient-type curves. The effect of inner region radius on rate-transient-type curves.
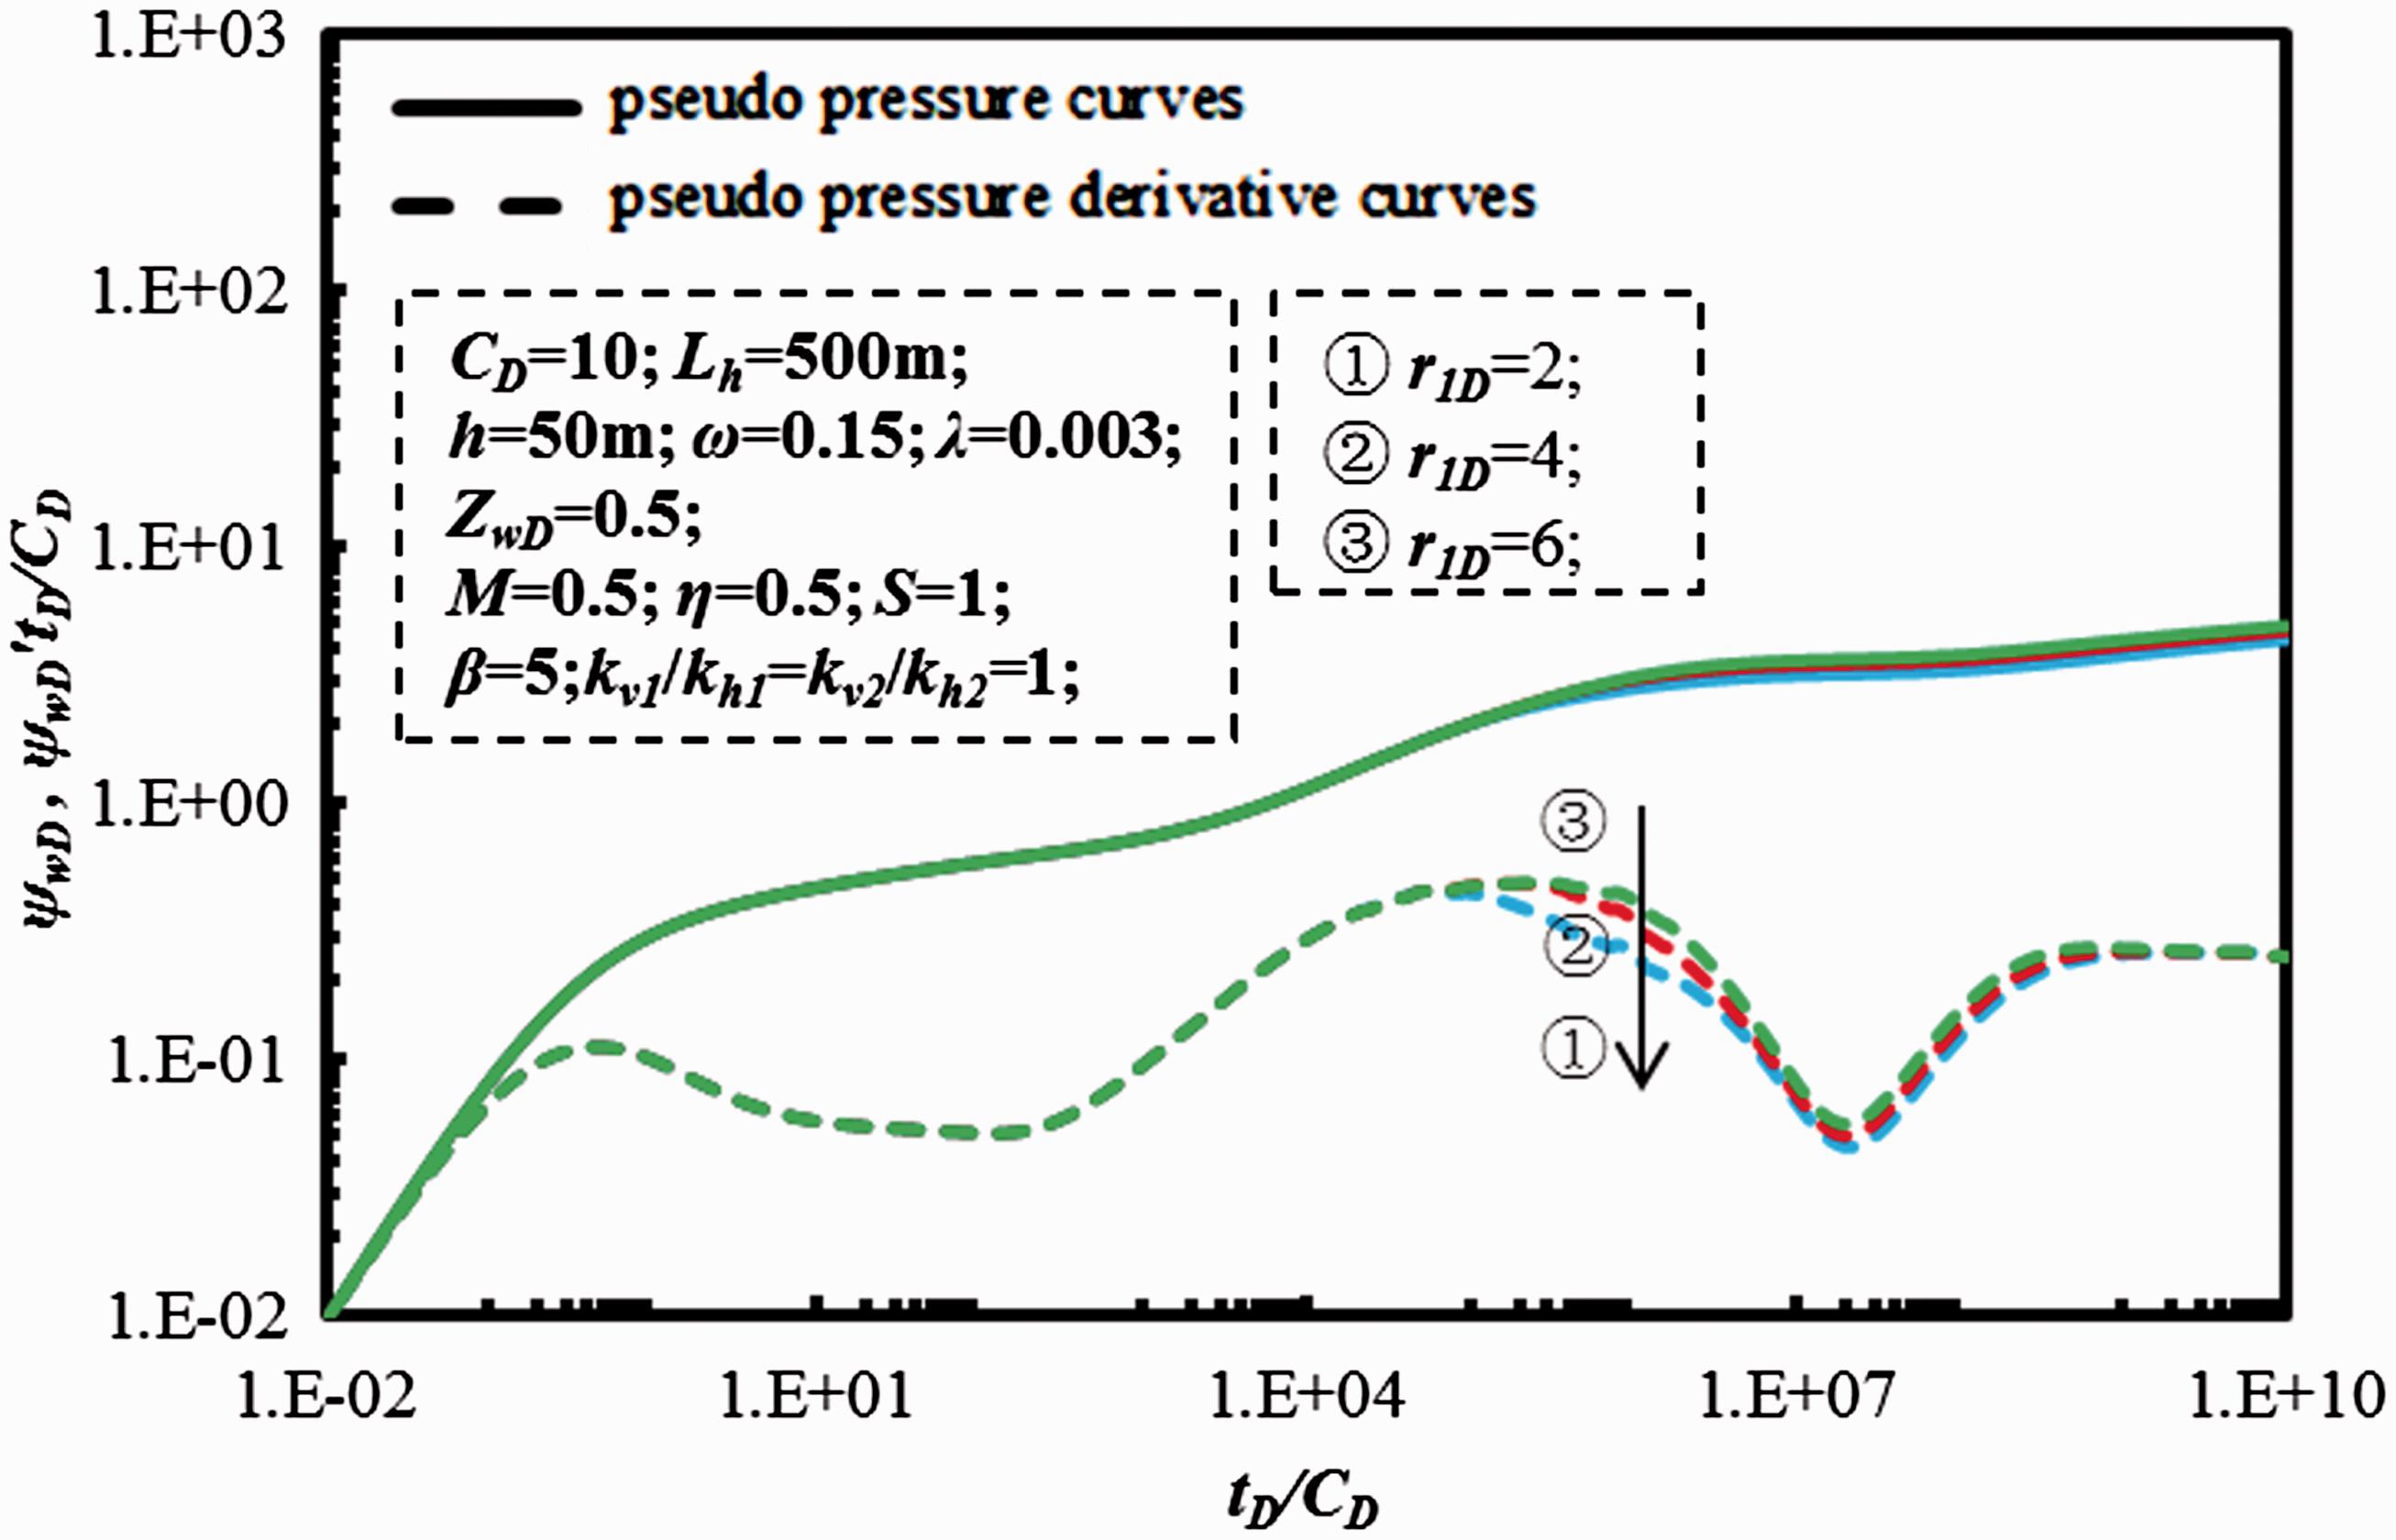
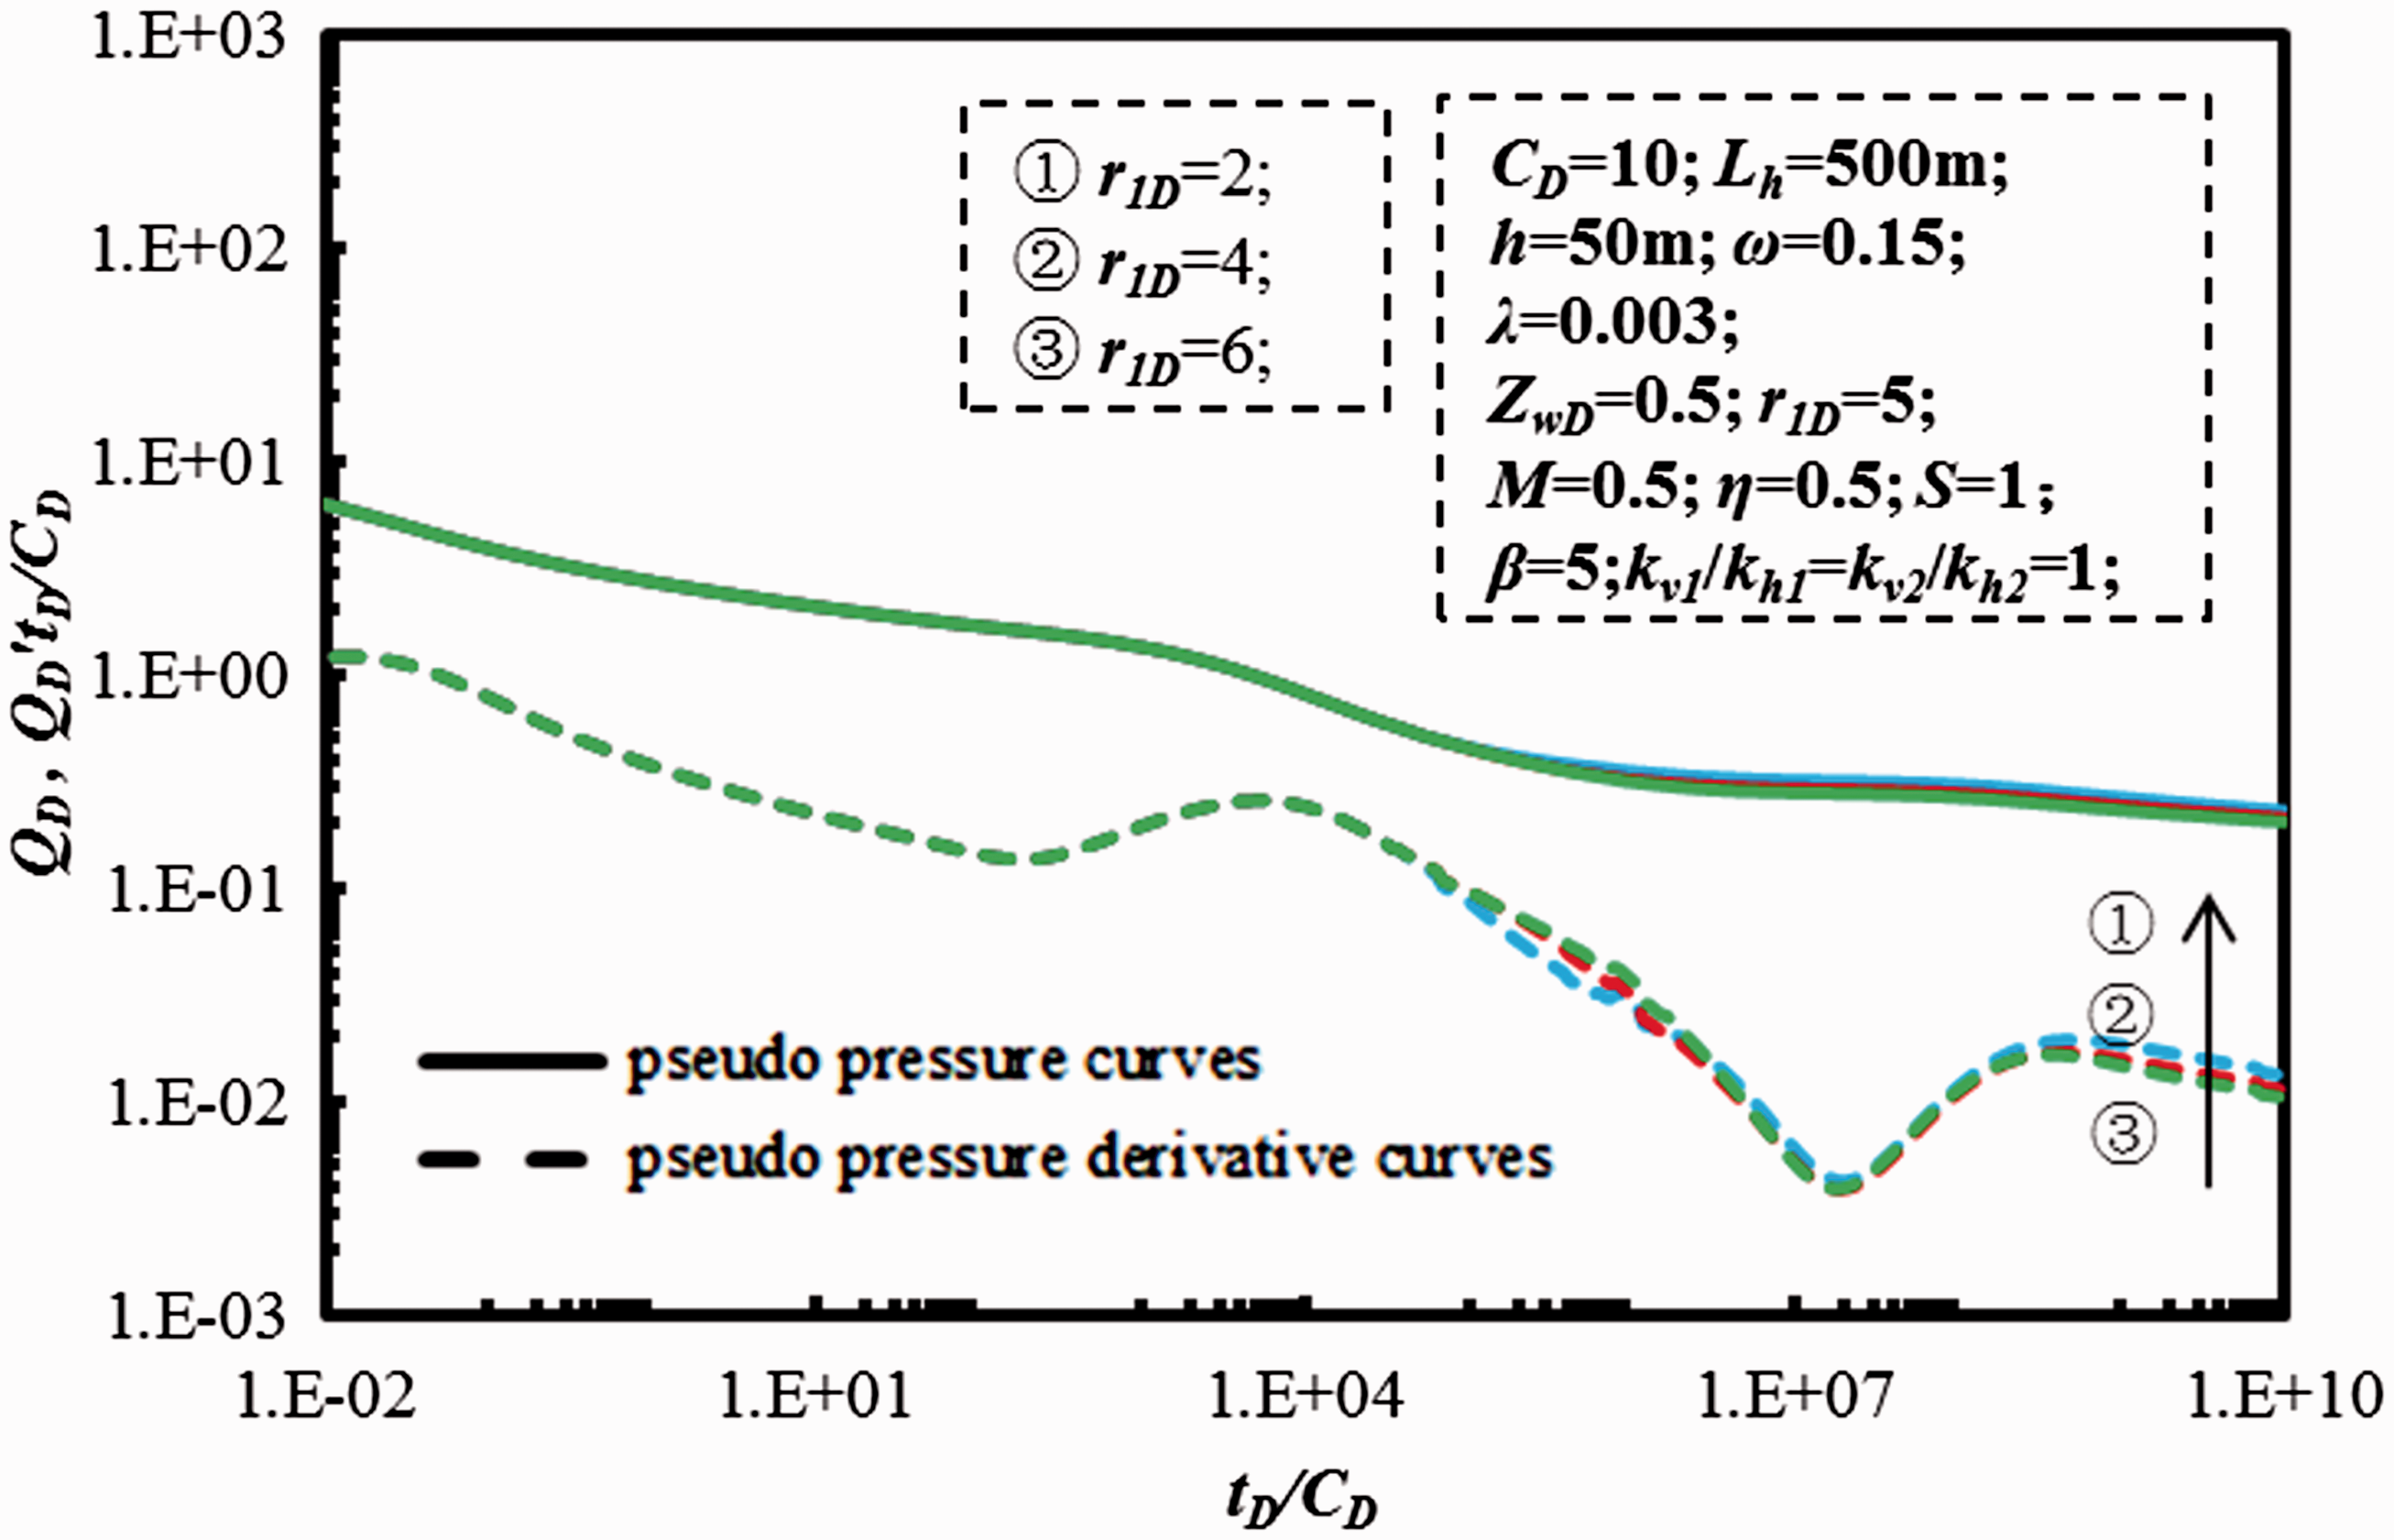
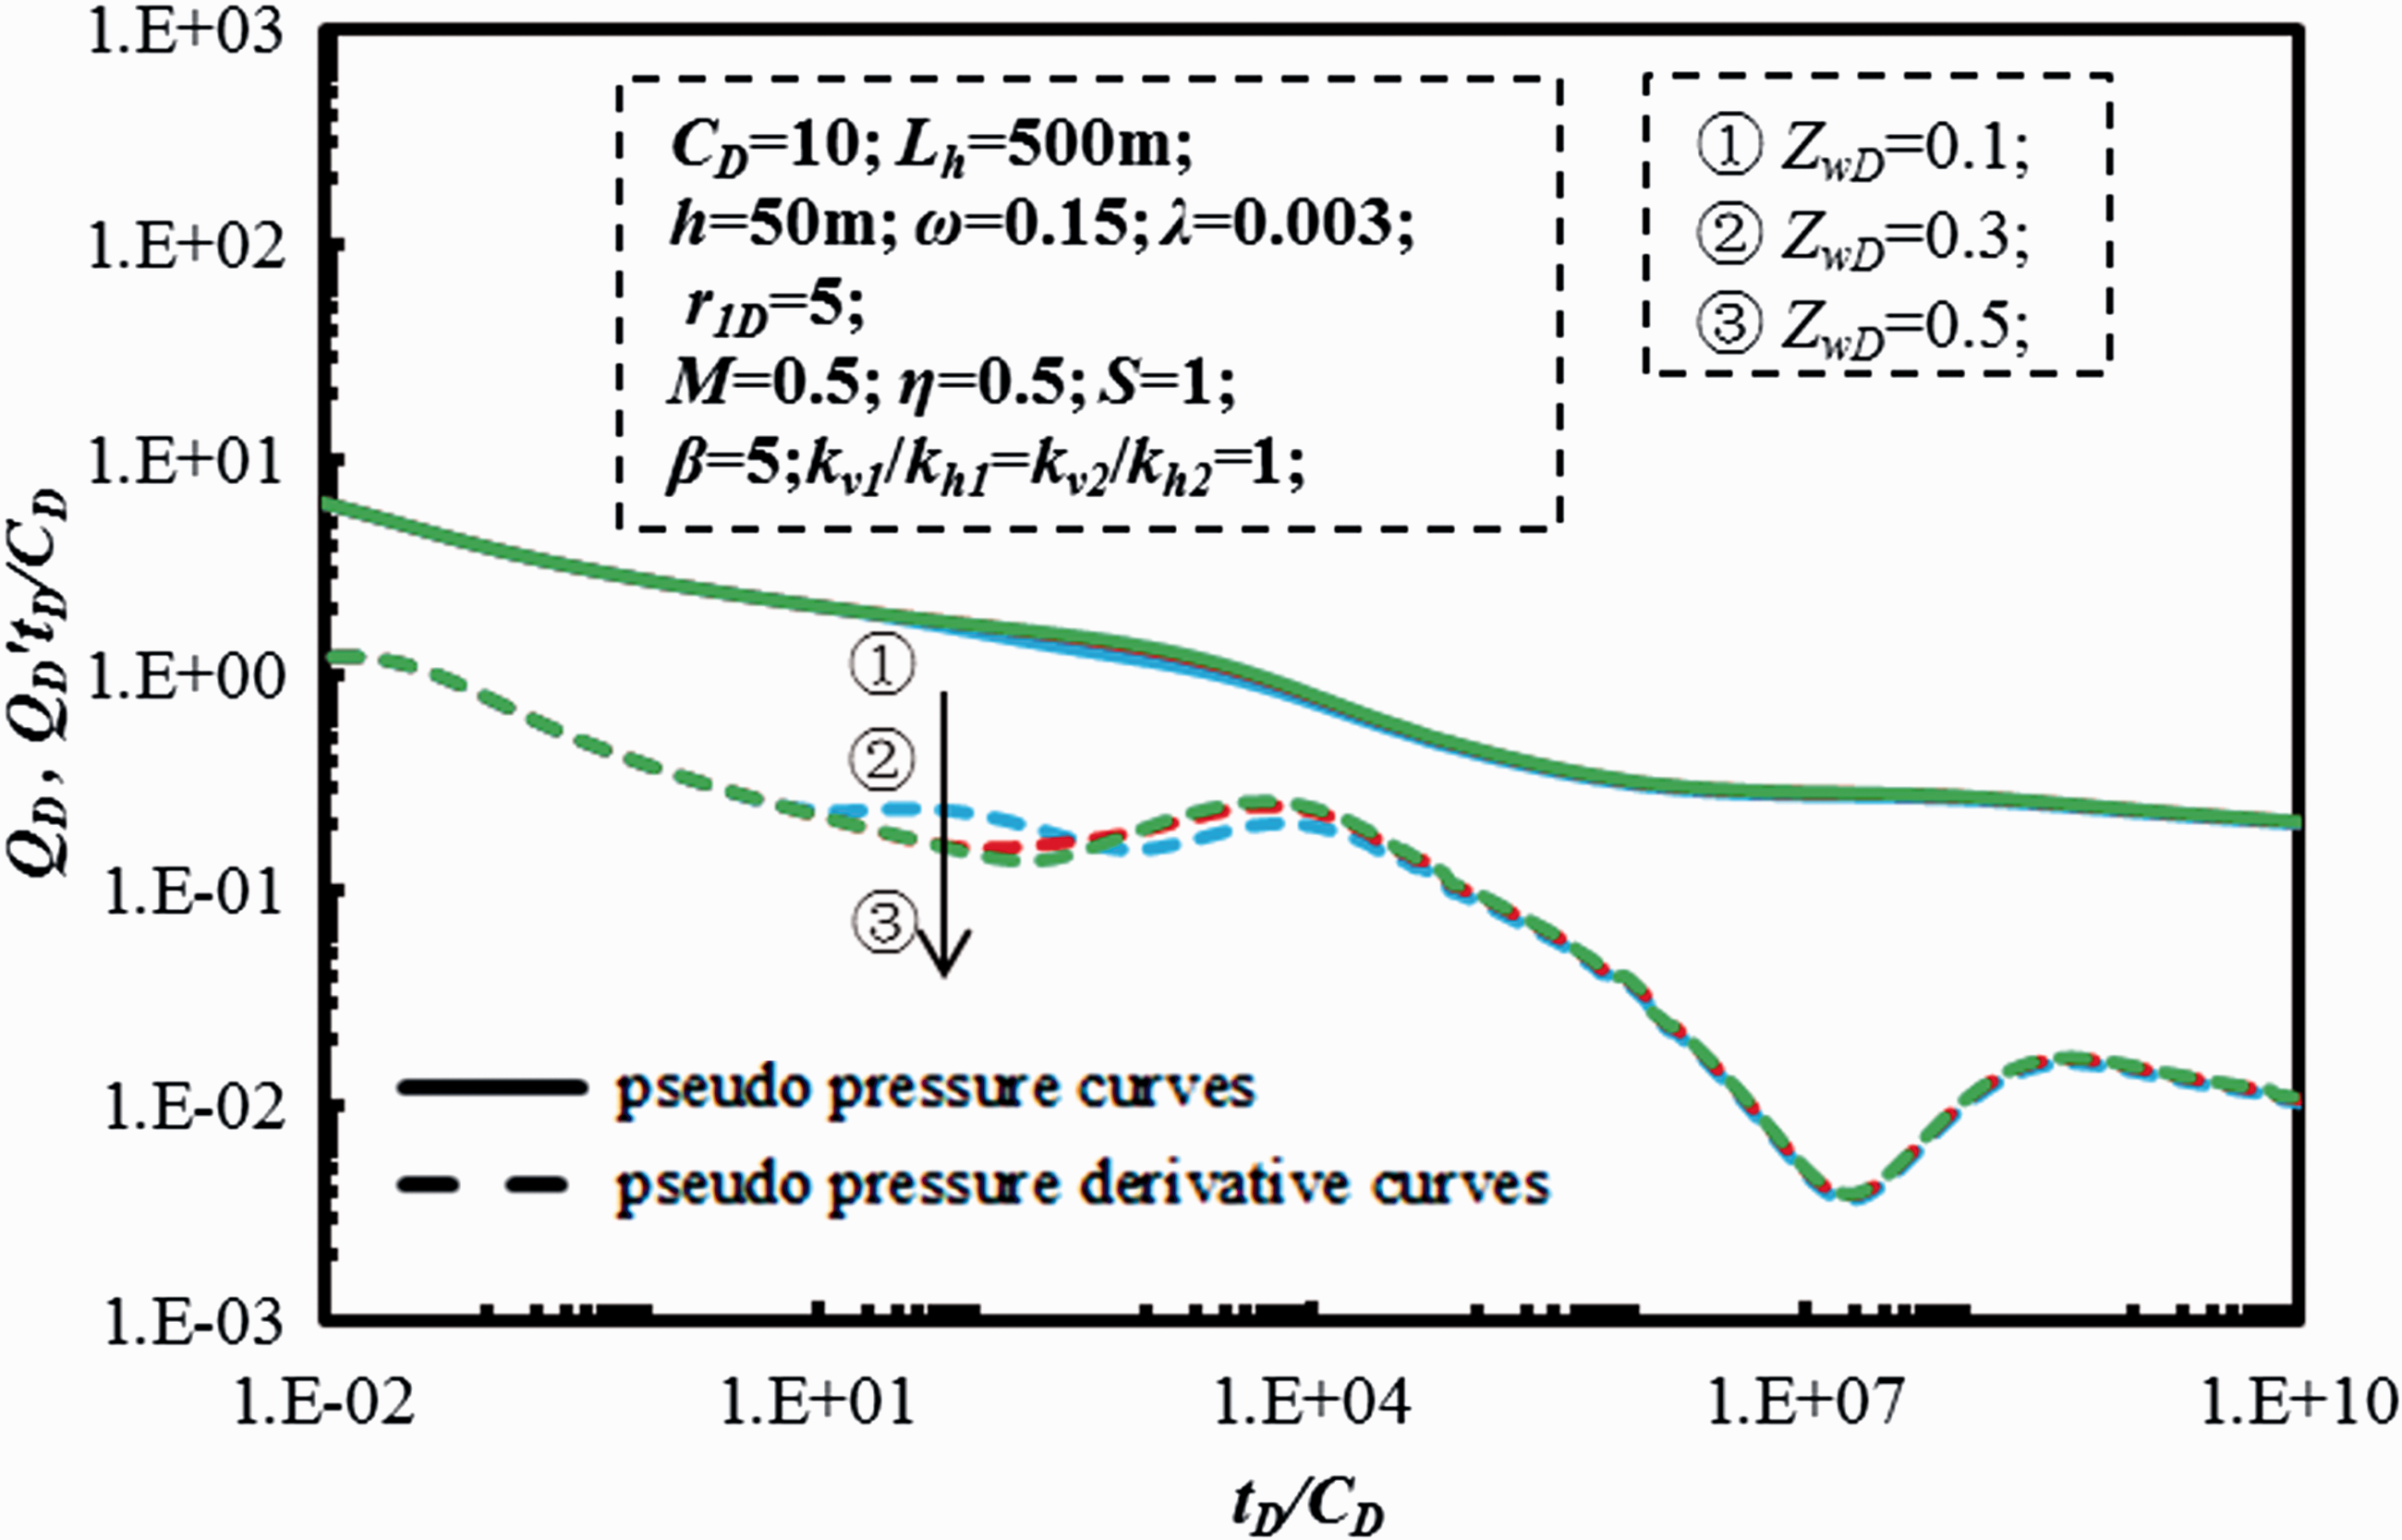
Figure 19 shows the effect of horizontal well position in vertical direction on PTA-type curves. Three values (0.1, 0.3, 0.5) are set to study the effect of the position. Seen from Figure 19, the horizontal well position in vertical direction mainly affects regime III and regime IV. When the horizontal well position in vertical direction zwD decreases, i.e. the distance between the horizontal well and the upper/bottom boundary decreases, the first radial flow regime lasts shorter and an “additional radial flow regime” appears. As can be seen from the curves that when zwD = 0.1, the pseudo-pressure derivative curve is a constant. When zwD increases, for example when zwD = 0.3, the “additional radial flow regime” becomes less obvious. When zwD = 0.5, the “additional radial flow regime” disappears. This regime is caused by the horizontal well being located away from the center position in z direction. Figure 20 shows the effect of horizontal well position in vertical direction on RTA-type curves. When the horizontal well position in vertical direction zwD decreases, i.e. the distance between the horizontal and the upper/bottom boundary decreases, the production rate will decrease in all time for well production lifetime, but the difference is not apparent.
The effect of horizontal well position in vertical direction on pressure-transient-type curves. The effect of horizontal well position in vertical direction on rate-transient-type curves.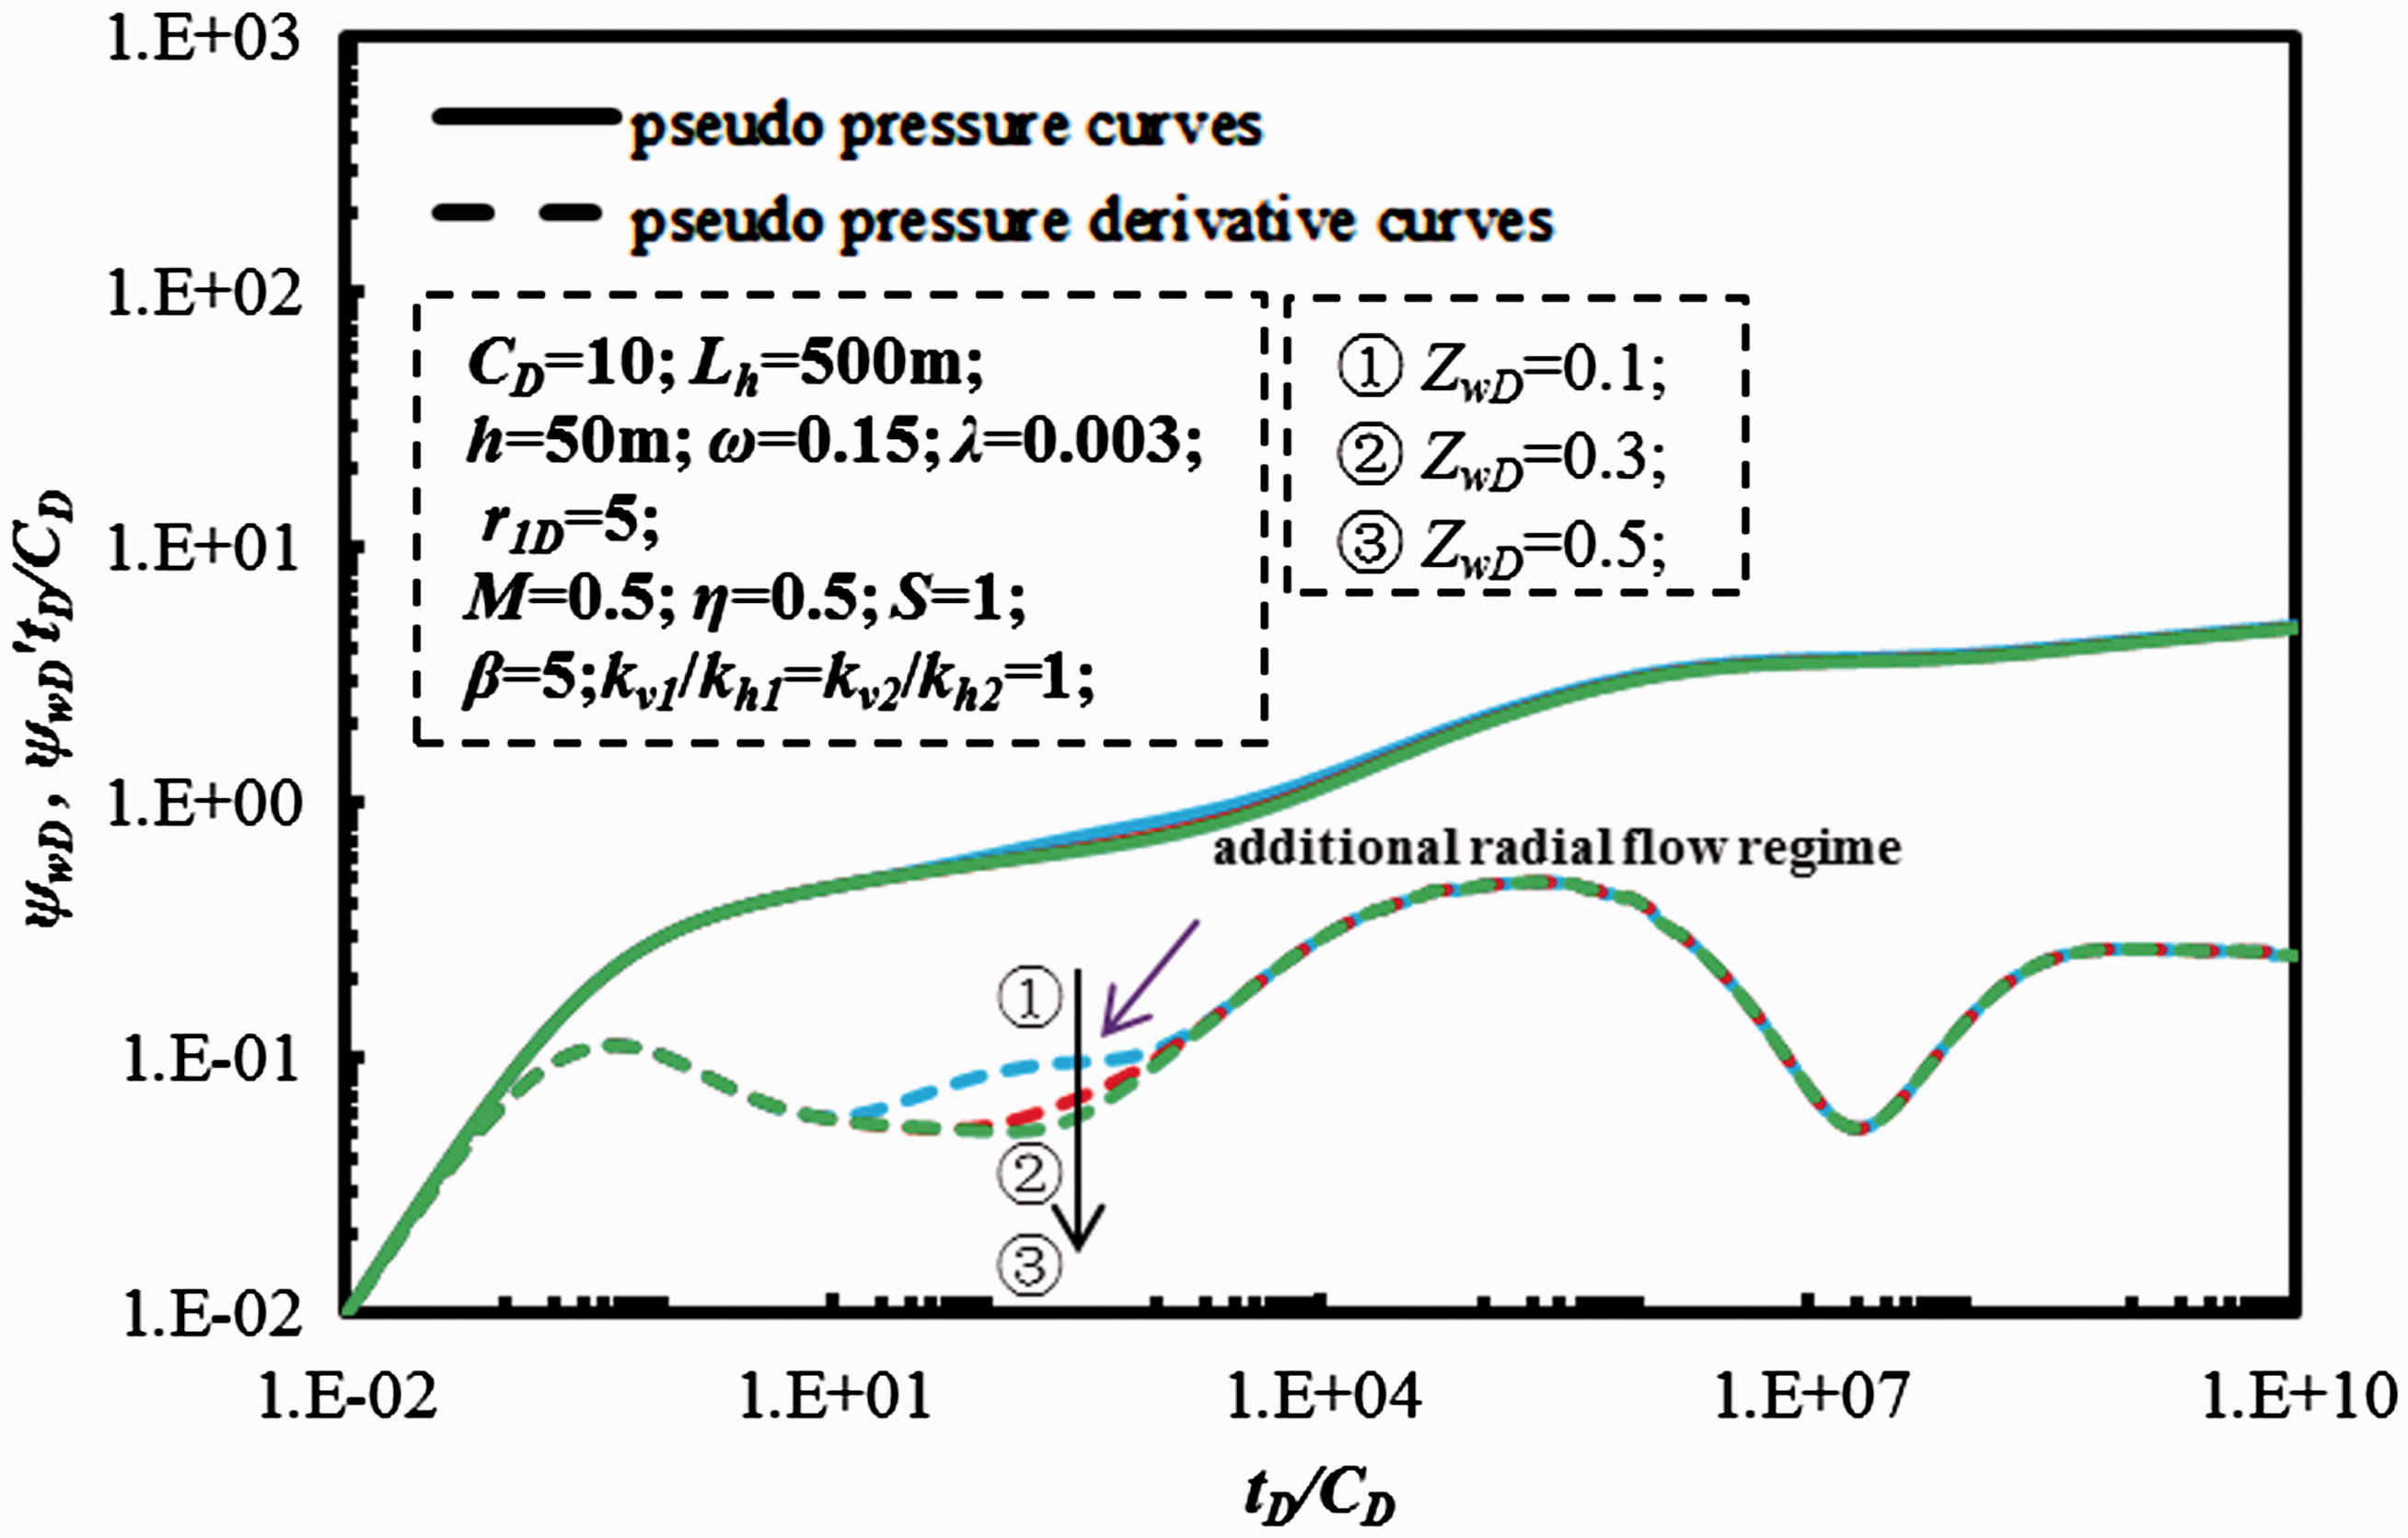
Conclusions
The main goal of this paper is to present the model and results of an extended study on the production performance behaviors of horizontal wells in composite CBM reservoir. The motivation of this study comes from the fact that the CBM reservoirs are generally heterogeneous. In this paper, the performance analysis model is established considering the transport mechanisms for CBM and solved using semianalytical method. Different flow regimes are divided based on the solution of this model, and sensitivity analysis of uncertain parameters is given. According to the work and results presented, the following conclusions are obtained:
The mathematical model is derived for production performance analysis of horizontal wells in composite CBM reservoirs. This model can be used to analyze PTA and RTA for CBM. Seven flow regimes exist in CBM production process including wellbore storage period, skin effect regime, first radial flow regime, transition regime, second radial flow regime, transfer regime, and late-pseudo radial flow regime. The flow mobility ratio of inner and outer region decides the shape of the production performance curves. The value of pseudo-pressure derivative curve for late pseudo-radial flow regime is 0.5* M. The value of pseudo-pressure derivative curve for second radial flow regime is 0.5. There is a big difference between the coal PTA and that of noncoal reservoir: there is no transfer regime for noncoal reservoir. Storage coefficient, transfer coefficient, and adsorption coefficient all have significant effects on pressure transient behavior and production performance behavior, and these parameters mainly affect the transfer regime. Bigger storage coefficient, transfer coefficient, and adsorption coefficient lead to bigger production rate. Considering ratio of vertical permeability to horizontal permeability, the value of pseudo-pressure derivative curve for early radial flow regime equals approximately to h
1D
/4.
Footnotes
Declaration of conflicting interests
The author(s) declared no potential conflicts of interest with respect to the research, authorship, and/or publication of this article.
Funding
The author(s) disclosed receipt of the following financial support for the research, authorship, and/or publication of this article: This work is supported by National Natural Science Foundation of China (Grant Nos. 51174223 and 51574265).