
Abstract
A large proportion of shale gas is in adsorbed state. However, in the process of shale gas development, adsorbed gas in the shale pores will gradually desorb, which results in the permeability change of shale. This study aims to find out the adsorption and desorption characteristics of shale and whether there exists certain impact of desorption effects on shale permeability by experiments. Isothermal adsorption and desorption curves of shale gas are not coincident and the desorption curves are in hysteresis. Langmuir equation can be used to calculate the shale isothermal adsorption curve and desorption equation can be used to calculate the shale gas isothermal desorption curve. The permeability of shale was measured, respectively, under low pressure and high pressure, with methane and helium as experimental gas. Then, the comparison was made between the results of shale and the similar experiment results of tight gas sandstone. The results are showed as follows: adsorption effects will break the linear relationship between the shale permeability and the reciprocal of average pore pressure under low pressure; under high pressure, when gas desorption enhances, shale permeability significantly increases. Therefore, adsorption effects can impact the shale permeability under low pressure as well as under high pressure, which should be taken into consideration in the shale gas development.
Introduction
In China, there are various kinds of shale gas resources, distributing in large areas. Thus, our shale gas has a great potential for exploitation. According to estimation, China’s shale gas resource that can be exploited is about 31 × 1012 m3 (Wang and Wang, 2011). In shale gas reservoir, gas exists in three states: as free gas in cracks, as free gas in matrix pore, and as absorption gas (Lane et al., 1989). Generally, shale contains high organic matter and clay mineral. And the quantity of high organic matter is closely related to natural gas adsorption (Lu et al., 1995). Its pore structure provides it with large specific surface area. Those advantages are beneficial for matrix pore to adsorb a good deal of natural gas, with its content changing in the range of 20–85% (Lane et al., 1995). The existence of nanopores in shale has been revealed recently by ultra-high pressure mercury injection (Curtis et al., 2010, 2011a; Elgmati et al., 2011; Sondergeld et al., 2010) and back-scattered scanning electron microscopy (Ambrose et al., 2012; Curtis et al., 2011b; Milner et al., 2010; Schieber, 2010).
Currently, there are mainly three methods for determining permeability of very low permeability rocks in the laboratory: traditional steady-state method, unsteady-state method, and mercury (Hg) intrusion curves method. Steady-state method has been successfully applied in conventional reservoirs for many years (Klinkenberg, 1941; Rushing et al., 2004; Sinha et al., 2013). However, this method requires a very long time to achieve steady-state flow in measuring ultra-low permeability samples. In order to overcome the shortcoming of steady-state method, the unsteady-state technique makes the shale permeability measurement possible by reducing the test time. Pulse decay method is one of the commonly used unsteady-state techniques, which generally includes the core column method (Bourbie and Walls, 1982; Chen and Stagg, 1984; Dicker and Smits, 1988; Hsieh et al., 1981; Jones, 1997), core chips or drill cuttings method (Qu et al., 2015), and the degassing method (Egermann et al., 2015; Luffel et al., 1993). Mercury (Hg) intrusion method is first presented by Washburn (1921) who first put forward capillary force function and established the relationship between capillary force, interfacial tension, and contact angle. After that, the relationship between Hg injection curves and permeability has been investigated by a number of authors (Kamath, 1992; Rashid et al., 2015; Thomeer, 1960, 1983). Cui et al. (2009) defined an apparent transport coefficient to determine the shale permeability and concluded that the apparent transport coefficient will become smaller if the gas is adsorptive to the sample if the gas adsorption is considered. Sinha et al. (2013) presented the results of steady-state permeability measurements on shale samples conducted at reservoir conditions and found that net stress, pore pressure, temperature, and gas type have strong effects on permeability of shale. Cao et al. (2016) presented a new approach for measuring the permeability of shale featuring adsorption and found that shale permeability would be inaccurate without consideration of adsorption. Except for net stress, pore pressure, temperature, and gas type, water is also an important factor influencing the permeability of shale. Zhou et al. (2016) provided quantitative permeability change to shale imbibition with various fracturing fluid and found that imbibition in shale seriously and permanently reduced matrix permeability. In this study, we focused on the gas adsorption effect on shale permeability by experiment.
Samples and methods
Samples
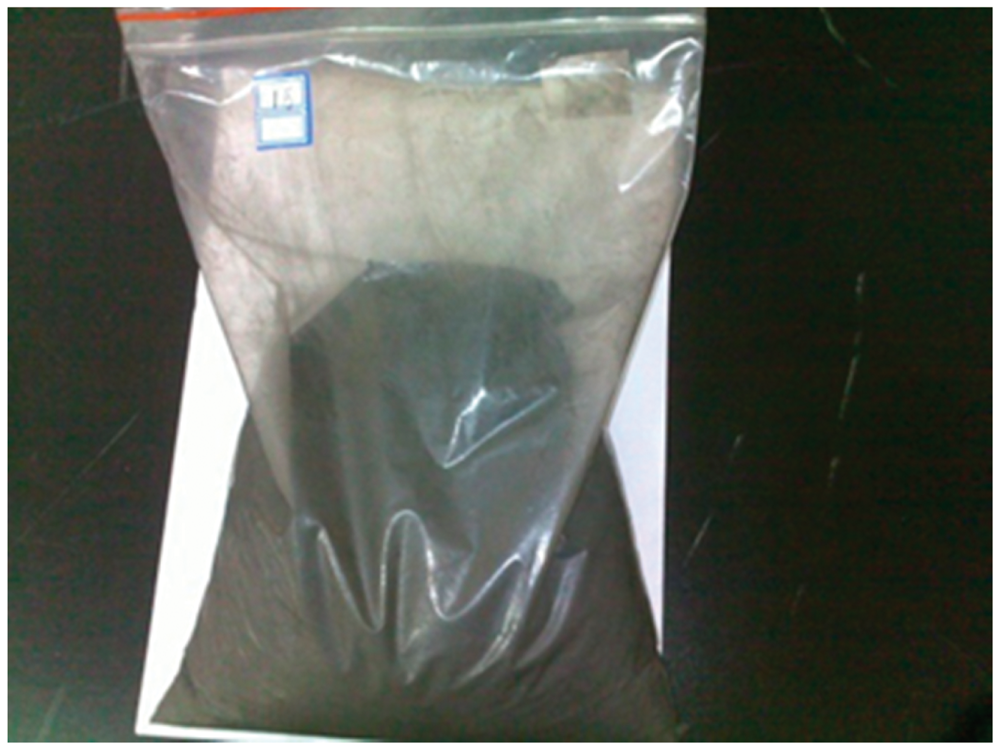
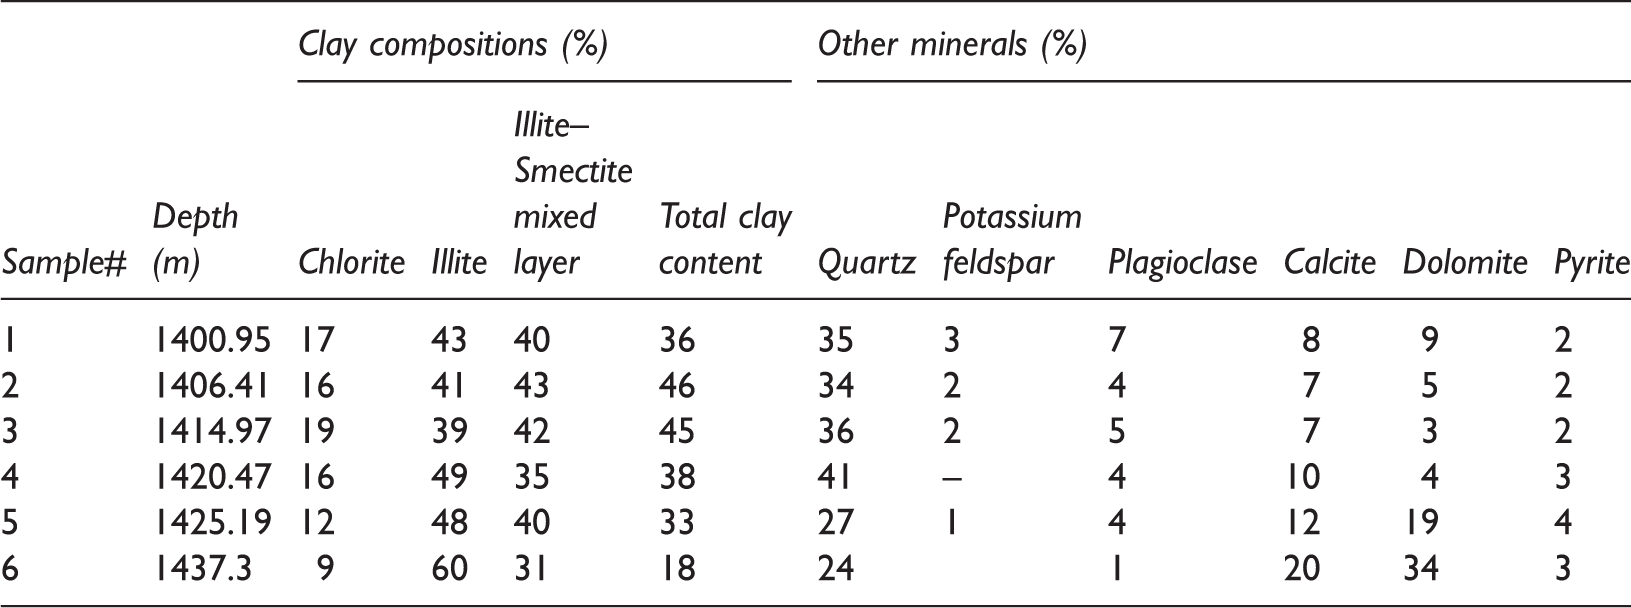
Experimental samples are collected from the target layer of Longmaxi Formation in Southern Sichuan Basin because Longmaxi Shale in this area is relatively stable and can better represent the formation. Core plugs with diameter of 2.5 cm and length of 5 cm were drilled from whole cores as shown in Figure 1, and then the left cores were crushed into 60–80 mesh (as shown in Figure 2) for isothermal adsorption experiment. The gas adsorption and desorption isotherms were measured on the “as-received” sample without any drying of the sample. Table 1 presents the compositional analysis of the Longmaxi shale sample. Generally speaking, clay mineral content is the highest, which ranges from 18 to 46% with an average of 36%. The second highest mineral is quartz, which ranges from 24 to 41% with an average of 32.8%. The average calcite content is 10.7%. Overall, in our research area, the sum of average clay, quartz, and calcite content accounts for 79.5% of the whole composition minerals. Other minerals such as plagioclase and pyrite content are usually less than 7%. The average total organic content of the samples is 1.75%.
Core plugs ready for permeability measurement experiments. Crushed shale sample for isothermal adsorption experiments. Mineral composition of Longmaxi Formation, Southern Sichuan Basin.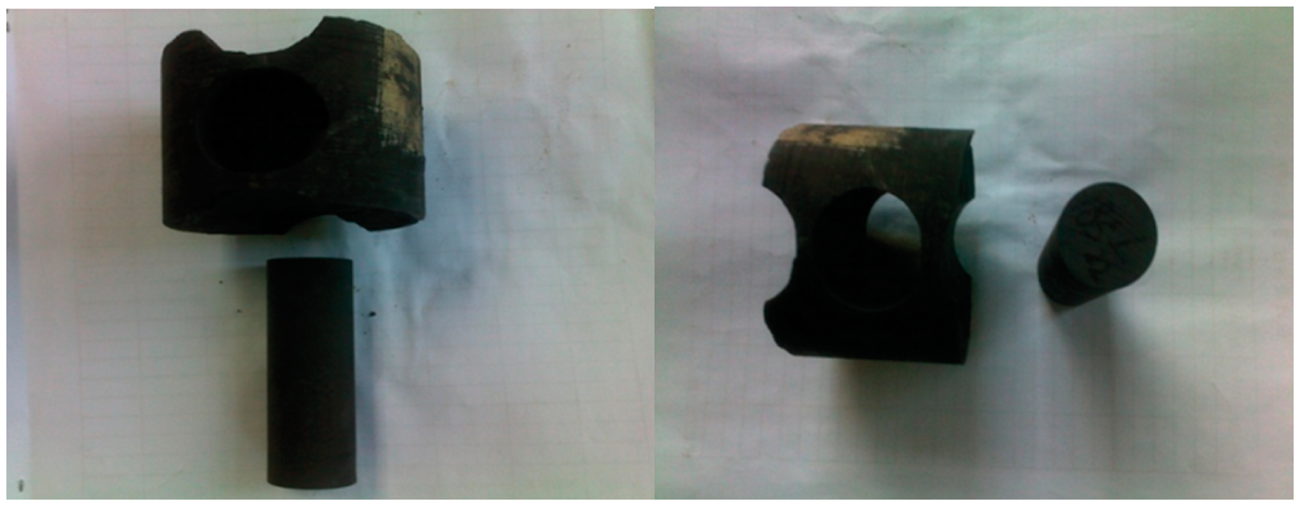
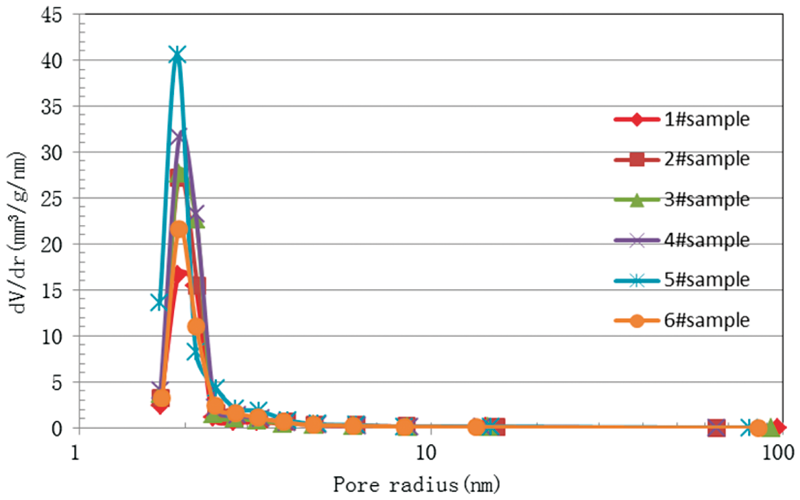
The gas adsorption experiment using nitrogen as the adsorbent at liquid nitrogen temperature was conducted. Figure 3 shows the adsorption–desorption isotherms results of the shale samples. Both the isotherms show hysteresis between adsorption and desorption that is characteristic of type IV isotherms (as per IUPAC classification). The hysteresis pattern, termed H3 as per IUPAC classification, indicates presence of slit-like pores. Figure 4 shows the pore size distribution obtained from the desorption curves by Barrett-Joyner-Halenda method. The distribution curves of six shale samples show a peak radius of between 1 and 3 nm. The dominance of micropores in shale makes it a good candidate for gas adsorption potential. So in the permeability measurement of shale samples, we should take gas adsorption effect into consideration.
Liquid nitrogen adsorption and desorption experimental results. (a) Sample 1#, (b) sample 2#, (c) sample 3#, (d) sample 4#, (e) sample 5#, and (f) sample 6#. Pore size distribution of shale samples.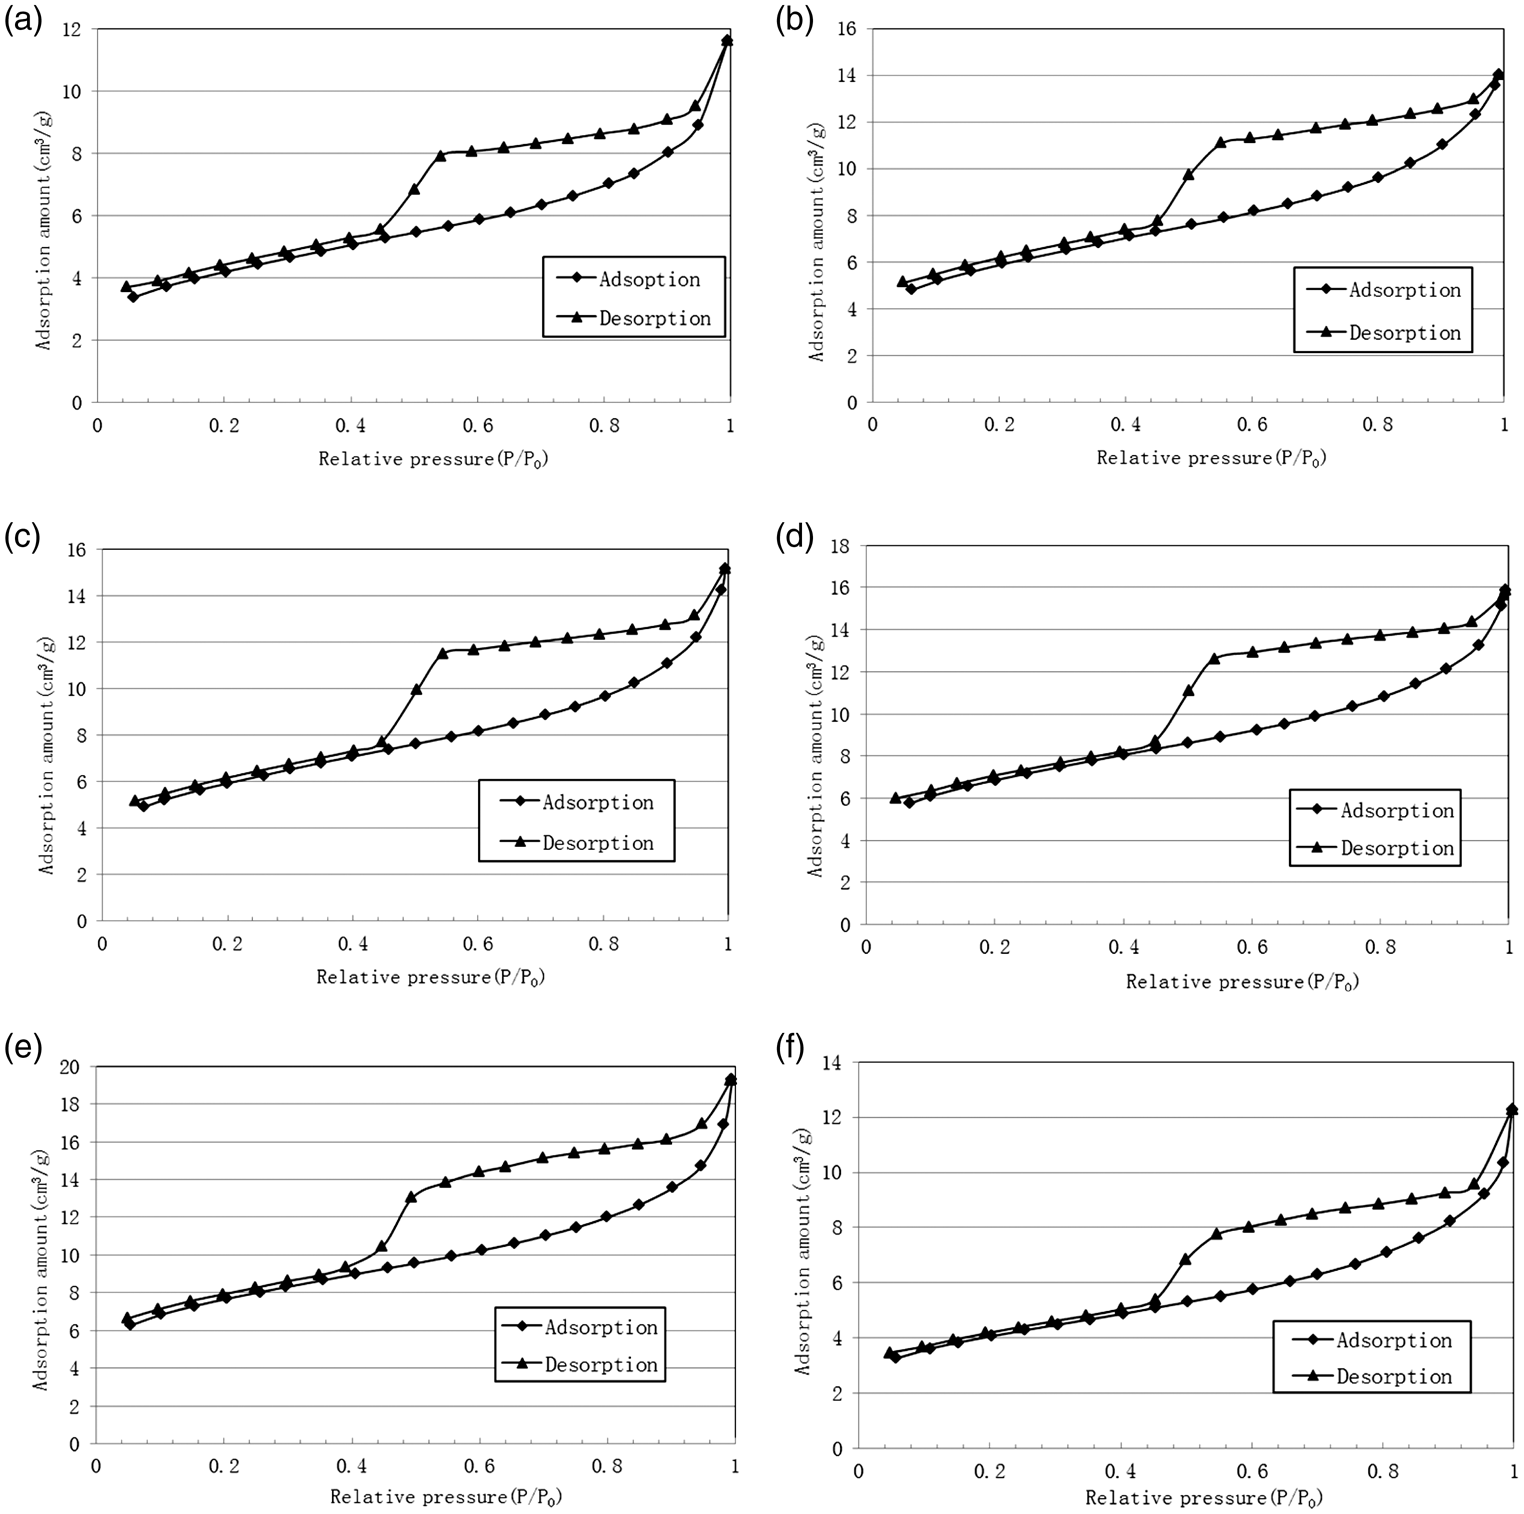
Adsorption and desorption isotherm curves measurement method
The experimental technique used in this study is based on the volumetric method of measuring adsorption. The experimental apparatus is shown schematically in Figure 5. The essential details of the method are described in the following paragraph.
Isothermal adsorption experimental apparatus diagram.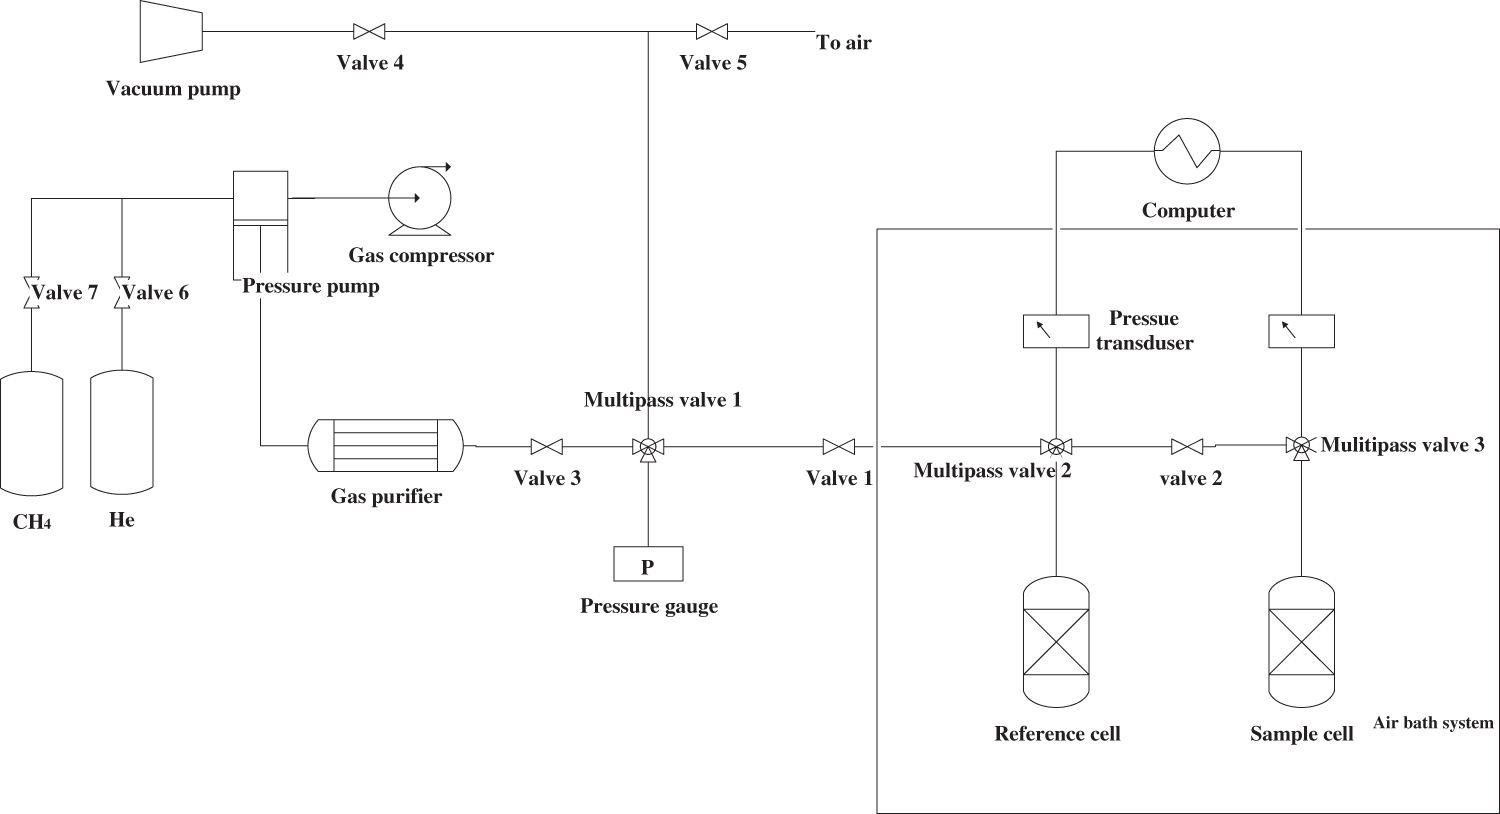
The entire apparatus is maintained in a constant temperature air bath. The sample cell (Figure 5) is filled with the adsorbent. The void volume in the cell, V0, is determined by helium expansion method. The helium void volume includes all the volume of the cell section exclusive of the adsorbent volume that is impenetrable to helium gas. Because the adsorption amount of helium can be ignored, the void volume can be determined from gas expansion method. The details of measuring V0 are as follows: (1) Set the system temperature first and open the valve 1, 2, 4 to vacuum the system that includes reference cell, sample cell, and connecting lines for 120 min until no significant pressure change and then close the valve 2, 4 and record the reference cell and sample cell pressure p1. (2) Open the valve 3, 6 to let a certain helium gas (purity > 99.999%) flow into the reference cell, and then close the valve 1, 3, 6. When the reference cell pressure and temperature become stable, the reference cylinder pressure p2 is recorded to calculate the amount of He in the reference cell. Open the valve 2, He expands into the sample cell and record the equilibrium pressure p3. The V0 can be calculated from the material balance equation

The isothermal adsorption experiment is a progress of gas injection–equilibrium–gas injection. The details of measuring isothermal adsorption curves are as follows: (1) After sample cell void volume measurements, valves 1, 2, 3, 4 are opened and the system is vacuumed for 120 min and then the valves 2 and 4 are closed. (2) Open the valves 3 and 7 to let methane (purity > 99.99%) flow into reference cell, and then close the valves 1 and 7, the reference cell pressure is recorded after equilibrium and the amount of CH4 in the reference cell is calculated in application of gas equation of state


The isothermal desorption experiments operation is the inverse process for the adsorption. The experiment is started from the maximum equilibrium pressure in the adsorption isotherm experiments. The steps are as follows:
Close the valve 2 and open the valve 1 and 5 slowly and then close, release a small amount of methane in the reference cell and record the equilibrium pressure pi−11. Open valve 2 slowly, connect the reference cell and the sample cell for more than 12 h and record the equilibrium pressure Repeating steps (1) and (2) successively reduces experimental pressure to the adsorption isotherms of the initial pressure. Plot the

As evident from the above equations, compressibility factors are required for the pure gases for proper data analysis. We choose the PR equation to calculate the CH4 compression factor (Robinson et al., 1985). For void volume determination, the helium compressibility factor was calculated with an expression based on experimental data from the National Bureau of Standards Technical Note 631 for helium (McCarty, 1972).
Shale permeability measurement method
To make clear gas flow characteristics in shale under low pressure (<5 MPa), the following experiments were carried out (as shown in Figure 6): (1) The shale core plug of 2.5 cm in diameter and 5 cm in length was put into an apparatus as shown schematically in Figure 7; (2) the confining pressure was adjusted to the core holder; (3) open the inlet valves to let gas flow to the core holder; (4) when the pressure and gas flow rate became stable, record the inlet pressure and gas flow rate; (5) increase the inlet pressure and repeat the third and fourth steps. In order to make comparison, both methane and helium gas were used to measure shale permeability. Tight gas sand samples were also tested to make sure the gas adsorption indeed has impaction on shale permeability.
Schematic sketch of a low-pressure shale gas permeability test apparatus. Schematic sketch of high-pressure shale gas permeability test apparatus.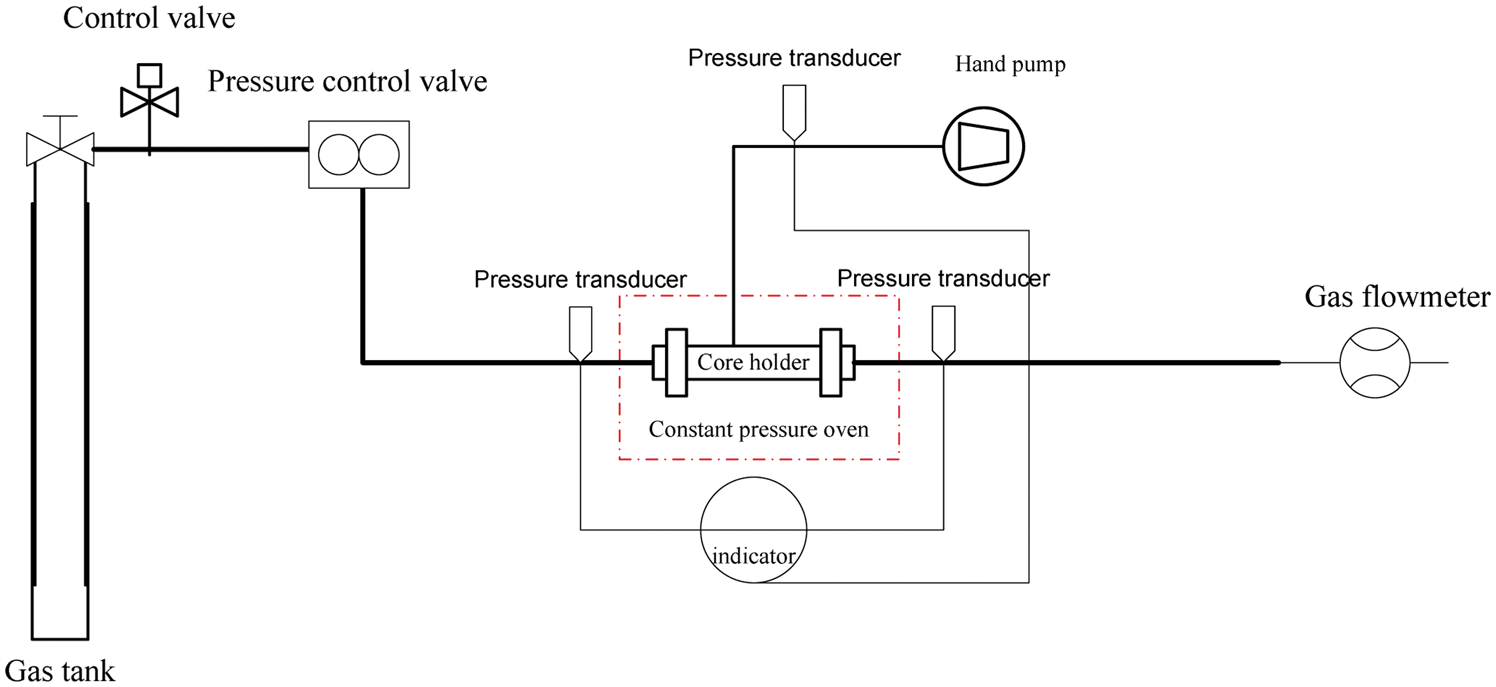
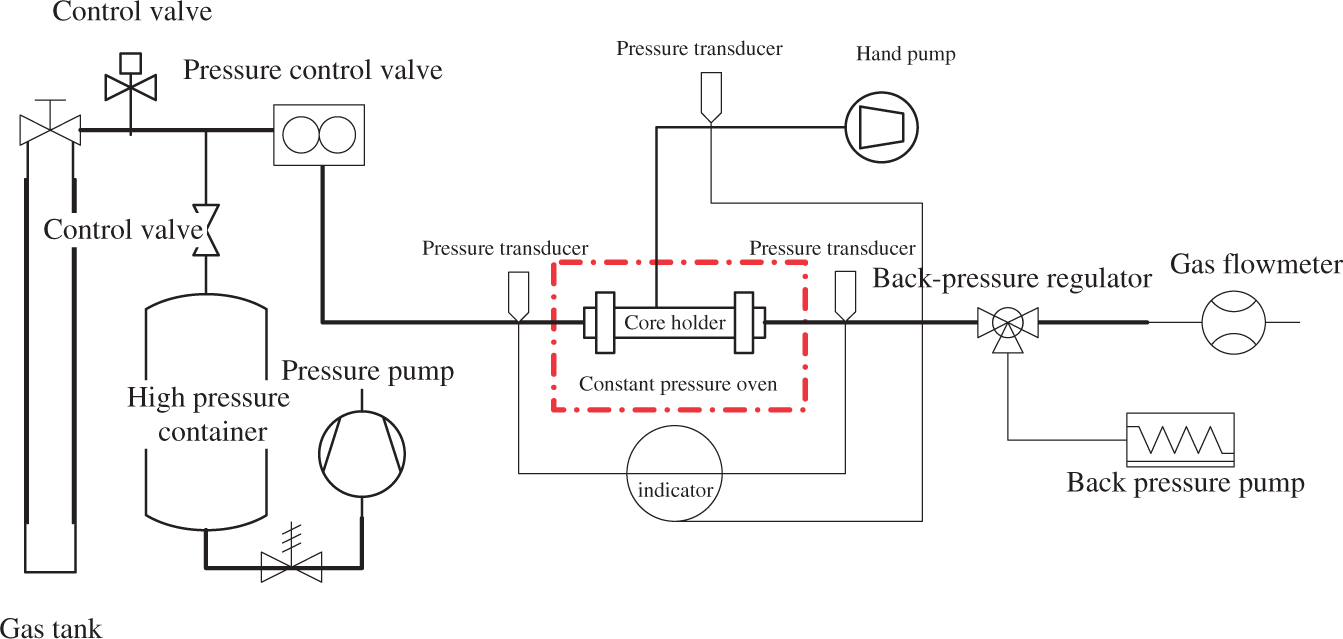
Under high pressure (>5 MPa), both pore pressure and confining pressure can affect shale permeability. Shale permeability decreases with confining pressure increases and increases with pore pressure increases. For this reason, shale stress sensitivity must be considered in high-pressure permeability test. So as to eliminate the interference of slippage effect on the experiment results, back-pressure regulator was fixed in the outlet end of experimental apparatus, as shown in Figure 7. At the same time, in order to eliminate the negative influence of stress sensitivity on shale permeability measurement, inlet pressure and outlet pressure were changed with confining pressure and the differential pressure between confining pressure and average pore pressure was kept in a constant value. Specific experiment processes are as follows: (1) Put core plug into core holder and adjust confining pressure to 20 MPa. (2) Increase the inlet pressure, outlet pressure, and confining pressure simultaneously and maintain confining pressure and differential pressure value of confining pressure and average pore pressure at 20 MPa; keep differential pressure of inlet pressure and outlet pressure a constant value, until inlet pressure reaches 30 MPa. (3) The confining pressure, inlet pressure, outlet pressure, and the gas flow rate are recorded. Once one data point is recorded, the inlet pressure, outlet pressure, and confining pressure are reduced by 2 MPa. While differential pressure, no matter between average pore pressure and confining pressure or between inlet pressure and outlet pressure, remains the same. In addition, the time interval for every data point recording is long enough, so that gas desorption in the rocks achieves equilibrium. The criterion of equilibrium is that gas volume flow rate keeps unchanged. (4) When inlet pressure drops to 2 MPa, back-pressure regulator is removed, then inlet pressure is slowly reduced and the gas flow rate and inlet pressure are recorded. In order to make comparison, both methane and helium gas were used to measure shale permeability under high pressure. Tight gas sand samples were also tested to make sure the gas adsorption indeed has impaction on shale permeability.
Results and discussion
Shale gas adsorption and desorption characteristics
Figure 8 shows the isothermal adsorption and desorption curves of three shale samples.
Isothermal adsorption and desorption curves of shale, the experimental temperature is 318.15 K.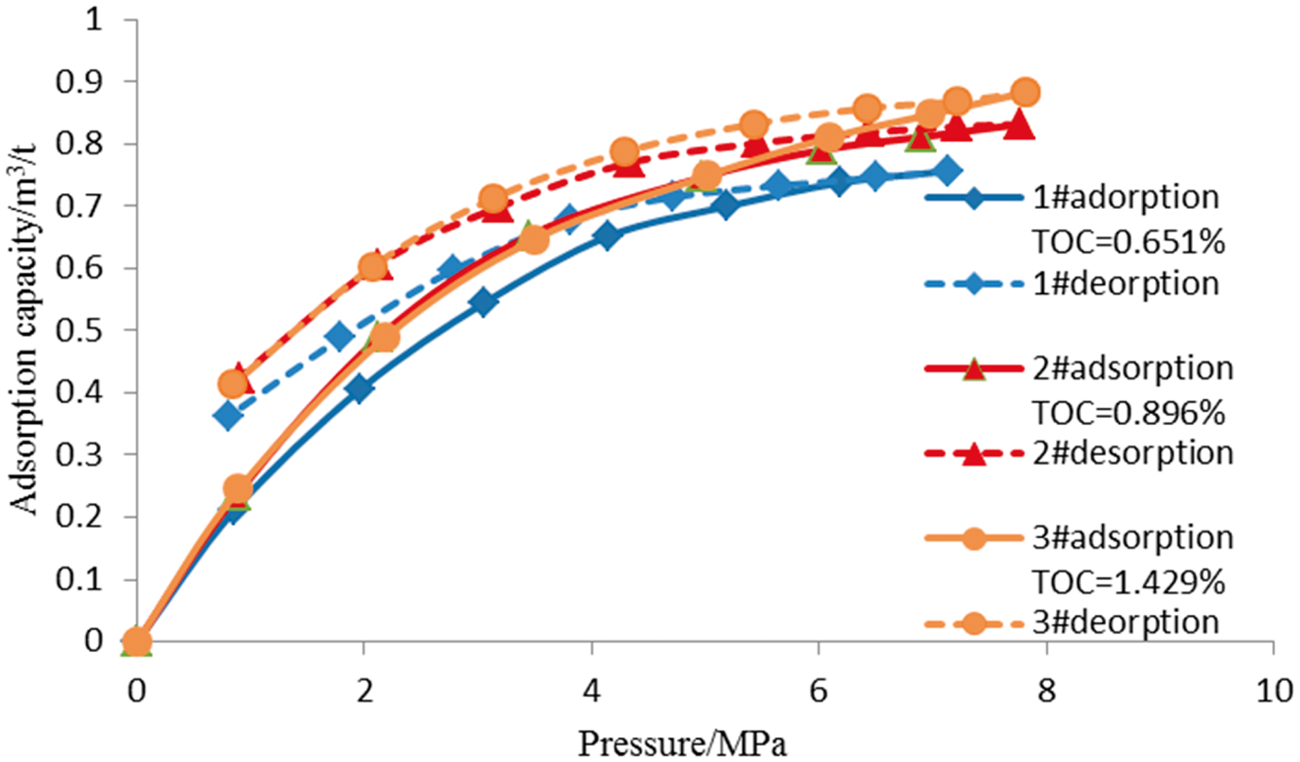
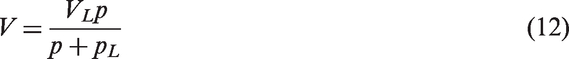
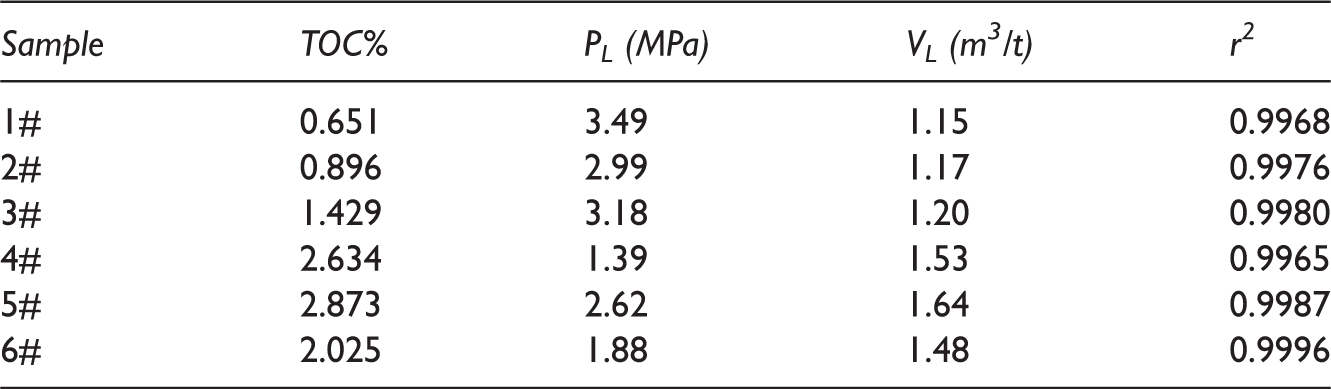
Fitting results of isothermal adsorption curves using Langmuir equation.
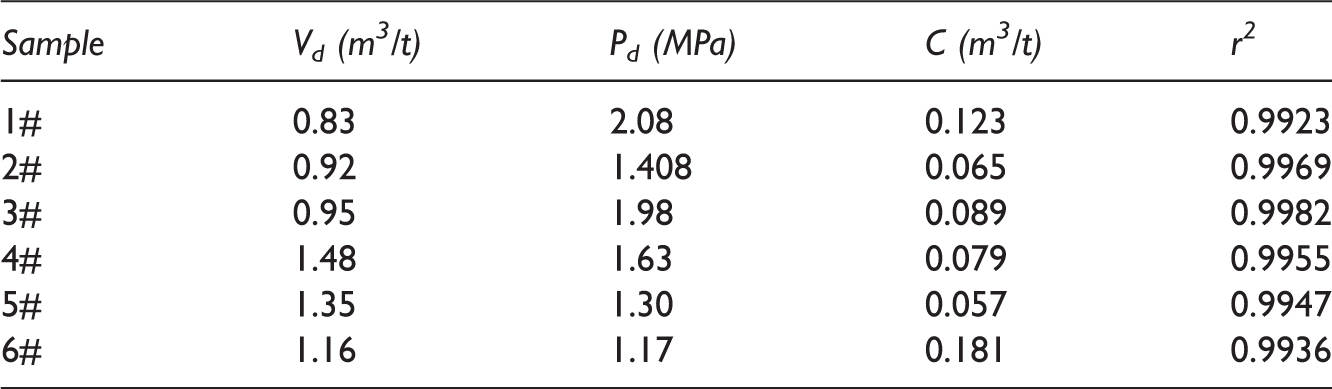
Desorption equation is

Fitting results of isothermal adsorption curves using Langmuir equation.
The impact of adsorption effects on shale permeability under low pressure
In conventional tight gas sandstone, gas slippage effect occurs when gas flows through rocks under the low pressure (Klinkenberg, 1941)

Shale permeability can be calculated with Darcy equation
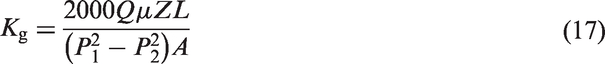
The experiment results of shale permeability under low pressure are demonstrated in Figure 9, with methane as experimental gas. From Figure 9, it is seen that Kg and 1/ Shale permeability as a function of reciprocal of average pore pressure under low pressure with methane as experimental gas. (a) -▪- 4# shale sample and (b) -▪- 5# shale sample. Tight sandstone permeability as a function of reciprocal of average pore pressure under low pressure with methane as experimental gas. (a) -▪- 1# sandstone and (b) -▪- 2# sandstone.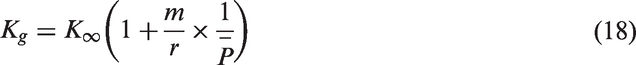
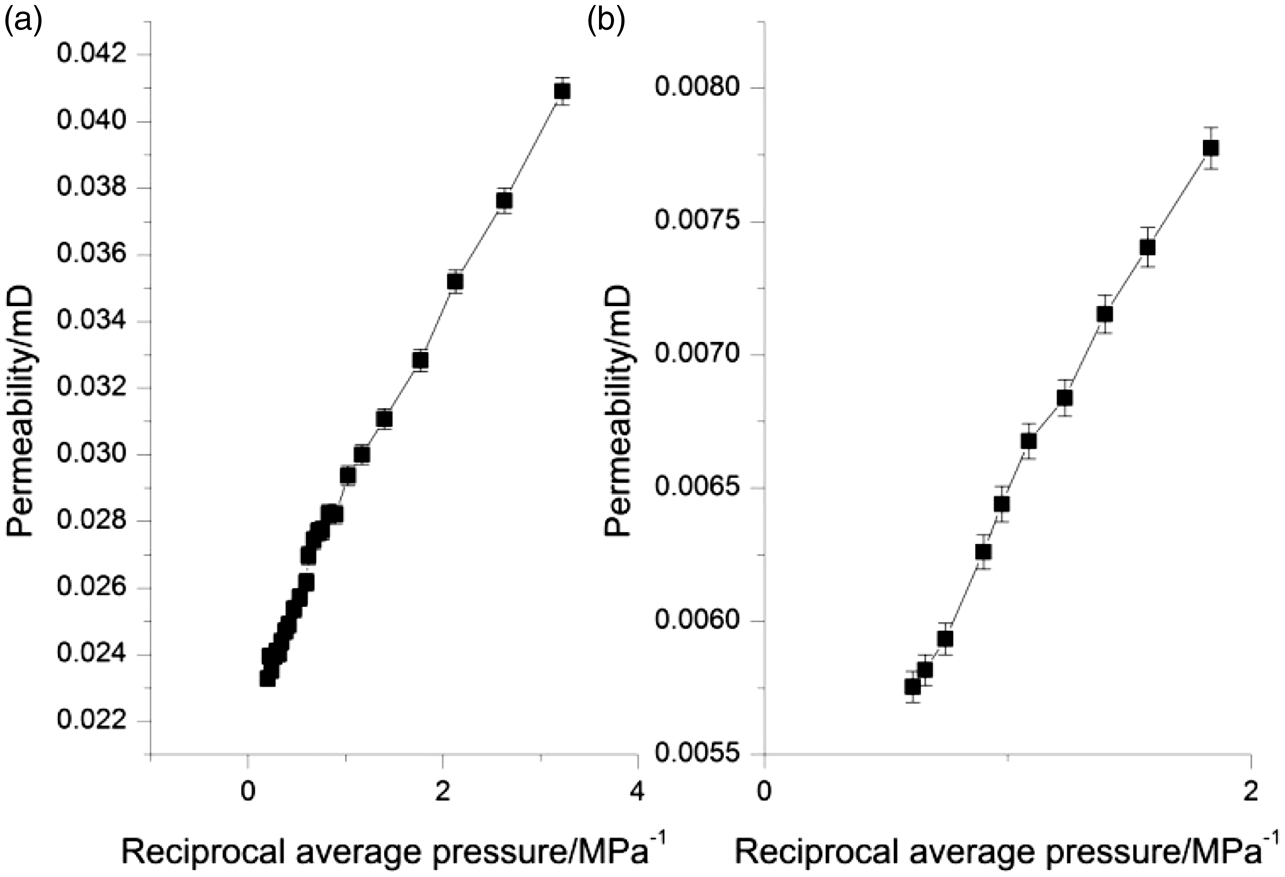
From the equation above, it is found that if T and r are kept at a constant value, Kg is proportional to 1/ Shale permeability as a function of reciprocal of average pore pressure under low pressure with helium as experimental gas. (a) -▪- 4# shale sample and (b) -▪- 5# shale sample.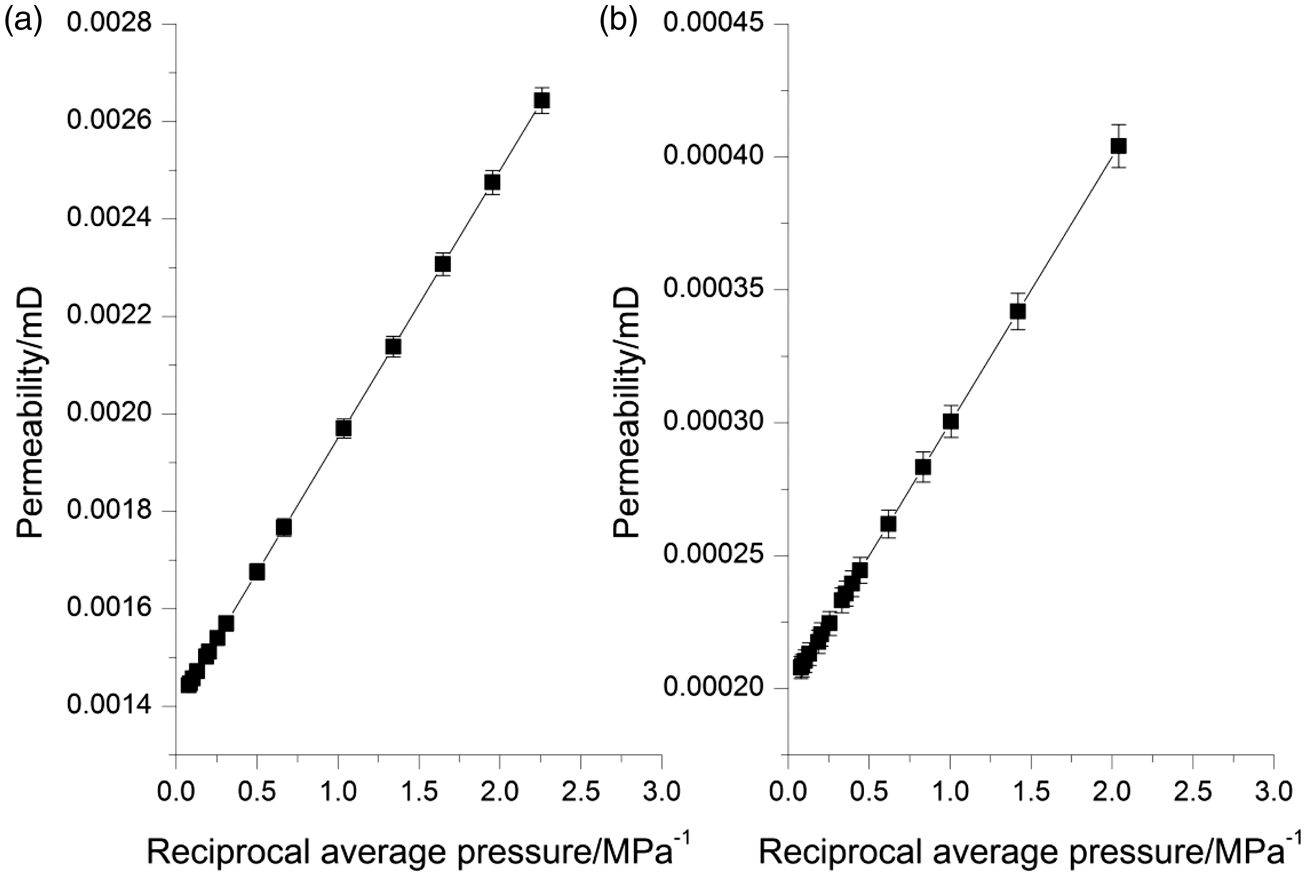
The impact of adsorption effects on shale permeability under high pressure
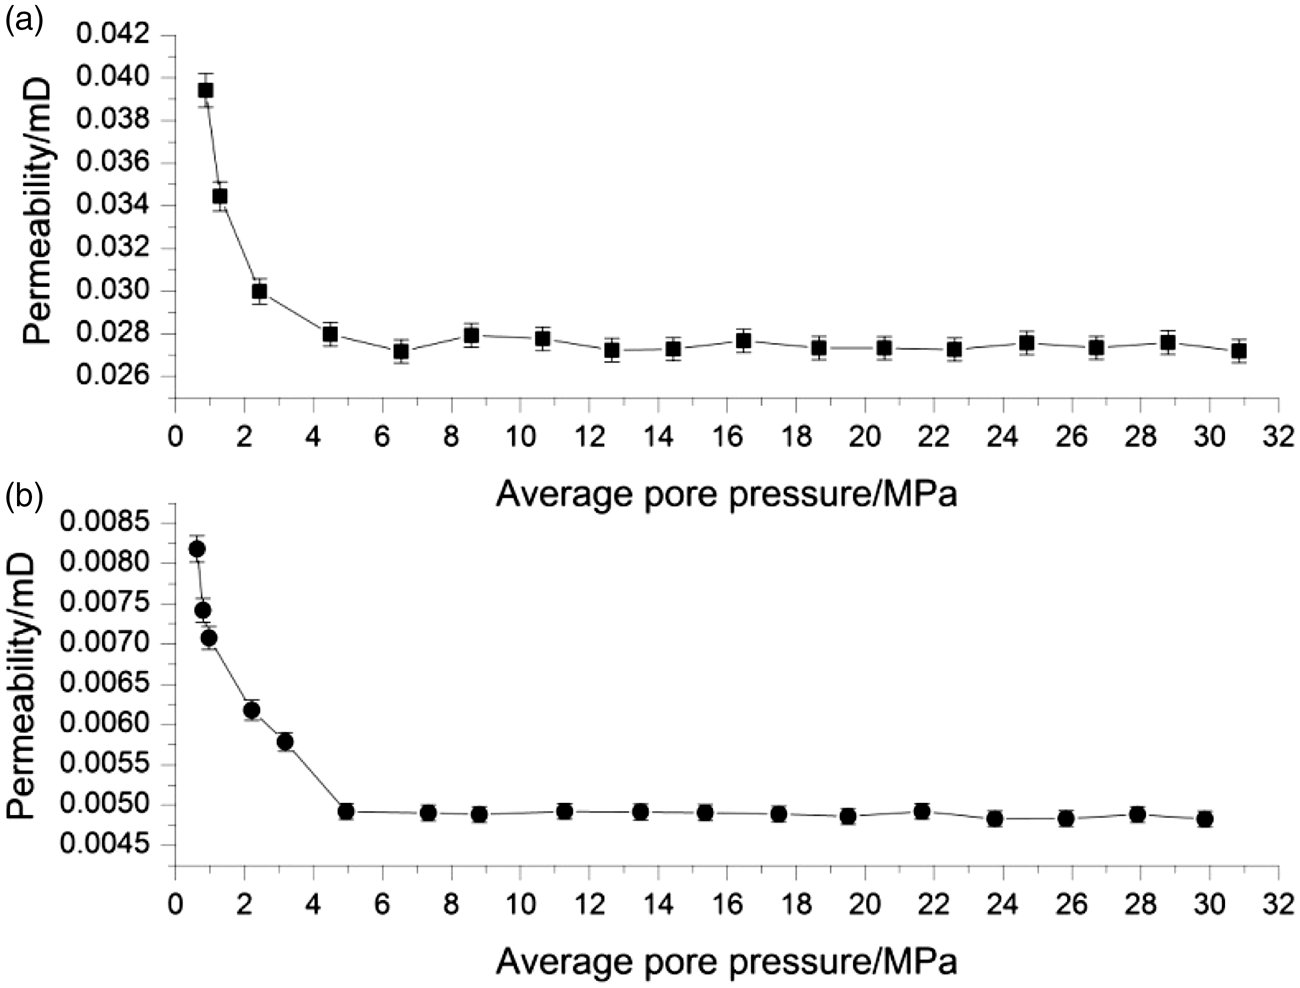
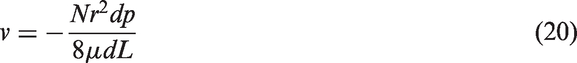
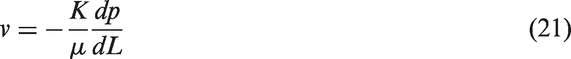
With methane as experimental gas, relationship diagram of shale permeability changes with average pore pressure and isothermal desorption curves are displayed in Figure 12. The desorption curves are calculated with desorption equation when the pressure is above 8 MPa. Figure 13 shows the results of the tight sandstone in the same experimental condition. In contrast, it is easily noted in Figure 12 that when average pore pressure is higher than 10 MPa, the shale permeability keeps a constant value with average pore pressure and confining pressure decreases. However, when average pore pressure is lower than 10 MPa, shale permeability obviously increases with average pore pressure decreases, and when the pore pressure continues to decrease, the permeability keeps increasing. In the corresponding desorption curve, desorption gas increases rapidly with the pressure decreases when the pressure is less than 10 MPa. In Figure 13, when average pore pressure is higher than 4 MPa, there is no apparent change of tight sandstone permeability with average pore pressure decreases. Then, as average pore pressure becomes lower than 4 MPa, sandstone permeability increases as average pore pressure decreases. Such an increase is due to gas slippage effect under low-pressure condition. In Figure 12, the increase of permeability with average pore pressure decreases when average pore pressure is higher than 4 MPa may result from gas desorption effect; while the sharp increase of permeability with average pore pressure when average pore pressure is less than 4 MPa may result from gas slippage effect and gas desorption effect.
Shale permeability as a function of average pore pressure, under high pressure and with methane as experimental gas. (a) 4# shale sample and (b) 5# shale sample. Tight sandstone permeability as a function of average pore pressure, under high pressure and with methane as experimental gas. (a) -▪- 1# sandstone sample and (b) -•- 2# sandstone sample.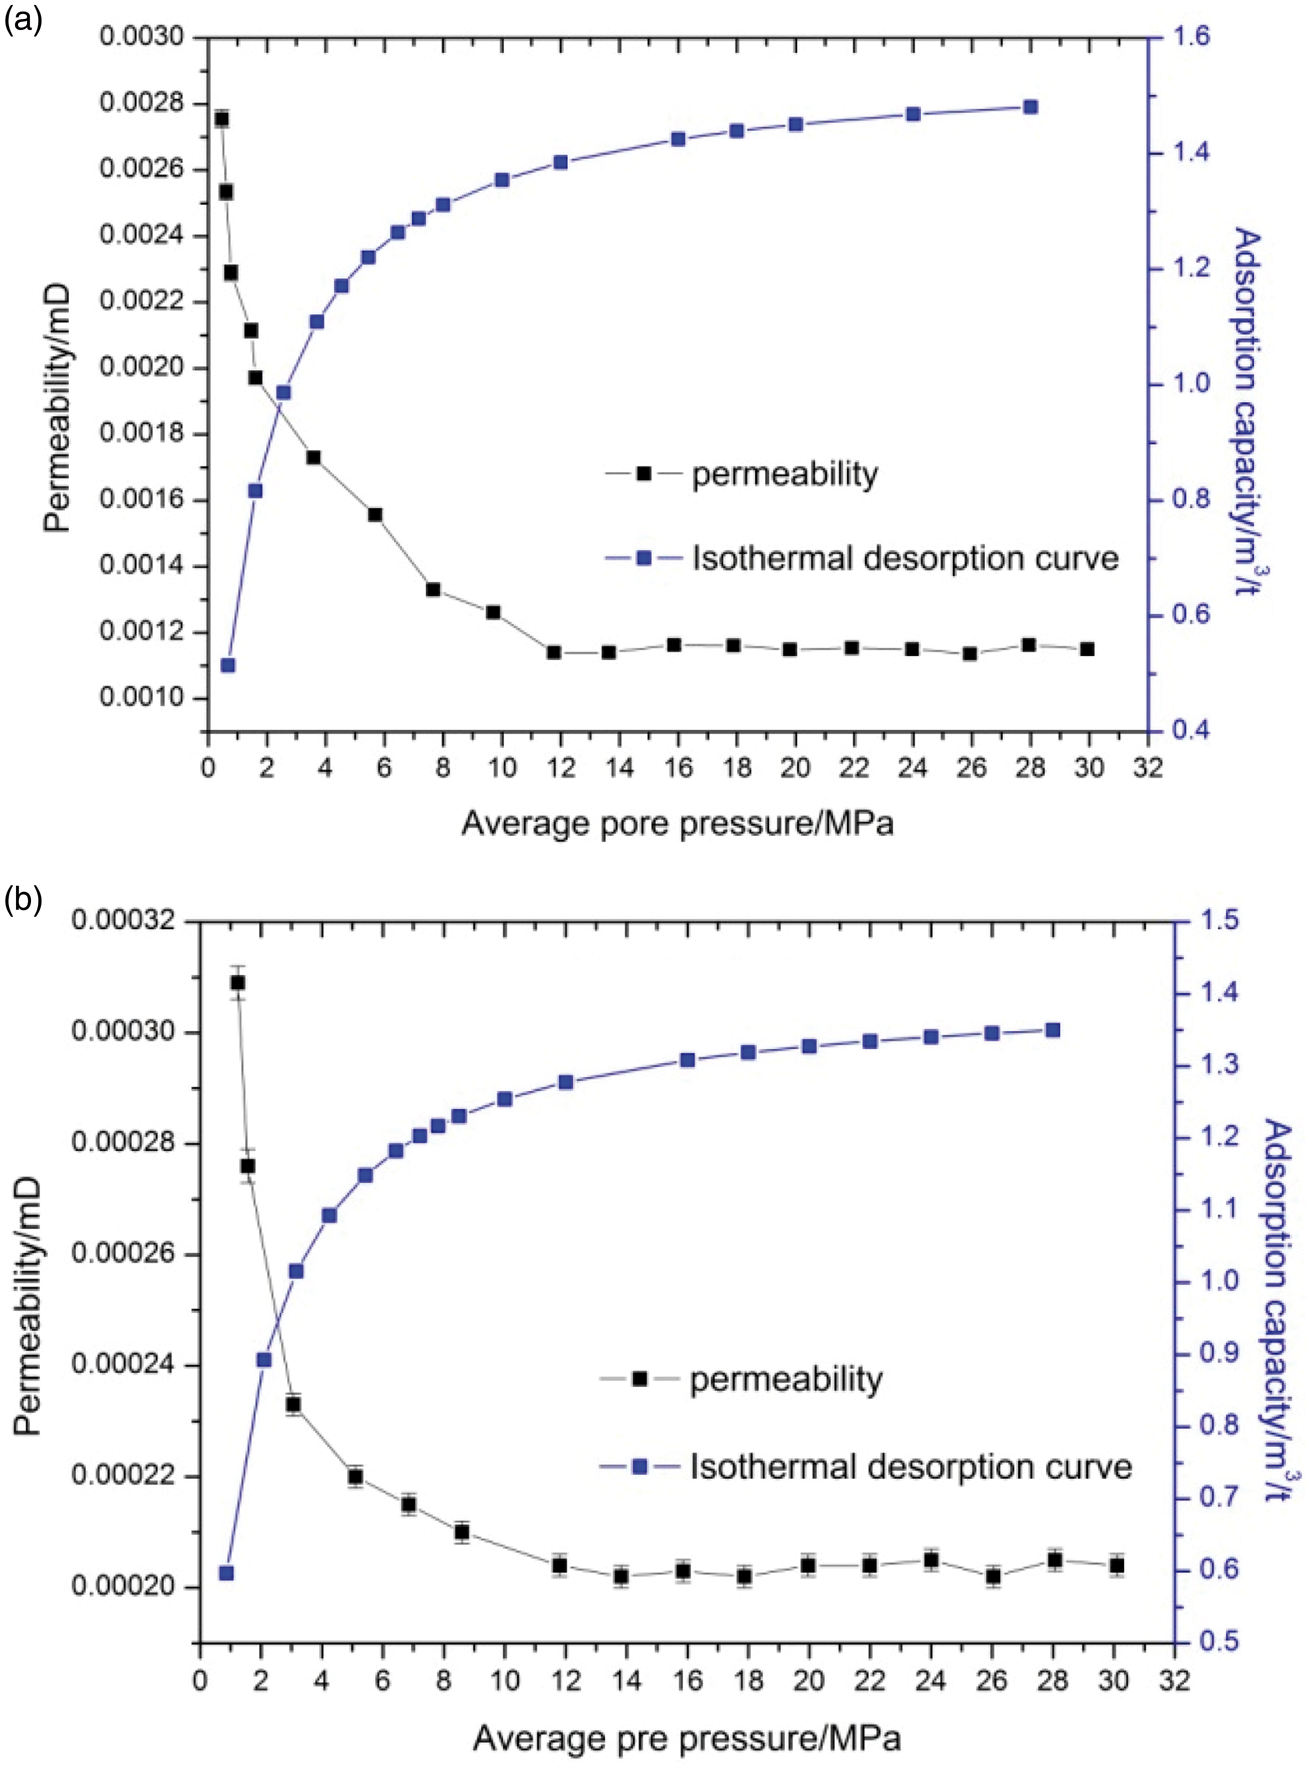
Take the gas flow channel in core plug as a bundle of nanotubes with the same radius, the overall flow rates under high-pressure condition where there is no gas slippage effect can be calculated with Hagen–Poiseuille model
From the equation above, we can see that K0 is directly related to nanotube radius r. When N is a constant, K0 decreases with r decreases and increases with r increases. If gas adsorption effect that affects r exists, the permeability K0 will change with average pore pressure changes. The pore space will increase with gas desorption and organic matter may shrink with adsorbed gas desorption, which leads to the enlargement of pore diameter and thus influences shale permeability.
In order to make sure adsorption effects have influence on permeability, similar experiment is conducted with helium. Figure 14 demonstrates the results. It is easy to observe that the permeability of shale as a function of average pore pressure agrees well with that of tight gas sandstone, which indicates that adsorption effects affect shale permeability. Besides, the permeability of helium is bigger than that of methane, the reason is that the molecular diameter of helium is smaller than that of methane and the helium molecule can pass through much smaller nanopores.
Shale permeability as a function of average pore pressure, under high pressure and with helium as experimental gas. (a) -▪- 3# shale sample and (b) -•- 5# shale sample.
Conclusions
Through the above series of experiments, the following conclusions are obtained. Isothermal adsorption and desorption curves of shale gas are not coincident and the desorption curve is in hysteresis. Langmuir equation can be used to calculate the shale isothermal adsorption curve and desorption equation can be used to calculate the shale gas isothermal desorption curve. Under low pressure and with methane as experiment gas, adsorption effect has impact on shale permeability, which renders shale permeability and the reciprocal of average pore pressure not in a linear relationship. Under high pressure, desorption effect has impact on shale permeability resulting in the shale permeability increases along with gas desorption. Gas desorption effects should be taken into consideration in the shale gas development.
Footnotes
Declaration of conflicting interests
The author(s) declared no potential conflicts of interest with respect to the research, authorship, and/or publication of this article.
Funding
The author(s) disclosed receipt of the following financial support for the research, authorship, and/or publication of this article: This research was funded by National Science and Technology Major Project(2016ZX05037).