
Abstract
The recent decade witnessed both steep ascending and descending trends in global oil prices. As a main energy resource, oil has been playing a substantial role in contemporary world’s economics. Hence, analyzing and understanding short- to long-term dynamics of oil prices is still one of challenging issues in the global economic- and energy-related debate topics. Although the literature is full of significant analytical studies that focus on particular issues related to the real oil prices, less can be found that integrates various factors affecting its dynamics. An integrated model, in which focal variables are included in main building blocks are illustrated with their interrelationships, helps policy makers to better understand the system. In this article, using a systems approach, a conceptual framework is developed to demonstrate various (economic and financial, technological, political, demographic, and industrial) factors that impact on the dynamics of the futures and spot prices with their interrelations. It is shown that unilateral (and univariate) analyzes is not sufficient in oil market dynamics analysis and systems approach should be applied. To do so, a subsystems diagram is developed based on literature review and analysis of oil market statistics. To validate the framework, windowed correlation analysis, Granger causality test, and regression analysis are utilized. Accordingly, a causal loop diagram is developed to describe interrelationships between main variables making the dynamics of oil prices. The framework provides practitioners with a foundation to conduct different related analyses. A quantified system dynamics model can be built based on this framework to simulate the market behavior and predict probable future trends and fluctuations.
Keywords
Introduction
Oil price is still the most important factor affecting world’s economic growth, industrial development, inflation and interest rate, food price, poverty, and other socio-economic variables, besides its dynamics is the main index demonstrating oil market circumstances (Álvarez et al., 2011; Jiménez-Rodríguez, 2008; Naranpanawa and Bandara, 2012; Narayan et al., 2014).
World’s oil market witnessed considerable and continuous oil price increments but a deep decrease during the end of 2014; oil price analysis is one of the most challenging energy related issues. There exist multiple factors influencing oil price dynamics, which makes oil market analysis so complicated whereas this complexity is increasing continuously (Huntington et al., 2012). Among those factors, the following ones are intensifying complexity of oil price analysis: changes in supply and demand side strategies, level of oil proved reserves, demand of oil substitutes, policies for oil strategic reserving, efficiency of transportation and industrial appliances, rate of economic growth in emerging and developed economies, financial market circumstances, and international political challenges. Consequently, numerous researchers tried to understand and investigate consequences of different factors on oil price dynamics as the main index of global energy market.
One research area focused on supply and demand side strategies in the market. A theoretical framework is developed based on the intersection of supply and demand curves and it is used to explain the reason of high level and oscillatory behavior of oil price (Stevens, 1995). Another research used the theory of exhaustible resources to estimate the equilibrium point of oil price and showed that oil price changes between 1974 and 1980 occurred as a response to supply-side changes (Roumasset et al., 1983). As well, it is argued that two co-integration relations are effective in oil price dynamics; the first one is Organization of the Petroleum Exporting Countries (OPEC) behavior based on its market power and the second one is the coverage rate of Organisation for Economic Co-operation and Development (OECD)- expected future demand using inventory behaviors (Chevillon and Rifflart, 2009). OPEC’s behavior analysis is done through an event analytical method based on available information about the future of global oil price in the market. Results are representative of the fact that there is no significant differences between the information and knowledge level of OPEC and Non-OPEC countries on oil price expectations (Lin and Tamvakis, 2010). One more research, using econometrics methods, investigated impact of OPEC announcements on expectation and volatility of daily oil price changes (Schmidbauer and Rösch, 2012). Moreover, the lifecycle of oil basins in supply side countries and significant suppliers’ production peak should be considered (Hosseini et al., 2014). Furthermore, the main reason of recent deep oil decreases could be found in supply side of the market wherein oil supply has not reacted to demand levels. On one side, main exporting countries tried to drive out rival producers (both new conventional and unconventional small but promising producers), and on the other hand, minor OPEC members and Non-OPEC producers tried to maintain and even increase, if possible, their market share through an oil export competition.
Another research area focused on relationships between oil prices and refineries’ performance (capacity production, demand, etc.). As an instance, it is showed that refinery sector had a significant role on oil price increases between 2004 and 2006 (Kaufmann et al., 2008).
The next category of literature is about effects of financial markets. The relationship between spot and futures prices is investigated for a monthly time period of 1990 to 1991 in United Kingdom and United States (Foster, 1996). In another research, the market’s data between 1990 and 2008 is applied to compare the capability of futures and spot prices in oil price discovery (Caporale et al., 2014). Moreover, it is tried to measure the effect of futures market on price discovery in spot market for crude oil benchmarks and the influence of changes in financial markets on oil futures market is investigated (Silvério and Szklo, 2012).
In the field of oil strategic storage (speculation), it is showed that there is a significant relationship between daily oil price oscillations and the level of oil strategic reserves (Cifarelli and Paladino, 2010).
Some researches focused on the response of oil substitutes demand to oil price changes. As an instance, using an econometrics approach, the relationship among alternative energy stock prices with technology stock prices, oil prices, and interest rates is analyzed and indicated that a shock in technology stock prices will result in a higher shock in alternative energy stock prices that have shocks on oil price (Henriques and Sadorsky, 2008).
In other researches in which some different factors have been investigated together, a research, using Vector Error Correction Model (VECM) and Directed Acyclic Graph (DAG), discussed the role of different factors on oil price dynamics including, near-term supply and demand, oil strategic reserves, exchange rate, commodity market, stock market, oil market, and US dollar index (Ji, 2012). Another research used Path Analysis and BVAR-TVP (Time varying parameter) model and concluded that followings with specific time-lags are influencing on oil price dynamics: changes in supply, level of oil reserves, oil consumption, and US dollar index (Chai et al., 2011). Moreover, the relationship between tanker freight rates and oil prices, using correlation coefficients and other tools, is investigated and showed that tanker freight rates and oil prices have high levels of correlation in medium to long term (Sun et al., 2014).
Although some of the aforementioned researches tried to investigate the dynamics of oil price in the global market more systematically (using vector regression), they almost ignored the structure and framework through which different factors are interrelating and used methods which are just based on the systems data; therefore, they do not have sufficient efficacy to model future trend of global oil price. However, systems approach focuses on the structure which makes the dynamics in a phenomenon and after showing this structure in a format of causal loop diagram, conducts quantitative analysis and validation consequently (Senge, 1997; Sterman, 2000). Furthermore, there exist different factors in form of a loop, which have considerable effect on oil price changes; these loops could not be modeled by unilateral relationships, instead, oil price dynamics should be considered in feedback structure over time, which considers various multilateral cause and effect relationships together.
In this regard, some researches applied systems approach to analyze oil market. Based on an expert panel, a conceptual framework developed to investigate OPEC’s power and stability, oil price dynamics, and investment opportunity of Non-OPEC countries. In this model, effects of market situation (based on practitioner’s decisions in the market) on producers’ decisions are studied however focus of the framework is on supply side of the market and other sectors were not studied completely (Morecroft and van der Heijden, 1992). Another research, critiquing behavioral simulation modeling approaches in related literature, which almost had modeled the supply side based on target capacity utilization, used a bottom-up approach to model demand endogenously although the model is too concise and suffers from several simplifications (i.e. an exogenous oil production rate) (Greenman, 1994). Regarding oscillatory behavior of oil price, a dynamic hypothesis (based on infrastructure development policies of oil importing and exporting countries) is developed and validated to investigate causes of the oscillations through a system dynamics modeling approach (Mashayekhi, 1998, 2001). Another research discussed effects of energy sector policies based on global economy’s trend, oil demand, oil substitutes, new oil discoveries, oil supply, and oil price (Samii and Teekasap, 2010).
Structure of literature review.
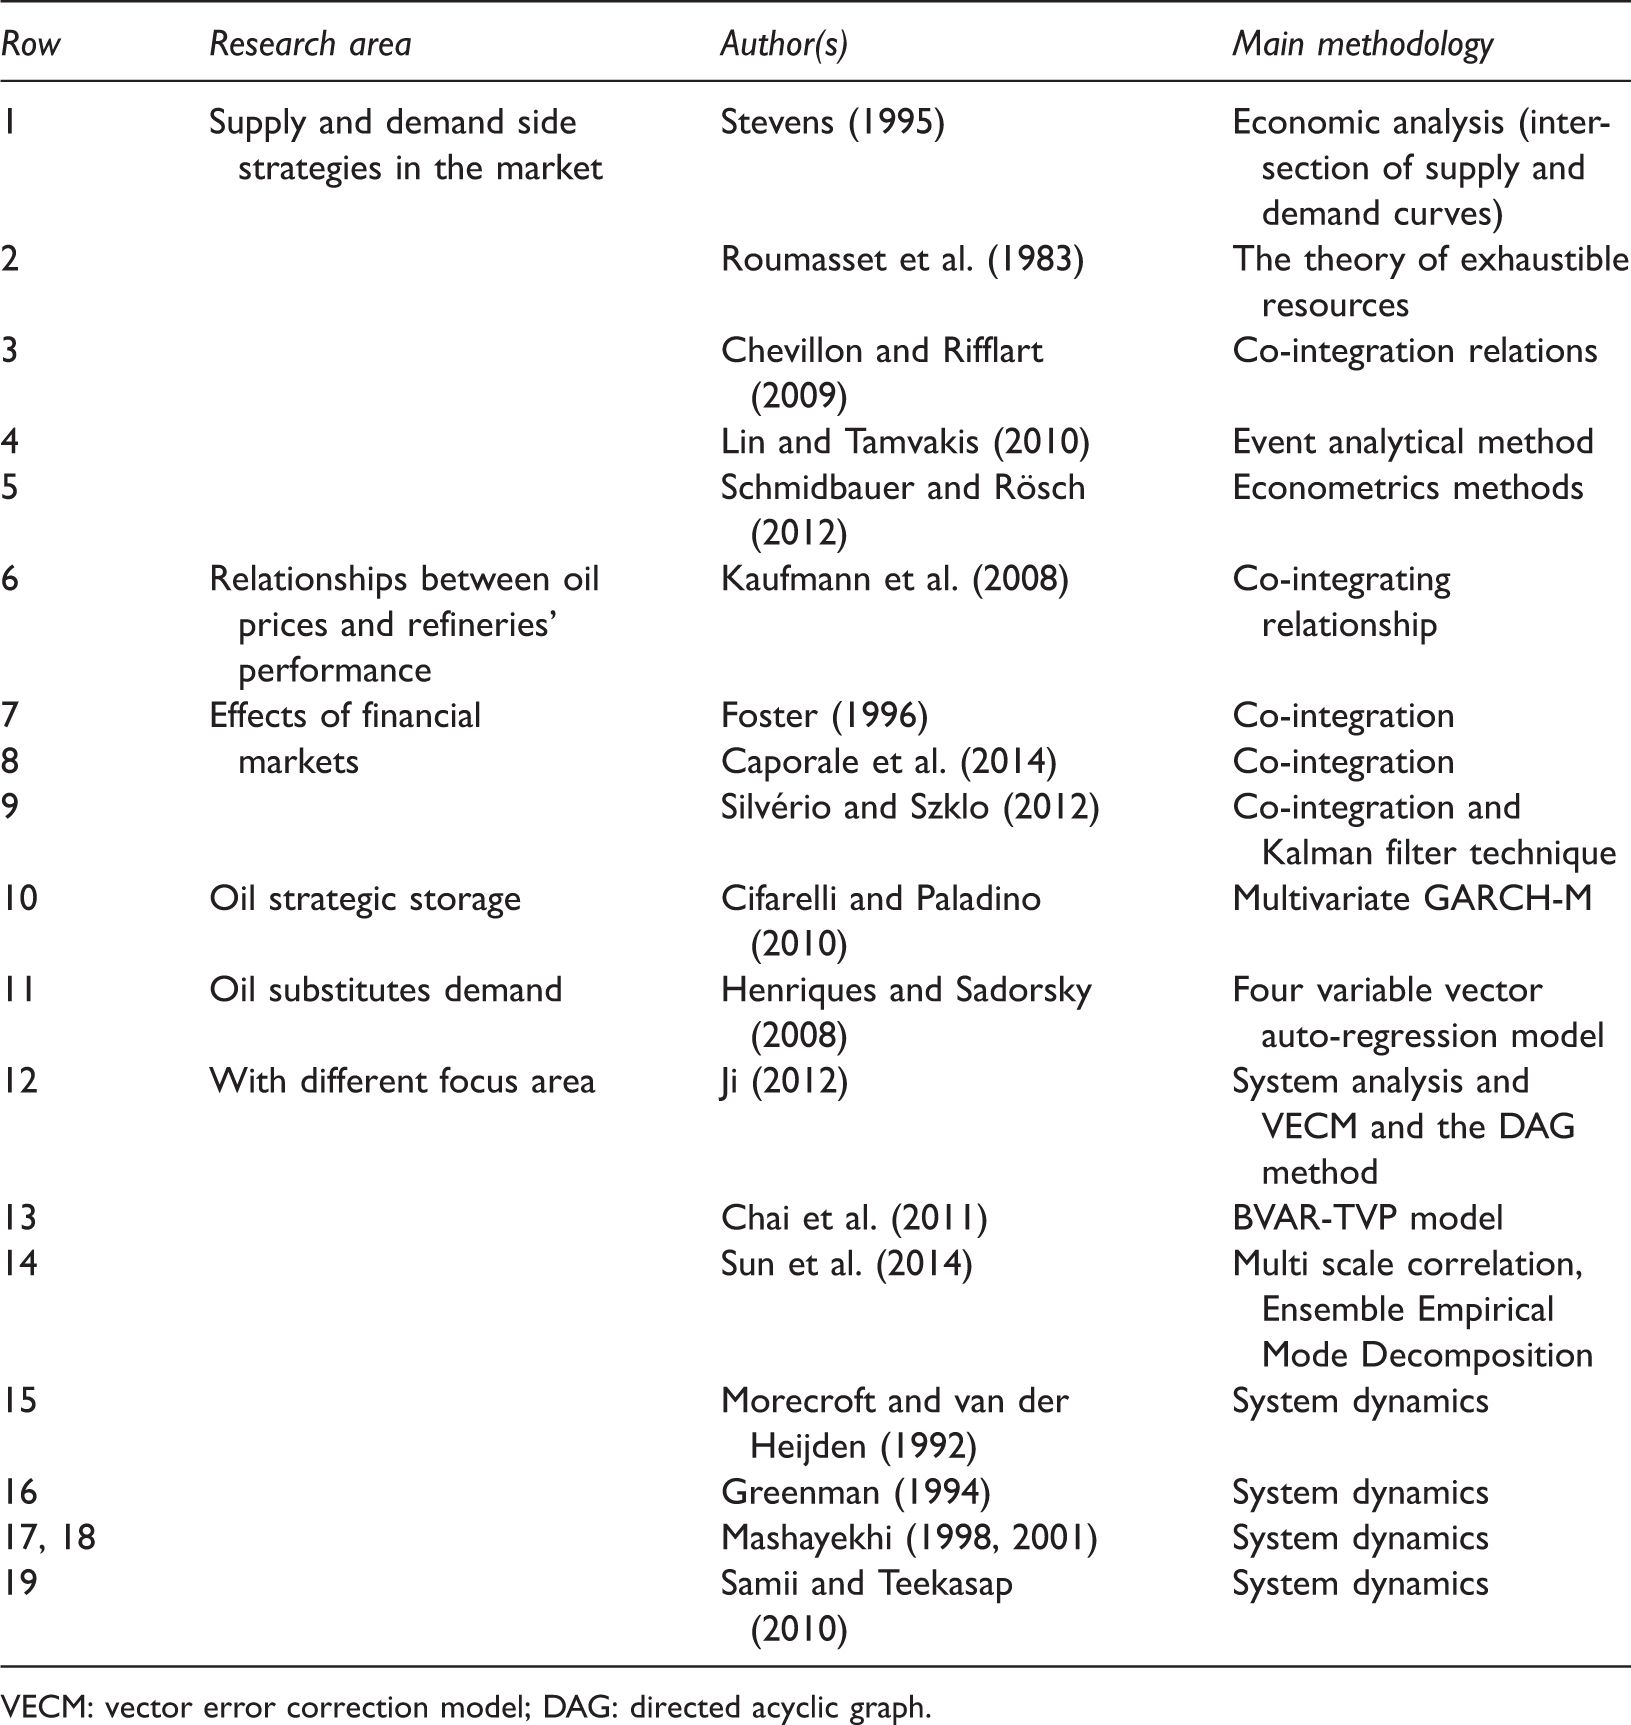
VECM: vector error correction model; DAG: directed acyclic graph.
In all, the researches with econometrics and statistical approaches almost consider limited relationships, which do not present an integrated view of the system’s structure in which oil price dynamics is being formed. Furthermore, researches with systems approach have not developed a comprehensive framework consisting all influencing subsystems in oil price dynamics analysis; meanwhile, oil market dynamics analysis needs such a comprehensive framework (Fattouh, 2007) upon which further researches could be conducted more systematically. In this research, after an illustration of affecting factors on oil price dynamics through statistical tools, a subsystem diagram is developed and finally the detailed causal structure of interrelationships among main variables are explained in a causal loop diagram format.
The structure of the article is as follows: The next section describes research methodology and different techniques and tools used in this study. “Building blocks of oil price dynamics” section explains the dynamic hypothesis in building blocks of oil market and uses different tools (i.e. drawing trajectory of variables and their differences, Granger causality test, windowed correlation analysis, regression analysis, etc.) to validate the developed hypothesis. Consequently, a subsystem diagram is developed in “The generic conceptual framework of oil price dynamics (a subsystems diagram)” section, which clarifies the macro relationships shaping oil price dynamics. Finally, the last section explains detailed causal loops which interrelate different identified variables and makes structure of the system in which oil price dynamics occurs.
Methodology 1
Figure 1 shows research process in this article. At the first step, as reviewed in the previous section, related literature should be surveyed briefly in order that affecting factors on oil market dynamics be determined. In the next step, it is necessary to analyze market data
2
(about identified variables) to shape a dynamic hypothesis by which oil price dynamics could be explained. Herein, following supportive analysis should be performed:
Drawing and scrutinizing trajectory of main variables (and their difference values) versus oil price (and its difference values) in a multi-variable analysis format (Shone, 2002) Calculating and drawing windowed correlation (Boker et al., 2002) among variables with mentioned relationship Research steps and tools.
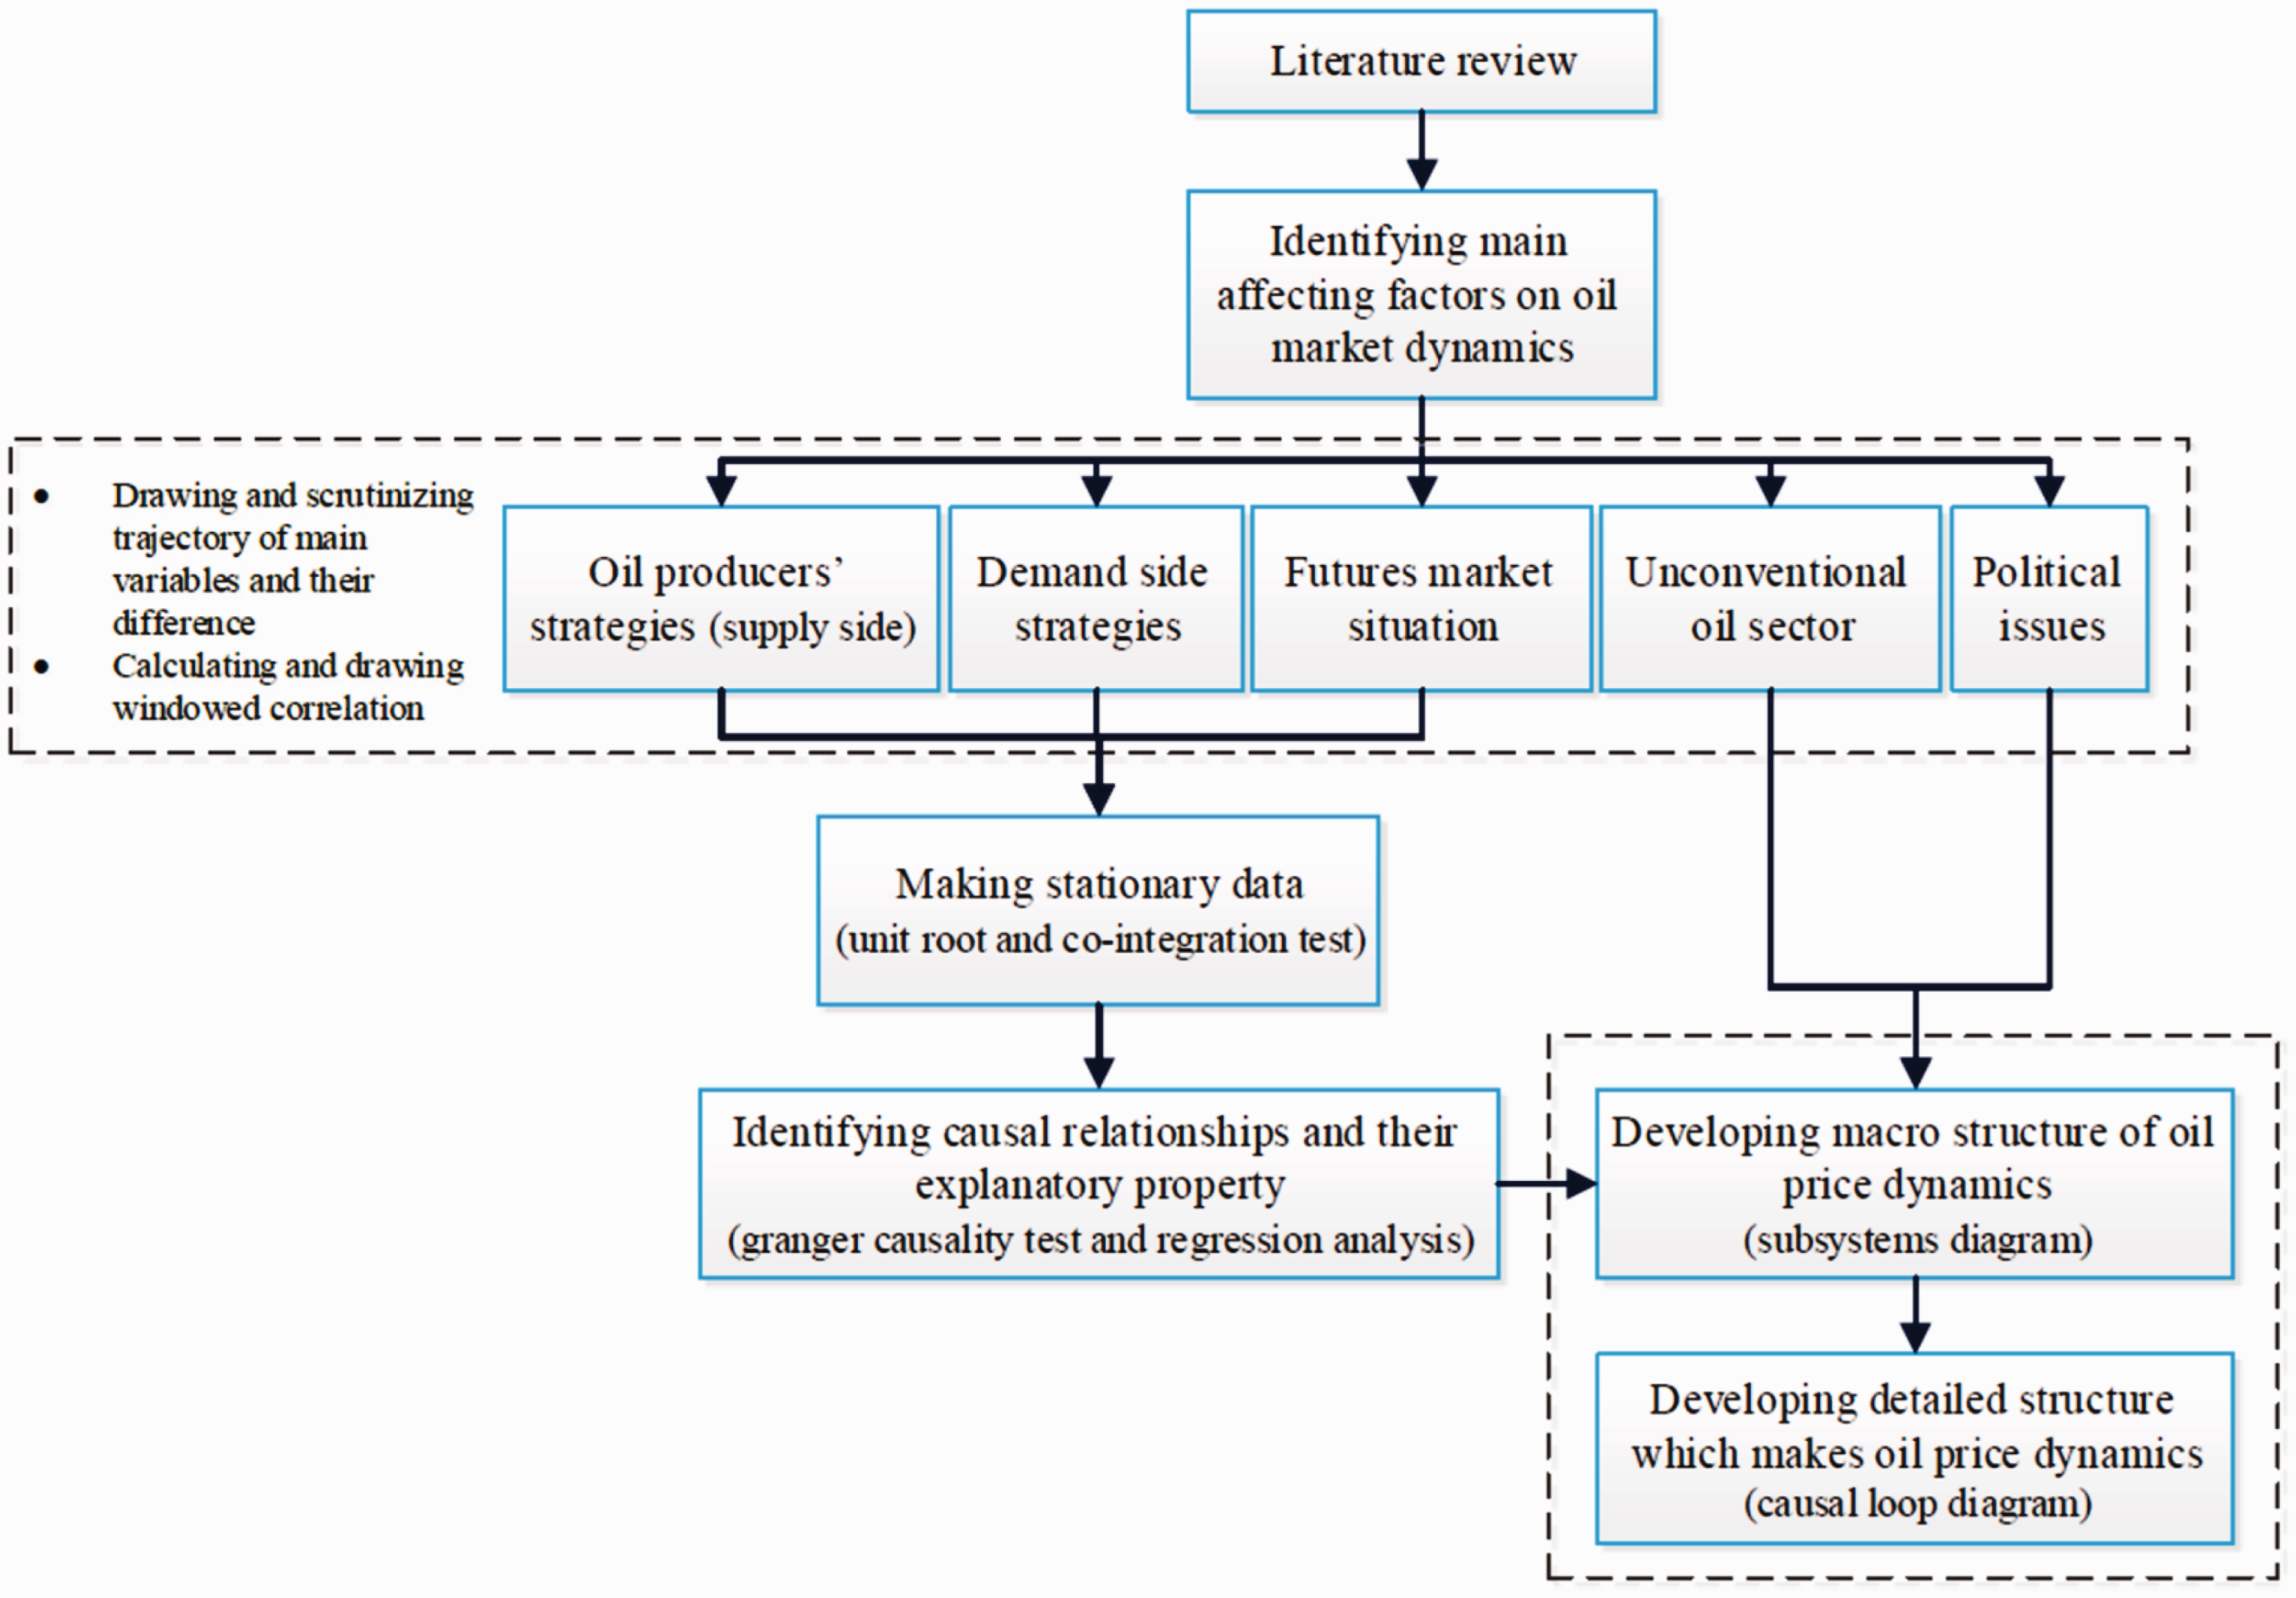
At this step, some hypothesis about oil price dynamics could be formulated although to validate it, more statistical analysis based on the gathered data is required; therefore, following activities and analysis should be done:
Testing stationarity of data and making data series stationary
3
(unit root and co-integration test (Ross, 2005)) Evaluating statistical causality between variable with different time lags (granger causality test (Tsay, 2005)) Evaluating explanatory property of identified causal relationships through regression analysis (Ross, 2005)
It should be mentioned that unconventional oil data (due to lack of adequate data) and political issues (being too qualitative) could not be involved in the above analysis.
The next two steps are to develop an integrated comprehensive framework using systems approach tools: subsystems diagram and causal loop diagram (Sterman, 2000).
Building blocks of oil price dynamics
In a general viewpoint, affecting factors on oil market dynamics could be categorized as follows:
Fundamental factors: These factors have long-term impact on market dynamics, which determines overall oil price trend, including oil supply and demand volume, volume and price of futures contracts, producer’s spare capacity, level of oil strategic reserves, rate of oil substitution (with coal, nuclear, renewables, unconventional oil, etc.), technological progress in oil discovery and recovery, etc. (Derakhshan, 2004). Technical factors: These factors have short-term impact on market dynamics, which includes capacity of oil and oil-product storage in demand side (refineries and governmentally owned facilities), capacity of oil containers and tankers, other facility’s limitations, etc. (Lorié, 2013). Political factors: These have short- to medium-term impact on market dynamics, including sanctions, wars, terrorist attacks to industry’s infrastructure, etc. (British Petrolum (BP), 2013a).
In fundamental factors, the demand side, regarding supply, oil price, and its economic situation, implements different short- to long-term reciprocal strategies especially oil substitution, energy intensity controls, and even temporary downturn in economic activities (Aldunate and Casassus, 2012; Aleklett, 2007; Cooper, 2005; International Energy Agency (IEA), 2008). On the other hand, it should be highlighted that some demand-side countries are Non-OPEC oil producers, determine their supply with regard to their demand and oil market’s situation. Meanwhile, oil spare capacity (in OPEC and Non-OPEC countries), oil strategic reserves in demand-side countries, and refineries storage level of oil are of high importance since they could damp or intensify market’s short-term oscillations (Andrews and Pirog, 2012; Bhanushali and Neema, 2007; Energy Security Partners LLC., 2013; Leiby et al., 2000; Morse, 2009; Singleton, 2013).
Another important factor is development rate of unconventional oil discovery and exploitation, which have considerable relative resources in the world in comparison with conventional oil resources (Kuuskraa et al., 2013). Besides, the main share of world’s unconventional oil resources is in demand-side countries especially in United States and China; in this regard, United Sates has implemented thorough development programs, which gradually affect its oil import rate as one of the largest oil consumers in the world (Maugeri, 2012).
It seems that if average oil price remains at a specific threshold, with the growth in futures market contracts and economically development in unconventional oil exploitation, OPEC power in the market will be weaken or even lost. On the other side, it should be noted that intentional decreases in oil price to put limitations on unconventional oil development is in contrast with utility of OPEC’s oil dependent economies (Brammer and Reuter, 2009; Morriss and Meiners, 2012). Furthermore, passing time, technological progress in unconventional oil and learning phenomenon would result in an economic competitive unconventional oil production which will control price manipulation power of OPEC (Brammer and Reuter, 2009).
In the following, a summarized and explanatory investigation of oil market dynamics is explained in four sections, namely, oil producers’ strategies, oil consumers’ strategies, unconventional oil development, financial market dynamics, and political issues.
Oil producers’ strategies
As a main supplier with 81 percent of world’s conventional oil reserves and 43 percent of world’s crude oil production, OPEC still plays a major role in the oil market (OPEC, 2012). OPEC's long-term strategy is to supply oil for market in a sustainable manner so that oil prices remain fair and stable to secure a regular supply for consumers and enhance the role of oil in meeting future energy demand, seeking to secure and enhance the collective interests of member countries (OPEC, 2010). Besides, whenever OPEC reduces oil supply to increase oil price, ceteris paribus, Non-OPEC will increase their supply to setback OPEC’s strategy (Aguiar-Conraria and Wen, 2012; Gately, 2011; Kohl, 2002).
OPEC’s spare capacity is also important since while spare capacity is tighten and economic condition is improving, oil price would ascend with more acceleration (Energy Security Partners LLC., 2013).
To conclude, it seems that the following items affect oil production rate of OPEC and Non-OPEC:
Oil production rate of OPEC and Non-OPEC (Y) OPEC’s spare capacity (SC) World’s Gross Domestic Production (GDP) World’s proved reserves of oil (PR) Oil real price (P) OECD’s strategic oil reserves (SR)
Following sections “Unit root test on data,” “Granger causality tests for hypothetical causal relationships,” and “Regression analysis of oil production” tried to investigate above proposition statistically to conclude up with a reliable statement about effective factors on oil producers’ strategies in oil market.
Unit root test 4 on data
Unit root test results for first-order difference of data.
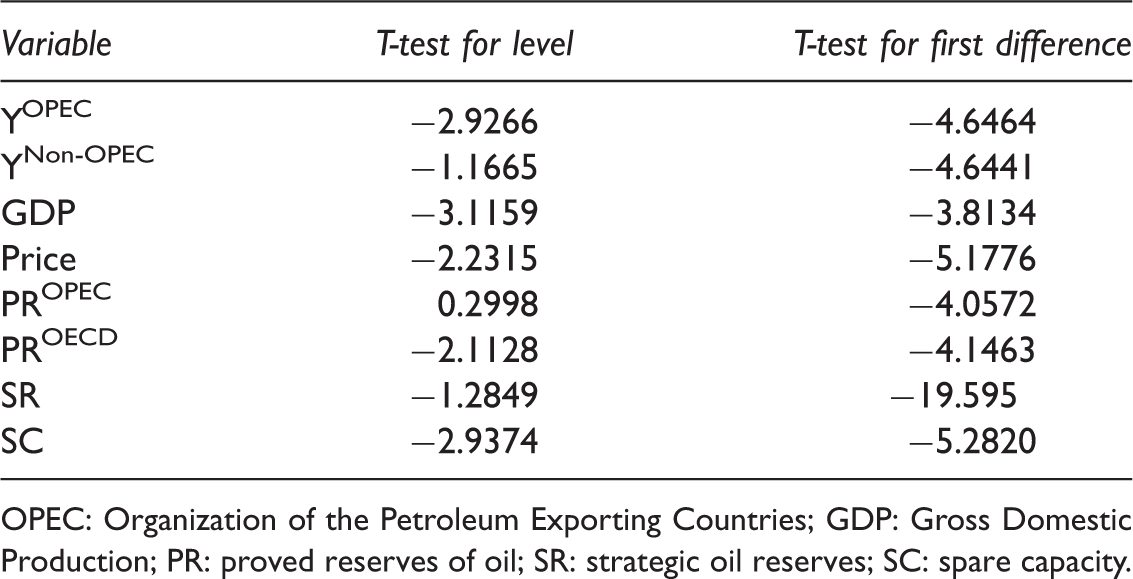
OPEC: Organization of the Petroleum Exporting Countries; GDP: Gross Domestic Production; PR: proved reserves of oil; SR: strategic oil reserves; SC: spare capacity.
Therefore, the first-order difference of data is used for Granger causality test and regression analysis consequently. 5
Granger causality tests for hypothetical causal relationships. 6
Based on the identified hypothetical causal relationships, Table 6 7 shows the statistical causality test for the variables mentioned above and determines significant causal relationships.
Results imply that there exists a mutual relationship among OPEC, Non-OPEC oil production rates, and other variables (especially among independent variables affecting OPEC and Non-OPEC production rate), which are disregarded in Table 6 and should be considered in the final integrated framework.
Regression analysis of oil production
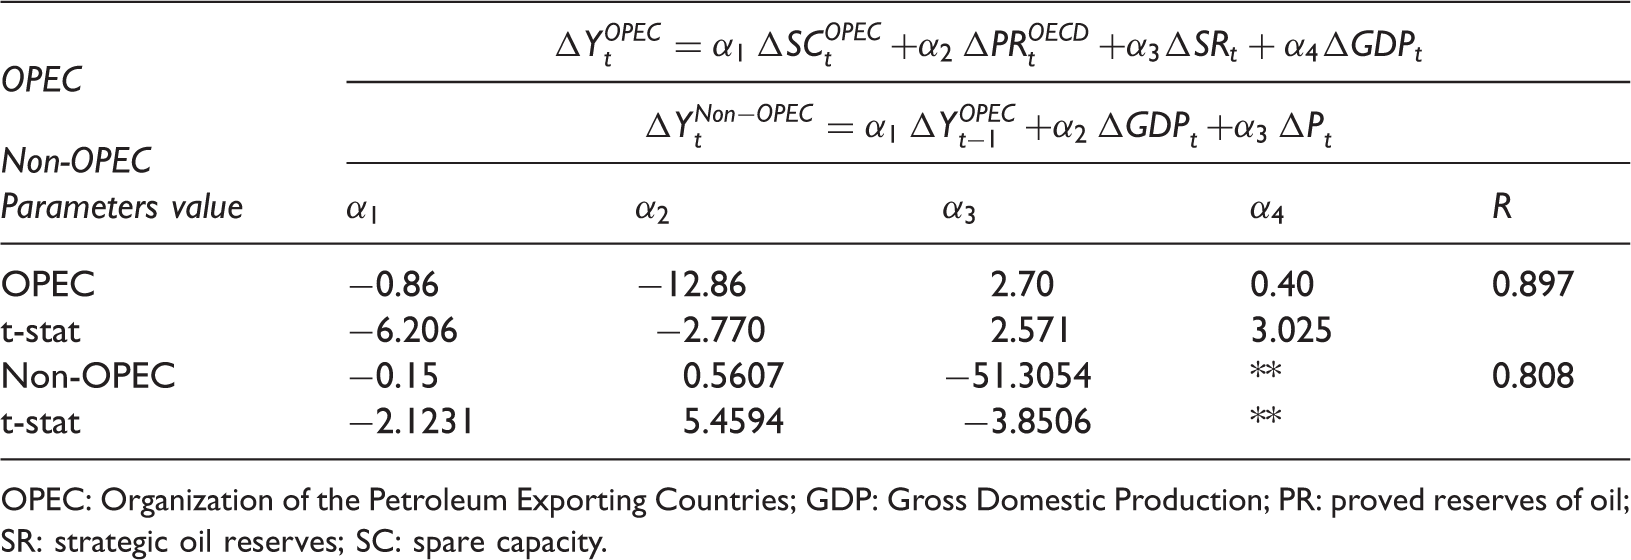
To perform a regression analysis, following variables are selected based on Table 6 although results were not significant based on T-stat and consequently another variable set is regarded, so that the resulted regression is more reliable as shown in Table 3. This implies that unilateral (and univariate) approaches for oil market dynamics analysis are not sufficient.
OPEC oil production:
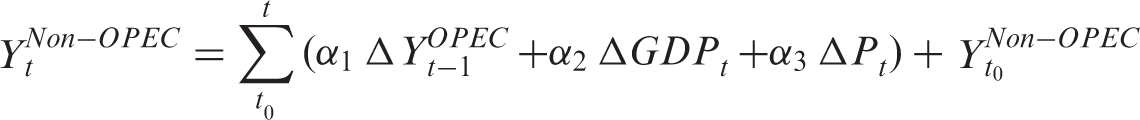
Non-OPEC oil production:
P(
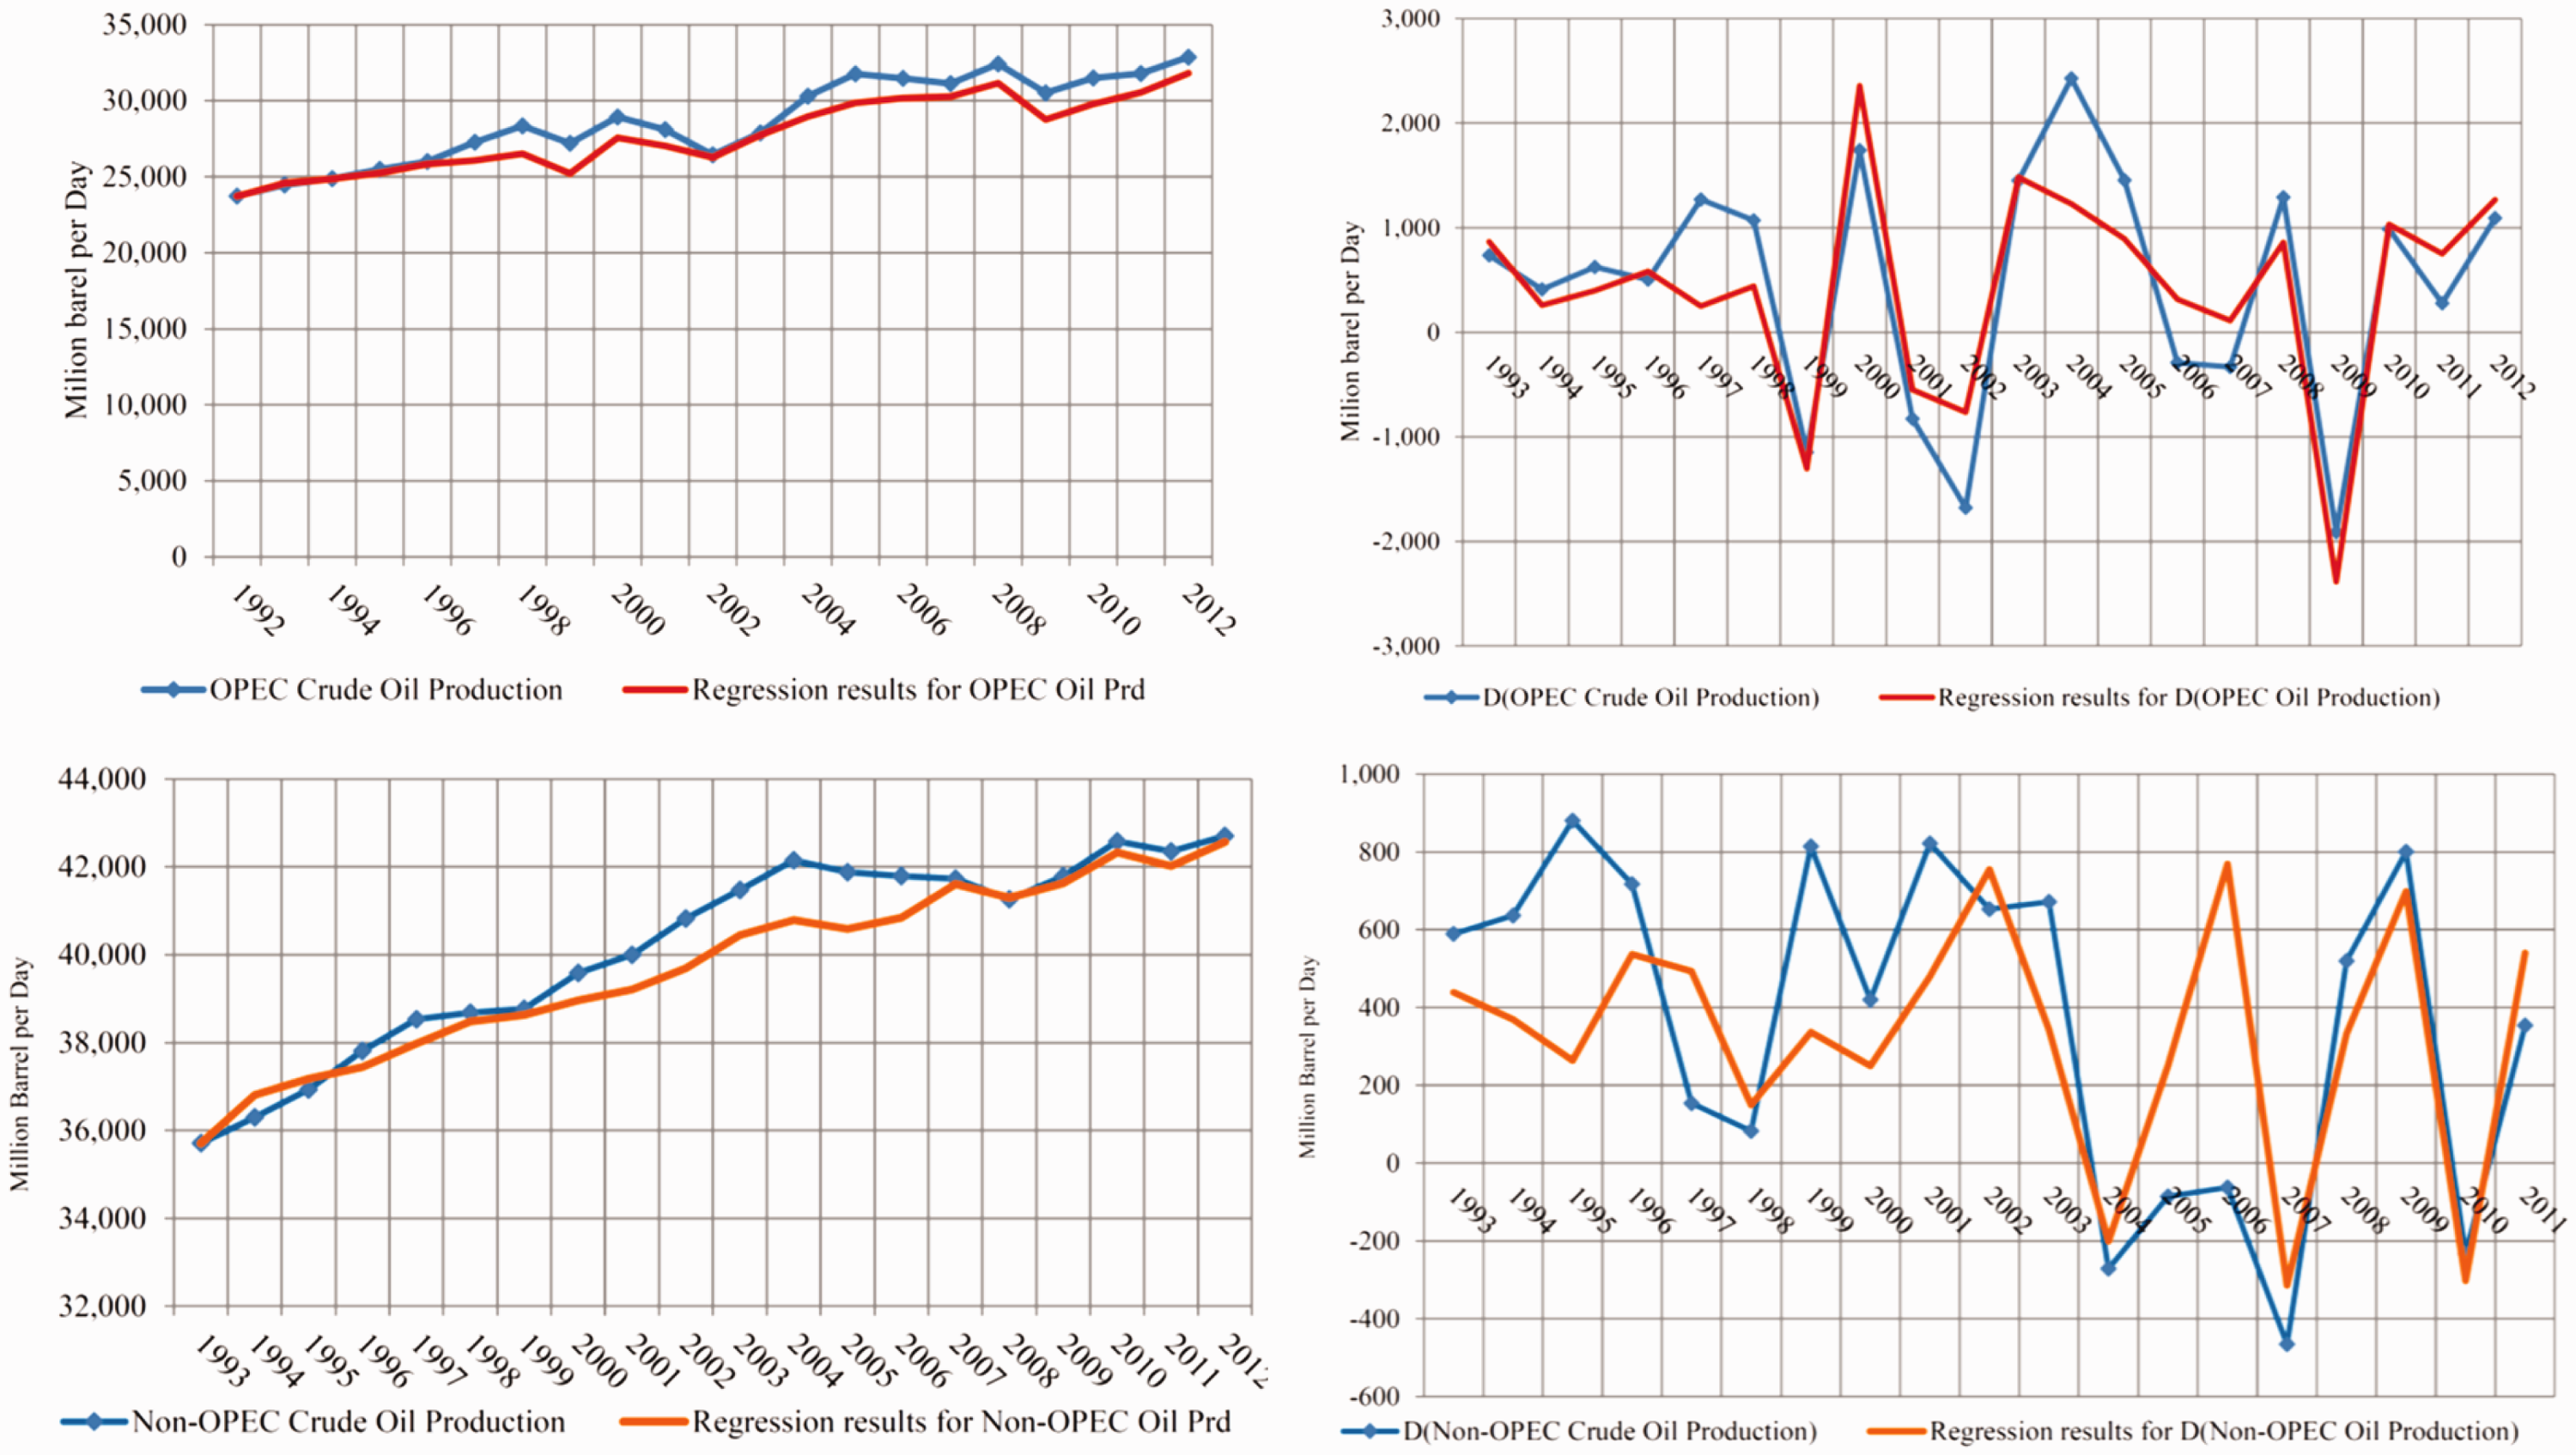
Parameter values and related statistics for oil producers’ regression analysis. OPEC: Organization of the Petroleum Exporting Countries; GDP: Gross Domestic Production; PR: proved reserves of oil; SR: strategic oil reserves; SC: spare capacity. OPEC and Non-OPEC oil production and its first-order difference—historical data vs. regression results.
Table 3 shows that aforementioned propositions are valid; Figure 2 shows results of regression analysis of OPEC and Non-OPEC oil production rate and their first-order difference. In depicting oil production rates, following formula is applied.

Co-integration test
T-stats for co-integration test of oil production regressions.
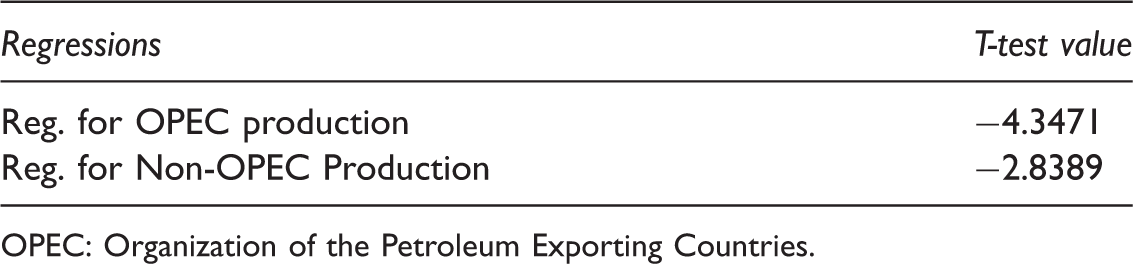
OPEC: Organization of the Petroleum Exporting Countries.
To sum up, the resulted remarks from Granger test and regression analysis reveals that the structure of relationships, which is realized with regards to historical data of the system, is not unique. To conduct numerical analysis, a conceptual integrated framework is necessary in which, not only cause and effect relationships between independent variables are seen but also bilateral relationships between dependent and independent variables could be studied in an integrated feedback structure. This could be achieved by systems approach in which the problem is investigated in a system of effective variables.
In the following, sections “Oil consumers’ strategies”, “Oil market players’ strategies to raise oil contracts in financial markets”, “Oil market players’ strategies to develop exploitation of unconventional oil”, and “Effect of political issues in the market” present similar analysis in summarized form for the other mentioned areas.
Oil consumers’ strategies
Oil consumption trends significantly depend on current and future outlook of world’s economic situation (U.S. Energy Information Administration (EIA), 2014); i.e. after 2008 economic crisis, oil consumption increased consequently all over the world (European Commission, 2009).
Among demand-side players’ medium- to long-term strategies, facing oil price increases, energy intensity control is one of the most effective ones in which technological improvement and market regulatory policies occur (BP, 2013b; Liddle, 2012; Matheny, 2010). Energy intensity control happens gradually due to considerable requisite time for technological progress and change (Fisher-Vanden et al., 2004). According to selected countries in EIA reports, Russia has reacted to oil price increases severely and has decreased 60% of its energy intensity from 1992 to 2011 (Karghiev, 2006); Moreover, China has reduced the index by 45% in the period of time (Long-term Incentive Strategies for Energy Efficiency, 2008) which affected world oil demand considerably (U.S. Energy Information Administration (EIA), 2013).
Another strategy is to substitute oil by other energy carriers (i.e. coal, natural gas, renewables, etc.) whenever oil price and its trend is not desirable regarding consumer’s economic programs and supply condition (Benes et al., 2015; Clark, 2013; European Commission, 2010; Kumhof and Muir, 2012).
The next action in demand side is to store oil and its derivatives strategically or in refineries (as the main crude oil consumers) so that they can adjust their activity level in refineries to minimize losses due to oil price undesirable oscillations.
To conclude, it seems that the following items influence oil demand rate in OECD and Non-OECD countries:
Gross Domestic Production (GDP) Energy intensity (EI) Oil substitutes consumption (OE) Petroleum stocks in refineries (PS) Oil real price (P) Petroleum products stocks in refineries (PPS) Refinery capacity utilization (CU)
As follows, sections “Granger causality tests for hypothetical causal relationships” and “Regression analysis of oil consumption” tried to investigate above proposition statistically to conclude up with a reliable statement about effective factors on oil consumers’ strategies in oil market.
Granger causality tests for hypothetical causal relationships
Similar to section “Unit root test on data,” Unit root test on data are performed and first-order difference of data is selected with valid stationarity. Table 6 shows significant causal relationships among the variables mentioned above.
Regression analysis of oil consumption
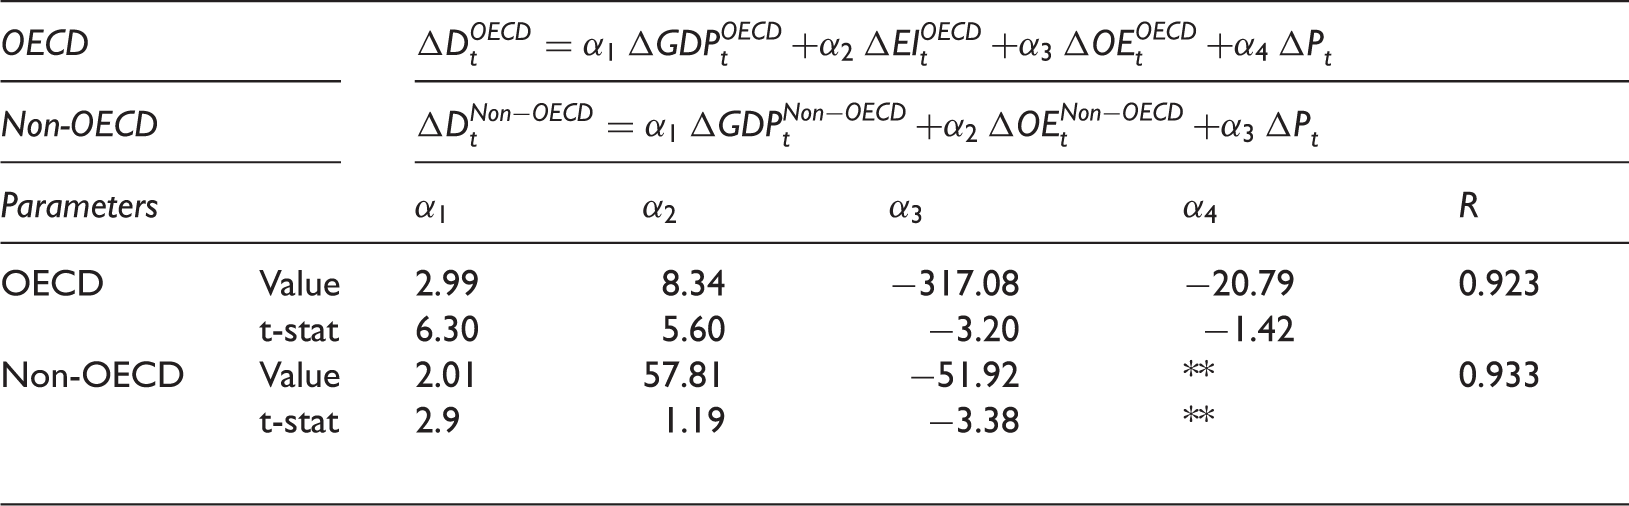
Parameter values and related statistics for oil consumers’ regression analysis.
Granger causality test results for main variable in oil production, demand, and financial market.

OPEC: Organization of the Petroleum Exporting Countries; SP: spot price; GDP: Gross Domestic Production; PR: proved reserves of oil.
Table 5 satisfactorily justifies the aforementioned propositions and Figure 3 illustrates results of the regression analysis of OECD and Non-OECD oil demand and its first-order difference. It is necessary to mention that co-integration test is also used here and showed that both regressions have explanatory property and therefore they are valid.
OECD and Non-OECD oil demand and its first-order difference—historical data vs. regression results (1000 barrels per day).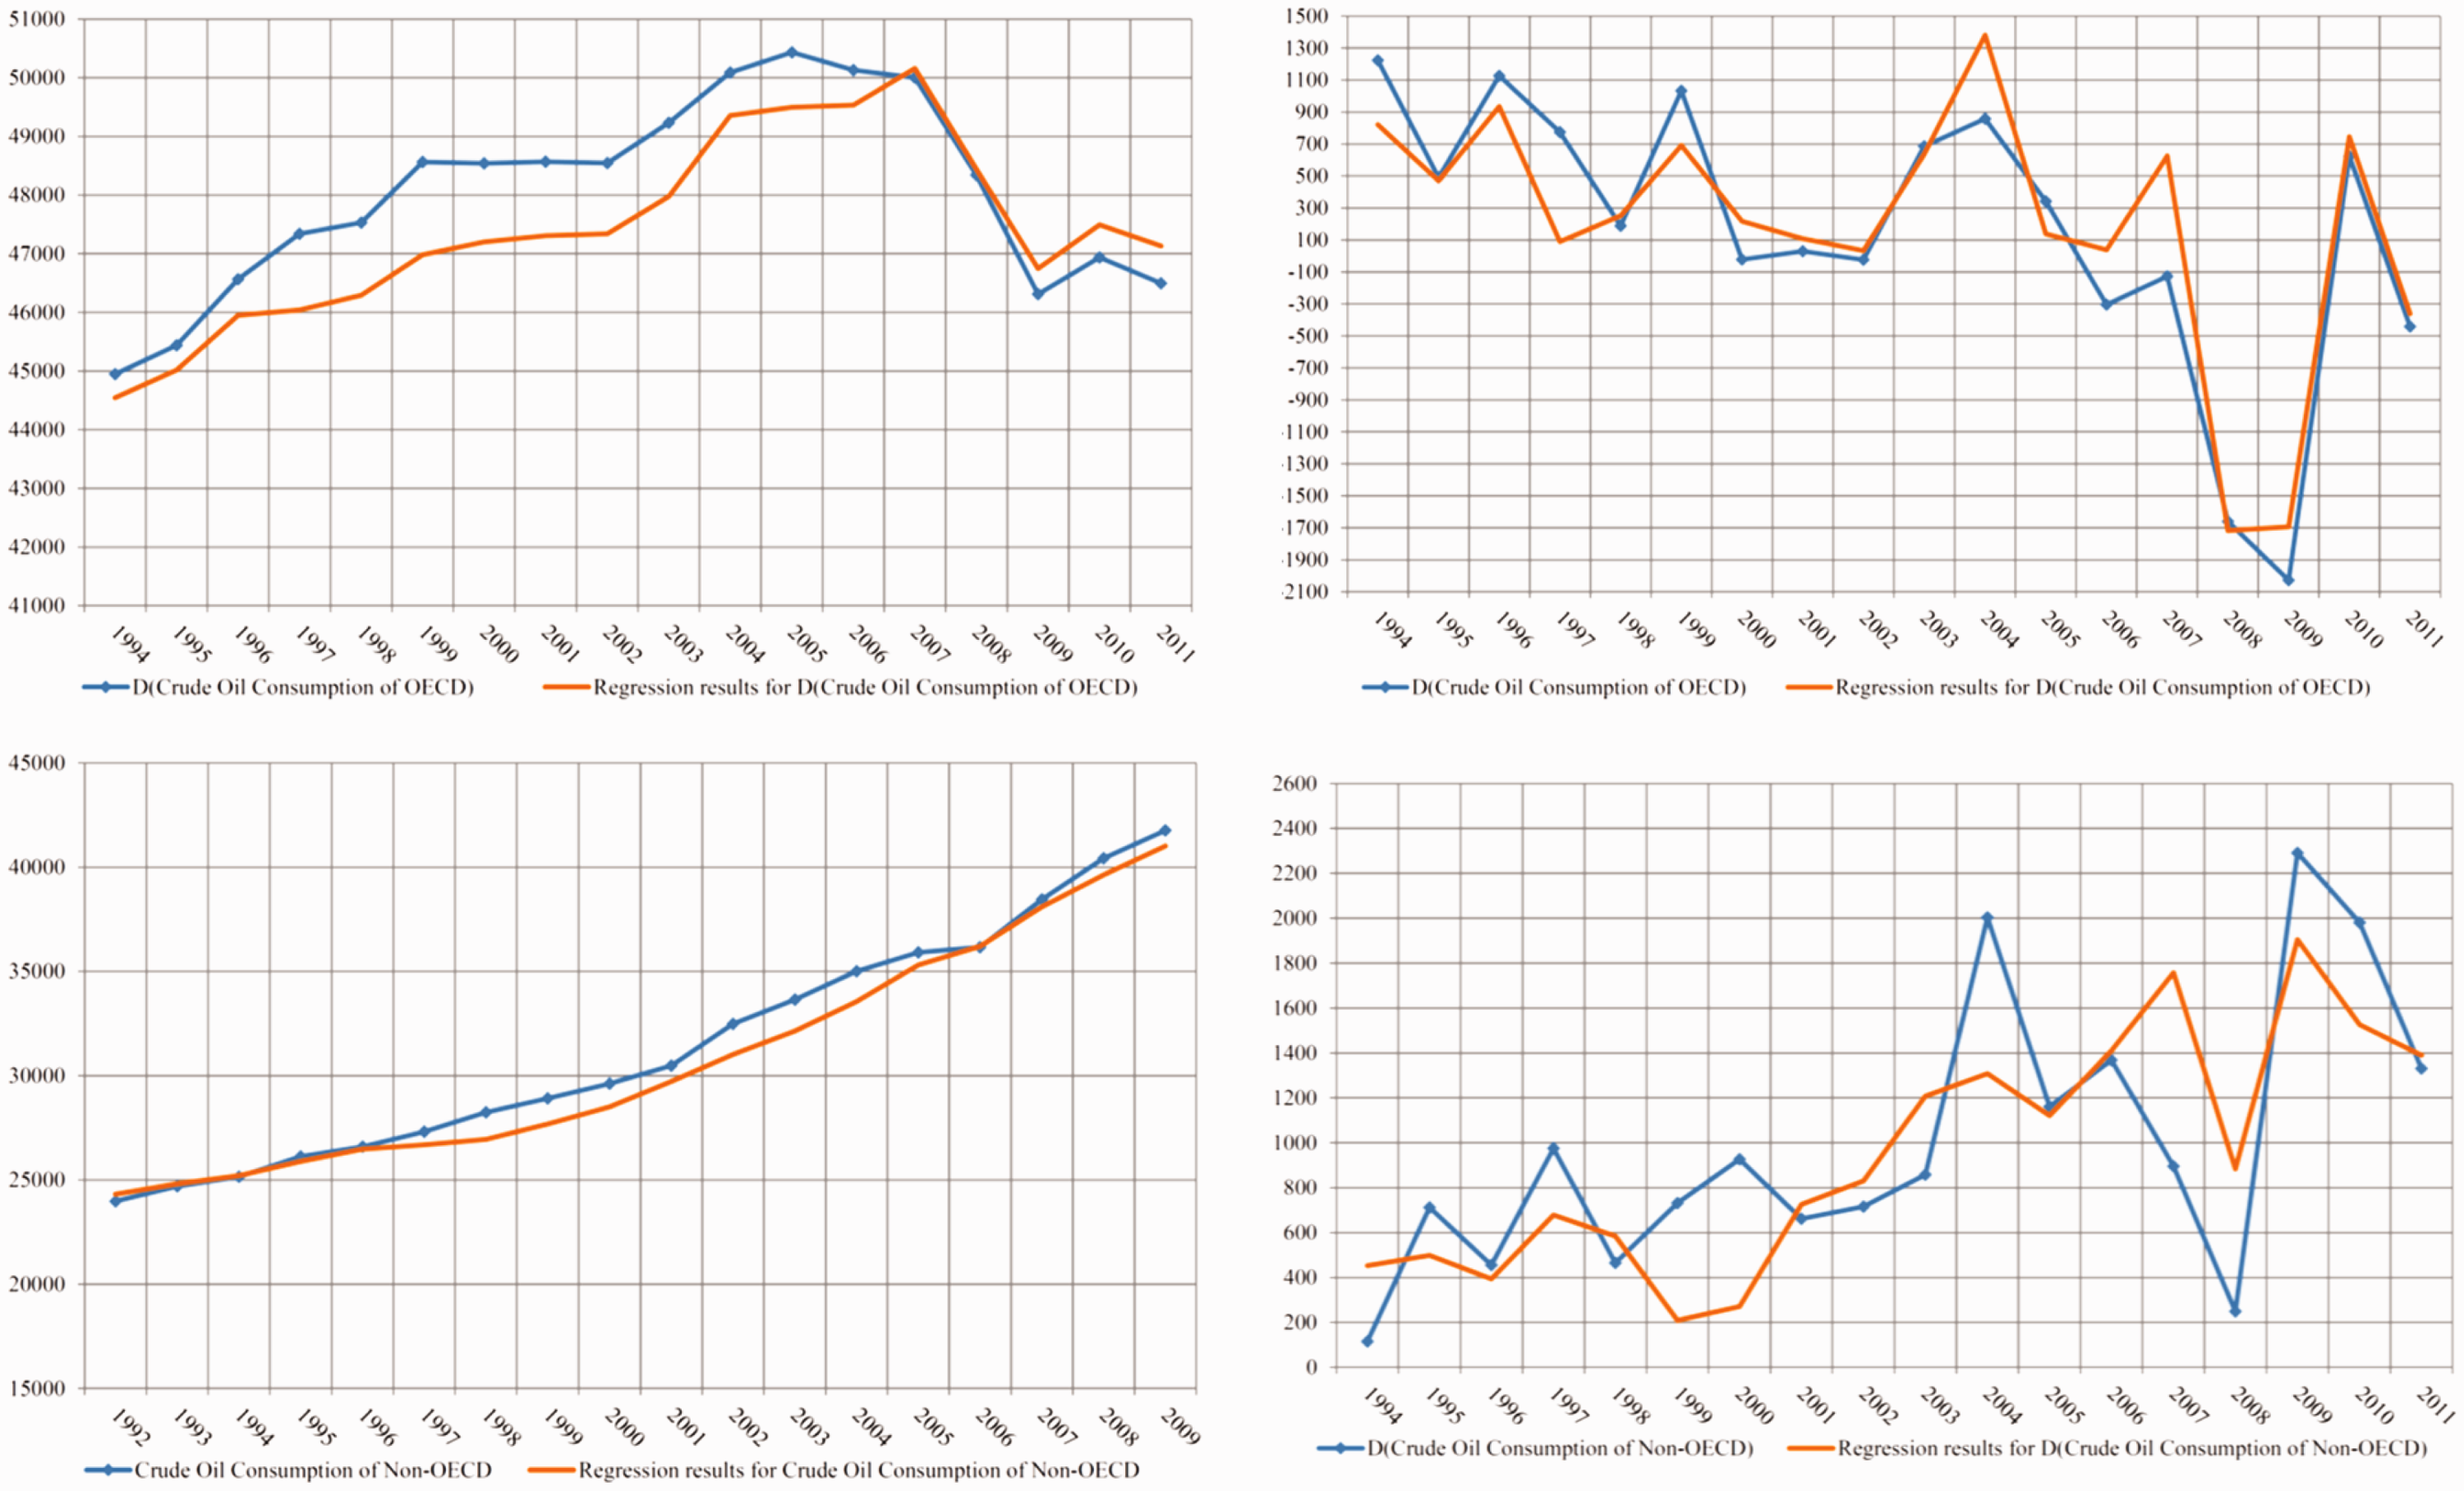
Oil market players’ strategies to raise oil contracts in financial markets
In recent years, oil contracts in financial markets (options, futures, and other derivatives) have grown noticeably; while maximum oil consumption in 2012 was about 100 million barrels per day, maximum of oil futures contracts reached to 1.5 million contract (and each contract equals to 1000 barrels per day) (U.S. Energy Information Administration (EIA), 2013). On one side, it should be noted that lack of oil in the market (consumption-production) is one of the main stimulus of oil contracts growth in the financial markets. On the other side, since OPEC does not have a major contribution in financial markets, price controlling power would be by Non-OPEC players of the market (i.e. in United States and Europe) in the future (Fattouh, 2011).
Moreover, since oil spot price oscillations is one another important motivation for market players to contribute additionally in financial markets to damp undesired changes, futures price has a more smooth trend in contrast to spot price (U.S. Energy Information Administration (EIA), 2013), which indicates ambition of market players to hedge contract risks in OTC that itself is a stimulus for the growth in financial markets (Hull, 2009).
Despite the fact that the major share of oil demand is met in the OTC market and therefore spot prices should be the major input for future decisions, futures prices play the main role (Bernard, 2013; Kuuskraa et al., 1985).
In case that more and more volume of oil demand is met in futures markets, oscillations of spot price would be partially controlled which makes a reliable and safe market for demand side; this will gradually result in a growth in futures contracts, which is determined by a more predictable future price.
In conclusion, it seems that the following are influencing oil futures contracts:
Changes in real oil spot price (ΔSP) Difference between oil demand and supply (Y-D) Oil futures price (FP)
Sections “Granger causality tests for hypothetical causal relationships” and “Regression analysis of oil futures contracts” investigate above proposition statistically to come up with a reliable statement about effective factors on oil futures contracts.
Granger causality tests for hypothetical causal relationships
Similar to section “Granger causality tests for hypothetical causal relationships,” Unit root test on data is performed and first-order difference of data is selected with valid stationarity. Table 6 shows significant causal relationships between the variables mentioned above.
Regression analysis of oil futures contracts
Parameter values and related statistics for oil futures contracts regression analysis.
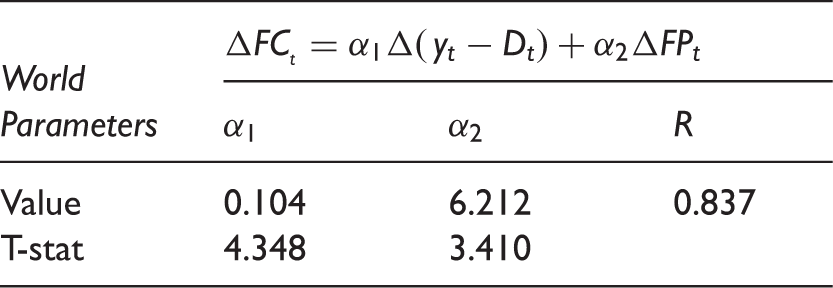
Figure 4 shows the results of regression analysis of oil futures contracts and its first-order difference. It should be mentioned that co-integration test is also applied here and showed that both regressions have explanatory property and therefore they are valid.
Oil futures contracts and its first-order difference—historical data vs. regression results.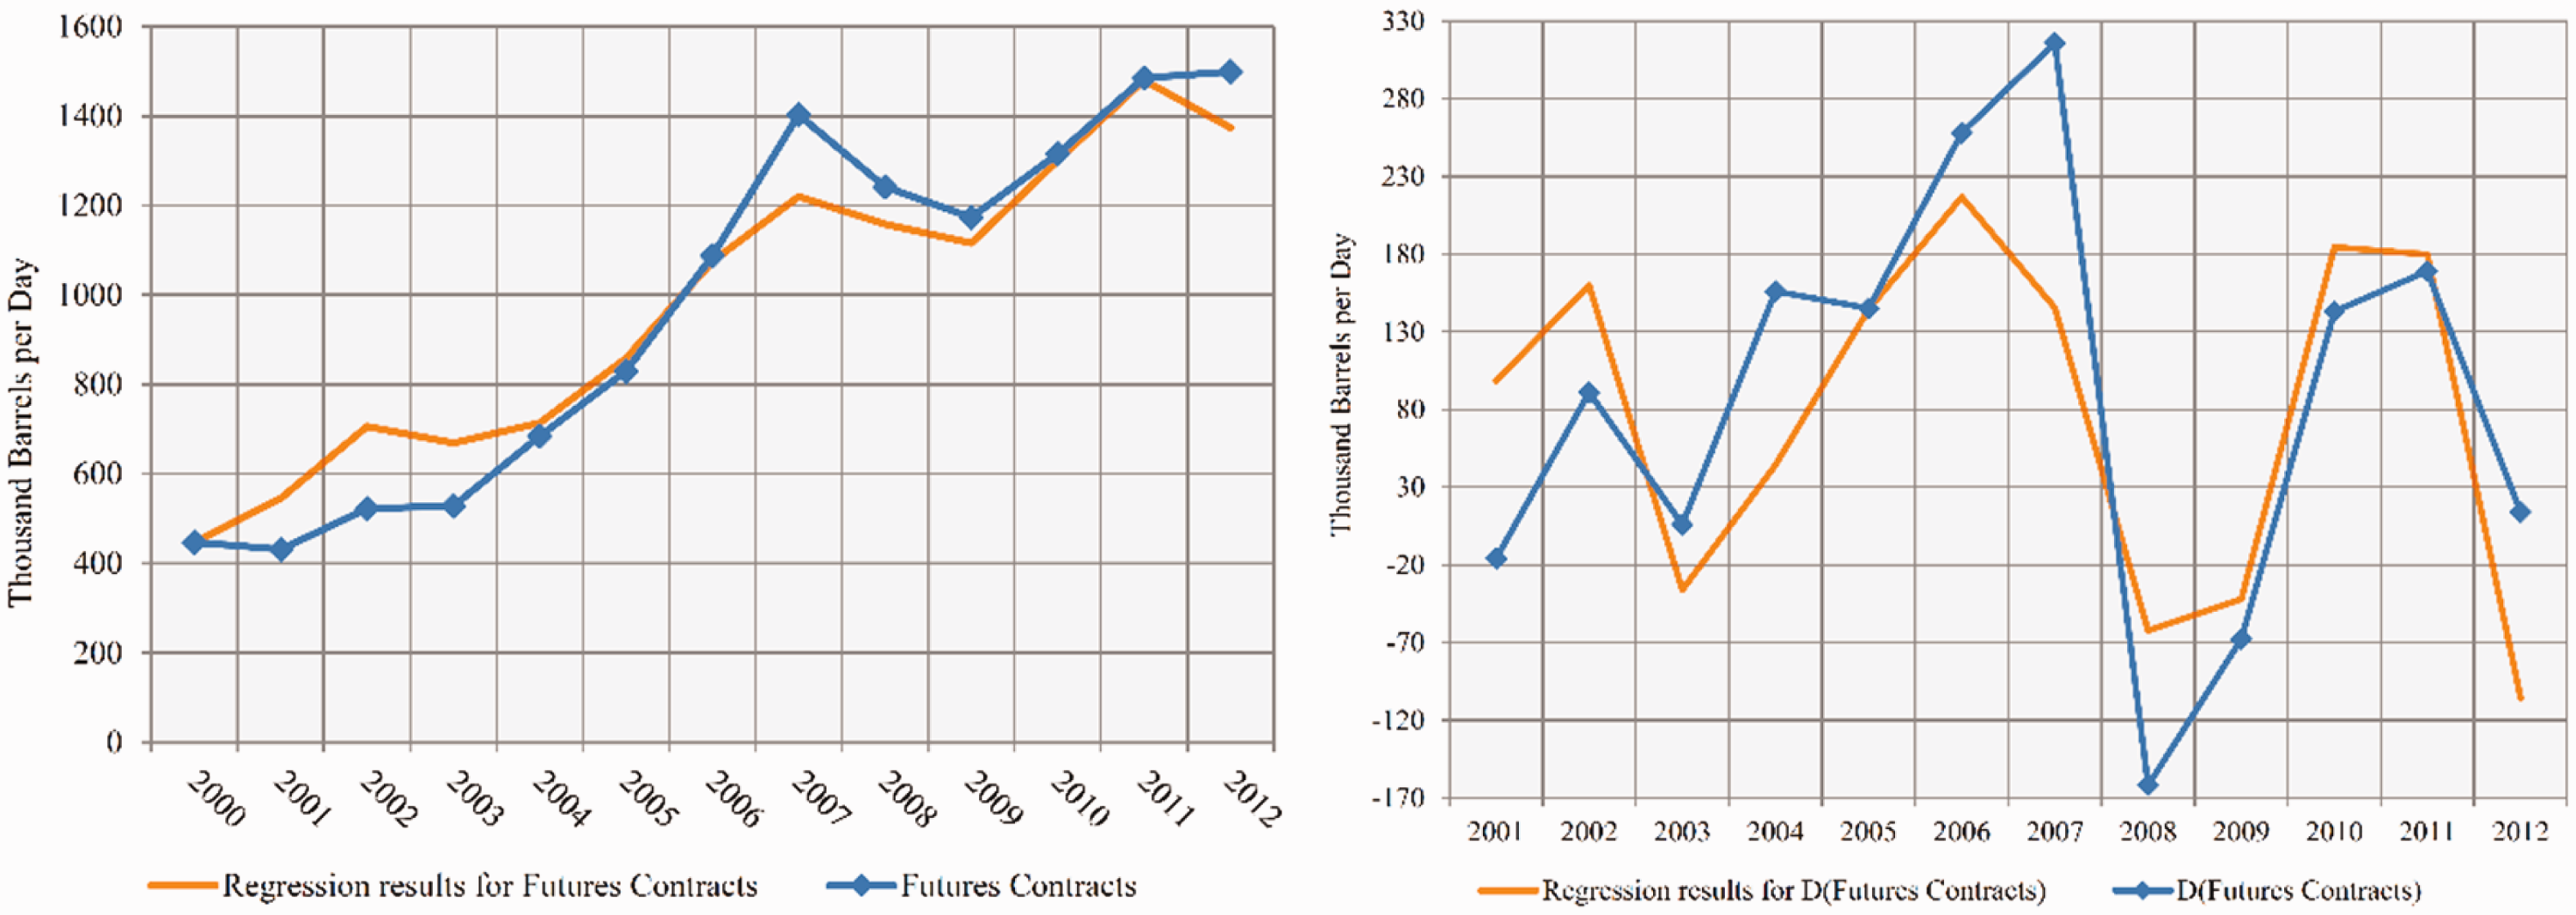
Oil market players’ strategies to develop exploitation of unconventional oil
Recent estimation of EIA in 2013 about world’s unconventional oil technically recoverable resources is 345 billion barrels which approximately equals 10 percent of total oil resources (conventional and unconventional) of world (Kuuskraa et al., 2013). The important point is that United States and China, as largest oil consumers, have main unconventional resources among others. In this regard, United States and Canada are developing exploitation of unconventional oil more rapidly and effectively with a promising trend (Bernard, 2013; Kuuskraa et al., 1985). It is argued that unconventional oil production for United States is economic with a WTI oil price between 50 and 65 dollar (Maugeri, 2012); this increases US power in controlling oil price in a defined interval. Unconventional oil production in United States, especially in North Dakota and Texas, has a growing trend so that 847,000 barrels per day of oil production increase of United States in 2012 was due to unconventional oil production, i.e. 29 percent of US oil production belonged to unconventional oil. In this year, the production rate of Canada reached to 291,489 barrels per day (Kuuskraa et al., 2013).
Hence, it could be concluded that demand side would consider developing unconventional oil as a long-term strategy, so that they could limit OPEC’s pricing power and provide a desired economic situation.
On the other side, technological progress in unconventional oil first makes unconventional oil production more economic, although it can enhance recovery factor of conventional oil, from its current average value of 35%, as well (Maugeri, 2012); thus, this bilateral relationship should be considered too.
Effect of political issues in the market
There is no doubt that political issues have substantial influence on oil market (especially in short to medium term). Global oil market has encountered structural changes in last decades. In 1960s, oil industry was controlled by large multinational companies. In 1970s, OPEC played a major role in the market. Arab-Israeli War in 1973, Iranian revolution in 1997, and Iran-Iraq war in 1981, imposed many oscillations to oil price in the market. In 1990s, oil market was almost stable politically except when Iraq invaded Kuwait, which imposed a short run increase in prices. Invasion of Iraq in 2000s and recently political changes in Arab countries put unplanned oscillations in the market (BP, 2013a; Derakhshan, 2005). Therefore, political issues (revolutions, wars, etc.) should be considered in the framework by which oil price dynamics would be studied.
The generic conceptual framework of oil price dynamics (a subsystems diagram)
As mentioned above, different factors affecting oil price changes, which make oil price analysis complicated; on the other hand, statistical analysis in previous sections showed that unilateral (and univariate) approaches for oil market dynamics analysis are not suitable. Therefore, it is suggested to apply a systems approach. Here, at least a generic conceptual framework is necessary and useful. This section provides a subsystems diagram of oil price dynamics building blocks, which has concluded from review of literature and reports issued by international energy related organizations and results of “Building blocks of oil price dynamics” section (Figure 5).
Building blocks of oil price dynamics—subsystems diagram.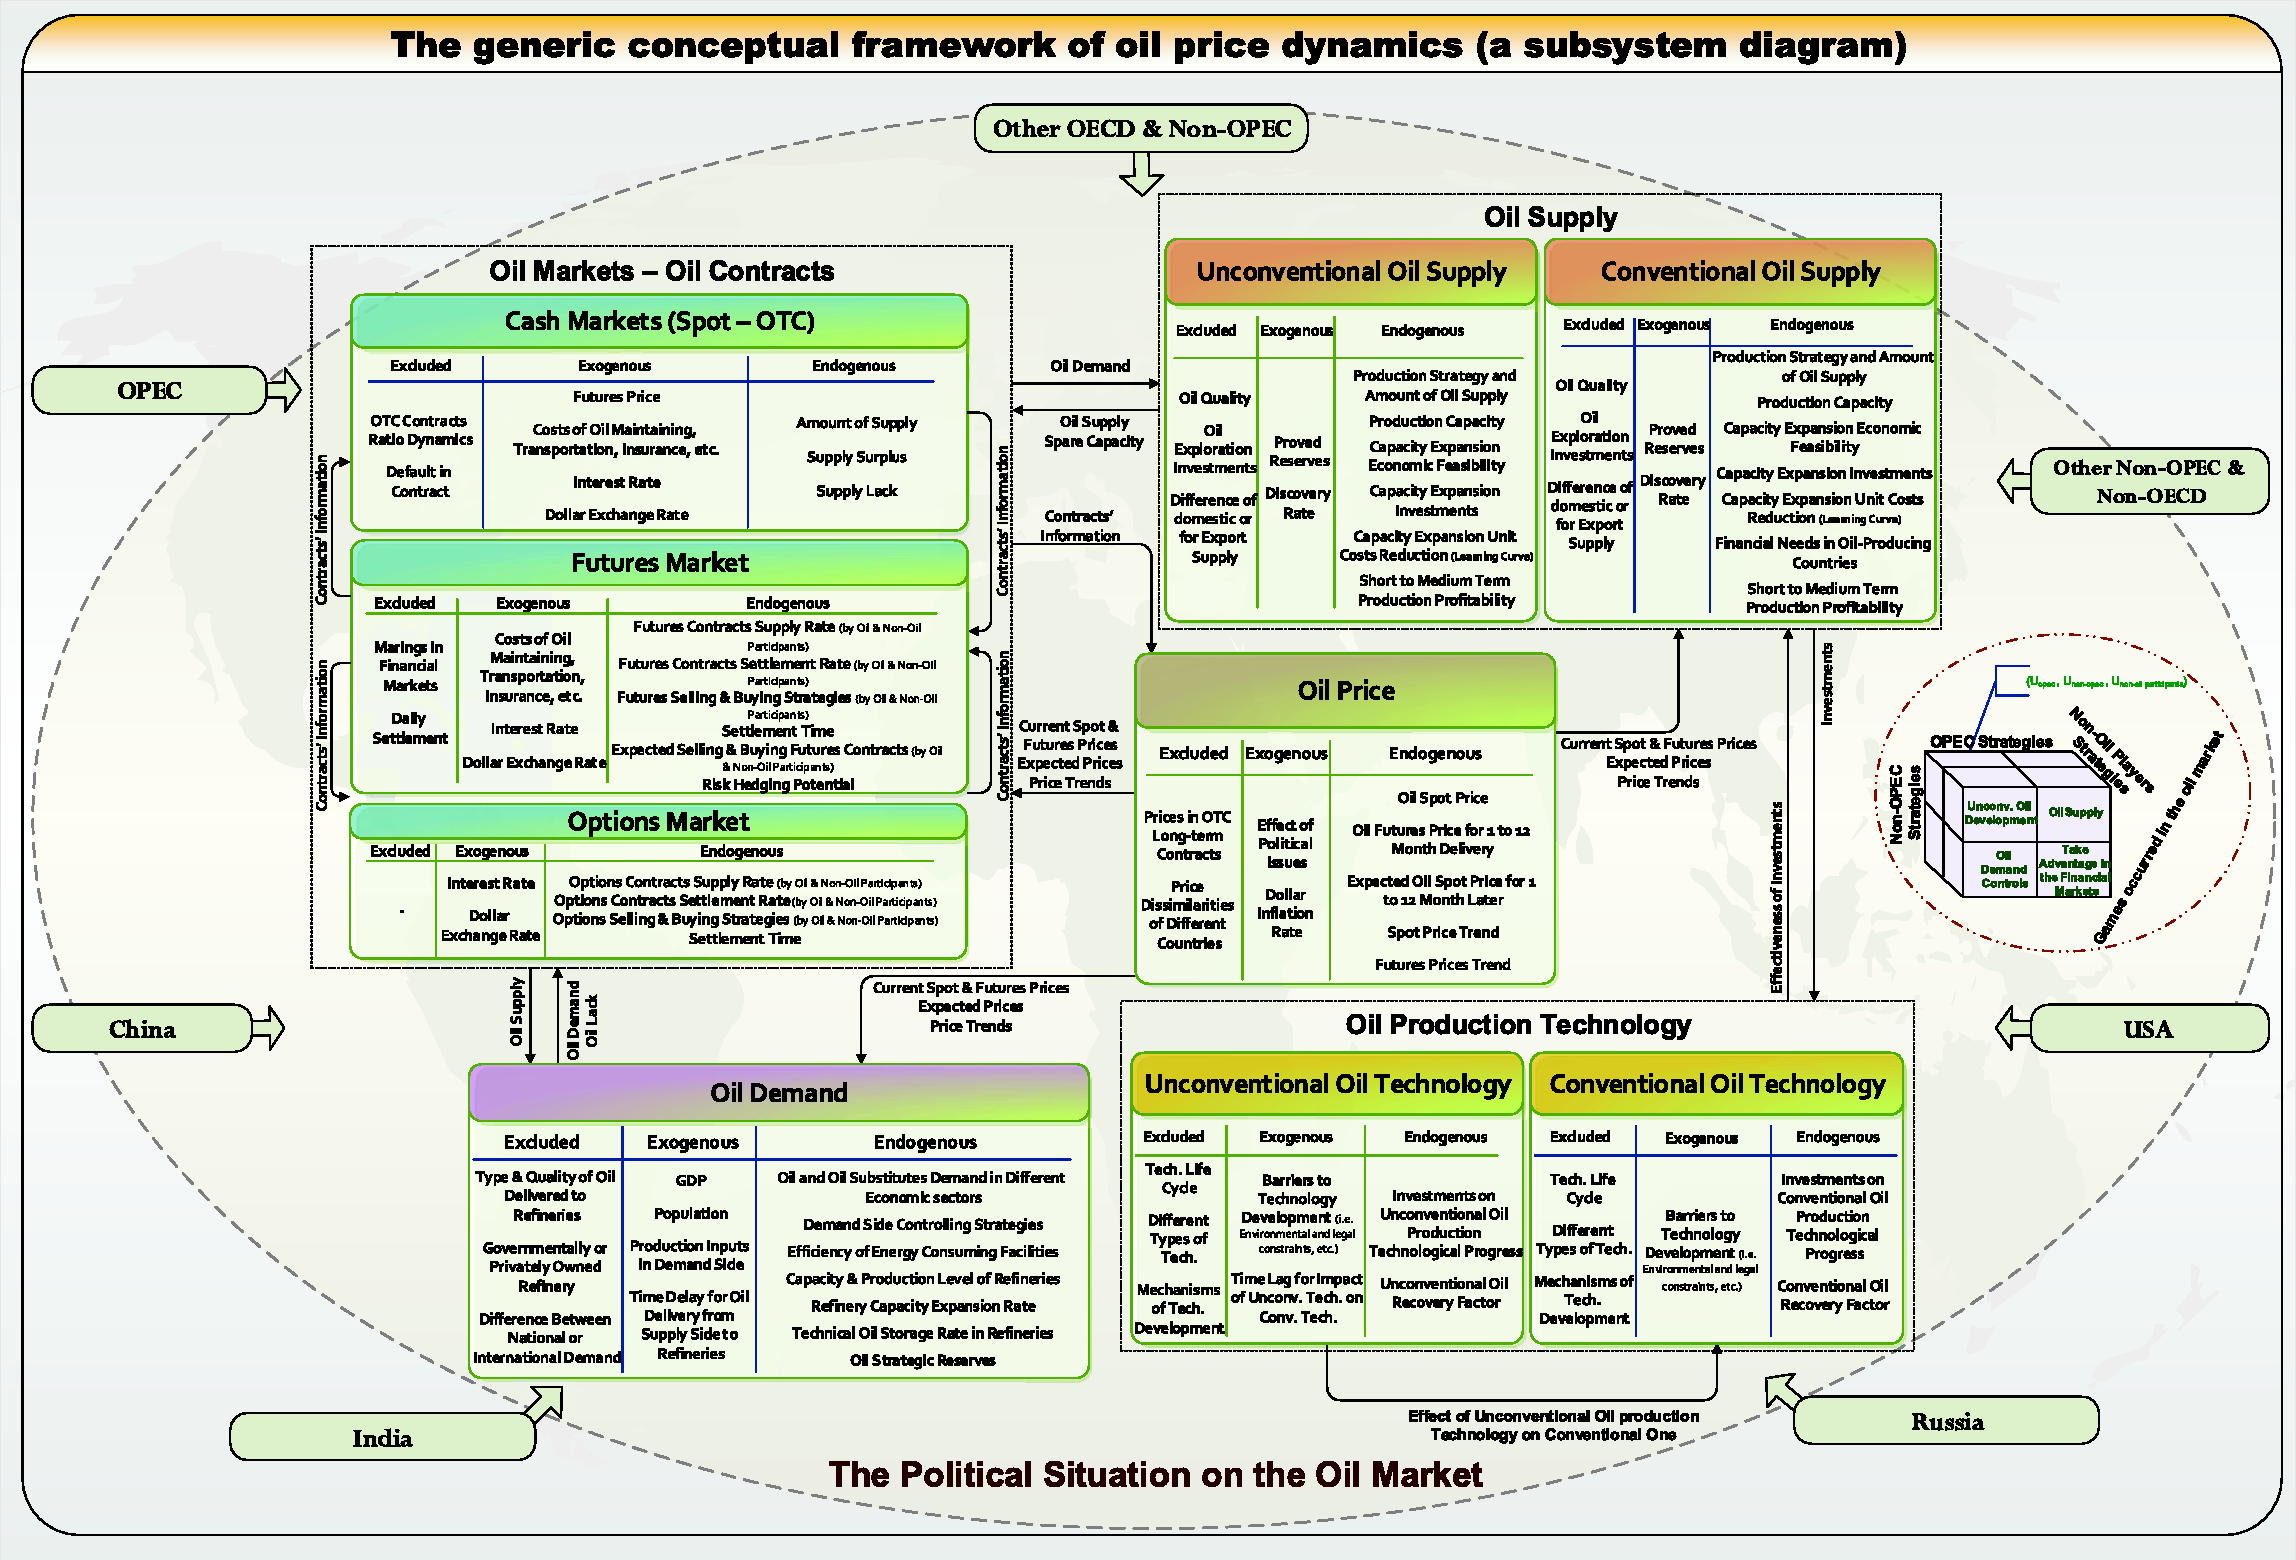
Oil production subsystem is considered in two sections, i.e. conventional and unconventional in which following variables are determined: production rate, production capacity, capacity expansion economic profitability, production and capacity expansion unit costs, proved reserves, discovery rate, etc. In production technology subsystem recovery factor for conventional and unconventional oil and their interrelationships are determined.
Oil contracts, mainly, in OTC and spot market, futures and options market, are considered in oil contracts subsystem in which following variables are determined: supply rate and demand rate of each contract type (from oil and non-oil participants), price of oil in each contract type, purchase and buy strategies of oil and non-oil participants, etc.
In demand subsystem, oil and its substitutes demand are determined; moreover, following variables are determined: world’s economic activities, energy intensity, refinery capacity, refinery oil stocks, etc.
The detailed conceptual framework of oil price dynamics (a causal loop diagram)
Based on the developed subsystem diagram of oil price dynamics in “The generic conceptual framework of oil price dynamics (a subsystems diagram)” section, in this section, a more detailed structure of mechanisms, by which oil price changes over time, is described through a causal loop diagram.
Figure 6 shows main influencing factors on oil spot price dynamics, oil futures price (for 1- to 12-month delivery), and expectations of oil spot price.
Main influencing factors on oil spot price (1- to 12-month delivery is shown by “…”).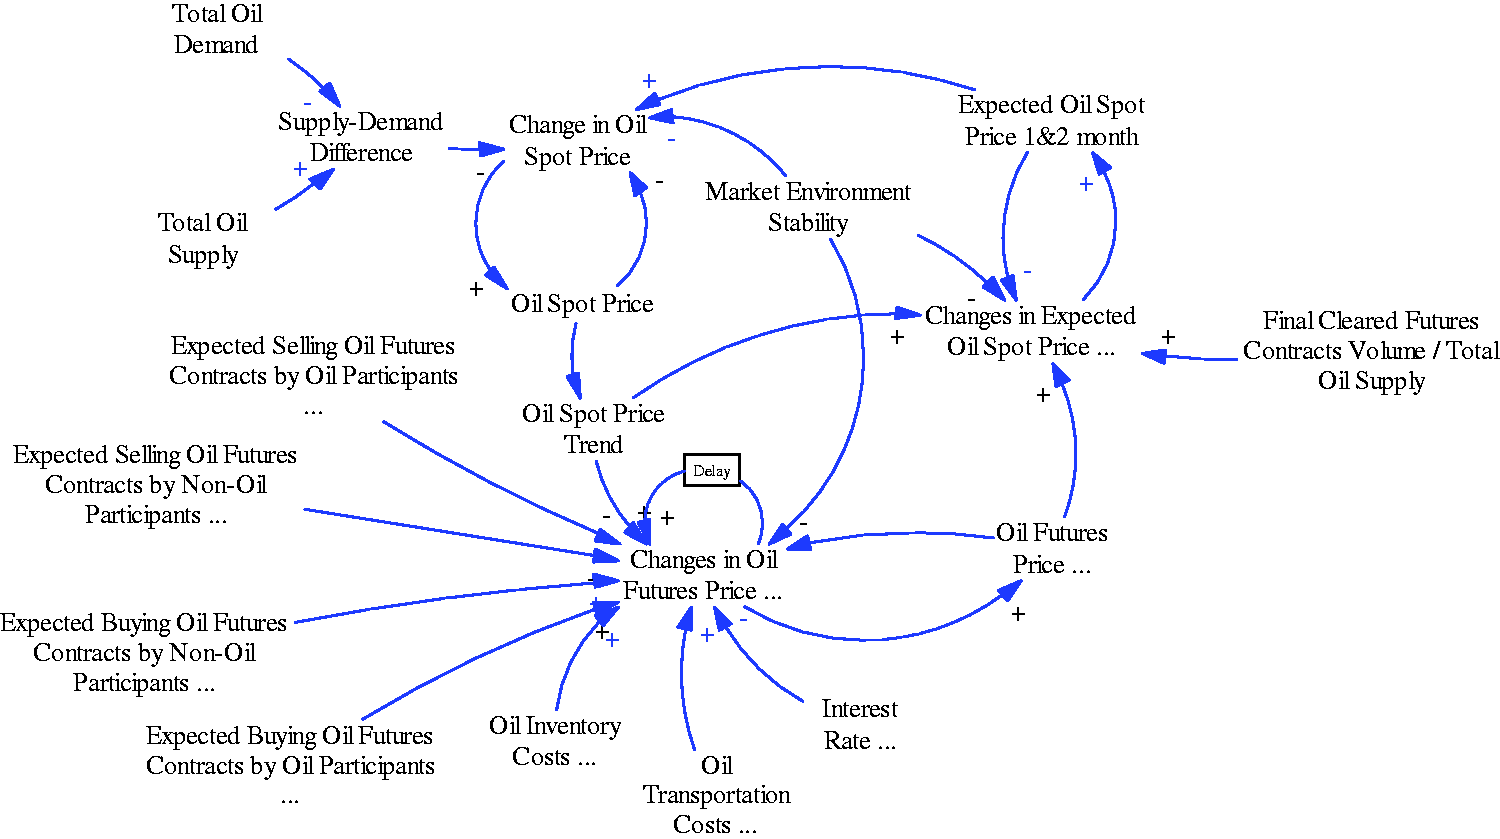
Supply and demand imbalance, oil spot price in previous periods of time, expectations of oil spot price in one and next two forthcoming months, and market environment stability are influencing the oil spot price (Hamilton, 2008). Factors forming oil futures price for 1- to 12-month delivery, include, supply and demand for futures contracts, trend of oil spot price, futures price in previous time period, and factors which determine desirability of futures contracts (opportunity costs: oil inventory and storage costs, oil transportation costs, and interest rate).
Also, spot price trend, futures price for delivery in the time period of expectation, and futures expectation weight (relative share of oil supplied by futures market) are of high importance in forming the expectations of oil spot price.
Figure 7 depicts two reinforcing and balancing loops which affect conventional and unconventional oil production and capacity expansion rates. In the reinforcing loop, an increase in production rate would lead to an increase in revenues and consequently an increase in investments in capacity expansion regarding normal field development delay time; therefore, in case that demand is growing, production rate would increase. In the balancing loop, an increase in production rate, regarding limited oil resources, all else being equal, decreases reserve to production ratio (R/P). The decrease mentioned above accordingly results in a decrease in long term expected profitability of investment in oil industry which finally constraints capacity and production enhancement programs.
Reinforcing and balancing loops of oil production and capacity expansion.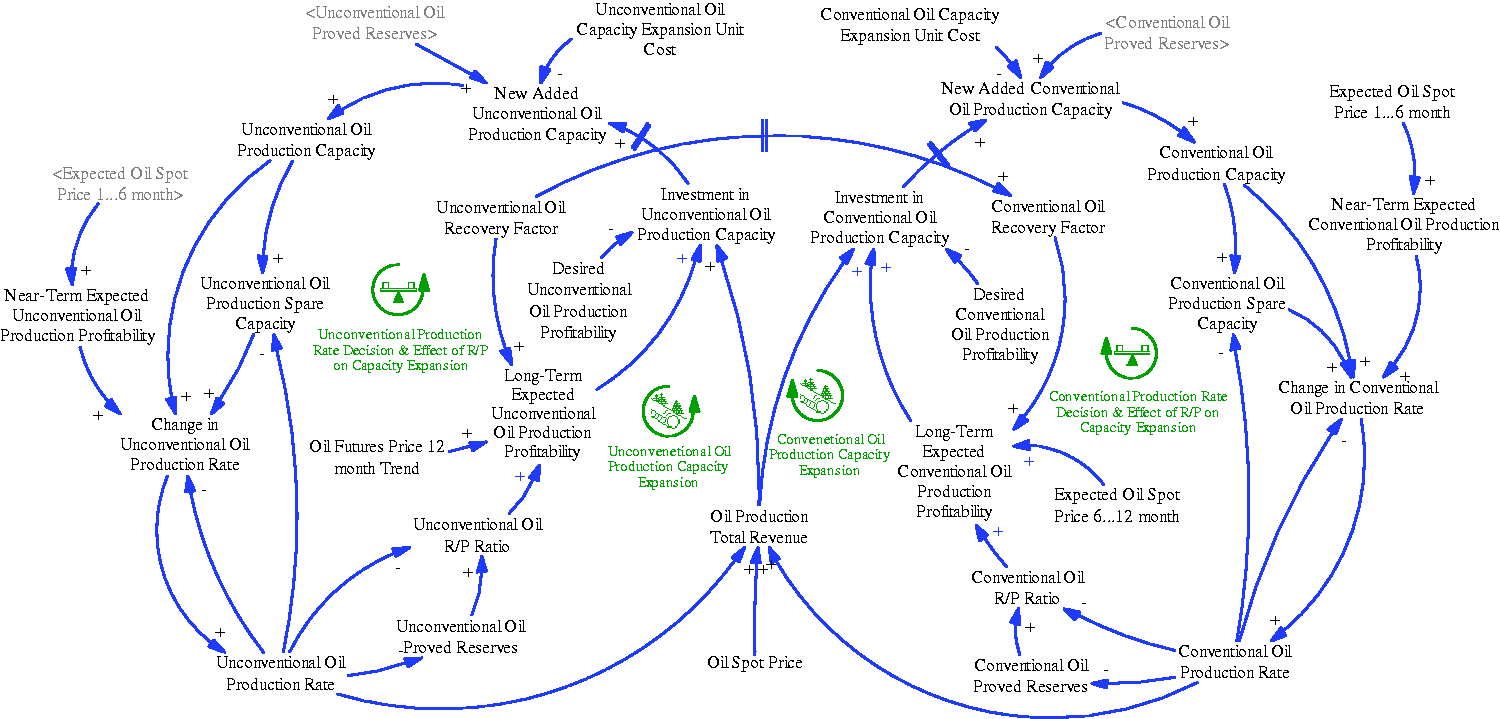
Figure 8 shows two reinforcing loops in which capacity expansion unit costs reduction (because of learning curve effect during the time) and production technology (which here is indexed by recovery factor) development are explained.
Reinforcing loops for learning effect in capacity expansion and production technology development.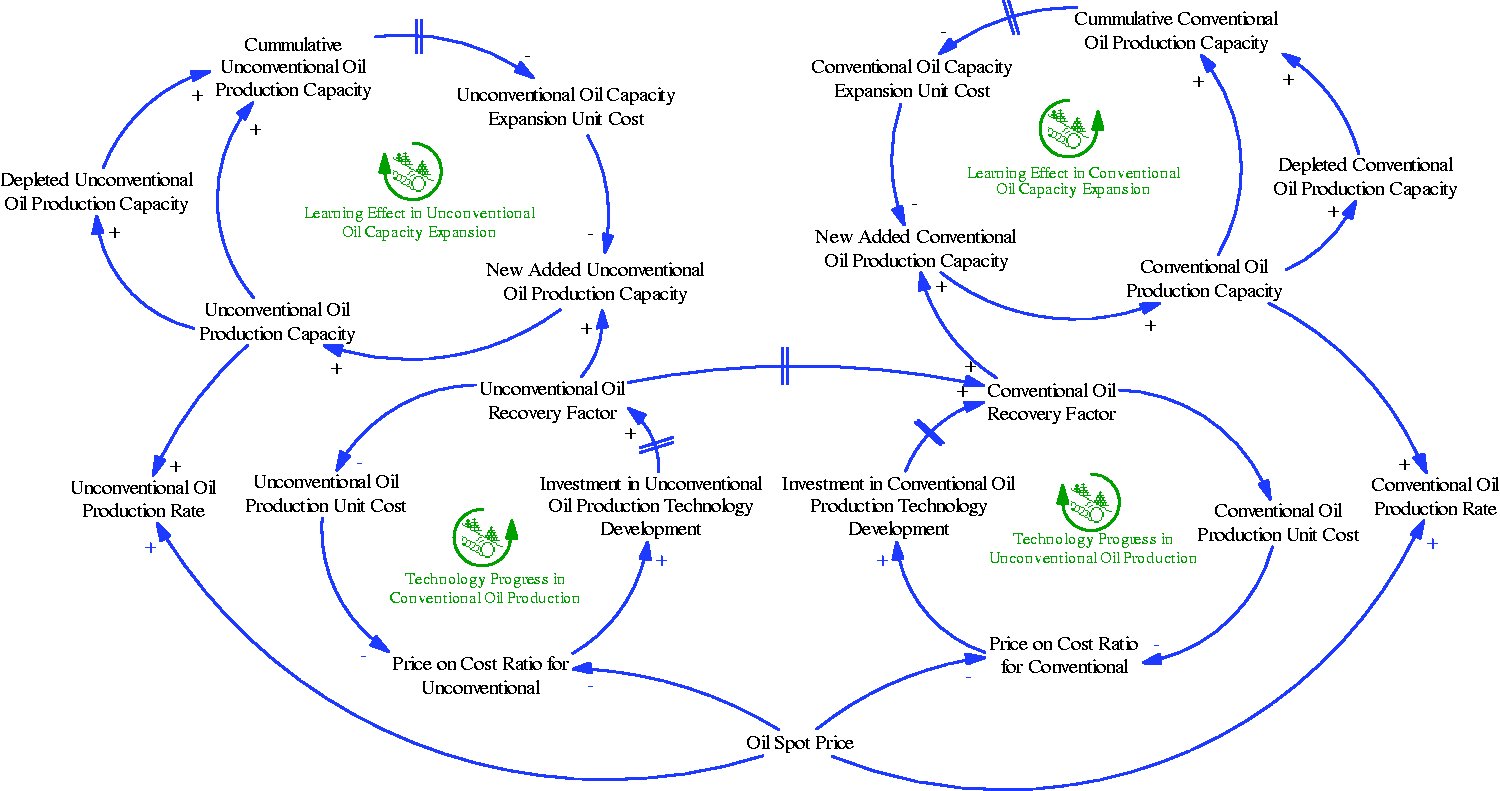
Figure 9 illustrates the structure which results in confronting OPEC and Non-OPEC strategies. OPEC and privately owned Non-OPEC producers adopt their strategy almost in a same manner since their ultimate goal is to gain the maximum economic added value from oil market; i.e. an increase in oil price, ceteris paribus, would result in more oil production to gain more revenue with new high prices. This, all else being equal, brings about oil surplus and overproduction in the market and ultimately closes the loop by reducing the oil price. The fact that should be considered, is oil strategic storage by Non-OPEC countries so that they can damp undesired fluctuations of oil price. Hence, an increase in spot price, if it considerably is far from targeted oil price which is came from long term spot price trend, causes an increase in oil supply from strategic reserves by Non-OPEC countries to control their market. In contrast, a decrease in spot price brings on more strategic oil storage in demand side of the oil market.
Effective factors on OPEC and Non-OPEC strategies.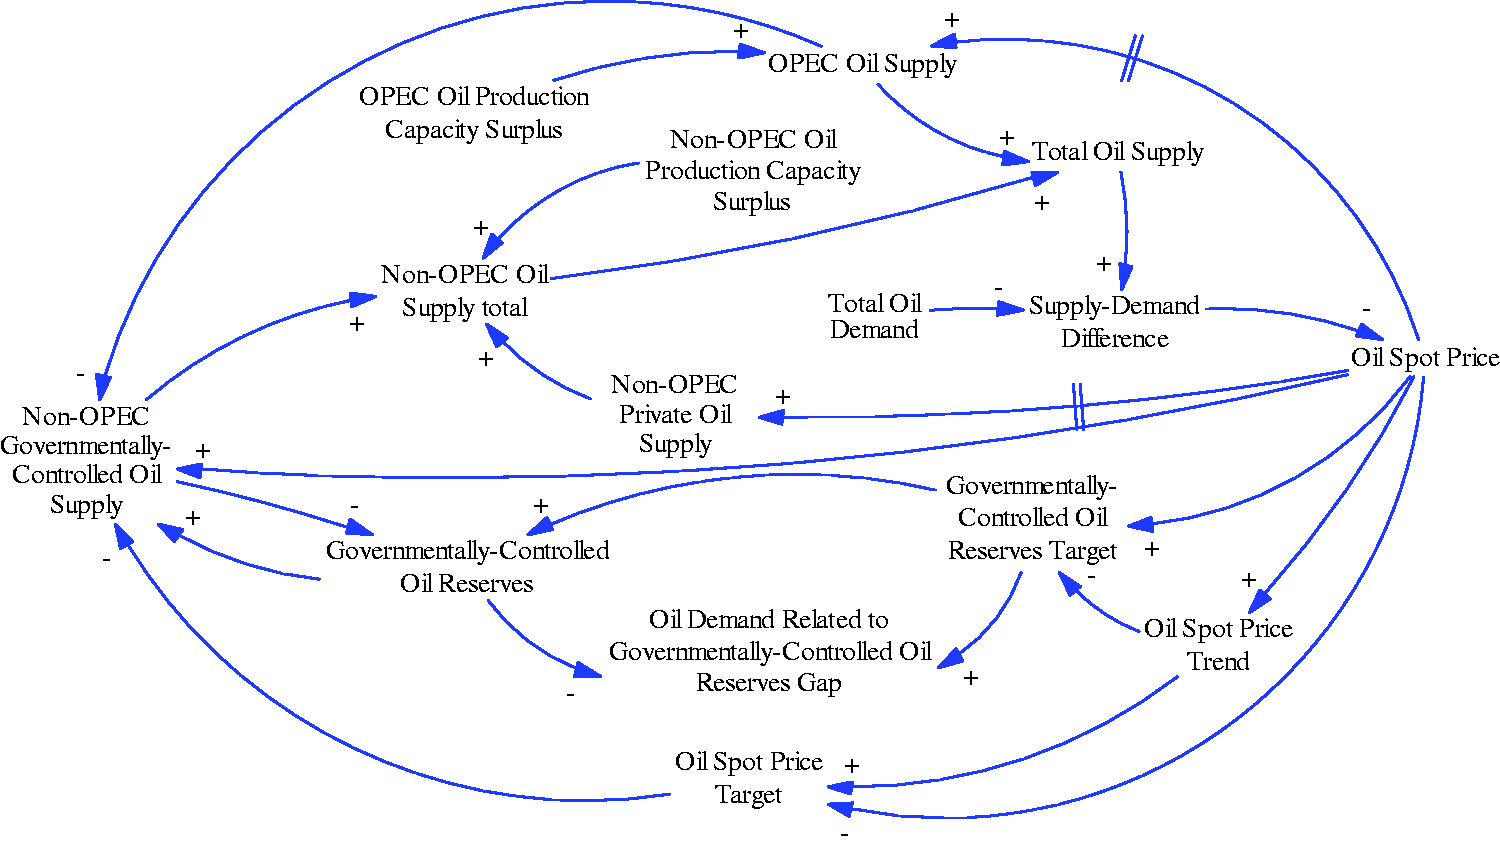
Figure 10 shows loops related to production and capacity dynamics of refineries as the main consumers of crude oil. Here, the main point is that refineries production and capacity expansion rates are based on short term and long term expected profitability which is calculated by means of expectations of oil spot prices. Figure 11 illustrates the structure by which fluctuations of futures prices for 1- to 12-month delivery affect storage level of petroleum and its products. Here, the key variable is the difference between futures price for 1- and 12-month delivery. An increase in this value, which means market players’ estimation of prices increase in the future, ceteris paribus, results in an increase in short term demand of oil which brings on oil lack in the market. This, all else being equal, motivates players to buy futures oil for 1- to 6-month delivery which causes an increase in price of these contracts. The increase closes the loop by decreasing the difference between futures price for 1- and 12-month delivery.
Reinforcing and balancing loops for production rate and capacity expansion of refineries. Balancing loop for effect of futures prices dynamics on the storage of oil and its products in refineries.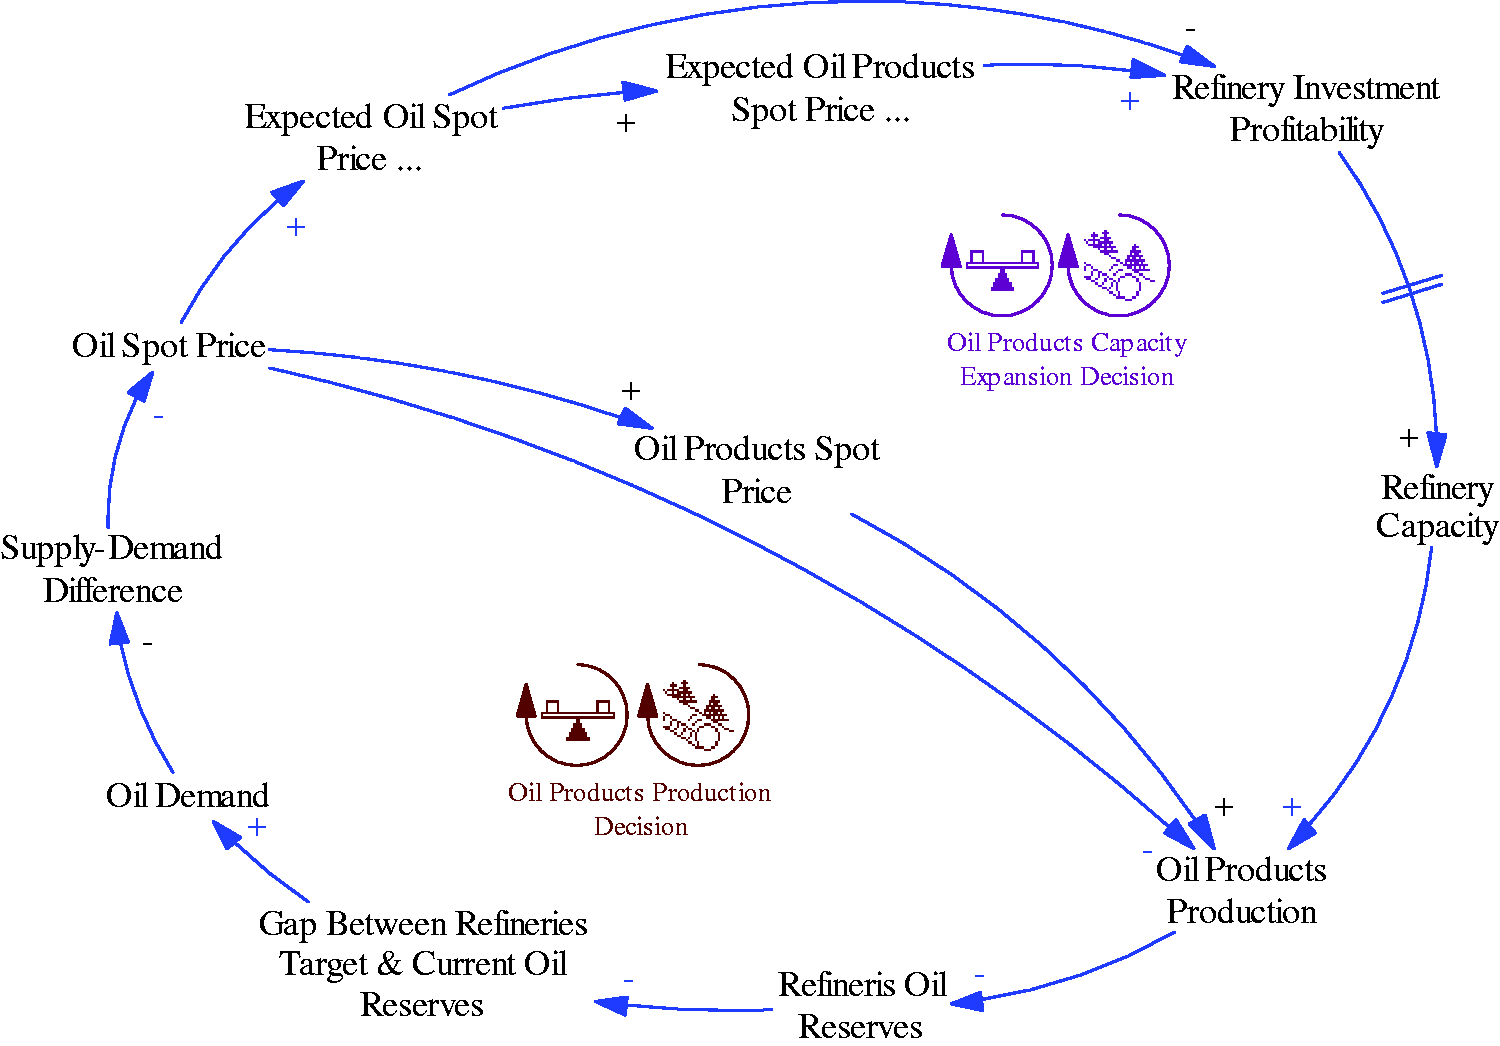
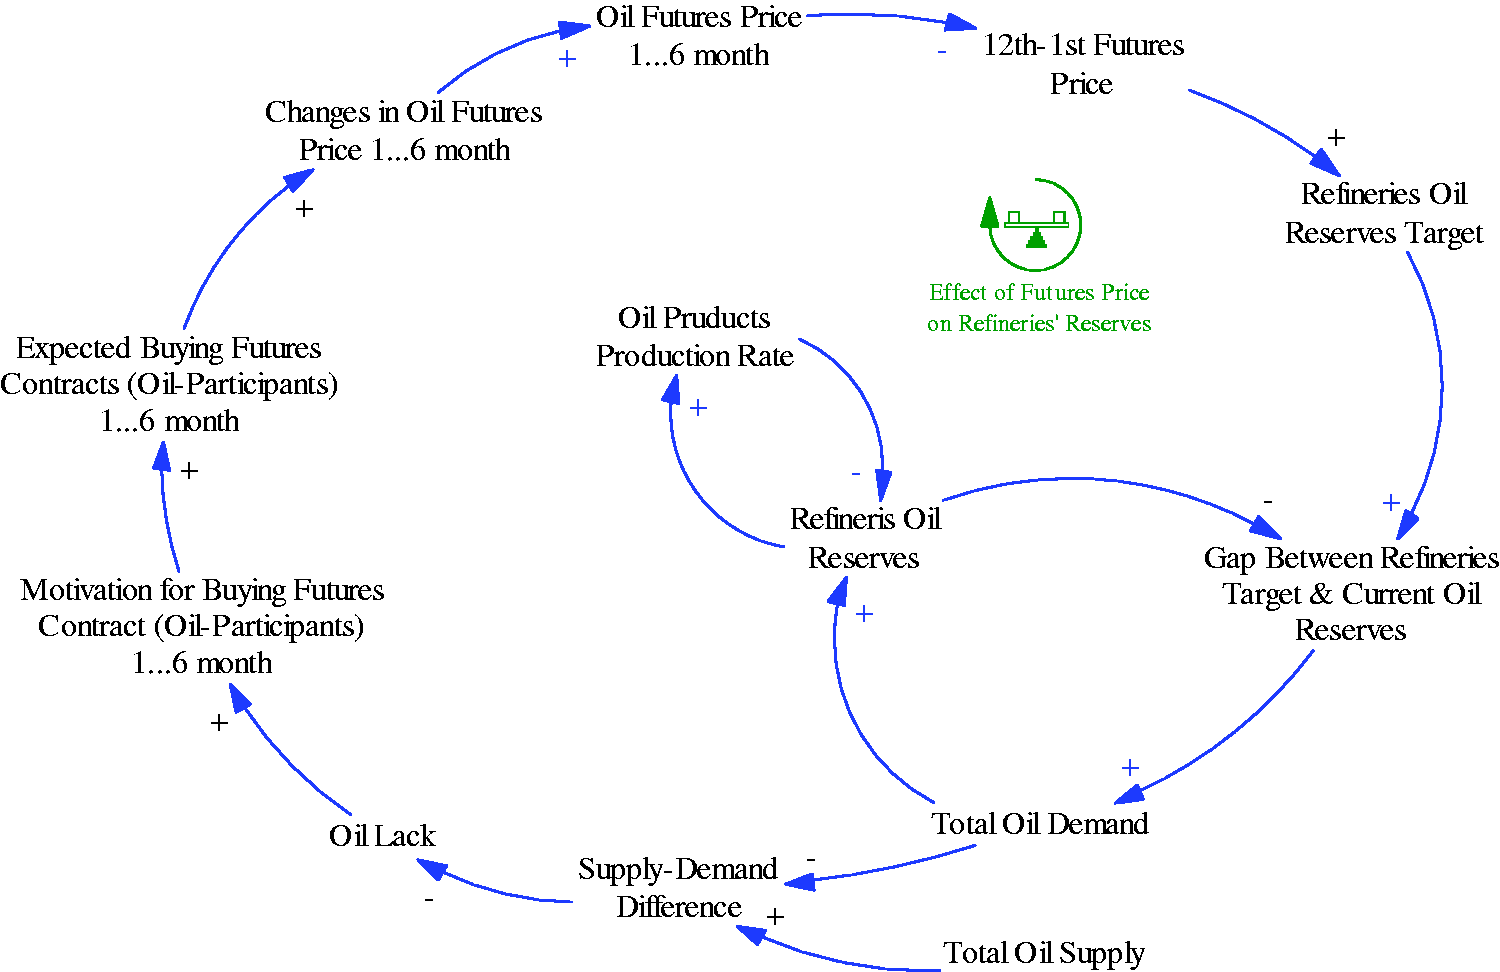
Figure 12 shows that how increase or decrease in oil demand affects volume of oil contracts in financial markets. An increase in oil demand, all else being equal, would result in oil lack in the market, which motivates oil demand side players to buy more futures contracts which finally increases futures prices. This causes an increase in spot price and its future estimation, which motivates demand side to reduce their oil demand by promoting energy intensity control programs which brings on lower demand in unit economic activity after a delay time. In contrast, a decrease in oil demand, ceteris paribus, results in oil surplus in the market which finally stimulates demand by lower prices.
Balancing loops for relationships between demand and price with the volume of futures contracts (1- to 12-month delivery is shown by “…”).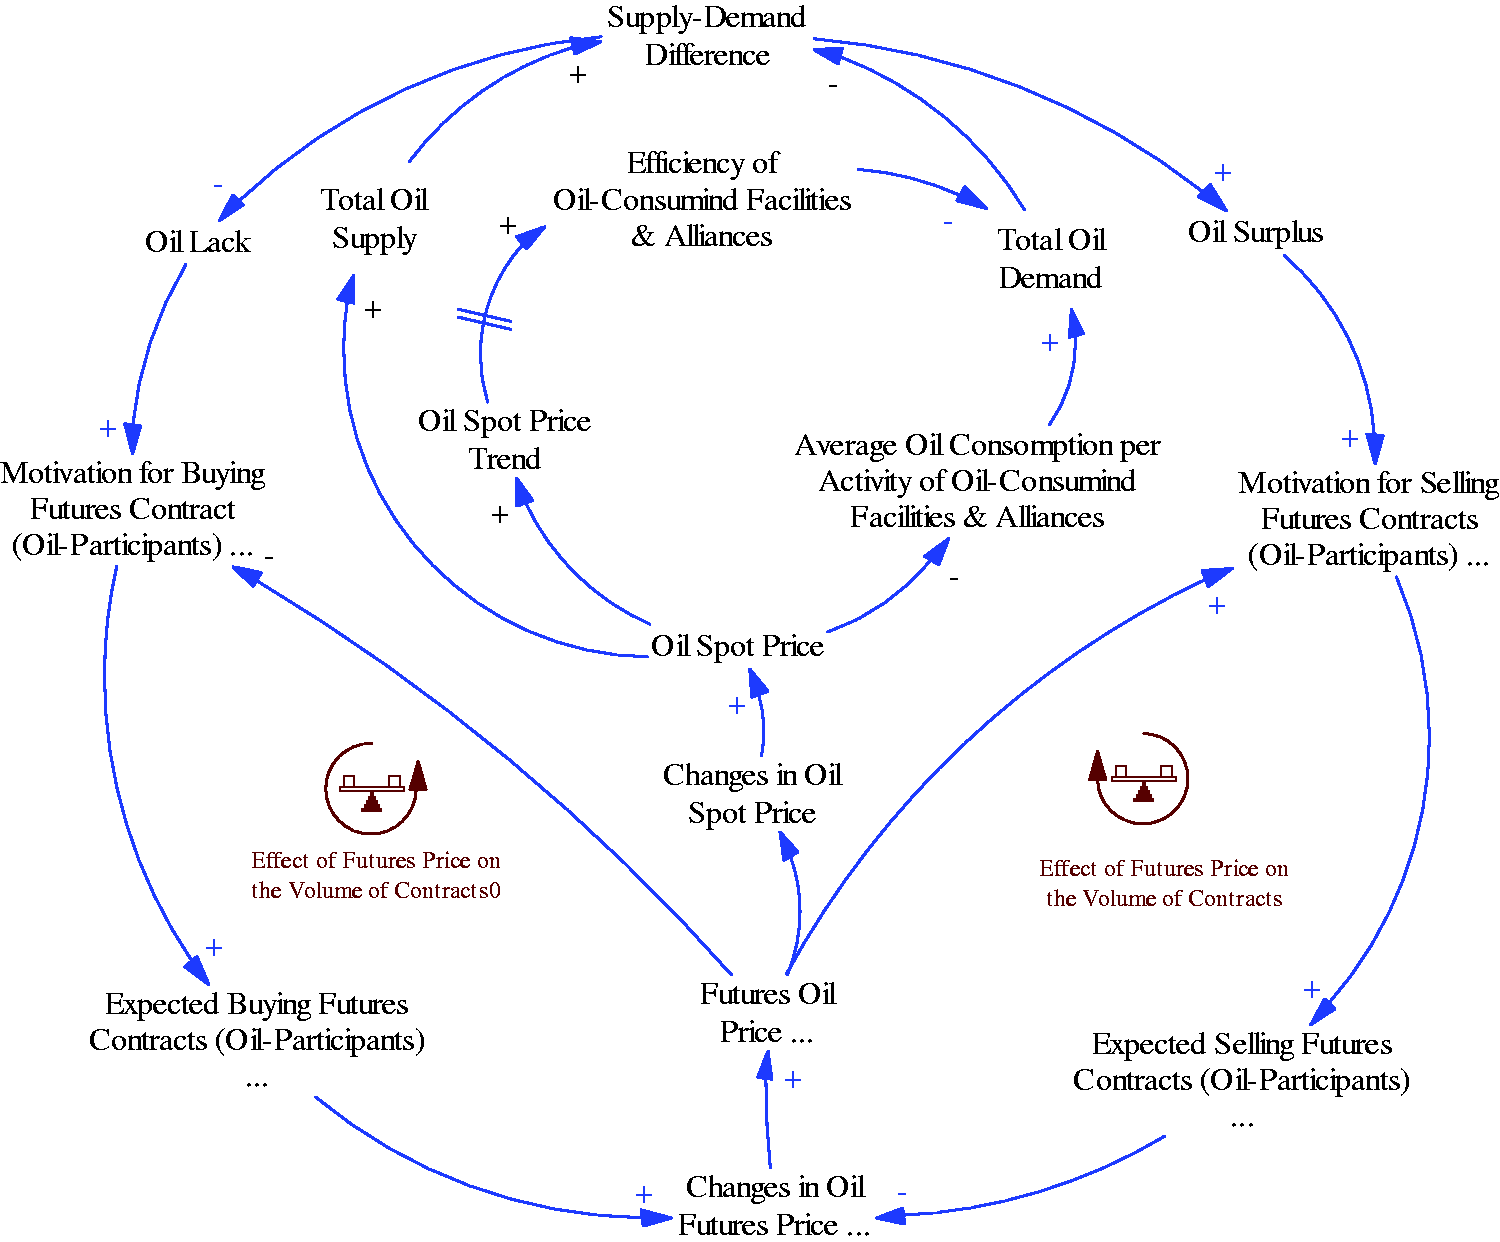
Figure 13 indicates to the structure through which speculators in financial market affect oil price. A raise in oil futures prices brings on a raise in estimations of spot price in the future, which increases motivation of speculators to buy more futures contracts; on one hand, this itself results in an increase in futures price, and on the other hand, by decreasing motivation of speculators for selling contracts, brings on futures price increment. Therefore, speculation can intensify oil increases or decreases direction which is called price bubble.
Effect of speculation in financial markets on oil price (1- to 12-month delivery is shown by “…”).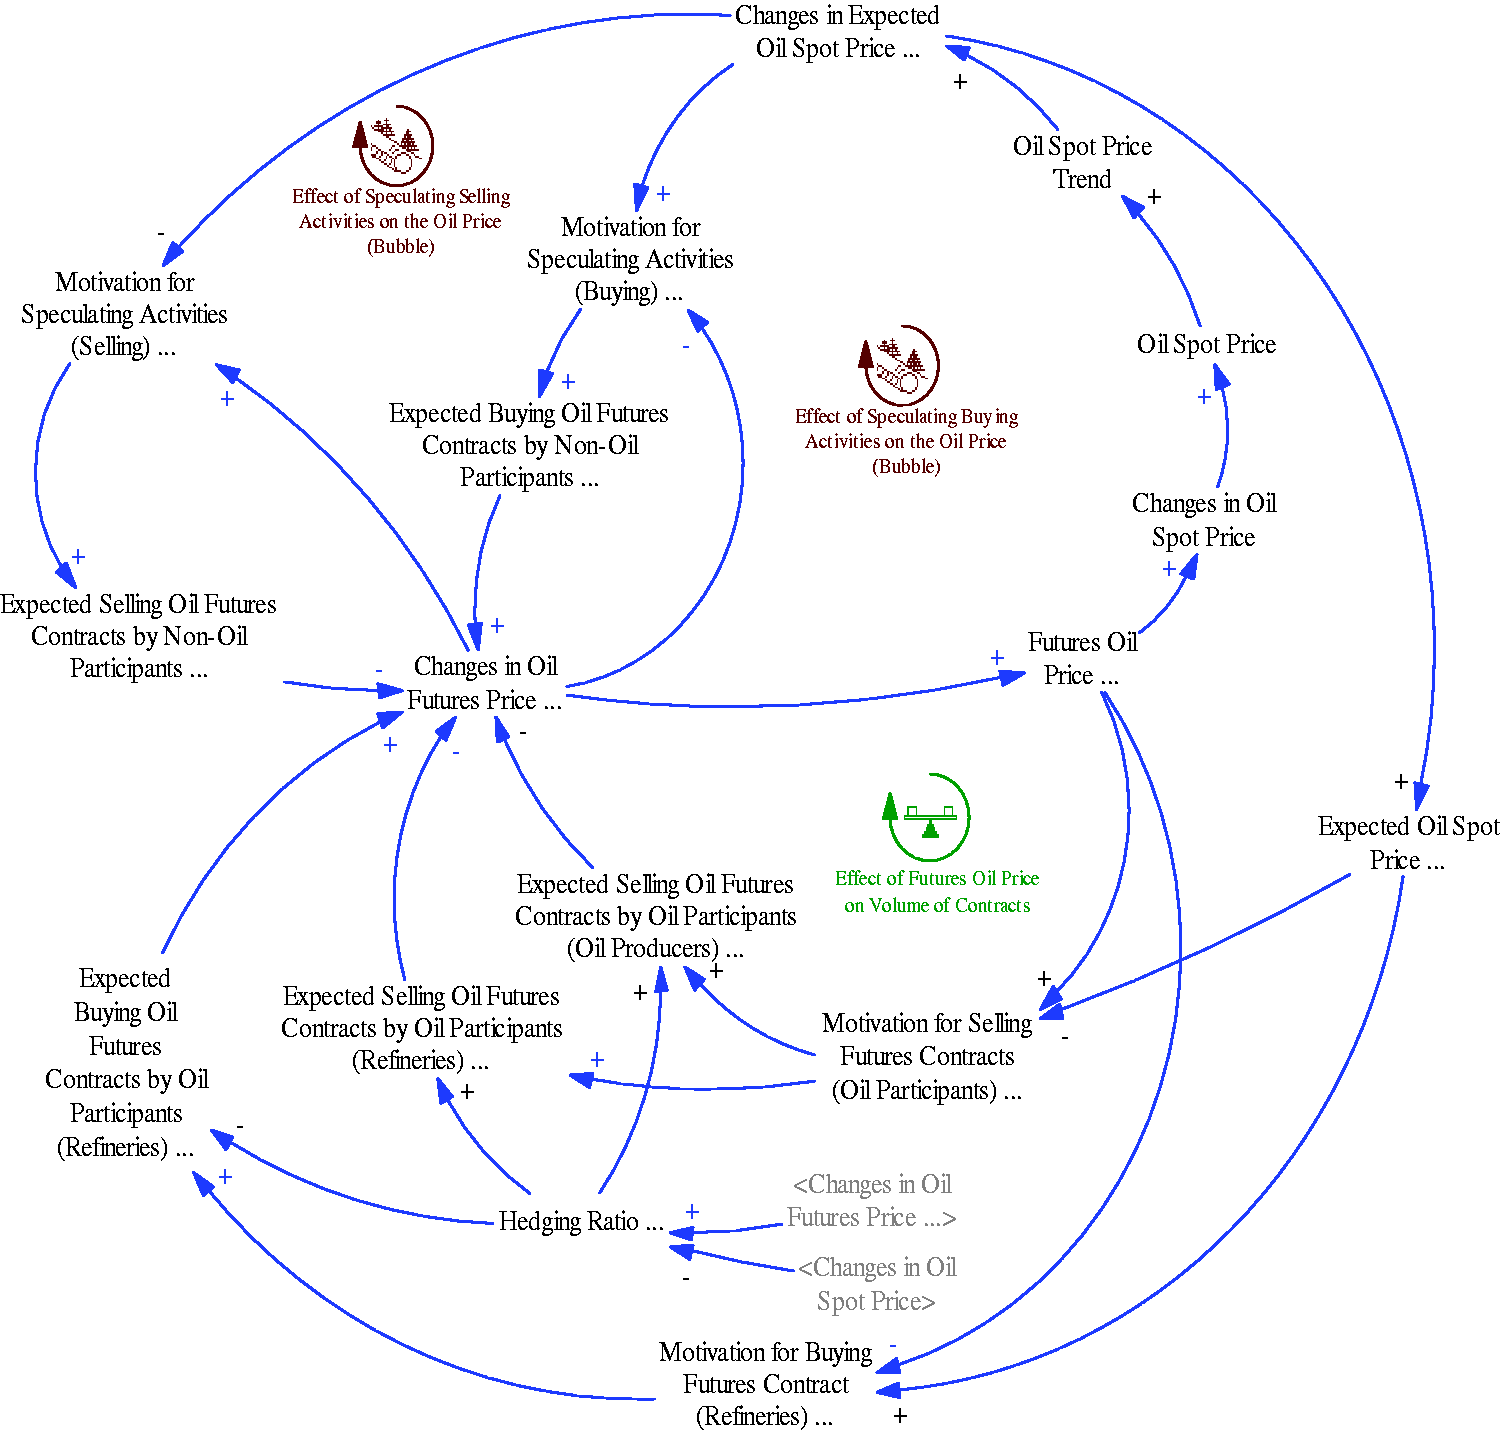
Figure 14 shows factors determining oil demand in residential, transportation, commercial, and industrial sectors. Here, the main point is relative price of petroleum products vs. substitutes. Finally, based on petroleum products demand and refineries technology to produce a specific mix of different petroleum products from crude oil, oil demand is calculated.
Loops for interrelationship between oil demand and oil price.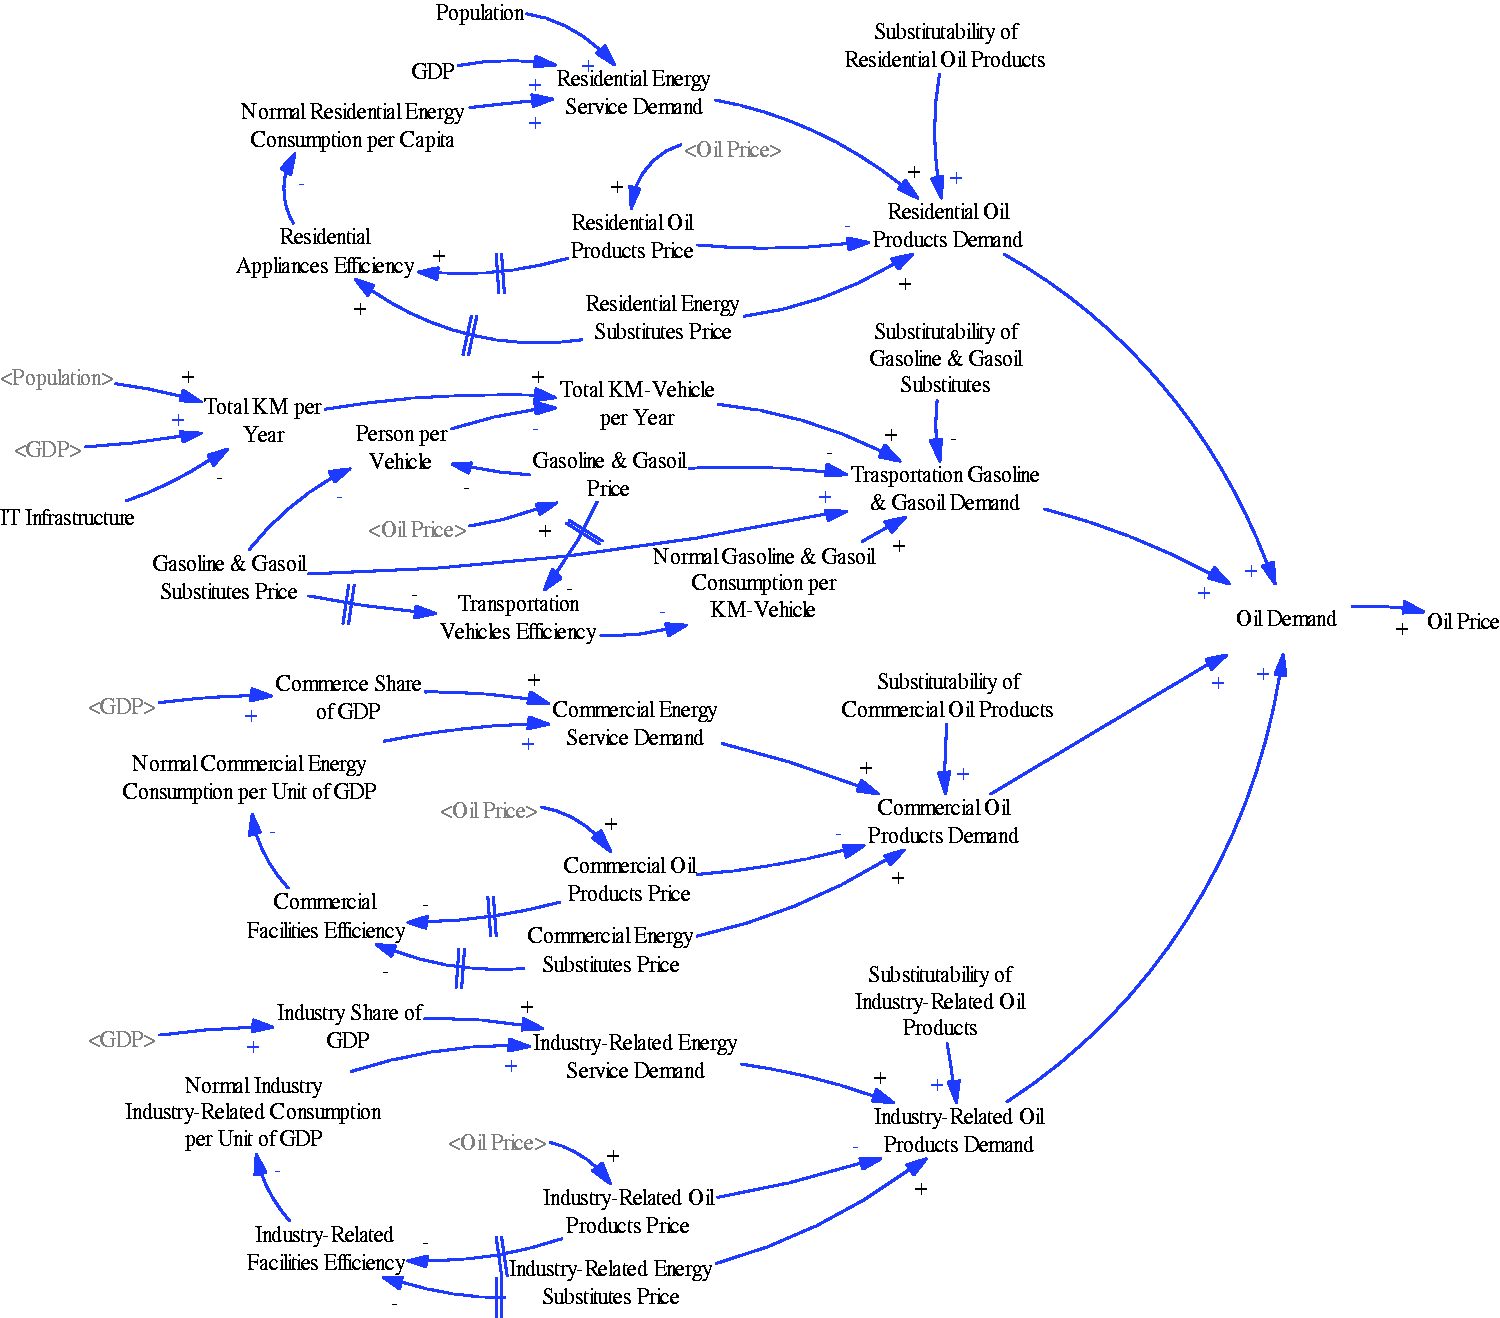
The main inputs for petroleum products demand in residential sector are welfare (here is considered by GDP) and population; the demand in transportation sector could be generally calculated by GDP, Population, and IT infrastructure; the main input of the demand in commercial and industrial sectors is GDP.
Conclusion
A concise review of literature about oil market dynamics showed that there is lack of an integrated framework for the system by which not only building block of influencing factors on oil price dynamics is explained but also causal loops and feedback structure of relationships among main variables in the market is illustrated. In this article, factors influencing on oil price dynamics are discovered through literature review and statistical analysis of oil markets data. In the next step, based on a multivariate analysis of oil price dynamics, hypothesizes are shaped and validated through a Granger causality test and regression analysis. In this analysis, unit root and co-integration test are utilized to validate the stationarity of the data and explanatory property of regression analysis results. It is shown that local analysis of the entire system with complex interrelations cannot explain the phenomena of price fluctuations well and an integrated model is missing.
In the next step, a generic conceptual framework of oil price dynamics is developed, so that the subsystems which make market dynamics are identified and their interrelationships are determined. Accordingly, a detailed conceptual framework of oil price dynamics is developed where feedback structures leading to fluctuations in the oil market are illustrated.
The developed two-stage framework can be used to conduct further quantitative research considering feedback structures in the market. Moreover, it facilitates qualitative analysis about new situations in the market, i.e. current downturn in international oil price. However, other factors such as export policies of both OPEC and Non-OPEC countries should be explicitly involved in the model.
Footnotes
Declaration of conflicting interests
The author(s) declared no potential conflicts of interest with respect to the research, authorship, and/or publication of this article.
Funding
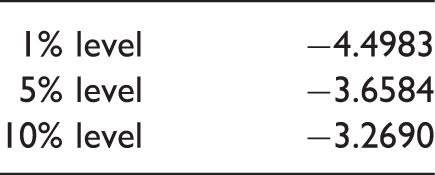
| 1% level | −4.4983 |
| 5% level | −3.6584 |
| 10% level | −3.2690 |