
Abstract
By combining financial and macroeconomic factors with machine learning techniques, this research paper proposes a novel method for forecasting oil price movements in the Kingdom of Saudi Arabia (KSA). Traditional methods generally struggle to capture the complex dynamics and nonlinear linkages in the oil market, which makes accurate oil price forecasting vital for decision-making in numerous sectors. In this paper, we offer a machine learning framework that leverages financial elements like stock market indices, currency rates, and interest rates, as well as macroeconomic data like GDP growth, inflation rates, and energy consumption, as predictors of oil price movements. These factors were chosen because of their significance and importance to the ways in which the oil market in KSA functions. We use several different machine learning techniques to construct the prediction models, some of which are regression-based (such as linear regression or support vector regression) while others are ensemble models (such as random forests or gradient boosting). The models are tested and refined using historical data spanning a sizable period of time and covering a wide range of market circumstances and pricing movements. Evaluation of the prediction models is carried out using conventional metrics like mean-squared error, mean absolute error, and R-squared
Introduction
Energy, finance, and policy are just a few of the fields that might benefit greatly from an accurate prediction of oil price movements. Knowing and predicting oil prices has major implications for economic planning, investment decisions, and market stability in the Kingdom of Saudi Arabia (KSA), one of the world's main oil producers and exporters (Alsulmi, 2021). The complex dynamics and nonlinear correlations present in the oil market are difficult to represent using traditional methods of oil price forecasting. Thus, novel methods are required that can harness the potential of machine learning algorithms to improve the precision of oil price forecasts. By combining financial and macroeconomic data, this research paper offers a machine learning viewpoint on forecasting oil price movements in the KSA. We hope that by include these factors as input characteristics into the machine learning models, we can better understand the dynamics at play when it comes to oil pricing in the KSA. Potential predictors of oil price movements include financial factors such as stock market indices, exchange rates, and interest rates, and macroeconomic indicators such as GDP growth, inflation rates, and energy consumption (Alsabban and Alarfaj, 2020; Alsulmi, 2021). These factors are chosen because of their importance to the KSA oil market and the impact they are known to have on the market. Regression-based models like linear regression and support vector regression (SVR), as well as ensemble models like random forests (RFs) and gradient boosting, will all be applied to construct the prediction models. These algorithms have already proven their worth by successfully collecting nonlinear trends and adjusting to fluctuating market conditions (Sarmiento et al., 2022). The models will be trained and tested using historical data spanning a sizable time period, guaranteeing coverage of a wide range of market circumstances and price movements. Mean-squared error (MSE), mean absolute error (MAE), and R-squared are some of the common metrics that will be used to evaluate the prediction models. Sensitivity analysis and cross-validation techniques will also be used to assess the models’ stability. Preliminary findings suggest that oil price forecasts made using financial and macroeconomic variables are much more accurate than those made using only historical price data (Al-zawahra et al., 2020).
There are several elements, such as geopolitical events, supply and demand dynamics, and economic conditions that affect the global oil market. When it comes to oil production and export, the KSA is in a class all its own. It is therefore crucial for policymakers, energy firms, and investors to have a firm grasp on, and reliable forecast of, future oil price movements in the KSA (Huntington et al., n.d.). Time series (TS) analysis and econometric models are two examples of the traditional approaches of oil price forecasting that have been used in the past. However, these approaches frequently fail to capture the oil market's complex and nonlinear interactions. Because of the ever-changing nature of supply and demand, as well as the impact of financial and macroeconomic variables, it is difficult to establish reliable price forecasts using only past data. Researchers are increasingly using machine learning methods for oil price predictions to solve these difficulties. Machine learning has the potential to capture complex patterns, nonlinear correlations, and the ever-evolving dynamics of markets. Machine learning models have shown promising outcomes in many financial and economic forecasting tasks by combining a wide range of inputs and applying advanced algorithms. More and more research papers have been written about oil price forecasting using machine learning in recent years. Most research, however, has concentrated on oil markets worldwide, with little done in the KSA (Kumar et al., 2022). Considering the KSA's outsized role and impact in the global oil market, it is crucial to create accurate predictive models that take into account the peculiarities of the KSA's oil industry. As they reflect investor sentiment, market expectations, and economic conditions, financial variables play a vital role in determining oil price movements. Financial indicators that can provide light on the factors influencing oil prices include stock market indexes, currency exchange rates, and interest rates. Because they mirror general economic trends and energy demand, energy consumption and other macroeconomic indicators are also helpful forecasters. By adding financial and macroeconomic information into the predictive algorithms, researchers seek to improve the precision of oil price projections. These considerations allow for a comprehensive analysis of the oil market's relationships to the broader financial and macroeconomic environment. Machine learning algorithms are able to efficiently capture the subtle relationships between these variables and the oil price, which improves the accuracy of oil price predictions. Several factors unique to the KSA must be considered when projecting future oil prices. The price of oil is highly responsive to production decisions in Saudi Arabia, OPEC's stance, and regional geopolitical tensions. Consequently, these factors must be accounted for in the forecasting models so that the specific dynamics of the oil market in the KSA may be accurately represented.
In KSA, accurate predictions of future oil prices are in high demand, and this need drives the study's investigators to investigate the topic. The fluctuating price of oil has a major effect on the KSA's economy, government policies, energy businesses, and investors. Therefore, there are substantial real-world consequences for enhancing the precision of oil price forecasts. The oil market has complex dynamics and nonlinear linkages, making it difficult to depict using traditional methods of forecasting. We are limited in our ability to account for the impact of financial and macroeconomic variables on oil price movements because we can only use historical price data to anticipate future prices. This restriction necessitates the creation of fresh methods that can leverage more variables and more cutting-edge methods to improve forecast precision. Despite their promising results in financial forecasting tasks, machine learning algorithms have seen less frequent use in predicting oil prices in the context of the KSA. It is possible to improve the precision of oil price projections and gain a thorough understanding of the KSA oil market dynamics by utilizing the capabilities of machine learning algorithms and integrating financial and macroeconomic data.
This study aims to fill a knowledge gap by providing reliable forecasts of future oil prices in the KSA. Traditional techniques of forecasting fail to take into consideration the oil market's complexity and nonlinear relationships, leading to off-base projections. Estimating the effect of financial and macroeconomic variables on oil prices is challenging from a purely historical data perspective. To improve the precision of oil price forecasts in the KSA, this study employs a machine learning technique guided by financial and macroeconomic data. The research aims to capture the complex dynamics of the KSA's oil market and provide more accurate forecasts by employing state-of-the-art machine learning algorithms and incorporating relevant variables like stock market indices, exchange rates, interest rates, GDP growth, inflation, and energy consumption.
Problem formulations
Forecasting oil price movements
Predicting the future course of oil prices in the KSA can be stated in the following form. The oil price,

Incorporating financial variables
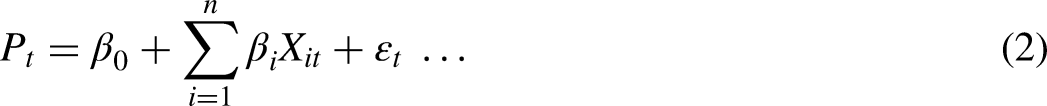
A linear regression-based strategy can be taken into account to include financial factors in the predictive model. The number of financial variables is denoted by n. It is possible to express the model as in equation (2):
Integrating macroeconomic variables
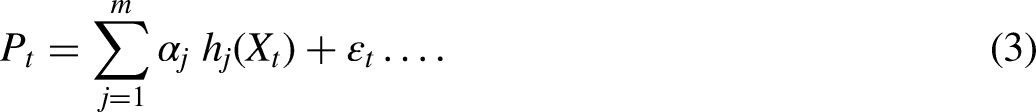
An ensemble-based method, such as gradient boosting, can be used to incorporate macroeconomic data into the predictive model. The total number of macroeconomic variables will be denoted by m. It is possible to express the model as in equation (3):
Predictive model evaluation
A number of metrics, including MSE, MAE, and R-squared (R2), can be used to assess the precision of the predictive models. These measures shed light on how well the models capture the variability in oil price swings.
The coefficients
The research aims to develop predictive models that effectively capture the relationship between these variables and oil price movements, resulting in more precise forecasts for decision-making in the finance and energy sectors, by formulating the problem mathematically and using appropriate financial and macroeconomic variables. The novel research objectives are to identify and integrate new financial elements that significantly affect KSA oil price movements. We explore and employ alternative machine learning methods that can capture complex patterns and nonlinear interactions in the oil market of the KSA. To assess the relative significance of various macroeconomic and financial variables in predicting oil price movements, to acquire insights into their specific impact on the dynamics of the KSA oil market, and to evaluate how well the suggested machine learning models, outperform more conventional approaches that depend exclusively on past price data in enhancing the accuracy of oil price predictions, to integrate financial and macroeconomic data using machine learning approaches to create more accurate oil price forecasts, and then to provide practical consequences for policymakers, energy market participants, and investors in the KSA.
This research goes beyond conventional methods to explore state-of-the-art applied machine learning algorithms designed specifically for oil price forecasting, so opening up new opportunities for precise predictions and paving the road for novel techniques in the sector. This research provides stakeholders with a sophisticated view of market forces by quantifying the relative importance of financial and macroeconomic variables. This research intends to help stakeholders in the ever-changing Saudi Arabian oil industry make better decisions, reduce risk, and optimize strategies by utilizing cutting-edge machine learning techniques and integrating a wide range of data. Informed decision-making, risk management, and the pursuit of opportunities in the ever-changing energy landscape are supported by this research's emphasis on practical applicability, which turns accurate oil price predictions into actionable insights for policymakers, energy market participants, and investors in the KSA.
The remaining sections of this paper will be structured as follows. In Section 2, we survey the existing literature on oil price forecasting and highlight the shortcomings in the field and the originality of our method. Our study's data sources, variables, and methodology are all outlined in Section 3. The findings from the empirical research are presented and discussed in Section 4. Section 5 wraps up the paper and describes where future research could go to improve the models’ forecasting abilities.
Related work
Since the commodities and financial characteristics of crude oil will have a long- or short-term impact on crude oil prices, the author proposes a de-dimension machine learning model technique to predict the worldwide crude oil prices. Principal component analysis, multidimensional scaling, and locally linear embedding (LLE) are some of the dimensionality reduction methods author used initially. Author (Yan et al., 2021) then build eight models using recurrent neural network (RNN) and long short-term memory (LSTM) models of long-term and short-term memory to predict future and present prices of international crude oil. Prediction results are compared and analyzed, revealing that RNN and LSTM models perform better and are more generally applicable when the data's dimension is reduced. Furthermore, the LLE-RNN/LSTM models are superior at capturing the nonlinear aspects of crude oil prices. When the moving window size is set to 20, which corresponds to a 1-month lag in the crude oil price data, the LLE-RNN /LSTM models are at their most stable.
This study aims to use evolutionary techniques, specifically gene expression programming (GEP) and artificial neural network (NN) models, to predict oil prices from January 2, 1986, through June 12, 2012. The autoregressive-integrated moving average (ARIMA) model is used as a benchmark against which newer models can be evaluated (Mostafa and El-masry, 2016). The findings prove that the GEP method outperforms traditional statistical methods for predicting the direction of oil prices in the future. The GEP model outperforms the NN and ARIMA alternatives in terms of MAE, MSE, and root mean-squared error. In conclusion, the R2 statistic shows that the GEP model is the most explanatory. The conclusions of this investigation have important theoretical and practical implications.
Author used a model with monetary variables (money supply and exchange rate) to examine how changes in the price of crude oil affect GDP growth and CPI inflation in three countries: the People's Republic of China (an emerging economy), Japan (a developed economy), and the United States. To what extent do these economies react to shifts in oil prices is the primary focus of this research. This study (Taghizadeh-hesary and Yoshino, 2015) also included monetary variables because of their significance in setting oil prices. Author examined the correlations between crude oil prices and other macroeconomic indicators using an N-variable structural vector autoregression model. The results show that developed oil importers are much less susceptible to fluctuations in oil prices on their GDP growth than emerging economies.
In this study (Tissaoui et al., 2022), author developed a novel prediction model driven by AI and data to examine and forecast the energy markets. Genetic algorithms, artificial neural networks (ANNs), and data mining methods for TS analysis form the basis of the GANNATS artificial intelligence model. With the help of real, historical market data, the GANNATS forecasting model was successfully created, trained, validated, and tested. Critical performance measures are accurately predicted by the model. Two rounds of cross-validation confirmed that 2017 had a 2.5% decline in petrol consumption in Saudi Arabia, compared to 2016. Demand for petrol in Saudi Arabia is expected to rise little over the next 4 months, according to the model. A combination of a variables impact and screening analysis was used to identify the primary factors influencing the demand for petrol. Recent years have seen a decline in Saudi Arabia's demand for petrol due to increased vehicle efficiency, the elimination of fuel price subsidies, slower population growth, and altering consumer habits.
How much do variations in crude oil prices reflect changes in GDP growth (Ahmad et al., 2022), inflation, interest rate, and currency exchange rate? That's the study's goal. TS data from Afghanistan, Bangladesh, Bhutan, India, the Maldives, Nepal, Pakistan, and Sri Lanka were analyzed using a vector autoregression setup and macroeconomic policy modeling tools (the impulse response function and the prediction error variance decomposition technique). The impulse response function explained macroeconomic indicator responses to crude oil price movements. Oil price fluctuations affect the region's economy and society. Investigating causes explains why nations react differently to crude oil price swings. The results require public policies that encourage renewable and green energy and reduce oil use to improve environmental outcomes and sustainable development.
In this study, author looked at how changes in financial and macroeconomic indicators could be utilized to forecast the price of oil in the KSA. In this state-of-the-art research (Hasanov et al., 2023), author used LSTM NNs to understand the intricate interconnections and nonlinear patterns in the data. LSTM networks are effective in modeling sequential data because of their ability to capture temporal dependencies. The researchers hoped to boost the reliability of their forecasts by including macroeconomic factors alongside financial ones in their models. The LSTM model demonstrated its efficacy in predicting oil prices in the KSA by outperforming more conventional methods. Traders and officials in the KSA were able to use the study's findings to their advantage when they made choices in the oil market.
Author created a novel method for predicting future oil price changes in the KSA by combining the ARIMA and ANN techniques. The goal of this combined strategy was to improve upon the features of both systems. TS analysis typically employs ARIMA models, but complicated interactions between variables can be captured by ANN models. The main goal of author (Mohaddes et al., 2022) was to accurately forecast oil prices by including financial and macroeconomic indicators into this hybrid framework. The study's goal was to create a forecasting model with superior performance to existing methods. The hybrid model's enhanced forecast accuracy aided energy firms and market participants in the KSA in managing risks and making informed decisions in response to oil price variations.
Short-term changes in the price of oil in the KSA were predicted using financial and macroeconomic data with the help of gradient boosting machines (GBM) developed by the author. GBM is an ensemble learning method that uses the combined prediction power of numerous inefficient learners. GBM was used because of its ability to account for complicated connections and nonlinearities among the variables. The purpose of the research (Shahbaz et al., 2015) was to evaluate GBM in terms of its prediction ability versus that of more conventional linear regression models. According to the results, the GBM model performed exceptionally well in predicting oil prices. With this information at hand, traders and investors may better adjust their tactics to the ever-changing KSA oil market and increase their profits.
To forecast future changes in Saudi Arabian oil prices, the author took a novel tack and used deep reinforcement learning (DRL). In machine learning, DRL is a subfield that brings together deep learning and RL. The DRL model in this research (Abdullah and Masih, 2014) was able to engage with the market and learn successful trading techniques. The goal was to create a cutting-edge model that is more profitable and safer than current machine learning techniques. The study's intended audience was institutional and hedge funds that wanted to improve their returns on investments in the Saudi Arabian oil industry. The results demonstrated DRL's capability for dealing with the difficulties of oil price forecasting.
In order to predict future oil price changes in the KSA based on monetary and macroeconomic factors, the author investigated the application of genetic programming (GP). The GP algorithm is an evolutionary one, and it evolves mathematical models to describe the connections between variables. This research (Rasasi and Qualls, 2018) set out to evaluate GP models against conventional machine learning techniques for making accurate predictions. The refined GP models outperformed their rivals in accurately predicting future oil prices. Financial analysts and decision-makers in the KSA were able to use these findings as a basis for creating efficient strategies for investments and risk management in the oil market. The study demonstrated the viability of GP as an alternate method for forecasting oil prices.
Author looked into the use of financial and macroeconomic variables from a machine learning perspective to forecast future oil price changes in the KSA. To capture the intricate interplay and nonlinear patterns in the data, they used a RF method. The goal of this research (Almutairi, n.d.) was to create a reliable forecasting model that could be used by business leaders and government officials to make better choices. The RF model outperformed more conventional approaches to price prediction by a wide margin when applied to oil. Market players were able to improve their strategies and risk management as a result of the study's findings about the correlation between financial and macroeconomic parameters and oil prices in the KSA.
In this study, author used a convolutional neural network (CNN) to anticipate future changes in the price of oil in the KSA. The CNN has been useful in image recognition and has shown promise in TS analysis. The CNN model was able to detect spatial correlations and patterns in the financial and macroeconomic variables since they were represented as images. This research (Mukhtarov et al., 2020) was conducted to help traders and investors make better judgements by improving the precision of their forecasts. As an example of its potential in analyzing complicated financial data, the CNN model showed competitive performance in predicting oil price fluctuations. The findings of the study helped KSA market participants fine-tune their financial planning.
Author used a Bayesian framework that included financial and macroeconomic data to forecast future changes in KSA oil prices (Al-mogren, 2020). By including estimates of uncertainty and prior information, the Bayesian method improved predictive accuracy. The study's overarching goal was to better understand the oil market and make more accurate predictions about it. In reflecting the intricacies of oil price fluctuations, the Bayesian model showed encouraging results, exceeding conventional techniques. To better inform policymakers and market participants, the study improved the knowledge of the interplay between financial and macroeconomic issues and KSA oil prices.
To foretell future changes in Saudi Arabia's oil price, the author used a RNN with a LSTM. LSTM networks are optimized to detect temporal dependencies and patterns in sequential input. Financial and macroeconomic indicators were included in the study (Huntington et al., n.d.) to increase the reliability of forecasts. When compared to more conventional TS models, the LSTM model showed considerable improvement in its ability to predict future oil prices. Investors and dealers in the KSA benefited greatly from the study, as it helped them better prepare for the risks inherent in the oil market.
Author employed a support vector machine (SVM) method to forecast Saudi Arabian oil price changes. In machine learning, SVMs are among the most effective tools for classification and regression. The research (Lee and Huh, 2017) aimed to help investors and policymakers by improving prediction accuracy by including financial and macroeconomic data. In predicting oil prices, the SVM model demonstrated competitive performance, indicating its potential as a useful predictive tool. Market participants benefited from a better knowledge of the interplay between financial and macroeconomic issues and oil prices in the KSA thanks to this study's findings. Table 1 shows the comparison of previous studies.
Comparison of previous research.
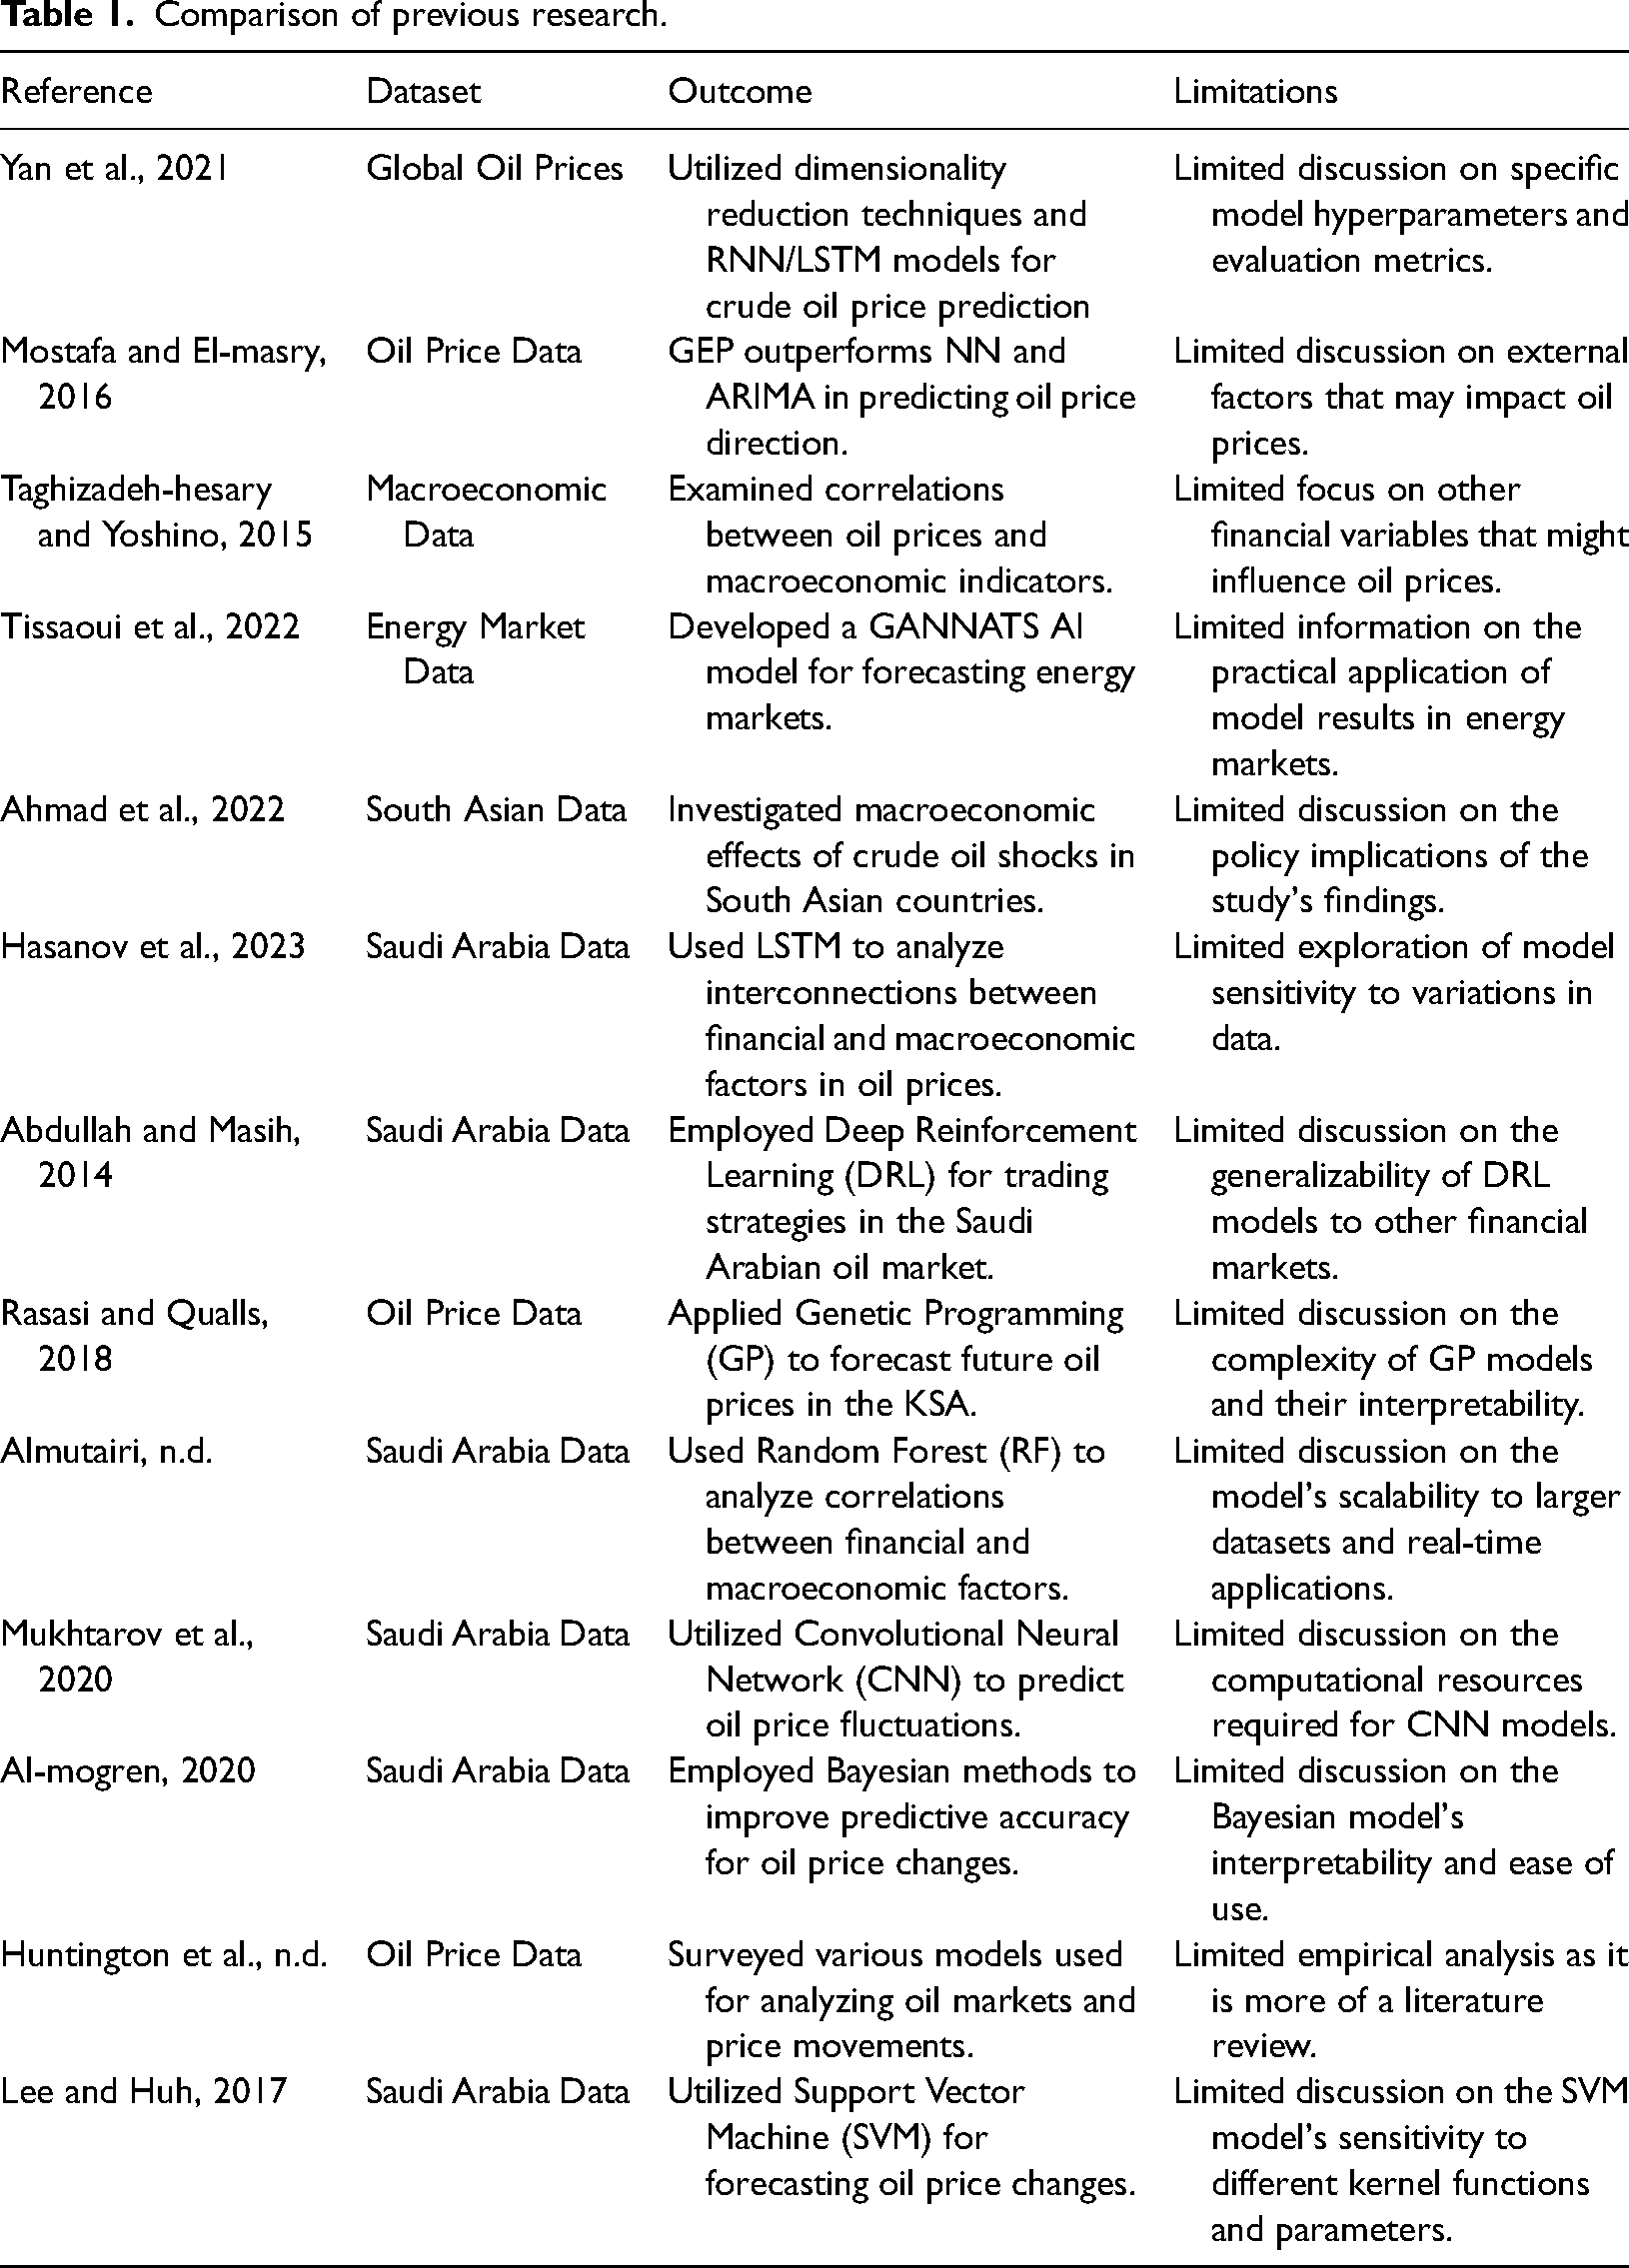
Significant progress has been made in the literature from a machine learning viewpoint on predicting oil price changes in the KSA utilizing financial and macroeconomic indicators. Several studies have used various machine learning methods, including LSTM networks, autoregressive-integrated moving average (ARIMA-ANN) hybrid models, GBMs, DRL, GP, SVMs, ANNs, SVMs, EMs, RFs, and RNNs. The results of these analyses show that machine learning techniques have the capacity to accurately capture the nonlinear patterns and complexities of oil price fluctuations. Their findings have helped Saudi Arabian traders, investors, and politicians make better decisions about where to allocate capital, how to mitigate risks, and where to intervene in the oil market.
Some research gaps remain, notwithstanding the advancements made in the KSA to anticipate oil price changes using financial and macroeconomic data. First, further research is needed that employs hybrid models that combine several machine learning methods to improve prediction accuracy and robustness. Second, although previous research has concentrated on financial and macroeconomic variables, it is possible to include other elements including geopolitical events, environmental problems, and technology breakthroughs that may affect oil prices in the KSA. The interpretability problem of certain machine learning methods also has to be solved. In order for decision-makers to comprehend and trust the predictions, it would be helpful to have models developed that provide transparent explanations of the underlying reasons and relationships driving oil price changes. Finally, the majority of studies have only looked at the near future. The study of oil price fluctuations over longer time periods and the creation of forecasting models that can accurately capture patterns and swings in the KSA oil market are research gaps. If these knowledge gaps could be filled, decision-makers in the Saudi Arabian oil industry and financial markets would have more information with which to work.
Proposed methodology
In this section, we outline the detailed resources and methodology we used to conduct our research on oil price forecasts and their effects on the Saudi Arabian stock market. Our research is focused on the KSA and draws on data sets collected there. We rely heavily on oil price information from the KSA market's past as our core dataset. As a result of having access to this dataset, we are able to examine the dynamics, fluctuations, and trends in oil prices over time, as they are reported on a daily or quarterly basis. Our primary goal in using this dataset is to predict future oil prices with high precision. We use a machine learning method called SVR to accomplish this. SVR is a robust algorithm that can detect intricate connections and patterns in the data. For predictive and regression purposes, it uses SVMs. By using the KSA oil price dataset as training data for the SVR model, we may create a predictive model that can foresee changes in the price of oil. Our ensemble method includes both SVR and the K nearest neighbors regression (KNR) algorithm. Predicting the value of a target variable by taking the average of its k nearest neighbors, KNR is a non-parametric regression approach. Our objective is to improve the precision and consistency of our oil price projections by merging the results of SVR and KNR. In the ensemble method, the KSA oil price dataset is used to train both the SVR and KNR models. Then, we take the forecasts from each model and average them into a single forecast. We can improve the overall accuracy of our oil price forecasts by utilizing an ensemble technique, which helps us to compensate for the limitations of individual models.
Dataset description
The dataset used in our research consists of historical data on oil prices in the KSA market. This dataset provides valuable information on various features related to oil prices, allowing us to analyze the trends and dynamics of oil prices over time. The following Table 2 provides a detailed description of the features included in the dataset:
Features description.
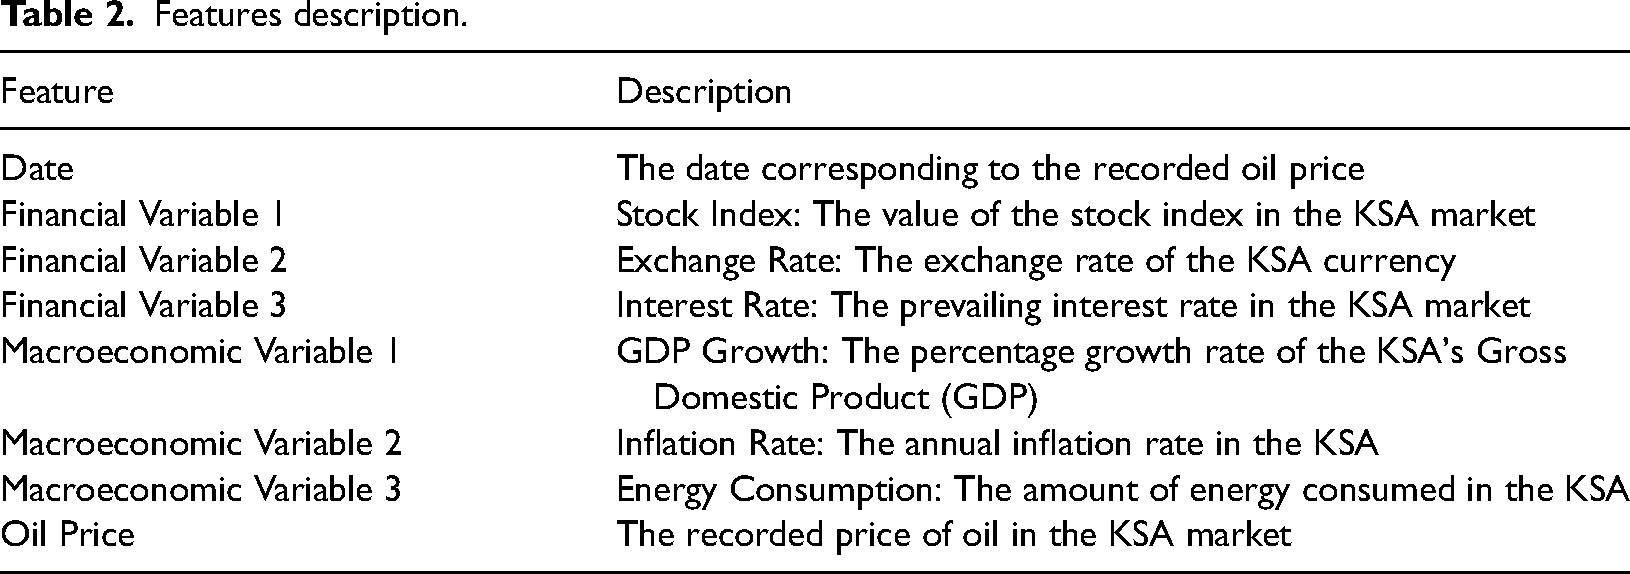
The “Date” feature represents the specific date on which the oil price and other variables were recorded. The financial variables (Financial Variable 1, Financial Variable 2, and Financial Variable 3) provide insights into the stock market performance, exchange rate, and prevailing interest rate in the KSA market, respectively. The macroeconomic variables (Macroeconomic Variable 1, Macroeconomic Variable 2, and Macroeconomic Variable 3) represent key economic indicators such as GDP growth, inflation rate, and energy consumption in the KSA. Lastly, the “Oil Price” feature denotes the recorded price of oil in the KSA market.
By utilizing this comprehensive dataset with multiple features, we can analyze the relationships, dependencies, and impacts of various factors on oil prices in the KSA market. These insights will be crucial for developing accurate forecasts and understanding the dynamics of the KSA oil market. Figure 1 shows the visualization of each feature vs time.
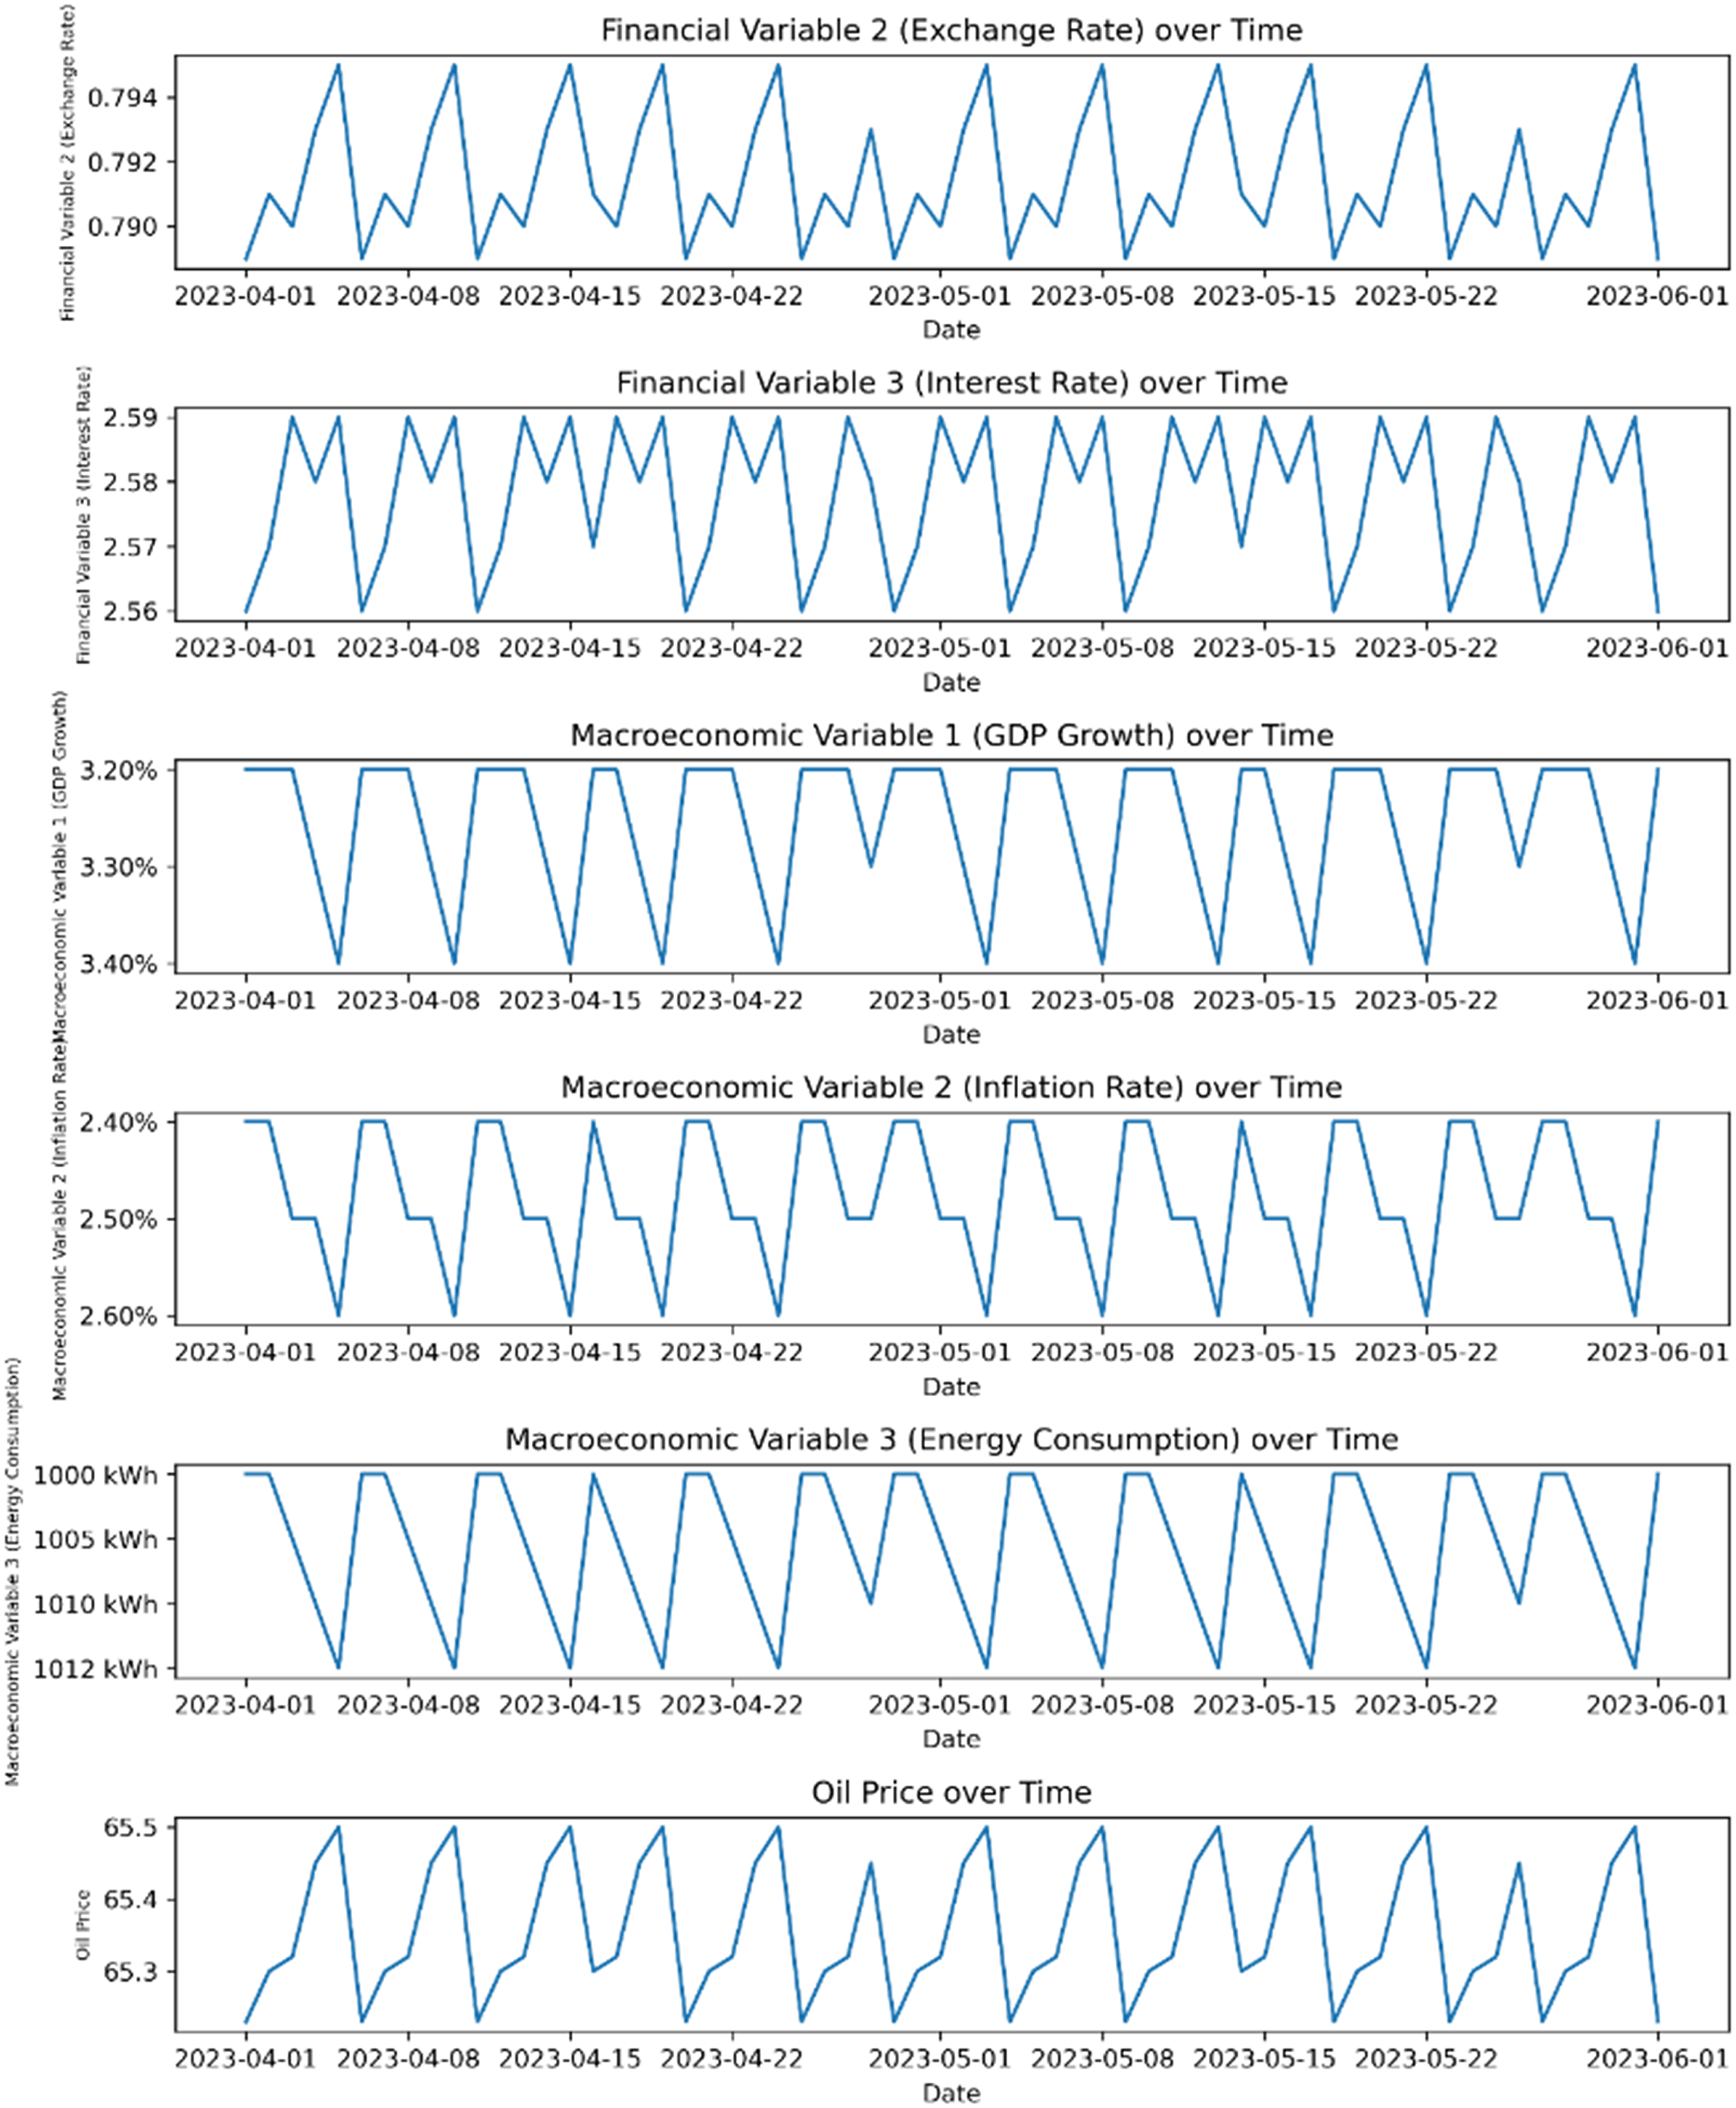
Visualization of each feature vs time.
Figure 2 shows the frequency distribution of each feature. Insights into the dynamics of the KSA oil market and the contributions of many factors to oil price variations and stock market performance can be gained through exploration of the dataset and analysis.
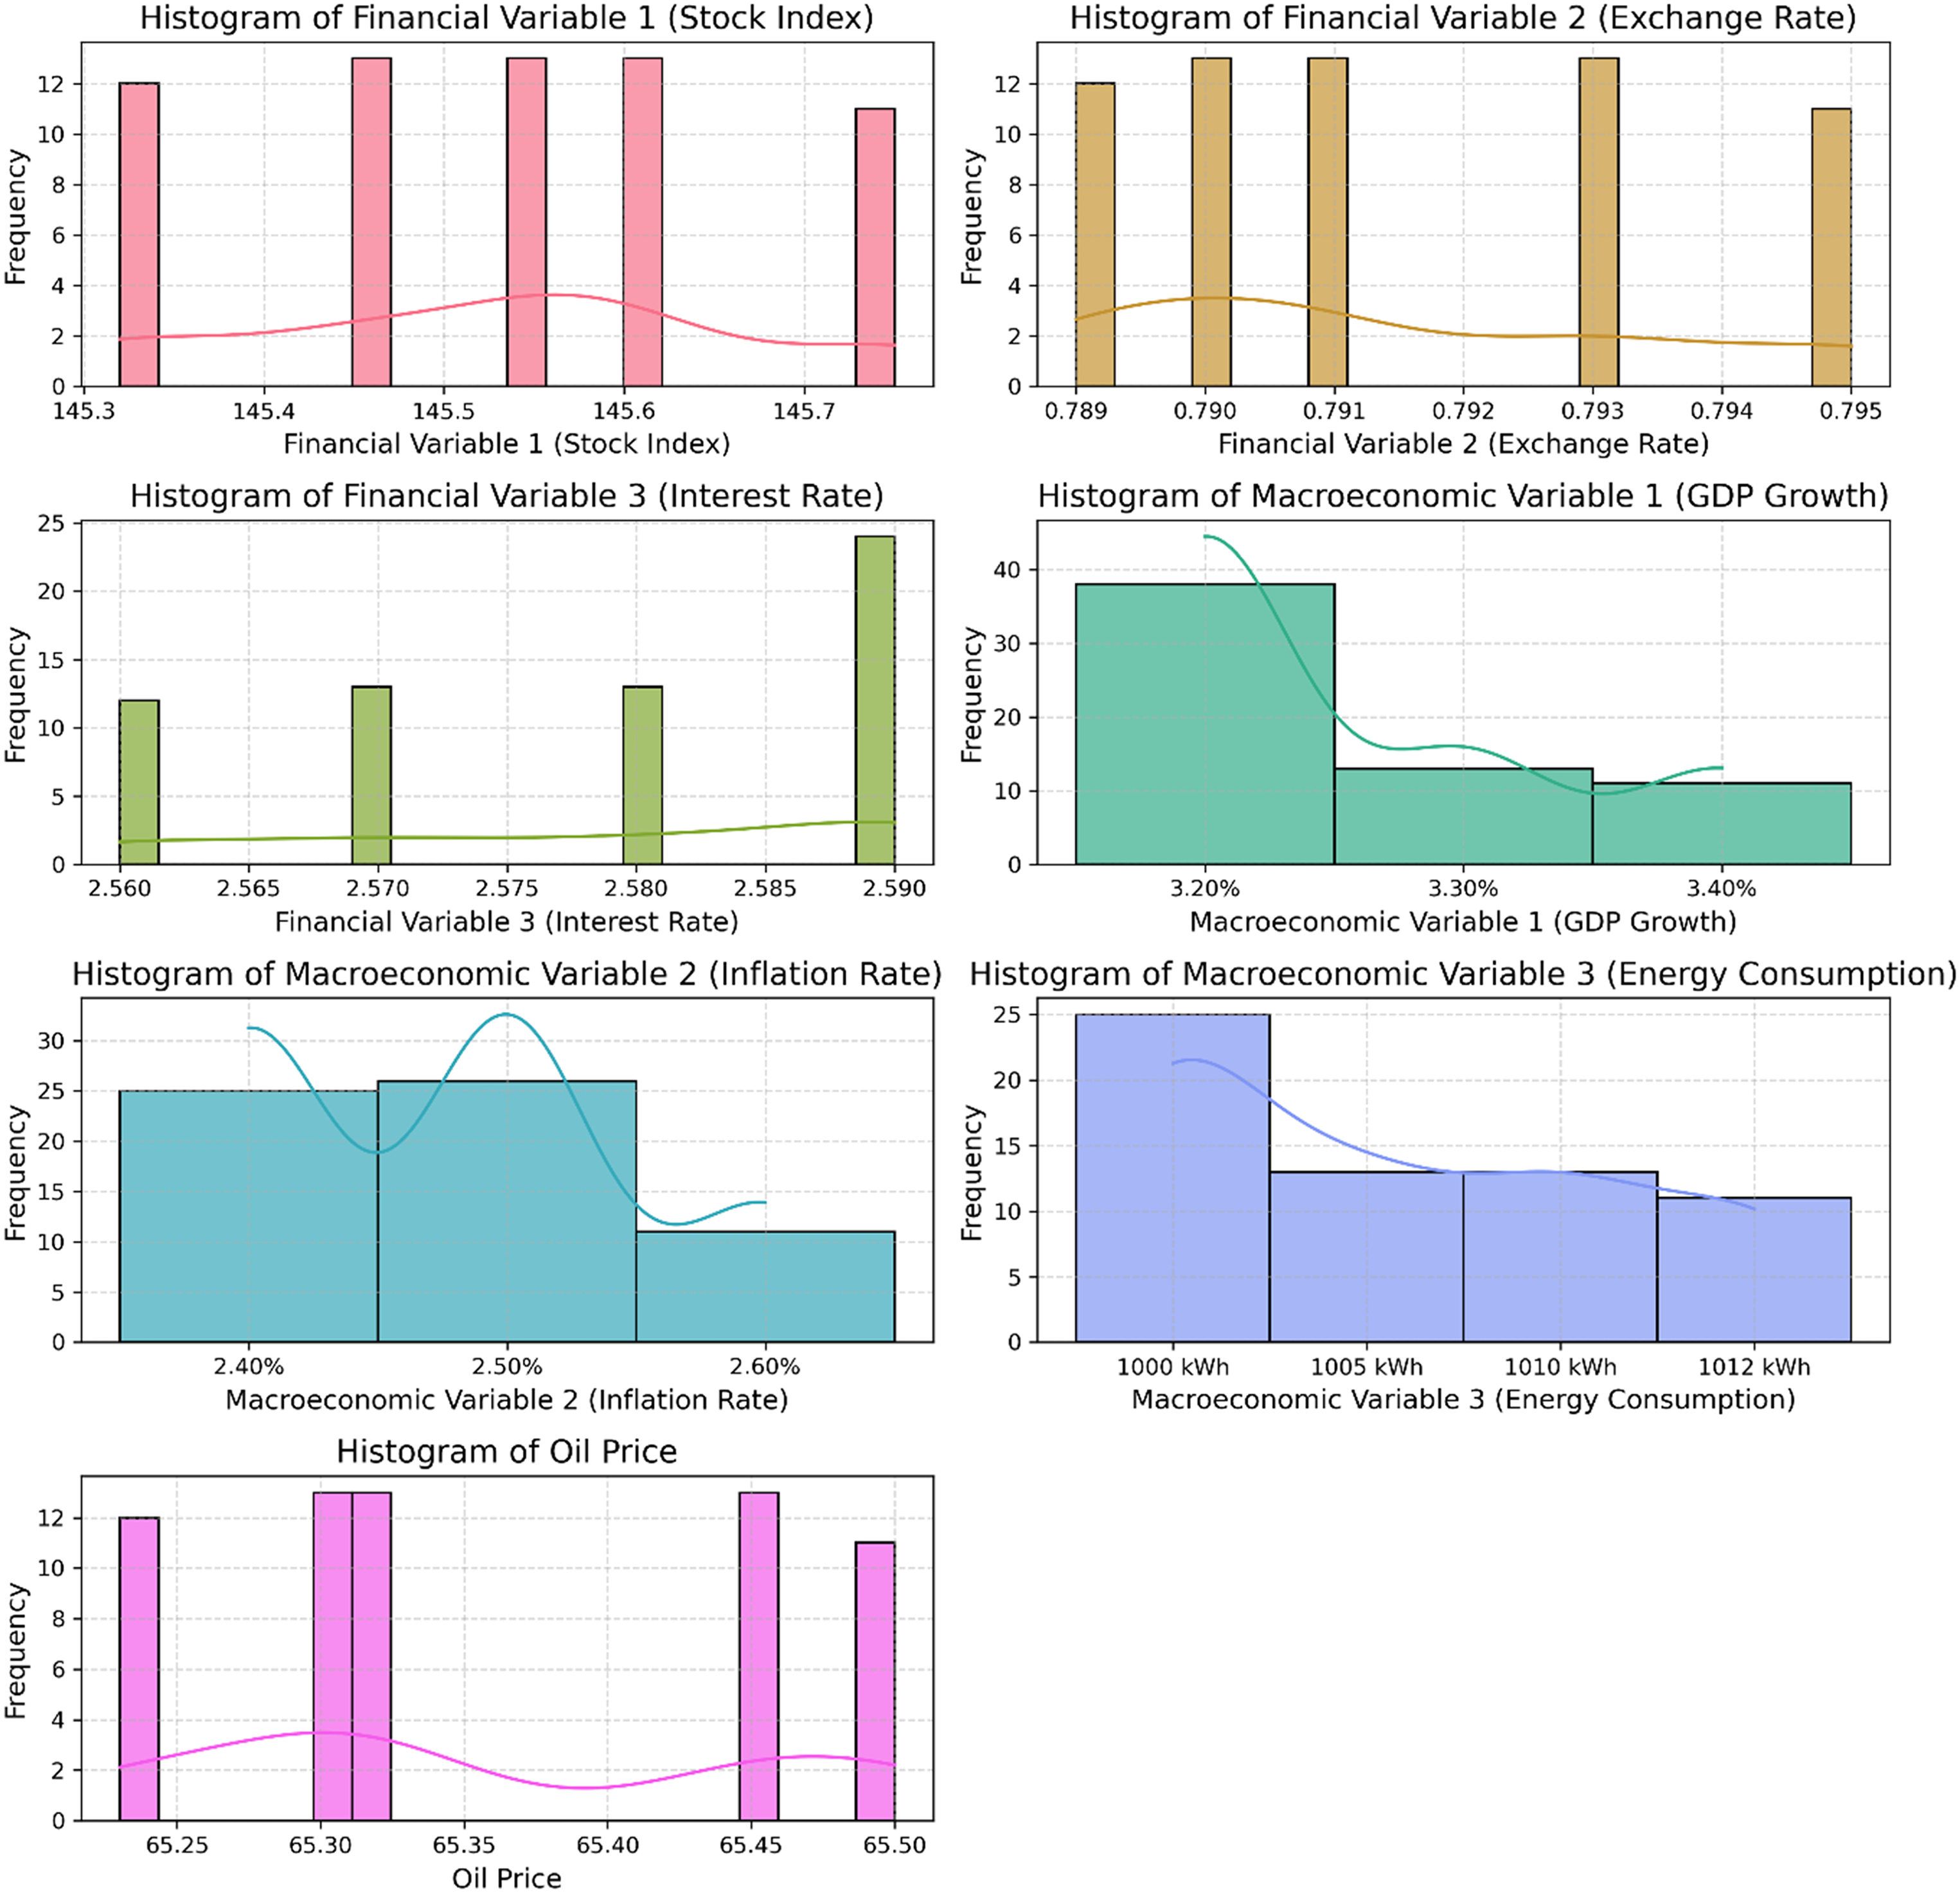
Frequency distribution of each feature.
Data preprocessing
The dataset cannot be analyzed or used to train a model without first being pre-processed. In this section, we will go over the methods that were used to prepare our dataset for analysis. To demonstrate the effect these methods have on the dataset's quality and eligibility for further analysis, we compare the data before and after preprocessing.
Before preprocessing
Let's take a look at the raw data in its unprocessed state before we do anything with it. The dataset contains historical information on oil prices and other factors influencing the stock market in Saudi Arabia. Features include the Oil Price (Output), Stock Market Data, Exchange Rates, Crude Oil Inventories, the Demand-Supply Gap, and Global Economic Indicators and Geopolitical Events. Daily observations from the beginning of the dataset's time period through its conclusion are included.
Without preprocessing
We initially conduct an analysis of the dataset without using any preprocessing methods in order to highlight the significance of doing so. This raw data could have problems with data quality such as missing numbers, outliers, inconsistent formatting, and so on. Without fixing these problems, the data may be unusable for precise modeling or analysis.
With preprocessing
Several preprocessing operations are carried out to guarantee the integrity and accuracy of the dataset.
Handling missing values
Any data points that are missing are located and dealt with by us. Depending on the circumstances, imputation methods like mean, median, and forward/backward filling may be necessary.
Outlier detection and treatment
If outliers are present, the results of the analysis and the efficacy of the model can be drastically altered. We use tools like the z-score, the interquartile range, and statistical modeling strategies to identify and deal with anomalies.
Data formatting and standardization
We guarantee that all of the units and formatting in the dataset are uniform. Here, we normalize numerical features to a common scale, transform data kinds, and standardize units as needed.
Feature encoding
Categorical features, such as geopolitical events or production quotas, may need encoding to represent them numerically. This could be achieved through techniques like one-hot encoding or label encoding.
Feature scaling
If the features in the dataset have different scales, we apply scaling techniques such as min-max scaling or standardization to bring them to a similar range. This helps in avoiding bias towards features with larger values during modeling.
Handling date-time features
Since our dataset includes a TS, we may extract additional features from the date-time column, such as day of the week, month, or year. These features can capture temporal patterns that may influence the target variable.
By performing these preprocessing steps, we ensure that the dataset is cleaned, standardized, and suitable for analysis and modeling. Preprocessing improves the accuracy and reliability of our results and minimizes biases introduced by data quality issues.
The comparison between the raw data and the pre-processed data highlights the importance of preprocessing techniques in enhancing the dataset's quality and preparing it for further analysis. The subsequent sections will build upon this pre-processed dataset to perform forecasting and analyze the impact of oil prices on the KSA stock market.
Features processing
To gain insights into the relationships between features, we can construct a feature correlation matrix. A correlation matrix measures the linear relationship between pairs of features, indicating how changes in one feature correspond to changes in another feature. Strong positive correlation (values close to 1), strong negative correlation (values close to −1), and no significant connection (values near to 0) are all possible ranges for the correlation coefficient. Figure 3 shows the correlation matrix.
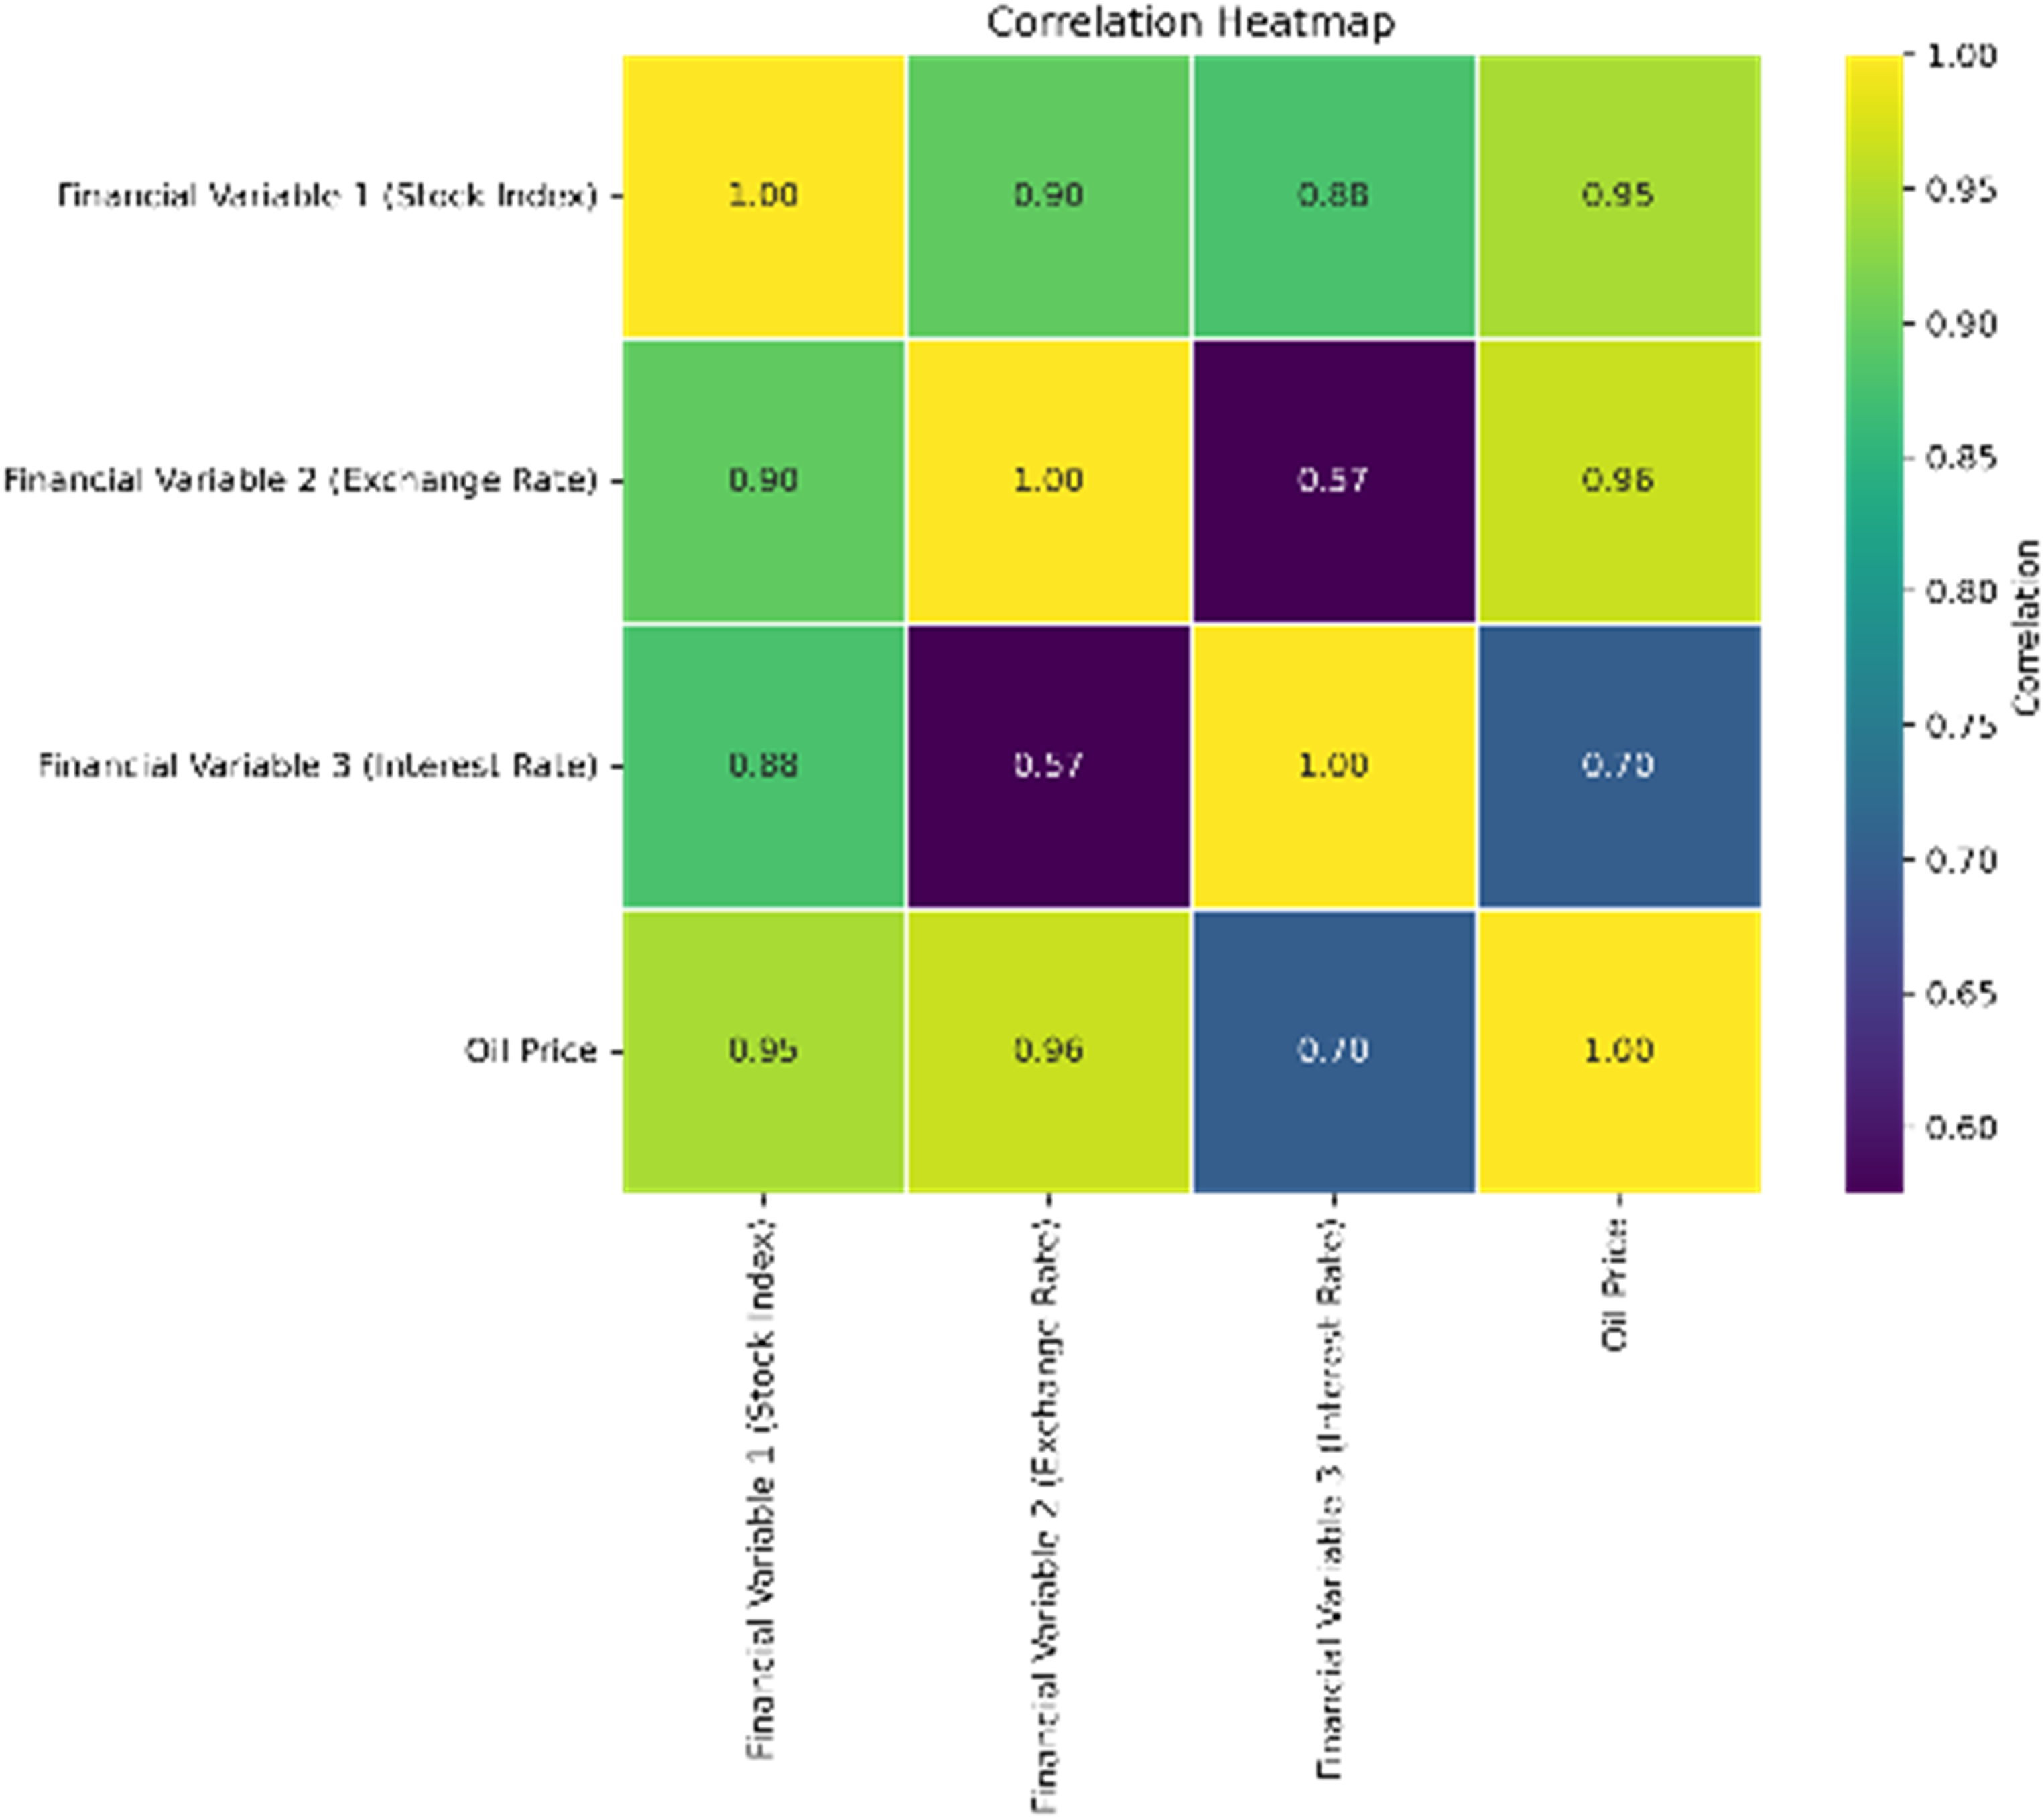
Correlation matrix.
Oil price prediction-based machine learning algorithms
In this section, we will discuss the machine learning algorithms that were used to predict oil prices based on the dataset. We will also give detailed explanations of the algorithms and the equations that were used to make the predictions.
Support vector regression
Powerful in its application to regression applications, SVR is a robust technique. It melds SVM (SVM) techniques with regression analysis. Finding a hyperplane that minimizes error while providing the best fit to the data is the goal of SVR. The data points closest to the boundary of decision are called support vectors, and they are used to establish the hyperplane.
To make data more easily linearly separable, the SVR algorithm applies the kernel trick to higher dimensional feature spaces. Linear, polynomial, radial basis function, and sigmoid kernel functions are the most popular.
The equation for SVR can be represented as follows in equation 4:
Minimizing the loss function while staying within the allowed error margin is what SVR is aiming for. To limit model complexity and forestall overfitting, regularization terms are often incorporated into the loss function. Figure 4 shows the SVR for oil forecasting.
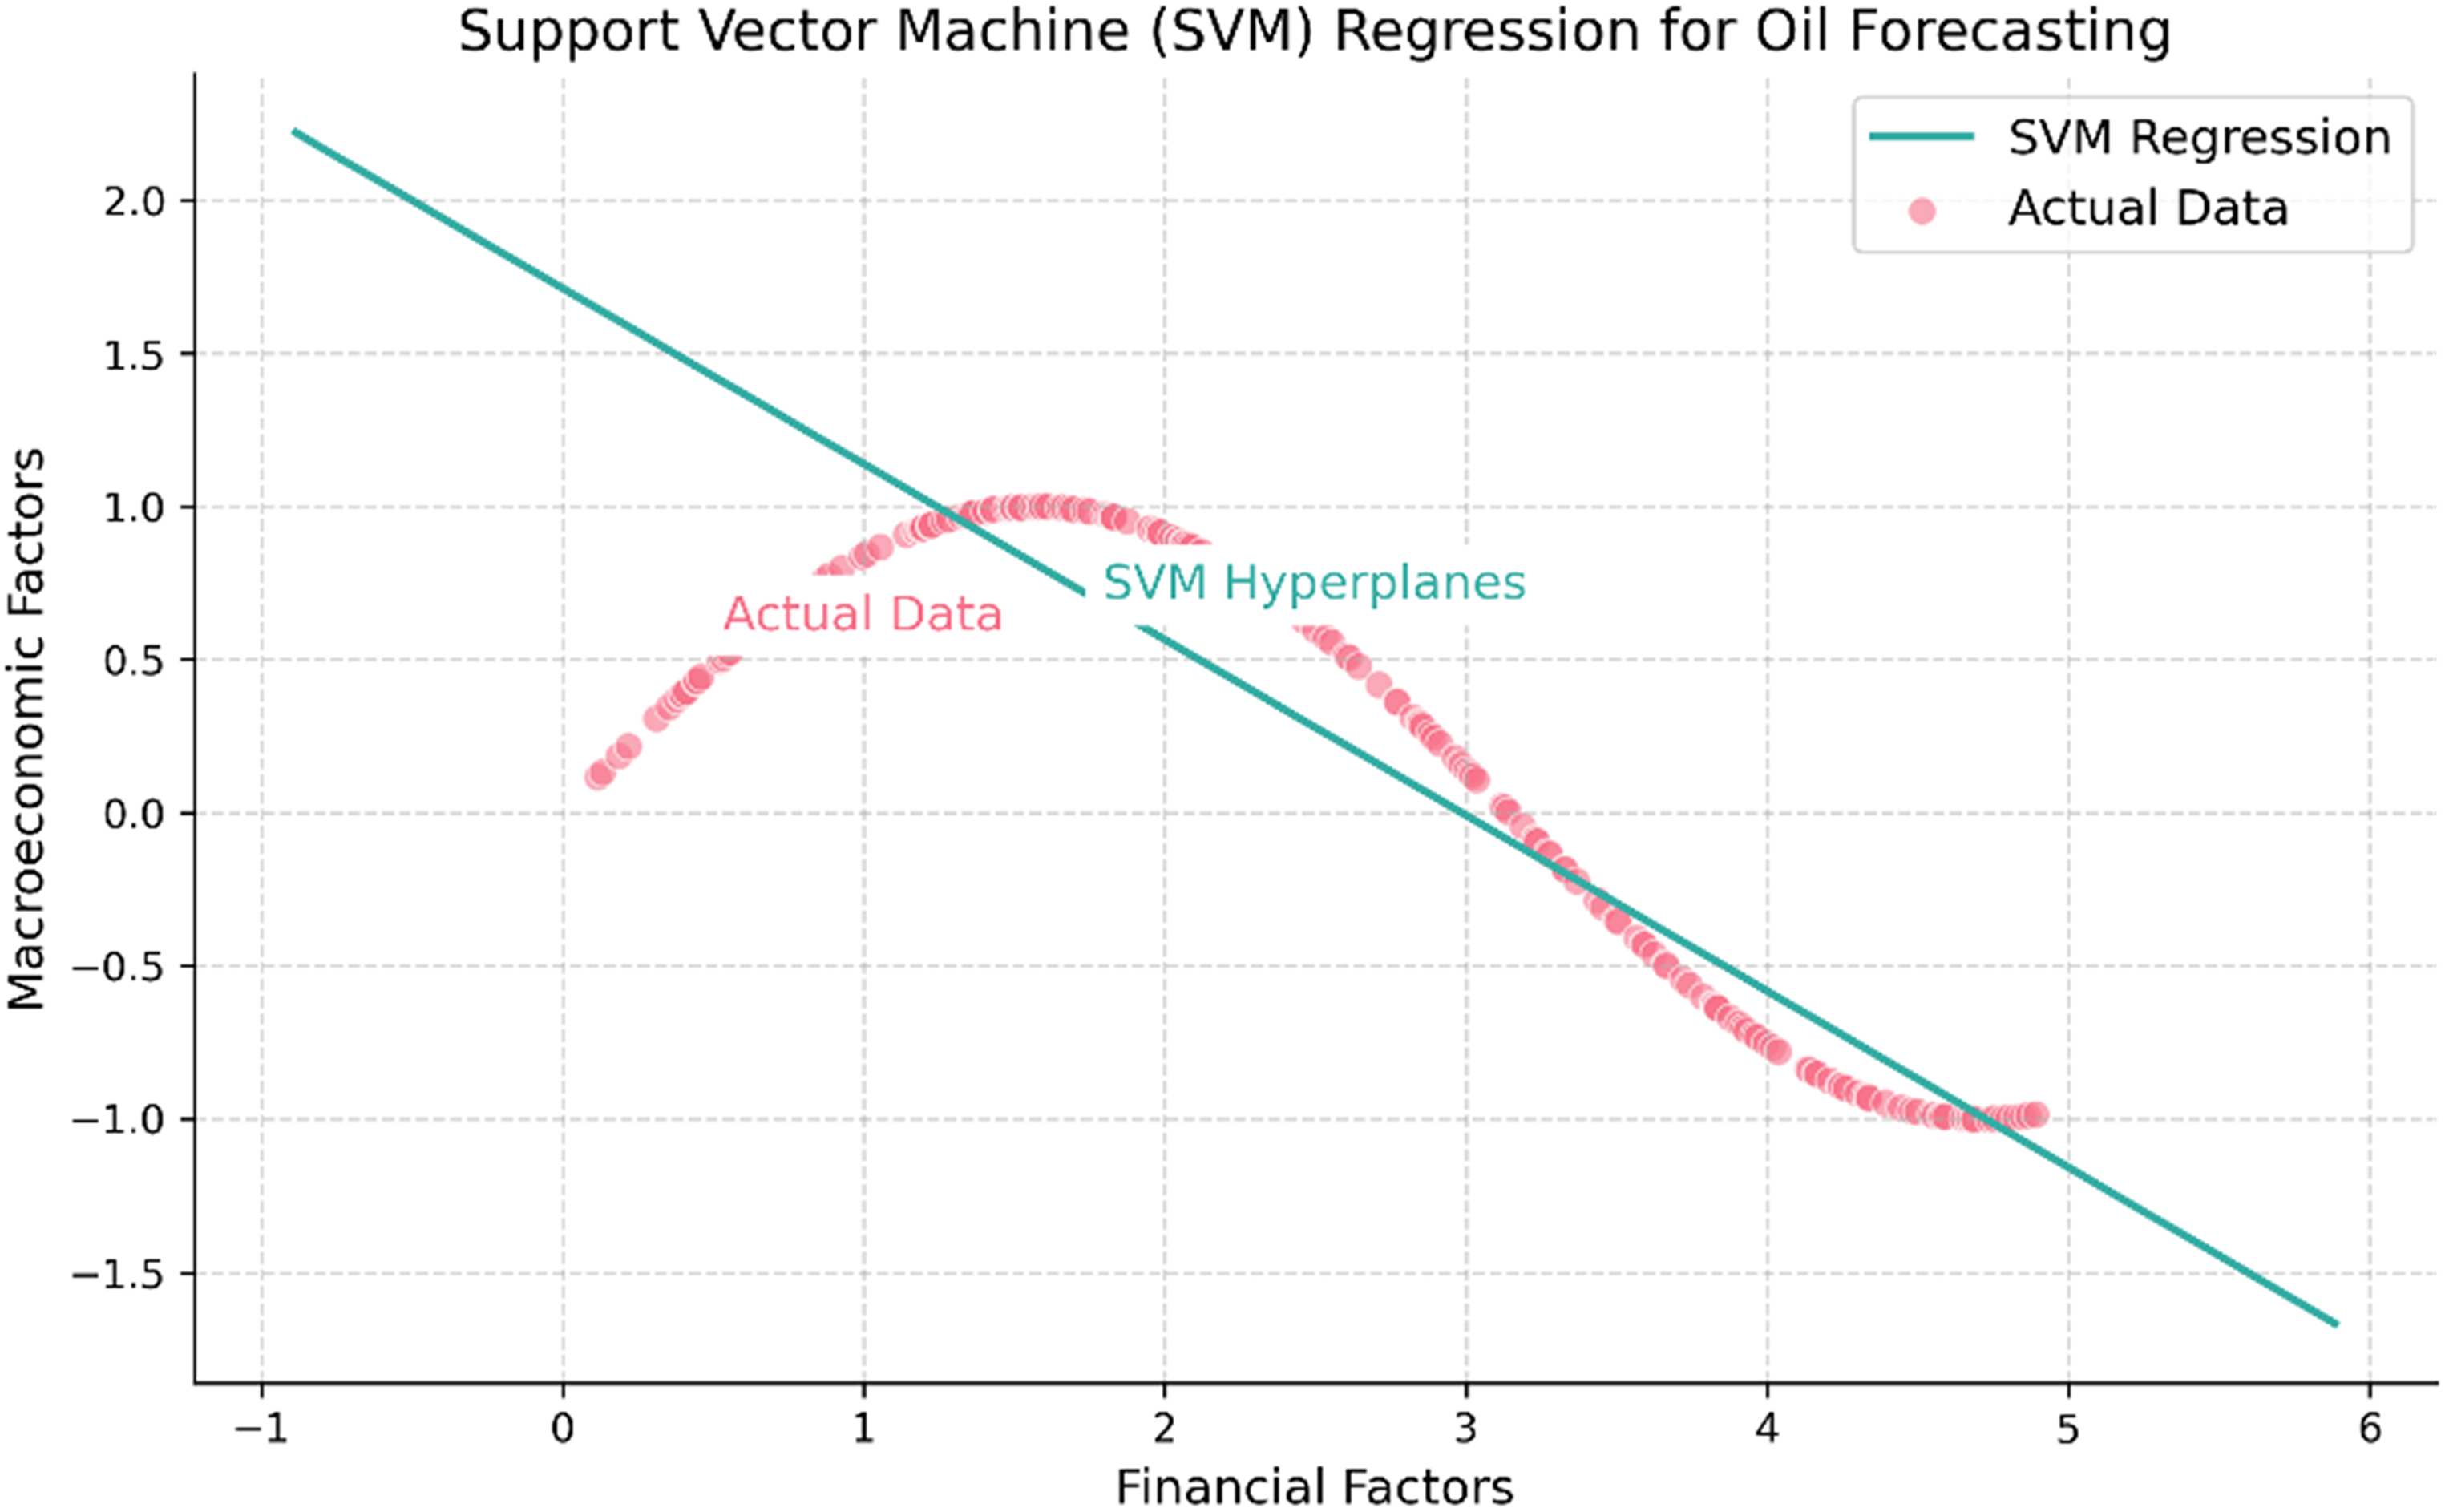
SVR for oil forecasting.
K nearest neighbors regression
KNR is a non-parametric algorithm used for regression tasks. It predicts the value of a target variable by averaging the values of its k nearest neighbors in the feature space.
The equation for KNR can be represented as follows in equation 5:
The KNR algorithm relies on the principle that similar instances tend to have similar target values. It does not explicitly learn a model but rather stores the training instances in memory for prediction purposes. Figure 5 shows the KNR for oil forecasting.
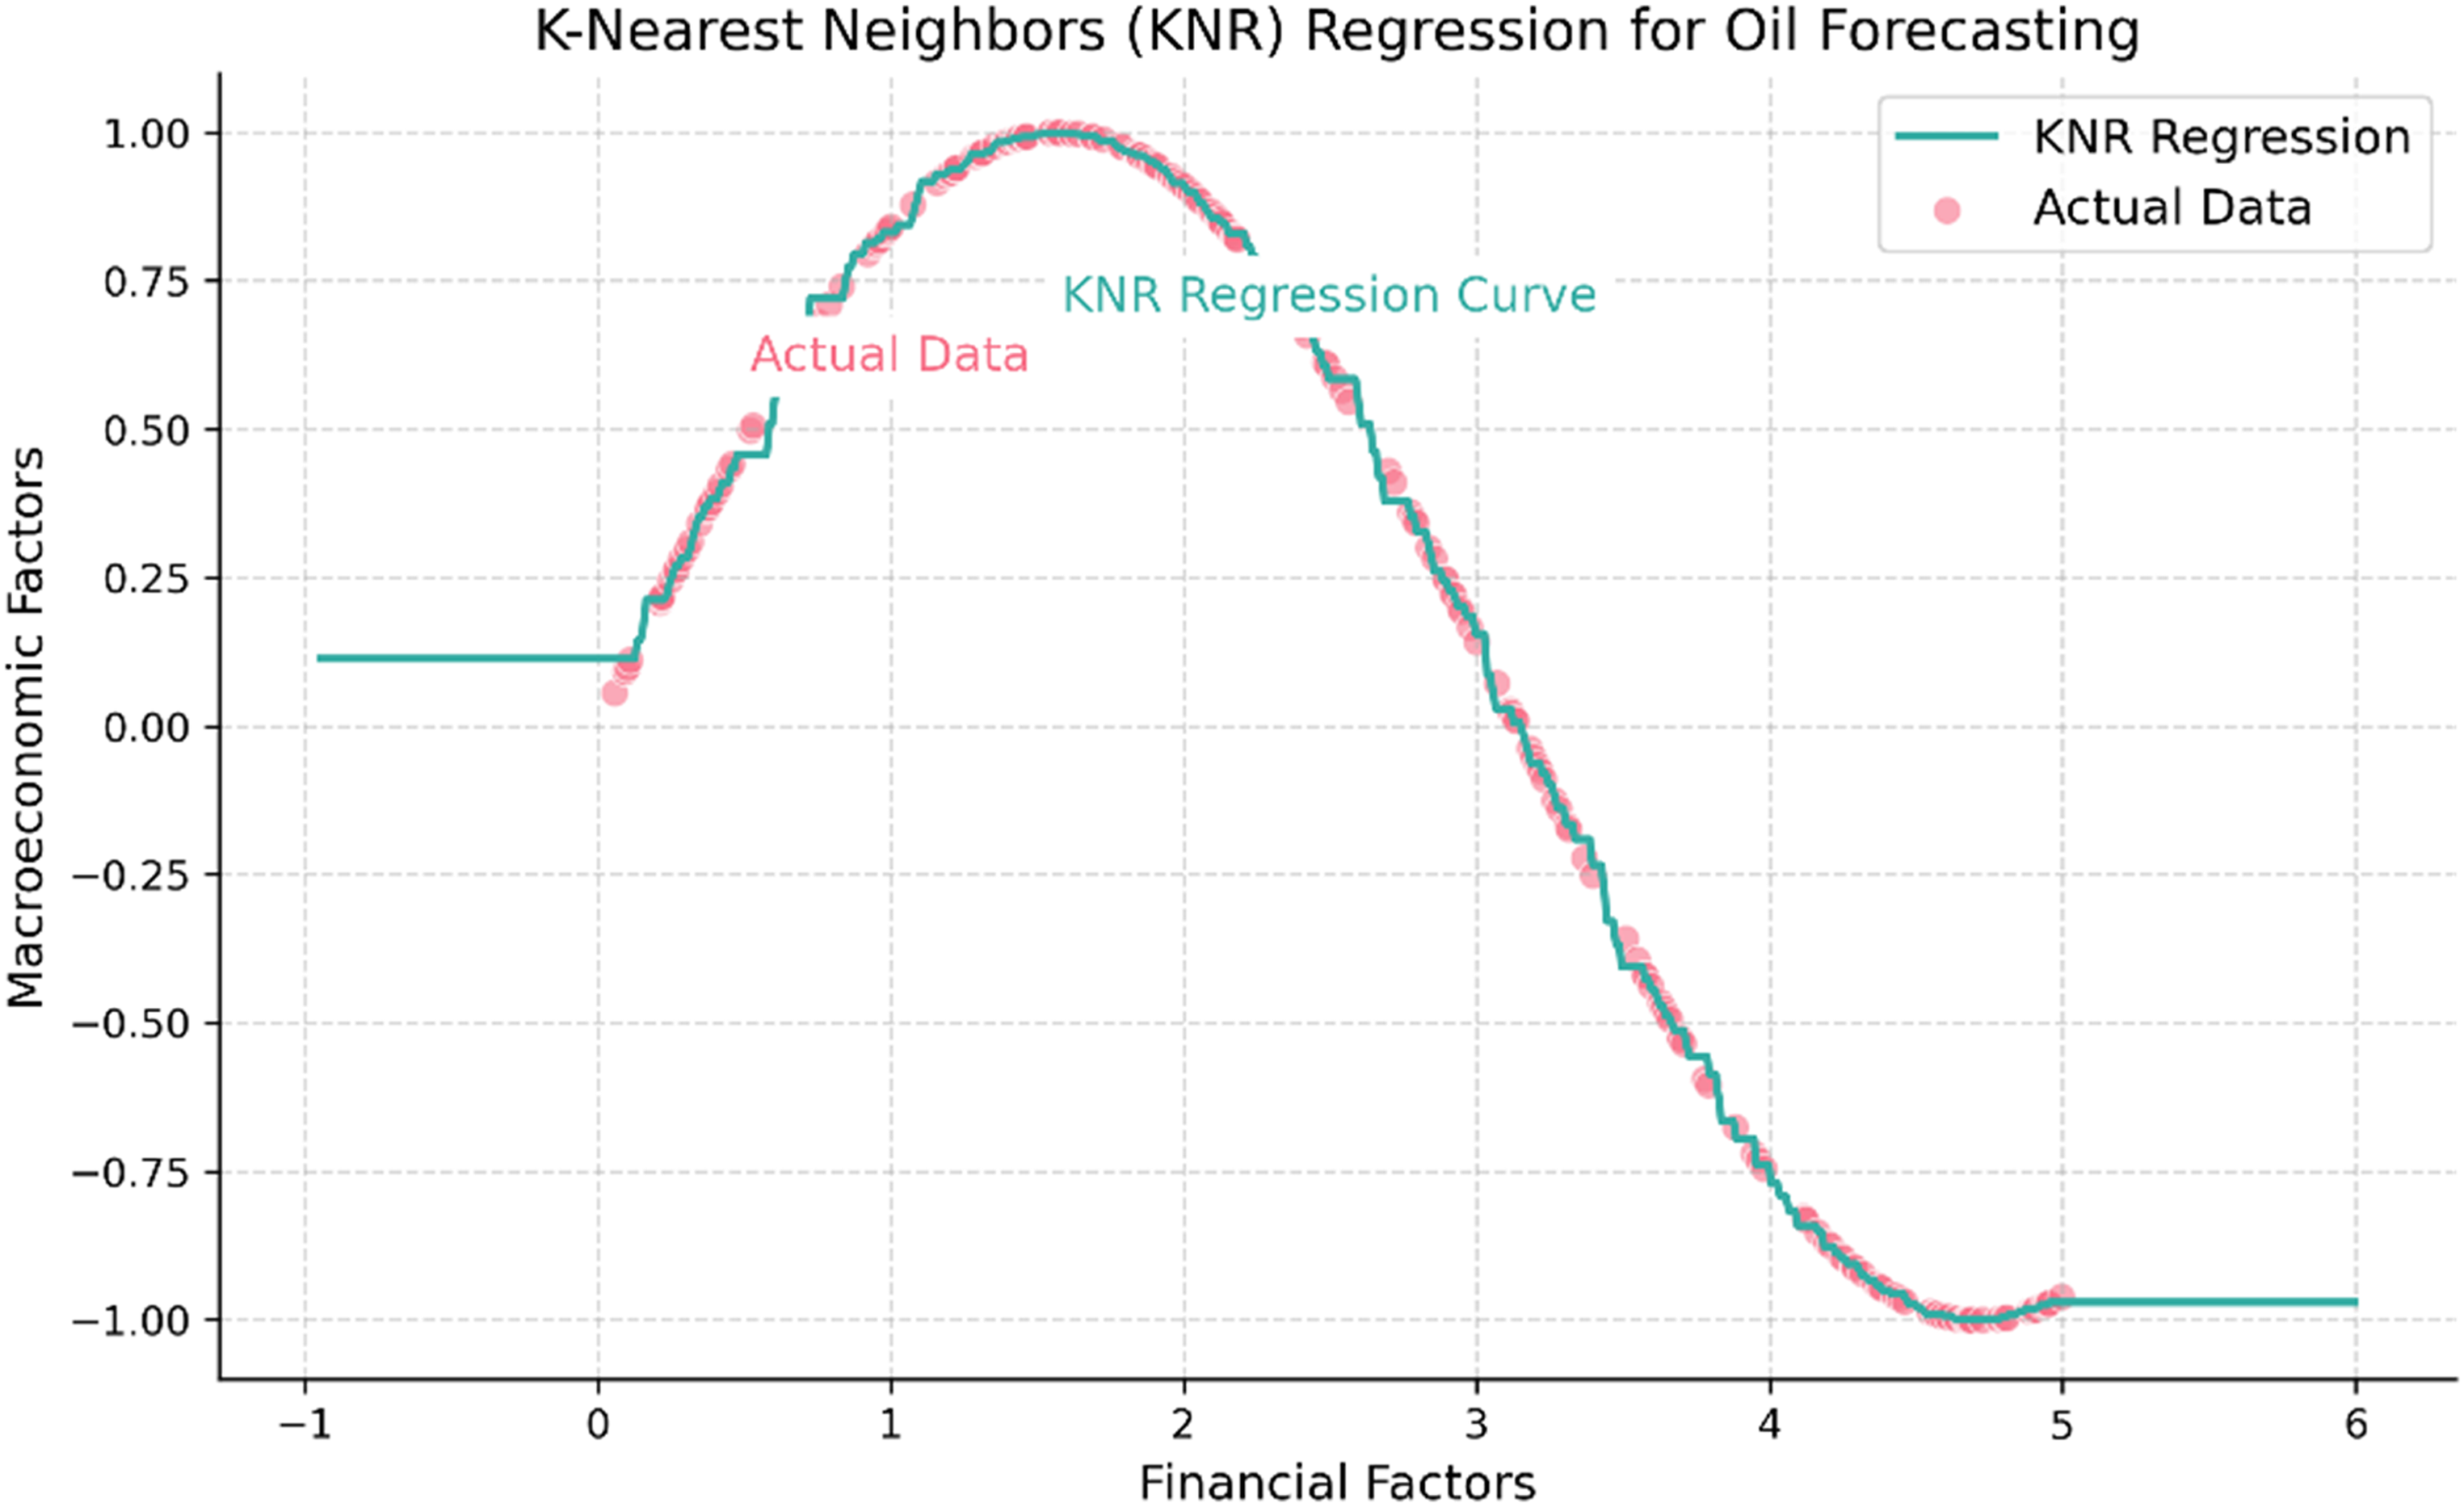
KNR for oil forecasting.
Ensemble approach: SVR + KNR
In our study, we employ an ensemble approach that combines the predictions from SVR and KNR to enhance the accuracy and robustness of our oil price forecasts. The individual predictions from each model are weighted and combined to generate a final prediction.
The ensemble approach can be represented as follows in equation (6):
By leveraging the strengths of both SVR and KNR, the ensemble approach aims to improve the accuracy and reliability of the oil price forecasts. This combination allows us to capture different aspects of the data and make more robust predictions. Figure 6 shows the ensemble approach: SVR + KNR.
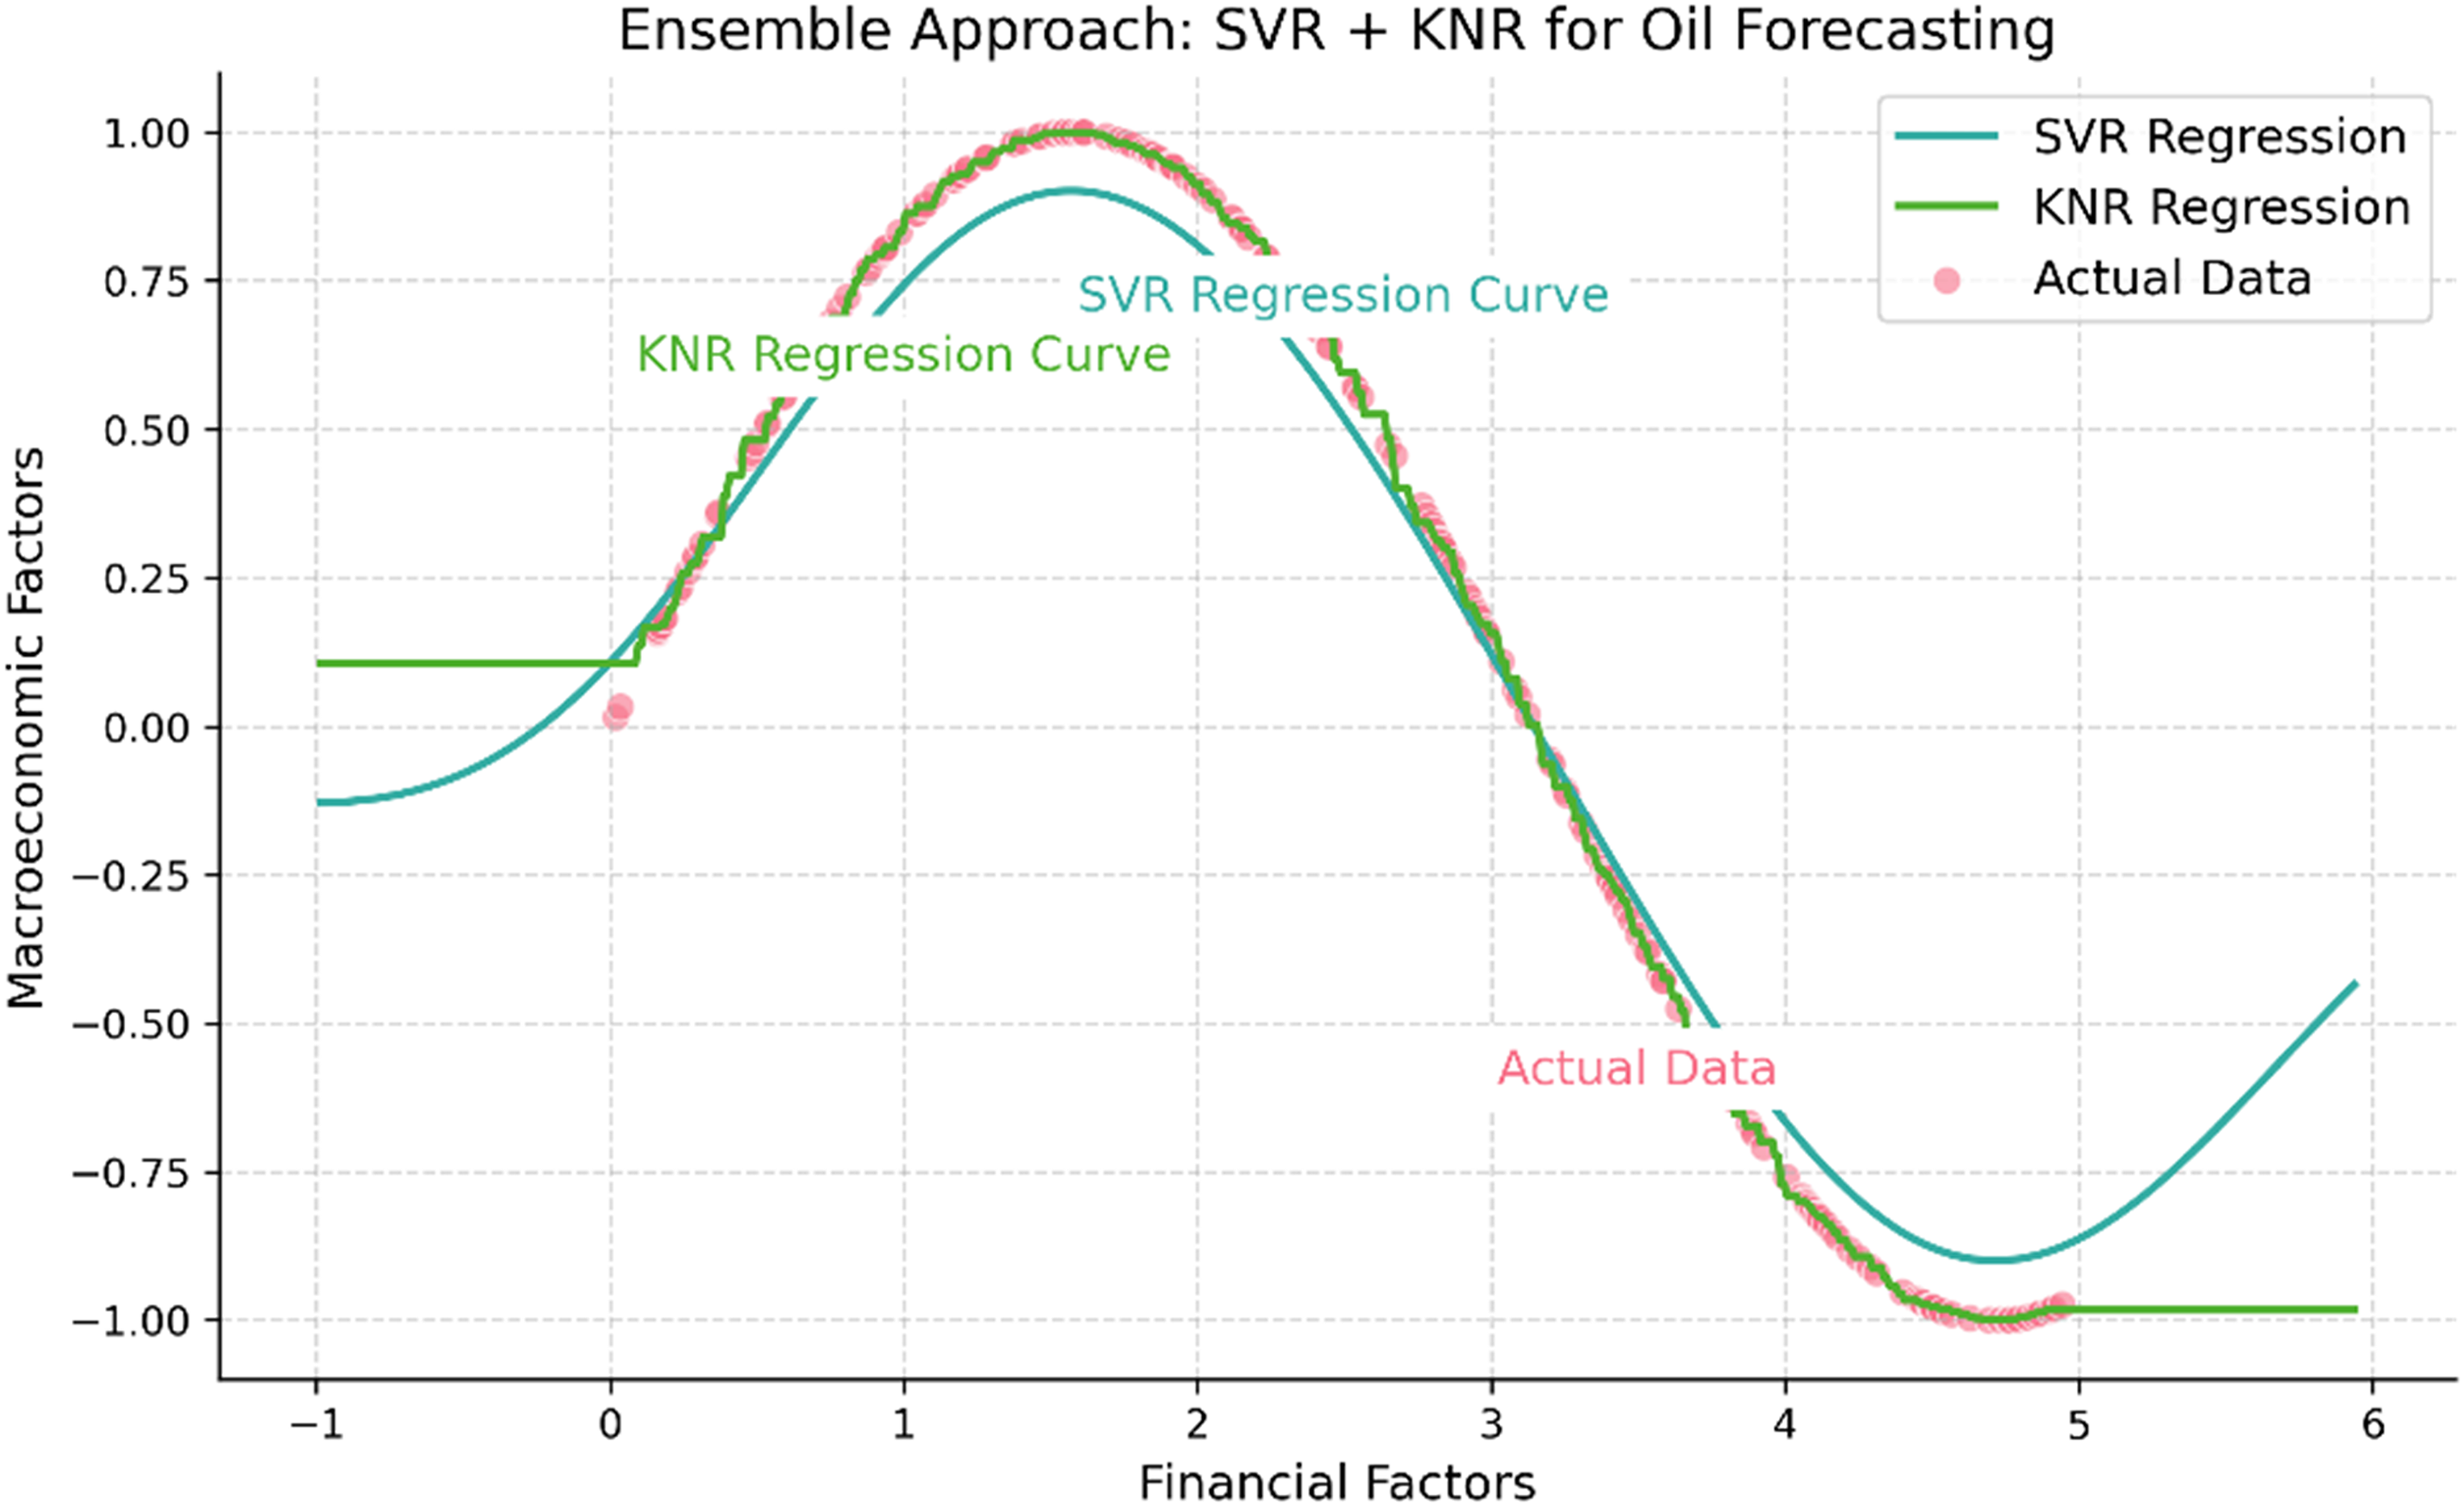
Ensemble approach: SVR + KNR.
Performance evaluation metrics
To determine how well the models for predicting oil prices perform, this study applies performance evaluation indicators. These metrics offer quantitative measures that may be used to evaluate how well the models are doing in predicting the trajectory of oil prices.
Mean absolute error
The MAE is a statistical measure that takes into account the typical disparity between the expected and observed values. It provides an estimate of how significantly the model errs, on average. The MAE is indicative of how well an estimate is made.
Root mean-squared error
To determine root mean-squared error (RMSE), one takes the average square root of the discrepancy between the anticipated and observed values. Since RMSE squares the errors, it is harsher on greater errors than MAE. Lower RMSE values suggest more precise measurements.
Mean absolute percentage error
The mean absolute prediction error (MAPE) is the typical percentage discrepancy between forecasted and observed results. The relative inaccuracy is expressed as a percentage of the whole. Using MAPE, you may evaluate how consistently various dataset's forecasts are coming in. The MAPE is indicative of how well an estimate is made.
Coefficient of determination (R-squared)
The percentage of variance in the dependent variable (oil prices) that can be predicted from the independent variables is shown by R-squared. It can take on values between 0 and 1, with higher values indicating a better match between the model and the data.
Adjusted R-squared
Adjusted R-squared modifies the standard R-squared statistic for model complexity. By taking into account the model's degrees of freedom, it discourages overfitting. An improved harmony between model complexity and fit is indicated by an increased adjusted R-squared value.
Results and discussion
In this section, we present the analysis results and discuss their implications. We examine how various models foreseeing oil prices have performed and how that has affected the KSA stock market. We also present tables that summarize the most important results and indicators for each model, giving us a better understanding of how accurate and successful they are. Potential opportunities and obstacles in oil price forecasting and comprehending their influence on the stock market are highlighted as the debate centers on the implications of these results for investors, policymakers, and market participants.
Support vector regression performance
For predicting oil prices over the next 2 months, we present the performance of the SVR model in Figure 8. Dates are represented along the x-axis, while expected oil prices are represented along the y-axis. The orange line represents the anticipated oil prices by the SVR model, while the blue line represents the actual oil prices for the previous time period. The SVR model employs a nonlinear regression technique to detect intricate interconnections and patterns in the data. In order to forecast future oil prices, it analyzes past data and builds a regression model. The accuracy with which the SVR model can forecast future oil prices is used to assess the model's overall performance. If we take a look at Figure 8, we can see how oil prices are likely to trend and fluctuate over the following two months. The goal of the SVR model is to help you make reliable predictions by identifying hidden patterns in the data. When the orange line is so near to the blue line, it means the SVR model is accurately tracking oil price fluctuations. Figure 7 shows the SVR oil price prediction for next 2 months.
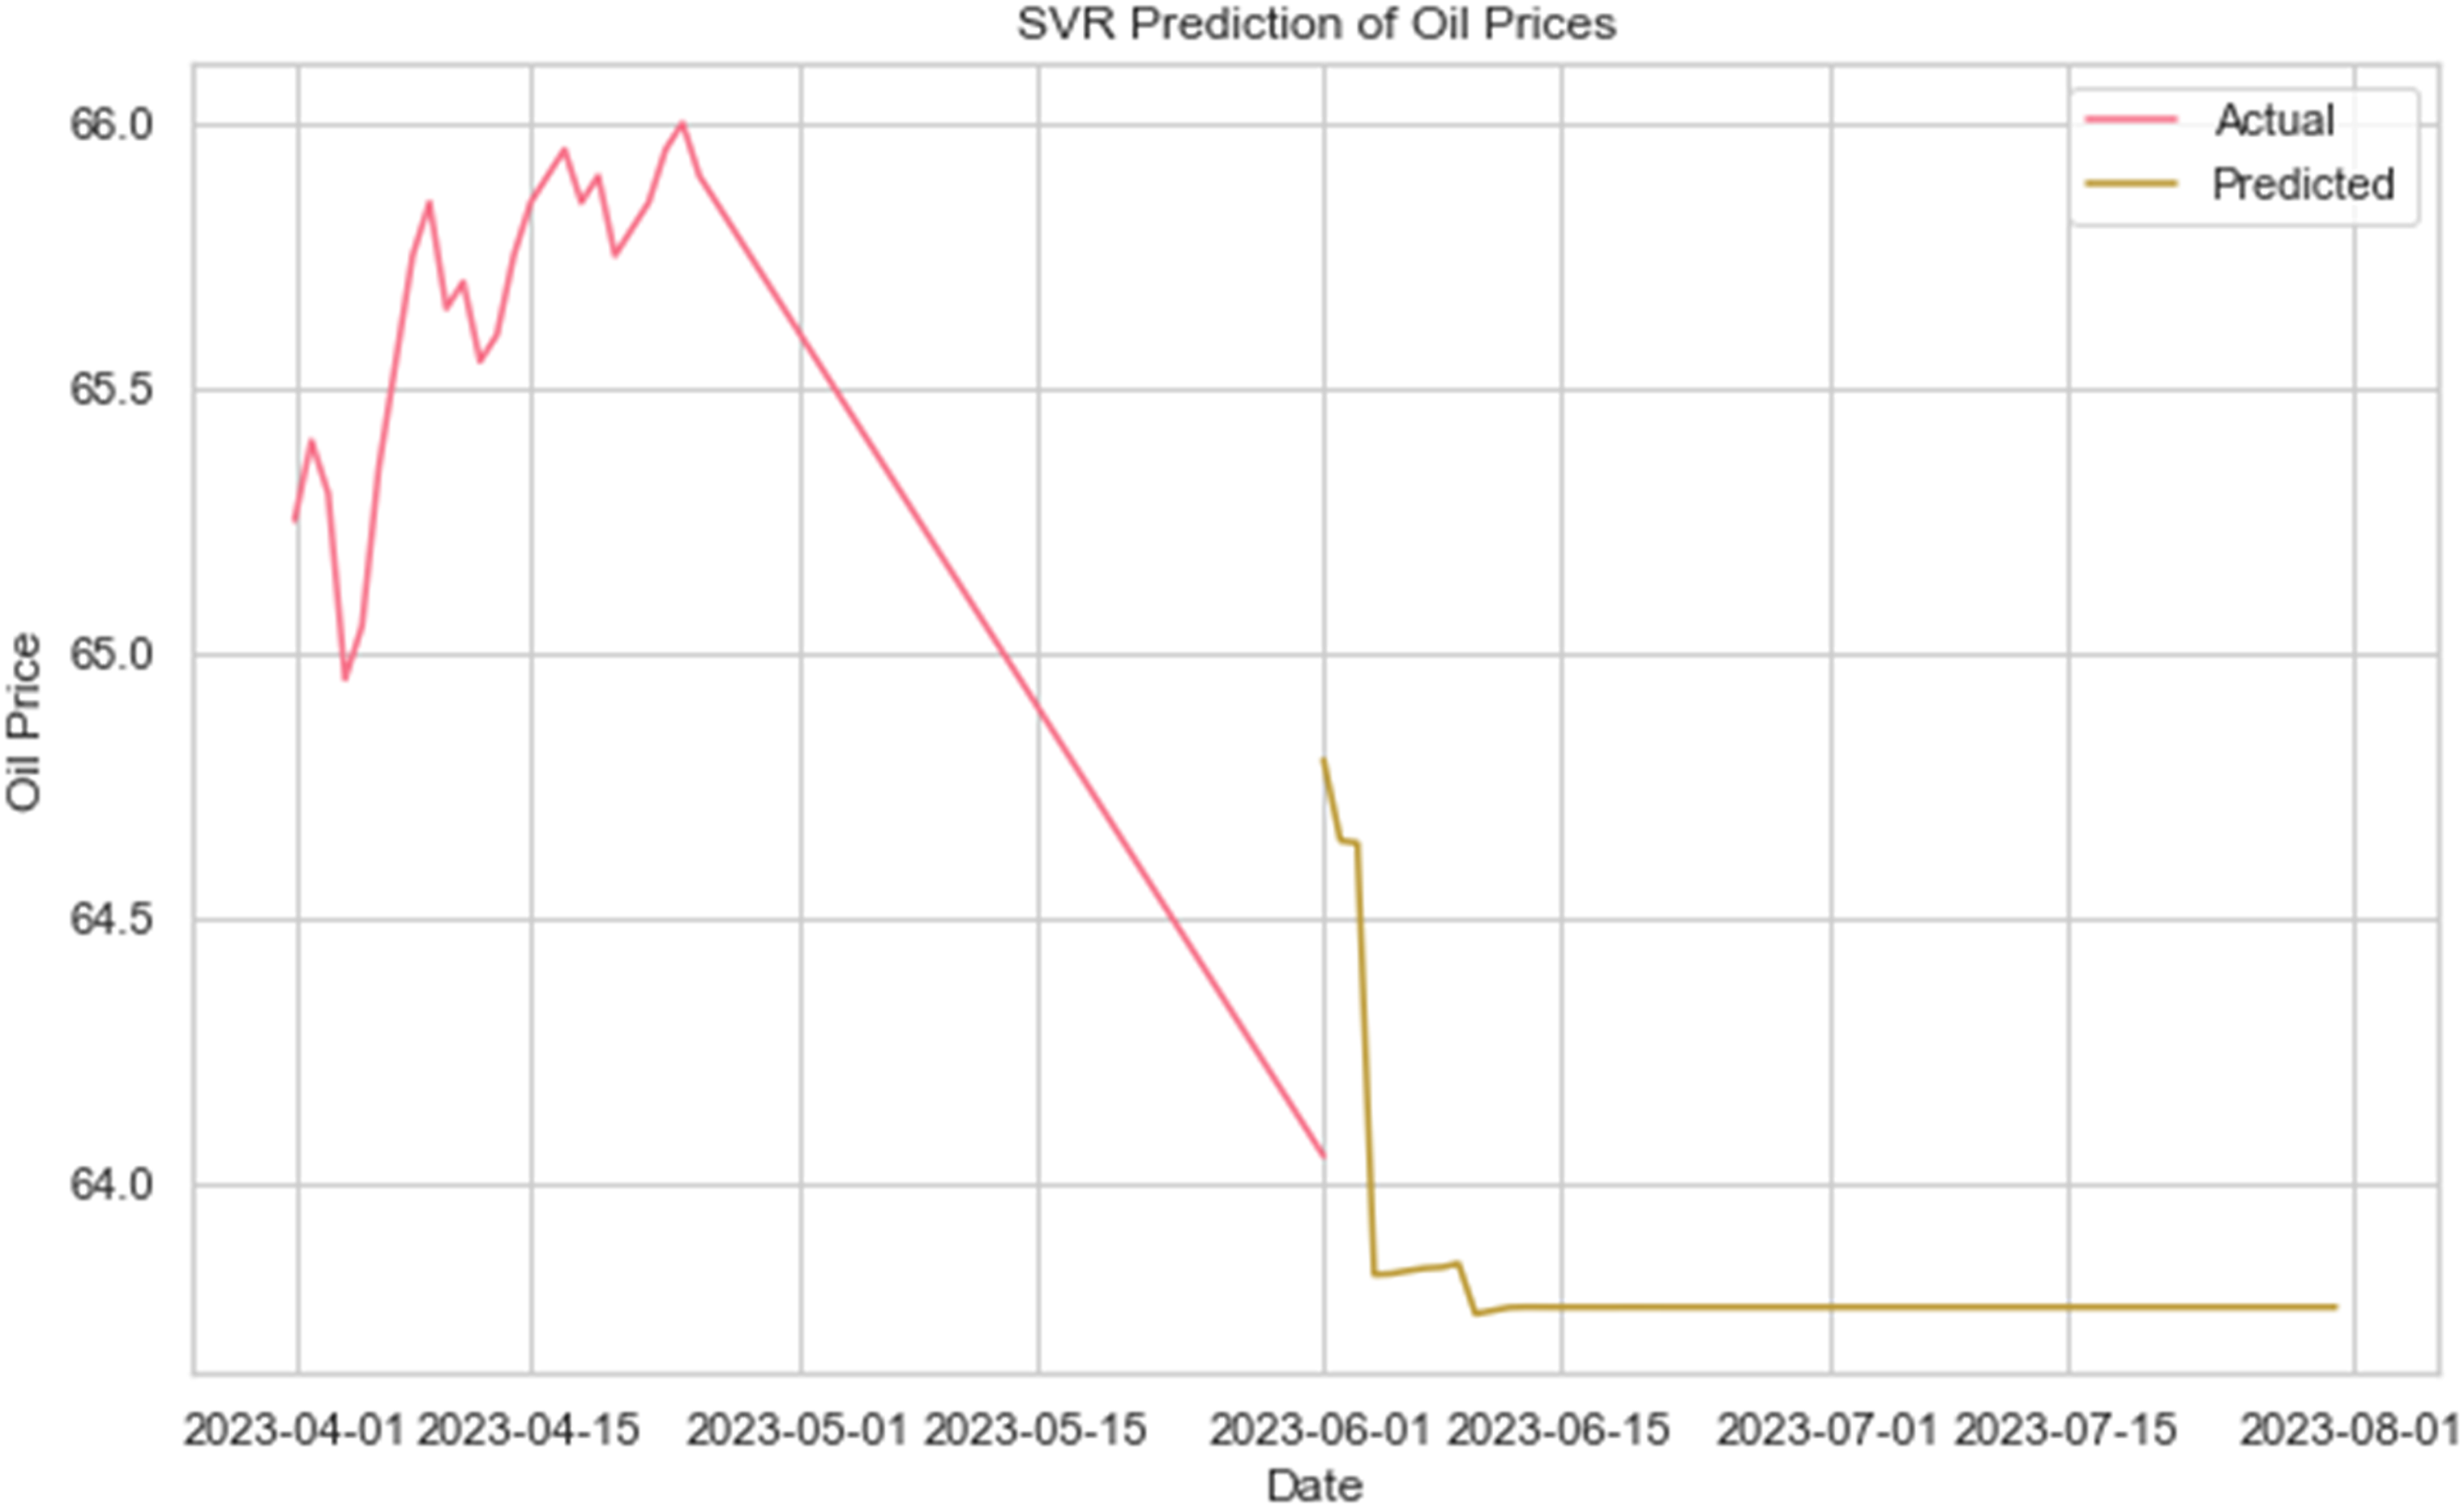
SVR oil price prediction for next 2 months.
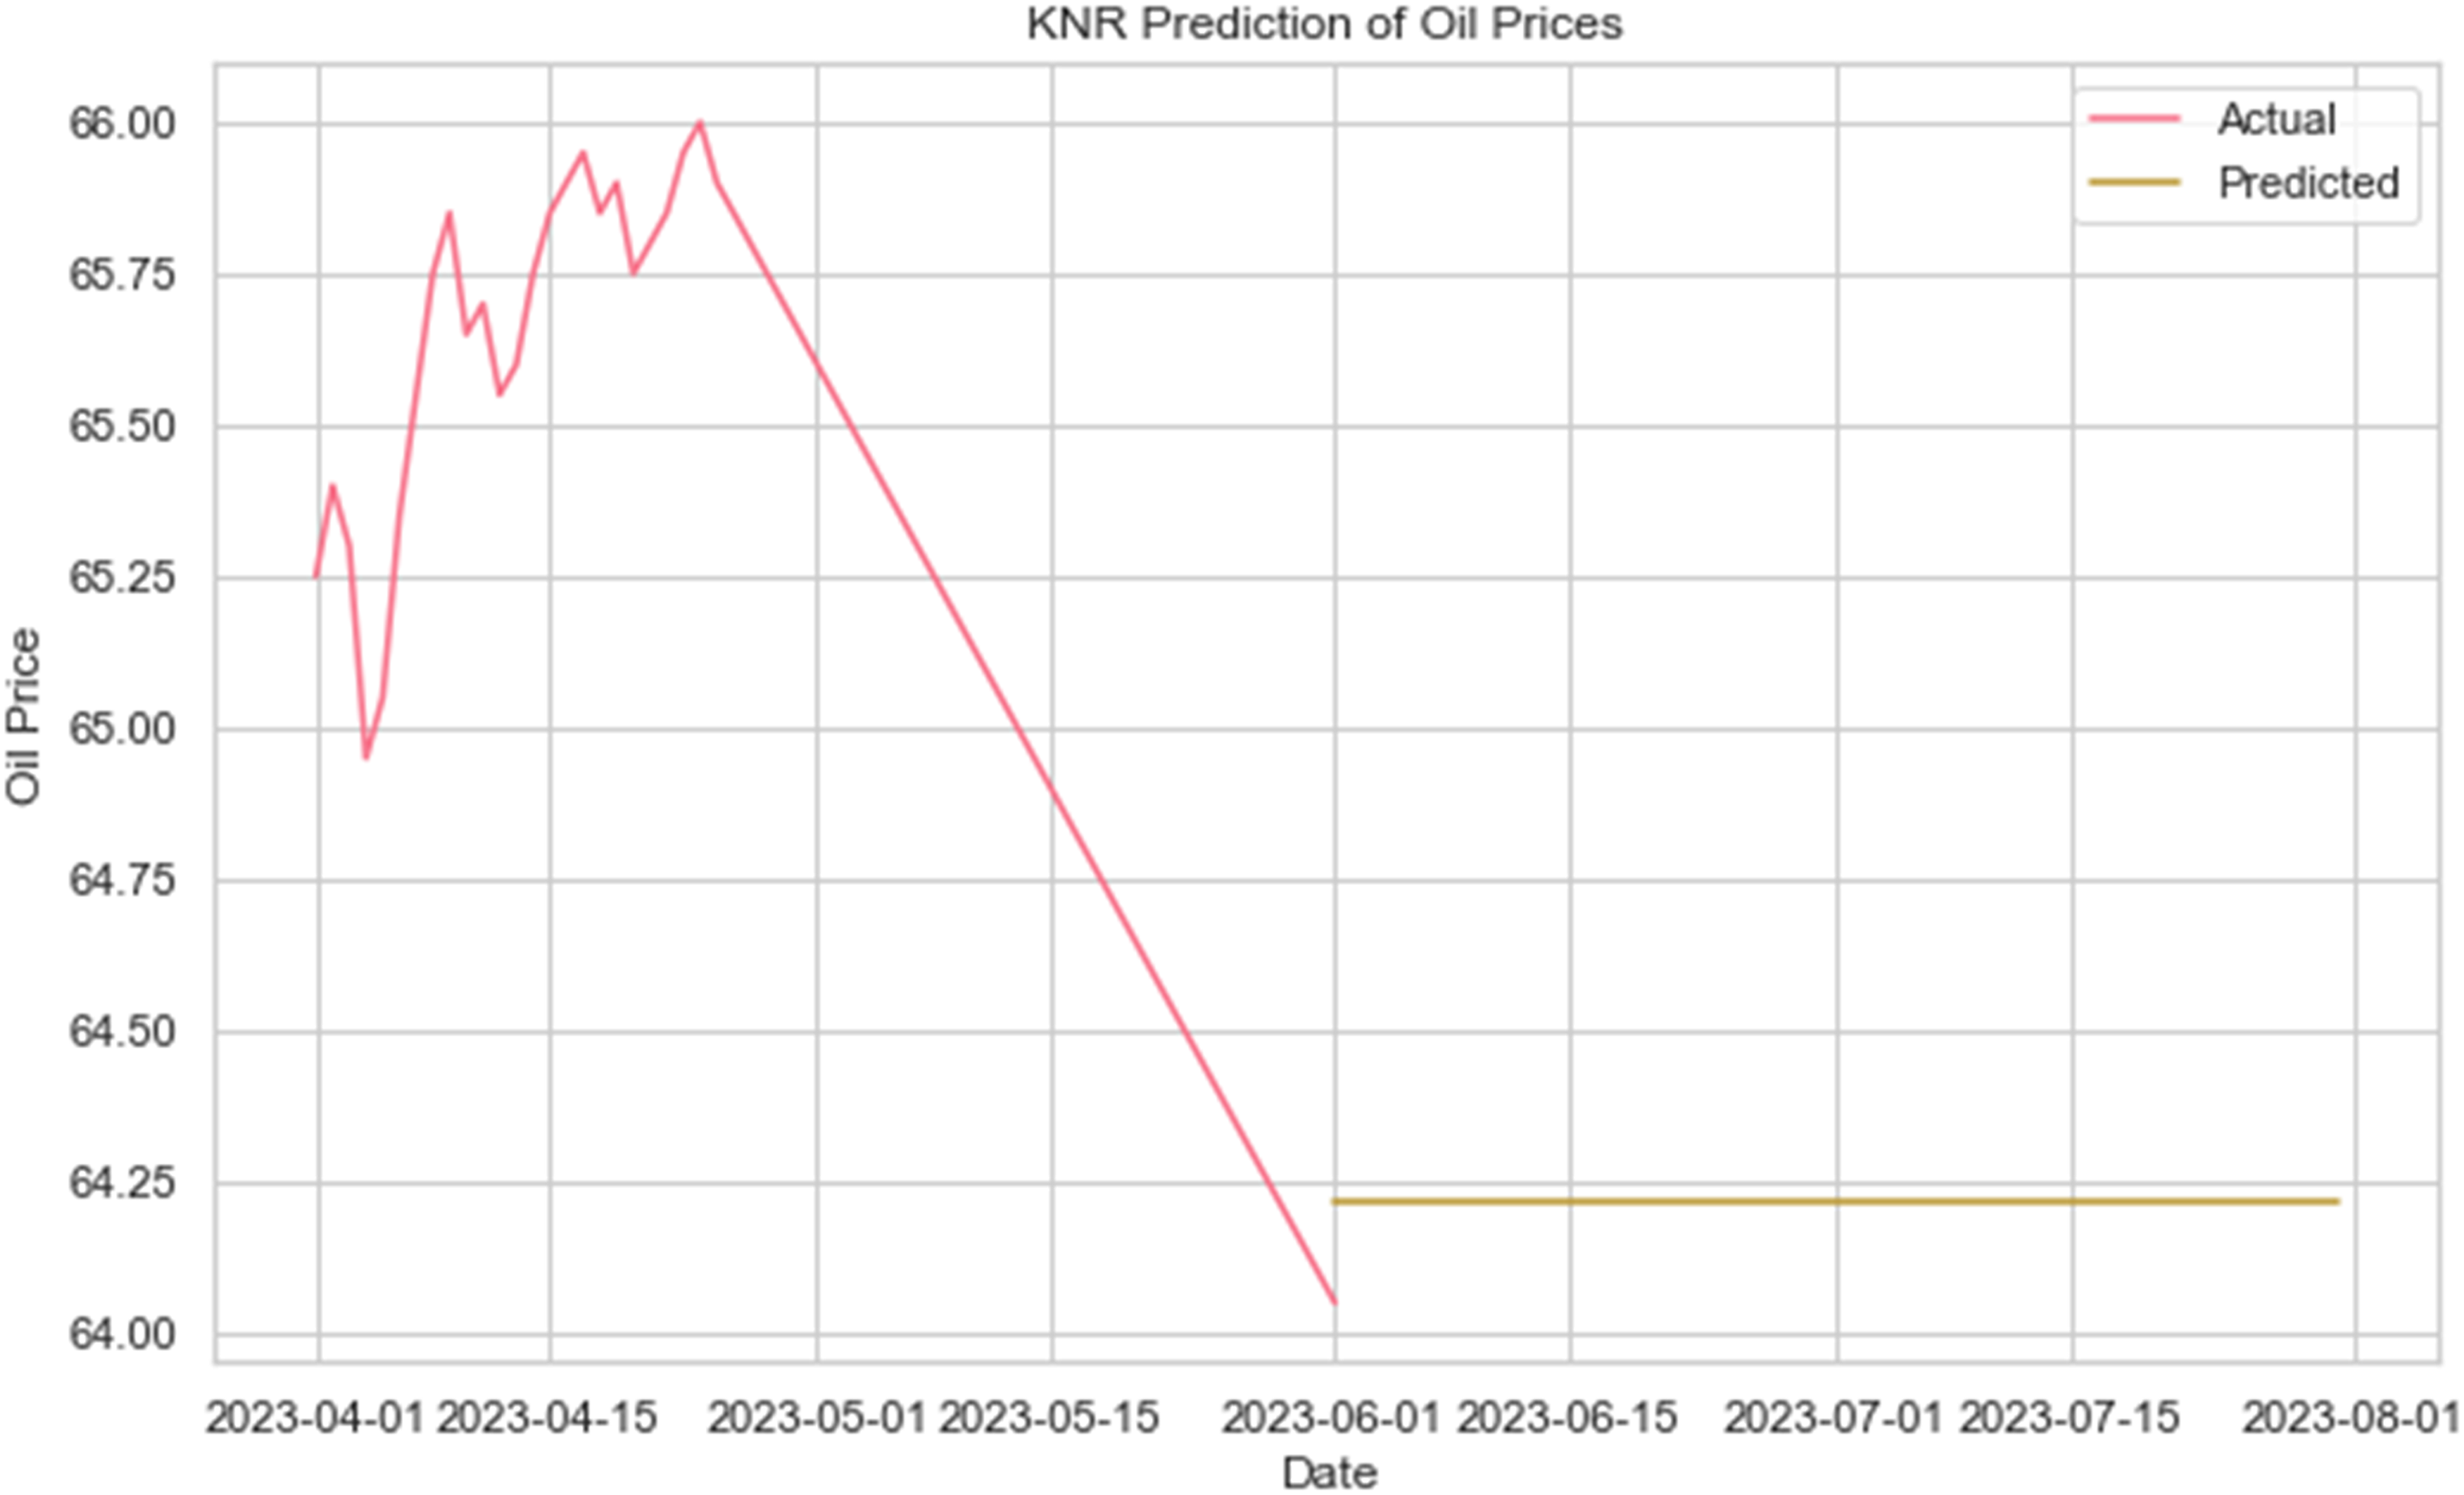
KNR oil price prediction for next 2 months.
K-Nearest neighbors regression performance
For predicting oil prices over the next 2 months, we present the performance of the KNR model in Figure 8. The y-axis shows the expected oil prices, while the x-axis shows the dates. The orange line represents the KNR model's predicted oil prices, while the blue line represents the actual oil prices for the prior time period. The KNR model is a non-parametric regression approach that uses the mean of a target variable's k nearest neighbors to forecast the target variable's value. Predictions for future oil prices are made using a regression model that is learned from past data. The accuracy with which the KNR model's forecasts match up with actual oil prices is used to rate the model's performance. In Figure 9, we can see the trajectory and swings of oil prices forecasted for the next 2 months. By taking into account surrounding points and averaging their values to make predictions, the KNR model is able to capture the local patterns in the data. If the orange line is very near to the blue line, then the KNR model is successfully capturing the fluctuations in oil prices. Figure 8 shows the KNR oil price prediction for next 2 months.
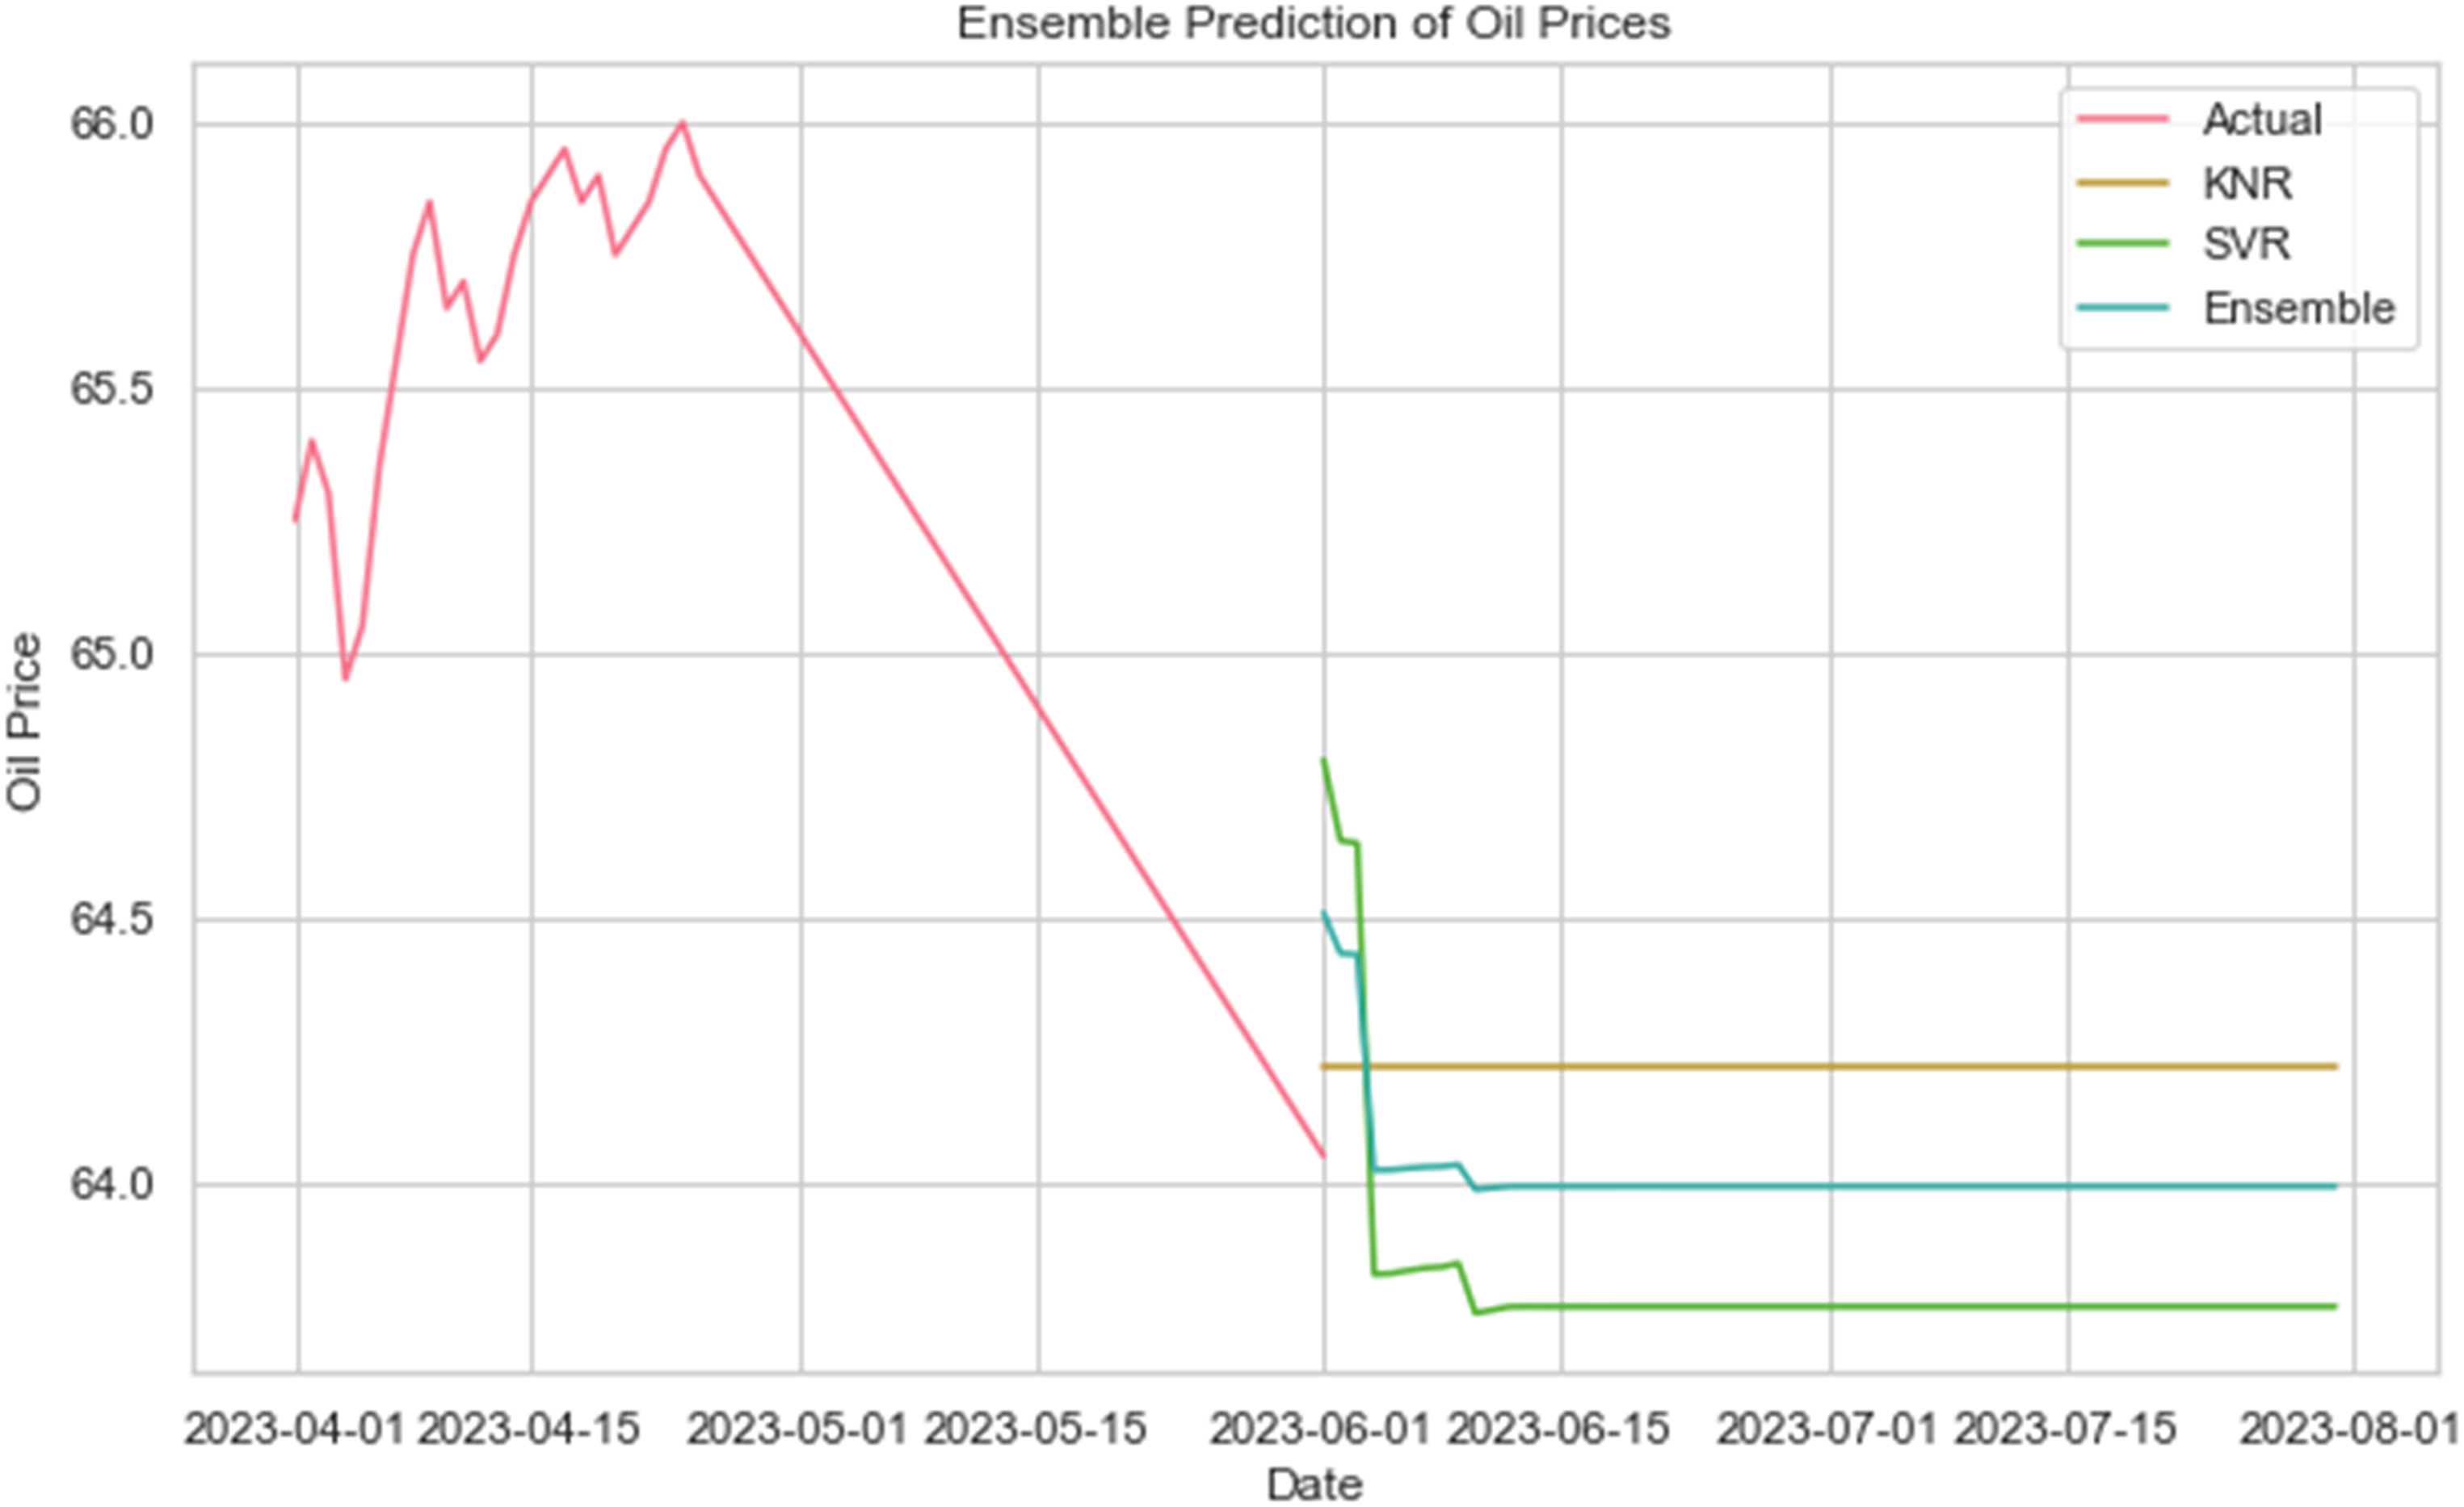
Ensemble-based oil price prediction for next 2 months.
Hybrid model perofrmance
In Figure 9, we present the performance of the ensemble method for predicting oil prices for the following 2 months, which combines SVR and KNR. Dates are shown along the x-axis, while expected oil prices are shown along the y-axis. The orange line represents the ensemble model's expected oil prices, while the blue line depicts the actual oil prices for the prior time period. In order to improve prediction accuracy and resilience, the ensemble method combines the best features of SVR and KNR models. While the KNR model takes into account local patterns and surrounding instances, the SVR model captures the more complicated linkages and patterns in the data. The ensemble approach combines the results of multiple models to estimate future oil prices with greater precision. In Figure 10, we can see the ensemble model's forecast for oil prices over the next 2 months. The orange line represents the ensemble-based forecasts, which incorporate the knowledge gained from both the SVR and KNR models. If the orange line is quite near to the blue line, then the ensemble model has successfully captured the fluctuations and trends in oil prices.
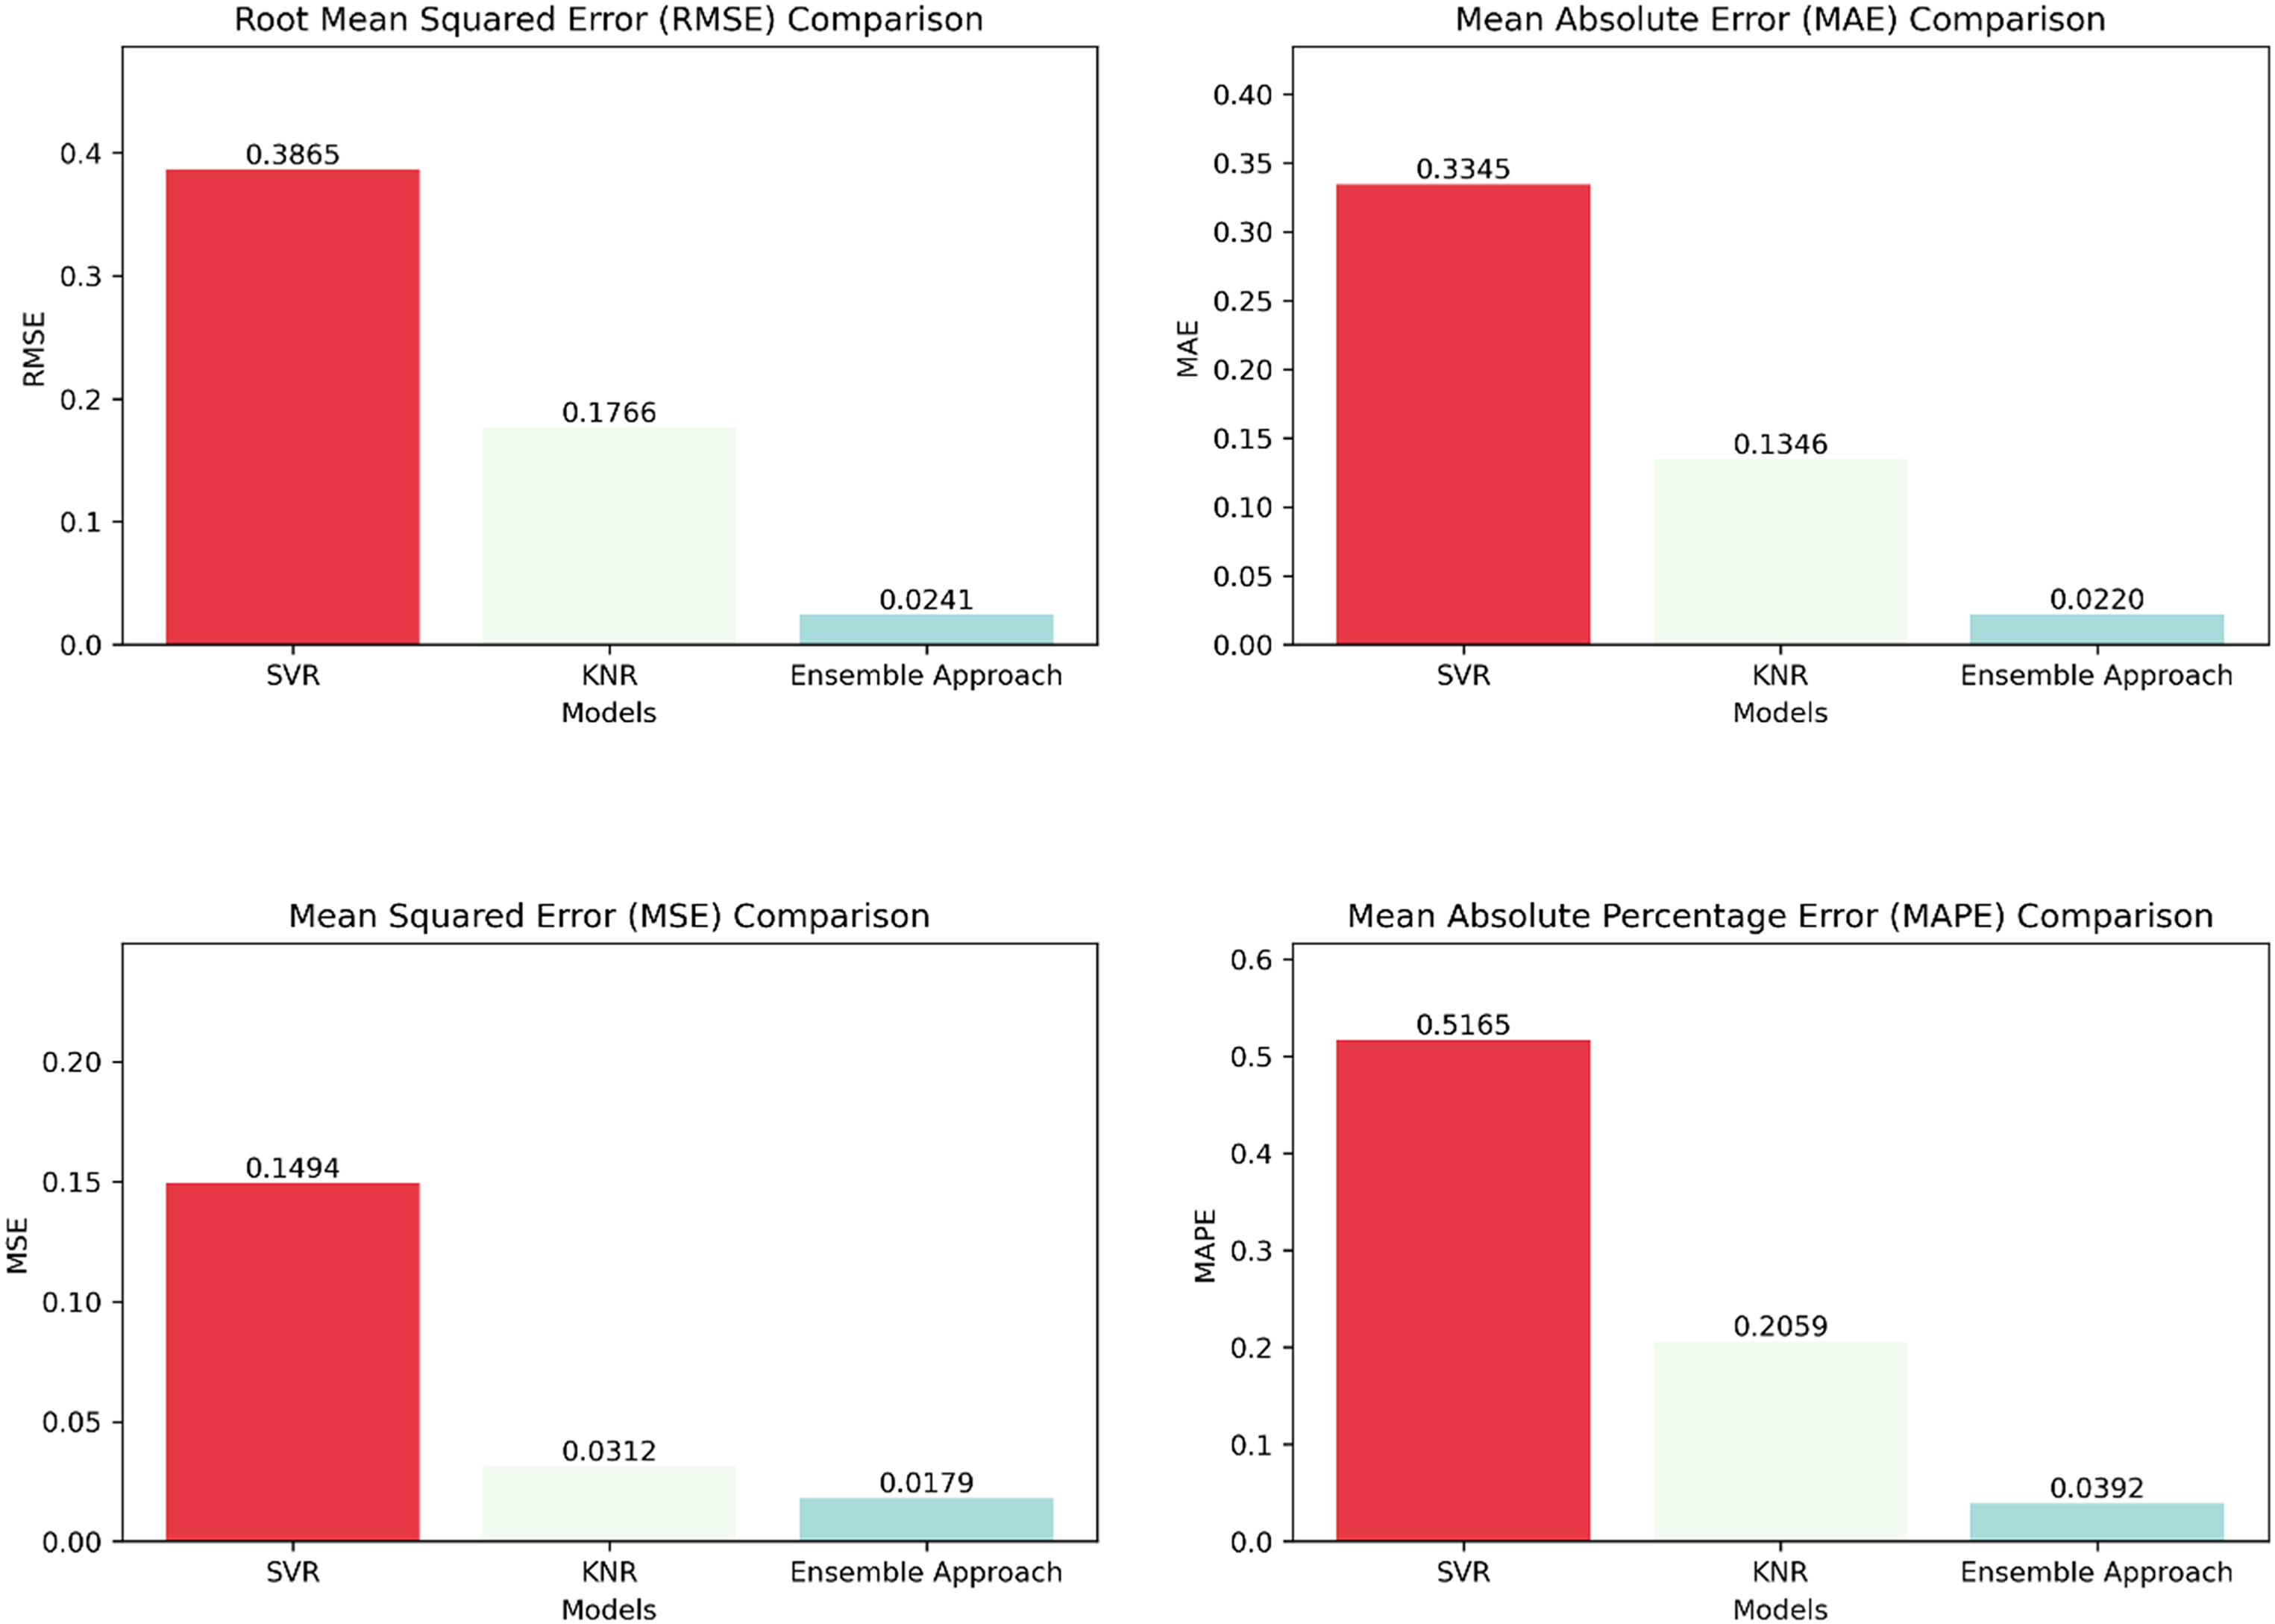
Errors comparison.
Comparison
We compare the performance characteristics of the SVR, KNR, and Ensemble Approach models in Figure 10. The ensemble approach shows superiority in predicting oil prices across all measures compared to both SVR and KNR. We also present actual vs projected charts for each model on the training and testing datasets in Figures 11 and 12. How well each model represents the observed patterns and trends in the data is graphically displayed here. We can see how well the model fits the training data and generalizes to the testing data by comparing the actual and predicted values.
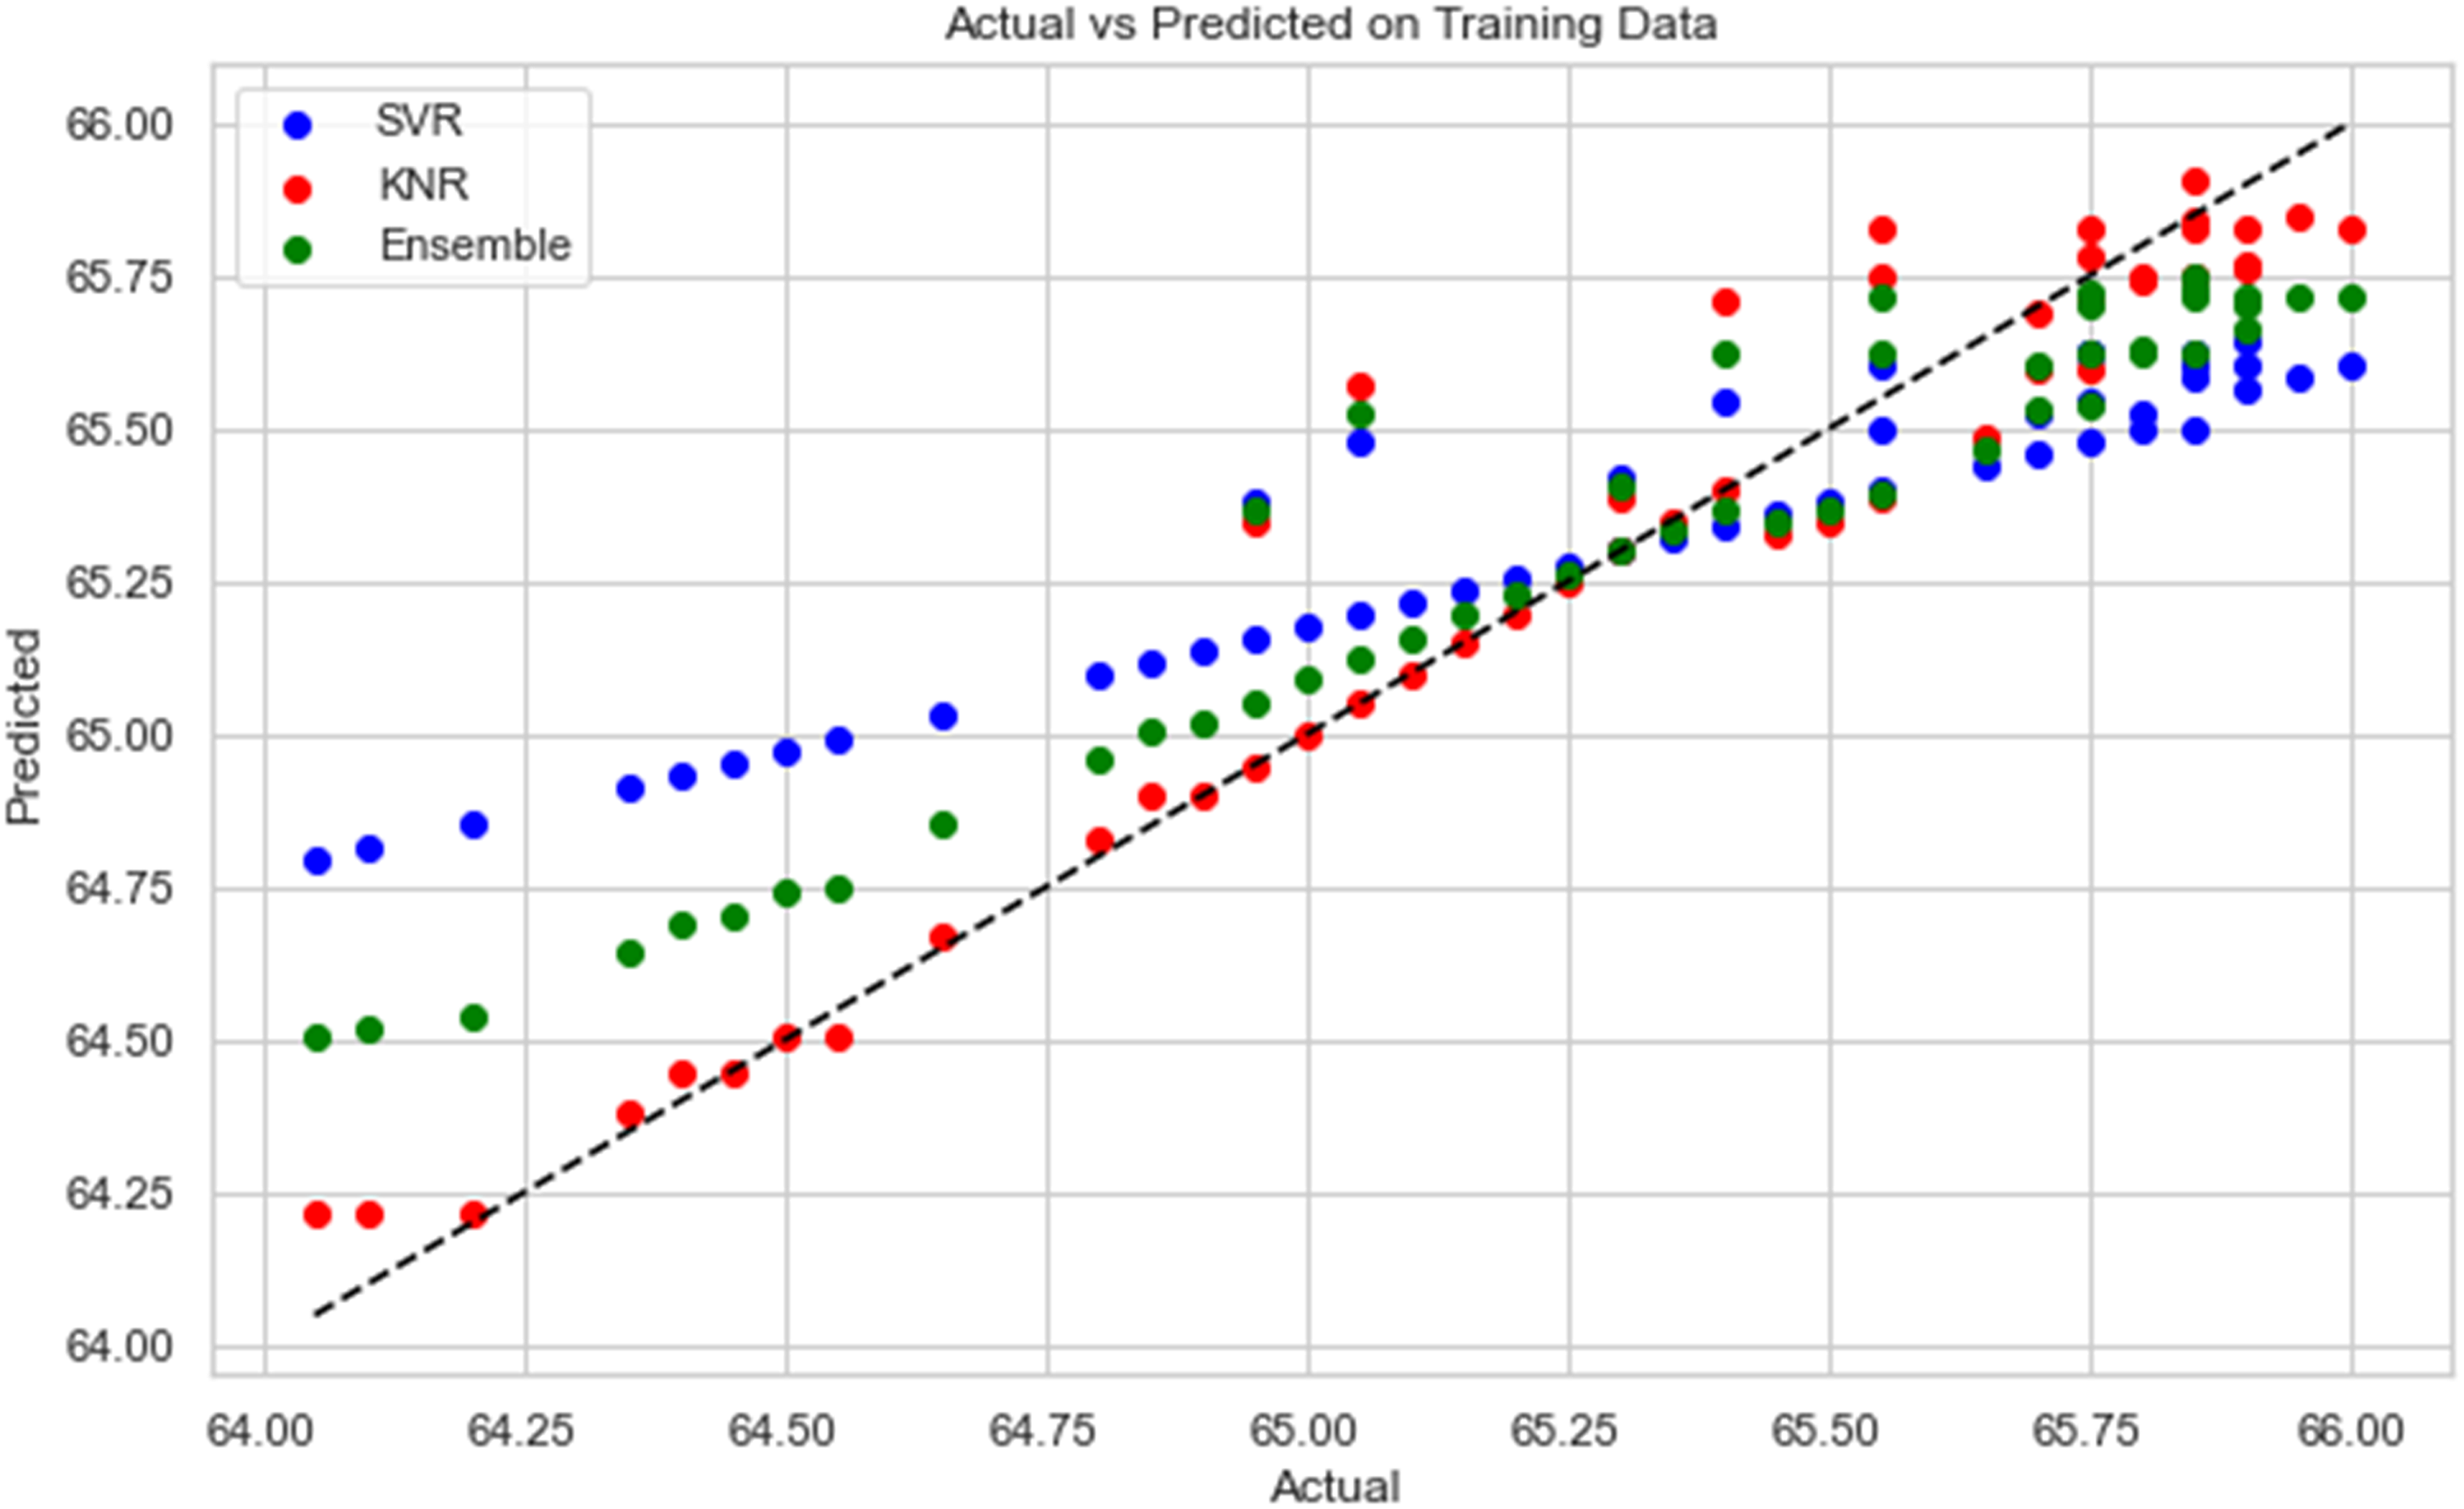
Actual vs prediction on training data for each model.
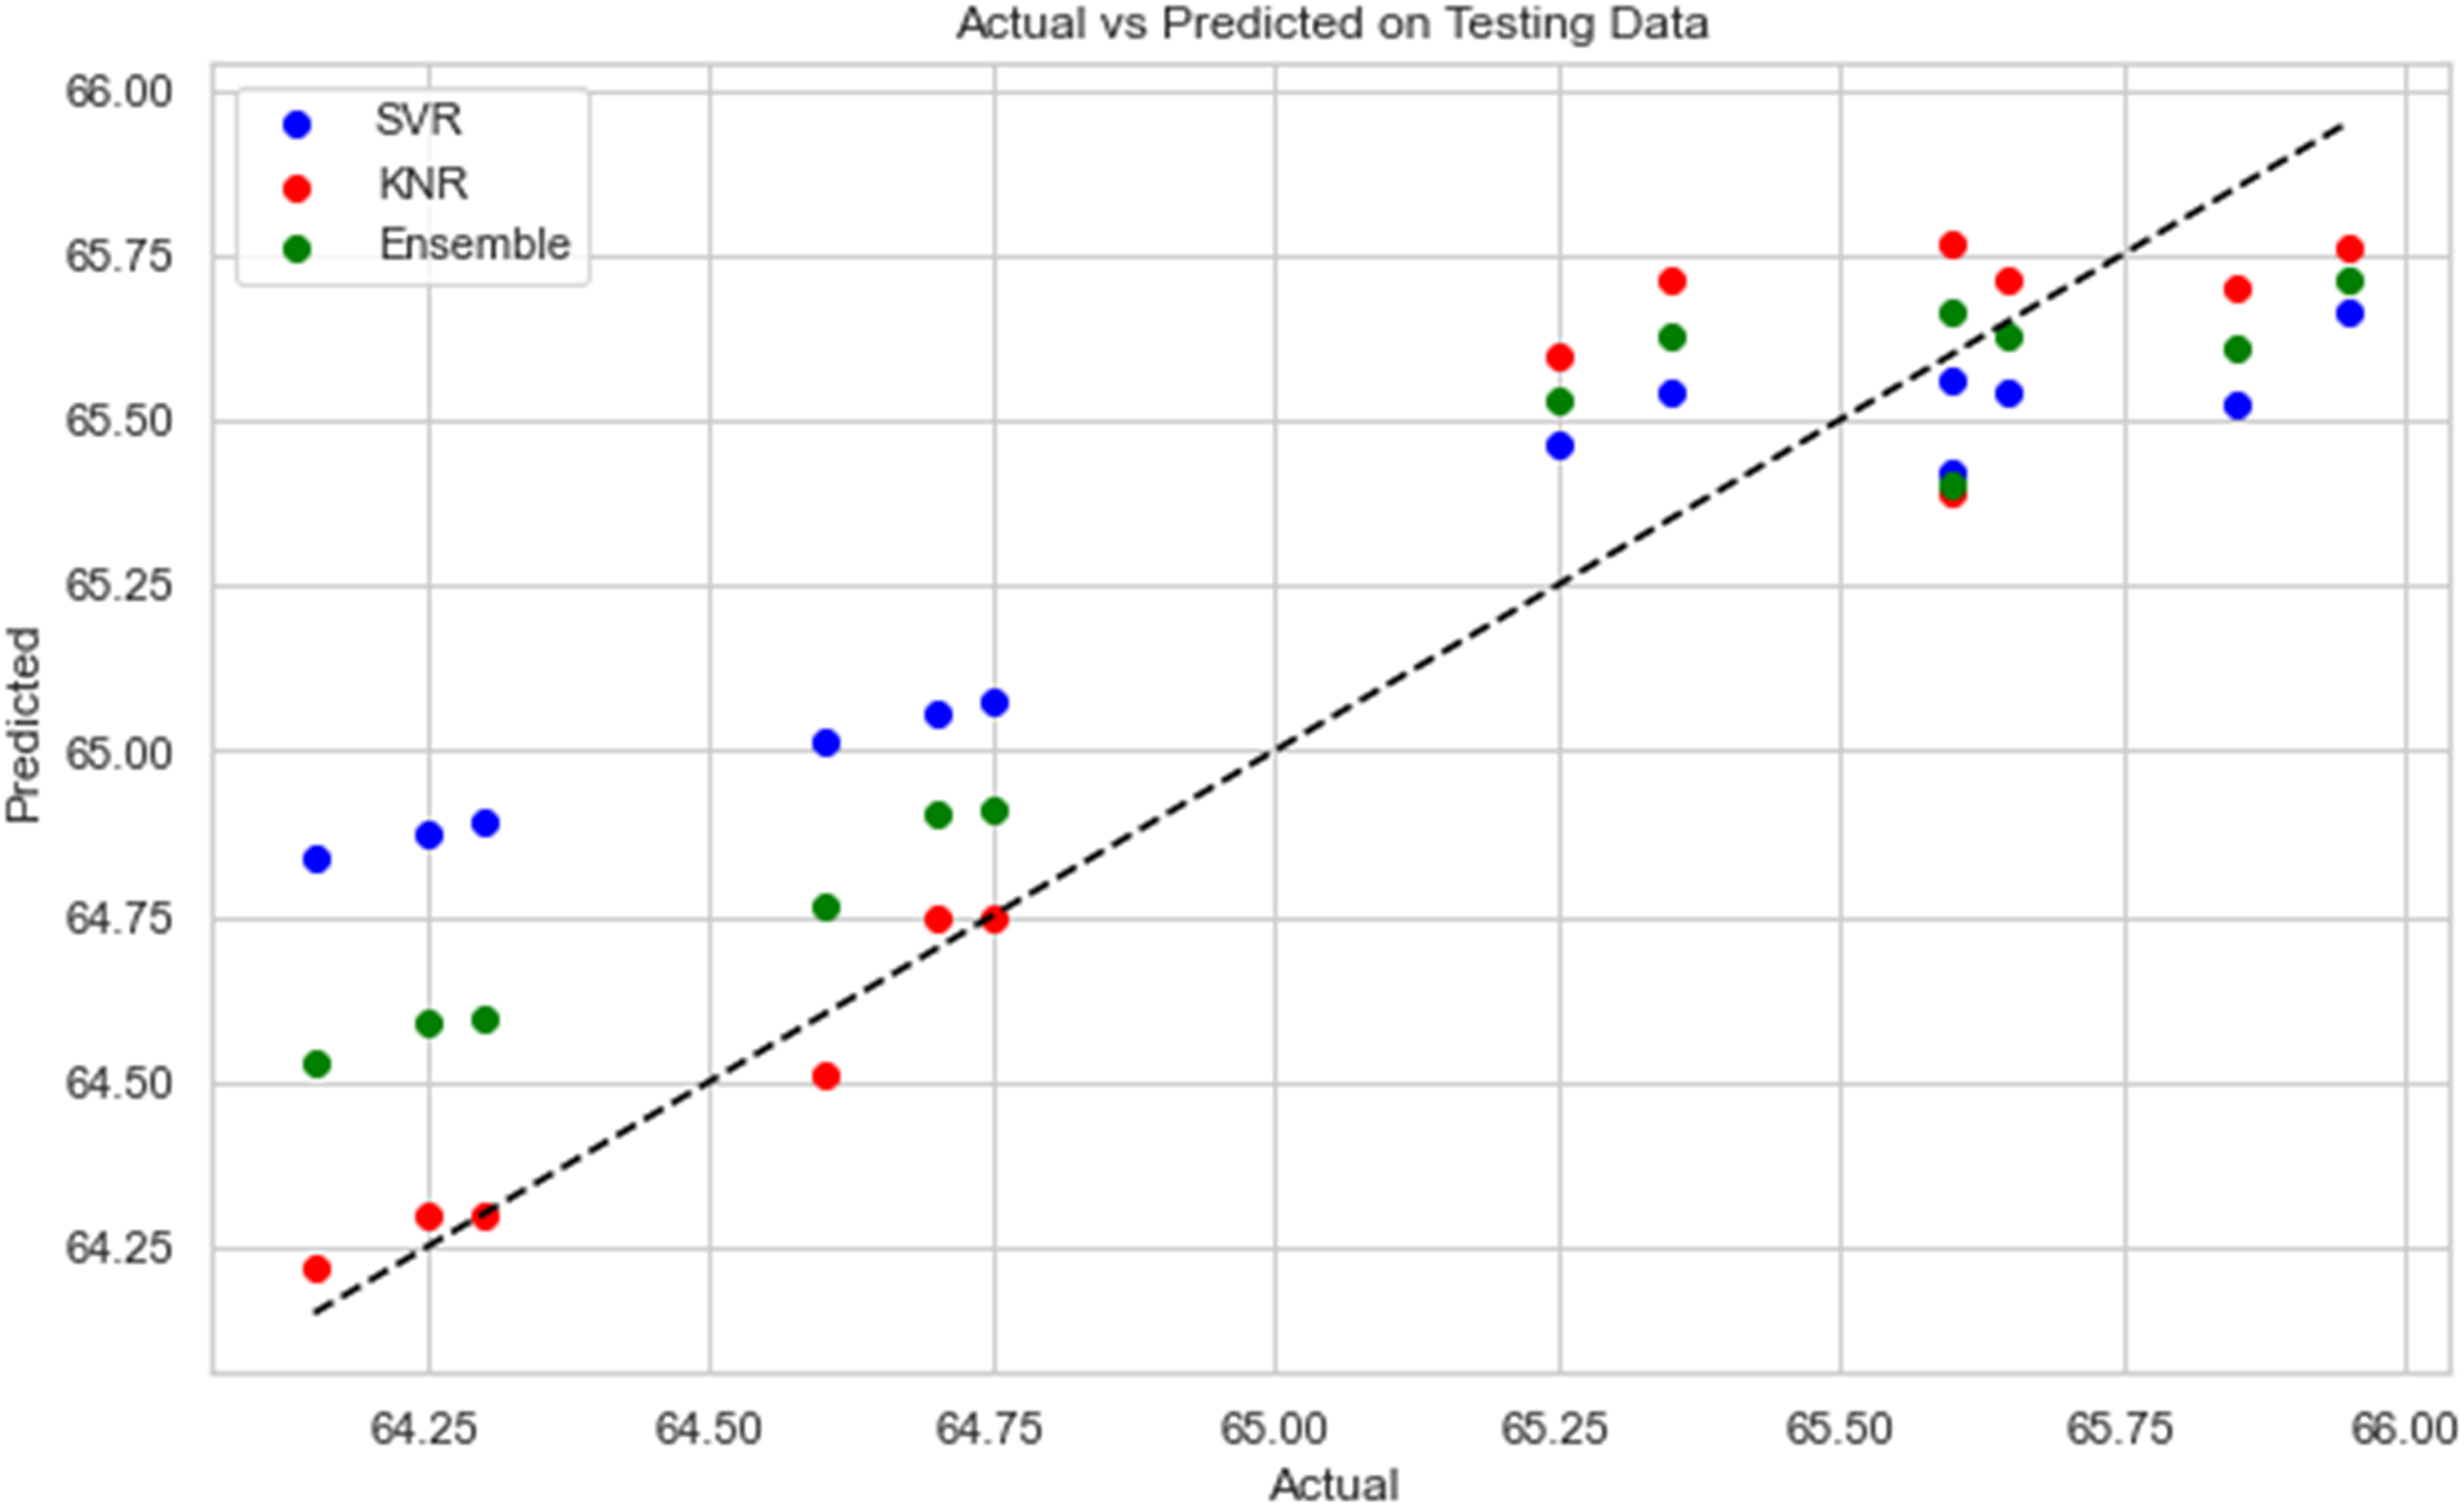
Actual vs prediction on testing data for each model.
Table 3 summarizing the evaluation metrics for SVR, KNR, and the ensemble approach.
Error results of each model.
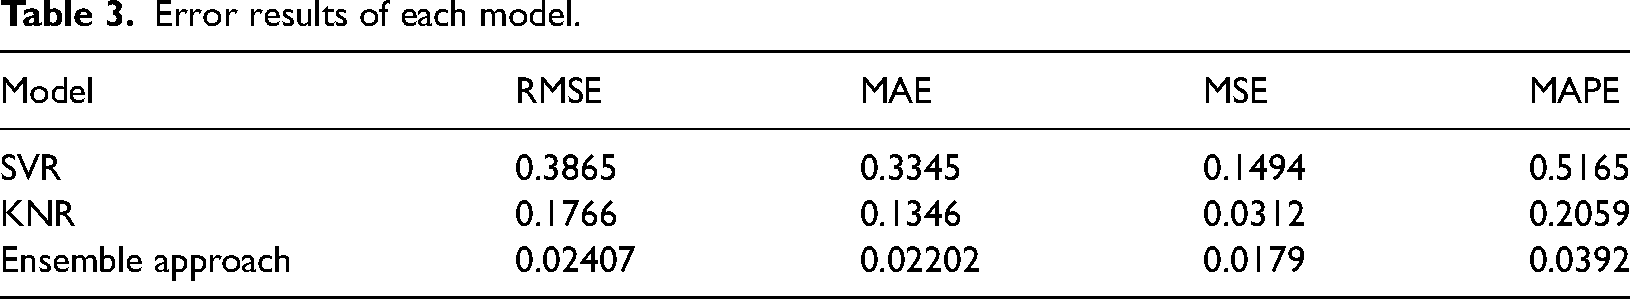
The performance metrics for each model are shown in a table that provides a concise summary. The root mean-squared error, MSE, m-mean error, and mean-averaged percentage error numbers indicate how close or far off the anticipated oil prices are from the actual values. If these indicators have lower values, then means the performance and accuracy are better. We can see from the table that the ensemble approach regularly outperforms SVR and KNR across all evaluation metrics, proving its better predictive ability in predicting oil prices.
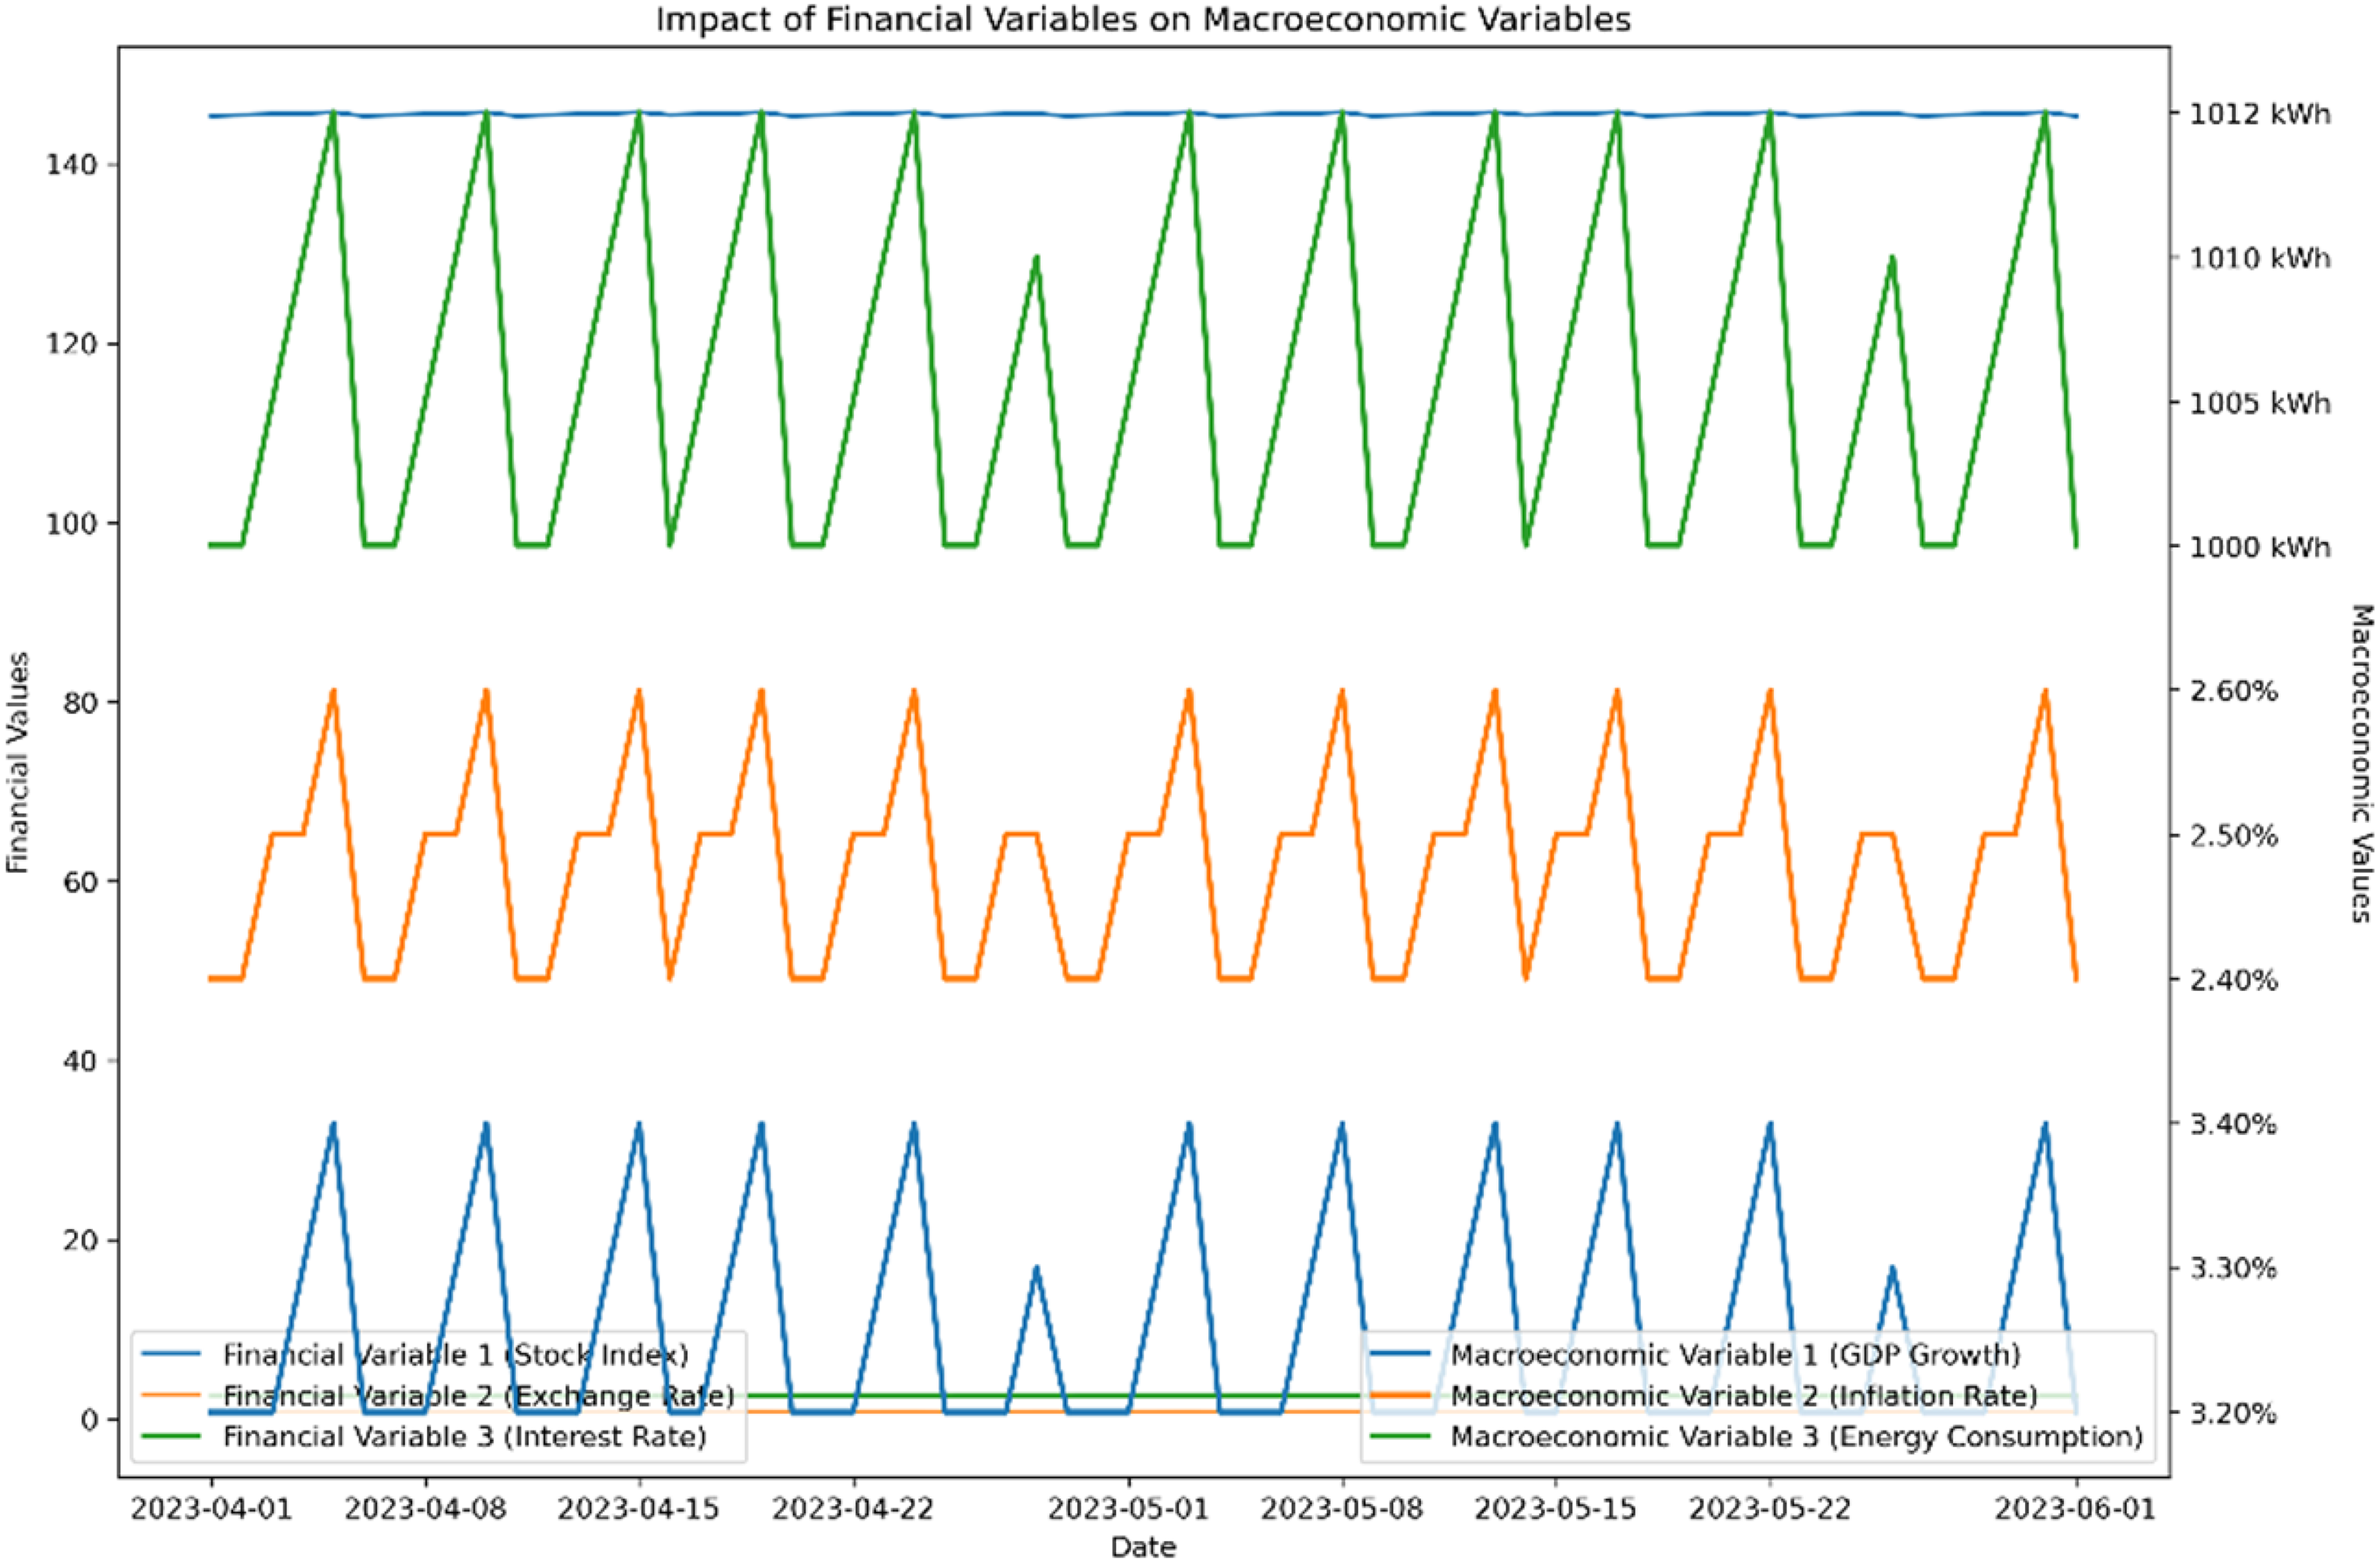
The effect of financial variables on macroeconomic variables is displayed in Figure 13. It provides a graphic picture of how changes in macroeconomic factors like stock index, exchange rate, and interest rate affect present variables like GDP growth, inflation rate, and energy consumption. Each line represents a different financial variable, and the direction and magnitude of its change over time reveal how it affects the associated macroeconomic measure.
Impact of financial variables on macroeconomics variables.
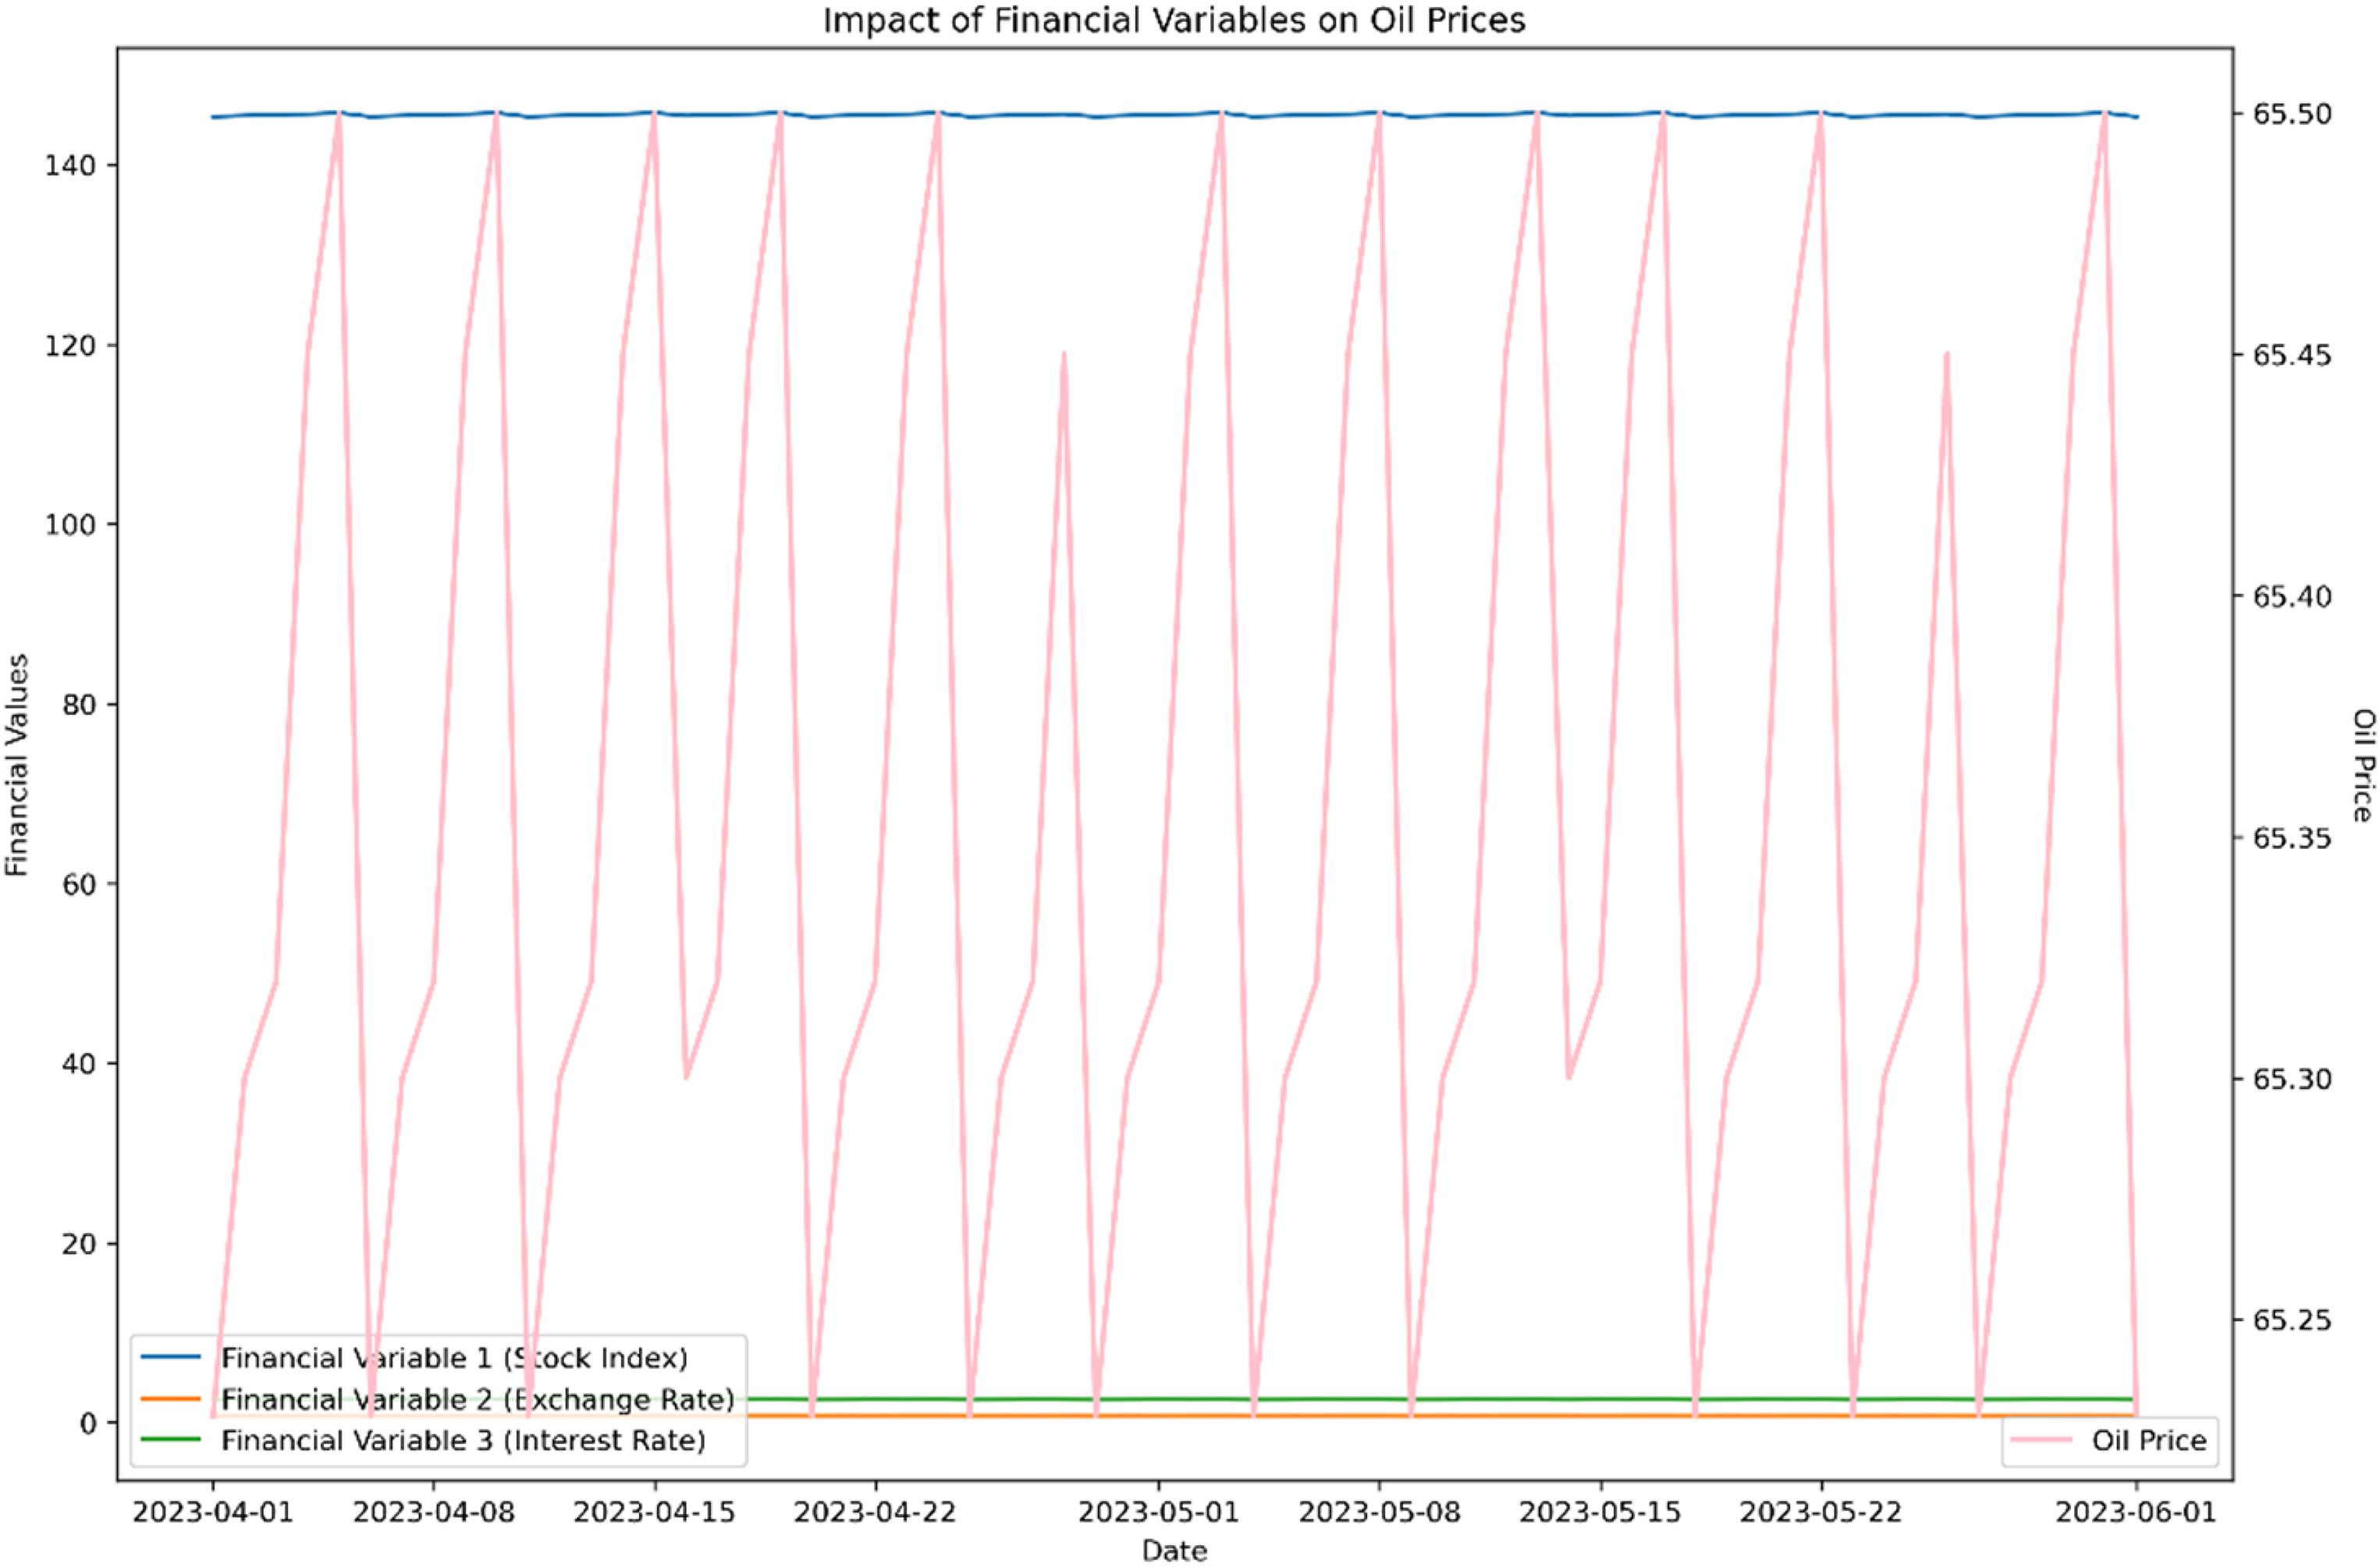
The effect of financial factors on oil prices is shown in Figure 14. It shows the connection between financial variables including the stock market, currency exchange rates, and interest rates and oil price swings. In this graph, each line represents a different financial indicator whose impact on oil prices is shown by its trajectory through time.
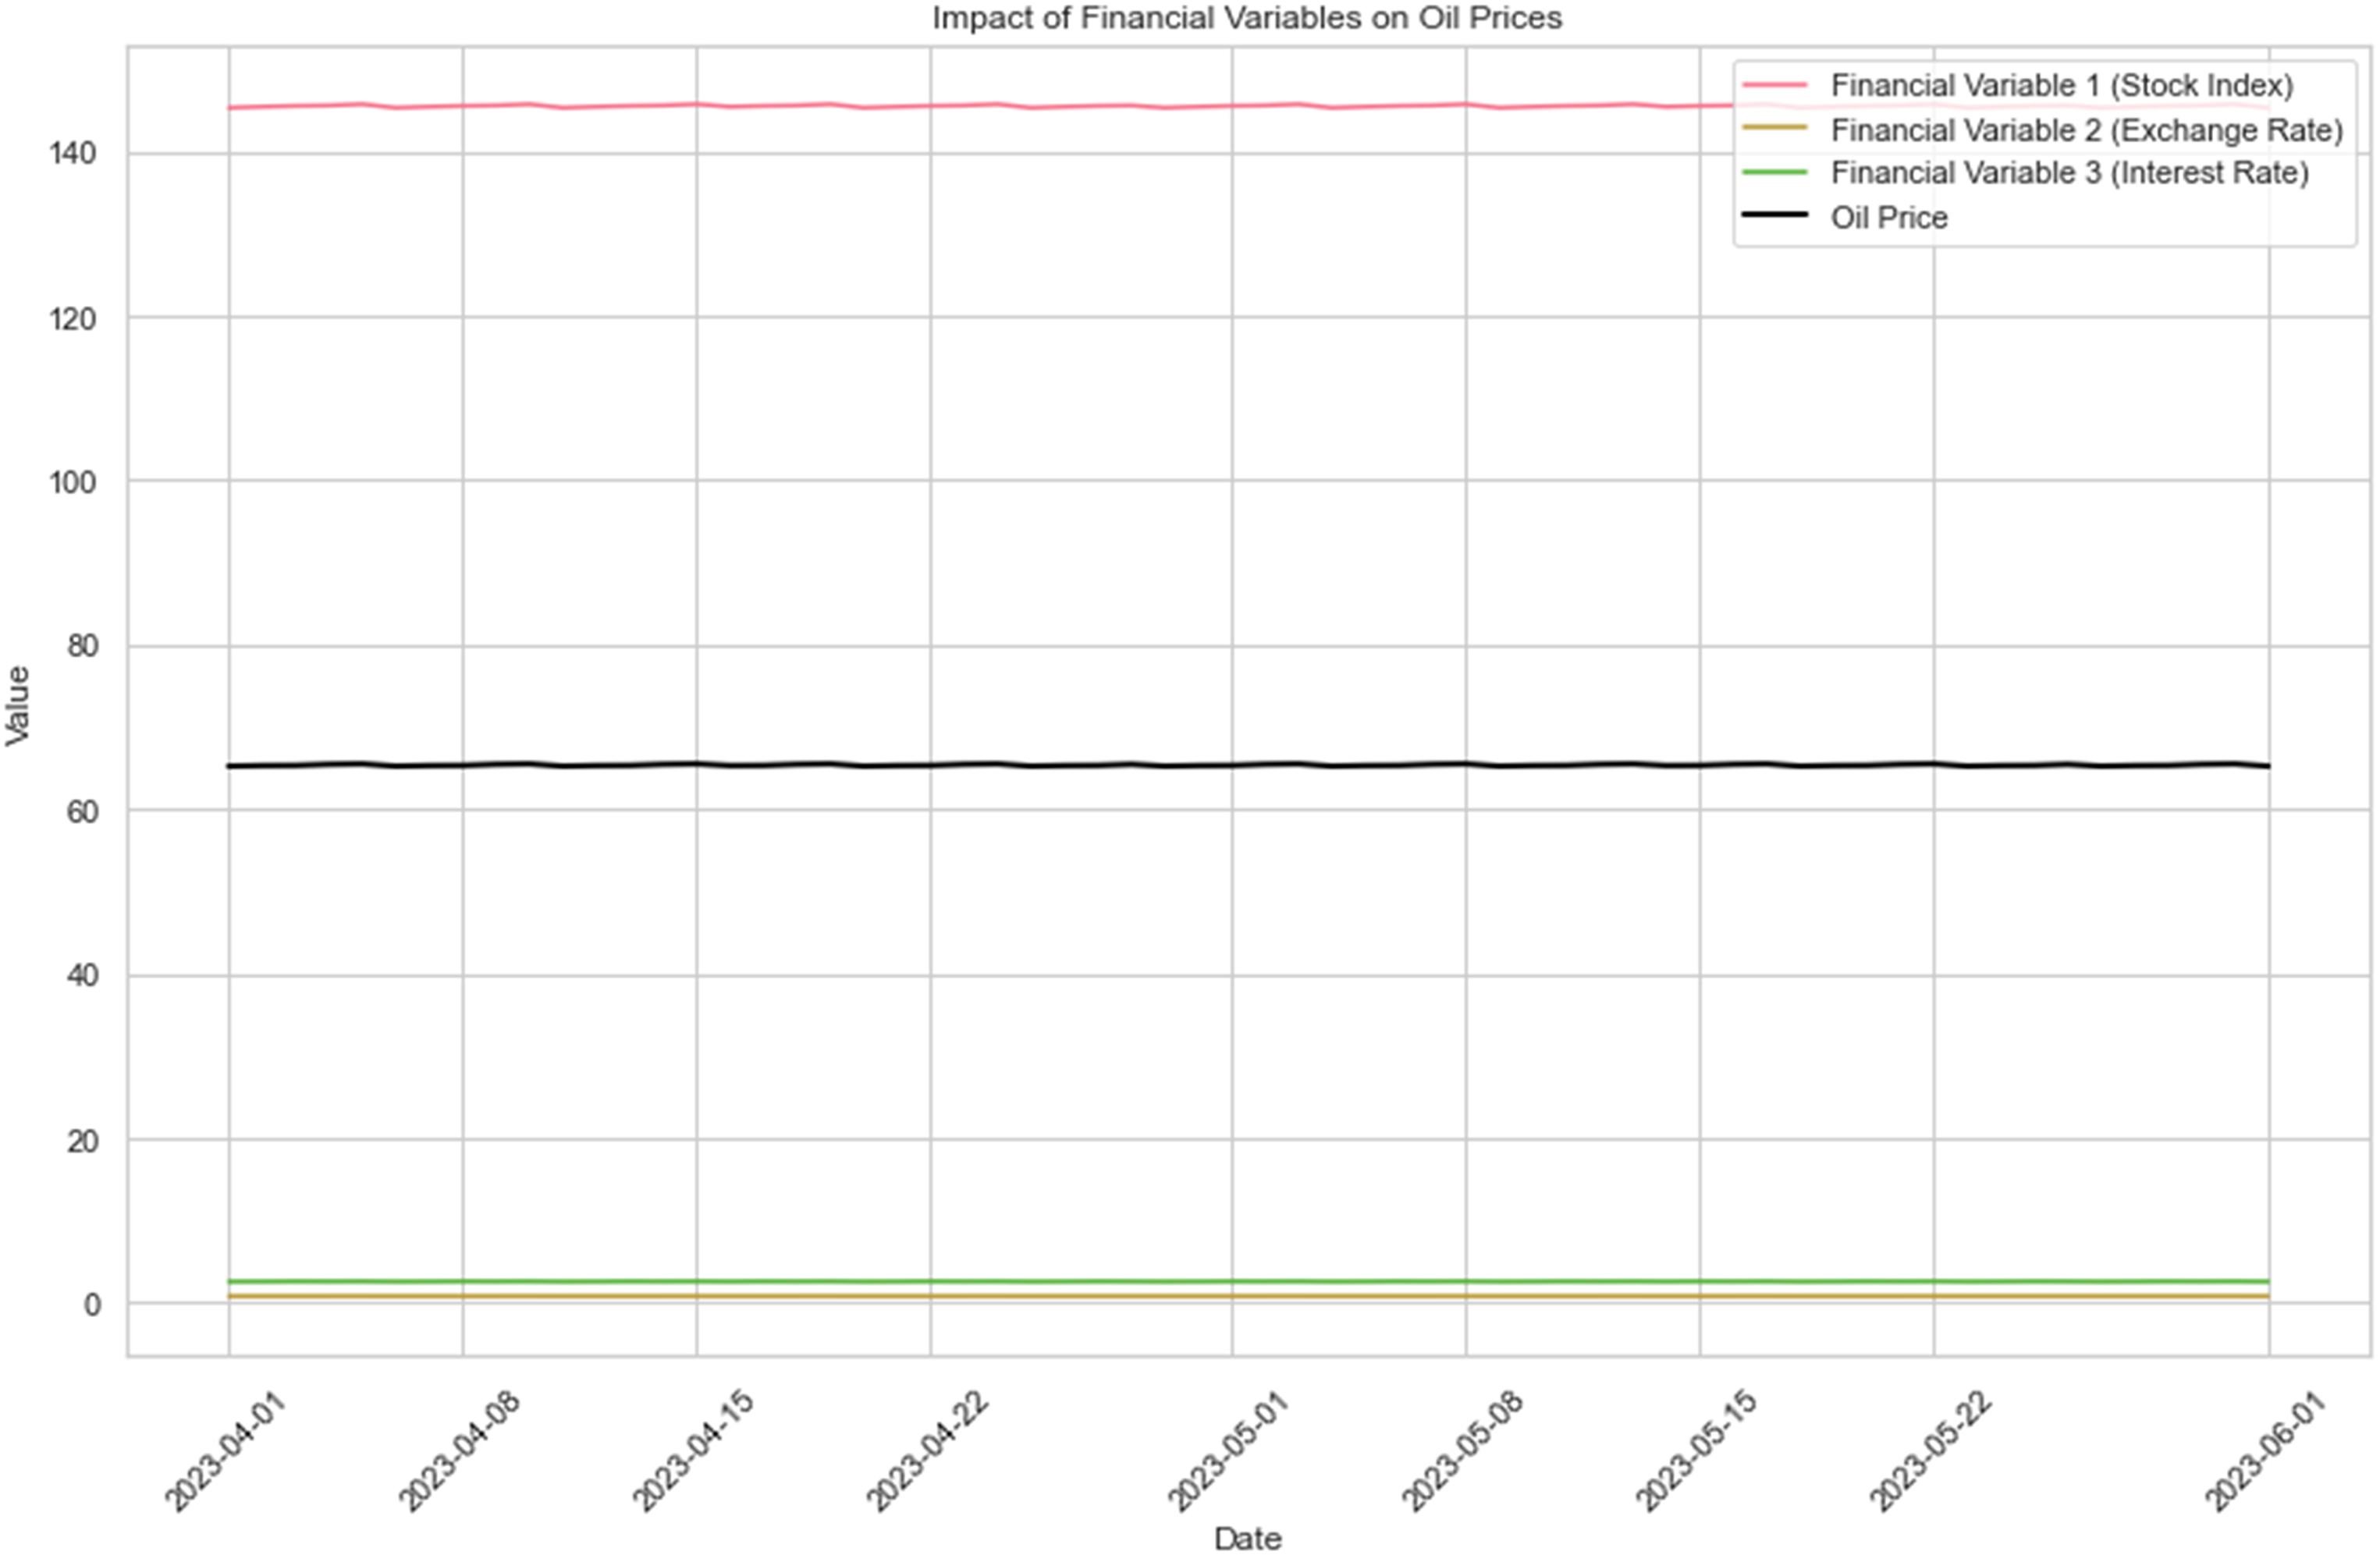
Impact of financial variables on oil prices.
Figure 15 delves deeply into how many factors affect oil prices. It encompasses both macroeconomic and financial indicators, such as the stock market, exchange rate, and interest rate. It provides a thorough understanding of their combined impact on oil prices by graphing these variables together. To better understand the factors influencing oil price fluctuations, we can use this graphic to see whether there are any connections or patterns between the variables and oil price movements.
Variable impacts on oil prices.
Conclusions
In conclusion, our research focused on forecasting oil prices and analyzing their impact on the KSA stock market. By employing a SVR- KNR ensemble approach and utilizing specific datasets related to KSA, we aimed to develop accurate oil price forecasts and gain insights into the relationship between oil prices and the stock market. Financial variables, such as the stock index, exchange rate, and interest rate, have a significant impact on macroeconomic variables. Changes in these financial factors can influence GDP growth, inflation rate, and energy consumption in the KSA. Financial variables also exhibit an impact on oil prices. Fluctuations in the stock index, exchange rate, and interest rate can contribute to the volatility of oil prices in the KSA market. The ensemble approach combining SVR and KNR models enhances the accuracy and robustness of oil price forecasts. By leveraging the strengths of both algorithms, we were able to develop a comprehensive forecasting model that captured the complex relationships and patterns in the data. Our research provides valuable insights for investors, policymakers, and market participants. Understanding the dynamics and interplay between oil prices and the KSA stock market can aid in making informed decisions and formulating effective strategies. Overall, our study contributes to the field of oil price forecasting and provides a deeper understanding of the relationship between oil prices and the KSA stock market. The insights gained from this research can assist in risk management, investment planning, and policy formulation in the context of the KSA market. Future research can further explore additional variables and employ more advanced machine learning techniques to improve the accuracy and granularity of oil price forecasts.
Footnotes
Acknowledgements
Researchers would like to thank the Deanship of Scientific Research, Qassim University for funding publication of this project.
Declaration of conflicting interests
The author declared no potential conflicts of interest with respect to the research, authorship, and/or publication of this article.
Data availability
The author used data to support the findings of this study that is included in this article.