
Abstract
In this paper, an improved mathematical model that evaluates the economic efficiencies of the integrated energy system, comprising the fuel networks (coal and natural gas) and the electrical power system has been extended. According to this model, the economic efficiency of the electric energy system depends on many factors including electric generation, transmission subsystems and the ability to produce and transport a variety of primary energy sources. In this study, new constraints for maintenance of the electricity and natural gas subsystems have been considered in addition to the constraints of the previous model. Additionally, by using analysis of variance (ANOVA), the effect of climate conditions on different gas or electricity transmission regions (with the assumption of equal break-even point for failure probability) has been analyzed. Finally, conditions under which preventive maintenance should be applied have been discussed. Notice that the extended model is linear and has been solved with the GAMS 23.5.1 software.
Keywords
Motivation and significance
Nowadays, the cost of transmitting energy from supplier to the consumer is so high and when the transmitting system finds a problem and the process of transmission stops, this disruption will become even more costly. So, the energy distributer companies need to implement a reliable system with a good maintenance program. But in order to have a reliable system with good maintenance, suppliers need to invest money so there is a challenge to find the proper condition that makes it worth to invest on maintenance. In this paper, proper conditions for implementing maintenance have been proposed.
Introduction
Maintenance and reliability play an important role in the performance of any system. In the following definition, the importance and relation between maintenance and reliability in the system have been described. Maintenance can be considered as a combination of different technological and supervisory actions in the life cycle of an item in order to keep it in good condition or reestablish it to a form in which it can do the required works. Actually, the main purpose of industrial maintenance is to increase availability of production facilities while decreasing the maintenance cost. Because of the large investments in energy systems in recent years, new maintenance management and strategies are of particular importance. As an example, in countries like Finland, around 5.5% of companies’ turnover is dedicated to maintenance cost (Komonen, 2002). Here, maintenance has been divided into three different types (but different authors suggest other groupings which are somehow different from this classification (see for example Bloch and Geitner, 2004; Calixto, 2012; Kelly, 1984; Nakajima, 1989; Willmott, 1997)
Emergency Maintenance (EM): In this method, equipment will be repaired after the first crash occurred. Corrective Maintenance (CM): In this method, equipment will be restored to its original state after the occurrence of any sign of defectiveness. Preventive Maintenance (PM): In this method, maintenance of the equipment takes place in certain time periods according to the specified schedule. According to the Federal Energy Management Program, preventive maintenance is defined as the actions performed on a time- or machine-run based schedule that detect, preclude, or mitigate degradation of a component or system with the aim of sustaining or extending its useful life through controlling degradation to an acceptable level.
Reliability that is defined as the probability that an item will do a required function under special conditions for a specific time (Dummer et al., 1997) has a close relation with maintenance since, as mentioned above, one of the purposes of industrial maintenance is to increase availability performance and high reliability can help maintenance to reach this goal. Actually it is so important that any equipment used in the production process operates reliably under all the conditions in which it is used (Dummer et al., 1997). Accidents such as the cascading outage of transmission and generation facilities in North American Eastern Interconnection on 14 August 2003 that resulted in a blackout in most North American states and similarly the accident on 23 September 2003 that caused almost 4 million customers to lose their power in some European countries (Andersson et al., 2005) illustrate the importance of improving the performance and reliability of distributed energy systems and energy conservation. As a result of this importance, improving the performance and reliability of distributed energy systems and energy conservation have recently received increased attention. Pehnt (2008) investigated the environmental effects of micro cogeneration in energy distributed systems. Söderman and Pettersson (2006) developed a structural and operational optimization model for a distributed energy system while taking into account the district heating pipelines and heat storage. Briefly, maintenance aims to increase the safety and reliability of the system and reduce the number of failures while keeping the maintenance costs to a minimum. In other words, the main objectives of maintenance are insuring that systems function, system life, safety and human well-being (Dekker, 1996), but here the main question is to find out whether its output is effective or not in terms of the employed materials and the capital invested (Garg and Deshmukh, 2006).
Hence, the management and maintenance scheduling optimization has become an important issue since proper maintenance could represent potential huge economic savings and prevent huge damage to the system but an improper maintenance can significantly increase the costs. Therefore, a reasonable balance between the maintenance costs and other costs must be established. Valuable research related to the analysis and modeling has been carried out in maintenance operation: for example, Nguyen and Murthy (1981) studied two preventive maintenance policies for a repairable system; Chen (2009) proposed a scheduling for maintenance; Kim and Makis (2009, 2010) computed the optimal maintenance policy by developing a new modified policy iteration algorithm; and Yang et al. (2009) considered a preventive maintenance of unreliable single server queues and proposed an applicable model for manufacturing systems.
In this paper, the effect of preventive maintenance costs on the total cost has been tracked by considering the failure probability of a natural gas pipeline and transmission of the electricity from one region to another using the model and the data from Quelhas Alves de Feritas (2006). On the other hand, by using ANOVA statistical models, the effect of climate conditions on different gas or electricity transmission regions has been studied with the assumption of equal break-even point failure probability. Finally, the scenarios for when preventive maintenance should be applied have been discussed. Since there are special constraints on some pipelines that affect the time of maintenance (Chabar et al., 2006), in this paper these special constraints have been ignored and the main focus was on general preventive maintenance.
On the other hand, it was desired to quantify the failure probability that disrupts gas pipeline and explore the impact of these probabilities on the costs. Some researchers, due to the high reliability of the gas pipelines, often ignore this probability of failure (Hubner and Haubrich, 2008; Padberg and Haubrich, 2008). Generally, the process of maintenance in gas pipelines and electrical transmission lines has been simulated as dynamic systems (Chattopadhya, 2004; Fotouhi Ghazvini et al., 2013; Kim et al., 2003, 2005). In this work, probability of failure of each gas and electricity transmission line has been assumed to be different (different months), but this probability of failure has been investigated for only two months of the year (January and February) because these two months have the maximum probability of failure.
The remainder of this paper is organized as follow: the Improved mathematical model section presents Ana Margarida's model (Quelhas Alves de Feritas, 2006) and shows the new cost component constraint added to this model, the maintenance cost of gas and electricity subsystems and its effect on the total cost in the objective function; the Probability of failure section calculates the failure probability of each region’s break-even point; and the Results section analyzes the results by running the model for the two subsystems in the months of January and February by considering the failure in each region, executing the model in GAMS for 85 series (30 series in the gas subsystem and 55 series in the electricity subsystem) and by analyzing the variance between the regions (weather conditions in winter) it was found that within a confidence interval of 95% in the gas subsystem and 99% in the electricity subsystem, which regions should have maintenance in January and February. Finally, the Conclusion section summarizes the main contributions of this paper.
Improved mathematical model
Here, the parameters of the model proposed in Ana Margarida’s thesis (Quelhas Alves de Feritas, 2006) have been used exactly. Below you can see the model and its parameters. It should be noted that some parameters have been changed due to modeling in GAMS. For instance, CG has changed to CGvar.
Decision variables
Right-hand side values
Coefficient
Indices
Objective function and constraints of improved mathematical model
Ana Margarida (Quelhas Alves de Feritas, 2006) has proposed the following model
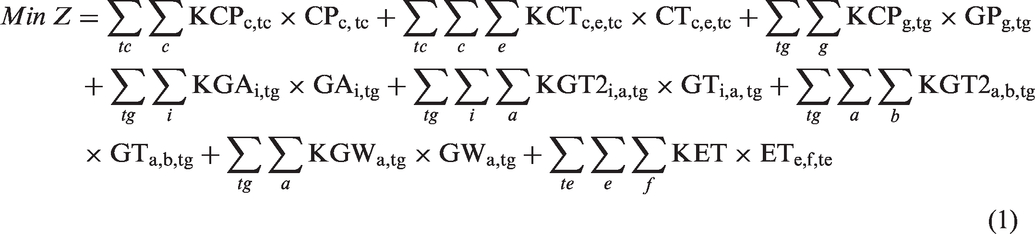
S.t.


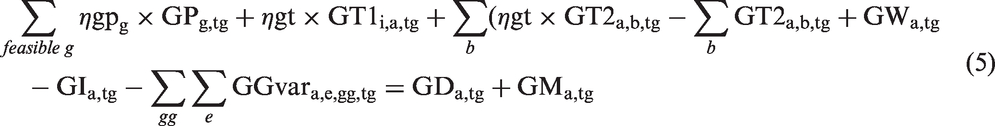


The objective is to minimize the total operating costs of meeting electricity demand from coal and natural gas sources over a medium term horizon. Equation (2) shows the balance between the produced coal and transported coal of the region. Equation (3) shows the balance between the coal received from each supply region and different coal-red units in the demand region. Equation (4) shows the balance of the natural gas at the crossing border nodes. Equation (5) shows the balance of the natural gas at the trans-shipment nodes. Equation (6) shows the balance of the natural gas at the storage nodes. Equations (7) and (8) are unit conversions at the equivalent power plant. Equation (9) ensures the electricity demand. Equation (10) bounds the amount of coal produced from each supply region. Equation (11) validates the coal supply contracts. Equation (12) bounds the amount of the imported natural gas from Canada through each crossing border node. Equation (13) bounds the natural gas from each supply region. Equation (14) limits the amount of natural gas transmitted between transmission regions. Equation (15) limits the amount of natural gas injected to the next time period as storage in transmission region. Equation (16) limits the amount of natural gas withdrawn to the next time period as storage in transmission region. Equation (17) limits the amount of natural gas carried over to the next time period as storage in transmission region.
Equations (18) and (19) restrict the amount of electricity from each generator in each demand region. Equation (20) restricts the electricity transmitted between demand regions. Equation (21) restricts the emitted SO2 as a result of electricity generation.
Developed model analysis
In this section, decision variables, coefficients and developed constraints from Ana Margarida's model (Quelhas Alves de Feritas, 2006) are illustrated for sensitivity analysis in maintenance of regions in gas and electricity subsystems.
Assumption
We consider the following assumptions:
If a failure occurs in any of the regions, it can be recognized and repaired by the following month; in other words, the duration of repairing is one month. Failures occur at the beginning of the month and when a region needs to be repaired, gas or electricity cannot be transmitted from that region. Failure in each section of gas or electricity transmission has been assumed independent and also assumed that in every month at most one failure happens in every section of gas or electricity transmission line. This means that the failure probability in two or more sections at the same time is too low.
Decision variables
λ
Coefficient


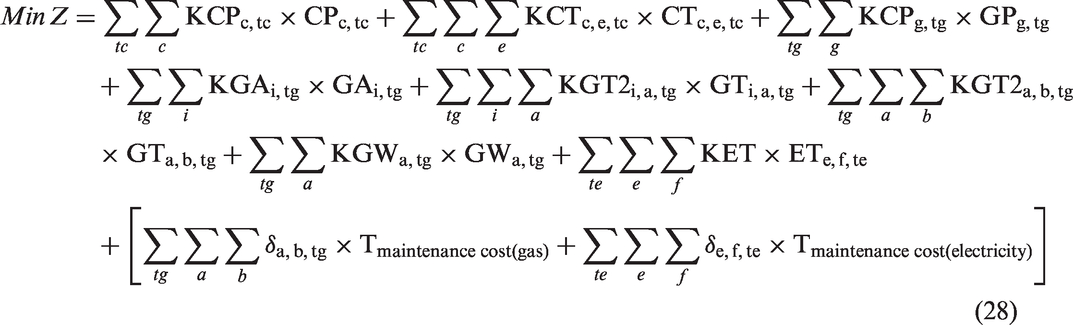
As previously mentioned, one purpose of this work is to do sensitivity analysis on the maintenance cost of gas and electricity subsystems and its effect on total cost, to answer the question whether it is feasible to invest on the maintenance cost in a particular region of the electricity and gas transmissions. The following steps can achieve this: (1) in any electricity and gas transmission region, an estimated cost as fixed maintenance cost has been considered; (2) in the model, the total cost at any region of electricity and gas transmission in two different conditions has been obtained: first considering failure, second without considering failure; (3) by equating total cost and the cost that contains maintenance cost probability of failure (that has normal distribution) can be found; and (4) finally, by considering probability of failure, it can be determined whether it is feasible to invest money on maintenance or not. The following is the new constraint that has been changed in Ana Margarida's model (Quelhas Alves de Feritas, 2006) for involving maintenance costs in the gas subsystem


In constraint (22), if failure occurs between two gas transmission regions (a, b) during time tg, then
Since the decision variable
The other new constraint that has been changed in electricity subsystem for involving maintenance costs is as follows


In constraint (23), if failure occurs between the two electricity demand regions (e, f) during time tg, then
Decision variable
Probability of failure
Probability of failure in gas subsystem
To obtain probability of failure in the natural gas transmission pipelines, total cost has been run with and without considering the probability of failure in the GAMS software. Then it is substituted into equation (22). In this way, probability of failure in any region can be obtained

From equation (24), break-even point of

Probability of failure in electricity subsystem
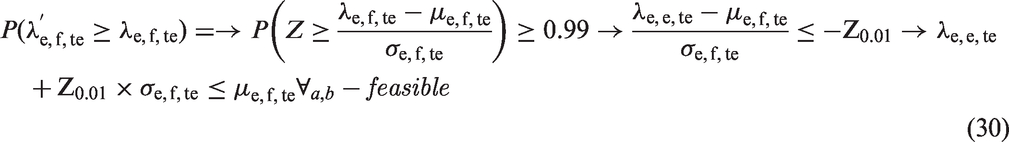
Probability of failure in the electrical subsystem of equation (26) is given by

From equation (26), break-even point of

So the objective function has both of the costs: costs that Ana Margarida (Quelhas Alves de Feritas, 2006) has brought into her model and costs of maintenance for gas and electricity subsystems.
Objective Function (Failure)
Both
Results
Gas subsystem results
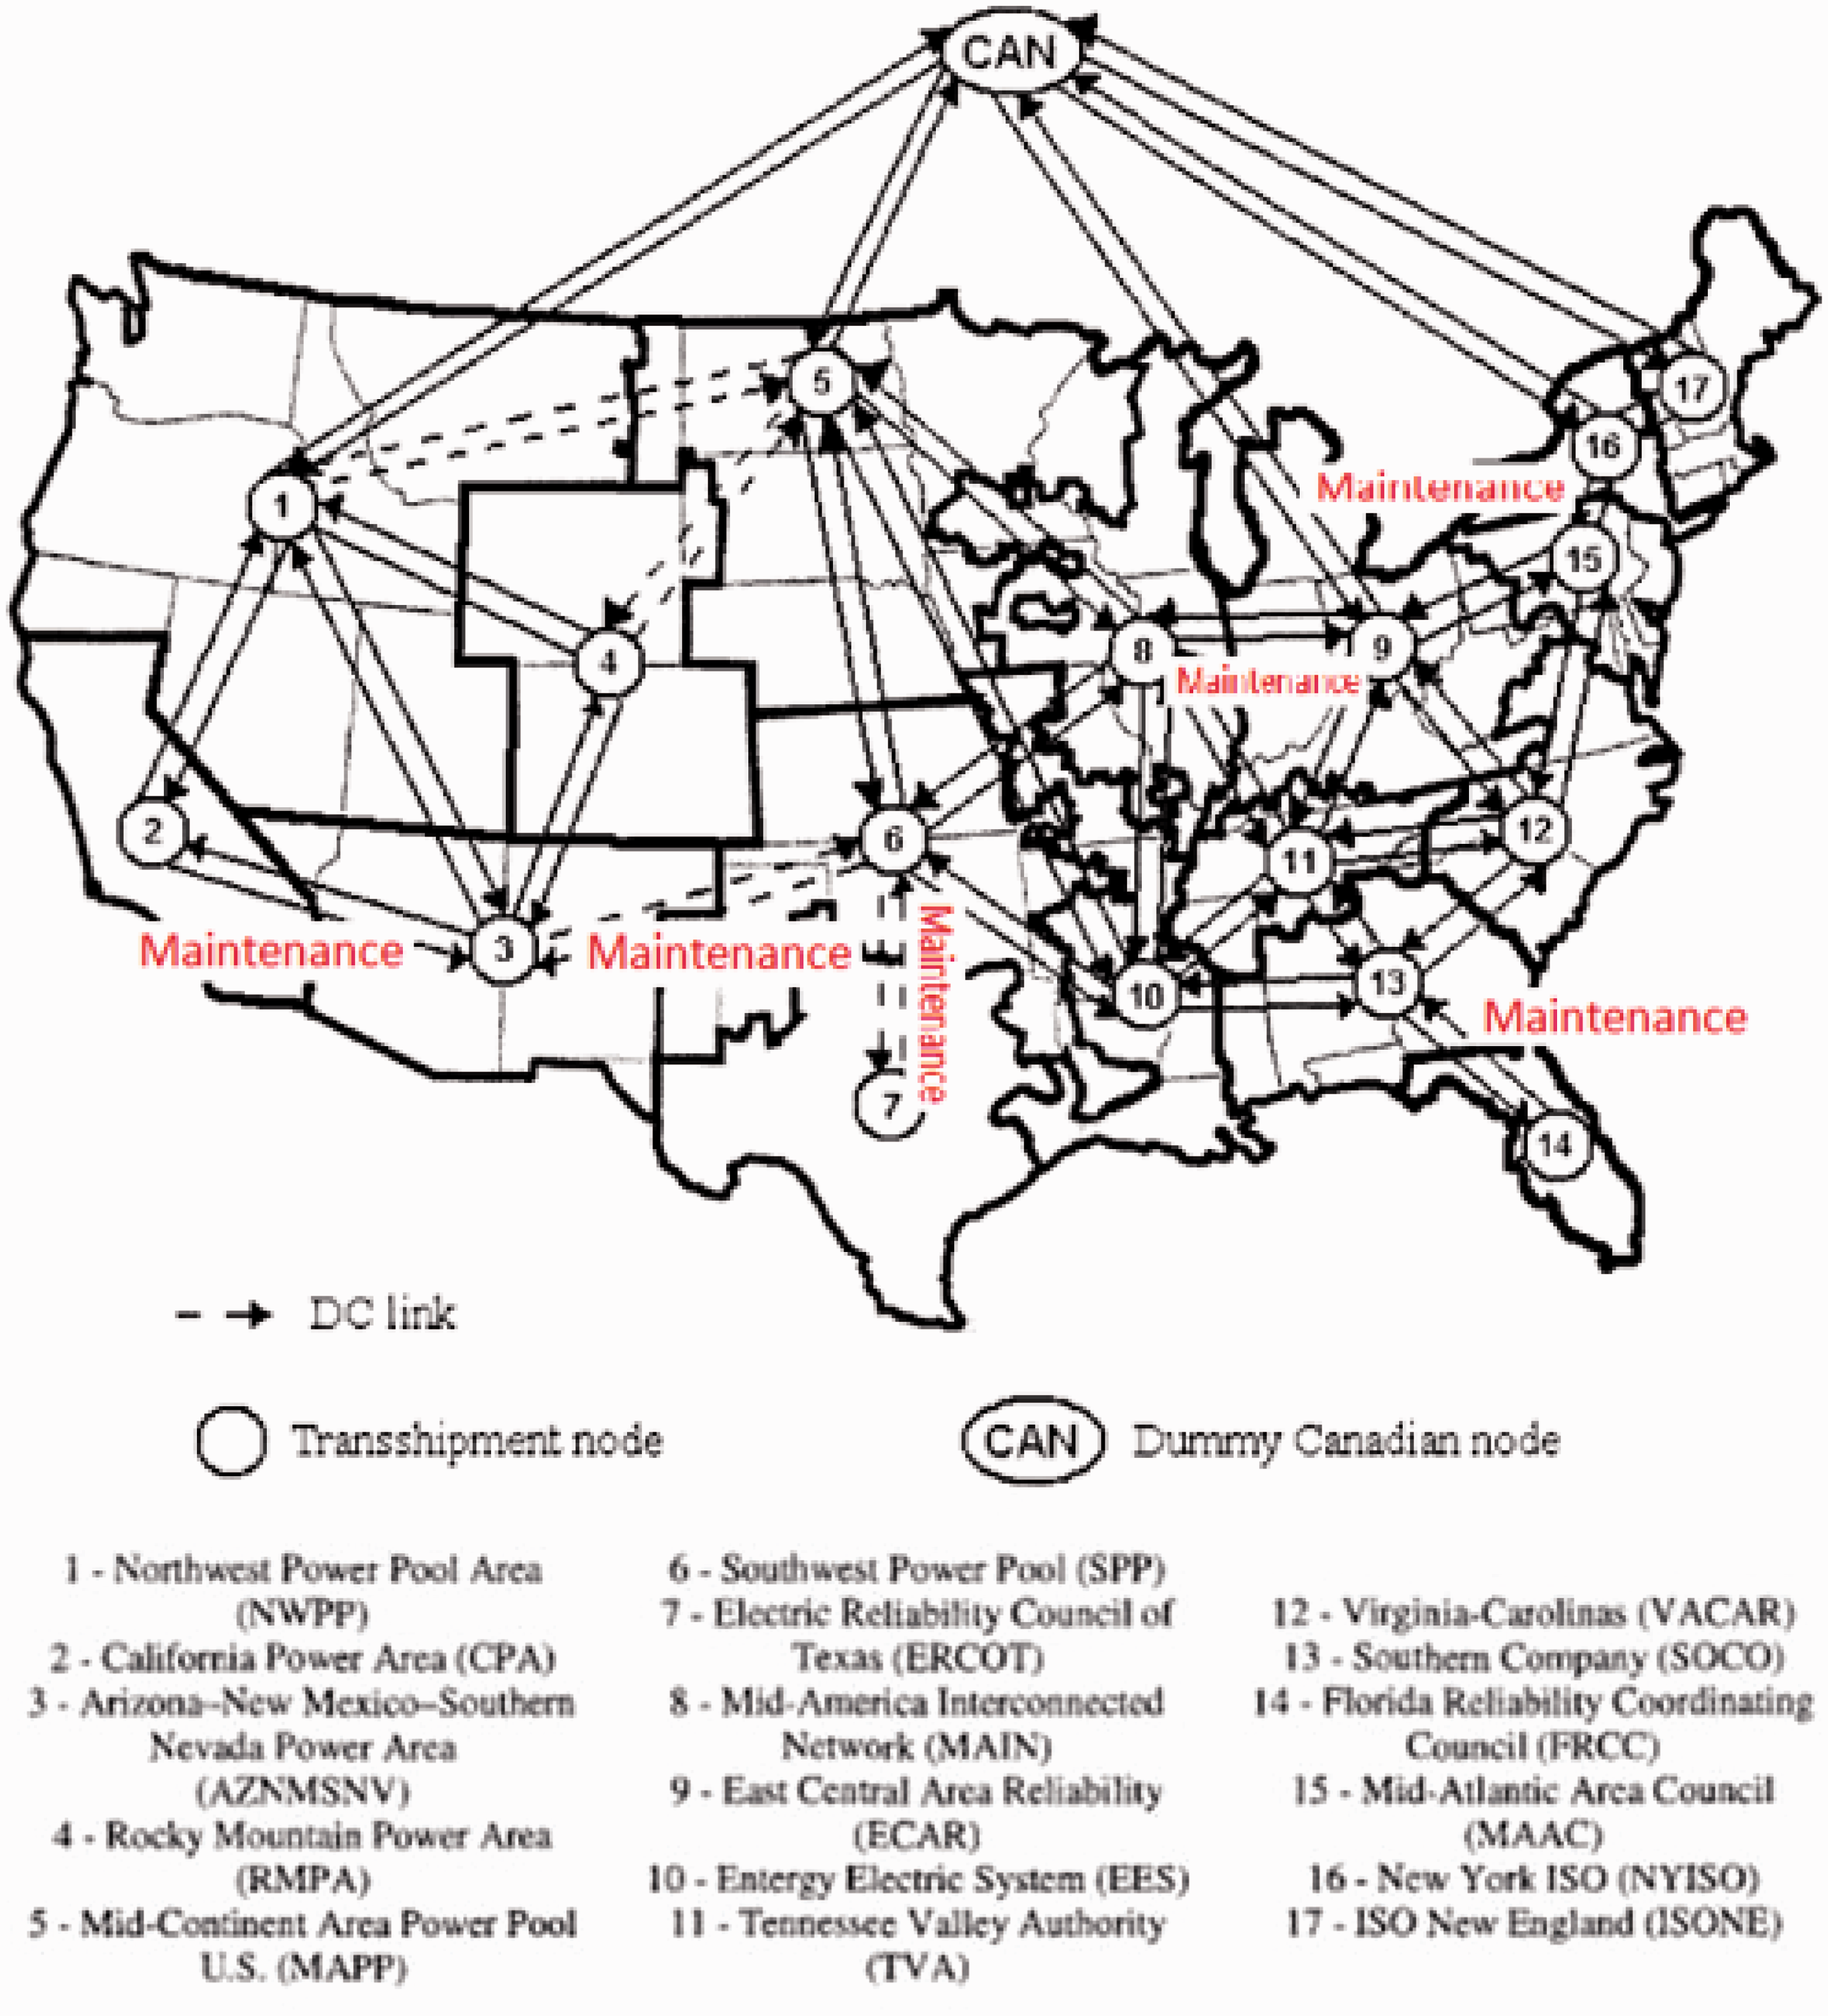
There are six gas transmission regions and each of them transmits gas to feasible regions. Figure 1 shows these regions: (1) Western, (2) Central, (3) Midwest, (4) Northeast, (5) Southeast and (6) Southwest.
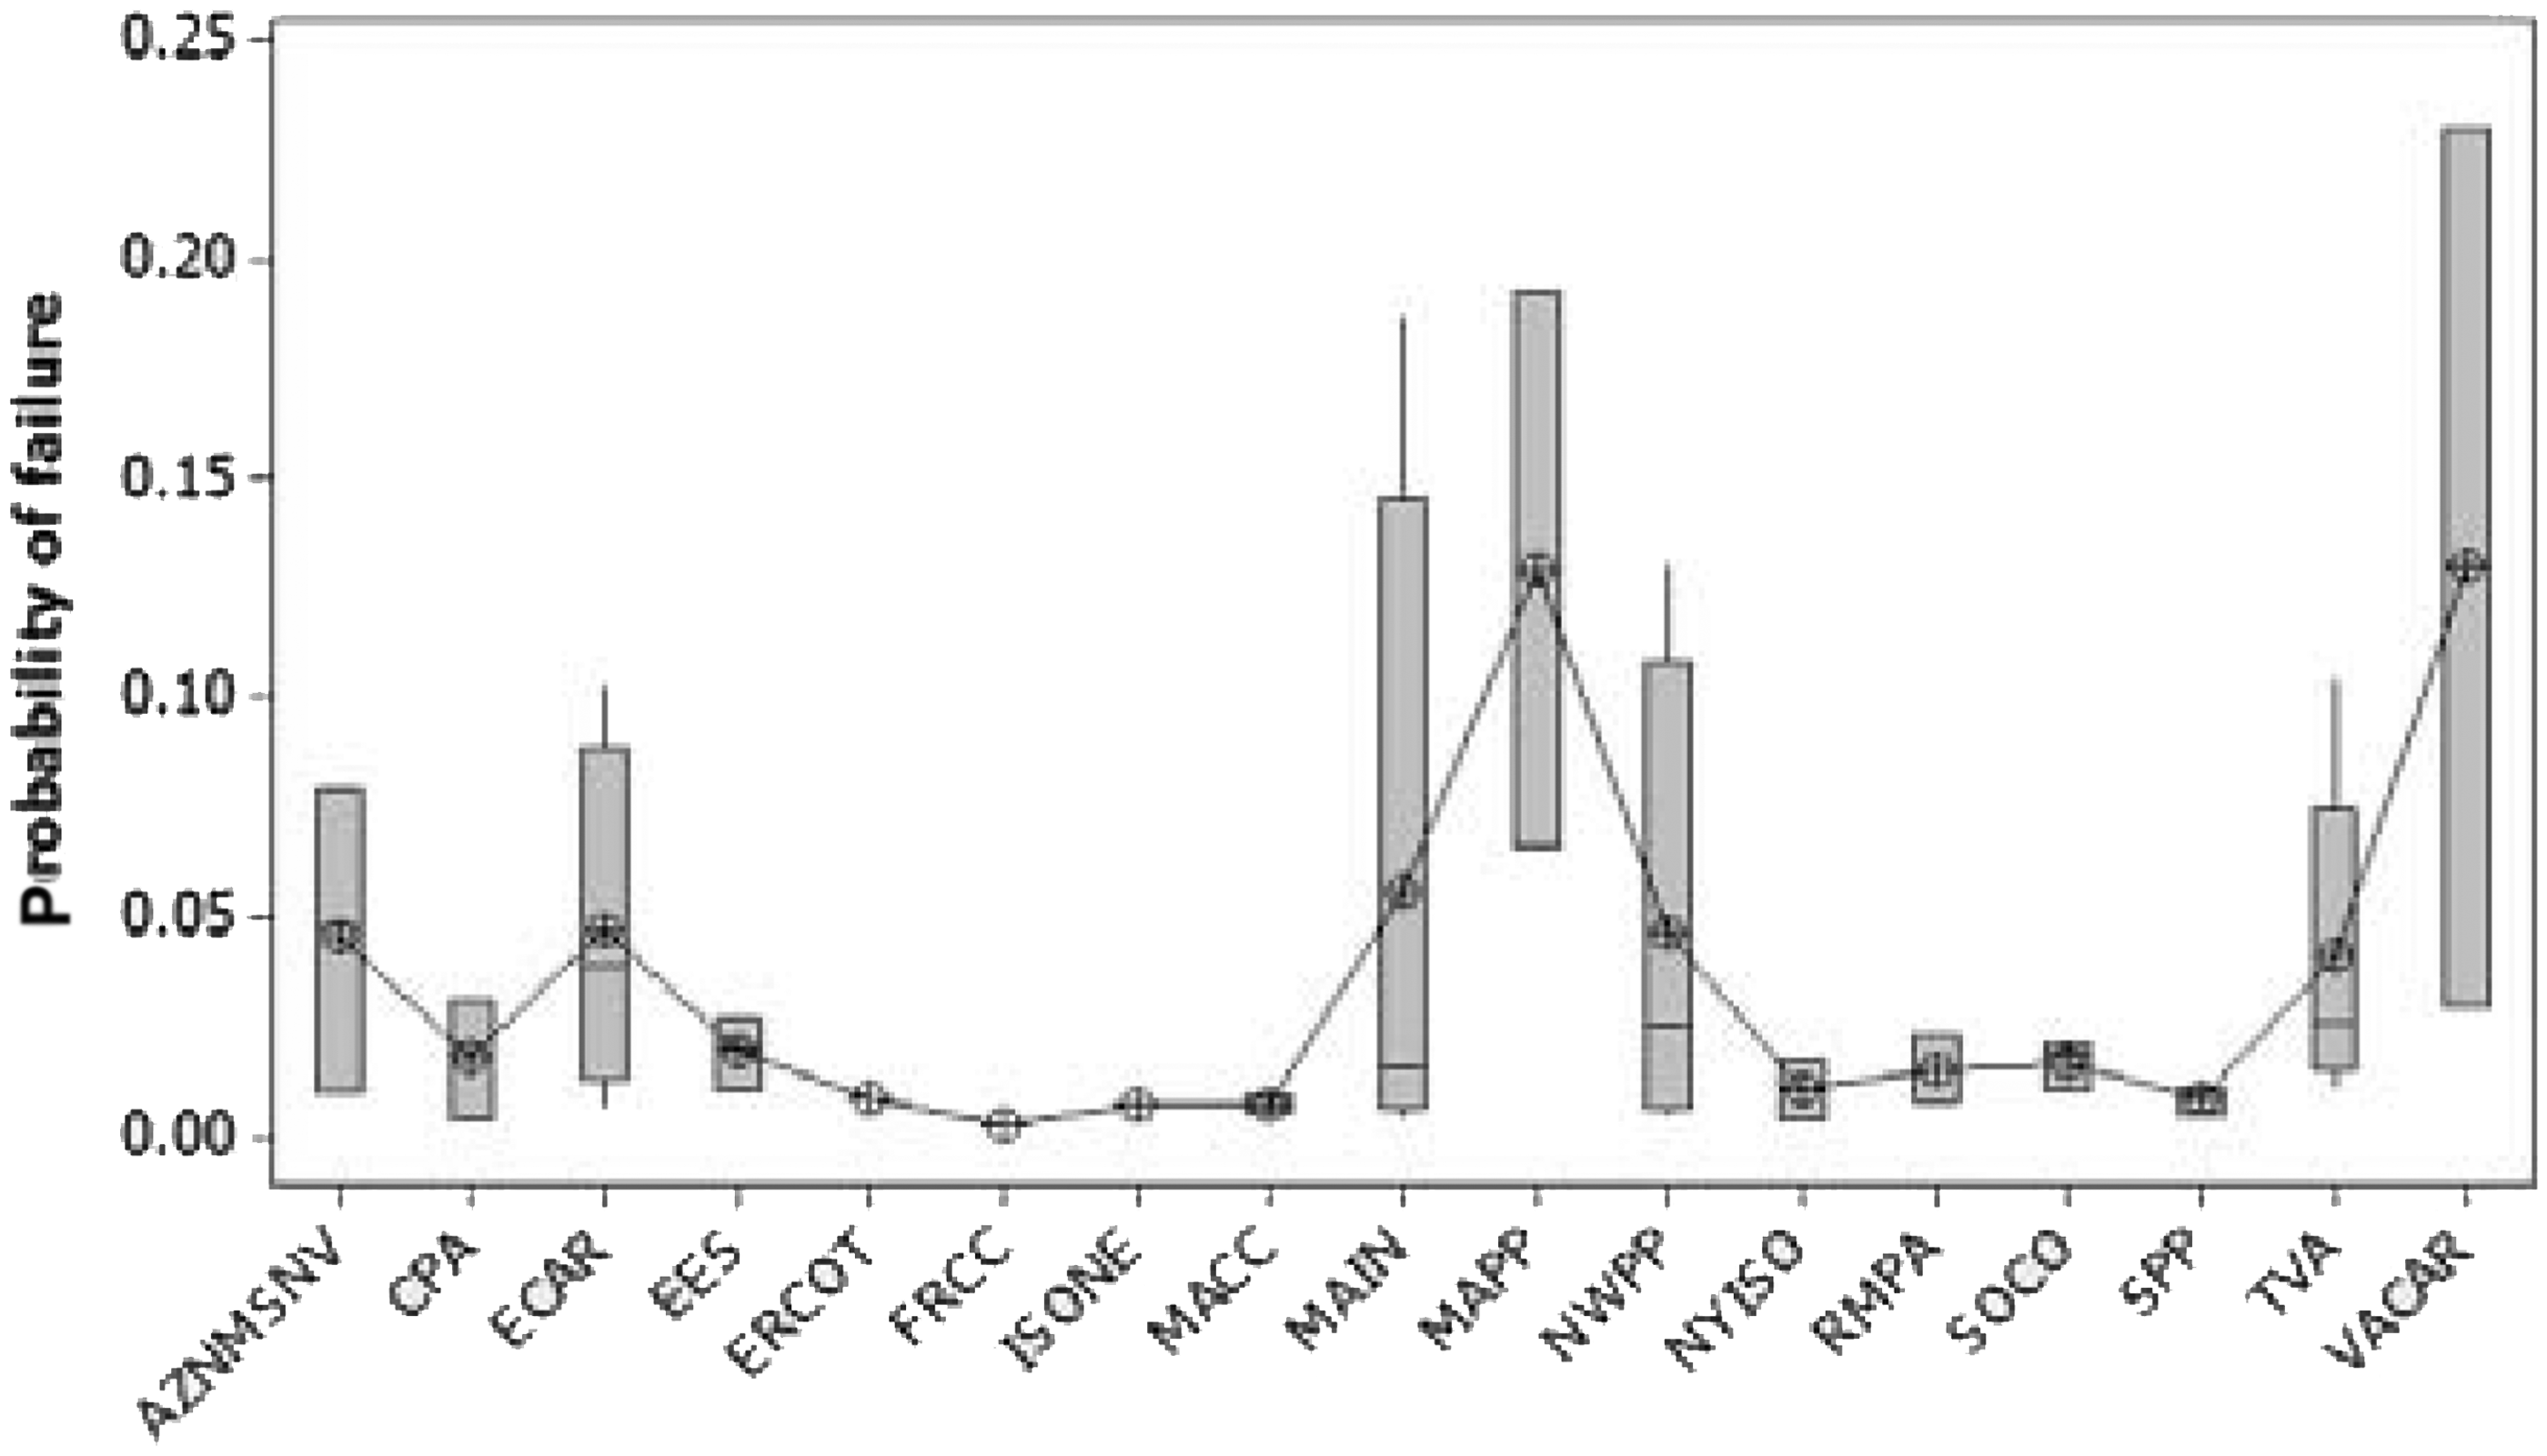
Box plot of probability of failure in gas transmission region.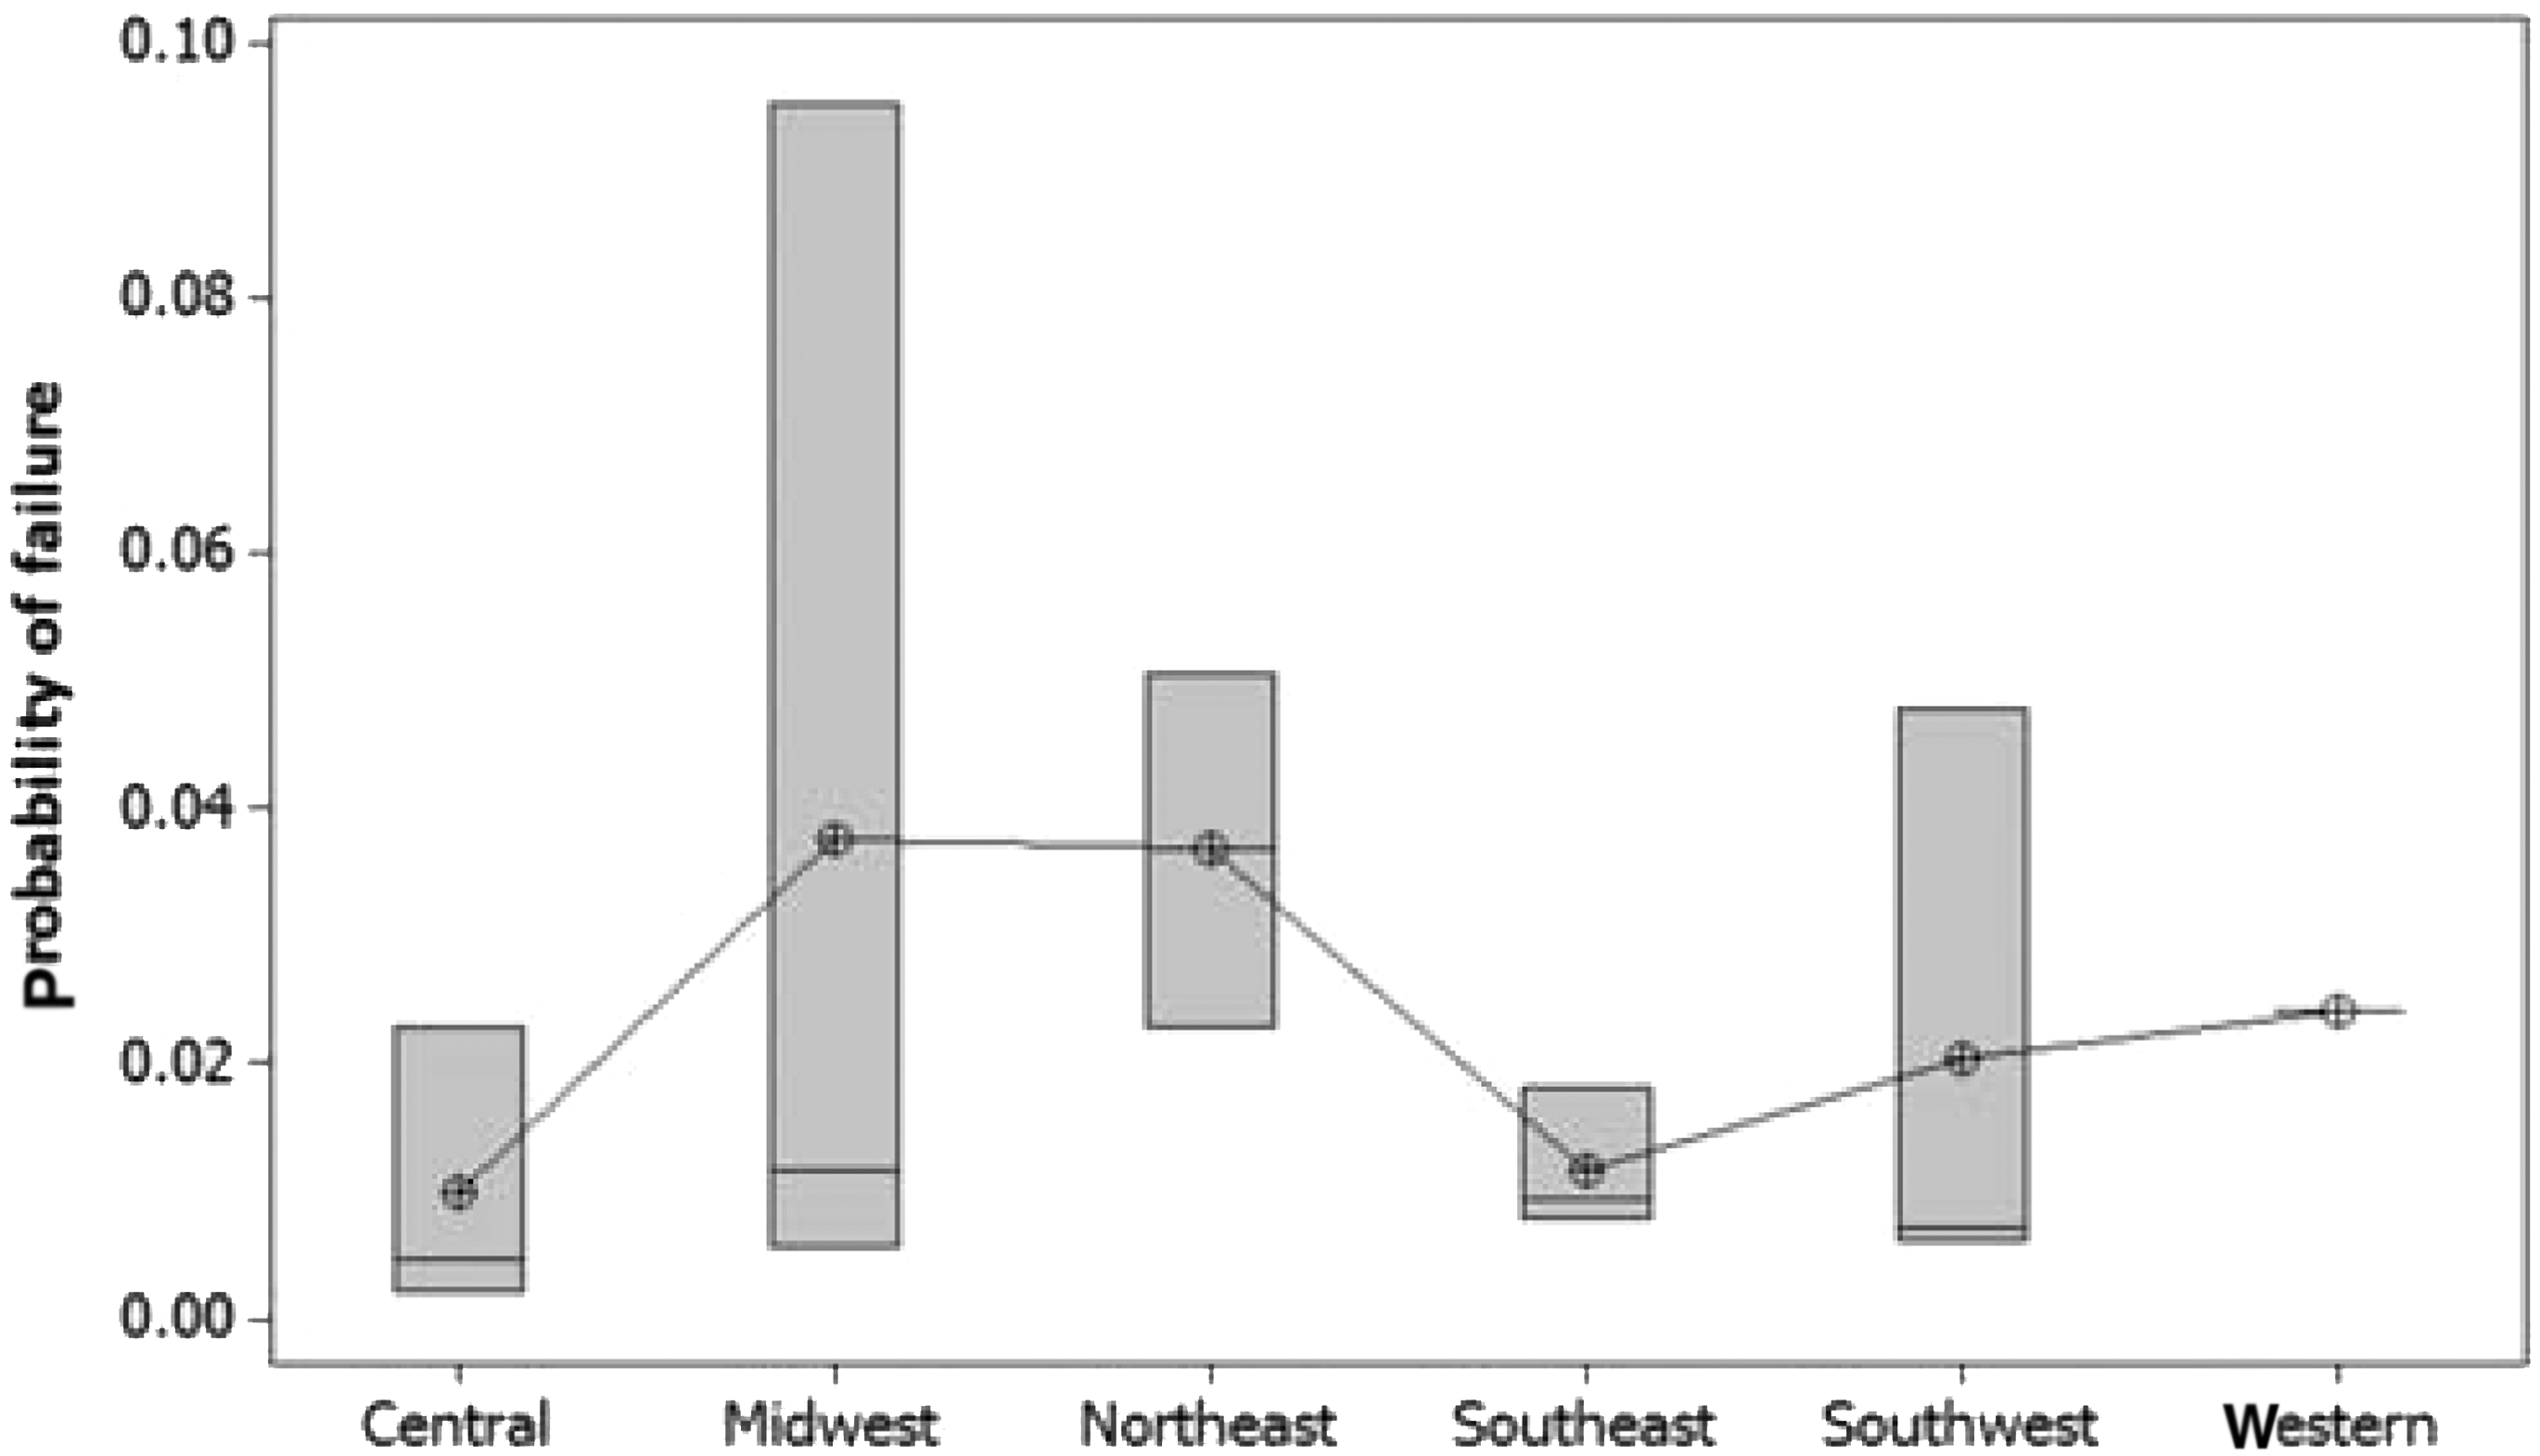


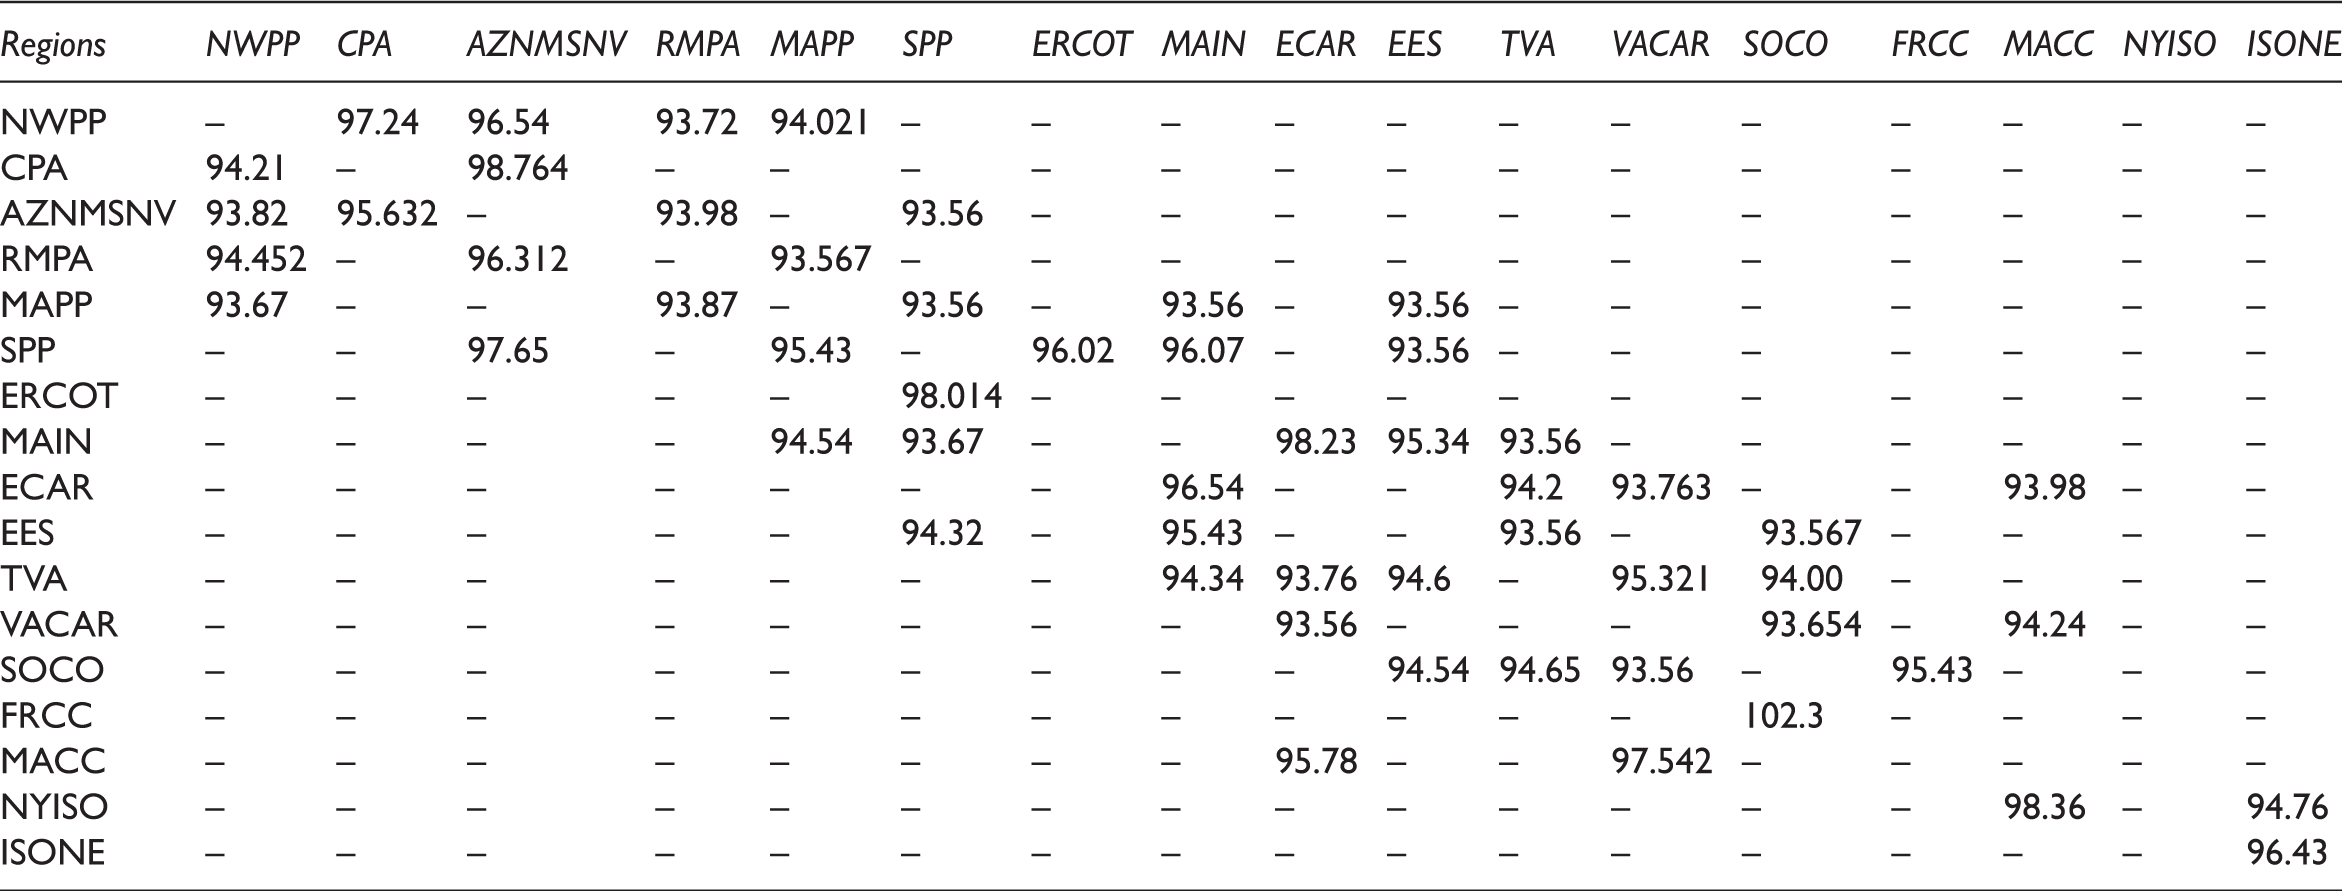
Total cost when a failure occurs in one gas transmission region (billion $).
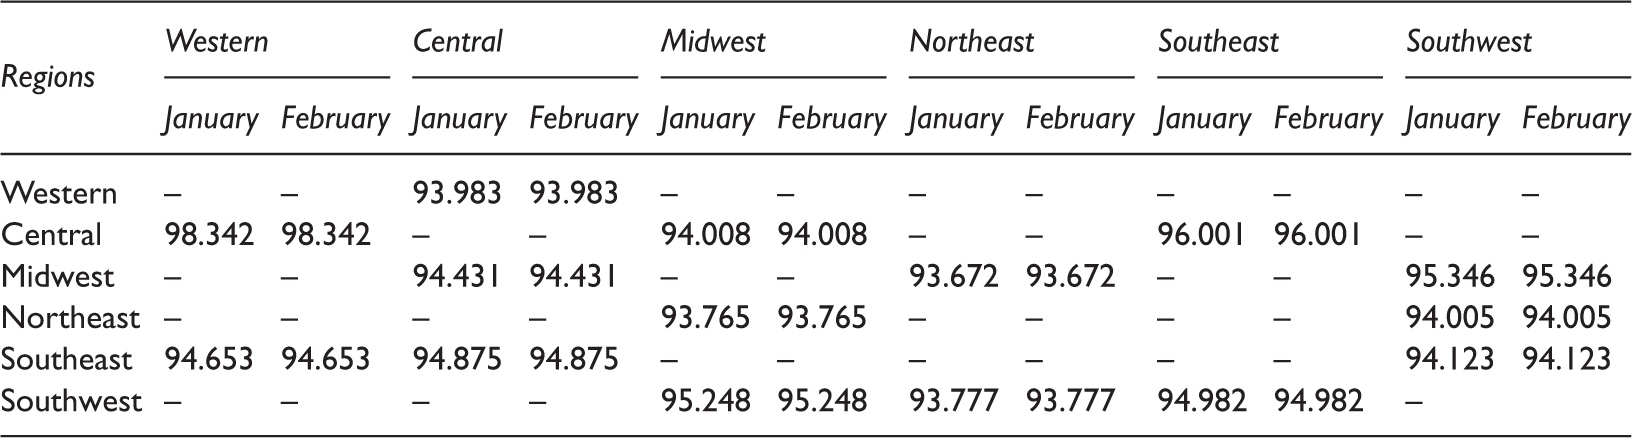
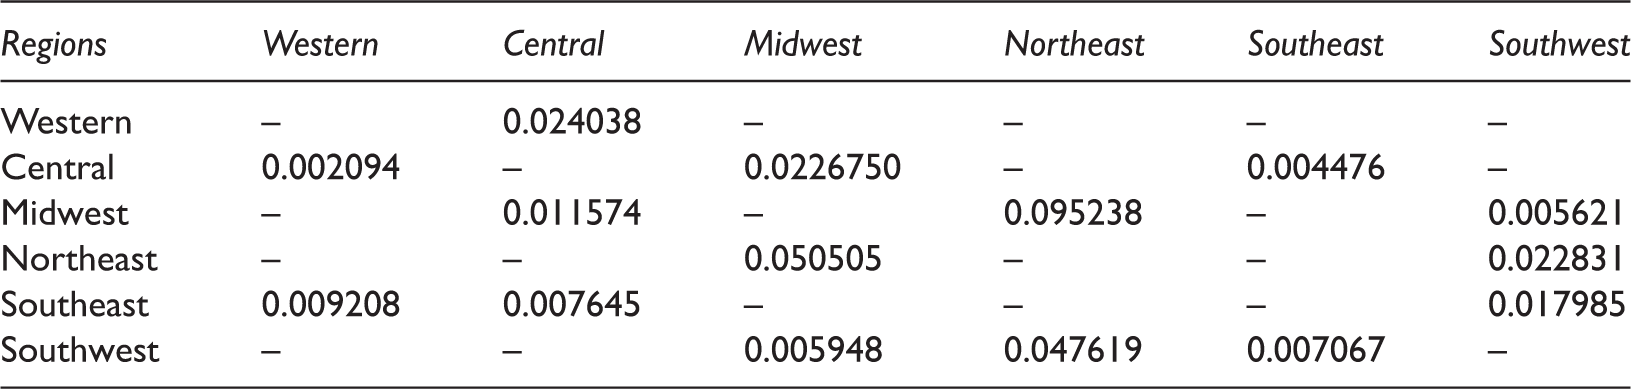
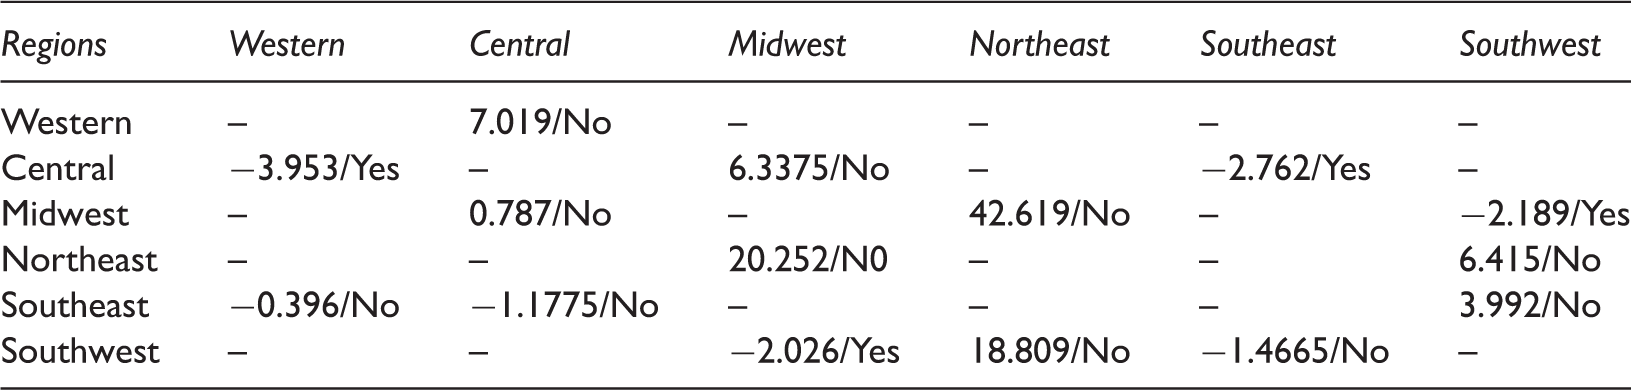
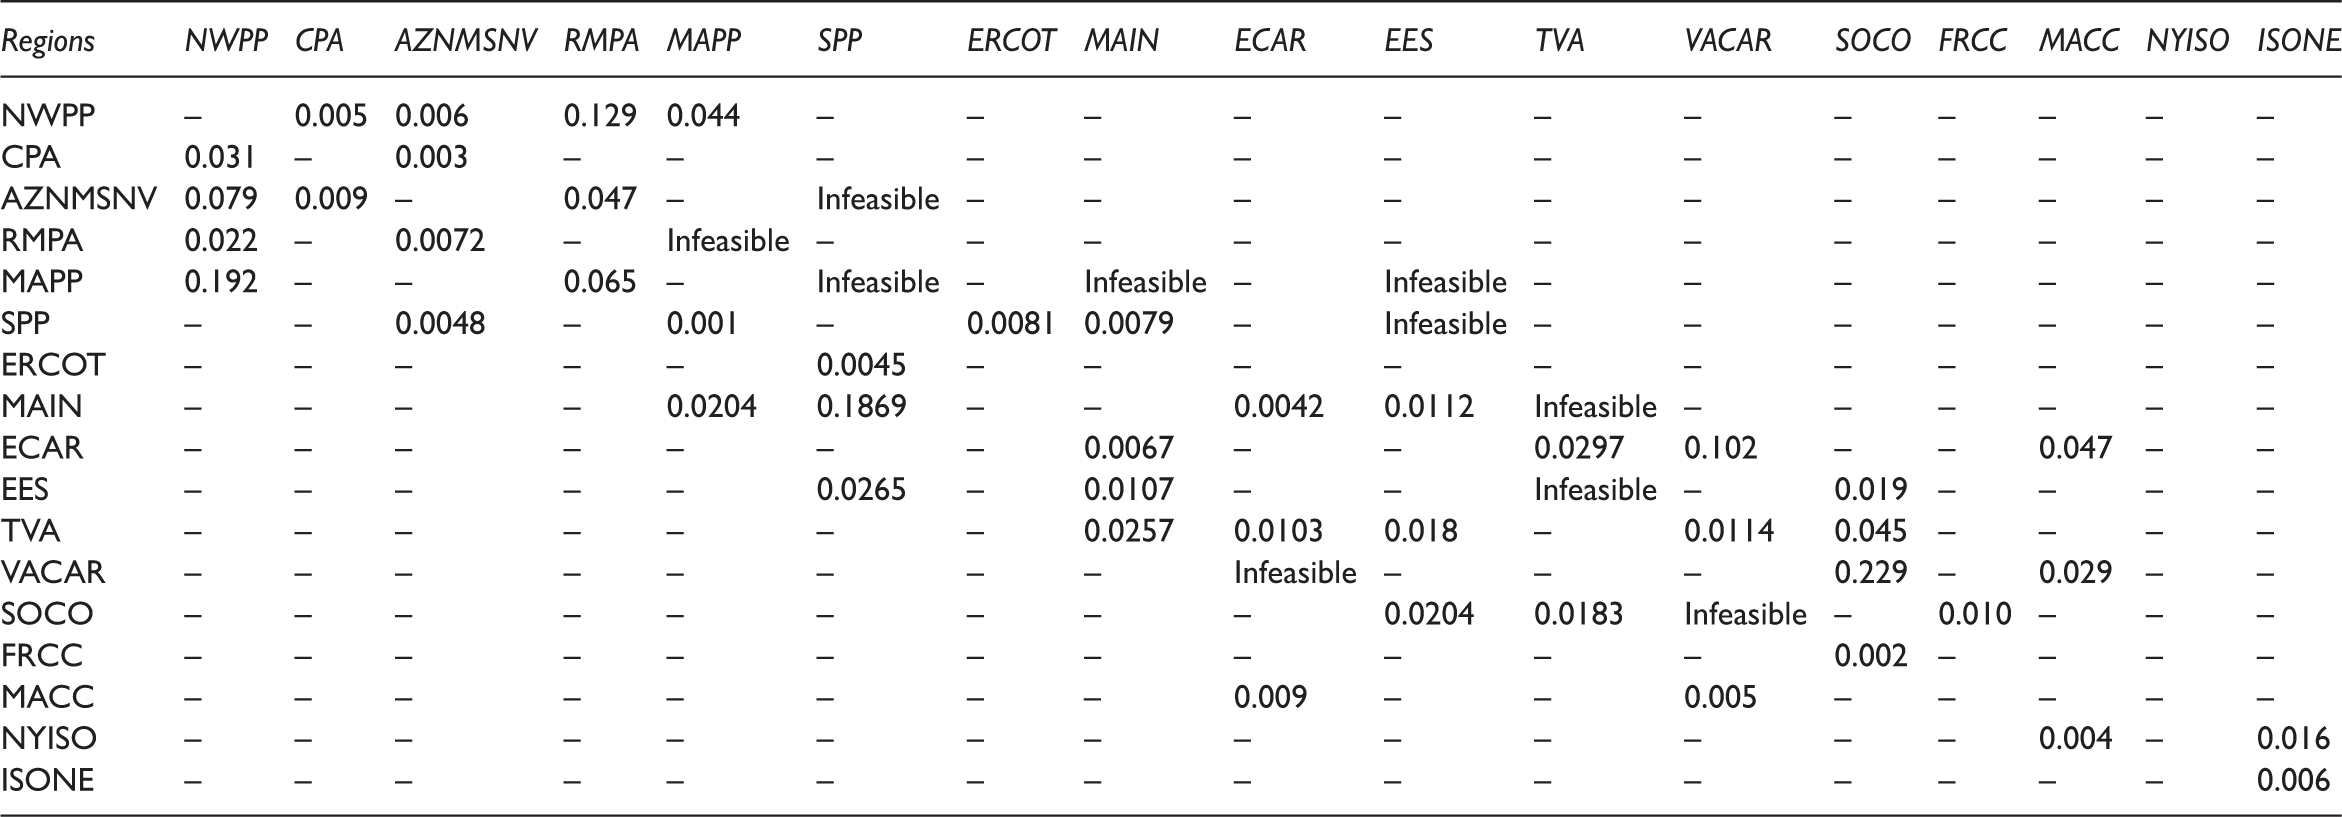
Break-even point of probability of failure between two gas transmission regions a, b (
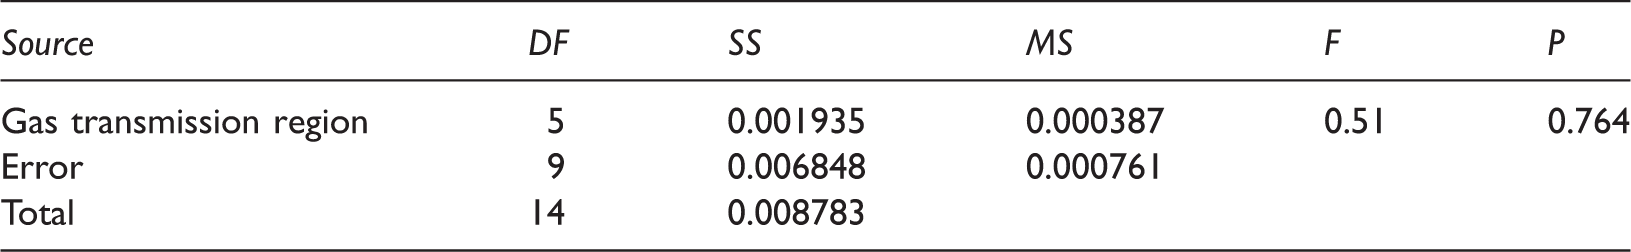
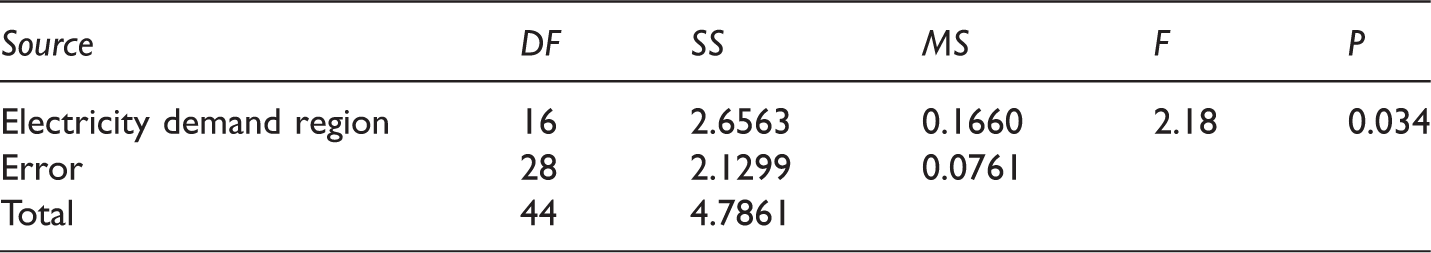
In this section, we will use one-way ANOVA for average probability of failure in order to find out whether these six regions have the same average probability of failure or not. (In February with 95% confidence interval.)
Clearly, with respect to F ≤ P, the zero assumption (equality of average probability in each area) will be accepted.
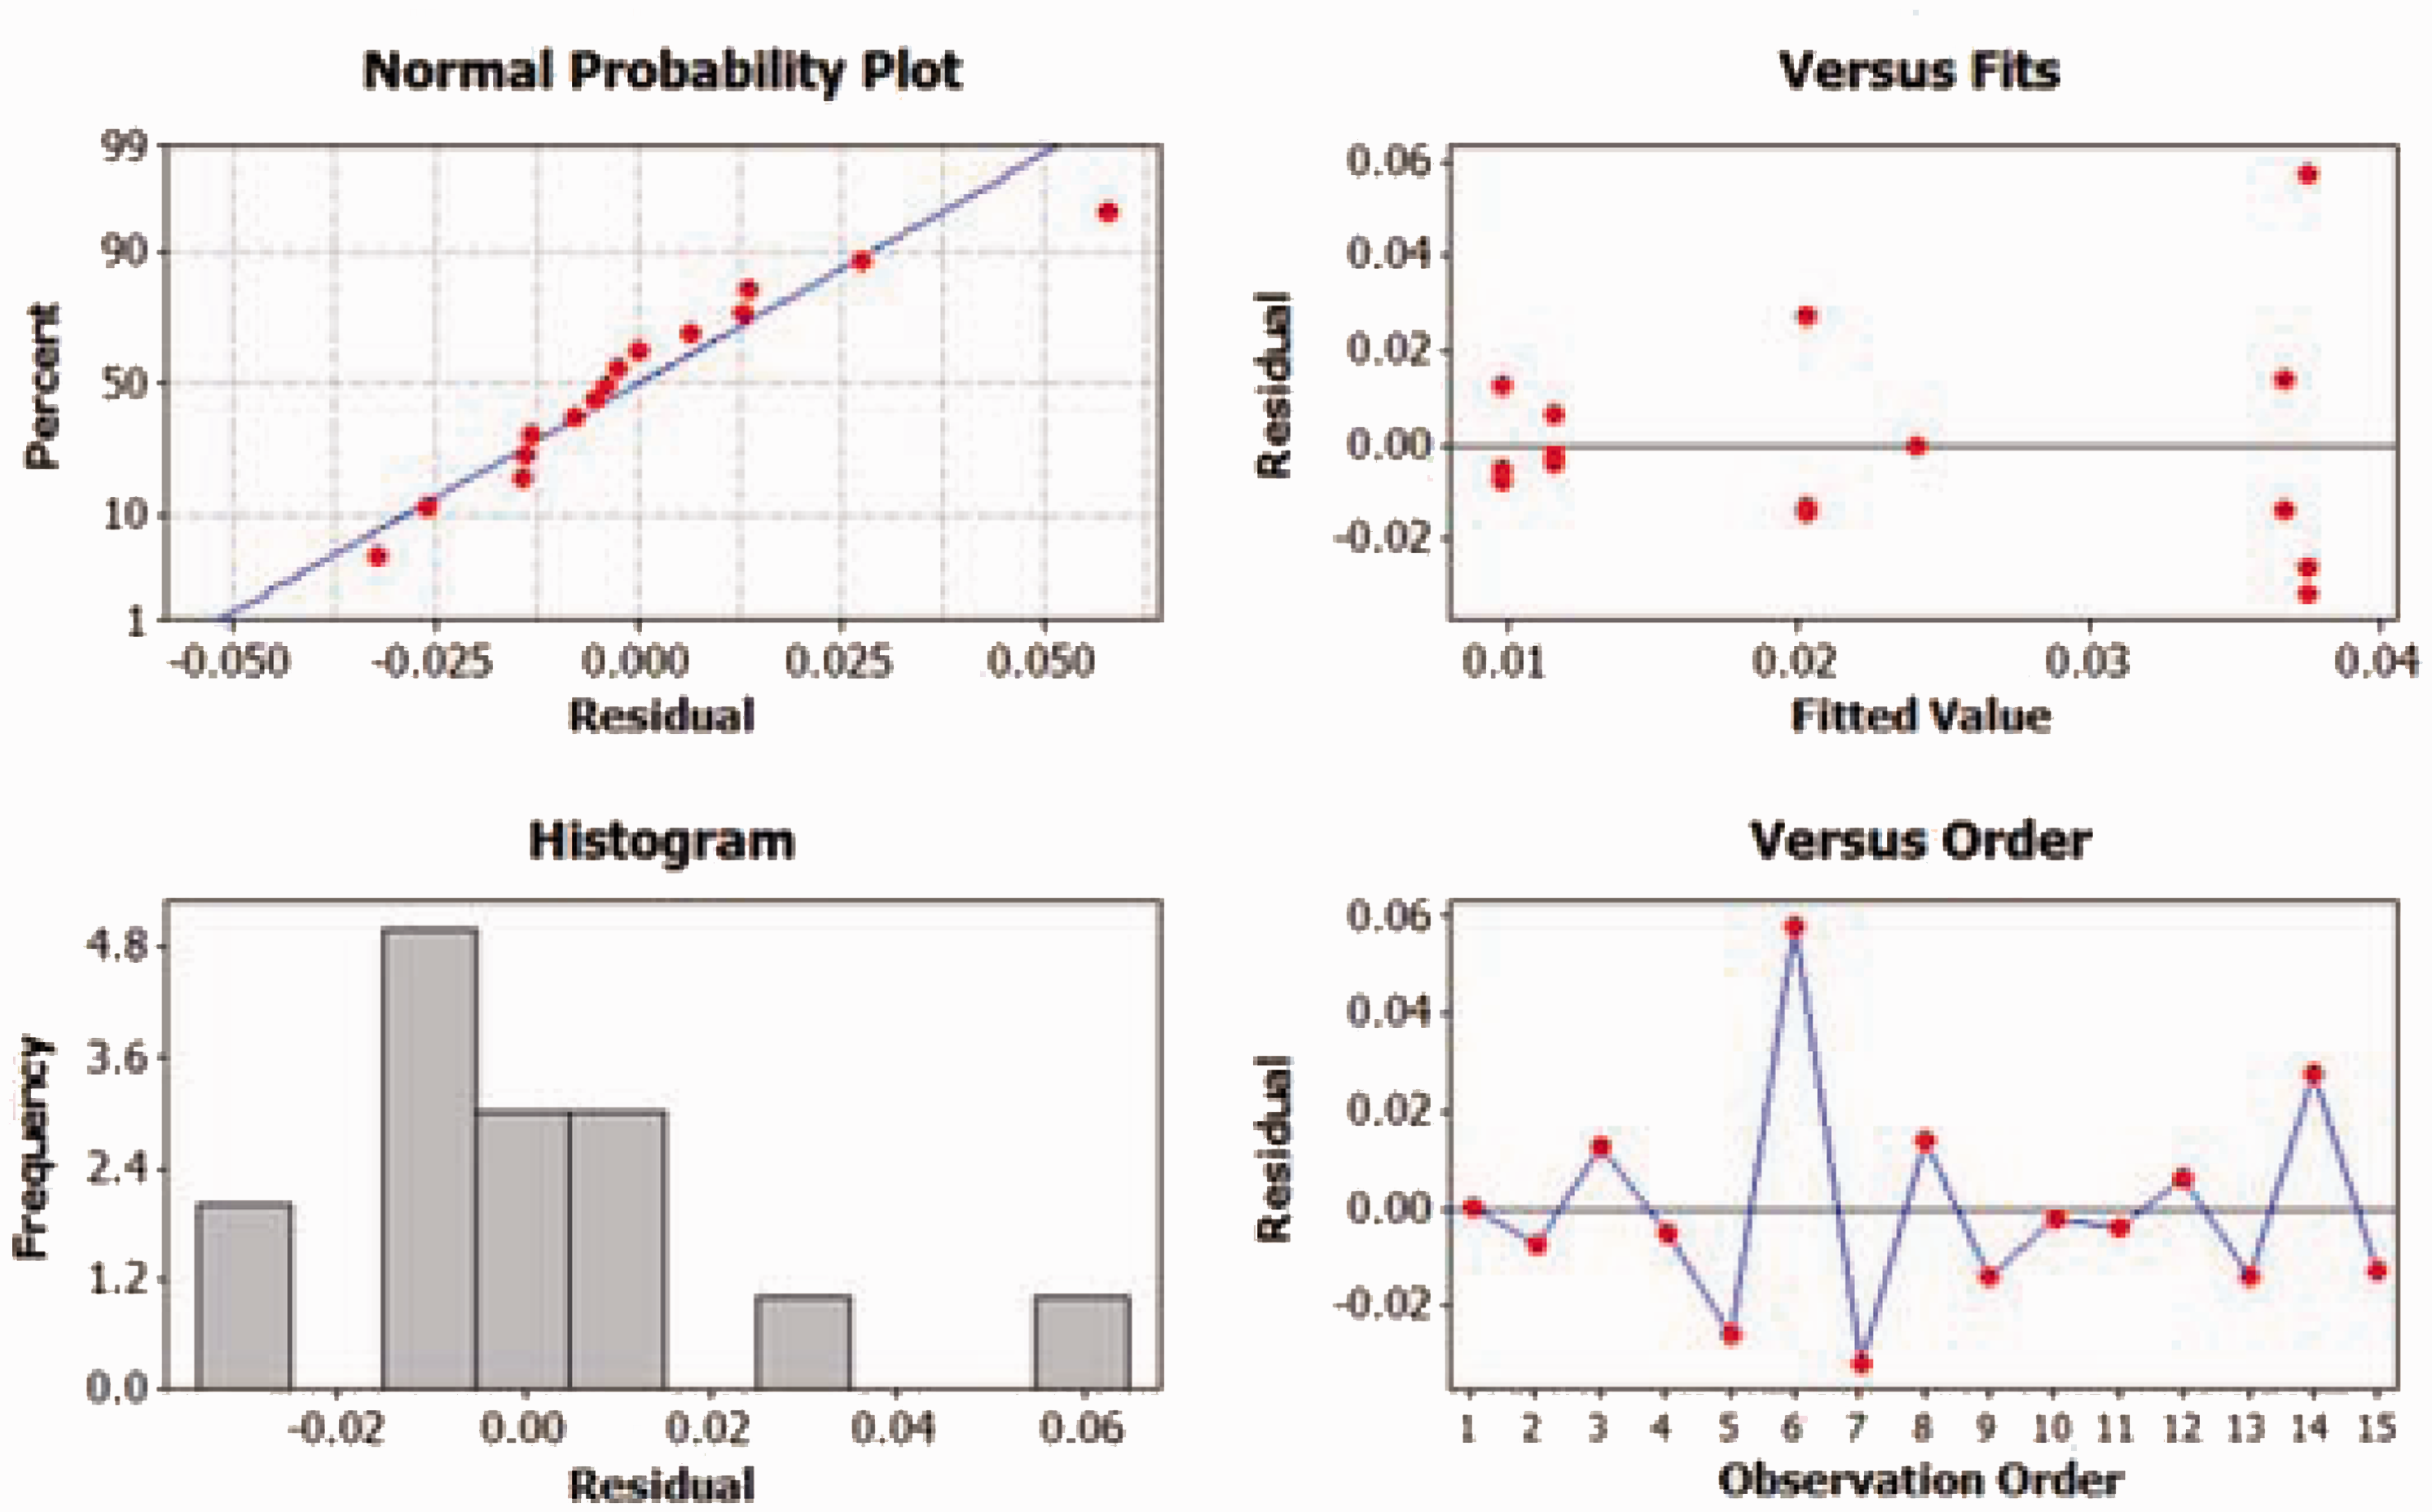
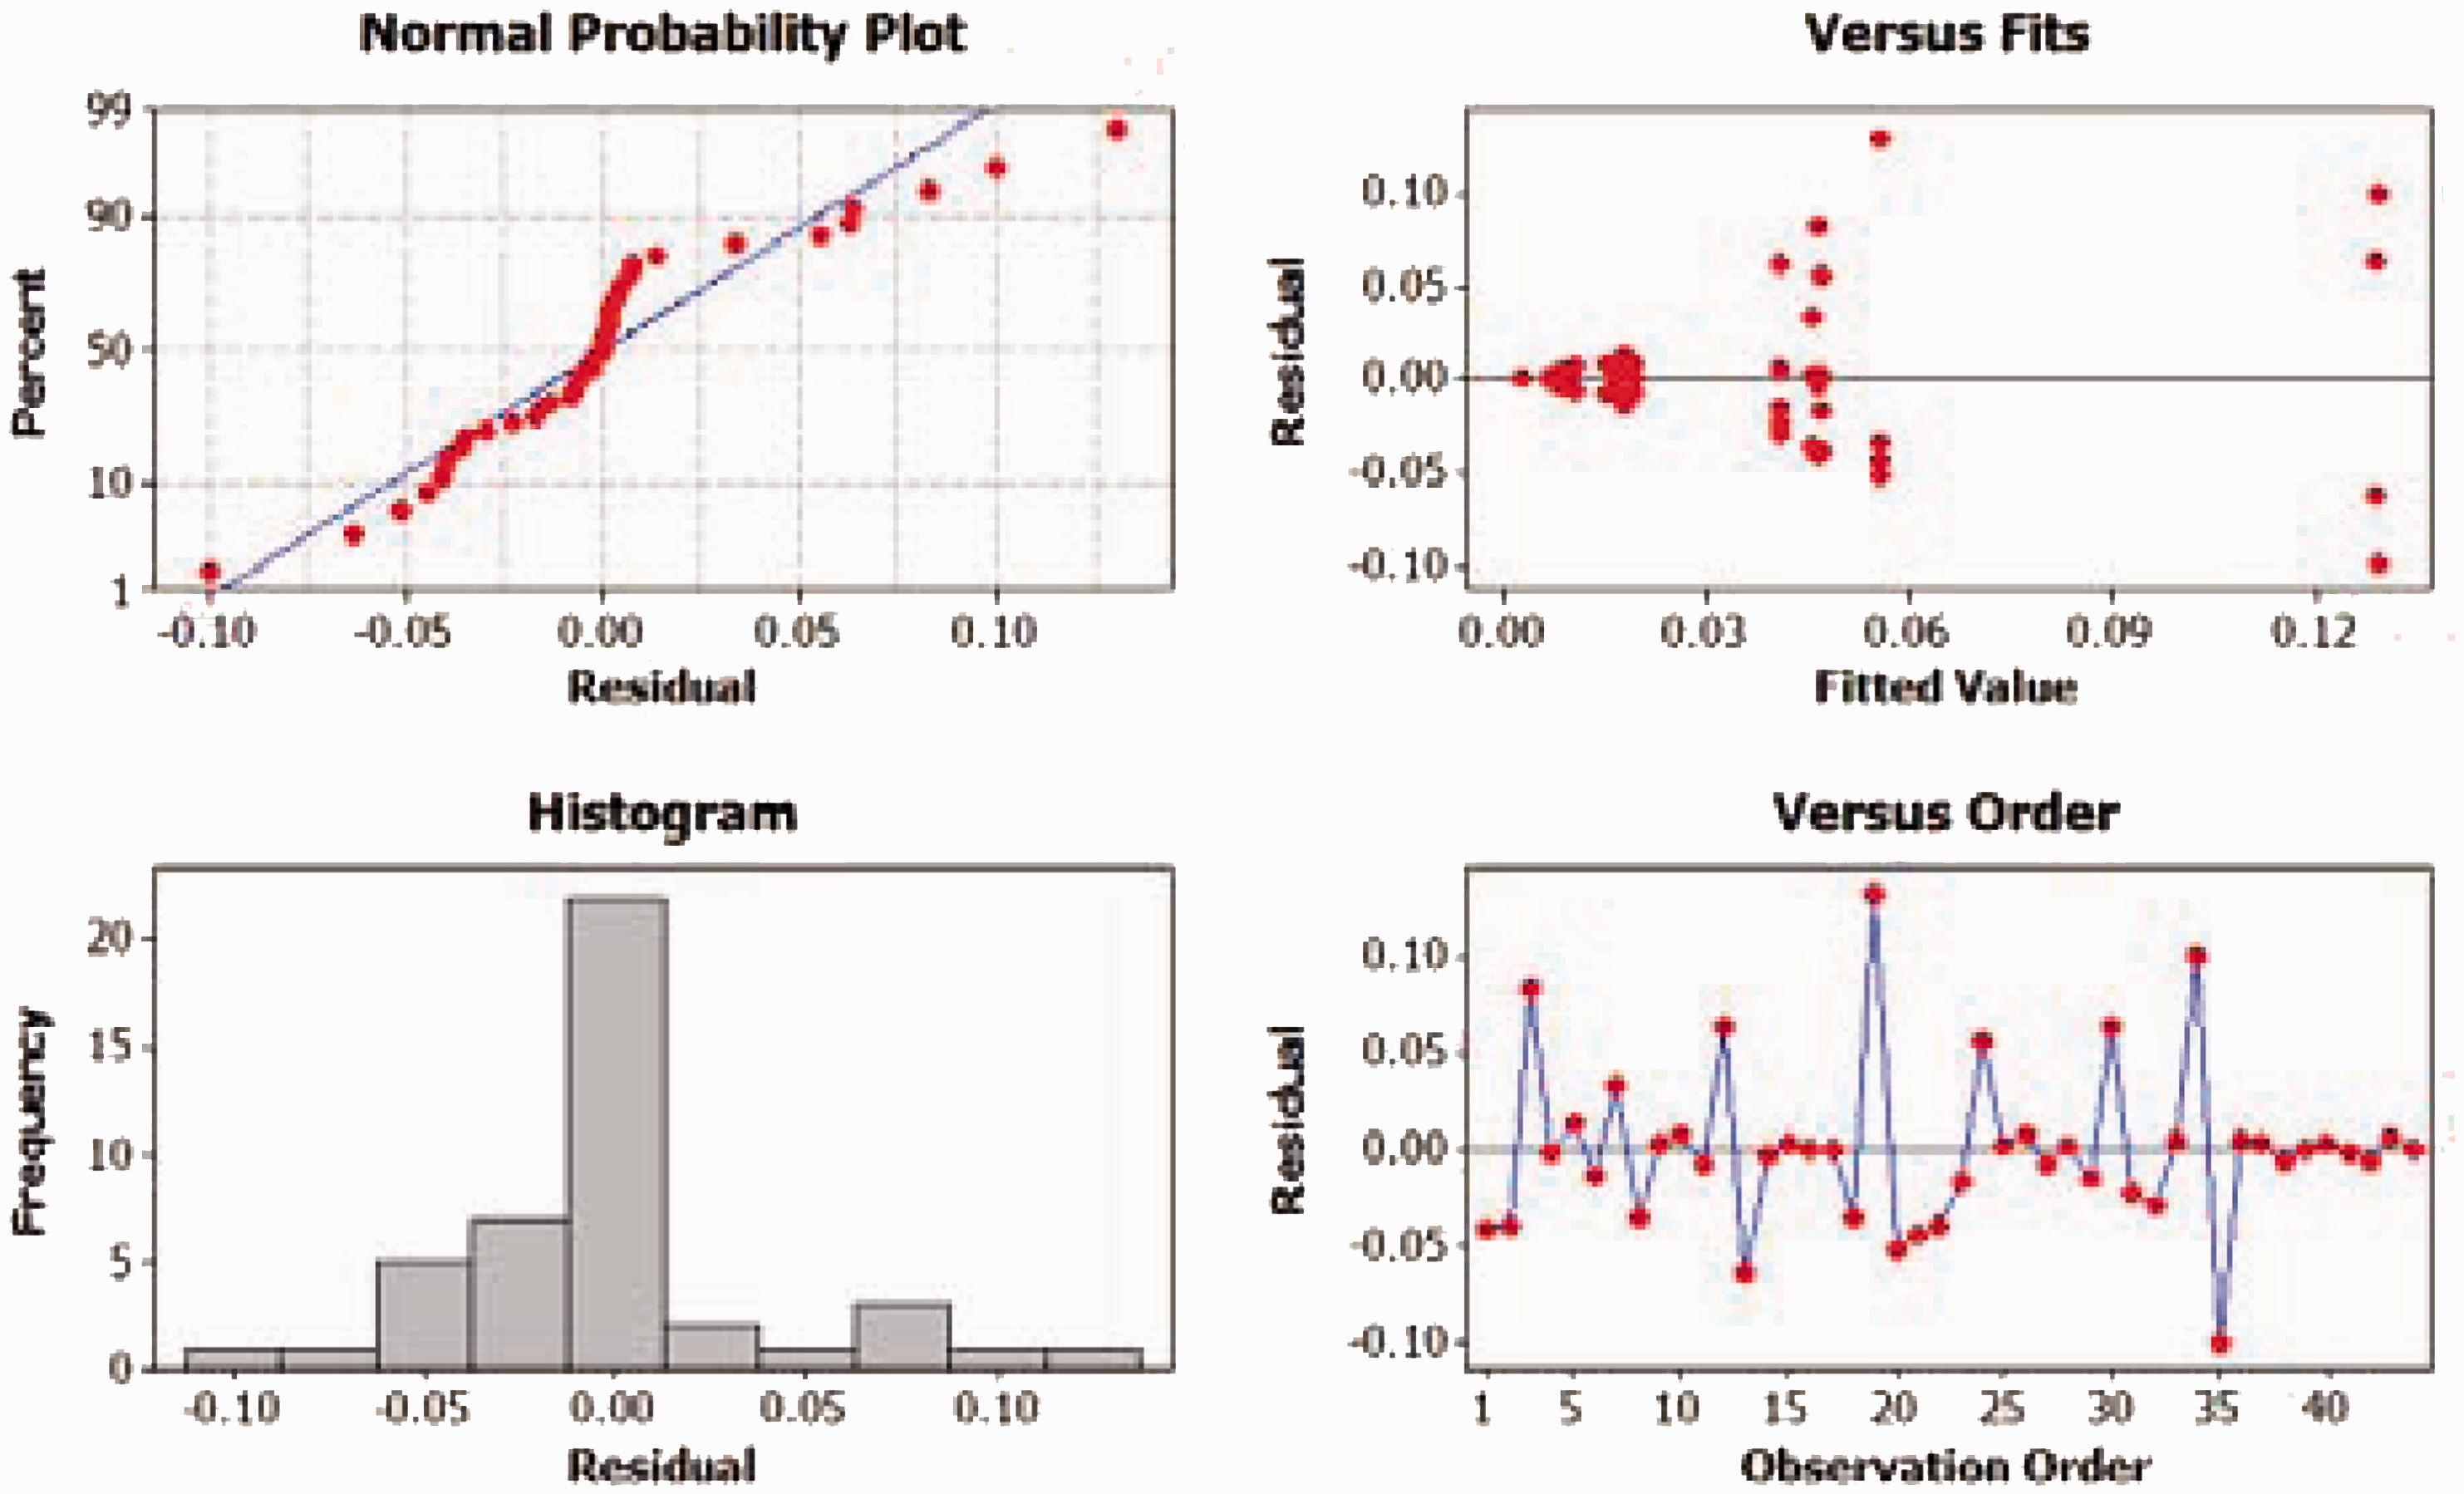
Figures 1–3, respectively, show the box plot for probability of failure versus gas transmission region, individual value plot for probability of failure versus gas transmission region and residual plot of failure. Table 3 presents analysis of variance (ANOVA) for gas transmission region under weather's condition.
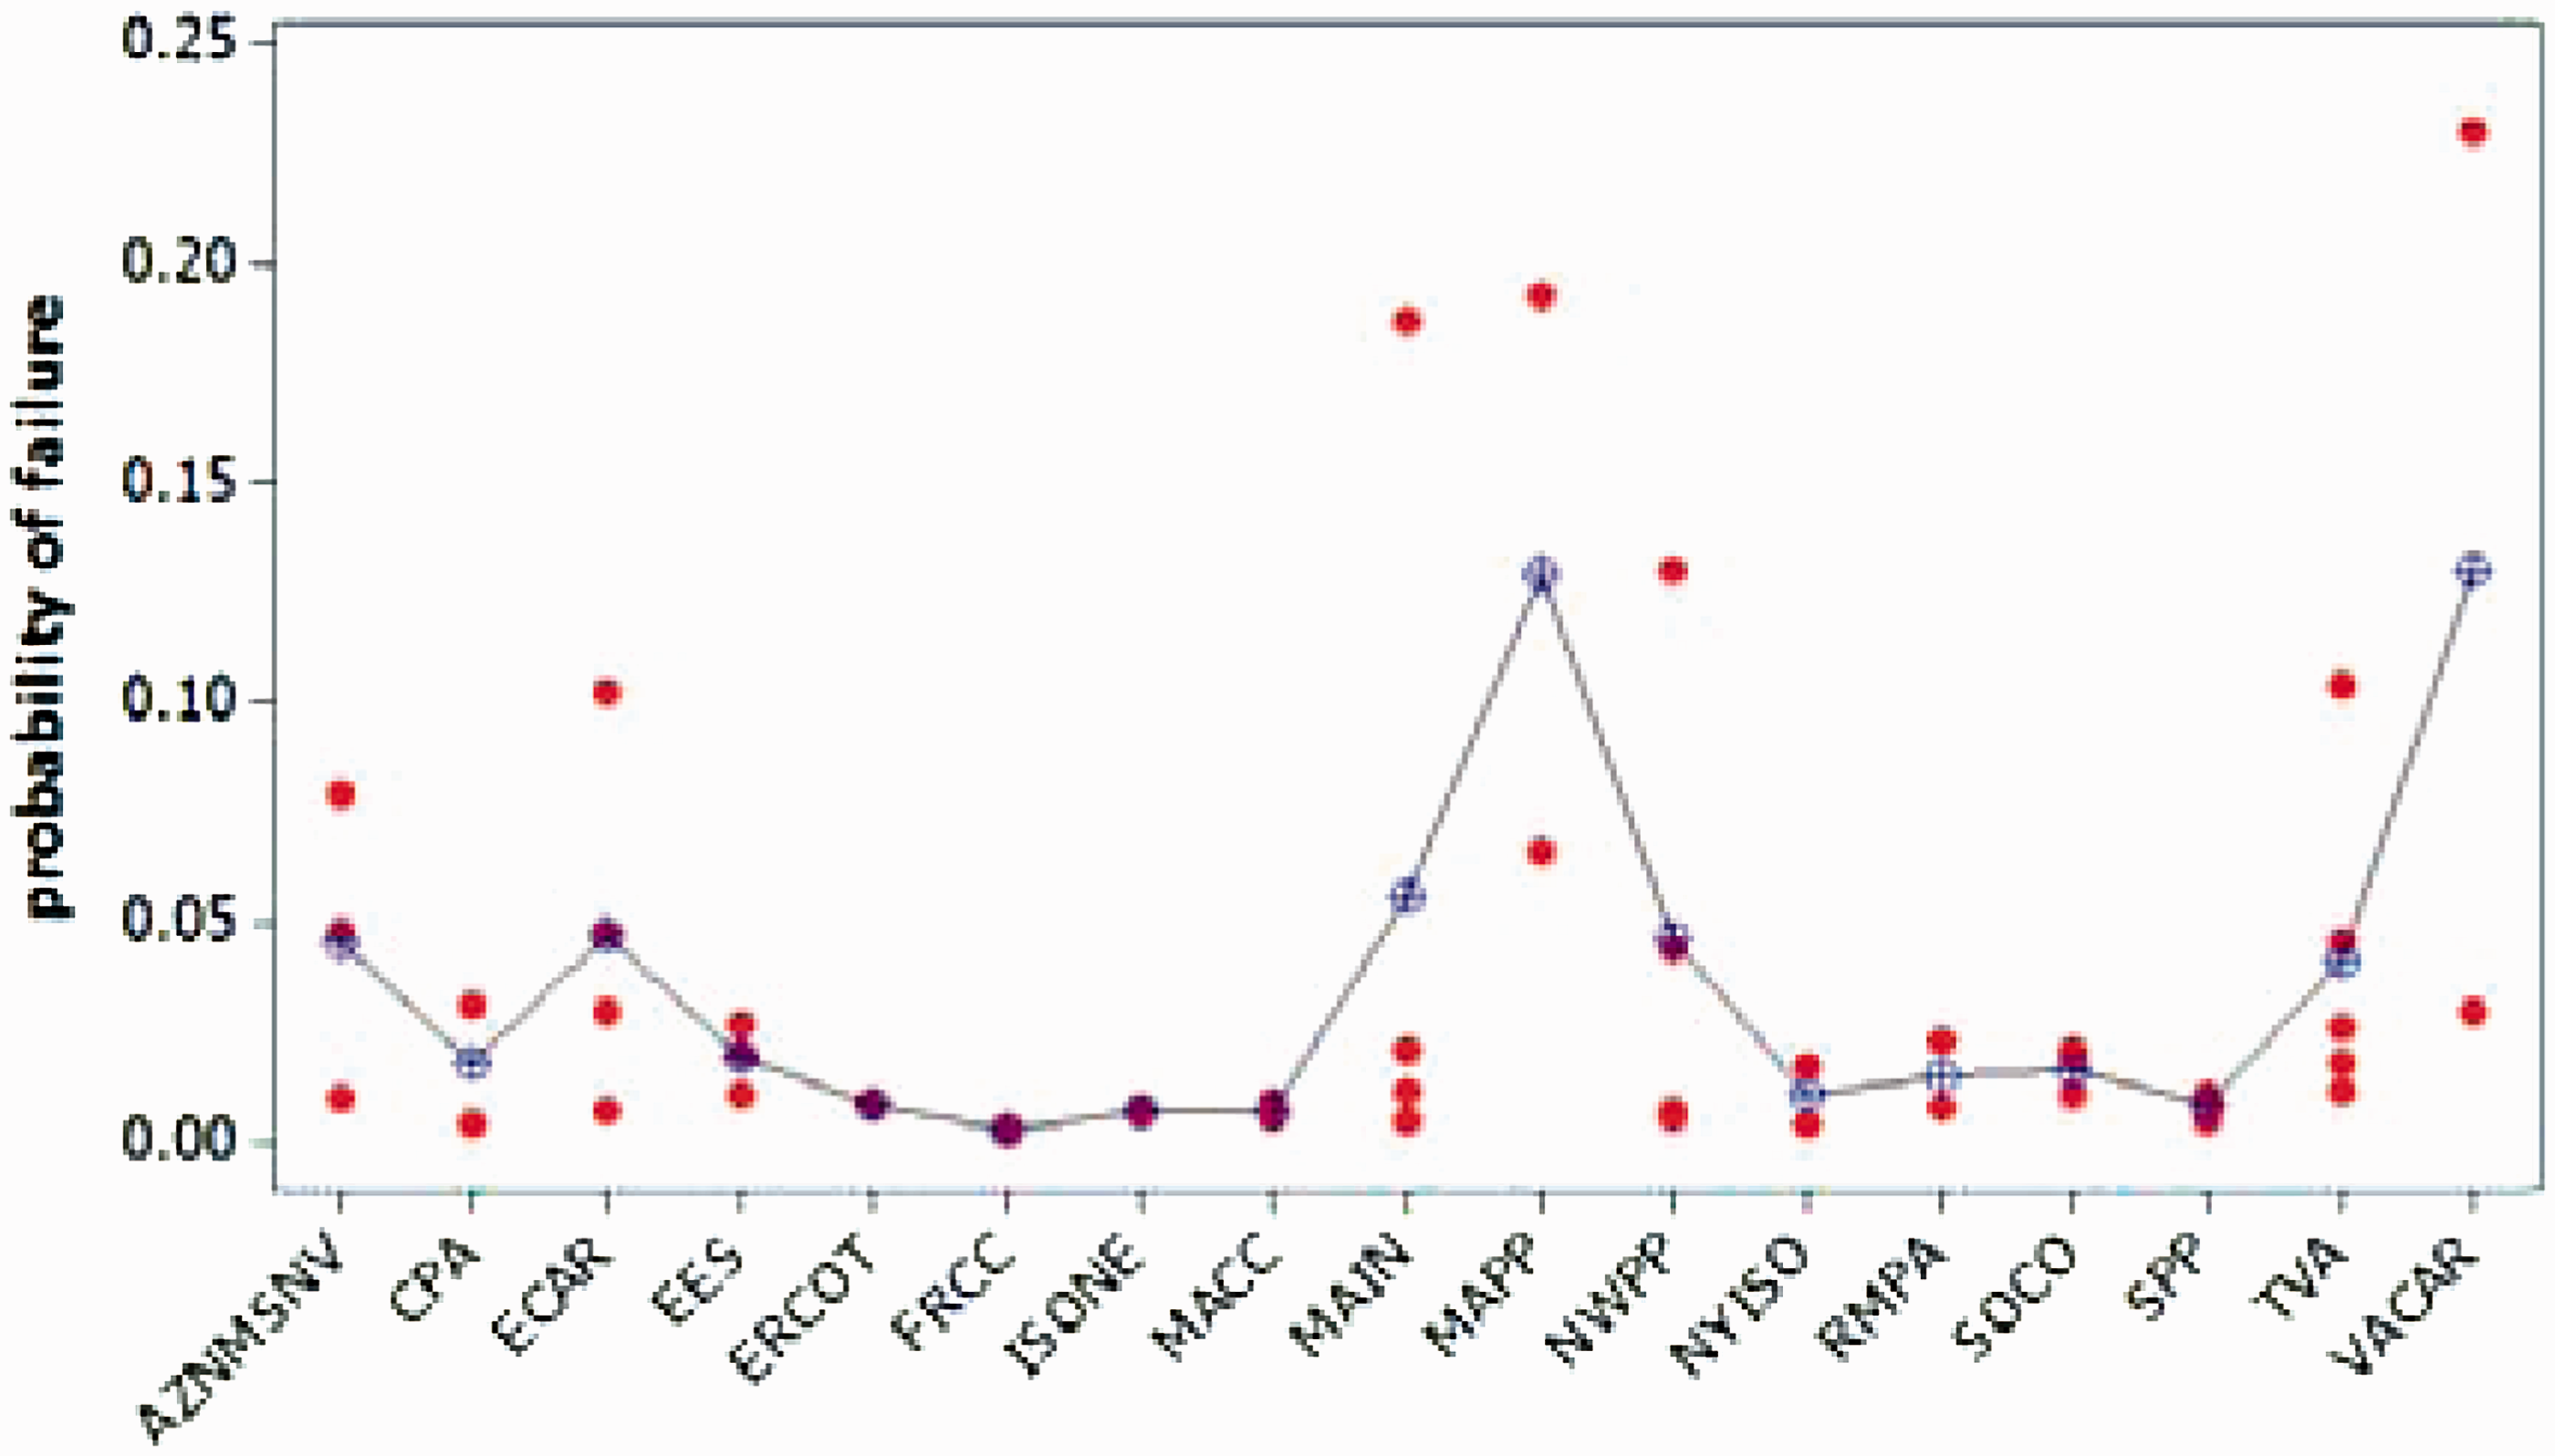
Individual value plot of probability of failure in gas transmission region. Residuals plot of probability of failure in gas transmission region.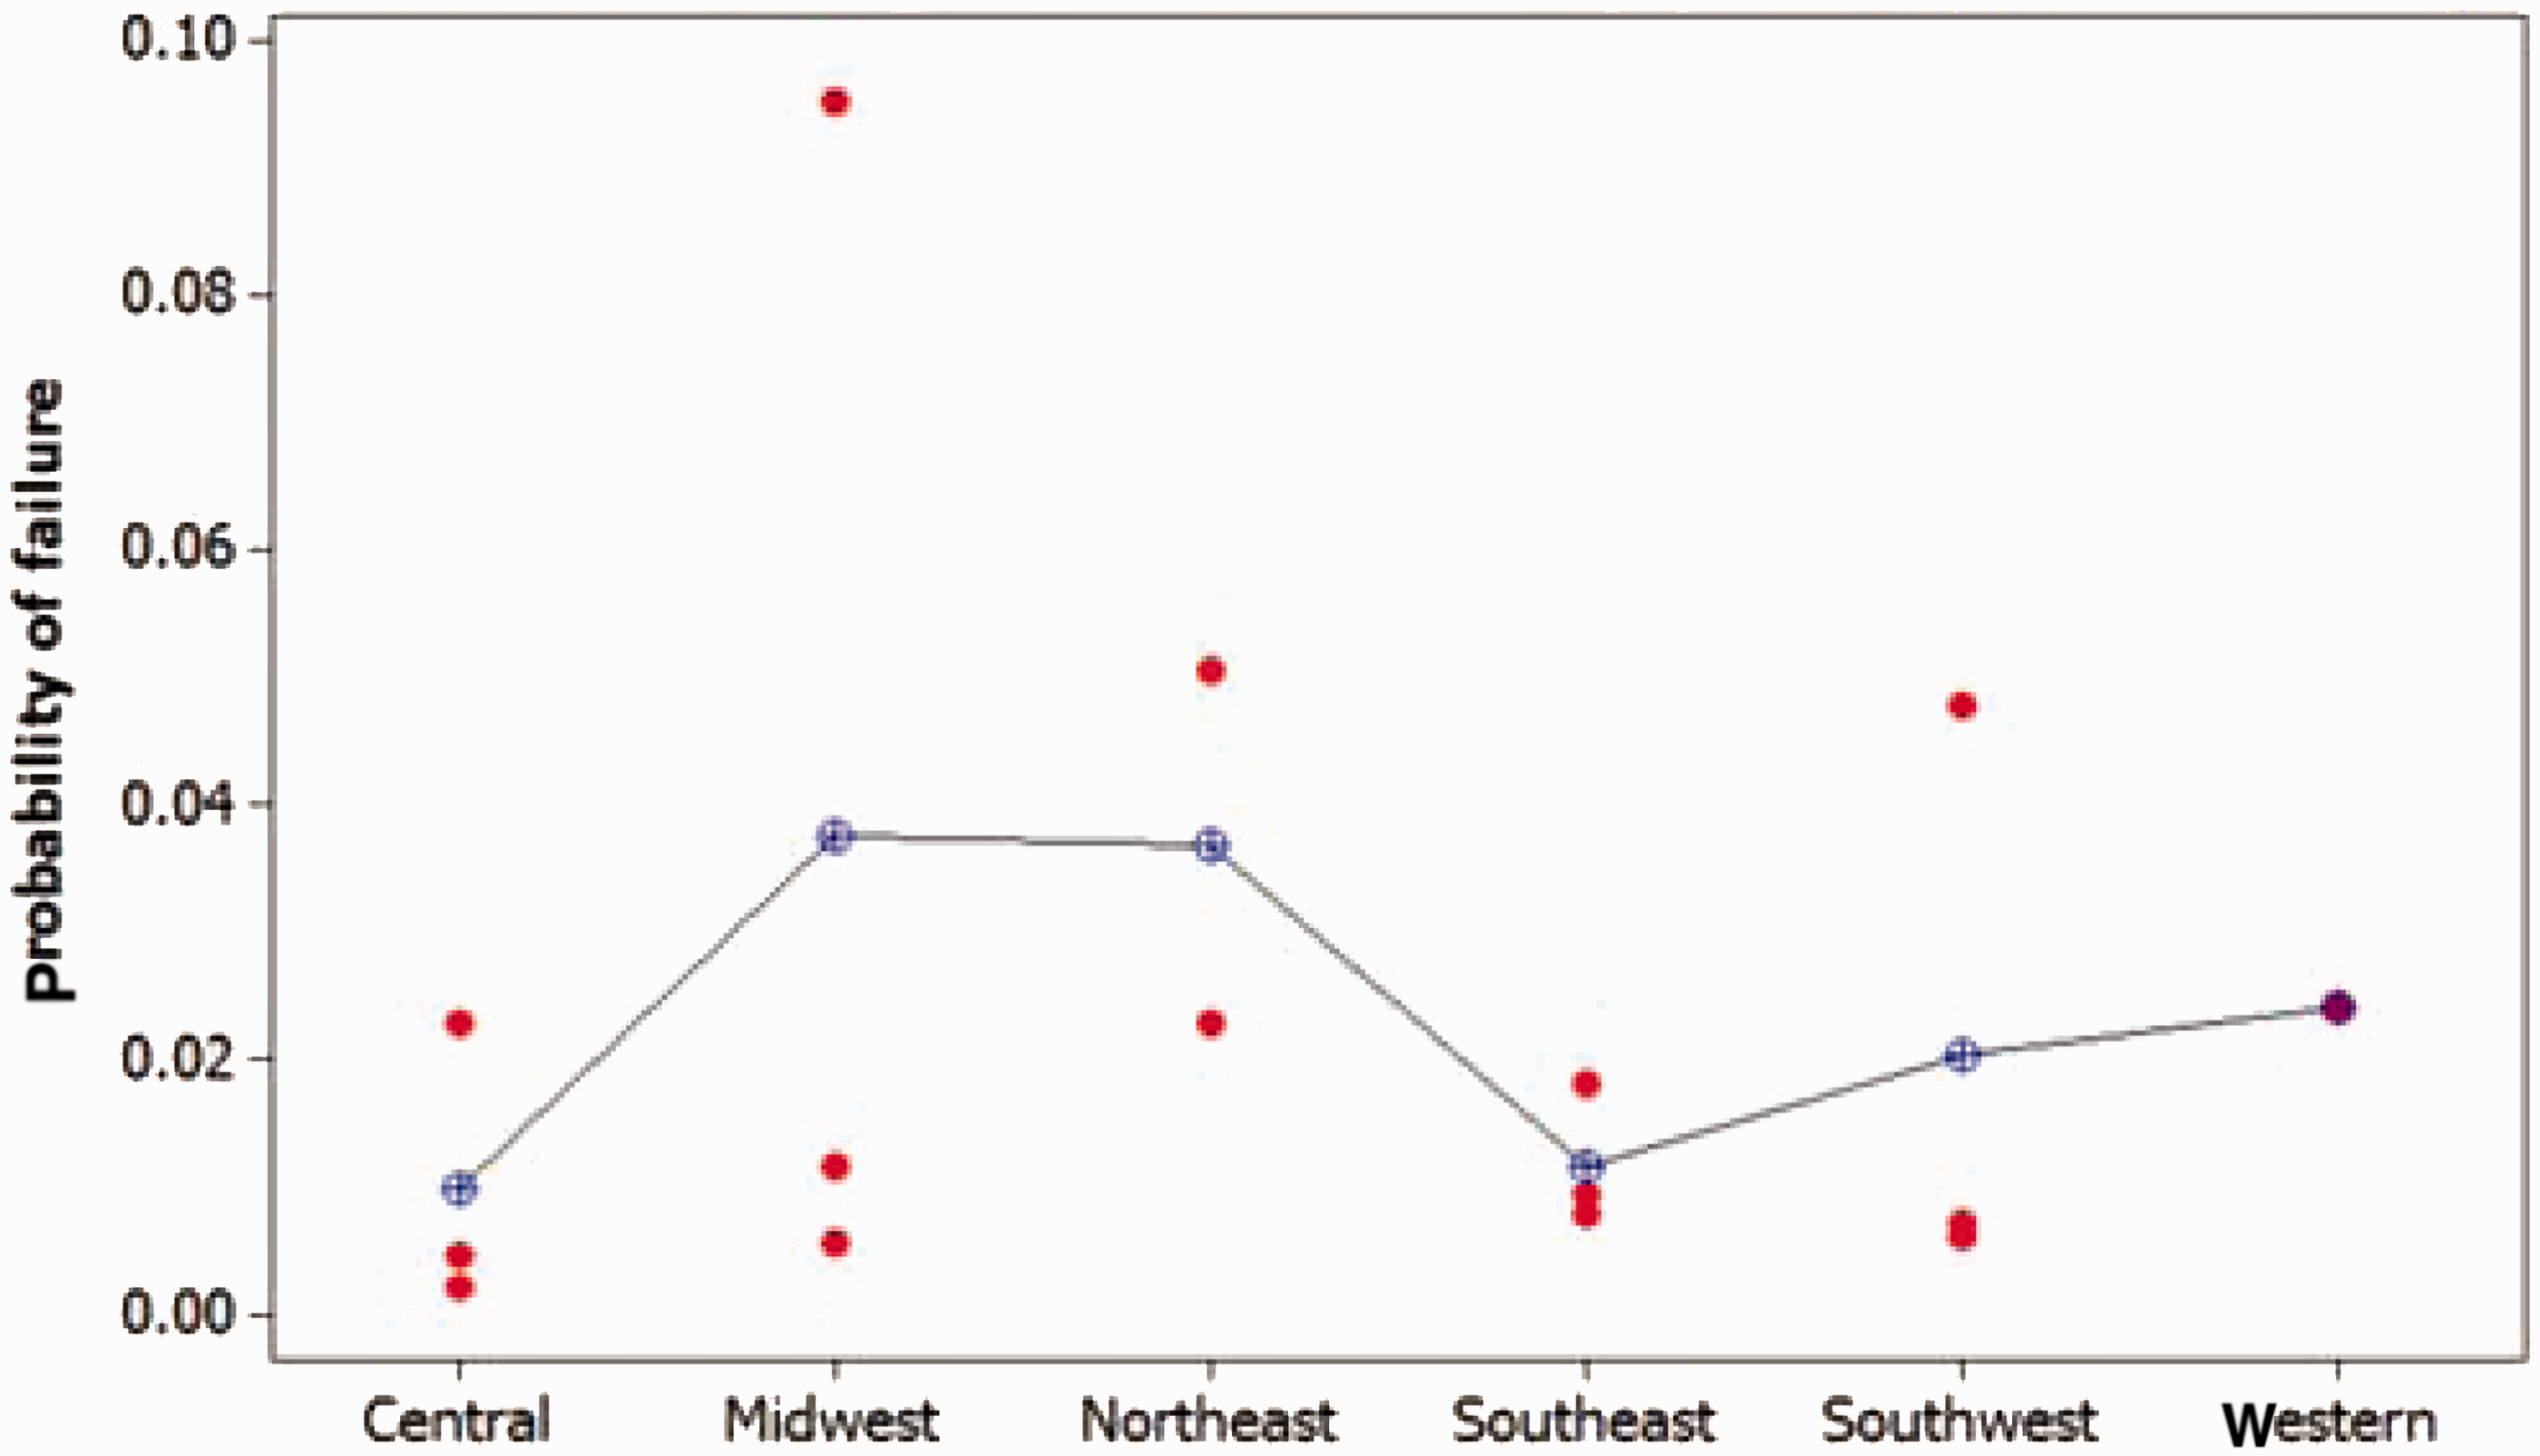
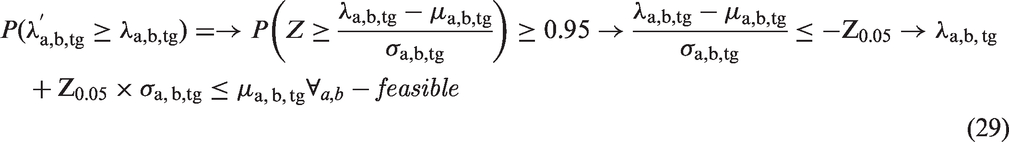
Since failure probability function for the gas subsystem is considered to have normal distributed with 95% confidence interval, if the failure in two regions is more likely than the break-even point (means failure in two regions is equal or greater than 95%) maintenance should be considered.
Because of that, the failure probability function for the subsystem is normally distributed with 95% confidence level; thus, if the failure in two regions is more likely than the break-even point with the probability more than 95%, maintenance should be considered (equation (29))
Obtaining average and variance of probability of failure between two regions is somehow impossible. However, these parameters can be computed approximately for January and February by using the data provided by North American Electric Corporation. Actually, here we take all average and variance of failure probability between any two gas transmission regions to be equal. (Since by one-way ANOVA it was observed that the average probability of failure between different regions can be considered equal.)
According to the ANOVA results, we assume equal average and variance Economic maintenance locations in natural gas transportation model. Box plot of probability of failure in electricity demand region. Individual value plot of probability of failure in g electricity demand region. Residuals plot of probability of failure in electricity demand region. Economic maintenance in electric power transmission model. ANOVA for gas transmission region (weather’s condition). Economic maintenance for gas transmission region.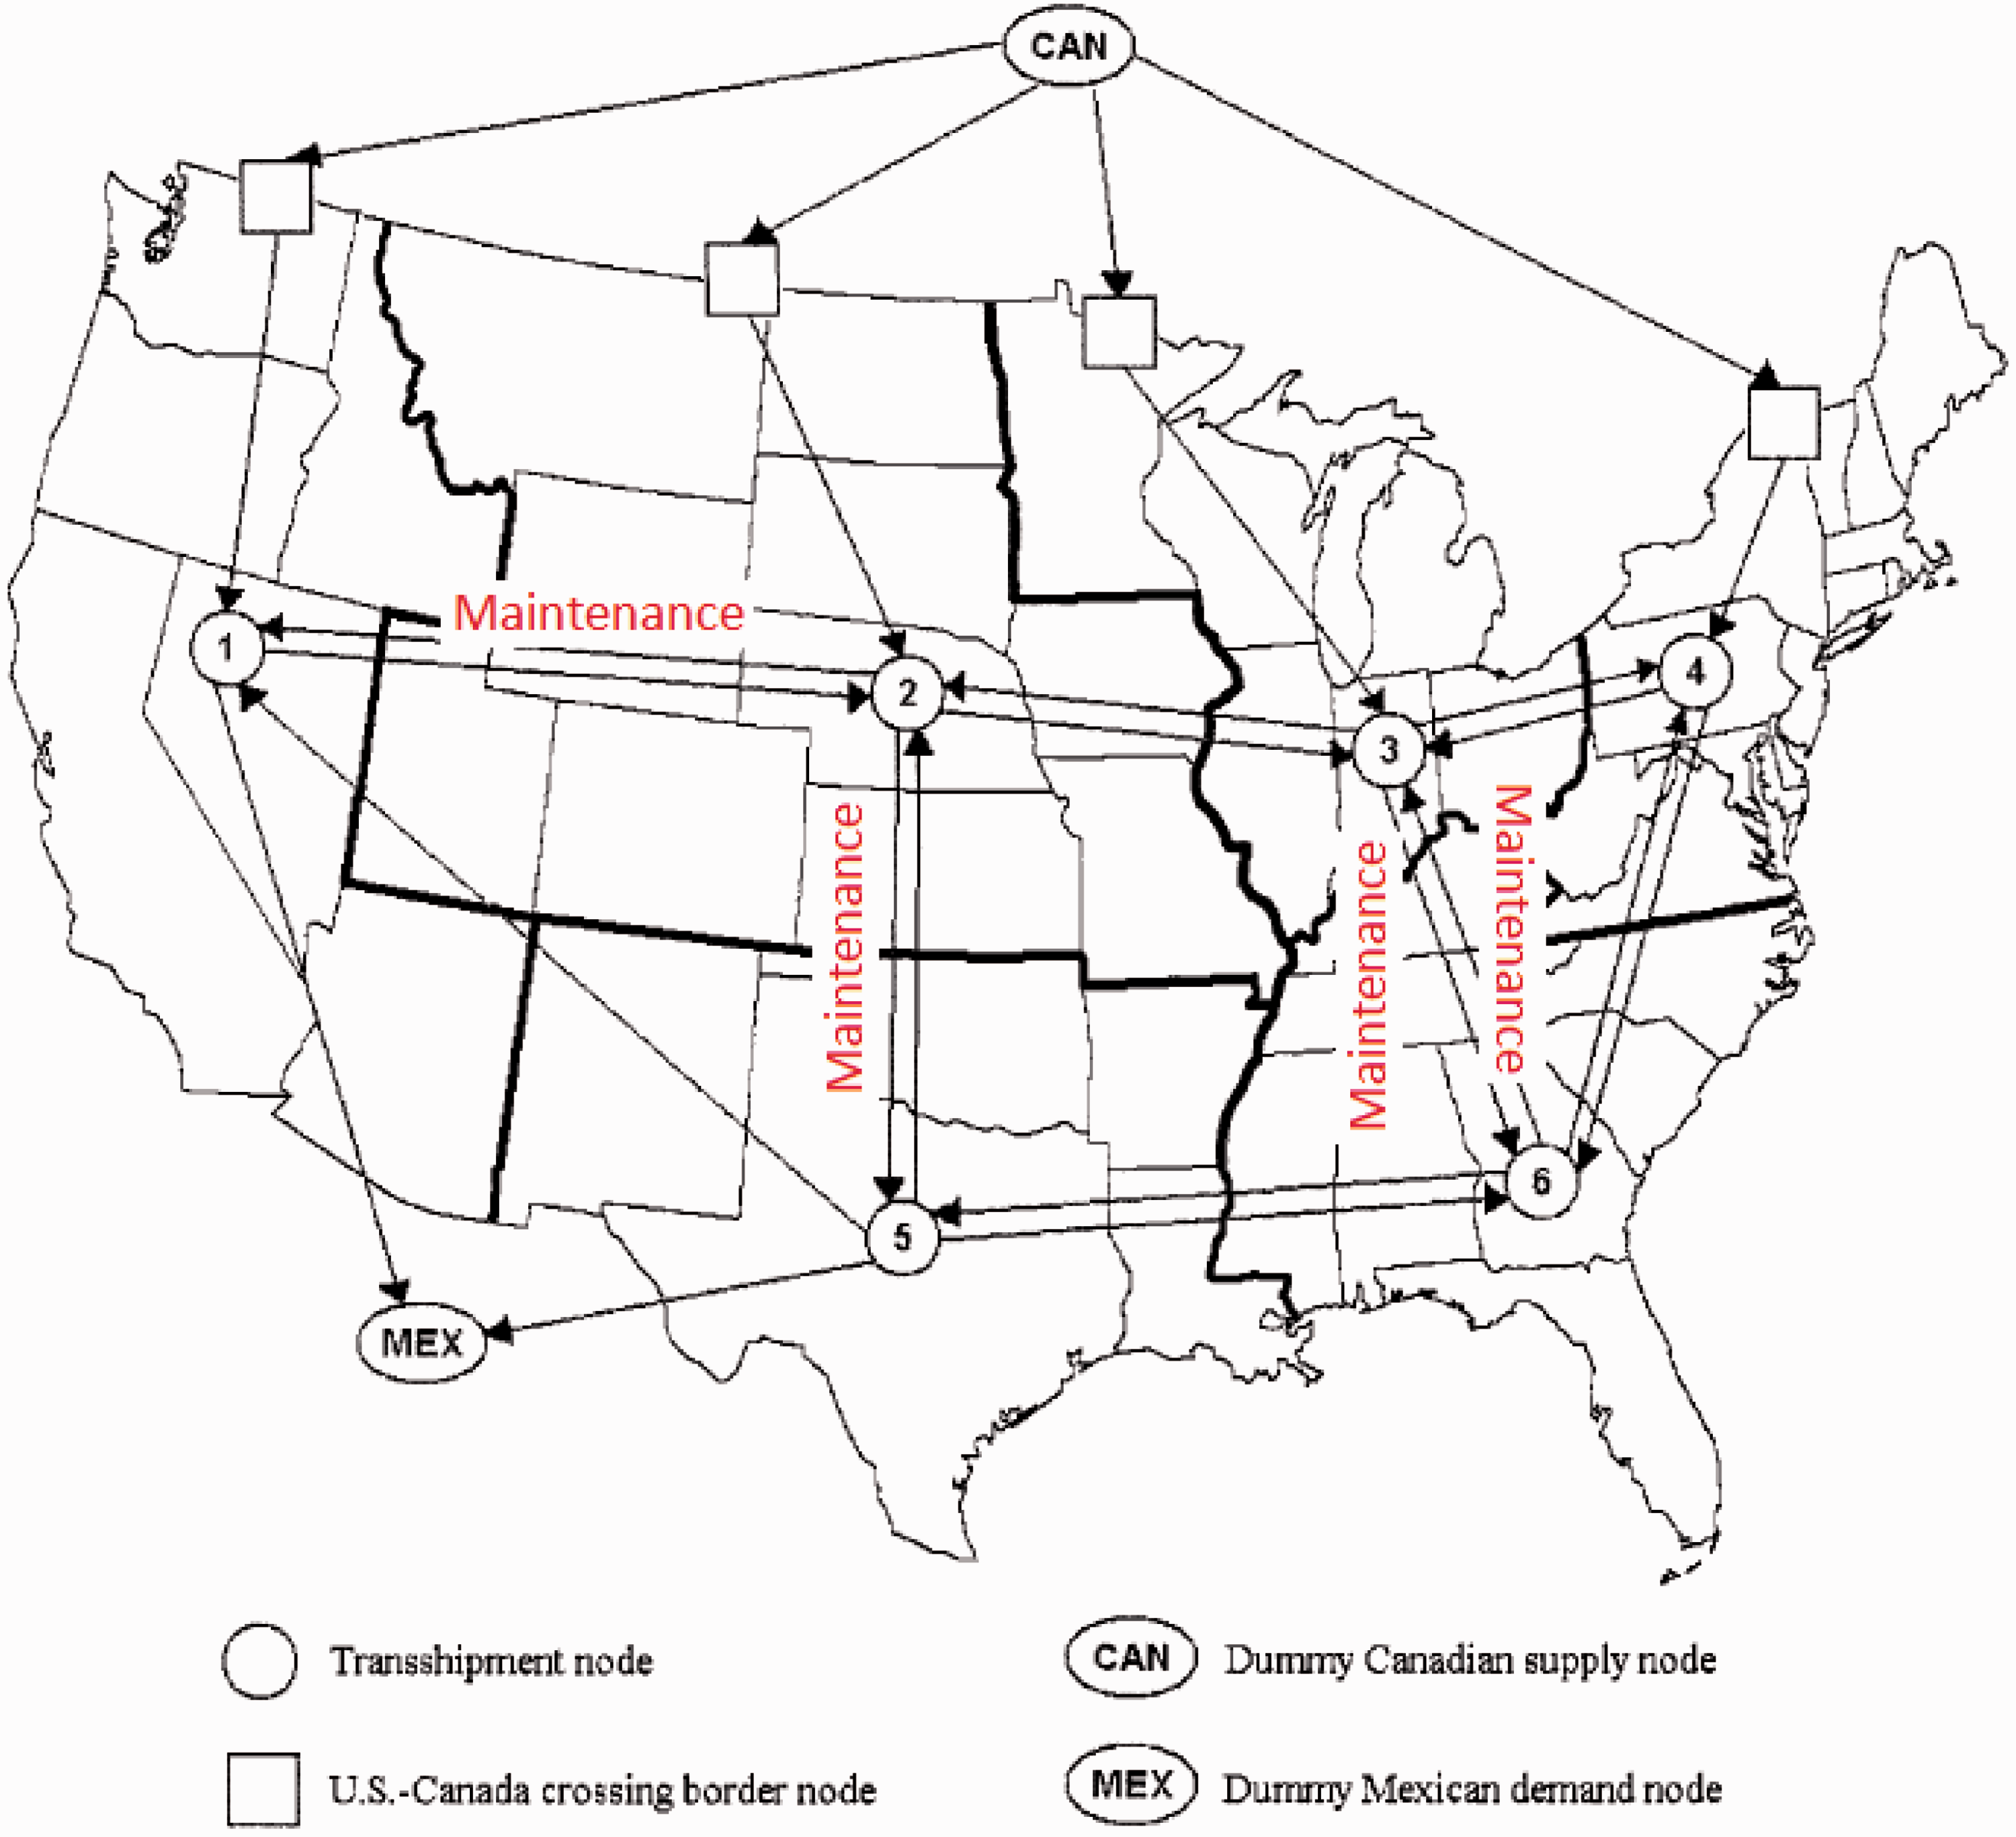
Electricity subsystem results


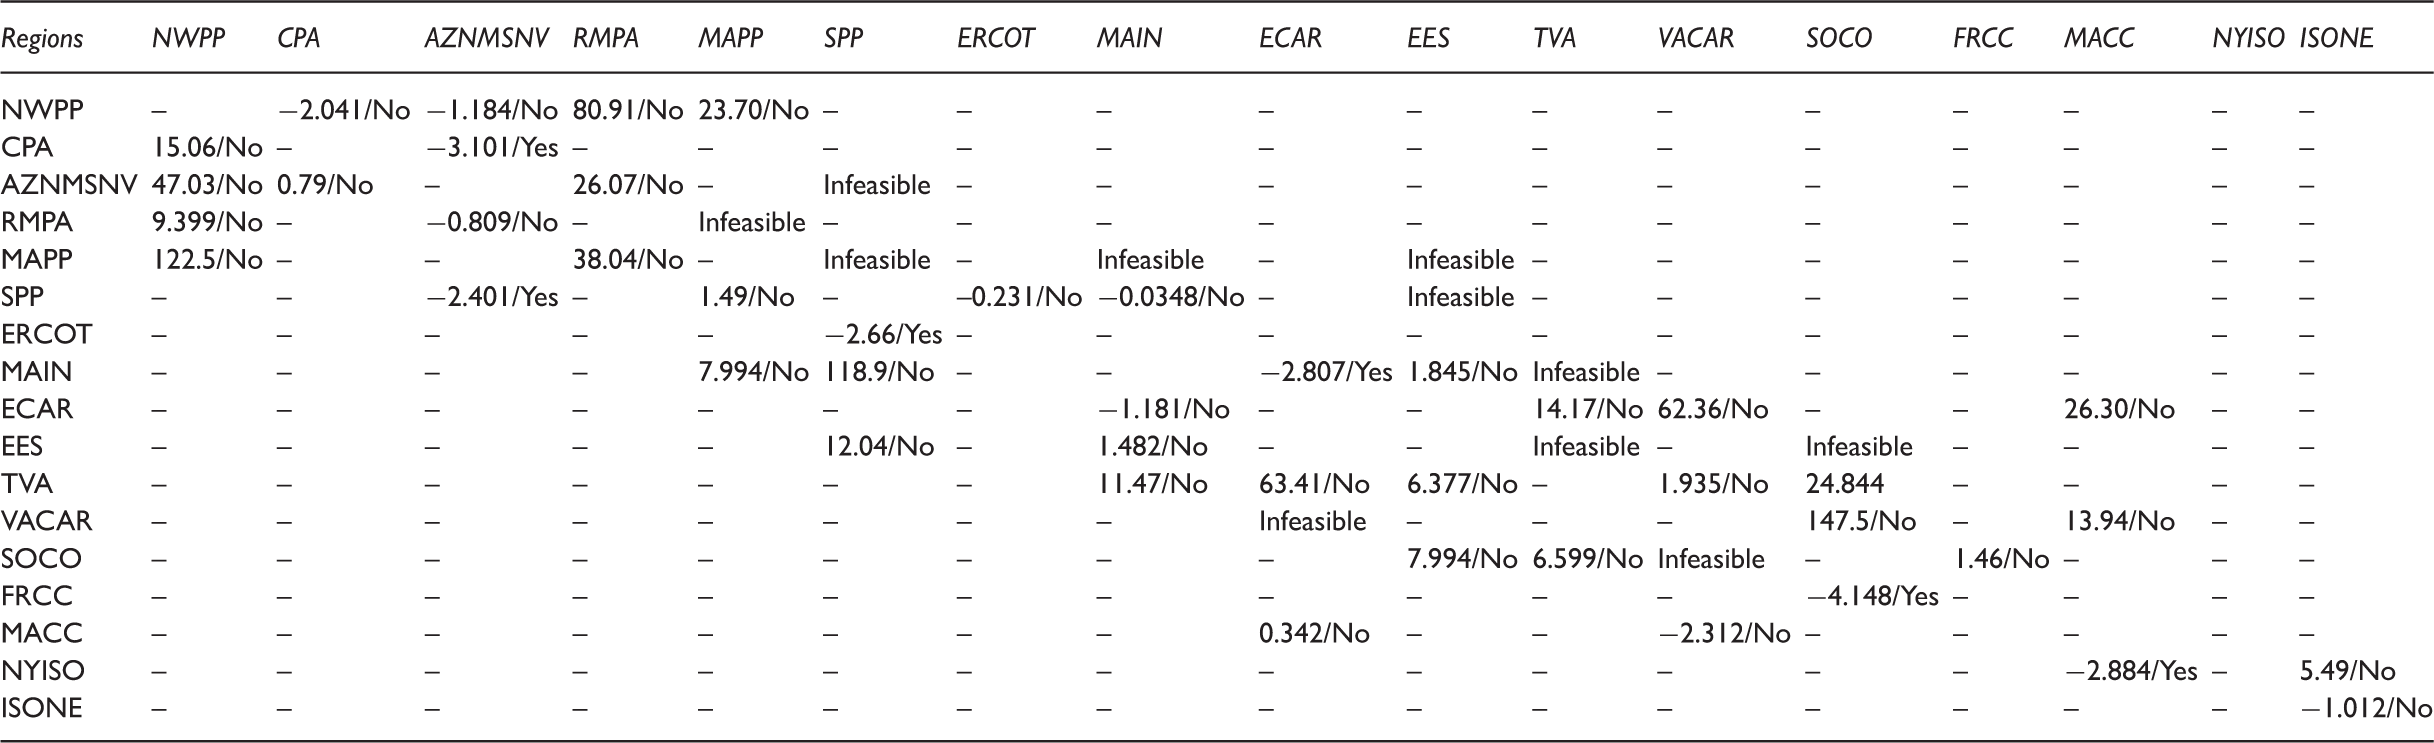
Total cost when a failure occurs in one electricity demand region (billion $).
Break-even point of probability of failure between two gas transmission regions a, b
ANOVA for gas transmission region (weather condition).
Figures 5–7, respectively, show the box plot for probability of failure versus electricity demand region, individual value plot for probability of failure versus electricity demand region and residual plot of failure.
It is obvious that the average of failures probability is not equal in different regions. But for simplicity of the task, average and standard deviation of failures probability are assumed to be equal.
It is assumed that the electrical subsystem follows a normal distribution with a confidence interval of 99%, so if the probability of failure between the two regions is greater than the failure probability in the break-even point of the two regions (it is equal to or greater than 99%) maintenance will be conducted.
Economic maintenance for electricity demand region.
Conclusion
This research incorporates the proper maintenance cost among the defected regions of the gas and electrical subsystems. In this research, by considering Ana Margarida's model (Quelhas Alves de Feritas, 2006), that is a linear model of coal, natural gas and electricity networks in USA, and by adding two overall constraints in maintenance of gas and electricity subsystems, a complete model was obtained and then by using data of Quelhas Alves de Feritas (2006), this model was solved in GAMS 23.5.1 software. In this paper, it is assumed that the average and standard deviation of failures probability in both gas and electricity subsystems are the same. In the Introduction section, maintenance in gas and electricity transport was introduced. It is clear that the economical maintenance in this area has more value. The maintenance cost is ignored in these two subsystems (Hubner and Haubrich, 2008; Padberg and Haubrich, 2008) because these systems have more reliability. Our main contribution is incorporating the maintenance costs to the model.
Future research
For the future work in maintenance, researchers can consider the failure simultaneity in two or more regions and find the effect of that in the overall cost. Maintenance cost can also be considered as a function of distance, which makes the model more effective. On the other hand, we can consider the maintenance in coal transportation regions. Our intent is to eventually apply this flow problem to the Iranian energy system to study and understand its complex dynamics since Iran is a country rich in fossil fuels and the optimization and efficiency of these systems are of low priority for now. Moshiri et al. (2012) has pointed out that the increasing energy consumption in Iran is partly due to the country’s fast growing economy, but the large energy subsidies and poor management have exacerbated the consumption trend. If this trend continues it would not take long before Iran can no longer export oil and natural gas that are the main sources of revenue for its economic activities. So, this paper could be of great interest to practitioners in addressing the rising energy use that imperils Iran for future generations.
Footnotes
Acknowledgements
The authors are grateful for the valuable comments and suggestions from the respected reviewers. Their valuable comments and suggestions have enhanced the strength and significance of our paper. This study was supported by a grant from University of Tehran (Grant No. 8106013/1/17). The authors are grateful for the support provided by the College of Engineering, University of Tehran, Iran.
Declaration of conflicting interests
The author(s) declared no potential conflicts of interest with respect to the research, authorship, and/or publication of this article.
Funding
The author(s) received no financial support for the research, authorship, and/or publication of this article.