
Abstract
This article examines the pattern of occupational change in Finland between 2013 and 2018 in light of hypotheses derived from skill- and routine-biased technological change arguments. As extensions to mainstream studies on occupational change, two alternative means of classifying occupations by skill level are used, and data from Statistics Finland’s Quality of Work Survey are combined with data from the Finnish Labour Force Survey. The analysis reveals a pattern of skill-biased change and indications of a digital divide between high-skilled and other occupations with no signs of job polarization. Reasons for country-wide differences in occupational change patterns and the implications of differences in the means of classifying occupations for the results are discussed with suggestions of topics for further studies.
Introduction
Technological development has been the most important factor underlying the transformation of occupational structure during the industrial era (Freeman and Louçã, 2001; Frey, 2019). In the recent debate in economics and sociology, two competing arguments regarding a change in occupational structure due to technological development can be identified, called the skill-biased technological change argument and the routine-biased technological change argument. This article examines the forecasts of these two arguments using data on the Finnish labour market and working life and including two important extensions to the mainstream empirical studies on occupational change. First, the article makes use of two supplementary sets of data. Data from the Finnish Labour Force Survey (LFS) on changes in occupational structure between 2013 and 2018 are combined with survey data from Statistics Finland’s Quality of Work Survey (QWS) of 2018 on the use of digital media and the effects of digitalization on job content in different occupations. As another extension, changes in occupational structure are investigated using two parallel means of classifying occupations by their skill levels.
According to the skill-biased technological change (SBTC) argument, technological development leads to an increase in the share of those working in high-skilled occupations and, correspondingly, a decrease in the share of those working in low-skilled occupations. The logic underlying the SBTC argument is quite straightforward: computerization affects skills requirements and occupational structure in the labour market through two main avenues. Jobs that require only less skill are susceptible to substitution by automation, whereas in high-skilled jobs, the use of computers complements employees’ skills. The overall effect of technological development is thus an overall upgradation (Berman et al., 1994; Bound and Johnson, 1992; Katz and Murphy, 1992; Machin and Van Reenen, 1998).
The premises of the SBTC argument have been increasingly questioned since the turn of the millennium. David Autor, Frank Levy and Richard Murnane (2003) found in their empirical study based on representative US data from 1960 to 1998 that for nonroutine cognitive tasks, computers bring with them strong complementarities. The substitution effect concerns both routine manual and cognitive tasks, whereas nonroutine manual tasks typical of many low-skilled jobs are only slightly affected by substitution or complementarity. These findings have led to a conclusion in subsequent analyses that computerization does not result in a general upgradation of the occupational structure, as was previously widely believed, but to increase the share of people working in both high- and low-skilled occupations and hollow out the middle, thus intensifying job polarization. The study of Autor and his colleagues has since formed the basis of a competing argument to SBTC, the routine-biased technological change (RBTC) argument (e.g. Asplund et al., 2011; Autor, 2015; Berglund et al., 2020b; Fernández-Macías and Hurley, 2017; Goos et al., 2014).
According to the RBTC argument, many middle-skilled occupations involve routine tasks that can be fully codified and hence automated. In contrast, many low-skilled occupations that in themselves require only relatively short-term training or practice call for more varied interaction and sensorimotor skills. According to Moravec’s paradox (Moravec, 1988), many cognitively demanding tasks for humans require little computational power from machines, while many tasks demanding flexibility, judgement and common sense – many of which are typically needed in manual low-skilled occupations – require enormous computational resources, making the automation of human work either technologically impossible or economically unprofitable.
According to the RBTC argument, technological changes may also reinforce the differentiation of wage development. The growing demand for high-skilled labour increases the share and purchasing power of those working in such occupations, feeding the demand for a variety of low-skilled services. However, the growing demand in low-skilled occupations does not accelerate wage development in the same way as that in high-skilled occupations because many people who have been excluded from positions requiring middle-level skills must apply for lower-skilled jobs in the future. Intensified competition for such jobs keeps their earnings low, reinforcing duality in wage development. The abundant supply of labour in low-skilled jobs and the resulting disincentives to raise wages further reduce employers’ motivation to replace such work with technology (Autor, 2015; Mazzolari and Ragusa, 2013).
The article starts with a review on previous research. The next two sections include the research design and questions and the research data and methods used. Thereafter, the results are presented. Finally, the findings and limitations of the study are discussed, and conclusions are drawn.
Review of previous research
The argument originally launched by Autor et al. (2003) about the job-polarizing effect of technological development has been supported in recent years by many empirical studies. Based on EU-LFS data, Maarten Goos, Alan Manning and Anna Salomons (2014) examined the change in occupational structure occurring in 16 countries between 1993 and 2010 and found clear support for the argument for job polarization, both between and within industries. Camille Peugny’s (2019) study, which focused on the period of 1993–2013 and 12 European countries, provides a similar result on the basis of the same data source and using slightly different occupational groupings. However, in this study, the countries differed somewhat in their intensity of polarization and in which middle-skilled occupations declined the most. Guy Michaels, Ashwini Natraj and John Van Reenen (2014) analysed the change in occupational structure between 1980 and 2005 using industry-level data from the United States, Japan and nine European countries. According to the authors, the ICT intensity of the sector was clearly positively related to the increase in the share of those working in high-skilled occupations and the decrease in the share of those working in middle-skilled occupations. Rita Asplund, Erling Barth, Per Lundborg and Kjersti Misje Nilsen (2011) compared changes in the occupational structures of Finland, Norway, Sweden and the United States from 1996 to 2006. Indications of polarization could be found in all countries. The trend was strongest in the United States and weakest in Finland. In light of statistics compiled by ILO researchers (Ernst et al., 2019), the increases in the shares of both high- and low-skilled occupations and the decline in the share of middle-skilled occupations seem to have also been trends in many developing countries in the first two decades of the 21st century.
The RBTC argument and its job-polarization assumption have also been questioned. Enrique Fernández-Macías and John Hurley (2017) criticized empirical studies in support of the job-polarization assumption for their inconsistent means of defining and measuring the concept of routine. In their study of changes in occupational structure in the 15 EU countries between 1995 and 2013, they measure the ‘routine index’ of the job in a more diverse manner than most other studies and in a way that better reflects the core aspects of the underlying concept, such as repetitiveness, monotony and lack of unforeseen problems. Based on the use of their more sophisticated measure, routine task content was not found to be more frequent in middle-skilled occupations than in low-skilled ones, but rather the opposite was found. As another result against the RBTC argument, the authors found occupational change patterns to be very uneven across countries. Indications of job polarization were found in some EU countries. In some countries, the main trend was a trend towards high-level skills with no signs of polarization. Finally, in some of the countries studied, the greatest growth had occurred in middle-skilled occupations. However, the authors did not take a stand on why a particular model was specific to a particular country, making only a general reference to differences in institutional and cultural features of the countries.
Daniel Oesch and Giorgio Piccitto (2019) and Michael Tåhlin (2019) called the view of job polarization a myth. The former researchers’ study of four European countries (Germany, Spain, Sweden and the United Kingdom) for 1992 to 2015 did not find empirical support for the claim of polarization for any country studied, using a more detailed classification of occupations and more varied indicators of occupational change than most other studies in the field. Tåhlin’s results for Sweden are similar. According to Tåhlin, changes in Sweden’s occupational structure in recent years are largely a reflection of the general change in the economic structure, where production tasks are being replaced by various service-intensive tasks. In comparison, the explanatory power of the RBTC argument – even in cases where there are indications of reductions in middle-paid/skilled occupations – is weak. Both Oesch and Piccitto (2019) and Tåhlin (2019) have also criticized how many studies in support of the job-polarization assumption have measured occupational skill requirements only at the earnings level and divided occupations into different skill levels only by using a very rough classification of occupations.
It is obvious that such divergent research results may be attributable to differences in the methodologies used. One difference concerns the ways in which occupations are classified. Some studies have used the major groups of the International Labour Organization’s ISCO classification of occupations (e.g. Brekelmans and Petropoulos, 2020; Kerr et al., 2020; OECD, 2017; Peugny, 2019), while others have used a two-digit level (e.g. Asplund et al., 2011; Fernández-Macías and Hurley, 2017; Goos et al., 2014) and others have used a three-digit level classification (e.g. Berglund et al., 2020a, 2020b; Oesch and Piccitto, 2019). Another difference concerns the way in which the skills required in the occupation are measured. The most commonly used method involves applying the level of earnings of the given occupation as a proxy. However, the level of earnings may also reflect many other factors, such as the bargaining power of employees, gender-related or other social norms, or elements that compensate for the demanding work environments or workloads that characterize many industrial jobs (Oesch and Piccitto, 2019; Tåhlin, 2019). The third major difference concerns how occupations are grouped. The most common practice has been to use a breakdown for low-, middle- and high-skilled occupations (e.g. Asplund et al., 2011; Ernst et al., 2019; Goos et al., 2014; OECD, 2017), but some researchers have used more fine-grained groupings, dividing occupations into four (e.g. Peugny, 2019), five (e.g. Berglund et al., 2020a, 2020b; Fernández-Macías and Hurley, 2017; Oesch and Piccitto, 2019; Tåhlin, 2019) or more categories (e.g. Böckerman et al., 2019; Kerr et al., 2020).
Research design and questions
This article examines changes in occupational structure in Finland between 2013 and 2018 in light of the forecasts of the SBTC and RBTC arguments. The first research question concerns whether the dominant trend is one of a general job upgrading or polarization, i.e. a growth of both high- and low-skilled jobs in relation to middle-skilled jobs. We derive the following alternative hypotheses from the above discussion:
H1a: The share of those working in high-skilled occupations has increased the most, and the share of those working in low-skilled occupations has decreased the most.
H1b: The shares of those working in both high- and low-skilled occupations have increased relative to the share of those working in middle-skilled occupations.
Second, the article examines how widespread the use of computers is in occupations with different skill levels. Autor (2015: 16) argues that ‘Most manual task-intensive occupations are only minimally reliant on information or data processing for their core tasks, and involve only limited opportunities for either direct complementarity or substitution.’ ‘Manual task-intensive occupations’ here refer to nonroutine manual tasks typically requiring only low skills (Autor et al., 2003). The second research question concerns to what extent the view based on the RBTC argument that low-skilled occupations are less affected by computer use than high- and middle-skilled jobs receives empirical support.
H2: Those working in low-skilled occupations use computers less at work than those working in high- and middle-skilled occupations.
Third, the article explores the view contained in both the SBTC and RBTC arguments that the substitution and complementary effects of computers are very unevenly distributed among occupations. Due to a lack of appropriate data, this article focuses solely on complementarity. The third research question concerns whether the claim that the complementary effect is stronger for those in high-skilled occupations than for those in middle- or low-skilled occupations holds water.
H3: The complementarity effect of the use of computers is stronger for those working in high-skilled occupations than for those working in middle- and low-skilled occupations.
As indicated above, the divergent results of empirical studies may be partly related to their different methodologies. Oesch and Piccitto (2019: 452) and Tåhlin (2019: 20–22) note that some studies that have resorted to the use of the major groups of the ISCO-08 classification have done so in an illogical manner and without taking into account heterogeneity between different occupations within individual major groups. However, the mainstream research has been quite insensitive regarding the effects of different methodological choices on the results. To shed further light on this matter, this article uses two different classifications of occupations in parallel throughout the analysis. The first of these is based on the major groups of the ISCO-08 classification, which divides occupations into 10 entities (ILO, 2012). Alongside this approach, the article also divides occupations using a more detailed two-digit level ISCO-08 classification (it was not possible to use an even more precise three-digit level classification, as data on occupations explored in Statistics Finland’s Quality of Work Survey were only available at the two-digit level). Indeed, the fourth research question of this article examines the extent to which different classifications of occupations can produce different results for the other three research questions. Since, due to the paucity of previous research on the subject (see above), there is no particular reason to assume a priori that different classification methods systematically produce different results, the hypothesis is as follows.
H4: The different occupational classification methods used in this study do not lead to different results for research questions 1–3.
When using a two-digit level classification, occupations are divided into five groups by skill level instead of applying the simpler and more commonly used method of dividing occupations into high-, middle- and low-skilled groups. The advantage of grouping into quintiles is that it provides a more detailed view of trends within middle-skilled occupations, a matter central to this article’s interest in examining in more detail the validity of the job-polarization assumption of the RBTC argument. Using a quintile-based grouping, we follow the methodology of previous studies by Fernández-Macías and Hurley (2017), Oesch and Piccitto (2019) and Tåhlin (2019).
Research data and methods
Data on changes in occupational structure are based on Statistics Finland’s Labour Force Survey. For the period 2013–2018, occupations are classified according to ISCO-08. Despite the abovementioned shortcomings, the median wage of the occupational group is used as the basis for the division of occupations into different skill levels. Other variables used in the studies include an occupation’s level of education, job requirements and prestige based on administrative databases or employee surveys. However, these alternative modes also present obvious deficiencies as proxies for an occupation’s skill level (Martinaitis et al., 2020; Oesch and Piccitto, 2019). Using the median wage is a straightforward method, and it best helps to draw this research in line with mainstream studies in the field for comparative purposes.
Data on the median wages and salaries of occupational groups are based on the Survey of Wage and Salary Structures maintained by Statistics Finland. The register contains information on the earnings of employees from all sectors of the economy. Register data are available for several wage components, such as basic monthly wages for full-time employees, hourly wages for part-time employees and various wage supplements. In determining the median wages of occupations, performance-based bonuses were excluded from pay supplements due to their irregularity and dependence on business cycles. The earnings of part-time employees were estimated to correspond with the earnings of full-time employees by multiplying hourly earnings by the most common regular working hours and type of employment in the industry. Employees whose working hours were less than 5% of the most common weekly working hours of full-time employees and type of employment in the industry, as well as those whose earnings were less than 44% of the median earnings of the employee’s occupational group, were excluded. Statistics Finland’s Survey of Wage and Salary Structures lacks earnings data for those working in enterprises with fewer than five employees. In addition, the earnings data of a few occupational groups are protected due to data protection practices on the grounds that employees holding the corresponding occupational group title are found in fewer than three companies or that one company covers more than 90% of the occupational group’s employees.
For the analysis conducted at the level of major groups, the groups were ranked simply by the value of their median wages. Major groups 6 (skilled agricultural, forestry and fishery workers) and 0 (armed forces occupations) were excluded from the analysis due to their small sizes. The analysis using a two-digit level classification comprised 30 occupational groups. According to the number of employees working in each group in 2013, the groups were divided into five entities of the same size based on their median wages, following the same procedure as that used, for example, in Oesch and Piccitto (2019). To determine the size of occupational groups, weighted data provided by Statistics Finland were used, for which the figures of the LFS have been corrected to absolute figures. As a base year for grouping occupations, we used the wage data for 2016 selected from the middle of the study period. Based on previous studies, the choice of the grouping year from the study period has little effect on the groupings, as the wage structures of the occupations are very stable over time in both countries with centralized (like Finland) and decentralized wage-setting (Asplund et al., 2011; Berglund et al., 2020b; Goos and Manning, 2007; Oesch and Piccitto, 2019).
Data on the level of computer use at work and on the complementary effect in different occupations are based on Statistics Finland’s Quality of Work Survey of 2018. The target group of the survey is employees who regularly work at least 10 hours a week. The 2018 survey is well suited as material for this study, as its special theme was the digitalization of work. The survey includes several questions related to this theme. Data from the 2018 survey were collected through site interviews held between September 2018 and January 2019. The sample was selected from among those who participated in the LFS. Of the 6153 individuals who met the sampling criteria, 4110 were interviewed (response rate of 66.8%). The skew contained in the data has been corrected by weighting factors to correspond to the target group of employees working at least 10 hours a week. Weighting factors were used to correct the distribution of the sample by respondent gender, age, province, level of education and socioeconomic group. The age range of the target population ranges from 15 to 67 years (Sutela et al., 2019: 365–370).
For the analysis that was to be conducted at a two-digit level, the distribution of respondents by occupational group in the QWS was compared to the corresponding distribution for the LFS in each wage quintile. The similarities of the distributions of the two surveys proved to be good in each quintile. The largest difference was found in the lowest wage quintile, where the share of respondents in major group 51 (personal and sales workers) in the QWS was six percentage points higher than their share in the quintile of the LFS.
Two questions from the QWS are used as proxies for the level of computer use in the occupational groups, reflecting the versatility and intensity of use. The first question concerns the number of digital applications and forms of media used by an employee at work. The survey specifically uses eight separate sub-questions focused on whether the employee uses real-time instant messaging; electronic workspaces or collaboration platforms; remote applications; social media; information modelling tools; applications for monitoring object movement or storage or ordering systems; resource planning applications; or customer applications or reservation systems. The second question concerns for how much of her or his working time an employee uses such digital applications and media in general. Occupational groups are compared to each other in terms of the number of applications and forms of media used (versatility) and the proportion of the time taken working with them (intensity).
Autor (2015: 15) describes the complementarity effect of computer use in high-skilled jobs by stating that ‘computerization enables workers performing abstract tasks to further specialize in their area of comparative advantage, with less time spent on acquiring and crunching information, and more time spent on interpreting and applying it’. The complementarity effect, as worded by Autor, can be considered to have two important implications for the jobs of those concerned. First, the effect acts as a safeguard against displacement by helping employees ‘further specialize in their area of comparative advantage’. In addition, complementarity helps employees improve their creativity by spending more time ‘interpreting and applying’ information and less time ‘acquiring and crunching’ it. These two embodiments of the complementarity effect are intertwined in the sense that the creative and social intelligence involved in the job act as the most important obstacle to substitution (Frey and Osborne, 2017). The question provided in the QWS regarding whether digital media have improved an employee’s ability to use creativity at work is used as a proxy for the complementary effect. The occupational groups are compared to each other in terms of the proportion of those who answered ‘yes’ to this question.
Results
Pattern of occupational change
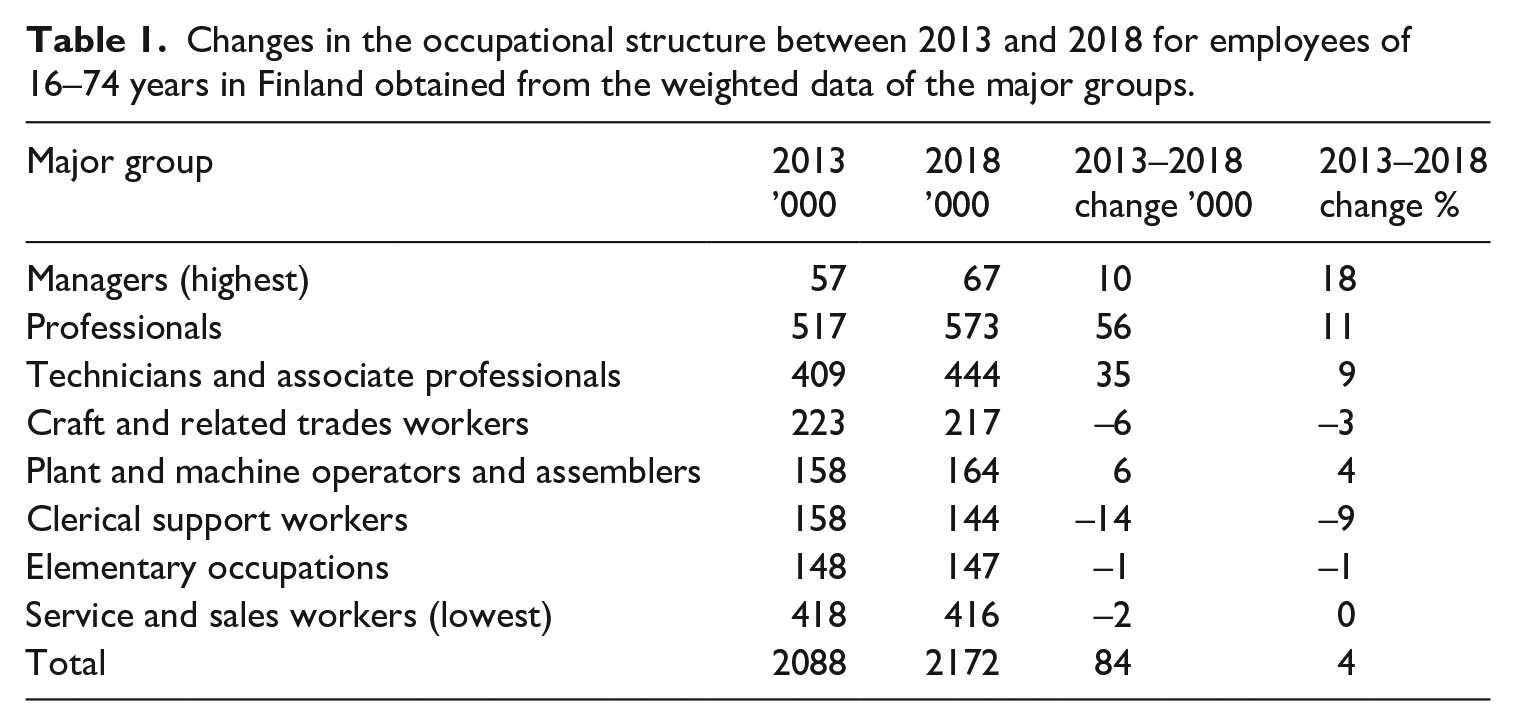
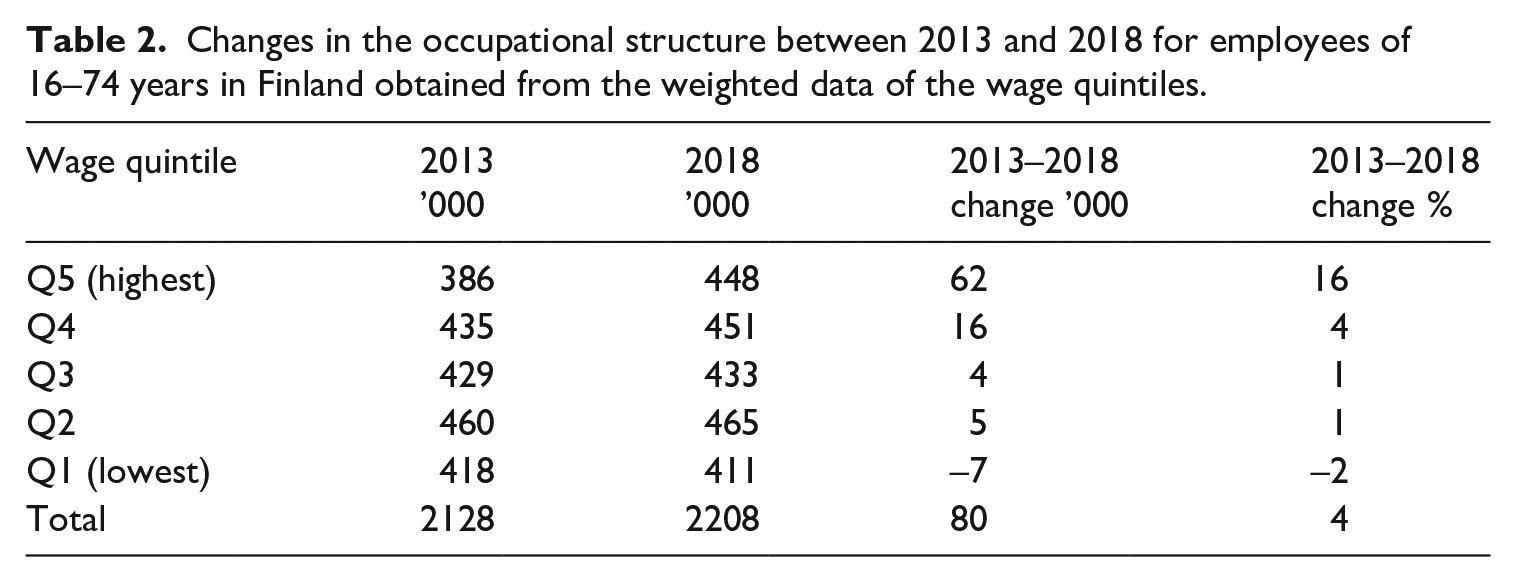
The analysis shows that the growth in the number of employees in Finland between 2013 and 2018 was focused almost exclusively on the three highest-paid major groups. The largest decrease, on the other hand, affected clerical support workers, who are in the lower middle of the pay scale. However, no clear signs of job polarization can be found in the distribution (Table 1). The parallel analysis based on wage quintiles at the two-digit level does not provide any indications of job polarization and suggests an even clearer incidence of skill-biased change than the analysis conducted at the level of major groups (Table 2). In terms of the hypotheses, the results show support for hypothesis 1a but not for hypothesis 1b. The results also suggest that the way in which occupations are grouped may be relevant to the unambiguity of the results, contrary to hypothesis 4.
Changes in the occupational structure between 2013 and 2018 for employees of 16–74 years in Finland obtained from the weighted data of the major groups.
Changes in the occupational structure between 2013 and 2018 for employees of 16–74 years in Finland obtained from the weighted data of the wage quintiles.
Use of digital media
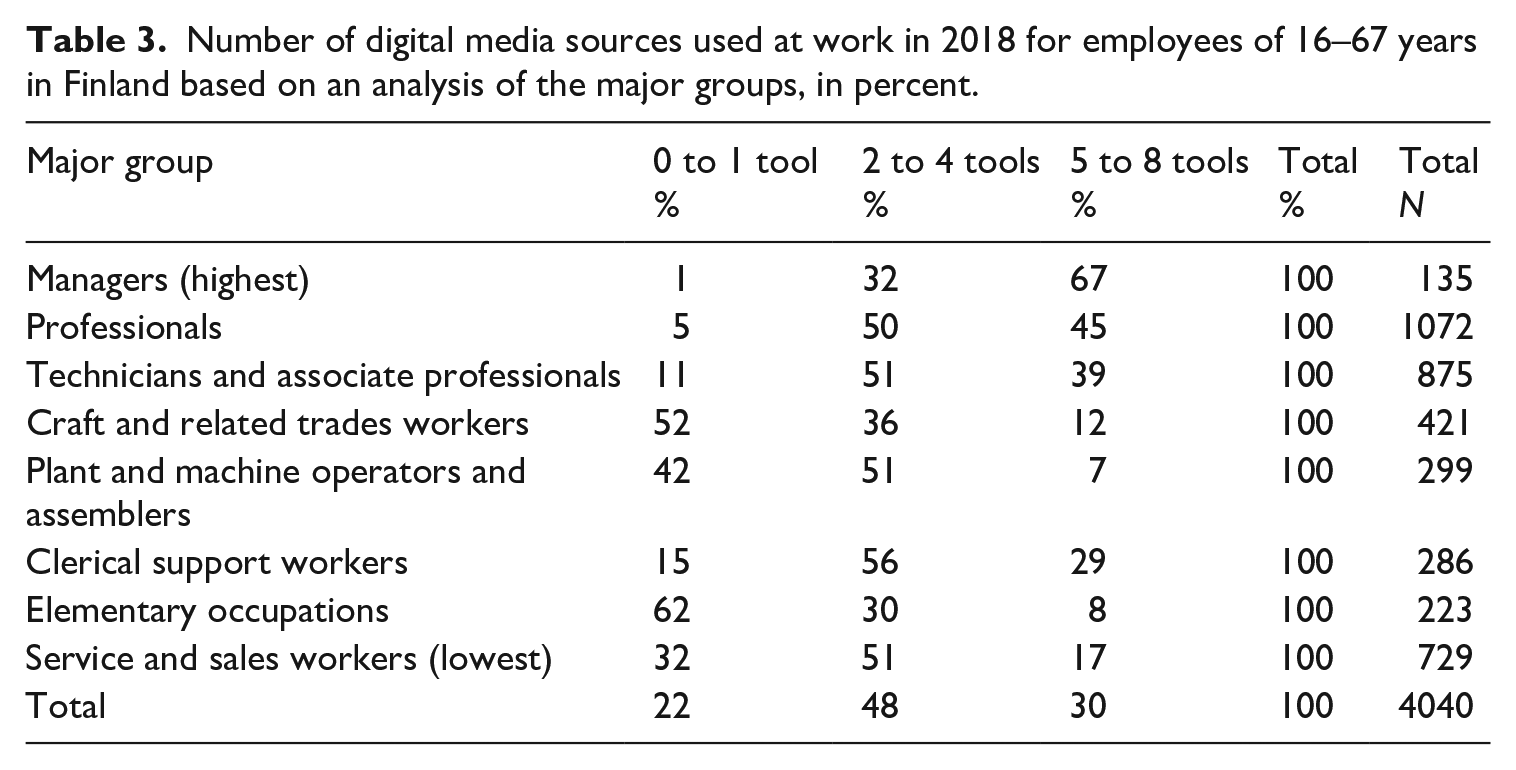
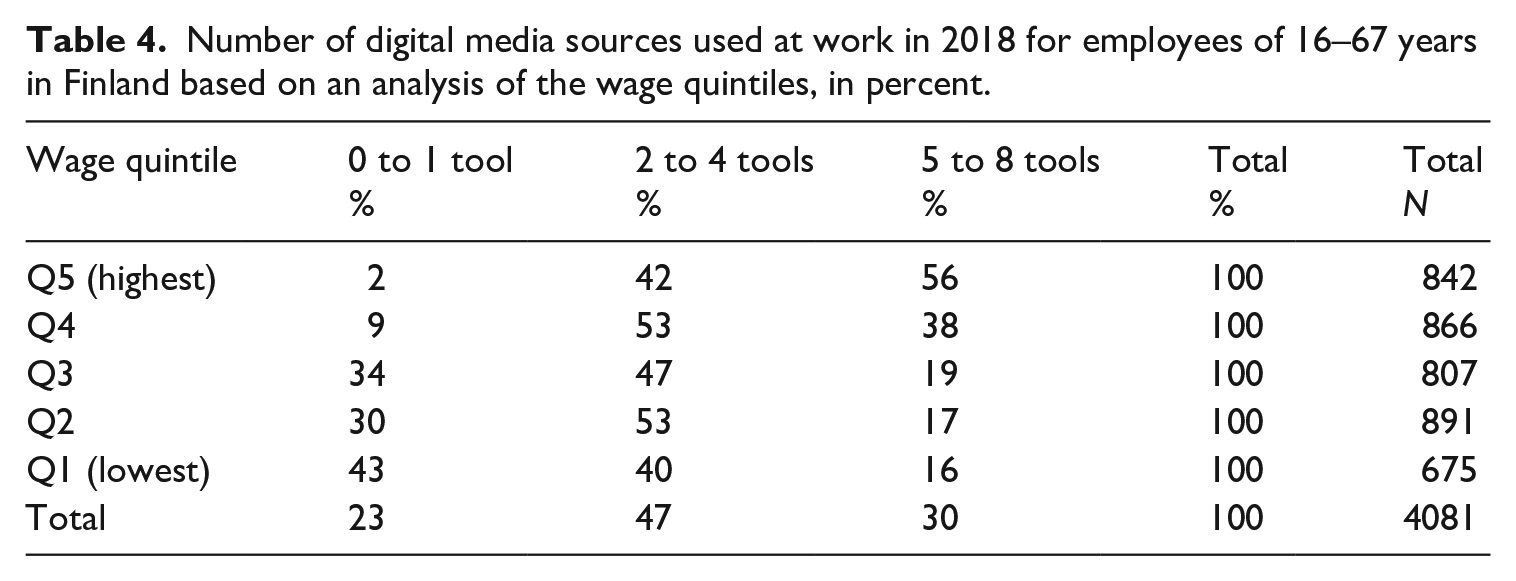
The number of digital media sources used at work varies greatly from one major group to another. The three highest-paid groups stand out clearly from the others, but many clerical support workers also use many different forms of media. The number of digital media sources used is not the lowest in the lowest-paid group of service and sales workers but is lowest among the three other groups of manual labourers (Table 3). The analysis based on wage quintiles at the two-digit level provides a more straightforward picture overall. The number of media sources used decreases systematically from the highest quintile to the lowest, albeit the differences between the three lowest quintiles in the proportion of those who use at least five media sources are minor (Table 4).
Number of digital media sources used at work in 2018 for employees of 16–67 years in Finland based on an analysis of the major groups, in percent.
Number of digital media sources used at work in 2018 for employees of 16–67 years in Finland based on an analysis of the wage quintiles, in percent.
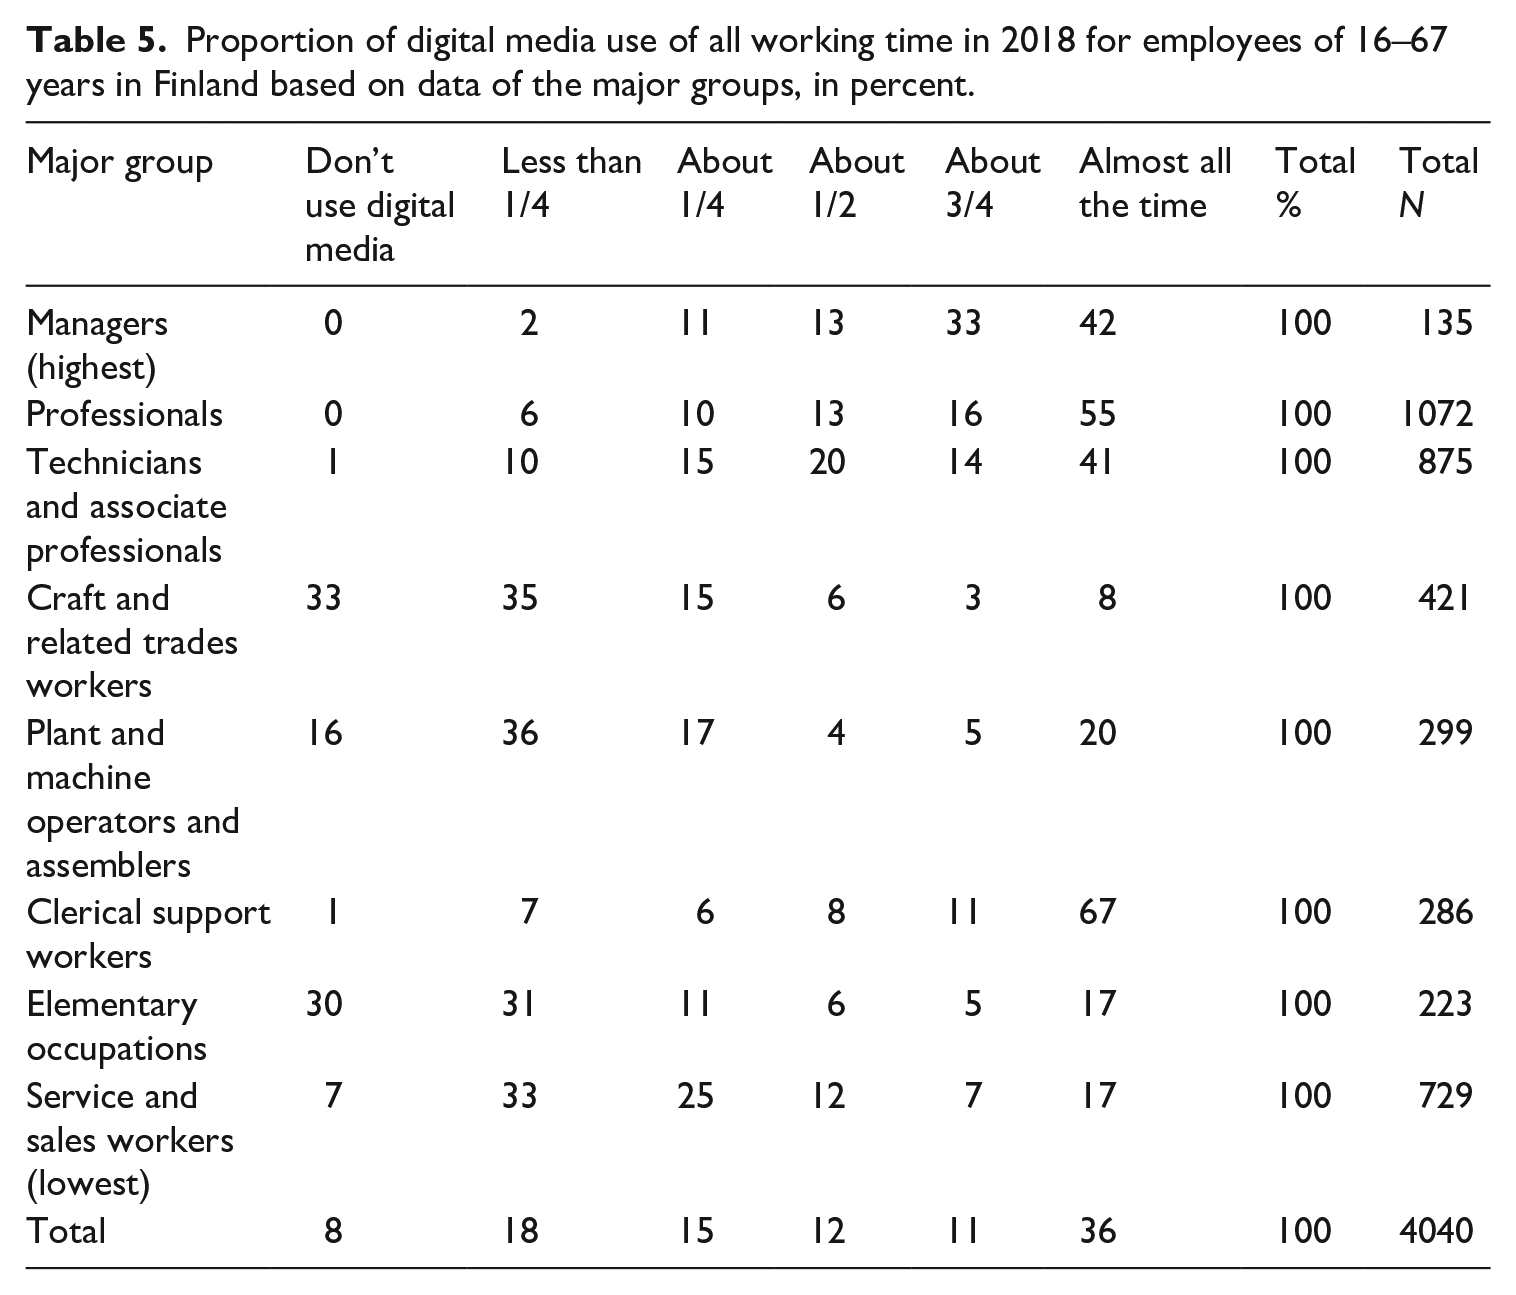
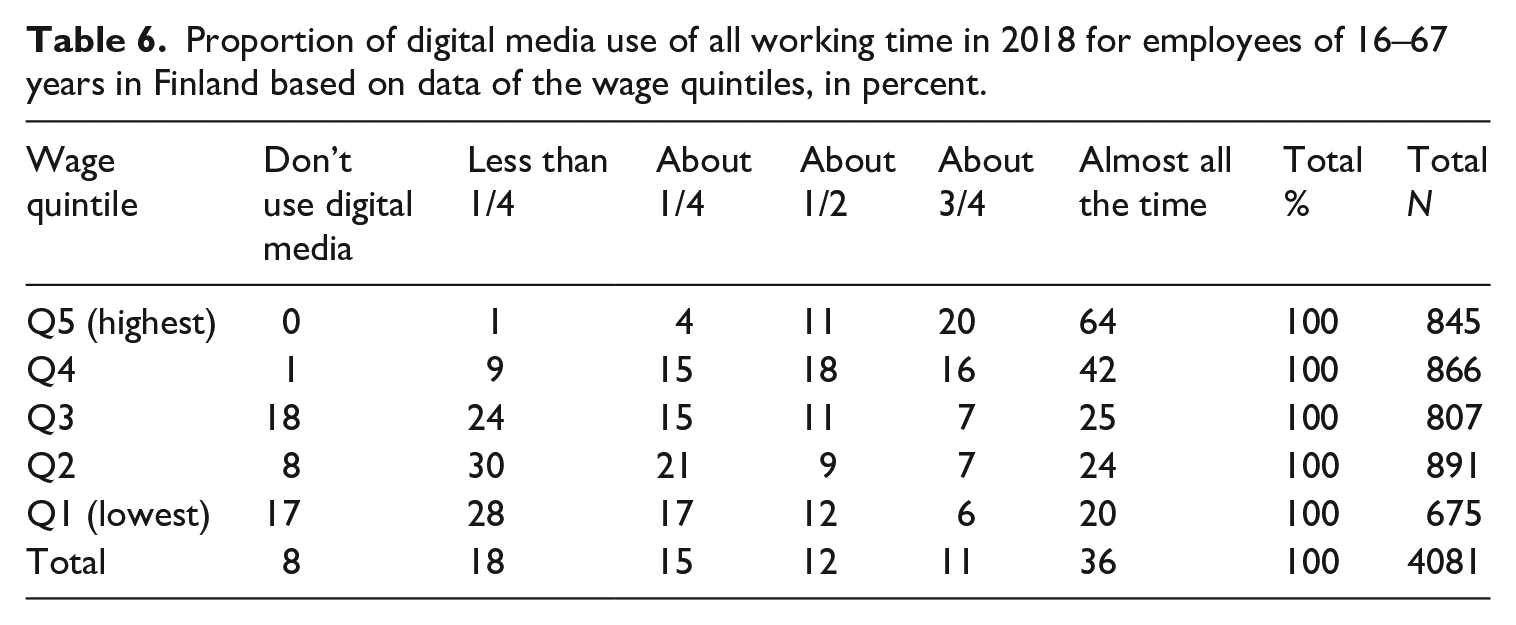
The use of digital media can also be examined based on the intensity of use. Unlike what is found for the versatility of use (see above), the intensity of use is clearly highest among clerical support workers, with as many as two-thirds reporting working with digital media ‘almost all the time’. The lowest level of use is represented by craft and related trade workers in the middle of the pay scale and not by the lowest-paid major groups (Table 5). The highest wage quintile represents the most intensive use of digital media, followed by the second highest wage quintile. Once again, the three lowest-paid quintiles do not differ significantly in their proportions of those who use digital media at least half of their working time (Table 6).
Proportion of digital media use of all working time in 2018 for employees of 16–67 years in Finland based on data of the major groups, in percent.
Proportion of digital media use of all working time in 2018 for employees of 16–67 years in Finland based on data of the wage quintiles, in percent.
According to hypothesis 3, the incidence of digital media use is lower in low-skilled occupations than in high- and middle-skilled occupations. The hypothesis does not receive unambiguous support. The analysis shows that use among the highest-paid occupational groups is more versatile and intensive than among the lowest-paid groups at both the major group and two-digit levels. However, the differences between middle- and low-paid occupations are far from clear. In the case of major groups, the differences seem to be related more to the specific characteristics of the typical occupations of the groups than to the group’s position in the wage hierarchy per se. The analysis based on wage quintiles shows only minor differences between the three lowest-paid quintiles. At the same time, the results seem to indicate, contrary to hypothesis 4, that differences in occupational classification methods are not insignificant in terms of results.
The complementary effect
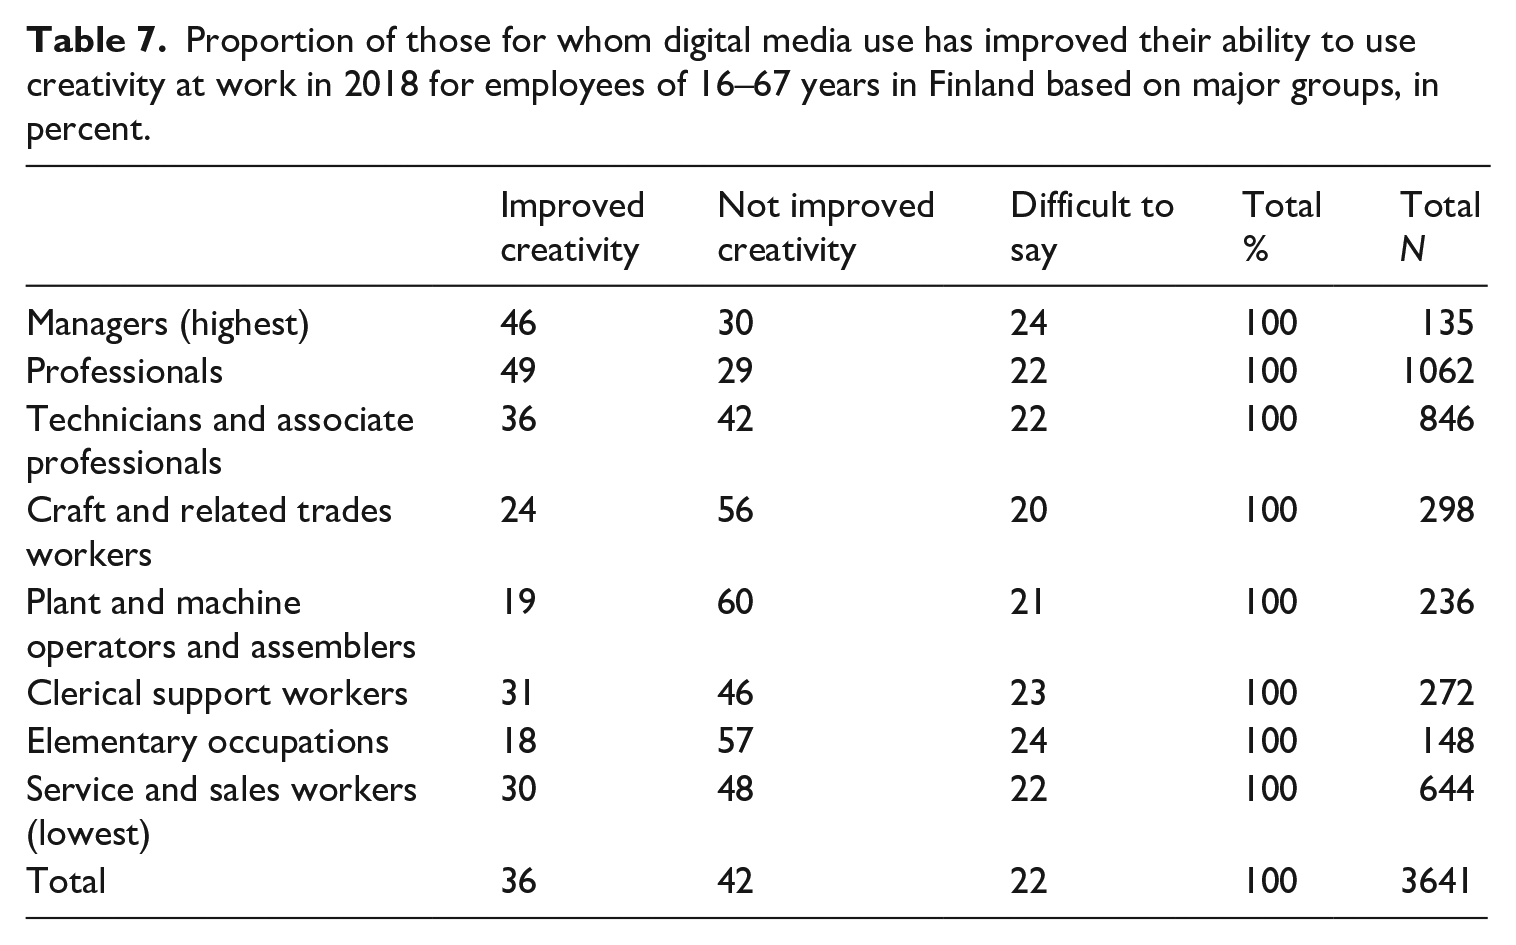
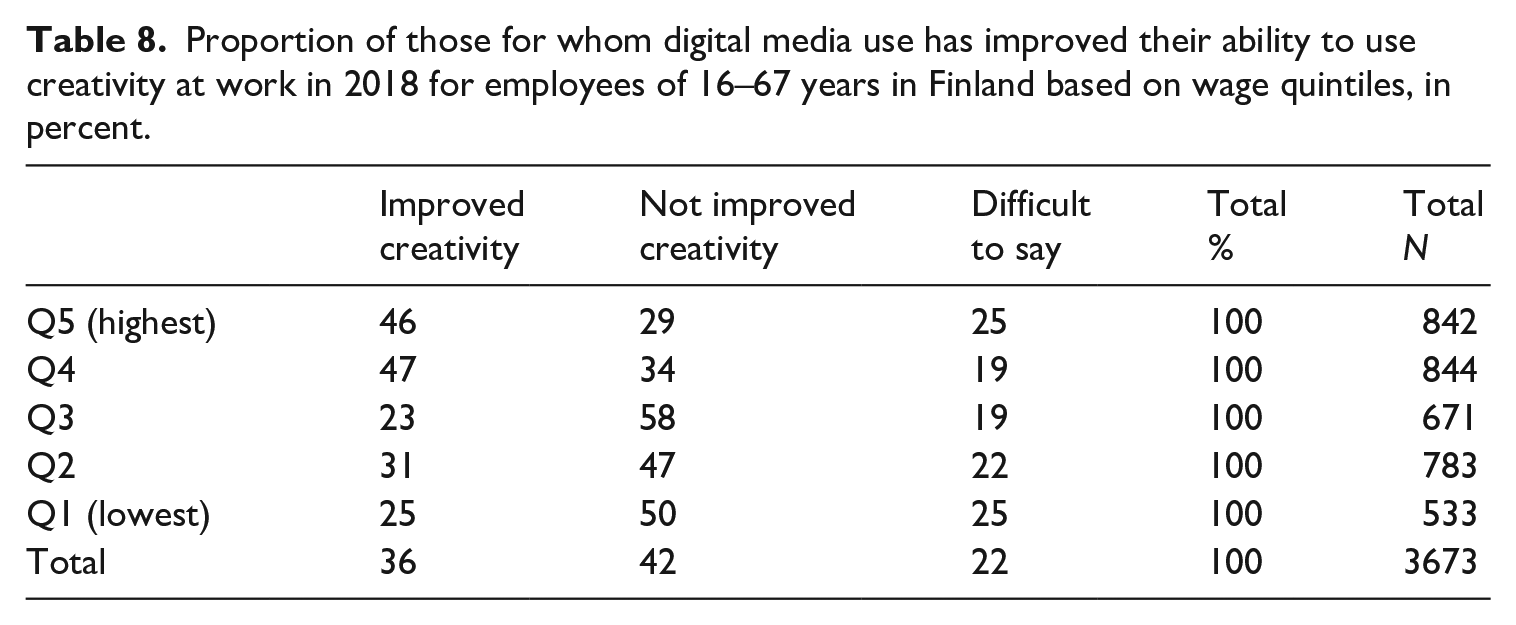
The complementary effect was examined only for employees who used at least one of the eight digital media outlets mentioned in the QWS. Managers and professionals are clearly distinct. Nearly half the employees in both groups reported that digital media have improved their ability to use creativity at work. For plant and machine operators and assemblers and for those in elementary occupations, the share remains at below 20% (Table 7). Similarly, according to the analysis based on wage quintiles, the two highest-paid quintiles are clearly distinguished from the others (Table 8).
Proportion of those for whom digital media use has improved their ability to use creativity at work in 2018 for employees of 16–67 years in Finland based on major groups, in percent.
Proportion of those for whom digital media use has improved their ability to use creativity at work in 2018 for employees of 16–67 years in Finland based on wage quintiles, in percent.
Our finding that the complementarity effect is stronger for those working in high-paid occupations than for those working in middle- and low-paid occupations aligns well with hypothesis 3. In this case, the analyses at both the major group and two-digit levels produce a similar result.
Discussion
The statistical analysis does not support the view of job polarization in Finland between 2013 and 2018. The trend involves an increase in those working in high-paid occupations, especially in the highest wage quintile. The results are in line with those obtained by Fernández-Macías and Hurley (2017) in their study of Finland from 1995 to 2012. The authors classified Finland, together with Denmark, Ireland, Luxembourg and Sweden, as an EU15 country, where the main trend was a growth of high-skilled occupations without signs of polarization. The authors’ study also used a breakdown of occupations into five quintiles at the two-digit level.
Comparative statistical analyses have not typically looked in greater depth at what may explain the differences among countries observed in the results. This is also true of the analysis of Fernández-Macías and Hurley, who refer only at a general level to differences in institutional and cultural factors between countries. Neither are we, in light of our research design, able to provide a straightforward explanation for why the change in Finland’s occupational structure differs from those found in many other EU15 countries (Fernández-Macías and Hurley, 2017) or the United States (Dwyer and Wright, 2019), in which job polarization has been a dominant trend for many years. However, in the following section, we present three potential factors that may be relevant, two of which relate specifically to Finland and the third of which is of a more general nature; all these factors have implications for further research.
The first of these factors relates to wage formation. According to the World Economic Forum’s Competitiveness Report, Finland has one of the world’s most rigid wage-setting mechanisms (Schwab, 2019) and a very strong and comprehensive system of universally binding collective agreements (Eurofound, 2015). Together, these factors have curbed the wage gaps among different occupational groups in recent years. Fairly small income disparities have not necessarily lowered the threshold for the high-skilled workforce in Finland to use various (often low-skilled) personal services in the same way as that observed in many countries with larger income disparities. Low wage flexibility may also have increased employers’ motivation to automate (or offshore) low-skilled work whenever possible. The assumptions underlying the RBTC hypothesis may therefore not have worked in such an institutional setting.
Another factor that may explain the results is related to the role and importance of the public sector as an employer. Employees working in the public sector account for nearly one-third of all employees in Finland. Many of the new jobs that have arisen in the Finnish public sector, such as those in healthcare and education, in the 2000s have been placed specifically in the middle of the wage structure (Alasoini and Varje, 2021). This recruitment pattern typical of the Finnish public sector may thus have counterbalanced the reduction in middle-skilled occupations in the private sector resulting from technological advances. This potential ‘levelling’ role of the public sector also requires further research.
Both of these institutional factors clearly distinguish Finland from, among others, the United States, where job polarization has continued since the beginning of the 1980s during both economic booms and busts. Richard Dwyer and Erik Olin Wright (2019) link job polarization and the growth of low-wage jobs in the United States to declining unionization and weakening business and labour market regulation in the context of the shift from a manufacturing to a service economy. Neither has the public sector played a similar ‘levelling’ role in the United States as in Finland. As Dwyer and Wright point out, only roughly 15% of jobs in the United States – about half of what in Finland – are provided by federal, state and local governments.
The third possible, and more general, factor relates to the development of technology as such. Daniel Susskind (2020: 67–71) has argued that with the advent of smart technologies, the assumption underlying the RBTC hypothesis of the different automating potentials of different types of tasks is becoming obsolete, and the substitution effect will thus increasingly extend to jobs at all levels of expertise. Carl Frey and Michael Osborne (2017) also argue in their much-debated analysis that smart technologies, together with innovative approaches to task restructuring, are rendering an increasing number of jobs susceptible to computerization. However, according to them, at this stage, this primarily applies to tasks that do not require creative or social intelligence. In their view, many of the low-skilled service jobs that, according to the RBTC hypothesis, offer limited opportunities for neither substitution nor complementarity are now highly susceptible to automation.
Finnish data do not provide clear indications of job polarization but rather of a skill-biased change in occupational structure. Instead of polarization, however, the data point to a clear digital divide among employees. The concept of the digital divide has been used in the research literature to refer to differences in access to digital media (first-level divide), the usage of digital media (second-level divide) or the outcomes of usage (third-level divide) (Ragnedda and Muschert, 2018). Here, the digital divide manifests between high-skilled occupations (the top three major groups and the top two wage quintiles) and others, especially in terms of both the versatility of the use of digital media (reflecting the second-level divide) and the extent of the complementarity effect (reflecting the third-level divide). From a policy perspective, these two manifestations of the digital divide with associated threats of growing work-related and social inequalities appear to be more acute and significant labour and social policy issues in Finnish conditions than job polarization.
A lack of complementarity, in terms of an inability to utilize digital media to increase one’s creativity at work, does not in itself mean that a job is in outright danger of being replaced by technology. However, what this does mean is that the ‘sheltering’ effect of complementarity against the substitution of the job is missing. It is also worth noting that the difference between the highest-skilled occupations and others in complementarity is by no means absolute. Nearly one-third of those in the two highest-paid quintiles answered in the QWS that their ability to use creativity at work has not improved, and almost a quarter found it difficult to provide an assessment. Correspondingly, for example, in the second lowest-paid quintile, almost one in three believes that their opportunities to use creativity have increased. There are also clear differences between middle- and low-paid major groups.
The main methodological contribution of this article is a comparison between two means of grouping occupations by skill level. While no particular reason to assume that different ways of grouping produce different results was obtained based on previous research, this assumption does not hold.
The analysis based on wage quintiles at the two-digit level mostly provided results that could be interpreted in light of previous research literature. A quite clear pattern of skill-biased change in Finland between 2013 and 2018 was revealed as well as a straightforward positive association between the intensity and versatility of the use of digital media and the level of skill. In contrast, the present analysis, which was based on the division of occupations into different levels of skill based on the major groups, produced a more ambiguous picture, especially concerning middle- and low-skilled groups. The decrease in employees in the research period was the largest among clerical support workers, which is in line with the job-polarization assumption, but no corresponding pattern was observed among other middle-skilled groups. The use of digital media was not the lowest among the lowest-skilled group of service and sales workers in terms of either versatility or intensity but was instead lowest among those in typical industrial jobs and elementary occupations (e.g. cleaners, helpers, labourers and food preparation assistants).
Based on the above results, two implications for further research can be distinguished.
First, for the time being, the use of digital media at work, at least in the case of Finland, seems to be more widespread among those working in middle- and low-skilled service-intensive occupations than among typical industrial blue-collar jobs. This result may not be generalizable to other industrialized countries, as, for example, the structure of industrial production may vary from country to country. The relatively low level of digital media use among typical blue-collar workers in manufacturing, construction and the like relative to middle- and low-skilled service-sector jobs in Finland may reflect the fact there is little such industrial mass production where it is possible even in the near future to radically increase the automation of operations and substitute labour for new technology (e.g. PwC, 2018), whereas in an advanced, knowledge-based economy, the use of digital media is already part of work even among many Finnish low-skilled service workers. The low degree of automation potential of existing, mainly middle-skilled industrial jobs may in part also have acted as an obstacle to job polarization in Finland. Thus, in future studies, it is important to better understand the role of such differences in the economic structure and subsequent task composition of jobs and their significance for different occupational change patterns among countries.
Second, the differences between the analyses performed at the major group level and the two-digit level suggest that the major groups may be very internally heterogeneous. The findings of the article echo earlier observations made by Oesch and Piccitto (2019) and Tåhlin (2019) that a division based on major groups alone can produce a very misleading picture of the skill hierarchy of occupations and any changes in the skill structure based on this. In analyses that use the wage level as a proxy for skills, this analysis should be based on a more precise two- or three-digit level classification of occupations instead of on major groups.
The present study covered only one country and over a relatively short period of time (significant changes in the classification of occupations in Finland were made in the early 2010s). Its contribution to the previous debate on occupational change is its combination of LFS data with a survey on working conditions and a parallel comparative use of the two occupational structure classifications as part of the analysis. However, in both classification schemes, the wage level was used as a proxy for the level of skill. Wage level is not an ideal measure of skill, as already pointed out above, but its use allowed for better comparability between this study and mainstream studies on the structure of occupational change.
There were also obvious limitations concerning the use of QWS data as part of the analysis. Unfortunately, the QWS offers no variable that would have directly indicated whether, to what extent and for what purposes a respondent uses a computer in her or his work. Computer use was examined only indirectly through two questions from the QWS concerning the number of digital media sources used at work and the proportion of working time spent using them. However, the eight media examined are very heterogeneous and designed for different purposes, and their use cannot be considered equivalent in terms of either versatility or intensity. Neither do the data allow us to draw further conclusions on the strategic function or role of the use of the media as part of the core focus of a job.
The present study used respondents’ views on whether digital media have improved their ability to use creativity at work as a proxy for the complementary effect. This choice was justified based on Autor’s (2015) description of the content and implications of the complementary effect for the jobs of those concerned. However, creativity may not capture all aspects that complementarity entails in different work contexts. It is also a matter of the employee’s subjective view, for which the object of comparison is the employee’s own perception of the content of her or his work before the introduction of digital media.
Conclusions
Changes in occupational structure in the digital age seem to follow different paths in different countries due to a number of institutional, cultural and structural factors. This study particularly highlights the potential significance of two such intervening factors – a rigid wage-setting mechanism and the role of the large public sector as an employer – which could have acted as obstacles to job polarization in Finland. Other potentially important factors include differences in countries’ economic, educational and task structures. More research is needed on the significance of all these factors for diverging occupational change patterns in the future.
This study also suggests that the results are not insensitive to different methodological choices. The methodological differences concern in particular the level of detail in which occupations are classified, how skills required in occupations are measured and into how many entities occupations are grouped for analysis. Based on previous research as well as this study, it is recommended that a two- or a three-digit level classification of occupations be used and that occupations be grouped into more than three groups based on the skills they require.
Footnotes
Declaration of conflicting interests
The authors declared no potential conflicts of interest with respect to the research, authorship, and/or publication of this article.
Funding
The authors received no financial support for the research, authorship, and/or publication of this article.