
Abstract
Proactive strategies for data-driven operational schedules based on monitored occupancy patters can enable energy demand reduction and optimal resource utilisation. A replicable framework that enables strategic closure of specific thermal zones is introduced and design and operational considerations are discussed. The potential of the framework is illustrated through a case study building, where up to 6% annual energy savings were estimated, highlighting the effectiveness of zone closures. Further findings indicated that total energy savings from the simultaneous closure of multiple zones were marginally larger compared to savings from closing off zones individually, depending on zone capacity and use. Therefore, balanced considerations should take place prior to selecting which zones to close off, also taking into account user acceptability, capacity of systems and controls as well as the internal layout of the building. The research enhances the understanding of the relationship between occupancy and energy demand, while offering recommendations for more energy efficient and sustainable building design and operations that require minimal capital cost.
Keywords
Introduction
Buildings serve as significant contributors to global energy consumption, with building operations accounting for 26% of total global energy consumption. 1 Internationally, government policies and schemes have focused on amplifying energy efficiency to reduce carbon emissions of the buildings sector. 1 Furthermore, operational energy consumption has been identified as the predominant contributor of a building’s life cycle energy usage, accounting for 80%–90%. 2 All stakeholders in the built environment bear a collective responsibility to champion enhanced sustainability practices, particularly in the domain of operational energy consumption.
Building Energy Models (BEMs), particularly dynamic thermal simulation models, are tools for analysing energy flows, occupant behaviours and environmental interactions in buildings. 3 These models enable informed decision-making, supporting the development of operational strategies and addressing energy concerns in the built environment. They are essential instruments that allow stakeholders to gain a deeper understanding of energy dynamics within the built environment and to pave the way for more sustainable building practices.
Efficient building operations are pivotal in achieving energy reduction goals, and the integration of data-driven responsiveness holds promise in this endeavour. The incorporation of smart data-driven control systems into building operations has gained prominence, offering the potential to optimise operational strategies without affecting building occupants. The influence of occupancy on building energy consumption can be substantial, 4 motivating a focused exploration of strategies that respond operations to occupancy patterns to achieve significant energy savings. Occupancy-based climate controls were found to save energy consumption in both simulations and field experiments. 5 Accounting for occupancy patterns without architectural changes can result in energy savings with minimal financial investments. 6
This study proposes a novel operational framework and design considerations to leverage occupancy data and enhance operational energy efficiency strategies, which are adaptable to evolving occupancy patterns.
The replicable data-driven framework devised can be readily scaled and extended to different building types, providing versatile energy reduction strategies without requiring significant physical retrofits. The research offers actionable recommendations for sustainable operational practices in non-domestic buildings, addressing a major source of global carbon emissions.
Methodology
This section illustrates the framework devised for the development of occupancy-driven energy demand reduction strategies. Its implementation is demonstrated and discussed through a case study building.
The framework
The framework devised consists of three main stages: assessment of occupancy patterns and space usage; implementation and calibration of a baseline model to assess the energy demand of the building in object; and development of occupancy-driven operational strategies to reduce energy demand at periods of low usage. The input data and workflow are summarised in Figure 1. Methodology overview of the framework devised and workflow.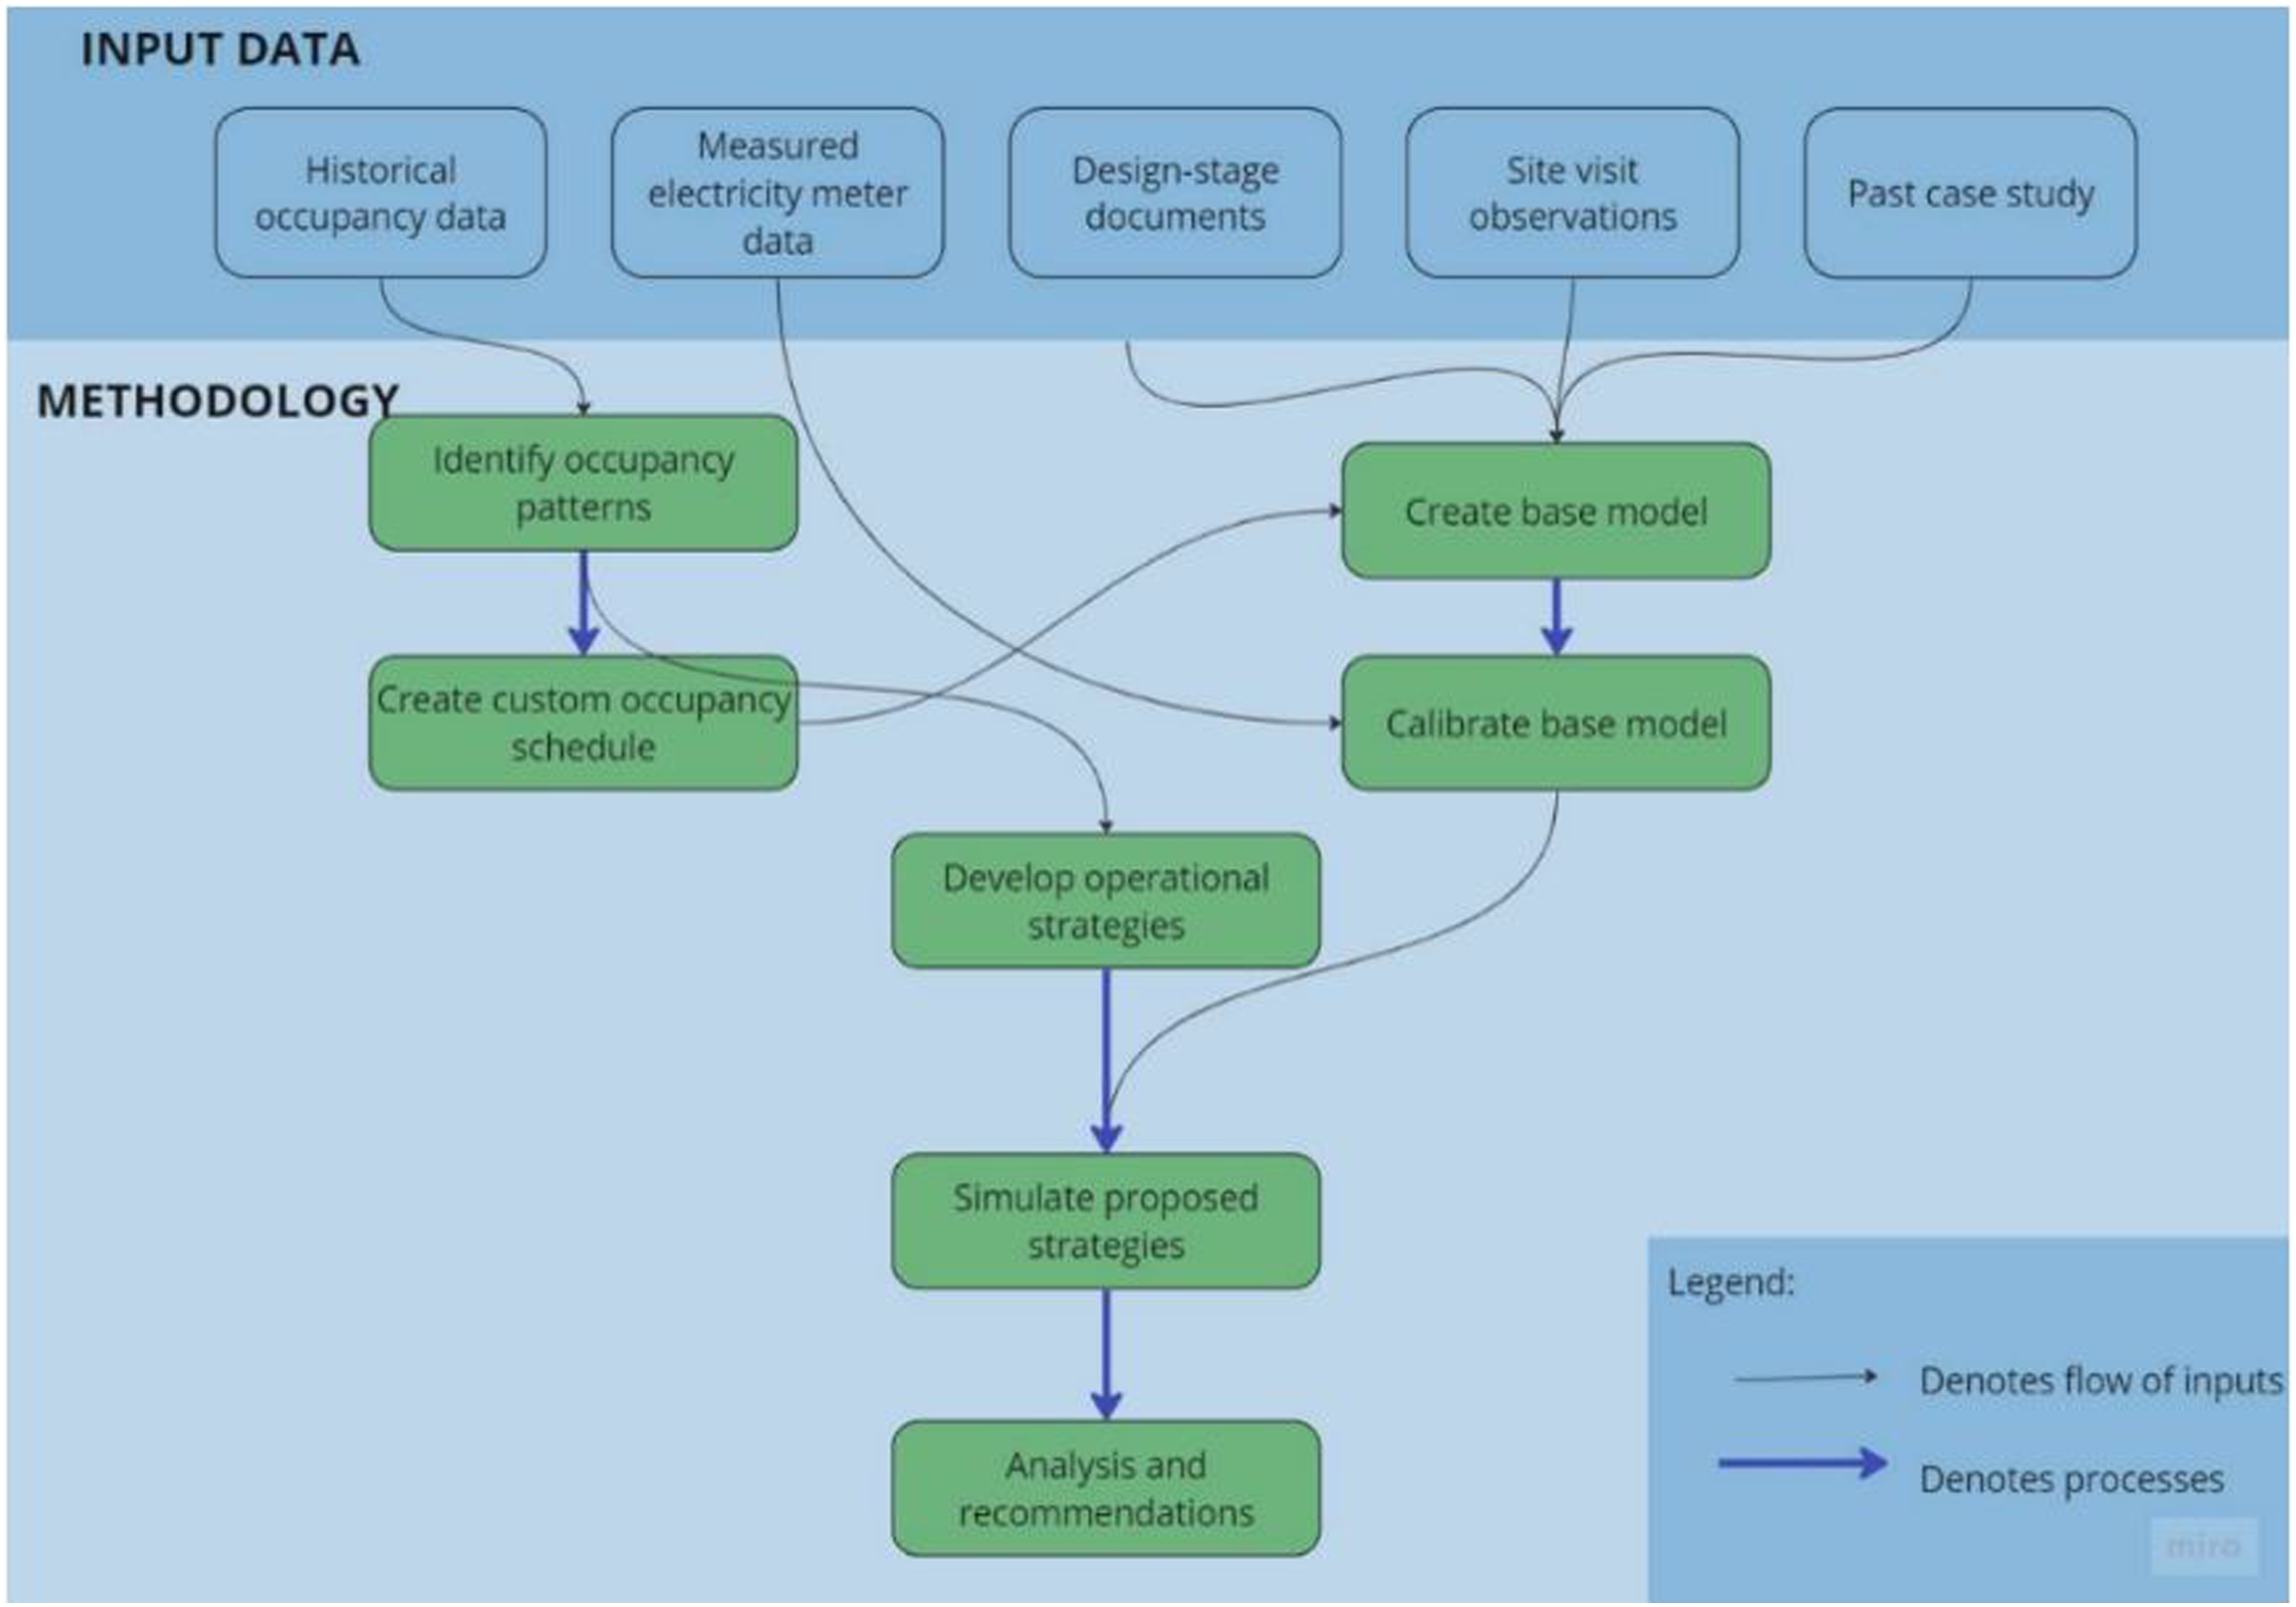
Data collection and pre-processing: The data required for this work include hourly measured occupancy, hourly measured energy demand as well as building-related information to develop a detailed dynamic thermal model (e.g., external and detailed internal geometry, fabric, systems, controls, equipment). Occupancy data serve multiple purposes, including understanding occupancy patterns, informing energy model inputs for occupancy schedules, and shaping proposed operational strategies. Measured energy data are used to calibrate the energy model of the building.
Modelling and calibration: The modelling process starts with the creation of a baseline model using the building-related information available. Subsequently, a calibration procedure is applied to the baseline model to minimise the discrepancy between the model’s energy demand prediction and the actual metered data. The calibrated model is then used to simulate a variety of operational-strategies scenarios, enabling subsequent detailed analysis.
Operational strategies formulation: Operational strategies are formulated by understanding the building usage and identifying periods of low occupancy where specific floors and/or zones can be closed during designated timeframes. This analysis aims at consolidating occupancy into smaller operational areas - potentially reducing energy demand - and adopting a more responsive operation of the building during periods of lower occupancy - enhancing efficiency. Careful consideration to the design and operational features of the building in object is necessary to guide the decision-making process and devise strategies that can be effectively implemented with minimum effort.
Experimental methodology
Case study building
The case study building is a large educational building in London
7
(United Kingdom), consisting of four floors above ground and two basement levels and spanning 5400 m2 (Figure 2). The building is operational 24/7 throughout the year and it accommodates individual and group study spaces, a café and staff offices. The building attained an Energy Performance Certificate (EPC) rating of “A” in 2018 and adopts a “passive-first” design approach which uses efficient fabric materials, thermal mass and natural ventilation when possible.
7
External view of the case study building in modelling environment.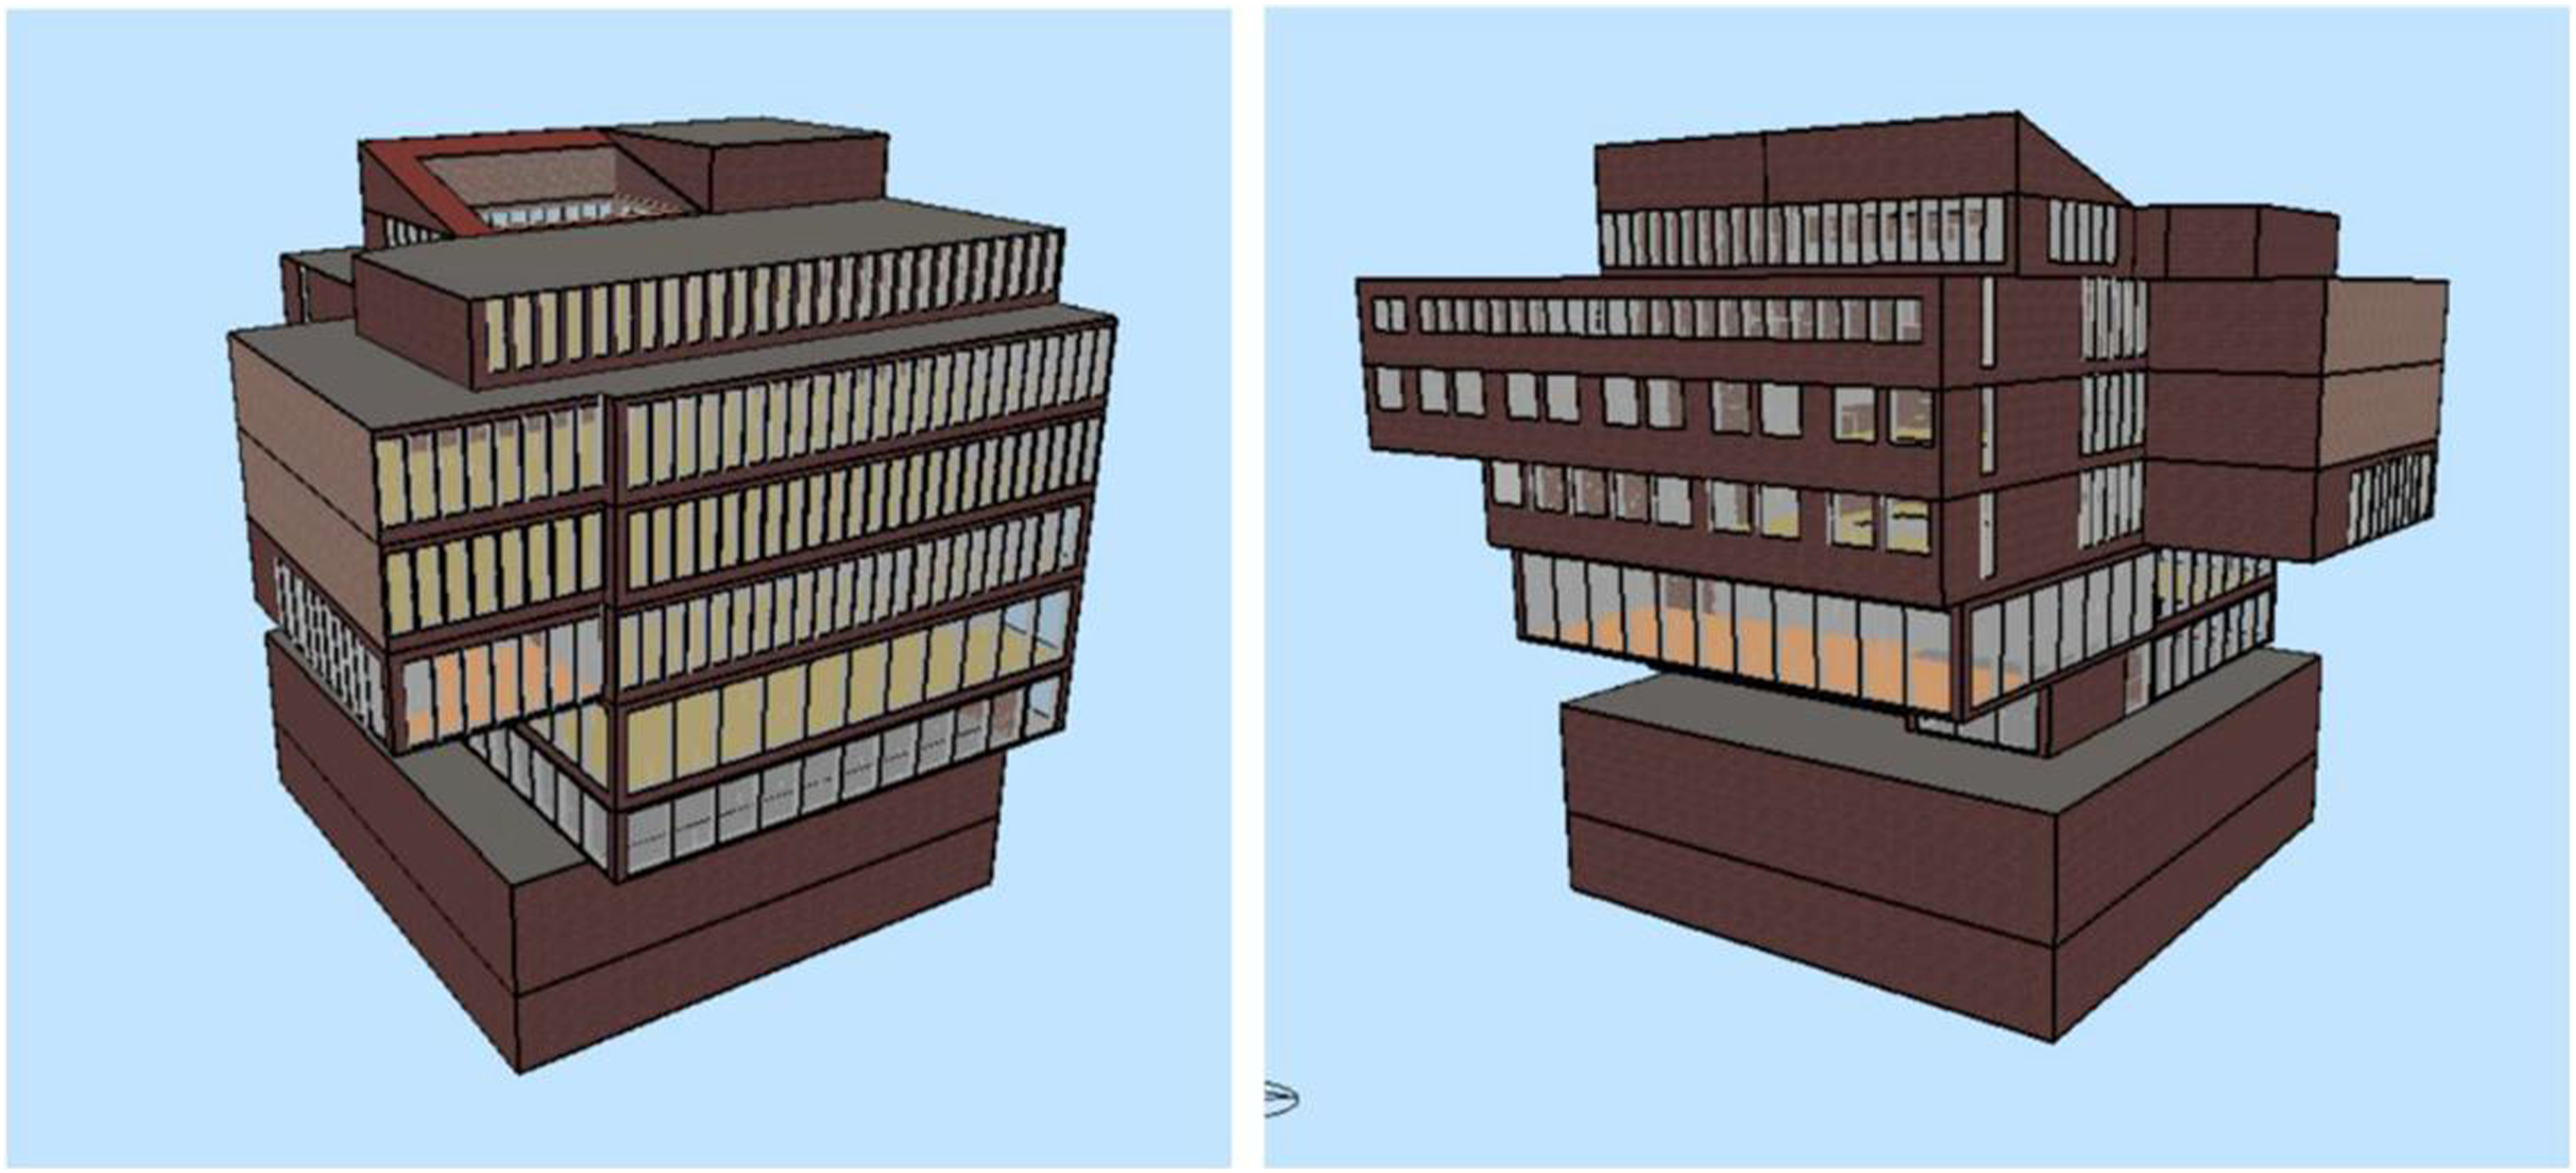
The building design and layout is notably complex. It presents a mixed variety of heating, ventilation and air conditioning (HVAC) configurations throughout. While the HVAC system is electrically powered with ground-source heat pumps, the domestic hot water supply is separately sourced from a district heating system. Additionally, the presence of a central atrium void, spanning from the ground floor to the main roof skylight, introduces intricacies in managing the building’s HVAC requirements. There are some entire zones on the first and second floors directly exposed to this atrium void.
The building design features operable window openings to enable for natural ventilation when outdoor temperatures allow. One of the most significant operational alterations from design intentions is the use of temperature sensors for HVAC control, departing from the originally intended carbon dioxide sensor-based system.
The building’s design does not include occupant controls as the lighting, windows and HVAC are centrally managed, as with many non-domestic buildings in the UK. This makes the building suitable for testing the framework devised examining how operational strategies can be responsive to occupancy patterns.
Data collection and pre-processing
The information required to implement the proposed framework on the case study building were retrieved from a number of resources. Data from the full calendar year of 2022 were selected due to completeness and up-to-date nature of the sources.
Building data: Design-stage drawings and documents were used to model the building geometry, interior layouts, HVAC systems, construction materials and their U-values.7,8 Valuable insights with regards to HVAC operations and the energy-use breakdown were also drawn from a prior case study. 9
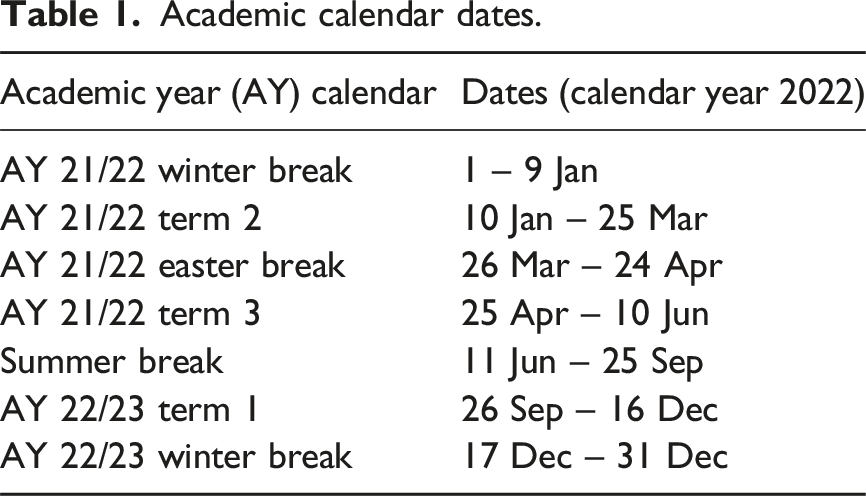
Academic calendar dates.
Subsequently, occupancy data were mapped against seats location in the building to identify zones with reduced occupancy at specific time of the year. This informed the occupancy-based optimisation, which aimed at closing off zones to minimise energy demand.
Energy consumption data: Metered energy data and daily main meter electricity consumption were extracted from the university building management systems 12 (BMS). This did not include the hot water consumption which is separately supplied through a district heating network. Notably, submeter and system-level data were unavailable.
Climate data: A weather file featuring the actual 2022 weather conditions of the area surrounding the case study building was utilised, courtesy of the DesignBuilder Climate Analytics platform. 13
Baseline model
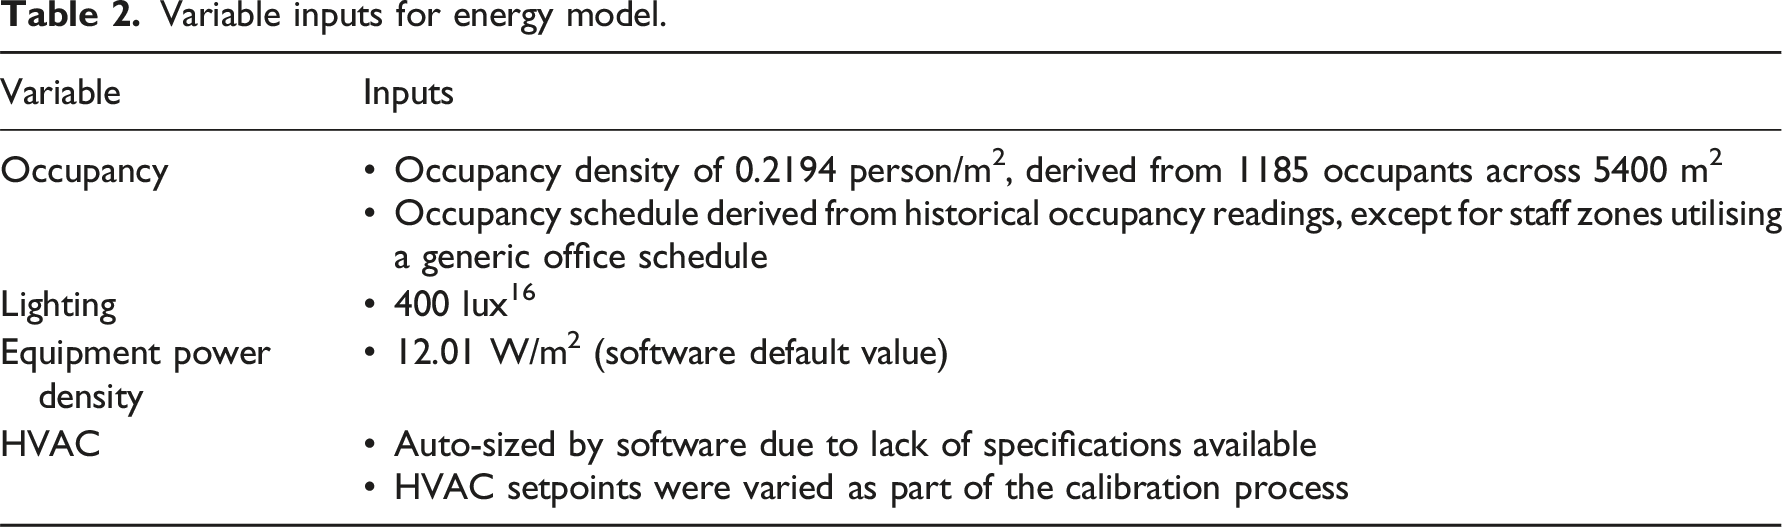
Variable inputs for energy model.
Model calibration
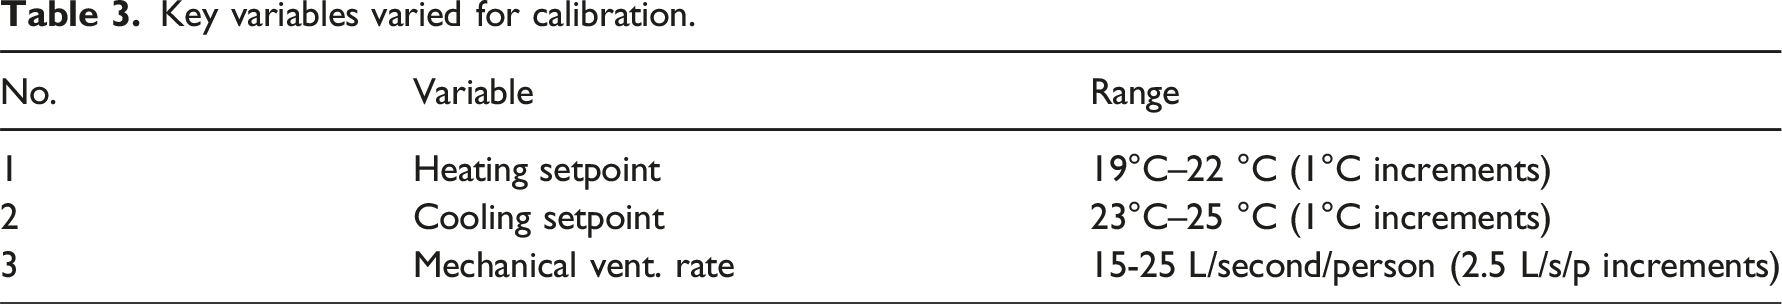
Key variables varied for calibration.
Development of modelling scenarios
Two periods of low occupancy were identified in the case study data from the occupancy analysis and were used to model operational scenarios aiming at closing off specific floors/zones in certain periods and concentrating the users in other areas. Specifically, these periods were a long period of low occupancy (15 May - 02 Oct 2022) and regular short periods of low occupancy (i.e. weekends throughout the year).
In the proposed strategy, occupancy count is maintained but redistributed across areas of the building that are operational and not closed. Occupancy count is determined by occupancy density (person/m2) multiplied by the occupancy rate (%) and the floor area (m2) of the building/zone. The concentration of occupancy in opened areas of the building can be simulated in the energy model by increasing the occupancy density or rate. The increases of occupancy density and rate can be calculated in proportion to the closed zones’ floor area to maintain total occupancy count across the building, which correspond to the redistribution of occupants across opened areas. The closure of zones was simulated by setting their occupancy, HVAC, equipment, and lighting schedules to zero.
Operational strategies formulation
Two operational strategies were proposed, which entail the temporary closure of specific floors or zones within the case study during (1) long periods of low occupancy and (2) regular short periods of low occupancy.
Function of floors and information regarding their suitability for closure.
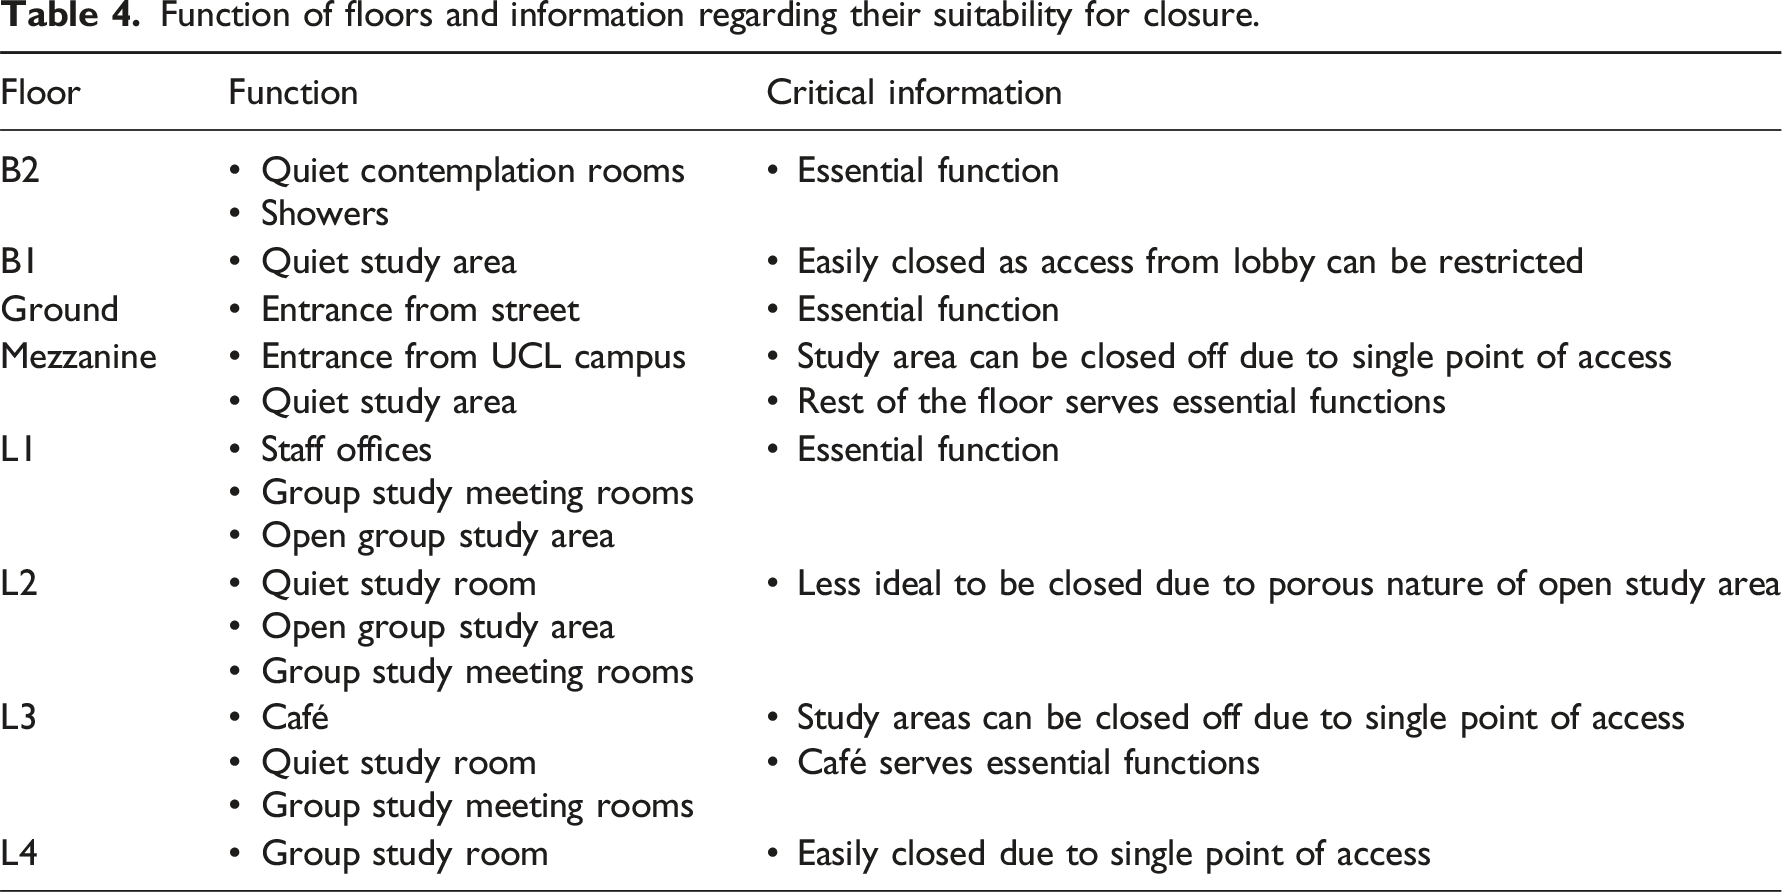
Consequently, B2 and Ground floor were excluded from the scenario modelling as they served essential functions, while L1 was omitted from the scenarios explored as it primarily comprises staff offices that are occupied throughout the year. Formulation of scenarios involving closed zones ensured that no zones within the remaining operational areas of the building would reach maximum occupancy during the simulated period, avoiding overcrowding.
Results & discussion
This section presents and discusses the implementation of the framework on the case study building and its main outcomes. A detailed analysis of the occupancy data is firstly provided, followed by a discussion of the baseline energy model simulation and calibration process. Insights from occupancy assessment are subsequently used to simulate zone closure scenarios at periods of low occupancy to maximise resource utilisation and achieve energy demand reduction. Design guidelines and recommendations are provided to guide the decision-making process and ensure that effective strategies can be implemented with minimum effort.
Occupancy assessment
A key requirement of the framework is to gain a comprehensive understanding of occupancy patterns through detailed analysis of occupancy data. This serves two purposes: firstly, to create a custom occupancy schedule for input into the energy model and secondly, to explore potential avenues for energy reduction in response to occupancy dynamics.
Average hourly occupancy data were initially used to define usage patterns. The working hours observed in the case study building extend beyond the conventional 9 a.m. to 5 p.m. in the UK. A diurnal (9 a.m. to 9 p.m.) and a nocturnal (9 p.m. to 9 a.m.) slot were defined based on the typical starting time of university timetables at 9 a.m., alongside a decline in occupancy observed in the data after 9 pm.
The analysis was further extended to evaluate occupancy patterns during academic term dates, term breaks and the summer break. However, a distinct demarcation between occupancy rates during these academic periods was not clear (Figure 3). Daily occupancy with academic term dates before clustering.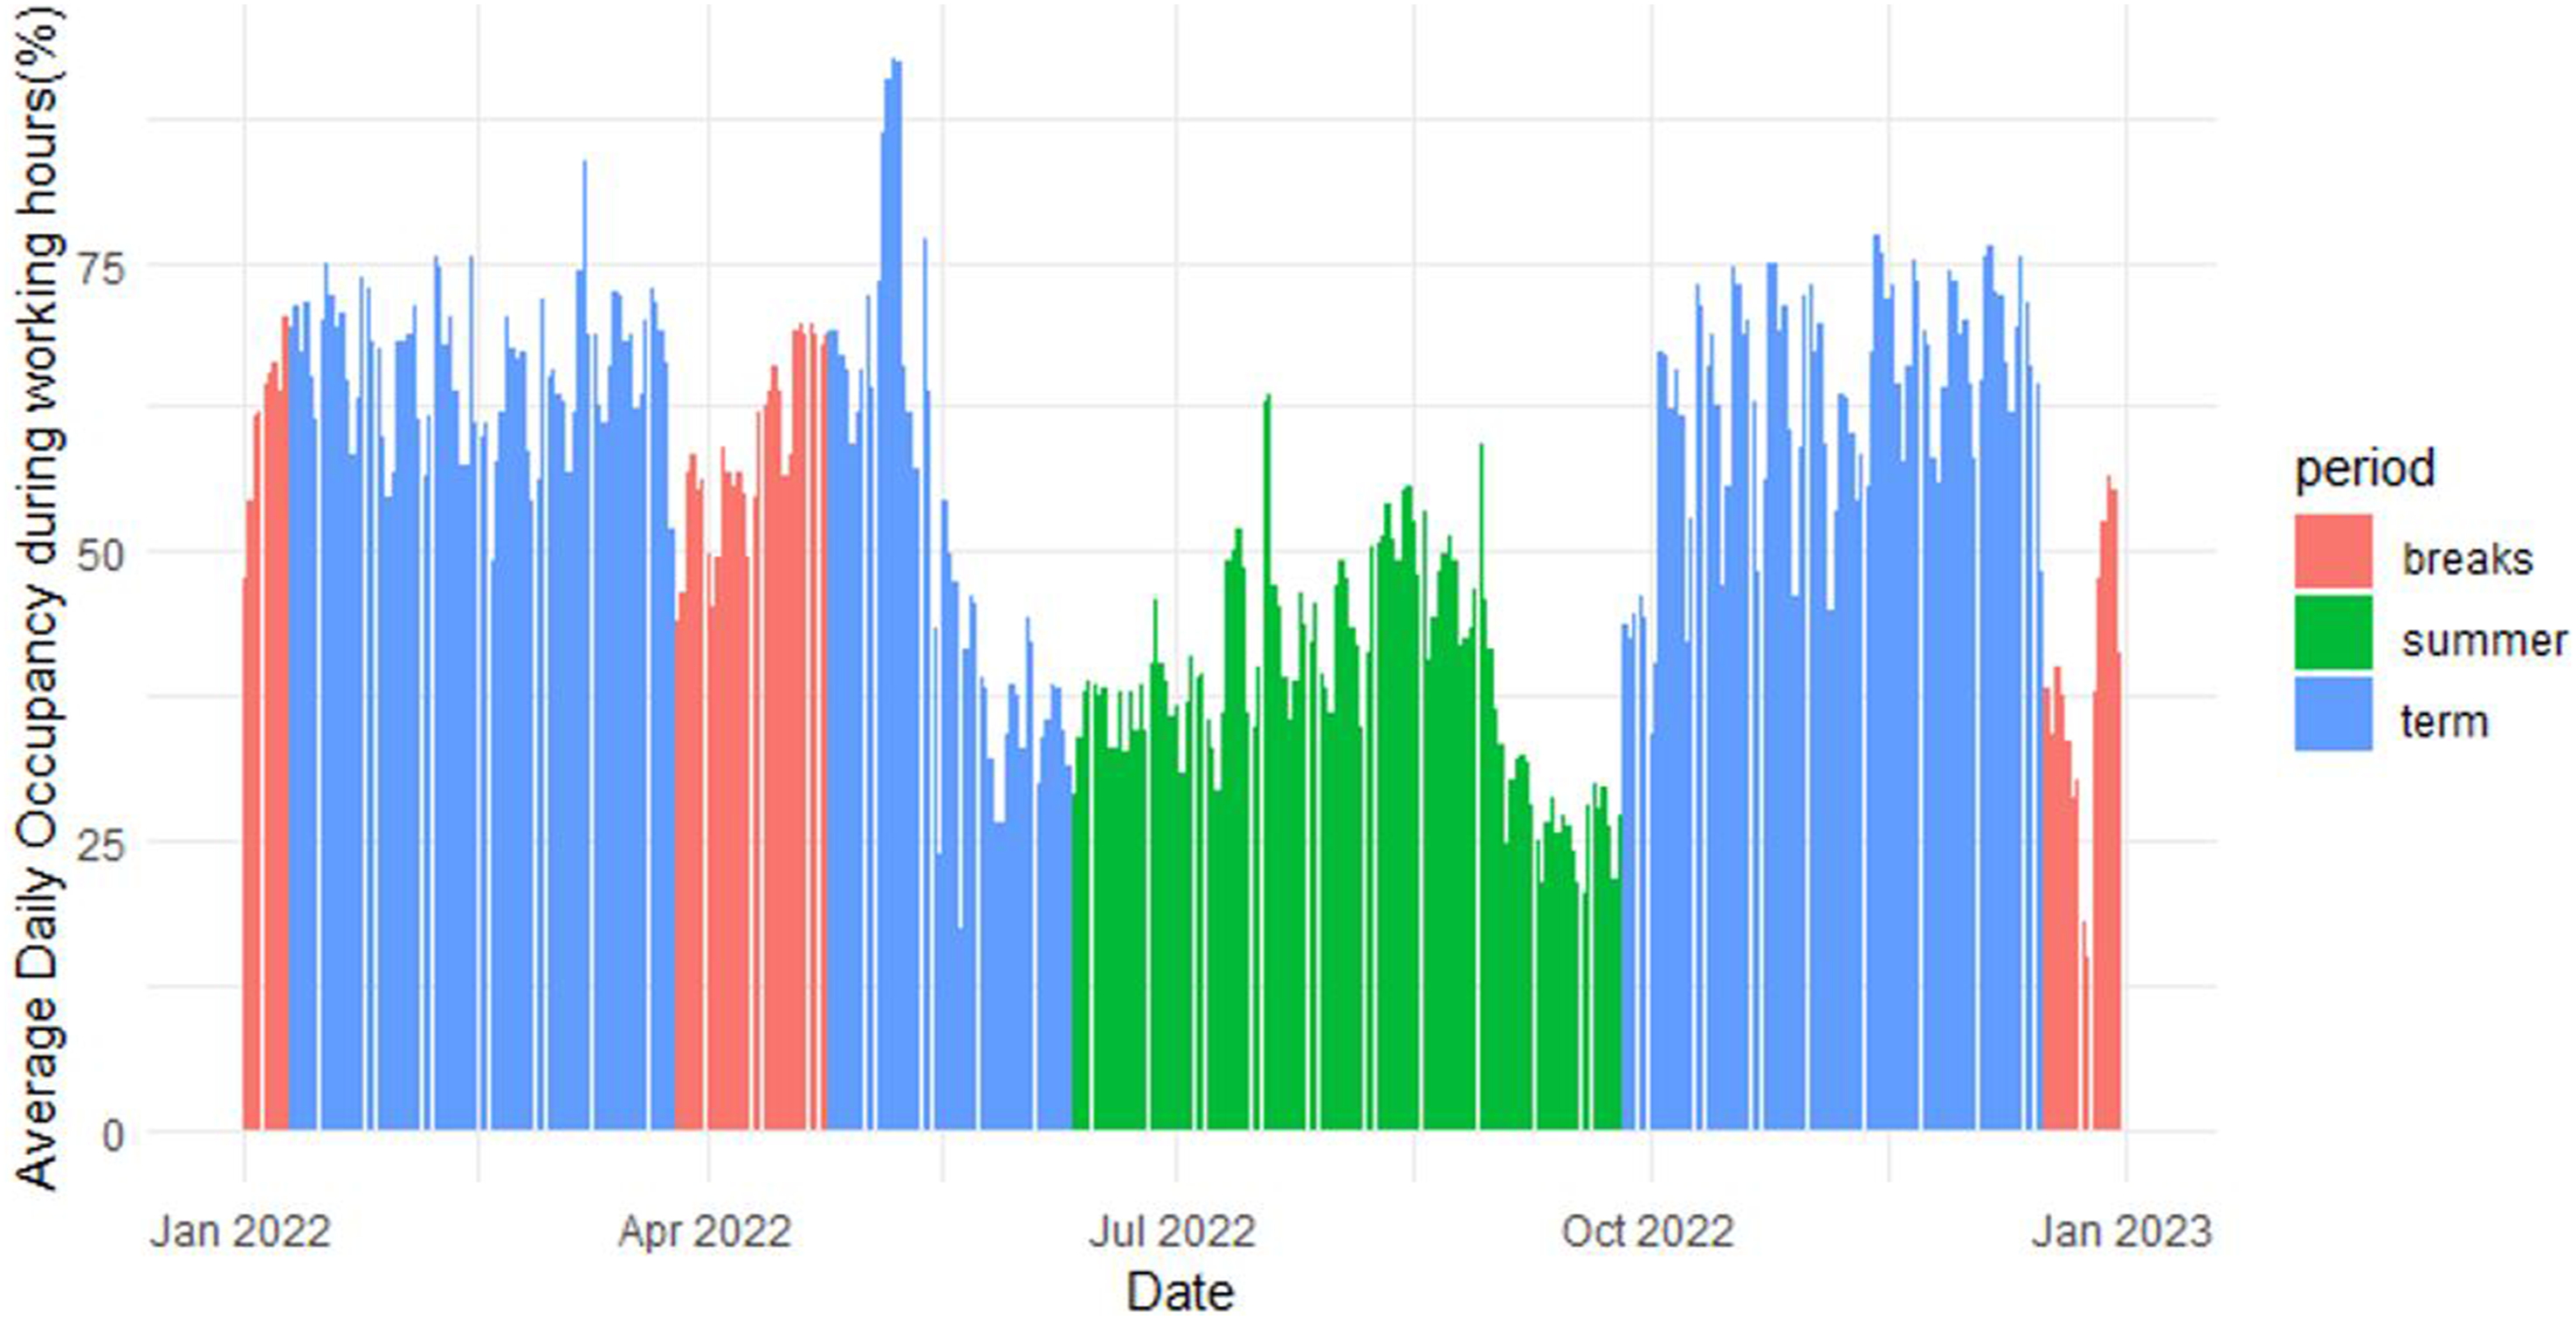
Thus, a k-means clustering algorithm
11
was used to identify periods with notably different occupancy rates. The outcome yielded two distinct clusters of dates (Figure 4), which are subsequently indicated as “low-occupancy” in red bars (between 15 May to 02 October 2022) and “high-occupancy” in green bars (for the rest of the year). Daily occupancy after clustering analysis (low-occupancy: red bars, high-occupancy: green bars).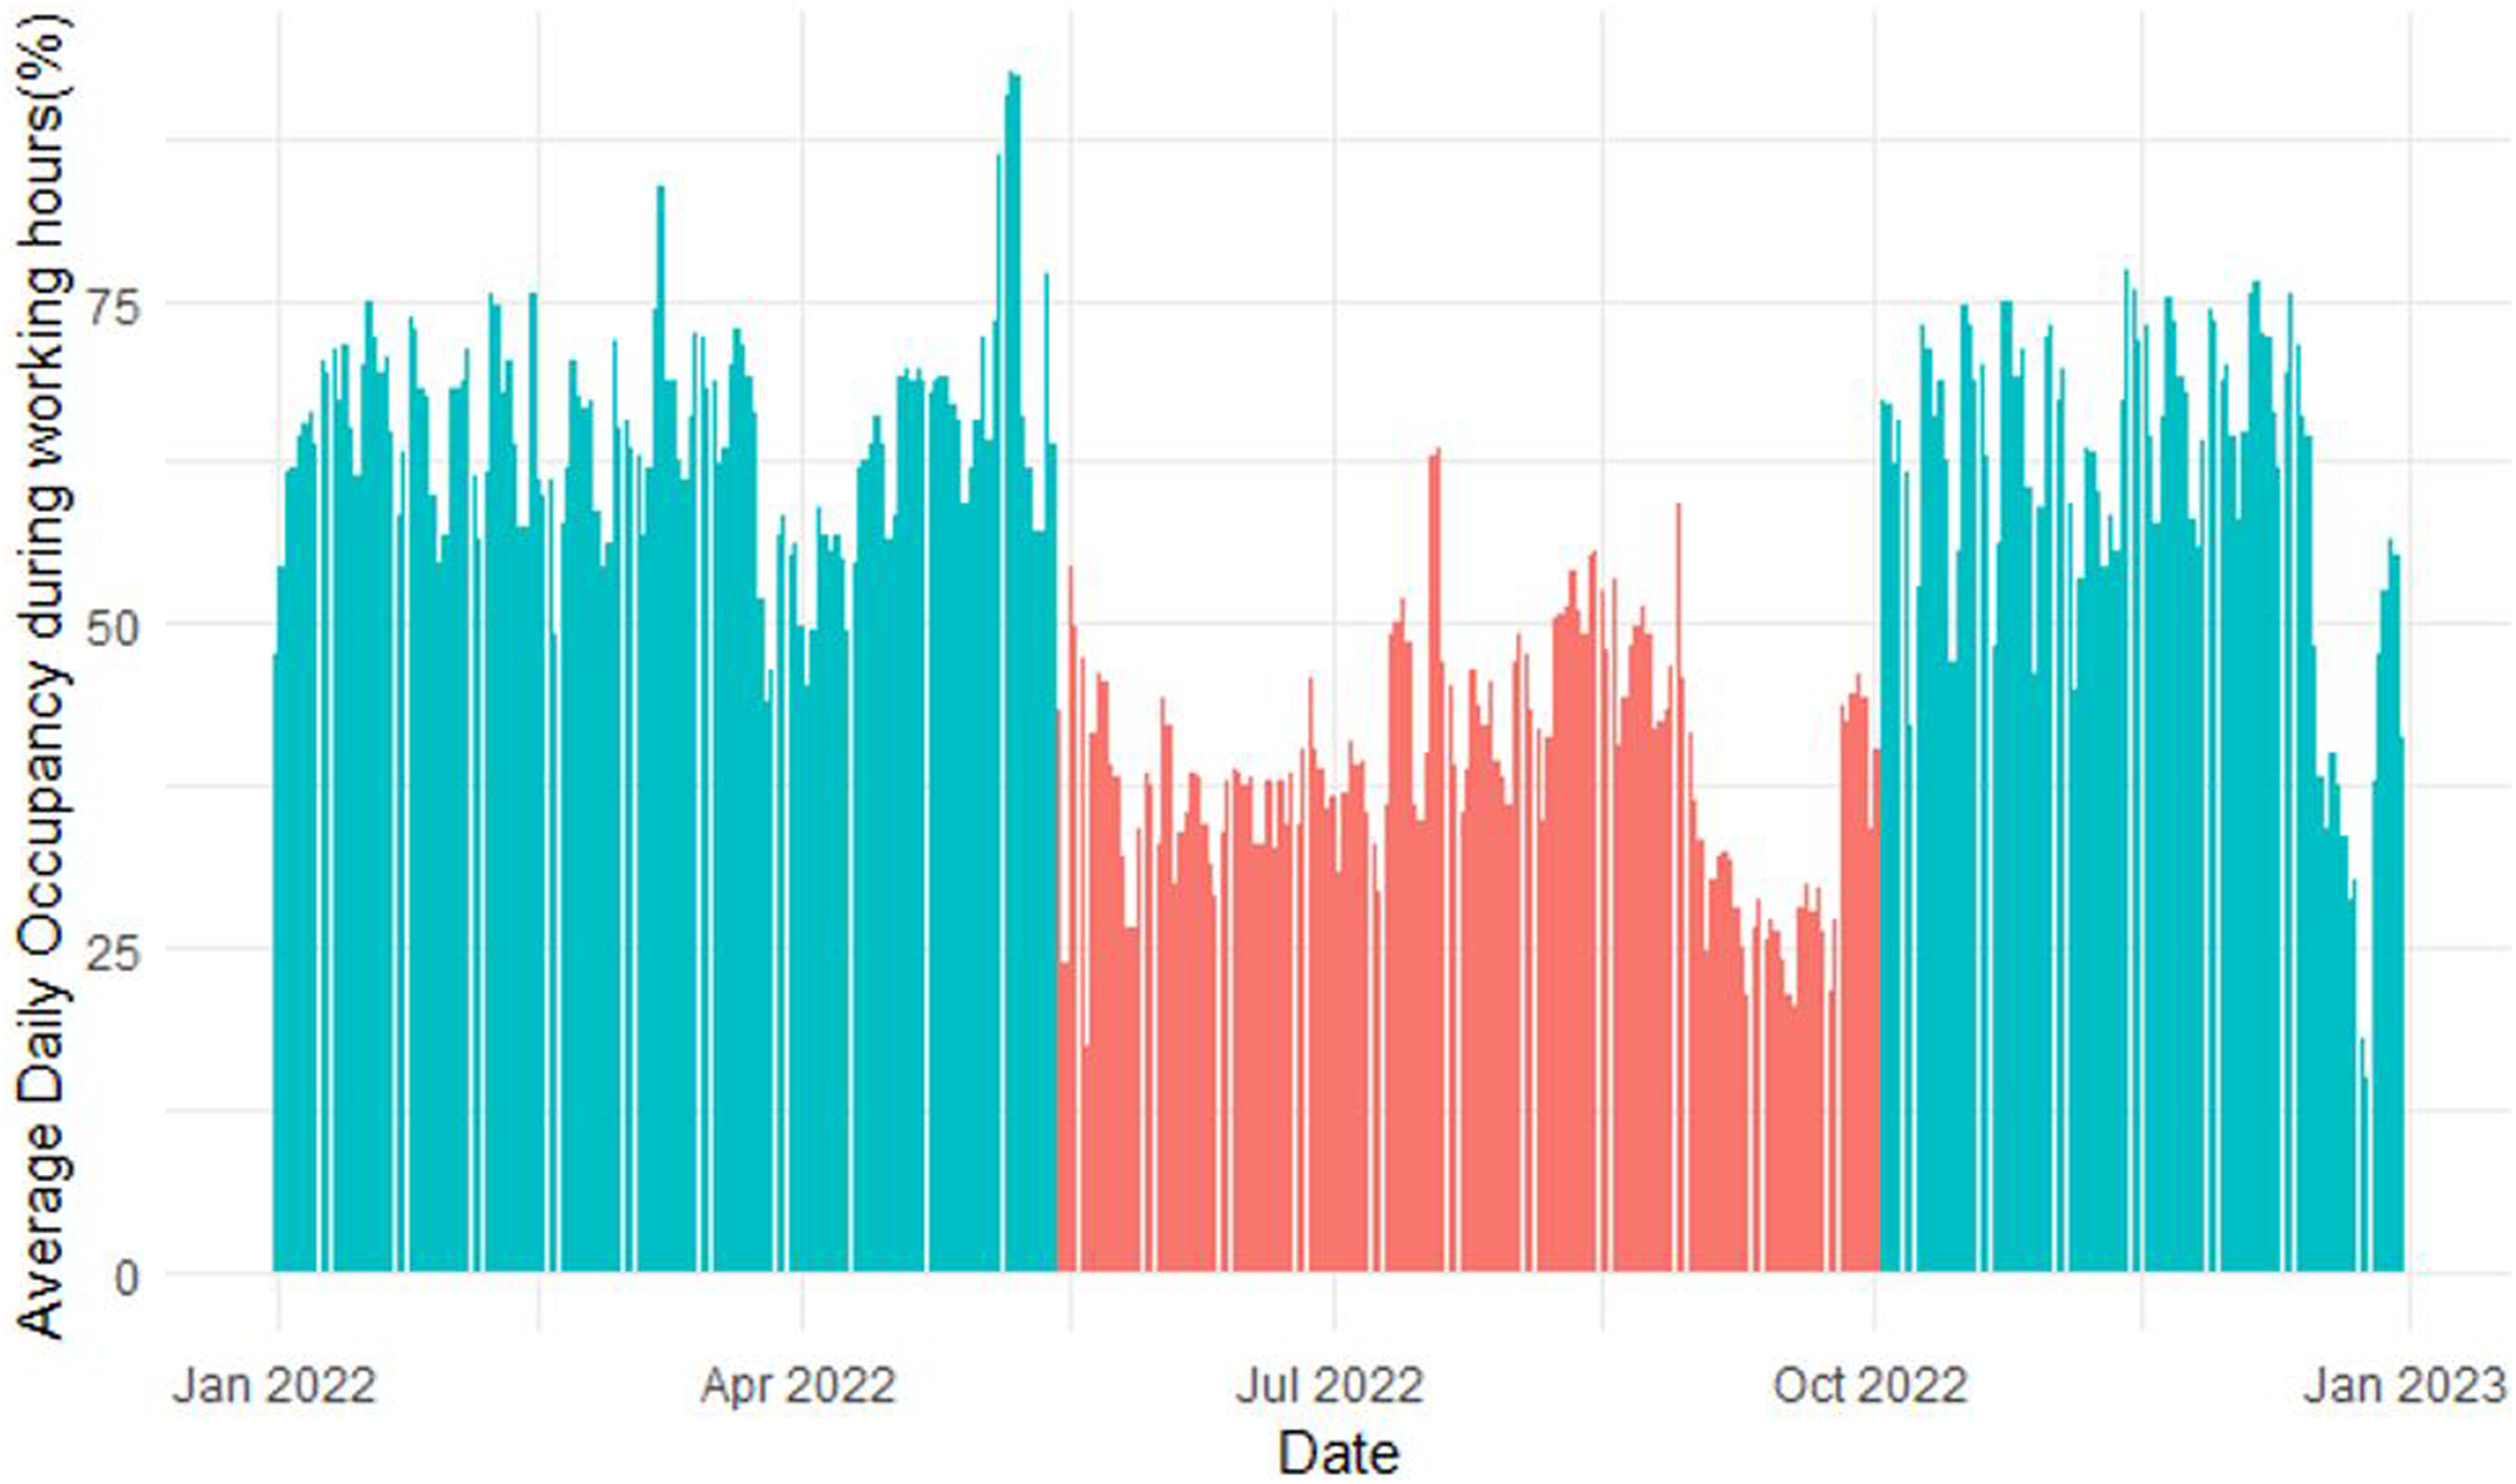
Custom occupancy schedule for the case study building.
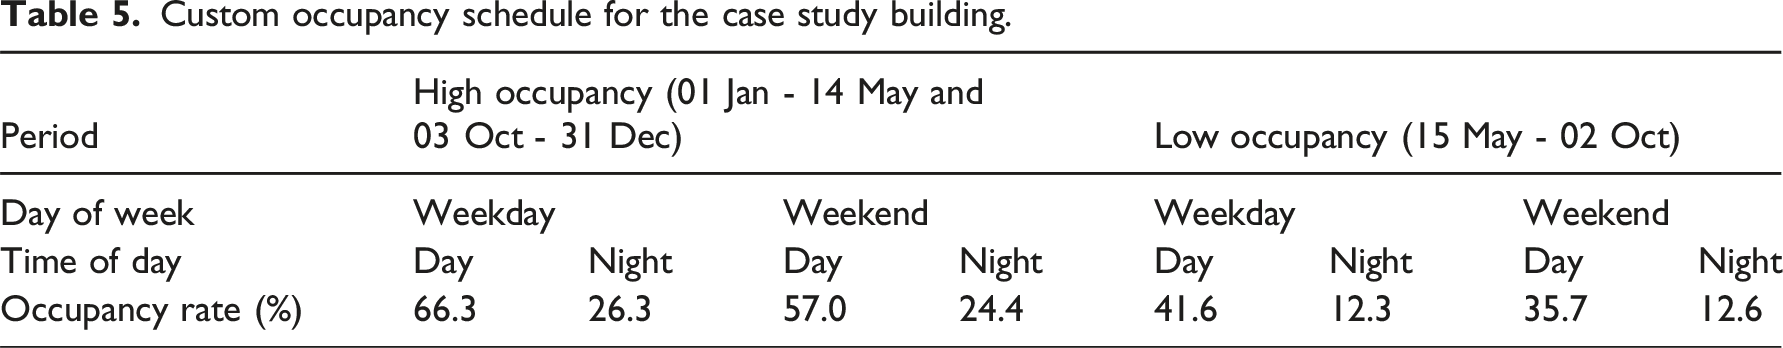
For an energy demand reduction target to be successful, minimising disruption to space occupants is essential; therefore, utilising the periods of low occupancy was preferred to demonstrate the viability of the proposed occupancy-based optimisation scenarios. In addition, periods of lower occupancy present greater potential for redistributing users in space so that certain zones can be empty and therefore be viably closed off.
The low occupancy periods examined in this work were split in two distinct sections: a longer period of low occupancy (the one outside term times) and a set of regular shorter periods of low occupancy (the weekends). While the occupancy rates did not strictly adhere to the academic dates as the low occupancy period overlapped with Term three dates, the low occupancy cluster is in line with an expected decline in presence around campus between mid-May (when most students may be done with final exams) and beginning of October (when the new academic year starts). Despite the absence of academic activities during the weekends and hence an expectation of a lower occupancy rate compared to weekdays, the reduction in occupancy was only around 15%. The occupancy analysis highlighted that field measurements may differ greatly from default values 4 therefore enhancing the importance of adapting model inputs to specific building attributes.
Case study simulation
Highest performing calibration results compared against ASHRAE Guideline 14 19 thresholds.
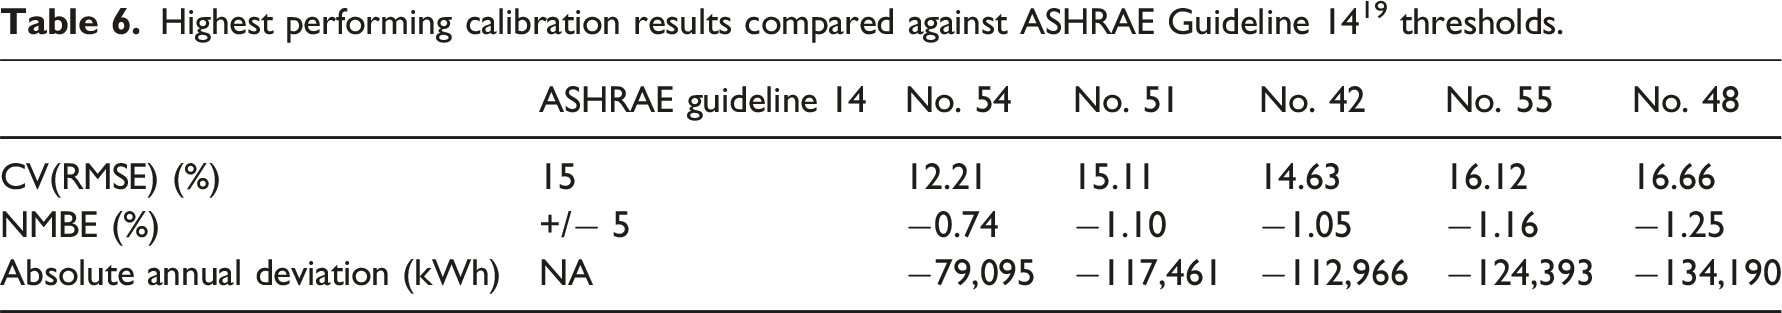
The energy demand results from the highest performing iterations (Figure 5) generally follow the overall trend of the metered data, closely aligning with it in the earlier months of the year and displaying a larger deviation in the second half of the year. Besides the complexities of the building itself that may have introduced sources of uncertainties in the model and contributed to this phenomenon, several factors could be responsible for this discrepancy including outdoor air temperature changes, heating/cooling seasonality, occupancy variations. It is also likely that the operations of the case study building might have undergone changes at some points during 2022, such as decreasing ventilation rates due to uplifting of COVID-19 restrictions or implementing energy-efficiency related strategies. This could account for the divergence from the modelled pattern towards the end of the year. While the calibration process yielded outputs that aligned well with ASHRAE standards, it is crucial to acknowledge that identifying parameter combinations leading to a good fit with observed data may not necessarily guarantee an accurate representation of reality.
20
Monthly energy demand of calibration iterations.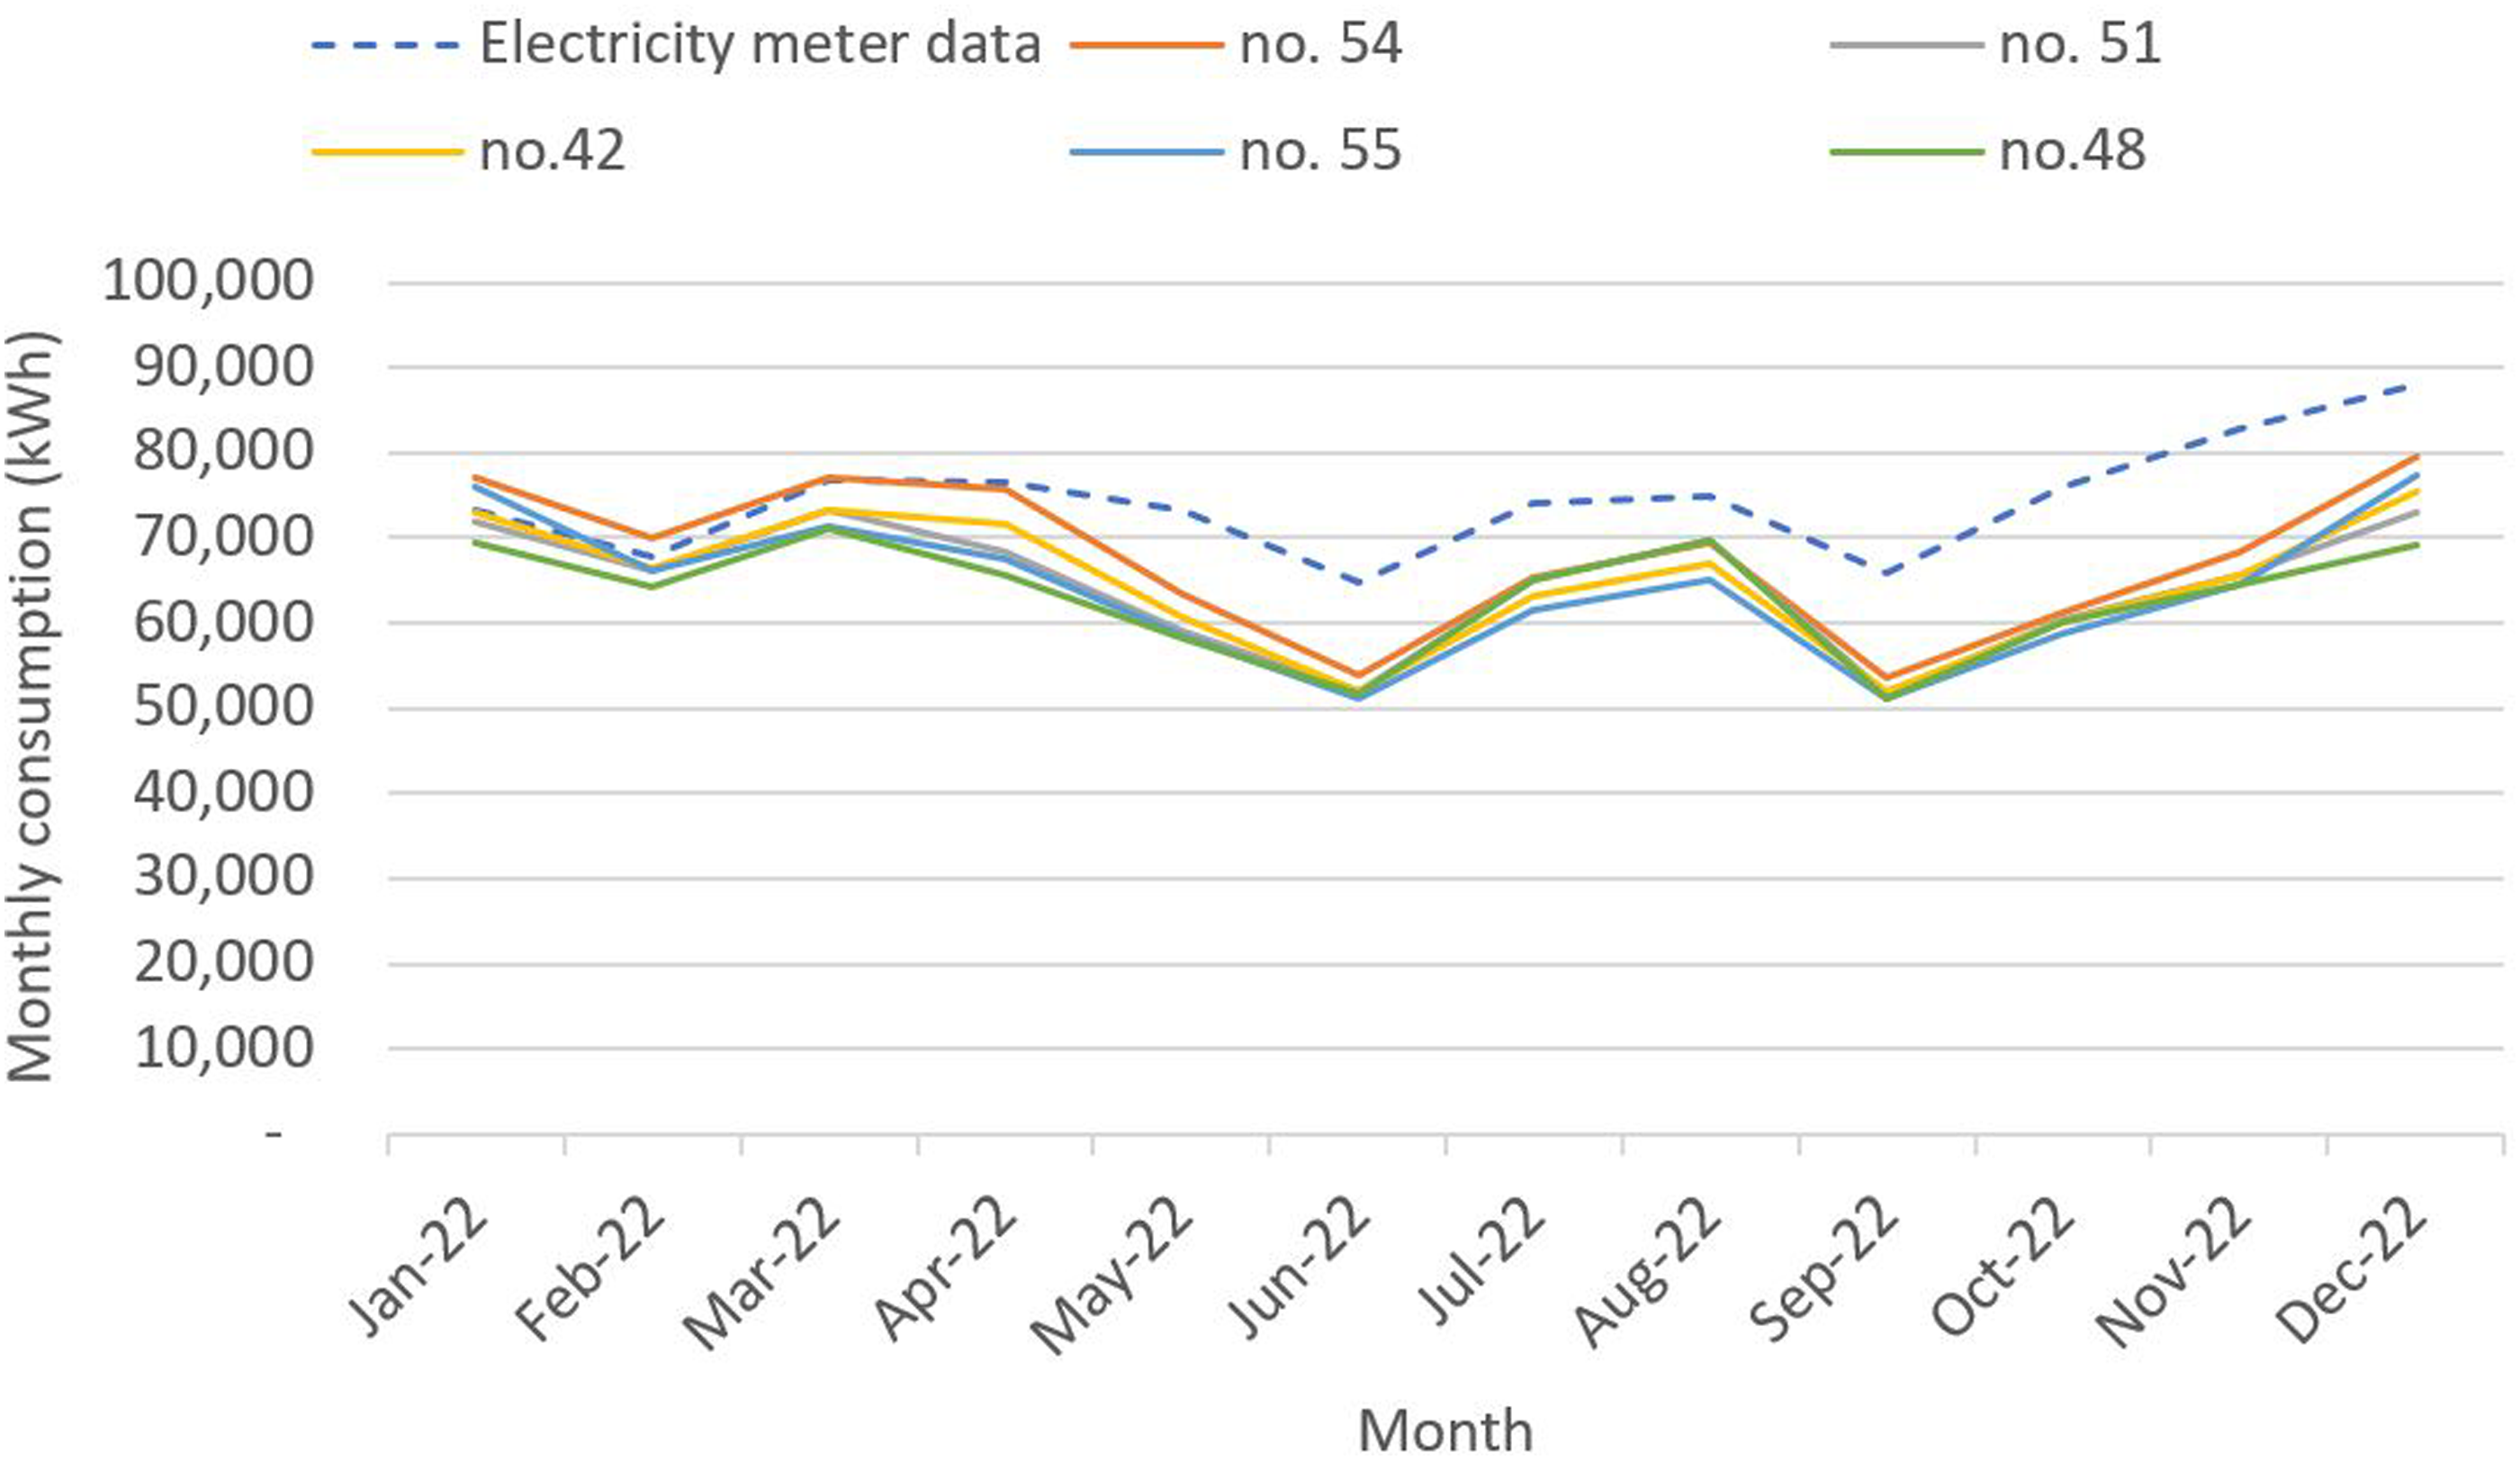
The breakdown of the simulated system loads and total monthly energy consumption for the calibrated model (selected as iteration 54) are presented in Figure 6. The distinctive patterns of heating and cooling seasons can be observed, with cooling peaking during the summer months and heating peaking during winter. The equipment loads reflect a reduction during low occupancy months as informed by the custom occupancy schedule, reinforcing the interplay between occupancy patterns and energy usage. Monthly electricity load breakdown for the case study building for 2022.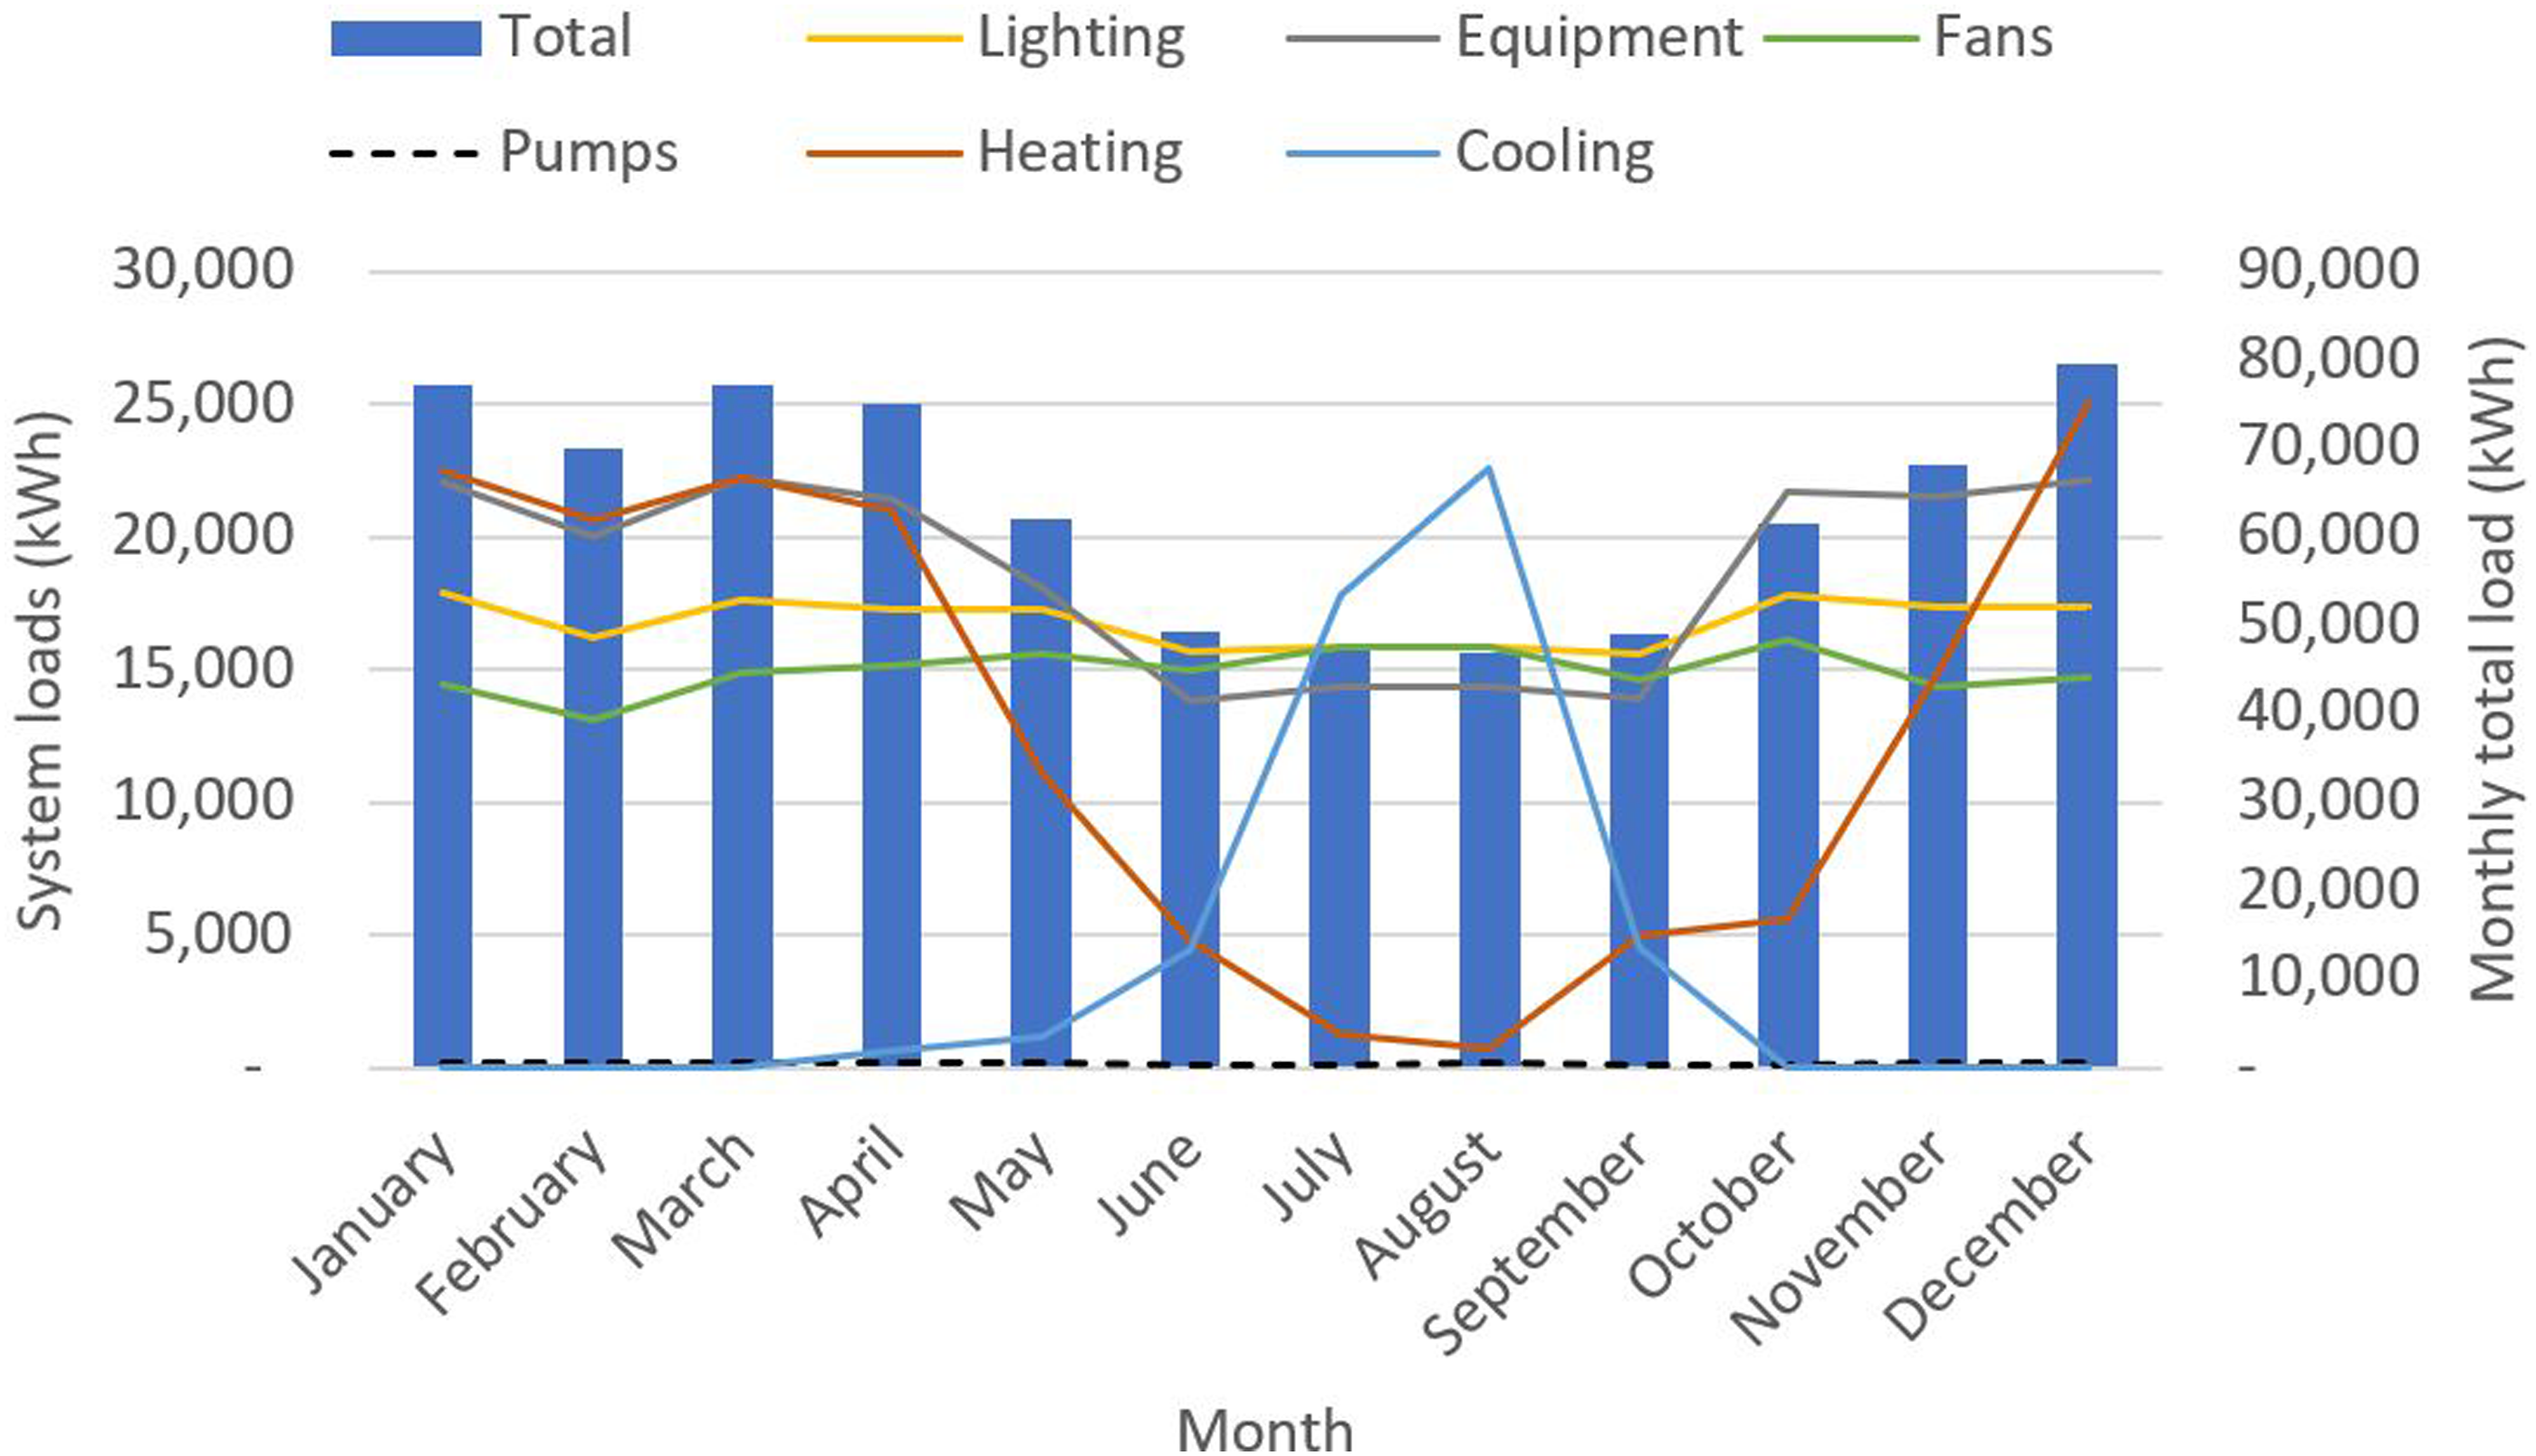
Lighting loads represent a substantial 25% share of annual energy consumption, while equipment usage contributes to 28% of the overall consumption (Figure 7). The remaining portion is predominantly allocated to HVAC operation, particularly ventilation and heating systems. The notable prominence of lighting load can be attributed to the building’s 24/7 operations. Annual breakdown of system load.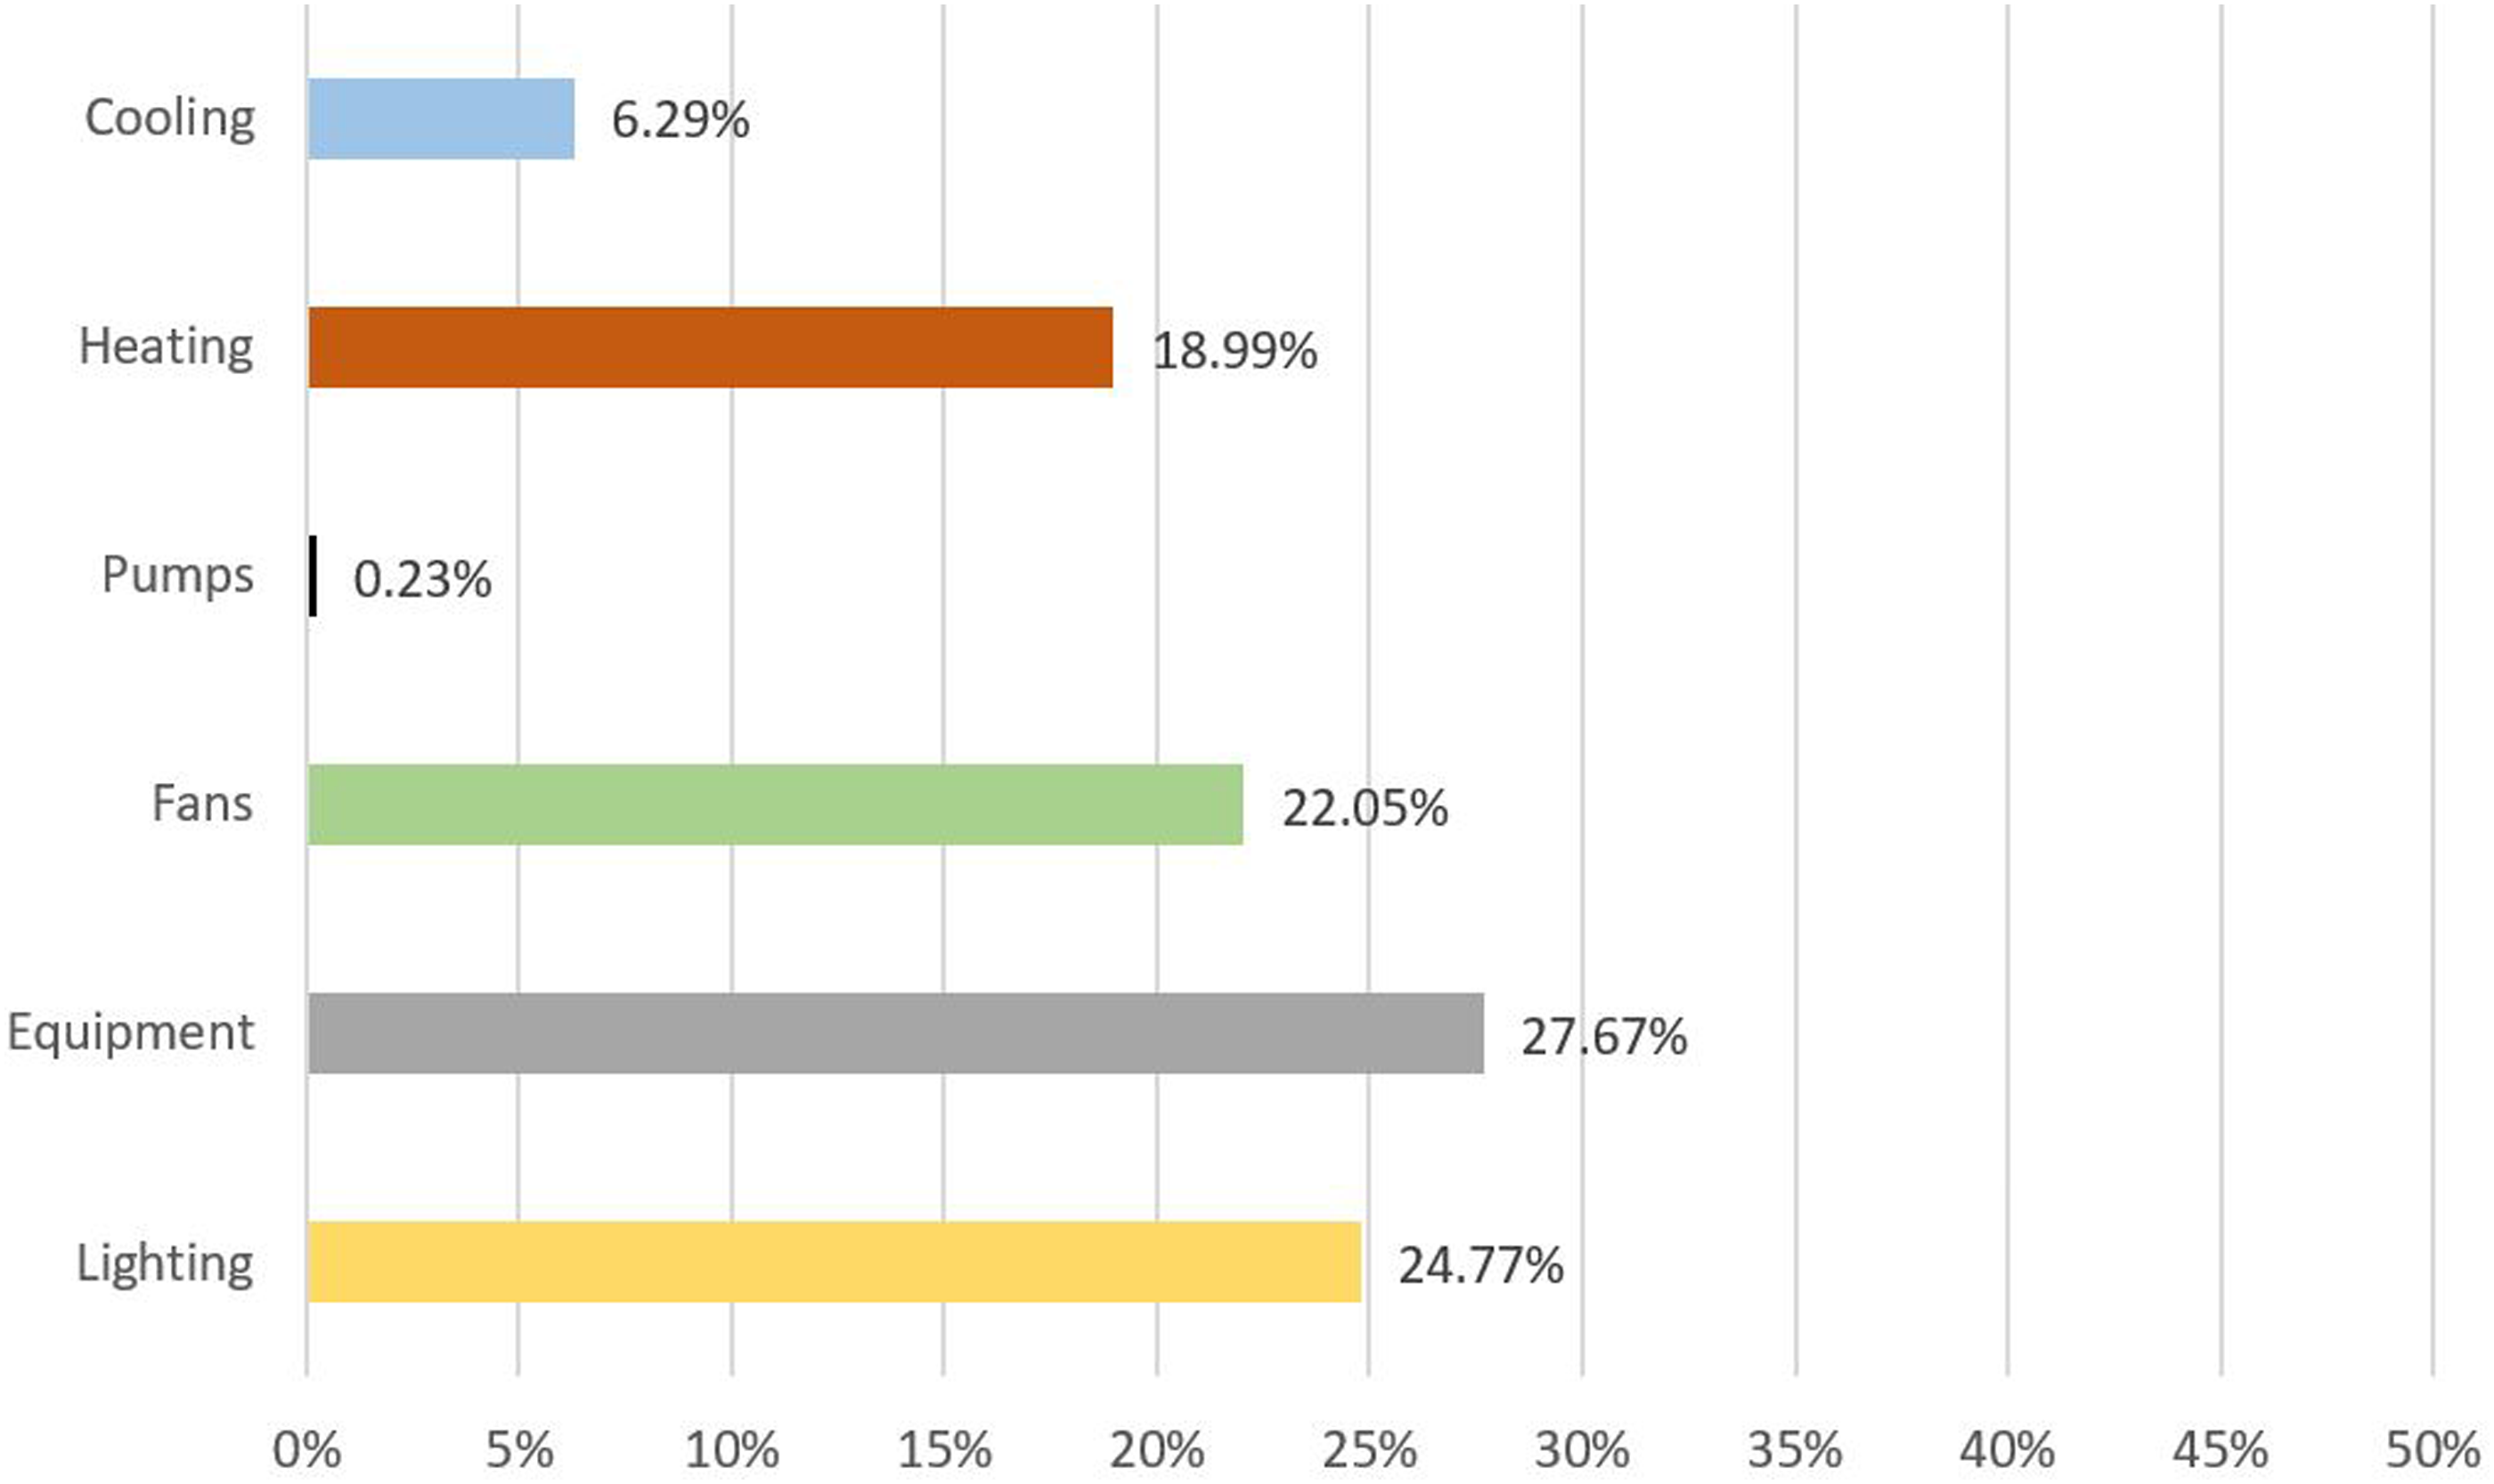
Given the absence of submeter data, calibration could not be performed based on individual system loads. Thus, it is possible that while the overall energy demand may exhibit close correspondence with actual values, the distribution of system loads within the model may deviate from reality to some extent.
Operational scenarios assessment
For both low occupancy periods identified (long and regular short), simulations of zone closure scenarios for five individual floors were carried out. Then, the best-performing scenario was combined with the second and third best-performing individually, to create new scenarios of two closed floors each. This aimed at assessing the performance of simultaneously closing multiple floors. In total, seven zone closure scenarios consisting of five individual floors and two combined floors were carried out for each period using the calibrated model. The simulations for the long period of low occupancy were analysed for 140 days (15 May - 02 October 2022), whereas the simulations for the regular short periods of low occupancy encompassed 104 days in total (all weekends throughout the year).
Results for energy demand reduction for the zone closure scenarios during the long period of low occupancy (in ranking order).
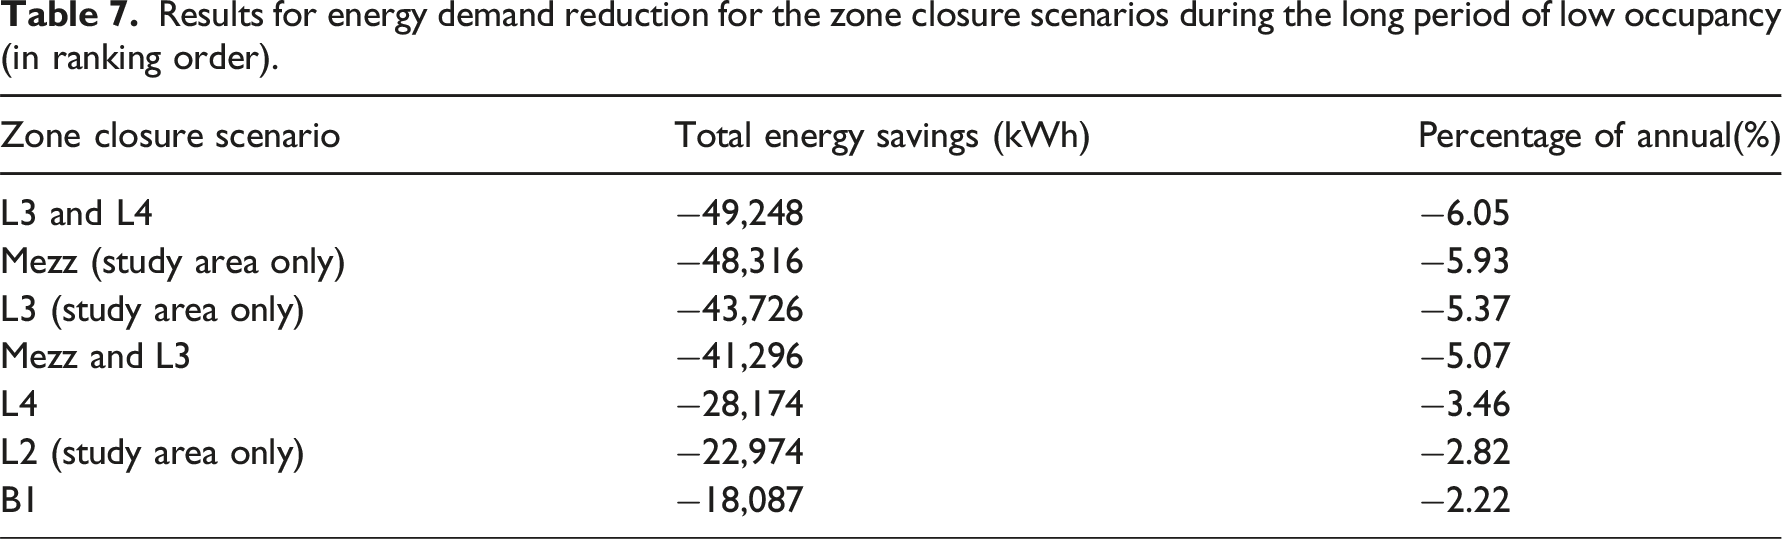
Figure 8 shows the breakdown of energy savings for each zone closure scenario, highlighting that the majority of savings are from lighting and cooling loads. Notably, the savings in lighting loads are substantial, which may be attributed to how occupancy is reassigned to spaces that are already illuminated, translating into absolute savings. Load breakdown of energy demand reduction for zone closure scenarios during the long period of low occupancy.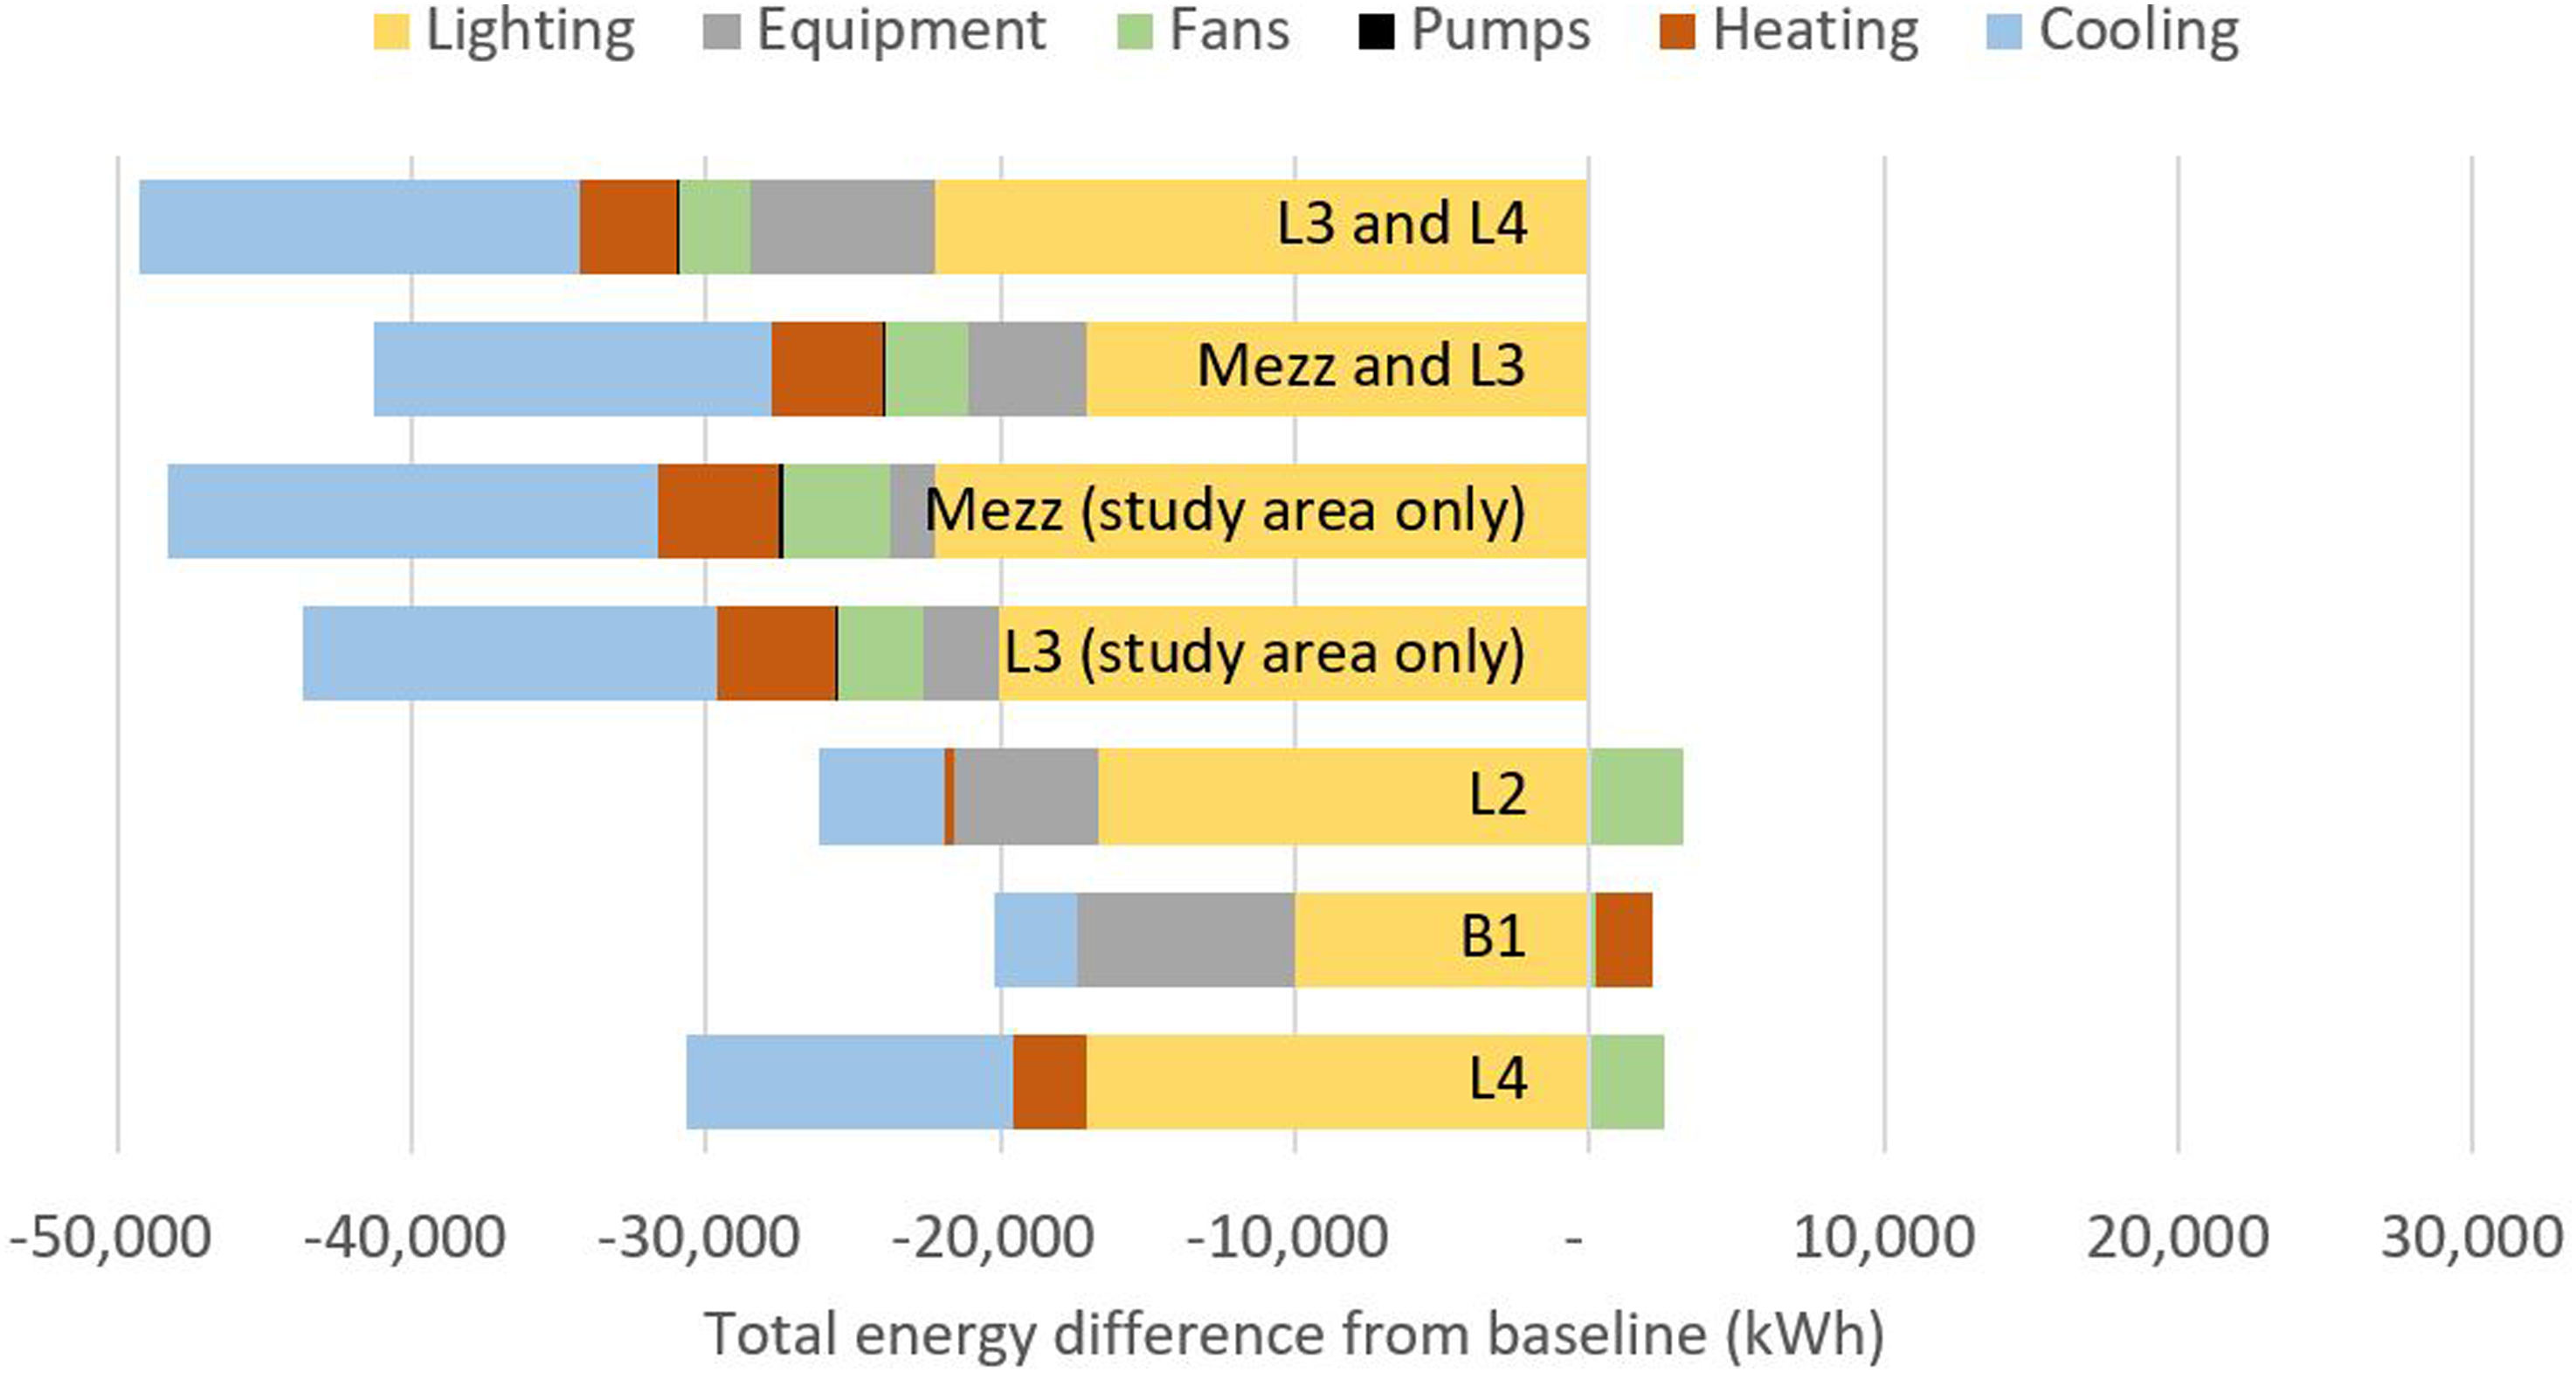
The cooling load savings are particularly pronounced during the summer months when cooling demand is dominant. The comparison between the monthly consumption of the fully operational building and the zone closure scenarios (Figure 9) shows that the most significant savings are evident in July and August across all scenarios, aligning with the months of peak cooling load for the building as a whole. Since the model underestimates energy consumption by approximately 14% for the months between May to October, the energy savings of these scenarios could potentially be higher in absolute terms. Monthly consumption for zone closure scenarios during long period of low occupancy.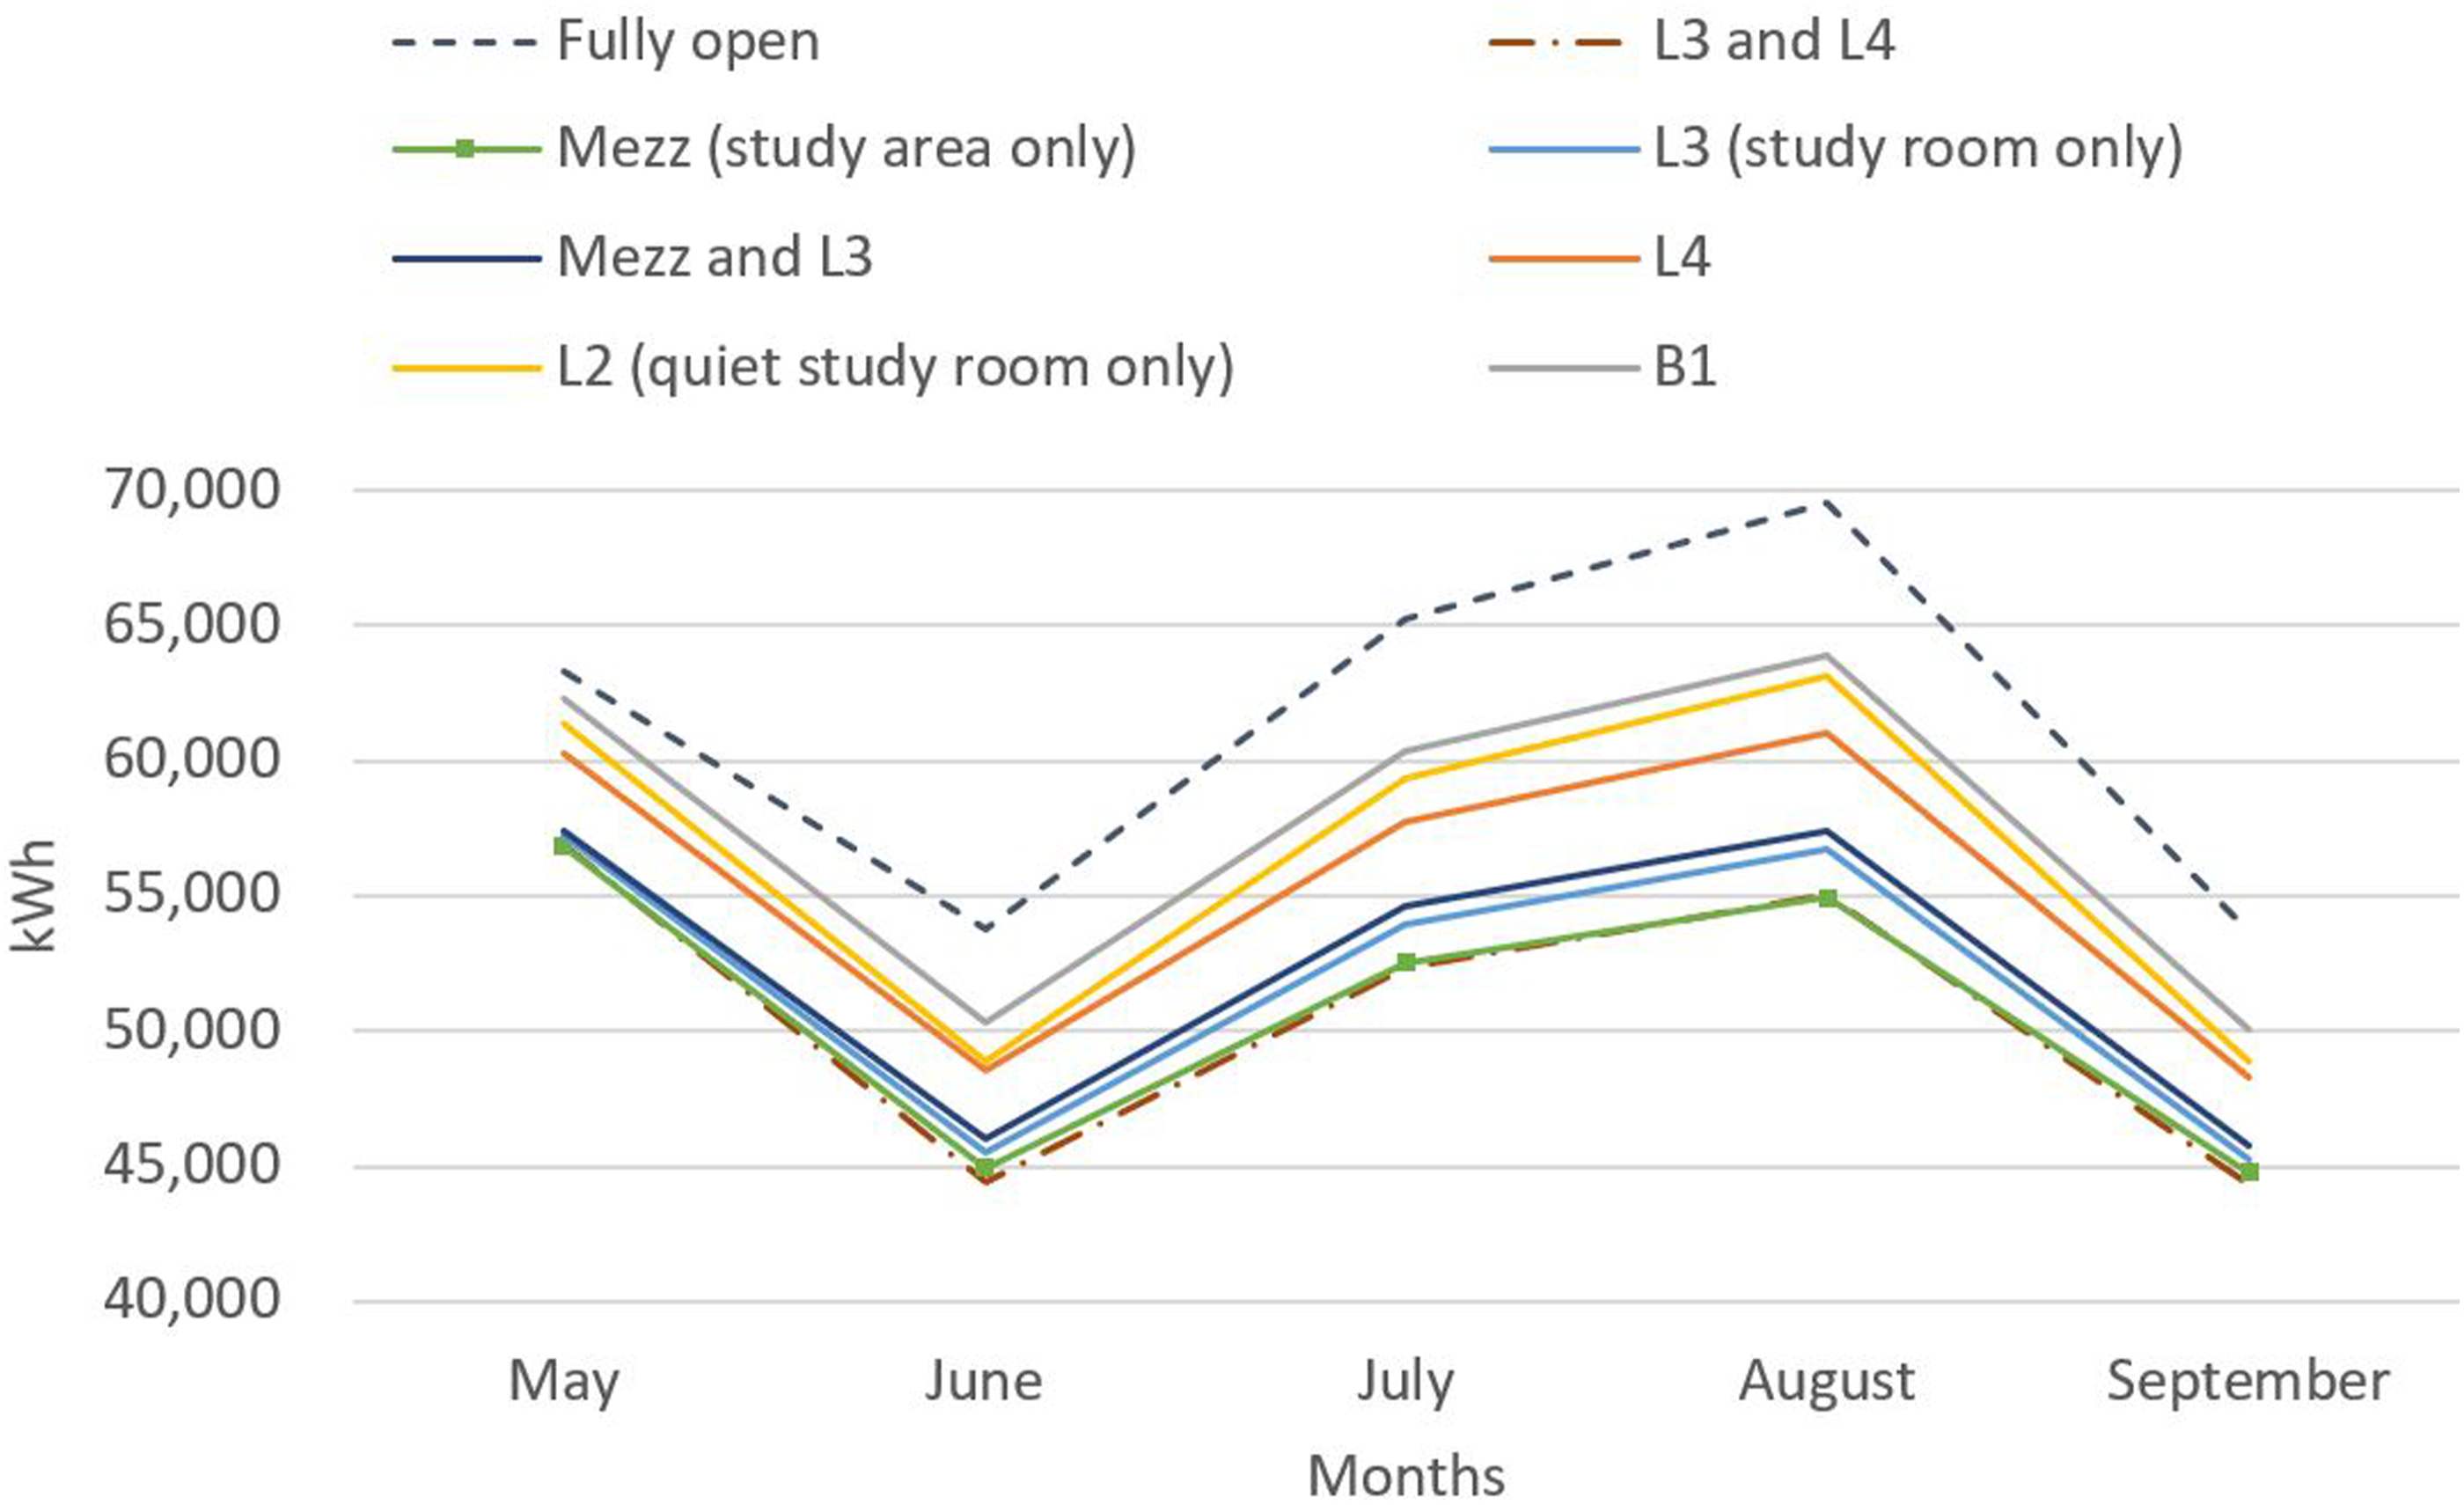
Conversely, equipment savings are comparatively less significant. As occupancy was redistributed, additional equipment power was consumed in the areas where occupancy has shifted to. In addition, the elevated fans load observed in L2, B1, and L4 is likely to be attributable to higher fans loads in the remaining operational areas, which accommodated the additional occupancy resulting from the closed zones. The individual closure of mezzanine, L3 and L4 demonstrated robust performance, likely due to their smaller enclosed floor areas that facilitated easier isolation. In contrast, L2 exhibited lower energy savings, influenced by a significant portion of open-air space exposed to the main atrium. The energy savings in B1 were comparatively less, attributable to its location underground, which is less susceptible to outdoor air temperature variations. This is evident in its notably lower cooling energy savings, reflecting a lower demand during the cooling season compared to other floors. An important finding is that the energy savings achieved from closing individual floors did not cumulatively equal to multiple floors being closed simultaneously. For instance, adding the energy savings from the individual closure of L3 and those from the individual closure of L4 are not equal to the energy savings from the closure of both L3 and L4 simultaneously. This phenomenon can be attributed to the fact that the HVAC systems on other floors need to compensate for the higher occupancy levels.
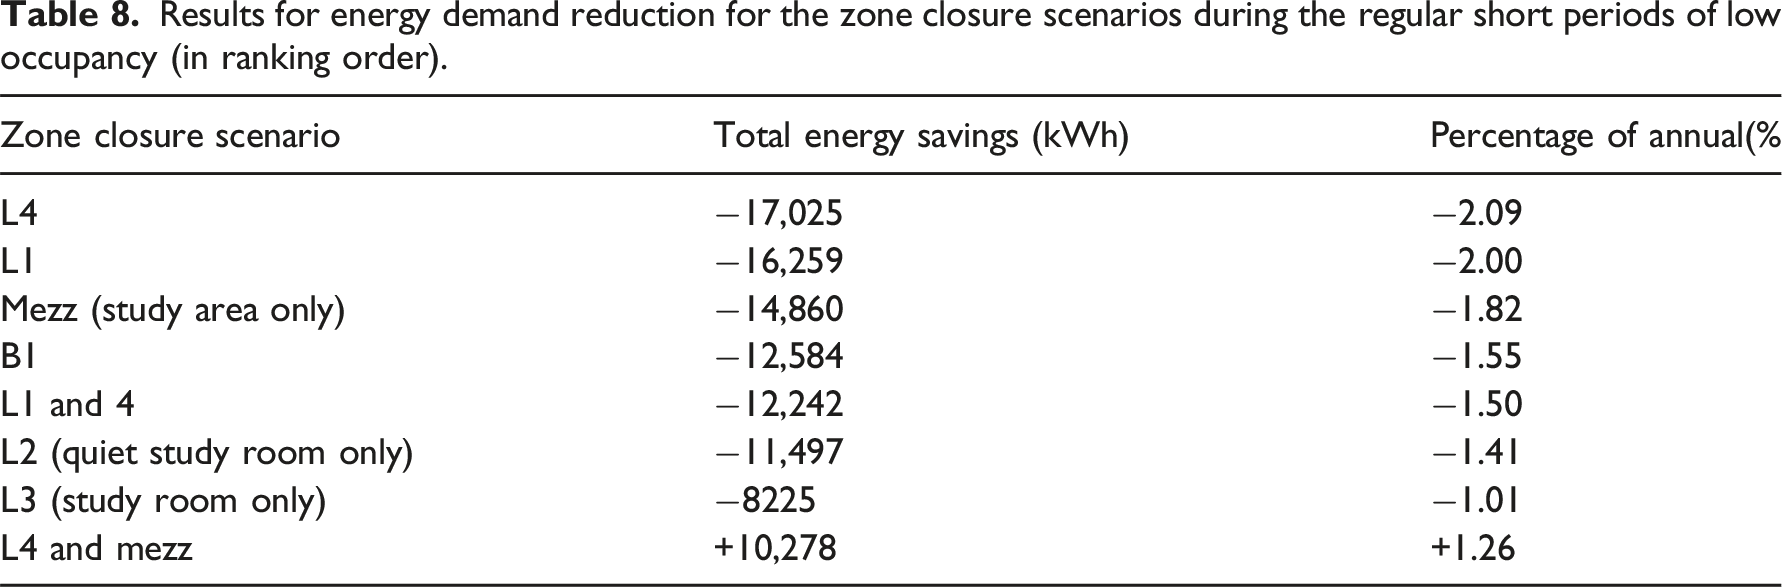
Results for energy demand reduction for the zone closure scenarios during the regular short periods of low occupancy (in ranking order).
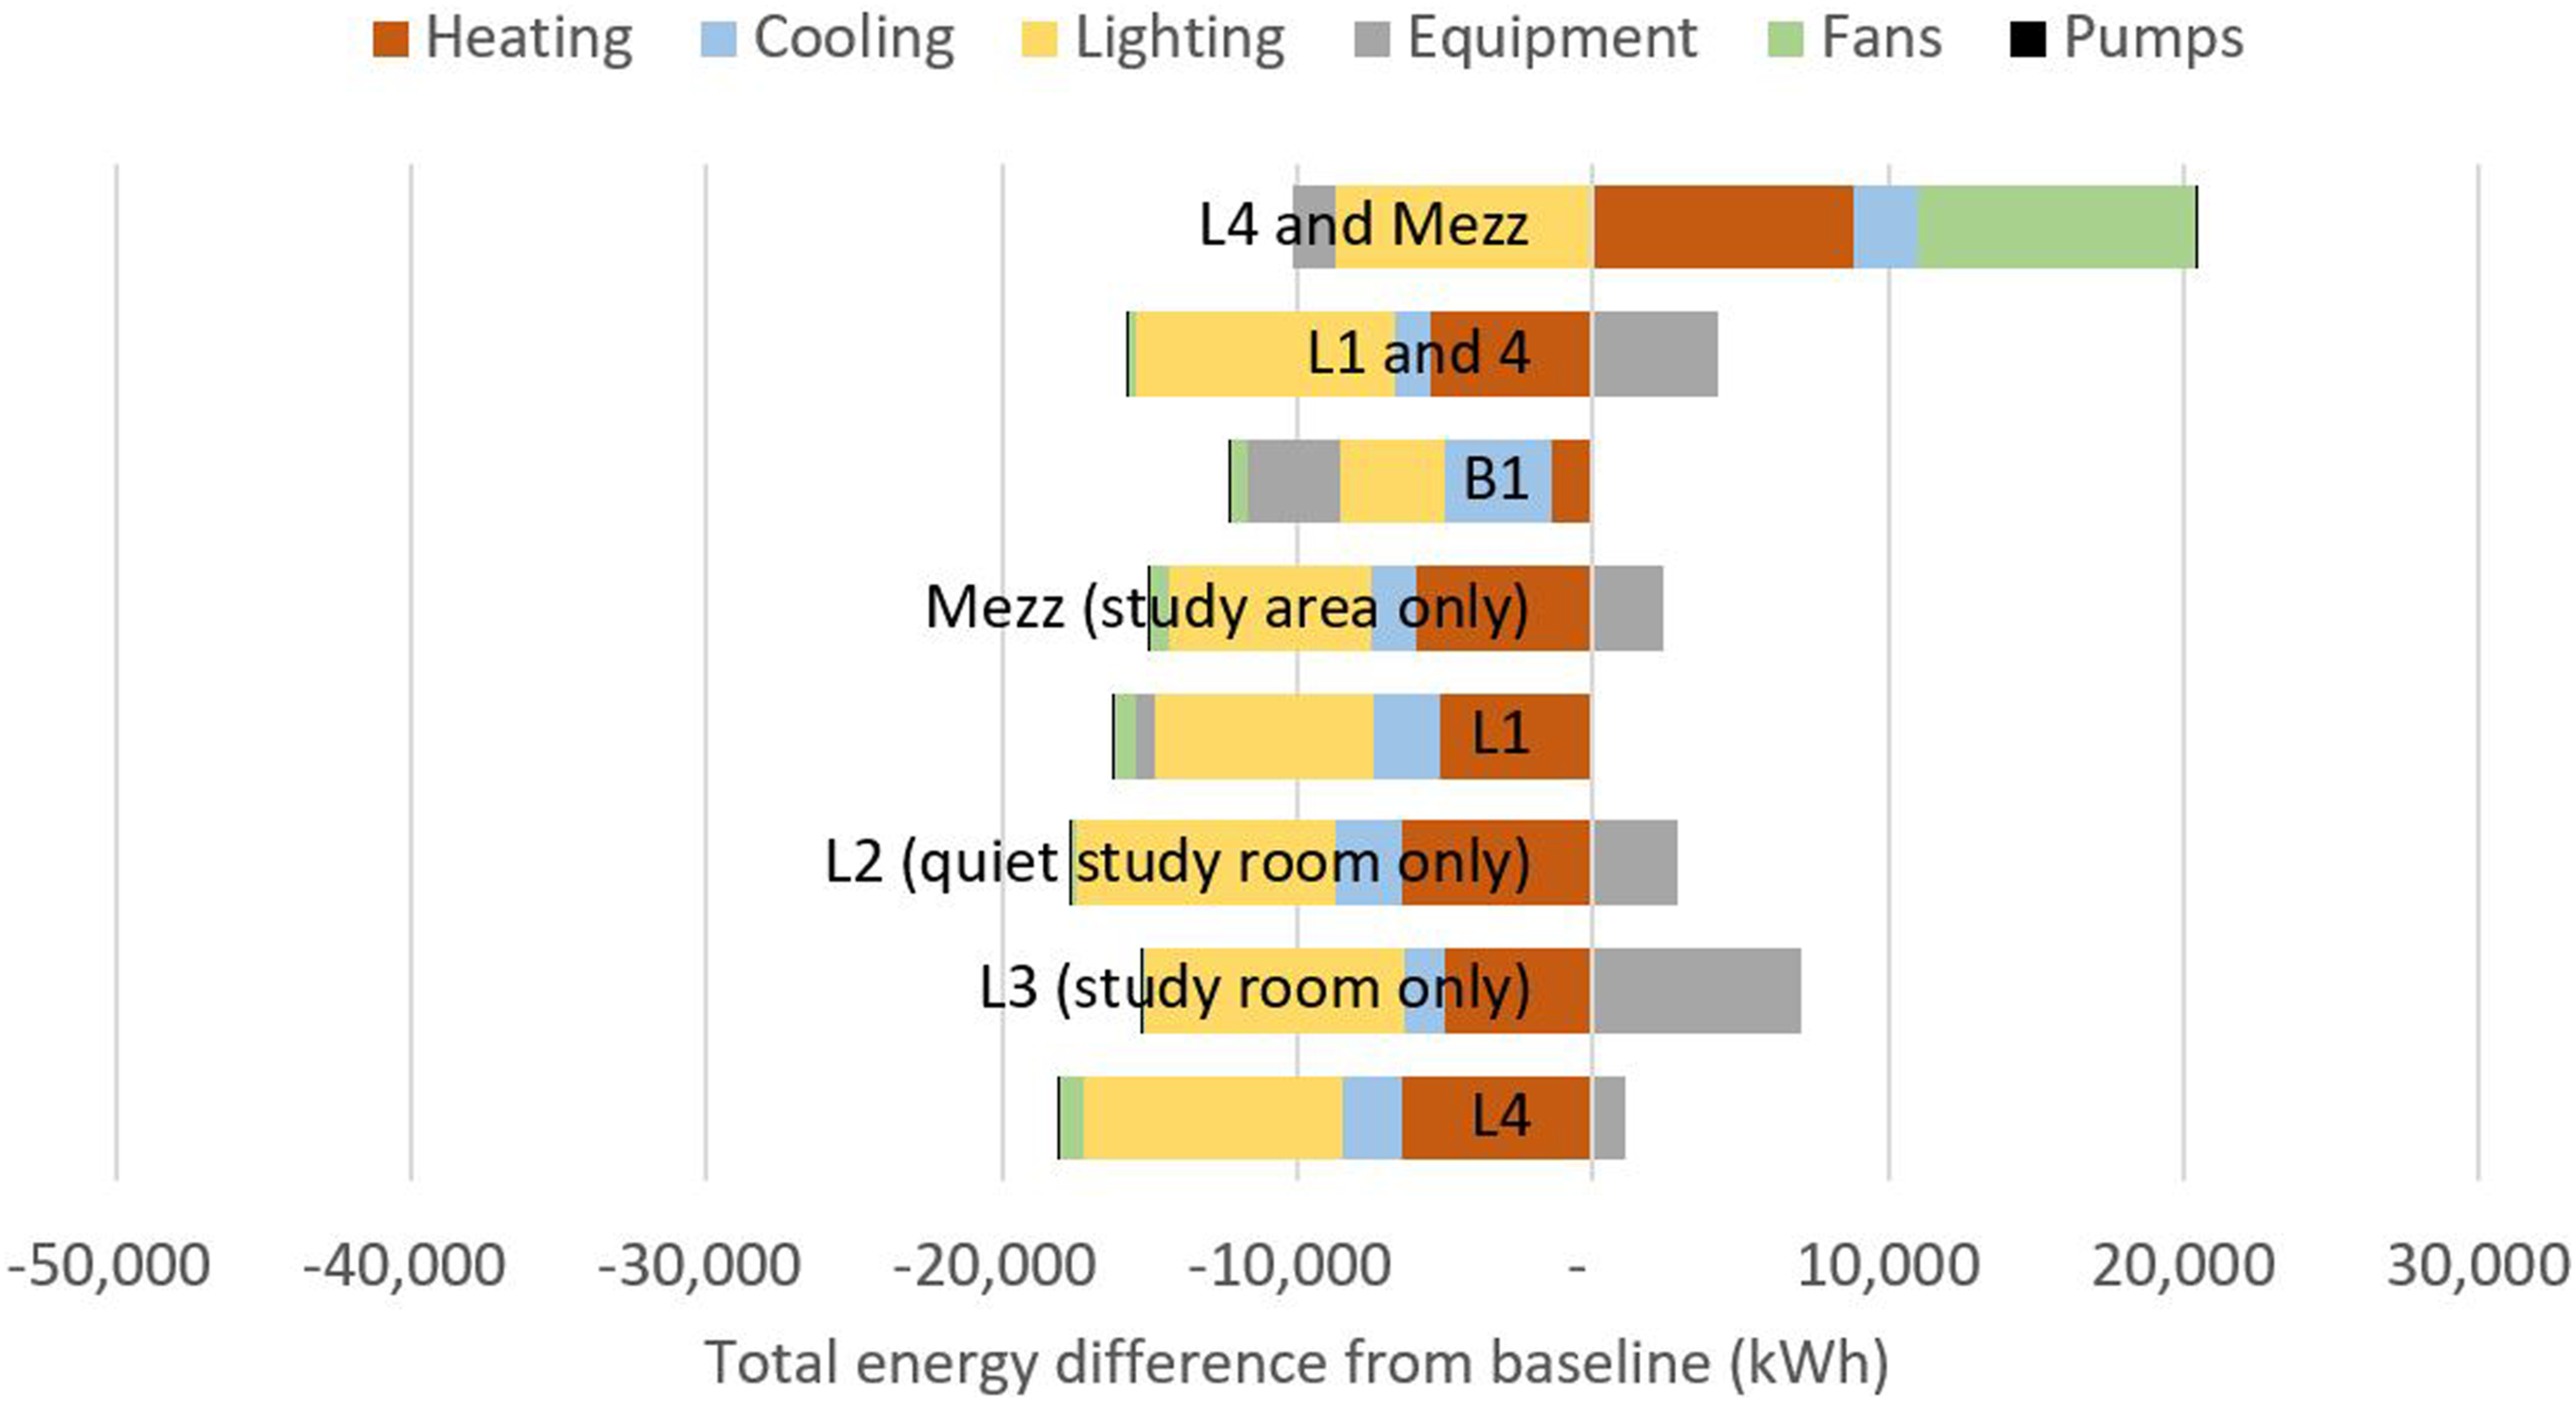
Load breakdown of energy demand reduction for zone closure scenarios during the regular short periods of low occupancy.
Figure 10 shows that the predominant sources of savings are lighting and heating loads, which contrasts with the off-peak period scenarios where cooling savings are more prominent. Notably, heating savings are substantial as these scenarios encompass the entire calendar year and the building is located in a heating-dominated climate.
An interesting observation is the dissimilarity in the magnitude of savings between the regular short and the long periods of low occupancy. The highest energy savings achieved during the regular short periods zone closure scenarios reach 2.09% compared to the 6.05% during the long period zone closure scenarios. This does not align with the proportional ratio of the number of days for each period (104 days for regular short and 140 days for the long period). Such disparity can be attributed to the frequent need for space reconditioning for the regular short periods (i.e. reopening every Monday after the weekend). In contrast, the zone closure scenarios for the long period of low occupancy occur within a continuous time frame, resulting in a once-off reconditioning energy consumption.
It is worth noting that variance in savings between the highest (closure of L1) and lowest (closure of L3) stands at approximately 8000 kWh, amounting to 1.08% of the annual consumption. This marginal difference indicates that closing off different zones does not yield significantly more savings, which aligns with the recurring need for space reconditioning leading to reduced energy savings discussed above. As previously indicated, higher occupancy loads in the remaining operational areas potentially lead to reduced benefits, evident in the L4 & Mezzanine scenario, where HVAC loads in the form of heating, cooling and fans exhibit energy increases rather than savings.
For both periods, overall energy reductions are evident across all zone closure scenarios except one (although with varied magnitude), and are attributed to the shutdown of HVAC, lighting and equipment loads on the closed zones, leading to the redistribution of occupancy throughout the remaining operational areas. The findings align with results by Wang, Mathew and Pang, 24 who also underscored HVAC operations as the most influential system load when exploring the impact of operational practices on annual energy consumption. Their findings highlighted a 3.9% savings in annual energy consumption from optimising operational practices of vacant spaces, such as using setback temperatures and shutting off lighting and equipment load. In comparison, our study calculated annual energy savings up to 6% after redistributing occupancy to create non-conditioned vacant spaces in the case study building and optimising the operational controls of these spaces to reduce energy demand. In terms of savings on specific energy uses, the findings align with Dong and Lam’s research 3 on adjusting HVAC operations based on predicted occupant behaviour and weather conditions, which demonstrated energy savings of 30.1% for heating and 17.8% for cooling loads. For the case study building in this work, up to 11% energy savings came from heating and up to 29% from cooling, due to the focus on an off-peak period mainly covering the summer months in the UK. It is also worth highlighting that the two findings are not directly comparable due to the scale of operational strategies employed, as the presented study explored the case of maximal closure of two floors in an 8-storey building, as opposed to the entire facilities of a smaller building. 3
Design guidelines and recommendations
The framework devised in this study proposes the utilisation of hourly occupancy data for optimising the availability of conditioned zones in non-domestic buildings with the aim of reducing energy demand. This occupancy-driven operational strategy is a rather cost-effective measure, as it does not require energy efficiency retrofit works, and it is therefore easily accessible to building management professionals. The successful implementation of the framework is grounded in a comprehensive understanding of occupancy patterns, building layout and usage. Accurate and systematic data collection as well as thoughtful design of the buildings’ systems and controls is therefore essential to avoid systems inefficiencies and compromising the users’ needs.
Strategies envisaging the closure of certain zones and users’ relocation based on occupancy optimisation should still leave ample remaining workspaces to accommodate the space demand in line with the central function of these areas. Minimising any disruption and inconvenience brough to the users should be of paramount importance; therefore, users’ engagement in the decision-making process is vital. Open communications should be established to convey the rationale behind proposed actions, emphasising that it is an evidence-based approach aimed at reducing energy demand and enhancing sustainability, potentially increasing the acceptability of the proposed strategies.
The implementation of these strategies requires certain resource considerations before being practically feasible. The HVAC, lighting and power systems capability of switching off loads based on the schedules needs to be ascertained by the building management team, in relation to existing configurations of the building systems in place, to ensure that no energy is effectively used when a zone is closed off; to avoid that heat gains are inadvertently provided in closed zones from pipes running through them towards other thermal zones or from uninsulated pipes. The location of zone thermostats and sensors is essential to enable feasible closure of certain zones without impacting others and ensure the operational success of such framework. Furthermore, the size of the HVAC systems should allow for creating healthy indoor environments when zones are occupied closer to their maximum capacity, without introducing inefficiencies or system’s strains. Prolonged cycles of closures, such as seasonal periods, are likely to require less effort to implement and have lower maintenance considerations. However, in both short cycles and longer cycles, manual effort is likely to be required to close off designated zones and potentially regular safeguarding to prevent truant entry and triggering of sensors.
Economic implications associated with the implementation of the proposed framework should also be carefully considered. The evaluation should encompass potential minor costs associated with necessary equipment, such as door locks or barriers, to facilitate the closure of these spaces as well as costs associated to increased labour, equipment procurement, and even consulting fees to assess the compatibility of existing building systems with proposed strategies.
Overall, conducting a detailed feasibility study, weighing the costs associated with operational strategy against the expected economic and environmental gain is recommended. Focusing on both user receptivity and the technological feasibility of implementing the occupancy-optimisation strategies within the building systems is key. Measuring the user experience and satisfaction, might pose challenges due to their inherent qualitative nature, but it should be dimmed essential for the sustainability of the implemented measures. A balanced consideration of all aspects is necessary for making informed decisions before the implementation of occupancy-driven optimisation strategies.
Conclusions
This paper presented a novel data-driven framework for optimising occupancy in non-domestic buildings with the goal of devising versatile operational strategies that enable reducing energy demand without requiring significant physical retrofits. Design guidelines and recommendations are provided to enhance the adoption of the framework by building management professionals. Balanced considerations of various aspects are essential before its implementation, including user acceptability, the capacity of HVAC systems and controls as well as the space uses and the internal layout of the building. The proposed strategies require minimal capital cost for implementation and are adaptable as they aim at optimising operations based on responsive shifts in occupancy according to empirical data, rather than modification works of the interior space.
The proposed framework is highly replicable as it can be readily scaled and extended to other buildings. The research presented not only enhances the understanding of the intricate relationship between occupancy and energy, but it also offers actionable operational strategies that contribute to sustainable practices and energy efficiency without compromising the available functions to users. The applicability of the framework was demonstrated on a case study educational building in the UK. By exploring historical occupancy data and creating a calibrated dynamic thermal energy model of the building, operational strategies were proposed to reduce energy demand during periods of low occupancy. These centred around targeted zone closures during long periods of low occupancy and regular shorter periods of low occupancy. The strategies comprising of zone closures for a longer continuous timeframe exhibited greater energy and carbon emissions savings compared to those achieved during regular short closures, as they avoided incurring energy consumption for regular space reconditioning after the zone closures. Additionally, large energy savings were observed for lighting as the occupants were reassigned to spaces that are already illuminated, leading to absolute savings. The results showed a reduction in energy demand by up to 6%, which in absolute numbers could be equal to the annual electricity consumption of up to 17 medium-sized UK households.
A novel finding indicated that in certain cases the energy savings from the simultaneous closure of multiple floors were only marginally larger compared to the closure of the same floors individually. This is likely attributable to both the capacity of certain zones and the greater concentration of occupancy in remaining zones. Therefore, careful consideration and investigation should take place prior to selecting which zones to close off.
Despite the successful calibration of the model, it is crucial to acknowledge that identifying parameter combinations leading to a good fit with observed data may not necessarily guarantee an accurate representation of reality and therefore a Bayesian approach for model calibration should be preferred in further explorations of this field. It is also important to acknowledge the inherent time lag and retroactive nature of this approach. Buildings are “artifacts with very long lifespans”, accommodating to changing usages and user groups over time, alongside the implications of shifting occupancy trends. The occupancy patterns of future years may not mirror those observed, potentially leading to disparities in the actual energy savings realised through the proposed operational strategies.
Further work could explore operational strategies that respond in real-time to occupancy patterns or minimise the time lag between occupancy pattern identification and responsive action, for example to increase benefit from flexible demand incentives such as dynamic time-of-use tariffs.
Footnotes
Declaration of conflicting interests
The author(s) declared no potential conflicts of interest with respect to the research, authorship, and/or publication of this article.
Funding
The author(s) received no financial support for the research, authorship, and/or publication of this article.