
Abstract
Developing appropriate building retrofit strategies is a challenging task. This case study presents a multi-criteria decision-supporting method that suggests optimal solutions and alternative design references with a range of diversity at the early exploration stage in building retrofit. This method employs a practical two-step method to identify critical comfort and energy issues and generate optimised design options with multi-objective optimisation based on a genetic algorithm. The first step is based on a post-occupancy evaluation, which cross-refers benchmarking and correlation and integrates them with non-linear satisfaction theory to extract critical comfort factors. The second step parameterises previous outputs as objectives to conduct building simulation practice. The case study is a typical post-war highly glazed open-plan office in London. The post-occupancy evaluation result identifies direct sunlight glare, indoor temperature, and noise from other occupants as critical comfort factors. The simulation and optimisation extract the optimal retrofit strategies by analysing 480 generated Pareto fronts. The proposed method provides retrofit solutions with a criteria-based filtering method and considers the trade-off between the energy and comfort objectives. The method can be transformed into a design-supporting tool to identify the key comfort factors for built environment optimisation and create sustainability in building retrofit.
Keywords
Introduction
Rapid urbanisation and the rise of internet technologies have developed new lifestyles: people tend to spend more time indoors. This social structural change in activity patterns places stringent demands on the building industry (1): a comfortable indoor built environment, (2) higher building energy efficiency. After World War II, many countries rapidly constructed a large number of buildings to support economic recovery and satisfy the needs of baby boomers. 1 Due to limited budget, these buildings are usually built with little insulation and consideration for the environment, consuming more energy, and having a higher carbon footprint. 2 Moreover, the poor design and outdated building technologies pose health and comfort concerns to the occupants. 3 Aged systems and disharmonious environment designs limit building performance and lead to several operational issues, causing more energy and maintenance costs to the operators and occupants, especially in global energy shortage.4,5 The global climate change and energy crisis amplified these pre-existing problems: the antiquated buildings have been a stumbling block to sustainability. It is important to provide an energy-efficient and comfortable environment for occupants of aged buildings.
Compared with reconstruction, retrofitting existing buildings is more cost and carbon effective by reusing existing structures and materials. 6 Also, retrofitting takes advantage in tackling occupant complaints and concerns. Therefore, building retrofitting has been gaining momentum and took nearly 50% of the construction market in developed countries. 7 However, retrofitting is never an easy task: successful retrofits require throughout consideration and the design process is often a game between multiple objectives in the design context, current condition, and regulations.8,9 For example, building engineers should design different building sub-systems to satisfy the final occupant needs of thermal comfort (TC), indoor air quality, noise control, energy efficiency and other dimensions. In building retrofit, the decision-making (DM) process entails a trade-off between two or even more objectives that can be optimised, for example, maximising the comfort of occupants and minimising the consumption of energy. 8 An integrated design approach with global optimisation consideration will be beneficial to the DM in balancing different aspects and multiple design objectives in building retrofits. 10
Design optimisation emerges with the development of low-energy buildings, aiming to find the optimal possible solutions among complicated and conflicting factors such as cost, comfort, and energy with the assistance of the computer. Multi-objective optimisation (MOO) can provide a set of solutions, rather than a single standard answer, for trade-off analysis. 11 There are several strategies to solve MOO problems, such as aggregated method (e.g., weighted sum) and Pareto-based strategies. Within over 20 Pareto-based algorithms for design optimisation, Genetic algorithm (GA) is one of the most widely employed.12,13 It mimics natural evolution and adopts the concepts such as genes, mutation, and crossover. GA is capable to calculate more than a single objective simultaneously and toggle the constraints and uncertainty and consider the interactive relationship between multiple objectives in the optimisation process. 14 Among them, Non-dominated Sorting Genetic Algorithm (NSGA-II) is most commonly used in the building sector.8,15,16 Several studies have evidenced that NSGA-II has the potential in supporting MOODM in building retrofits.8,16,17
While there is already a solid MOO research foundation, these novel algorithms are still not widely used in practical designs of building retrofit. One important cause is the imbalance between limited computing power and an extremely large amount of uncertainty (i.e. new design objectives) in building retrofit DM. 11 Because of limited computing power, the MOO algorithms can hardly cover all design objectives but only consider a few of them. Many recent studies have improved the existing algorithms and workflows to cover more objectives.18–22 For example, Yu et al. developed a novel NSGA-II-based algorithm to consider energy efficiency and TC in building retrofit. 8 Merlet et al. considered heating demand, overheating and cost dimensions and integrated a temporal dimension with the phasing of the construction work in the retrofitting strategies. 23 These studies extend the implications of MOO in building retrofitting. However, most of the applications rely heavily on qualitative experience, especially in practical cases. The identification of the critical variables and controlling the number of objectives is more effective to reduce the complexity and the optimisation time. While many studies focused on the improvement of MOO algorithms, there is a lack of a standard design framework combining objective election and the algorithms Therefore, urging for a practical framework to guide the formation of a design optimisation problem from a design question.
In practice, design analysis for building retrofit still presents a deep reliance on human experience. The industry, therefore, is urging for a practical framework to guide the formation of efficient and standard design optimisation from existing subjective and experience-based design process. To bridge the research gaps mentioned before, this paper aims to develop a practical and systematic framework to identify critical comfort issues with post-occupancy evaluation (POE) and generate optimised design options with GA-based MOO with genetic algorithm, with a priority to quantitative measures. The proposed framework in this study is generic and therefore, can work under various building typologies, different regulations and climate zones. By focusing on quantitative measures, it reduces the reliance on human experience to perform successful design analysis and encourages more designers to be benefited from the design technology advance. This research also employs a typical post-war highly glazed open-plan office in London, United Kingdom as a case study. The discussion is not just to process the MOO in a case study project, but also to find a way to translate a raw design question to a processable optimisation problem, to integrate stakeholders’ ideas and designs, and to interpret and select within the optimisation results.
Overview of previous studies
Occupancy comfort
Occupancy comfort, satisfaction and productivity are affected by both physical and phycological Indoor Environment Quality (IEQ) factors, e.g. location, interior designs, biophilia and views, TC, indoor air quality, noise and acoustics, and visual condition.24–27 TC reflects individuals’ perception of satisfaction towards the thermal condition in a space. 25 TC is commonly predicted or presented with comfort models, such as Predicted Mean Vote (PMV) model and the Adaptive comfort model. Local discomfort also affects TC. Typical local discomfort is cold draught, radiant asymmetric, etc. 28
Visual comfort considers both physical parameters and psychological effects of visual conditions. 29 A uniform and sufficient visual environment and suitable daylighting are preferable for promoting well-being, and productivity in the workplace30,31 However, excessive daylighting, usually caused by large windows for good view, may bring problems such as glare, causing visual and physiological annoyance. 32 Window shading devices are a common measure to balance daylighting and views and mitigate glare. But some types are proved to be less useful for computer uses, such as perforate blinds and non-opaque shading devices. 30
Aural comfort is affected by the sound itself besides the environment and is related to annoyance and disturbance. 33 Aural comfort is affected by people, interior materials, noise screens, background noise, reverberation time, and even window opening etc.2,34,35
In addition, demographic factors (e.g. gender, age, familiarity to a space) also play important roles in comfort perception.36,37 For example, Asif 38 found that comfort indoor temperatures of male and female present significant difference. Ageing of building and interior might also contribute to the indoor comfort perception. 39 Office settings are less discussed but can be influential for overall satisfaction and productivity, e.g. personal control, orientation, cellular or open office, and distance to outdoor windows.31,33,37,40,41 All these IEQ factors contributes to human comfort and satisfaction to a space.
Post occupancy evaluation
POE is a process of evaluating the building performance against the initial design and construction goals, as well as its actual use by occupants. POE has been widely employed to understand the options and satisfaction of building end-users to the IEQ building. 42 This technique is often used for (1) transference of operation knowledge to further building design, (2) improvement of existing facility performance, and (3) benchmarking building performance. 42 POE covers a wide range of building performance metrics, such as occupancy comfort, energy consumption and maintenance cost. POE typically includes a combination of quantitative data collection (such as energy consumption, indoor environmental quality measurements, etc.) and qualitative assessments (such as surveys, interviews, and observation) to evaluate the performance of the retrofitted building. This process collects occupants’ opinions over satisfaction and comfort in the target building and presents a general overview of satisfaction with the space. 37 Participants are invited to score their feelings over different questions about IEQ and write down comments if a more precise description is desirable. The questionnaire might include categorical factors, such as gender and age, for more precise analysis and description of the IEQ status. It enables the occupants, the main users of the built environment, to reflect the actual status of a building, and spot key factors and issues requiring thorough consideration. 43 In recent years, POE has been promoted by LEED and other green building certification system to evaluate building IEQ. 44
Multi-objective optimisation
Conventional design optimisation relies on iterative and experimental processes to explore different design options for an optimal solution by humans. 12 The process is very time and effort-consuming, and the result is relying on the experience and expertise of the engineers in optimizing areas. With the development of computer science, different algorithms emerged to replace humans in this iterative optimisation process, such as direct search, evolutionary algorithms and Meta-heuristic algorithms. 13 The evolutionary algorithm is one of the most effective methods, capable of considering multi-objectives, interactive, qualitative, robustness, uncertainties and reliability. Design variables were mostly selected through a comprehensive literature review process. 22 TC and energy demand are widely used as objectives. 45 These empirical-based strategies might lead to bias and less optimal results due to the overlooking of parameters.
Optimisation is a time and computational power-consuming process. MOO, surrogate model, machine learning and other methods are the frontier in application methods and optimisation algorithms for resolving the obstacle in real-world applications. 46 Another trend is to integrate design optimisation with BIM for better integration with other construction activities. 13 Optimisation can be conducted for single objective or multi-objective. Although it is possible to divide multi-objective problems into a series of single-objective problems, MOO addresses design issues in integral and reflects the interactive relationship between objectives, and thus, widely adopted in the built environment field to optimise conflicting building design objectives for DM suggestions.18,47 The optimisation objectives can be economics (e.g. initial cost), environmental (e.g. energy consumption, carbon footprint), and social parameters (e.g. TC, IEQ comfort) in buildings.48,49
GA is an evolutionary algorithm developed by Holland, 50 which is inspired by Darwin’s evolutionist theory. GA adopt the concept of genes, transition, crossover, mutation, and natural selection. Genes are the sets of inputs related to the objectives. Based on a large pool of candidates with different genes, the candidates are compared over their performance on the objectives to determine the possibility for gene transition to the next generation.
There are several algorithms for GA. NGSA-2 is widely used for MOO due to its effectiveness and efficiency.11–13 SPEA algorithm is a recent technique in MOO developed by Zitzler et al. 51 and adopted as one of the main optimisation algorithms for MOO in Rhino-grasshopper (GH) environment. The updated version, SPEA-2, was compared with the trending NSGA-2 algorithm, as well as the other two algorithms. The SPEA might be trapped in the local optimal problem, thus not recommended in MOO problem. SPEA-2 and NSGA-2 were both the best-performing algorithm for MOO, while SPEA-2 was more effective than NSGA-2 in high-dimensional objectives problems.
After several generations of GA s, the Pareto front is formed by candidates of the best possible trade-offs over the objectives. 52 Although it is possible to further evaluate the Pareto front, e.g. weighted sum methods, 53 the human visual selection is still common in the further selection of an optimal solution from the Pareto front.54,55 Such human involvement lowers the technical difficulties of the computer program, but reduces the usability of MOO, because more human effort is required, the judgement is still affected by human factors and automation cannot be achieved.
Application of MOO in design practices
The optimisation problem can be presented with a mathematical function with three main components, i.e. the objective function, the constraints function, and the variables and their constraints. 56 Therefore, MOO workflow can reflect the three main structures of a MOO problem, i.e. MOO variable, MOO constraints and objectives, and MOO settings.
Zhu et al. 18 incorporated this workflow in the optimisation for energy, daylighting and TC for Rural Tourism Buildings (RTB) in China. The study is conducted with GH and Octopus. A field survey was conducted beforehand to summarize the RTB features and form three prototype replicas. Then, 16 to 19 design variables in building design, envelope details, and even the interior dimensions are parameterised for generating design options. The MOO successfully output recommended range of values for these variables. Additionally, it is possible to divide the workflow by the optimisation process with pre-processing, processing, and post-processing phases. Jafari and Valentin 57 proposed a framework for building energy retrofit with MOO, based on a heritage house retrofitting case. Before defining MOO problem, an initial energy simulation study was conducted to narrow down the number of design alternatives and determine their impacts and interactions. The LCC was also calculated for the alternatives. Next, the design alternatives as well as the interactive energy simulation model and LCC evaluation models were fed in MATLAB for MOO towards minimizing LCC and energy. Subsequently, investment costs were calculated for the Pareto front to obtain the optimal design solution. The outputs successfully balanced the energy, LCC and investment cost. In short, the former workflow emphasizes a clearer outline of a MOO problem, guiding to preparation for parameters required by the MOO process. The later workflow provides an overview of the process, similar to other engineering applications such as CFD. However, neither is directly compatible with the overall building design workflow, making it less practical for DM. It is relying on manual selection for the Pareto front, which leave rooms of improvement for automating the MOO process.
Recent research has tried to adapt MOO for real-world design applications, from improvement in workflow, algorithms, and combination with other techniques. Zhang et al. 58 created a generative design process for residential building design with MOO. Numerous design parameters were categorised into qualitative (e.g. spatial form) and quantitative factors (e.g. room geometry) and inputted in GH and Python for MOO. The candidates were optimised for cooling and heating load. Designers were involved in the final selection with visual presentations of the load and the spatial schemes, improving the efficiency of passive design in an early stage. Hamdy et al. 49 used MATLAB to optimise building design and building services systems for less carbon emission and investment costs for a low-emission dwelling. Eight design variables were identified from sensitivity analysis and defined with the carbon emission and cost for each option. Besides the utopian solution, they suggested that the analysis of the Pareto front also provides useful information for designing. Schwartz et al. 6 combined Sketchup and EnergyPlus for BPS and jEPlus for MOO in early design DM. The study is specific to the refurbishment of two listed buildings in the UK. By defining different material and construction options as MOO genes, the optimisation successfully runs towards both Life Cycle Carbon Footprint (LCCF) and Life Cycle Cost (LCC) and finds a better retrofit scheme than the original human design. Giouri et al. 59 utilised mode FRONTIER with NSGA-2 algorithm to study the impact of design alternatives for zero-energy high-rise buildings. The design variables include building envelope, PV systems and building systems. The objectives were energy demand, energy production and adaptive TC. After numerous simulations run and analyse of the Pareto front in post-processing, the study successfully generated valuable design suggestions for DM. Kirimtat et al. 60 optimised facade amorphous shading devices for minimising total energy use and maximising Useful Daylight Illuminance (UDI) with MOO. The geometry is divided into 25 variables. UDI was approximated with surrogate model from a regression study between UDI and geometry variables. Energy was simulated with EnergyPlus. The optimisation results reduced 14% of energy without compromising daylight. Chegari et al. 22 combined machining learning with MOO by using ANN to generate the surrogate model of BPS. The method successfully optimised for energy reduction and indoor comfort, and greatly reduced the processing time while maintained a good accuracy. This greatly improves the time required for MOO, making it more applicable in real-world practice. Asl et al. 61 incorporate MOO into the Building Information Modelling (BIM) and successfully optimised for energy and daylighting for LEED IEQ credit requirement in a residential building. Also, the cloud-based BPS coming with Autodesk showed a high potential to speed up the optimisation process. Kim and Clayton 62 used MOO with parametric behaviour maps for an adaptive building envelope design in hot climate. The dynamic envelope can control its openness to control the shading effect. To balance cooling load and daylighting, the MOO was conducted for the operation function in different scenarios. Ascione et al. 63 proposed to optimise the hourly set point temperatures of HVAC system with the weather forecast and occupancy profiles with MOO, and manually select from the Pareto front as the operation setting the next day.
In general, the overview of the recent studies indicates that MOO is capable of blending into many designs process for different design intents. It is also compatible with different computational techniques, such as ANN. However, the application process is still highly diverse and customised from case to case, making MOO a completely new research project when moving into a new project. This makes the design team refuse to integrate MOO into their daily design routine without good reason, especially in the tight design and DM schedule nowadays.
Method
The mathematical expression of an optimisation problem consists of three main components, the objective function, the constraints function, and the variables and their constraints.
56
Adapting the concept, MOO design can be approached by identifying and constructing the following a 3 + 1 essentials. (a) Optimisation objectives and constraints. These are the design targets to achieve and the key constraints and limitations affecting the optimisation process. For example, to reduce building energy use, one can reduce the window size, but the window size is constrained by the daylighting of the space. An effective MOO question should consist of at least one objective and one constraint, developing a contradictory relationship. (b) Evaluation functions and matrix. These are the equation, algorithm, or program that quantify the abovementioned optimisation objectives and constraints into design performance index. For instance, the design energy performance can be evaluated with an energy simulation program and return the predicted Energy Use Intensity (EUI) value. (c) Design parameters. A study should determine design variables that will affect the design performance index above. These design variables will usually have a range, representing the constraints in reality.
(+1) MOO process configuration. Different MOO algorithm, variables and setting parameters defines the behaviours of the optimisation process and could lead to different results. This includes the selection and inputs for the optimisation algorithm, mutation rate, sample sizes, gene pool sizes, etc.
Usually, the objective/constraints, functions, and variables are determined by the user, with qualitative analysis and intuition to the design question. And thus, it limits the adaption of MOO by human error and experience. This drawback could be tackled with quantitative data analysis. As in Figure 1, this study elaborated the “3 + 1” concept into a design workflow, which quantitatively explores the design question, formulates the MOO question, and generates optimised design options for future study. Firstly, the study used a POE survey and statistical analysis to identify MOO objectives effectively. Next, based on these objectives, the study selected objective functions for building performance analysis. Then, following industrial conventions, constraints, and design intention, the MOO variables and constraints was be defined. At last, the MOO process has generated a set of optimised designs from the above inputs. After candidate screening, a set of optimal design options could be obtained for future design. The proposed method.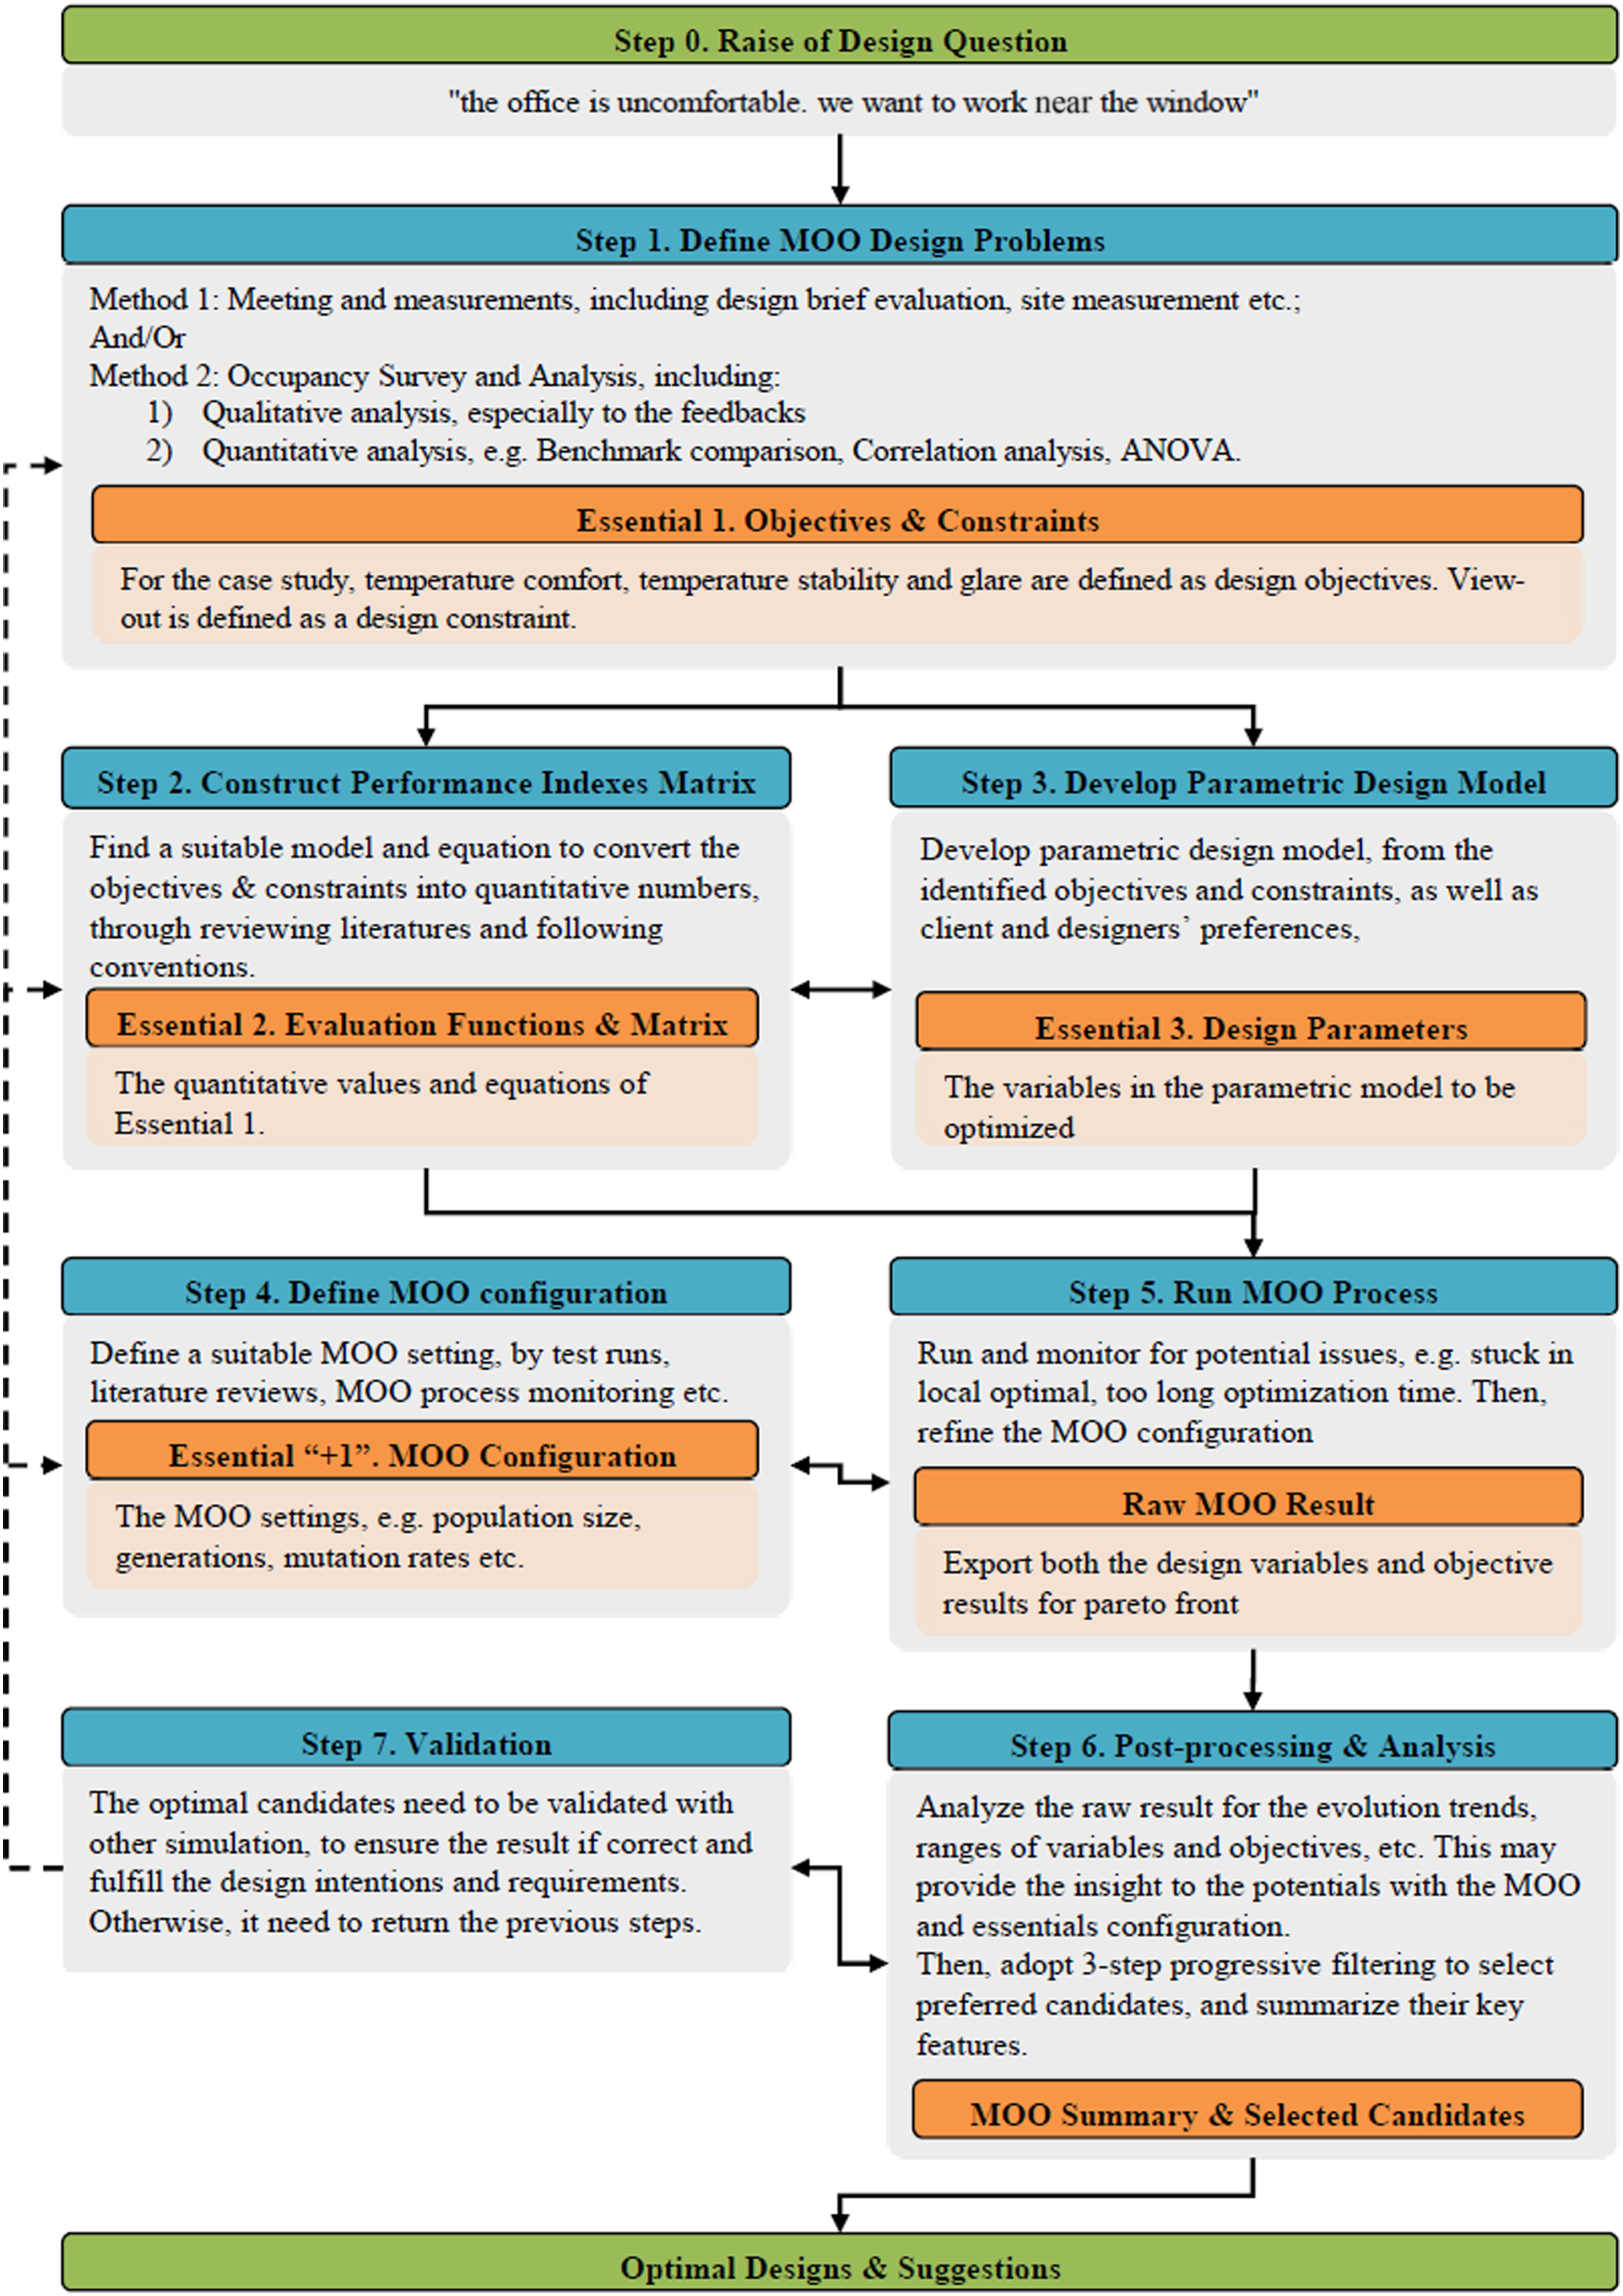
Defining MOO objectives by POE and statistical analysis
Before the formal research stages, a brief meeting within the research group was conducted for design directions. After that, site inspection, drawing evaluation, past operation data inspection and occupancy interview were used to further understand the expected deliveries and details. To ensure the credibility of the analysis, POE and statistical analysis were adopted to provide a comprehensive overview to the occupancy related issues. This also reduce the human effort in the design analysis by using computational power.
POE is a widely used method to support the collection of the occupancy satisfaction rating. The BUS Methodology 64 is a recognized POE questionnaire, containing a questionnaire with 45 quantitative and qualitative questions to evaluate the abovementioned IEQ aspects as well as the several design factors and personal details for detailed analysis.37,39 Physical copies of questionnaire were distributed to all occupants in the study building in March 2019. In addition, the seating location of the respondent was collected alongside the survey to link the survey rating to a specific location in the office.
The POE survey was conducted with BUS methodology questionnaire. Excel and SPSS were adopted for statistical analysis. Rhino and GH is a widely used platform for parametric design owing to its visual and extensible features. 65 The version, Rhino 5 + GH, was used for parametric modelling. Ladybug and Honeybee from Ladybug tools were adopted for BPS, which are cored with EnergyPlus for thermal simulation and Daysim for daylight simulation. Octopus plugin was used for MOO process, with which the SPEA algorithm was adopted. 51 The MOO process data was extracted into EXCEL for post-processing.
The study conducted a qualitative analysis of all comments in the feedback. Also, descriptive analysis was used to reveal the under-performing factors, correlation analysis to further confirmed the key IEQ factors as well as analysis of variance (ANOVA) analysis to test the impact of categorical factors, such as layout, personal control, and human factors. In general, the statistical analysis systematically revealed the key comfort issues and the potential causes for discomfort rather than complicated manual analysis efforts.
Defining MOO variables by parametric design and BPS
The step aimed to determine MOO variables which would encourage further optimisation process. The parametric design model includes both the geometry models and the BPS models. The geometry model of baseline building was modelled first the foundation for the overall parametric model of the design building. The BPS models contained the parameters for different simulations. Design variables for TC can be simplified into the U-value and thermal mass properties of envelope without modified the geometry model. For glazing types, U-value, SHGC and VT were changed according in the BPS model to reflect changes in both thermal and lighting performance. After model validation, only the retrofit measures and related design variables were added or modified in the BPS model. To reduce the number of variables, only related design variables were parametrized for the geometry model and directly link to the BPS model after conversion.
MOO and post-processing
Manual selection by visual inspection is an easy and still widely adopted technique for optimal solution selection. 66 Human preference could be easily introduced in the process, such as appearance. But the interface was not effective with more than three objectives. Also, the process has to be undertaken in a trail-and-error method by randomly comparing candidates, which can be less effective over large number of pareto front. Octopus plugin has a built-in visual navigation for this process. Utopia point method is another method, which assumes a theoretical point of optimal trade-off over all objectives, then locate the candidate with shortest distance to this utopia point.67,68 The process can be automated with computer. 69 Additional screening for constraints and limitations may be required for this method.
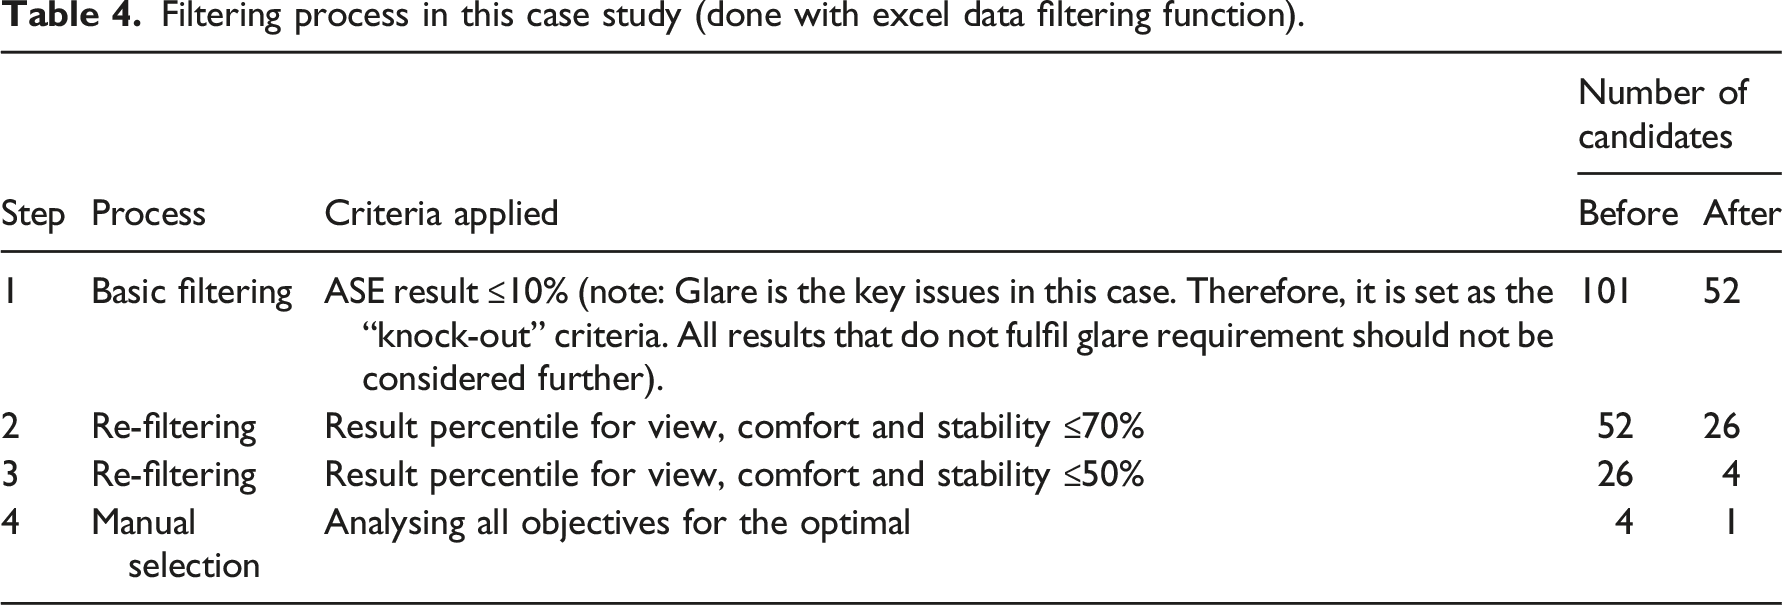
To avoid the abovementioned problems, this study adopted criteria filtering for selecting the optimal solution. As illustrated in Figure 2, different criteria were set based on the design objectives, and gradually applied to the pareto front, until finding the optimal solution. The basic filtering screens out candidates that do not fulfil mandatory design requirements, such as the criteria for compliance. In other word, it is the “knock-out” filter Then, the ranking filtering reduces the number of candidates based on their rankings in the performance criteria. It can be adopted several times to adjust the preference on different criteria, and to reduce remaining candidates by constricting the filter criteria. This study adopted the percentile ranking for BPS results, which aims to achieve a balance for all objectives. Until targeted number, preferable design solution can be effectively manually compared and selected. This method can effectively reduce the size of candidates regardless of the size of pareto front while ensuring that all candidates meet the required design constraints. The process of selecting the optimal solution by filtering.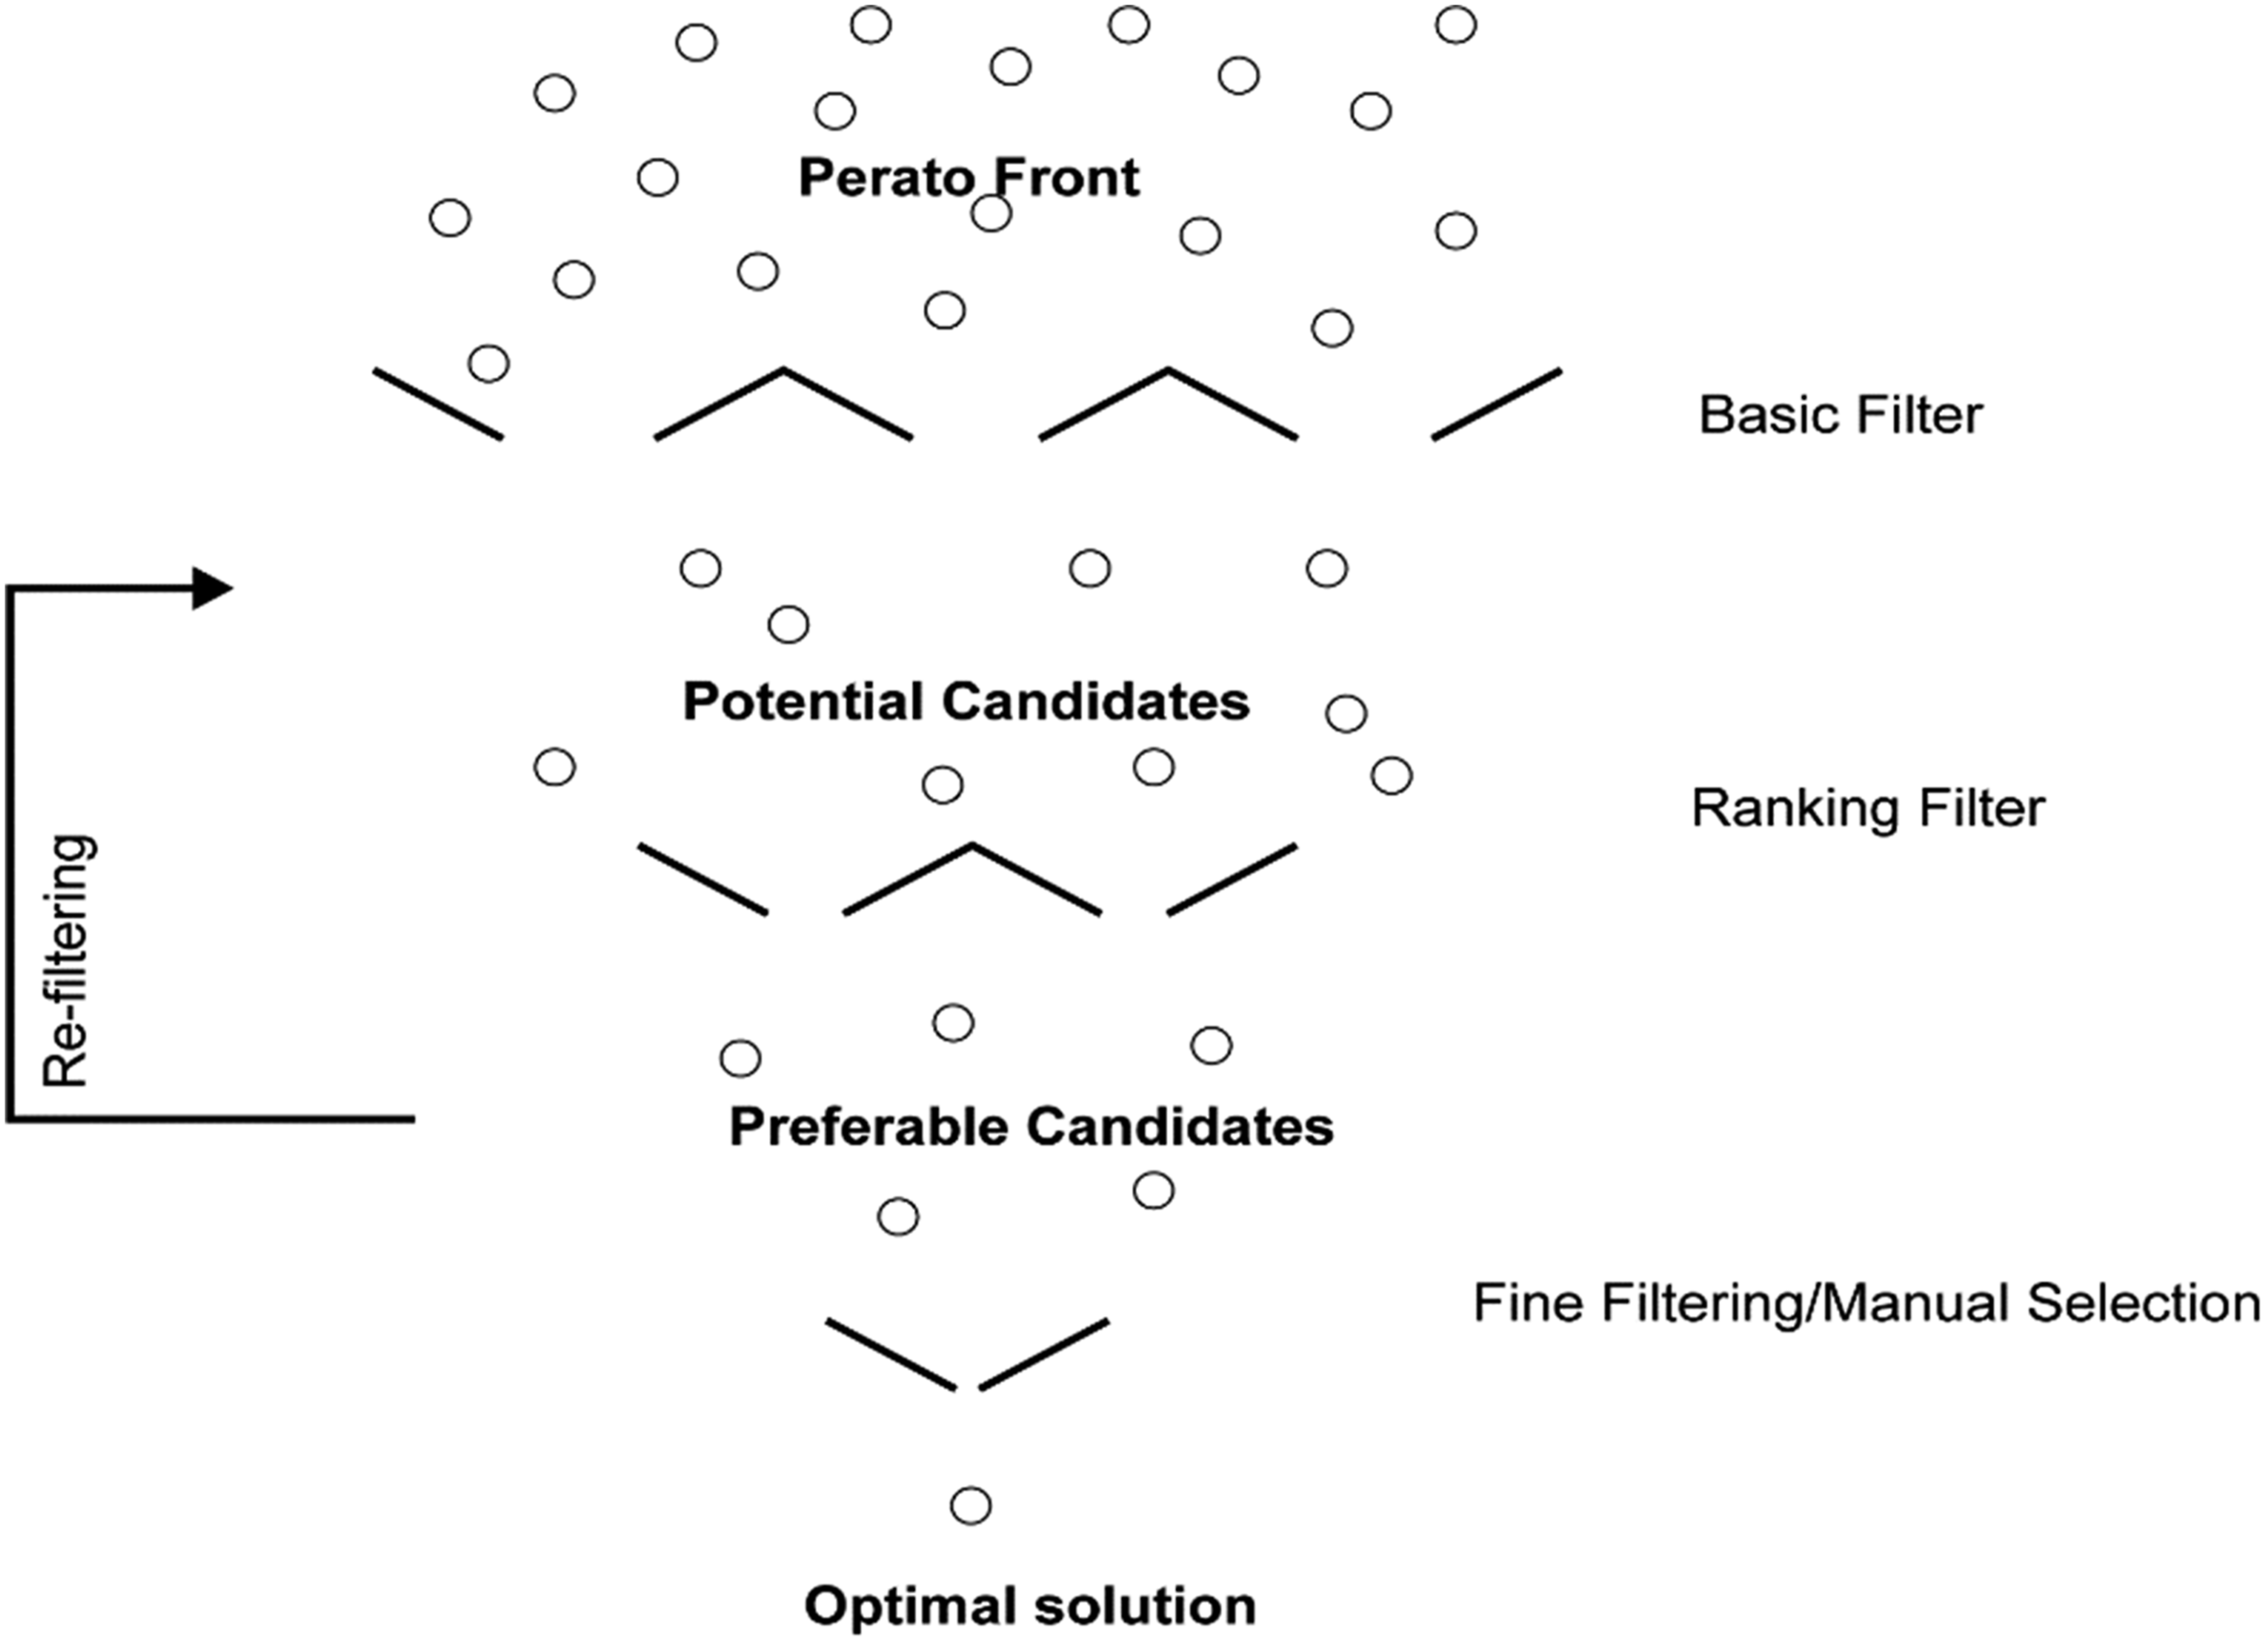
case study
Reference building
The case study building is a multi-tenant commercial office building in London, UK. The design is specific to the 450 m2 open-plan office at the top floor (ninth floor). It is a post-war building featuring uniform large single-glazed windows on all façades. Figure 3 illustrated the detailed construction of a typical façade module which duplicate across all facades. As a listed building, the façade features and external construction cannot be changed. The occupants also required not to take up internal spaces. The retrofit measures were restricted to the recessed space from external window panel to the windowsill, which was only 370 mm in depth. A typical facade module.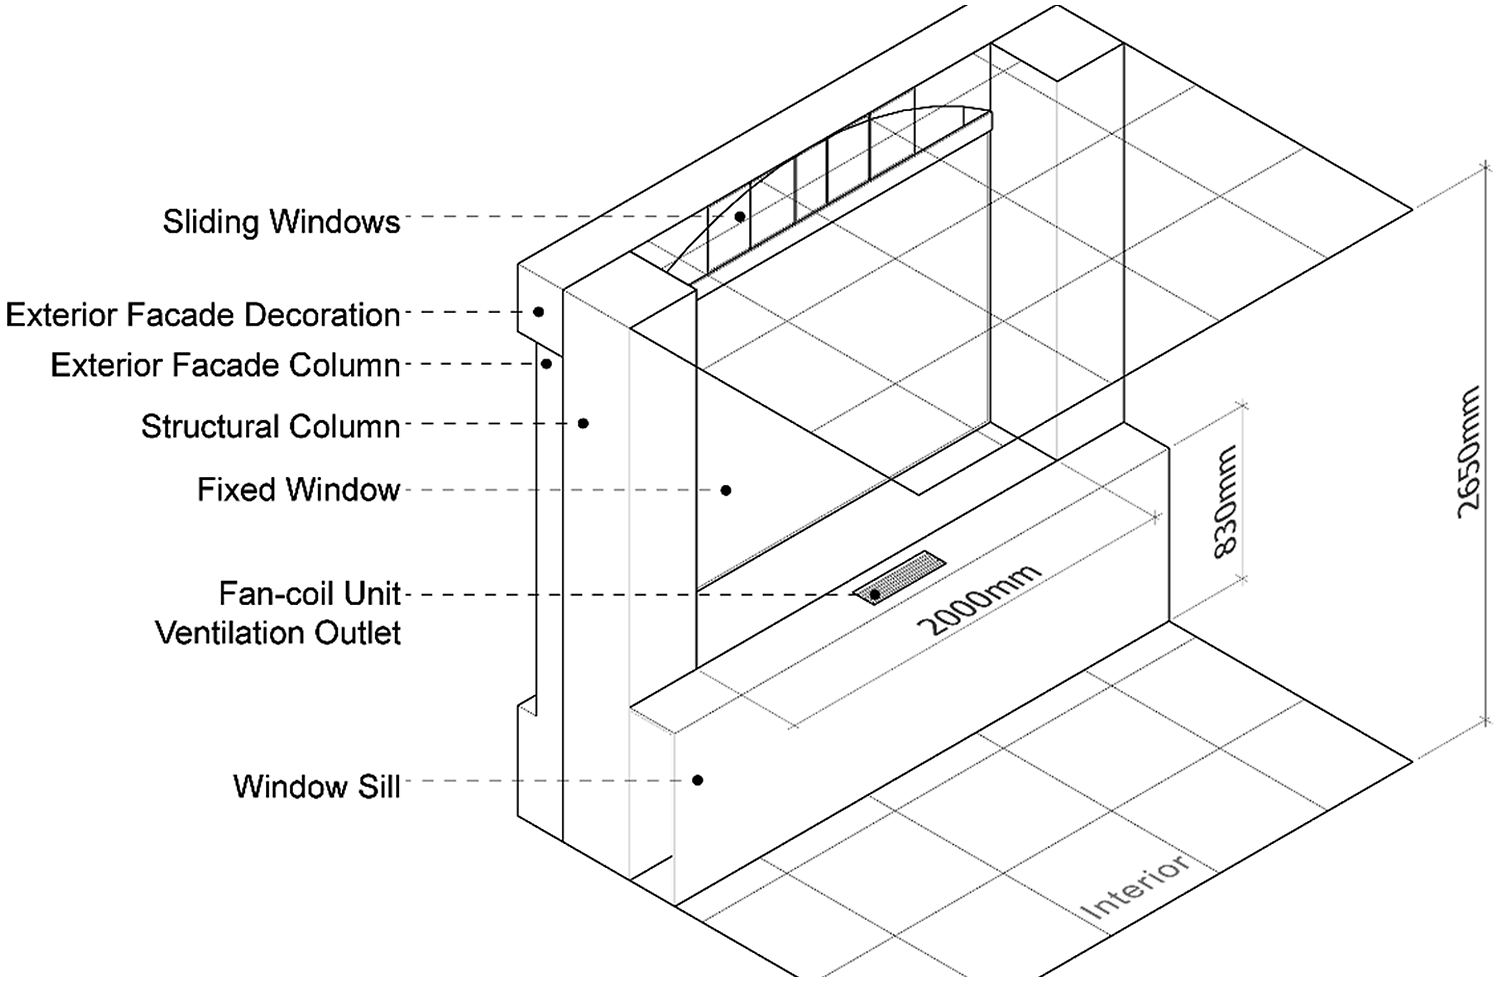
Site-inspection showed the building was not insulated. There are no surrounding shadings. The air conditioning units were integrated into the windowsills with a small air inlet through the window. No monitoring nor tariff data was available for energy use evaluation.
Climate data
The building is located in central London, UK. The climate is classified as temperate oceanic variety (Cfb) in the Köppen–Geiger climate classification. The mean annual temperature is over 11°C in central London, which is warmer than the surrounding suburbs. 28 The monthly dry bulb temperature is from 5.4°C in January to 18.4°C in July. London is affected by heatwave, during which the temperature could goes over 30°C. The “London Wea Ctr St James Park” 70 was used for all simulations. London is at 51.5°N latitude. Sunlight come at low altitude from North-east in the morning and Northwest in the late afternoon.
Simulation model
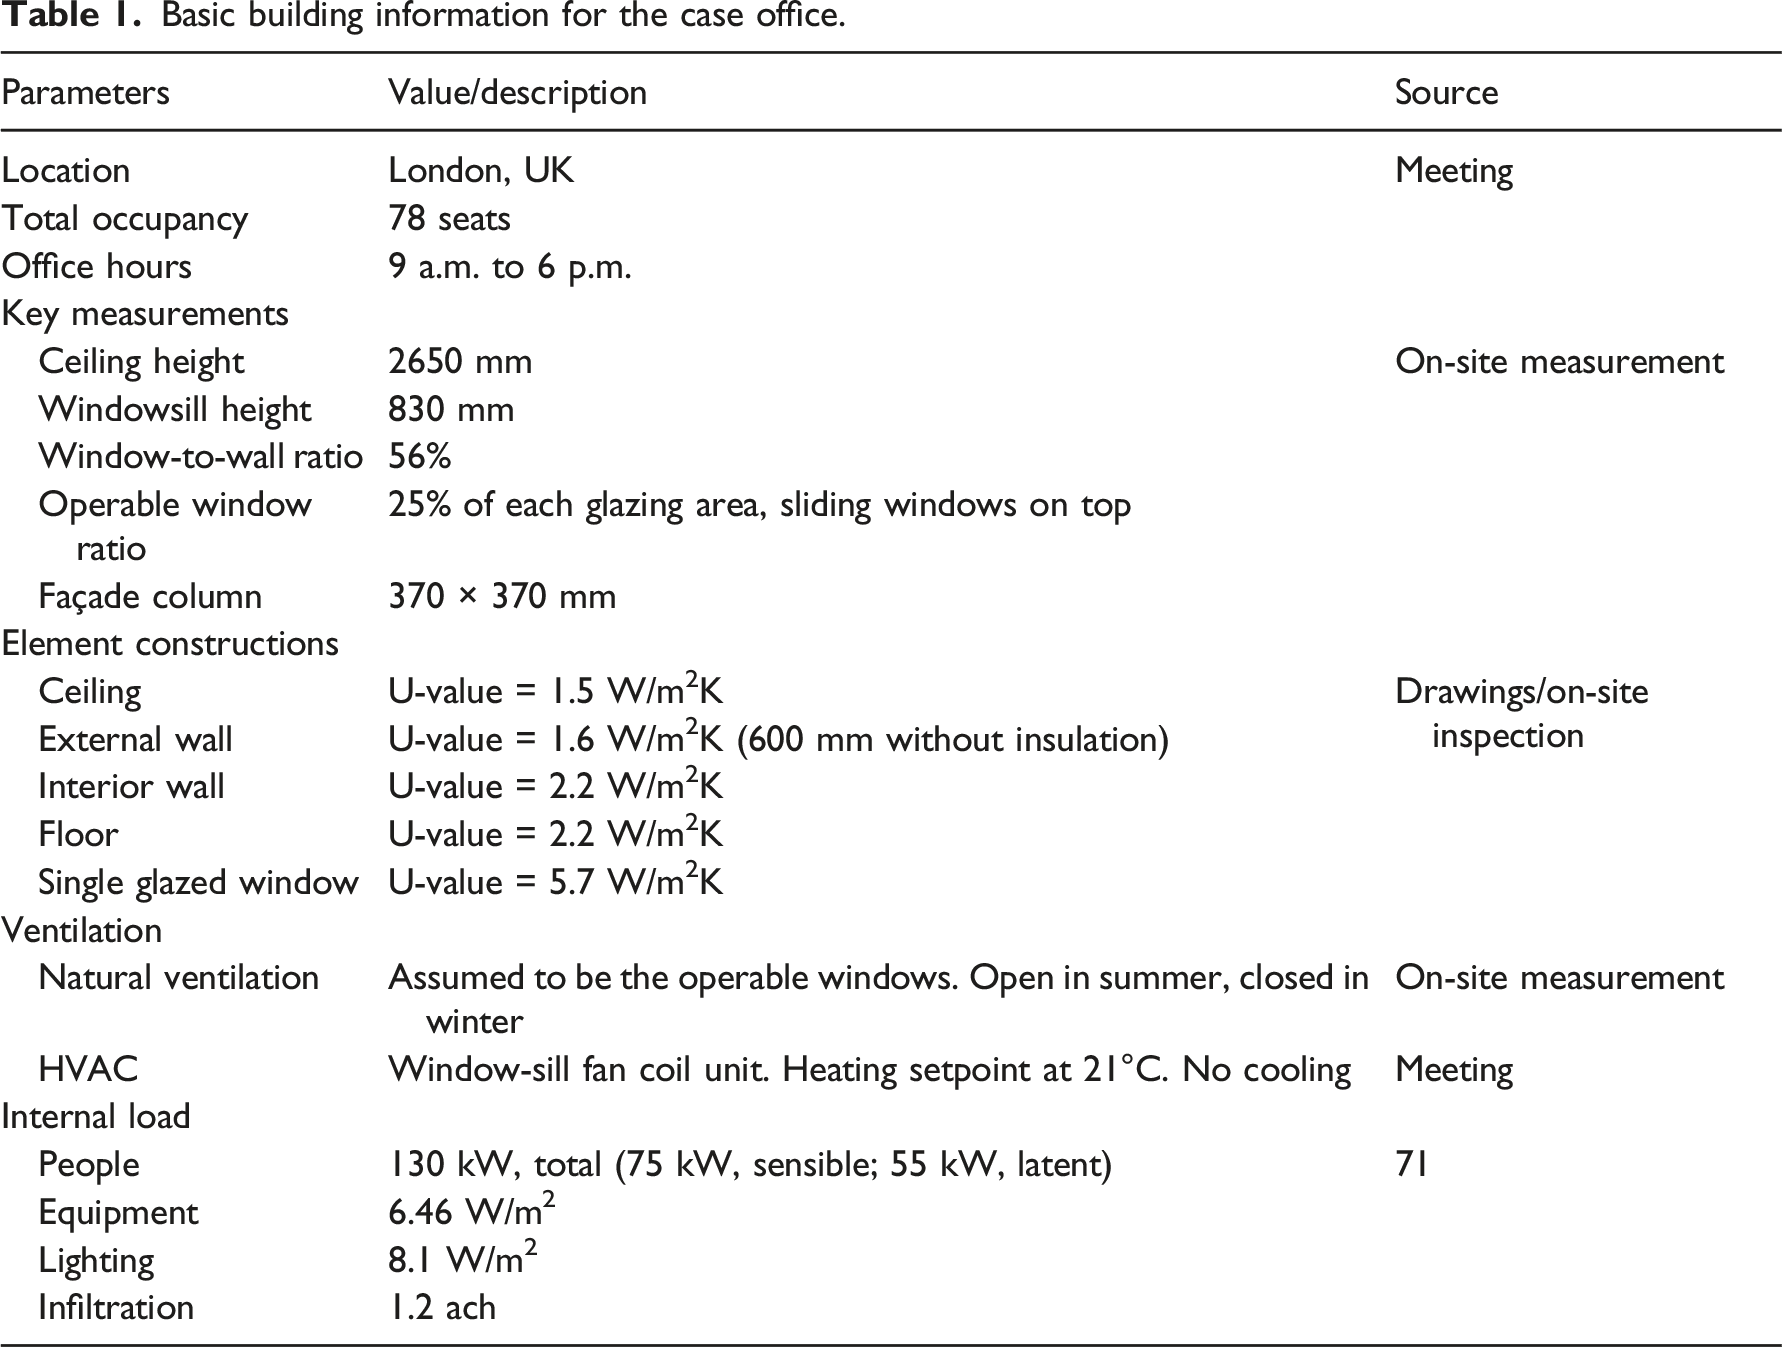
Basic building information for the case office.
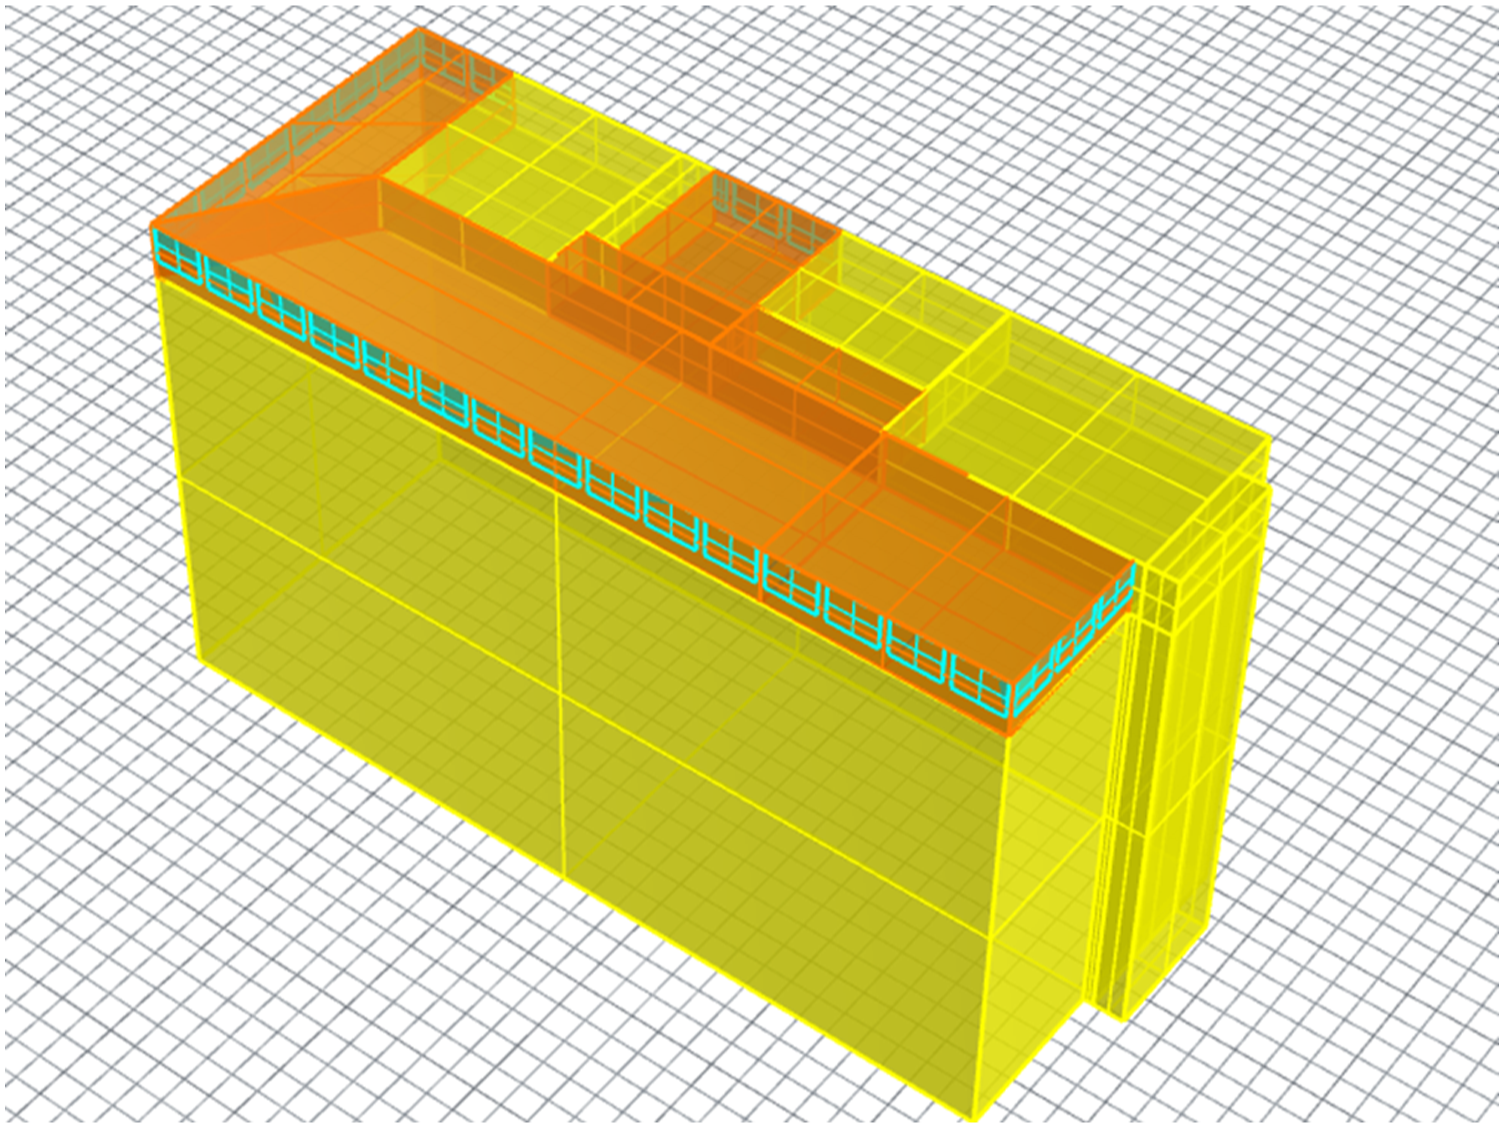
The simplified office geometry model.
The baseline model simulation results were compared to the typical data and POE result for model verification. The energy consumption is slightly higher than the typical office commercial average. The simulation results showed that it was bad performing in TC and glare. winter PMV comfort was at 3.9% satisfaction. Summer adaptive comfort was at 66.3% satisfaction. These was similar to the POE results. The ASE result is at 28.9%, i.e. the space is exposed to high level of glare. Areas near west, east, and south windows were highly likely to experience glare whereas the middle area was at acceptable glare probability. Generally, the baseline model approximated the actual building performance. Further MOO process only modified the corresponding parameters.
Optimisation and results
Design initiation
At the beginning, an on-site meeting was arranged to have a brief understanding to the reference building and complaints from the people. On-site photo, layout drawings, on-site measurements and complaints were collected and discussed with the correspondents. The largest problem needed retrofitting in the reference building was reported as the sunlight glare (SG) issue as well as the winter cold problem. Sunlight could penetrate deep into the office and cause SG in a specific time of the day in a year. The space became extremely cold in winter even with central heating. The occupants were desperate for an effective retrofit plan to resolve these discomfort issues.
Determining the key IEQ problems with POE
Physical copies of the BUS survey were distributed to all occupants in the office and collected after 2 weeks. The seating location of the respondent was collected alongside the survey to link the survey rating to specific location in the office. 32 valid samples were finally collected. Participants were evenly distributed for workstation location in the office, gender and age range. Occupants commented with winter thermal discomfort, glare and noise interruption problems.
In terms of ratings, TC in winter and summer were both badly performing (over 50% dissatisfaction). In winter, the temperature was reported unstable, cold and the air was slightly stuffy, very draughty. In summer, the temperature was hot, and unstable but the air was acceptable. Noise from colleagues and outside, and noise interruptions were unsatisfactory. Noticeably, overall lighting and natural lighting condition were satisfactory (less than 20% dissatisfaction). But the SG issue was unacceptable to most participants (65% dissatisfaction).
Pearson correlation analysis was conducted between the continuous parameters to reveal relationships among the IEQ parameters. “Overall winter air comfort” are found highly correlated to “overall winter temperature comfort” (ρ = 0.892, p = 0.000, N = 30) and “overall winter temperature comfort” (ρ = 0.804, p = 0.000, N = 30). “Overall satisfaction to winter air condition” was related to “winter air temperature” (ρ = 0.773, p = 0.000, N = 31), “winter air stability” (ρ = 0.436, p = 0.014, N = 31) and “winter air stillness” (ρ = 0.456, p = 0.010, N = 31). “Overall satisfaction to summer air condition” was correlated to “summer air temperature” (ρ = 0.804, p = 0.000, N = 30) and “summer air stability” (ρ = 0.500, p = 0.005, N = 30). “Overall satisfaction in overall noise condition” was correlated to “overall comfort” (ρ = 0.620, p = 0.002, N = 31), “noise from colleagues” (ρ = 0.531, p = 0.002, N = 31) and “noise interruption” (ρ = 0.485, p = 0.008, N = 29). Unexpectedly, “Overall lighting satisfaction” was not identified as strongly correlated to “sunlight glare” and “natural lighting”, which was against the low comfort rating in SG.
The one-way ANOVA was used to exam potential comfort impact of categorical data. Human factors (Sex and age) were not found influential to the result. In terms of layout, the west end of the office was found to have higher satisfaction over design (p = 0.005), storage space (p = 0.006), overall noise (p = 0.004) and overall comfort (p = 0.005). Air stiffness (r = 0.004) was found better near window, suggesting a better ventilation and air movement near window than deep into the floorplan. However, there is no positive result to support our hypothesis that the cold draught and radiant asymmetric is the main issues for thermal discomfort.
Generally, Pearson correlation results and ANOVA analysis results are aligned for key IEQ factors affecting comfort and productivity. Air temperature and temperature stability (TS), and noise from colleagues can be identified as key IEQ variables. The TC was affected by the potential low and unstable air temperature, cold draught and ventilation in winter. As expected, this implied that air temperature is a key IEQ factor, especially in winter. Objectives of the retrofit must consider TC in winter. SG did not show a strong correlation to overall comfort, due to the small sample size. However, SG was found badly performance in the benchmark and an overall dissatisfaction rate (88%). SG was still identified as a key variable.
Although noise from colleagues was strongly correlated to IEQ comfort, it was specific to certain locations, implying that noise was more likely to be a personal or management issue than a building performance issue. Therefore, the noise was not selected as a key IEQ factor for performance improvement.
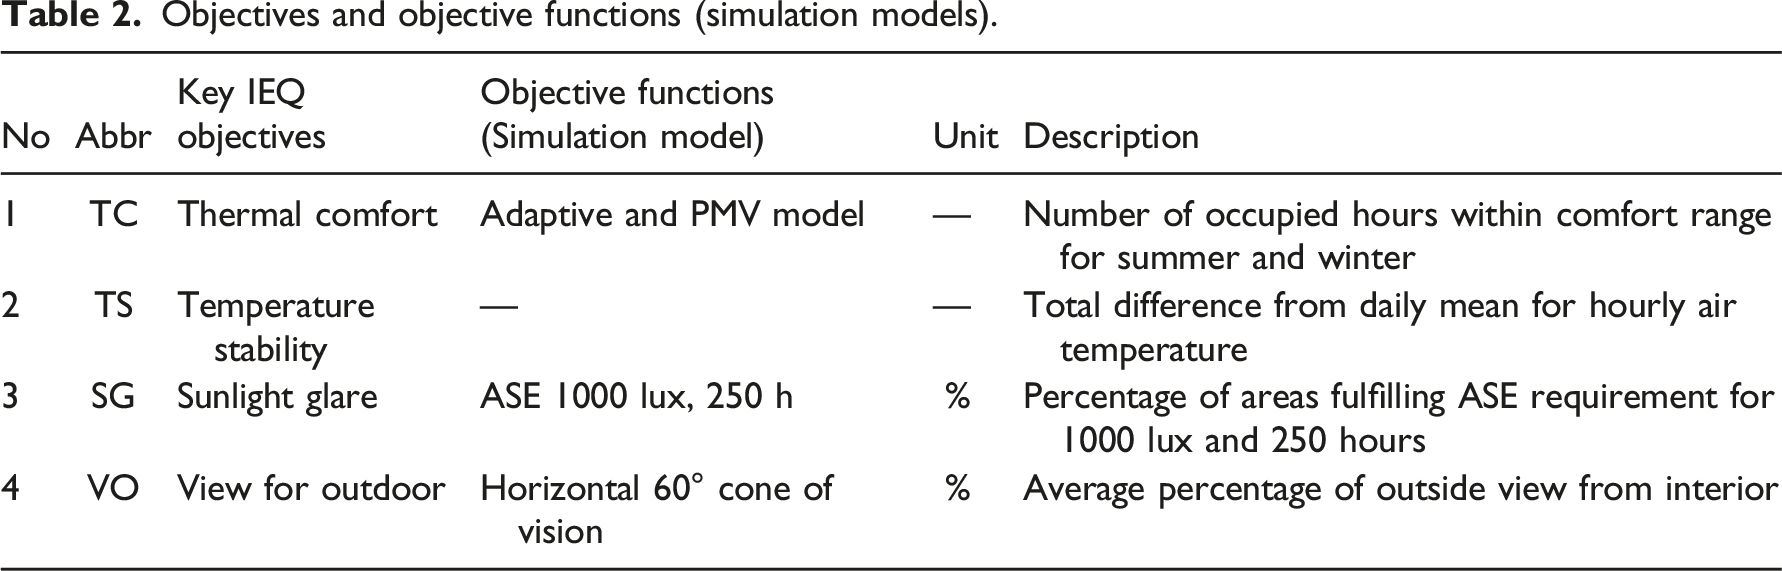
Defining MOO objectives according to POE results
As for TC, the adaptive comfort model is for natural human adaptation to the thermal condition.72,73 PMV model is a steady-state model suitable for conditioned space.
28
From the 8460 hours in a year, the occupied hour was extracted, from which the percentage of hour in comfort was determined. The office is mainly naturally ventilated in summer and heated in winter. Therefore, the adaptive comfort model was selected for summer (January to March) and the PMV model for winter (June to September). The adaptive comfort model and PMV model are both optimizing for the same “maximizing” direction. To reduce the number of objectives, they were summed up as one objective.
TS is the temperature variation over time. Analysis of stability is usually conducted with time-related charts. However, there is yet a specific index or method defining how stability affects TC. Generally, higher stability means less potential for thermal disturbance. Thus, a simplified method to model stability is to calculate the error between hourly temperature differences over daily average temperature. The TS was the sum of the simulated hourly indoor temperature (
SG can be evaluated with image-based and grid-based calculation model. Although imaged-based glare simulation is more precise for glare prediction, 74 it requires excessive computational power and time, making it impossible for annual hourly evaluation. 75 Annual Sunlight Exposure (ASE) is a grid-based calculation model accessing both location and time for glare probability and approximating the potential glare problem with a considerably shorter time. ASE is adopted in LEED v4 standard 76 and WELL v1 standard 35 as an effective SG indicator. The threshold of acceptable glare is recommended at ASE 1000 lux, 250 h < 10%, which stands for less than 10% of the area being exposed to over 1000 lux horizontal illuminance for more than 250 hours annually. Thus, ASE (1000 lux, 250 hr) was adopted for glare approximation.
View-out (VO) was also set as an objective to balance the occupants’ need for outdoor view as an additional parameter from the designer’s intention. Indoor designs and is also an important occupancy satisfaction feature. VO can offset some unsatisfactory feelings from glare. Generally, a large view angle is preferable in modern offices. View analysis was based on a Horizontal 60° cone of vision algorithm which approximates the percentage of outdoors visible from indoors at each test point at a seated eye level of 1.2 metres. View analysis returns an average percentage for the whole space. Defining parametric design variables for MOO
The façade concept was developed to reflect the identified problems in the POE. The design followed the parametric concept, by separating the design into several elements and assigning variables to control the shapes of these elements. These parametric geometries were then assigned different materials and went through simulations in Building Performance Simulation (BPS) tools. As in Figure 5, three types of parametric geometries were developed based on the typical façade module, to simplify the parametric geometry model. The variable parameters were selected to be directly related to the IEQ performance. Besides the geometry, the properties of this element were also set to be changeable by the MOO program. Vertical shading fins were selected for better performance over the low-angle sun. The length of the vertical fin was set as a parameter for changing the shading effect. To change the glazing ratio for solar aperture and thermal properties, an insulation panel was added to the top of the façade element. The size of the lower glazed area could be changed with the parameter. Another parameter set, with/without secondary glazing, was set to further improve the façade thermal performance. Double glazing and triple glazing were not considered because it is not allowed to replace the original window panels. Table 3 recorded the detailed setting for the design variables. Façade design concept and its parameters.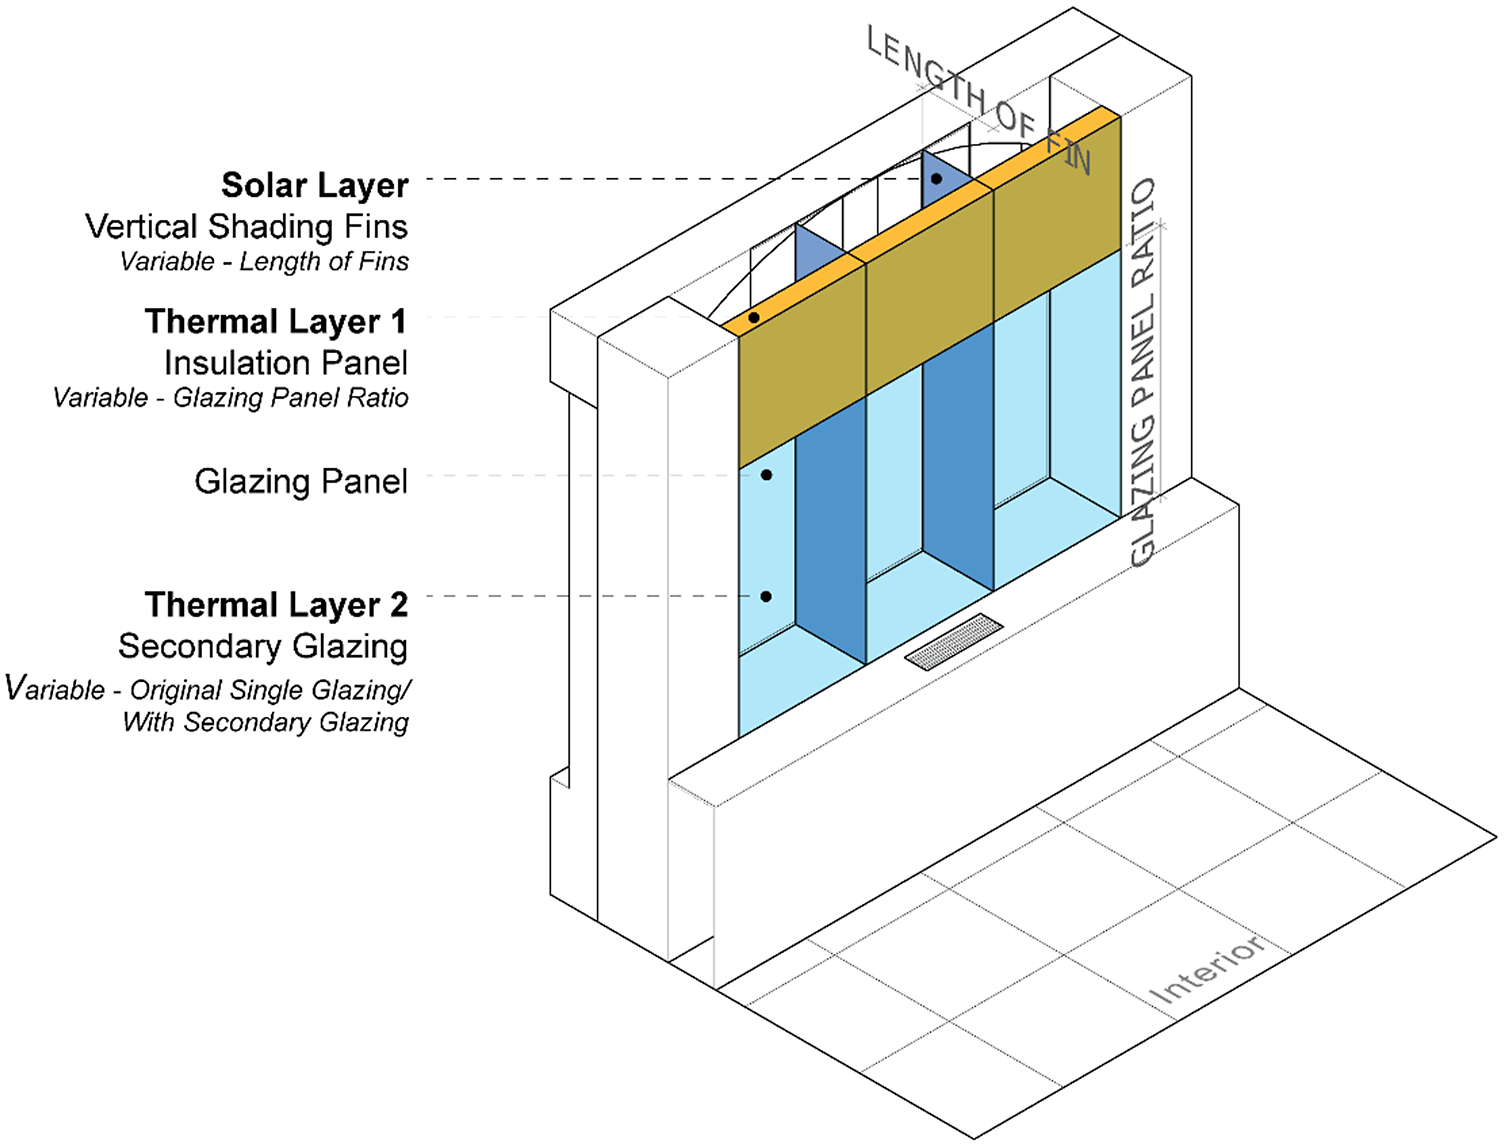
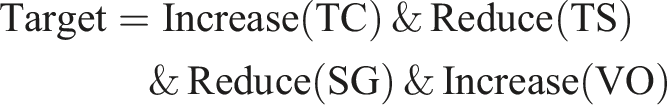
Objectives and objective functions (simulation models).
Summary of design variables for MOO.
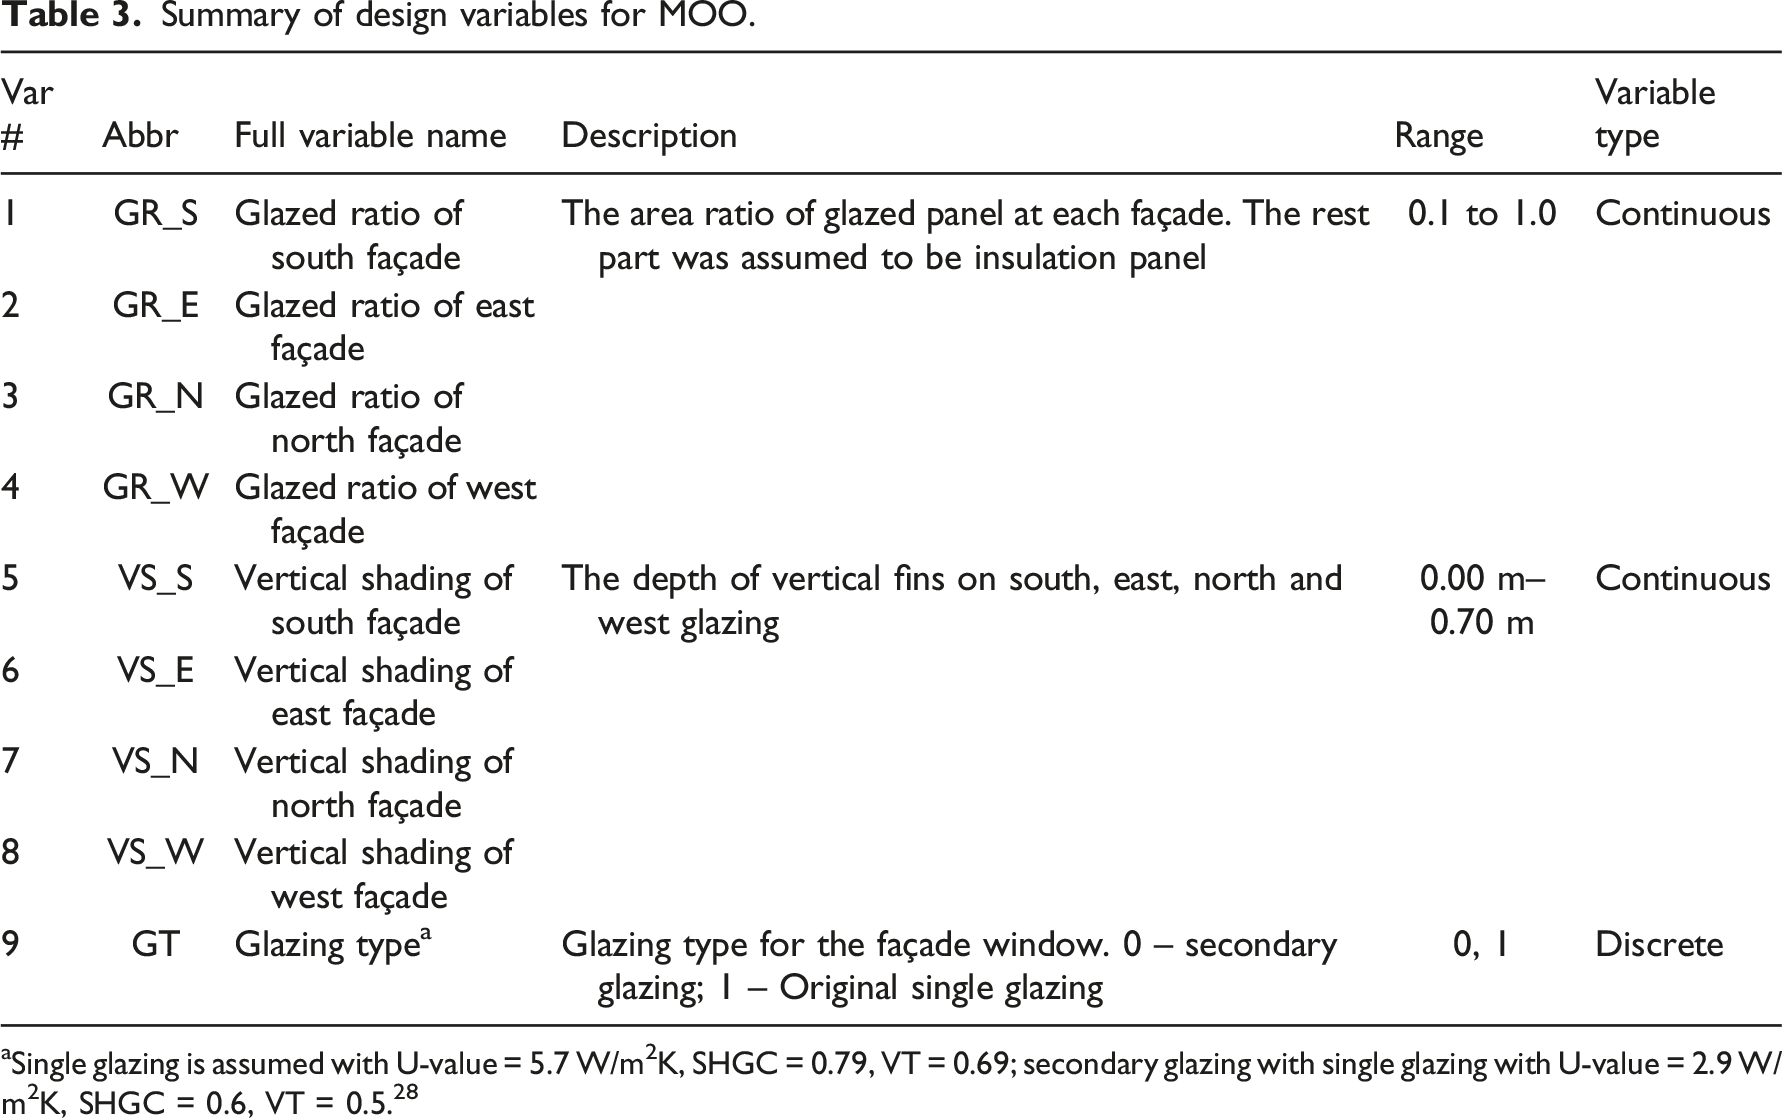
aSingle glazing is assumed with U-value = 5.7 W/m2K, SHGC = 0.79, VT = 0.69; secondary glazing with single glazing with U-value = 2.9 W/m2K, SHGC = 0.6, VT = 0.5. 28
MOO process
The optimisation genes and objectives were set according to Table 2. Because the MOO algorithm proved to be more effective at a higher population size,
22
the population size for each generation was set at 60 to reduce the possibility of local optimal. The elitism, mutation probability, mutation rate and crossover rate were set to 0.5, 0.2, 0.9, and 0.8 respectively. Eventually, MOO converged and ended in the eighth generation. 101 Pareto front solutions were generated and identified. These Pareto-front individuals went through a selection process for the optimal individual. As in Figures 6 and 7, the elite candidates as well as the Pareto front candidates distributed randomly across the design variables and objectives Figures 6 (a). All Pareto front candidates ranged from 73% to 90% for TC (as in y-axis of Figures 6 (c) and y-axis of Figures 6 (d)), 3727 to 4908 for TS (as in colour scale of Figures 6 (b–d)), 0.1%–25% for SG (as in x-axis of Figures 6 (b) and x-axis of Figures 6 (d)), and 0.6%–14.5% for VO (as in y-axis of Figures 6 (b) and x-axis of Figures 6 (c)) . The range of TC and TS was relatively small, suggesting that the design concept was less effective in improving office thermal performance. The range of SG and VO was relatively large, indicating a wide variety of design options for lighting performance. Projection of the 3-dimensional plot space over either two objectives axes screenshot for Pareto front and history candidates for view over ASE result, comfort index overview result, and comfort index over ASE result. The grey mesh represents the Pareto front (a). Distribution of (a) and (b) pareto front that fulfil the ASE 1000 lux, 250 hr < 10%, and (c) and (d) all Pareto front.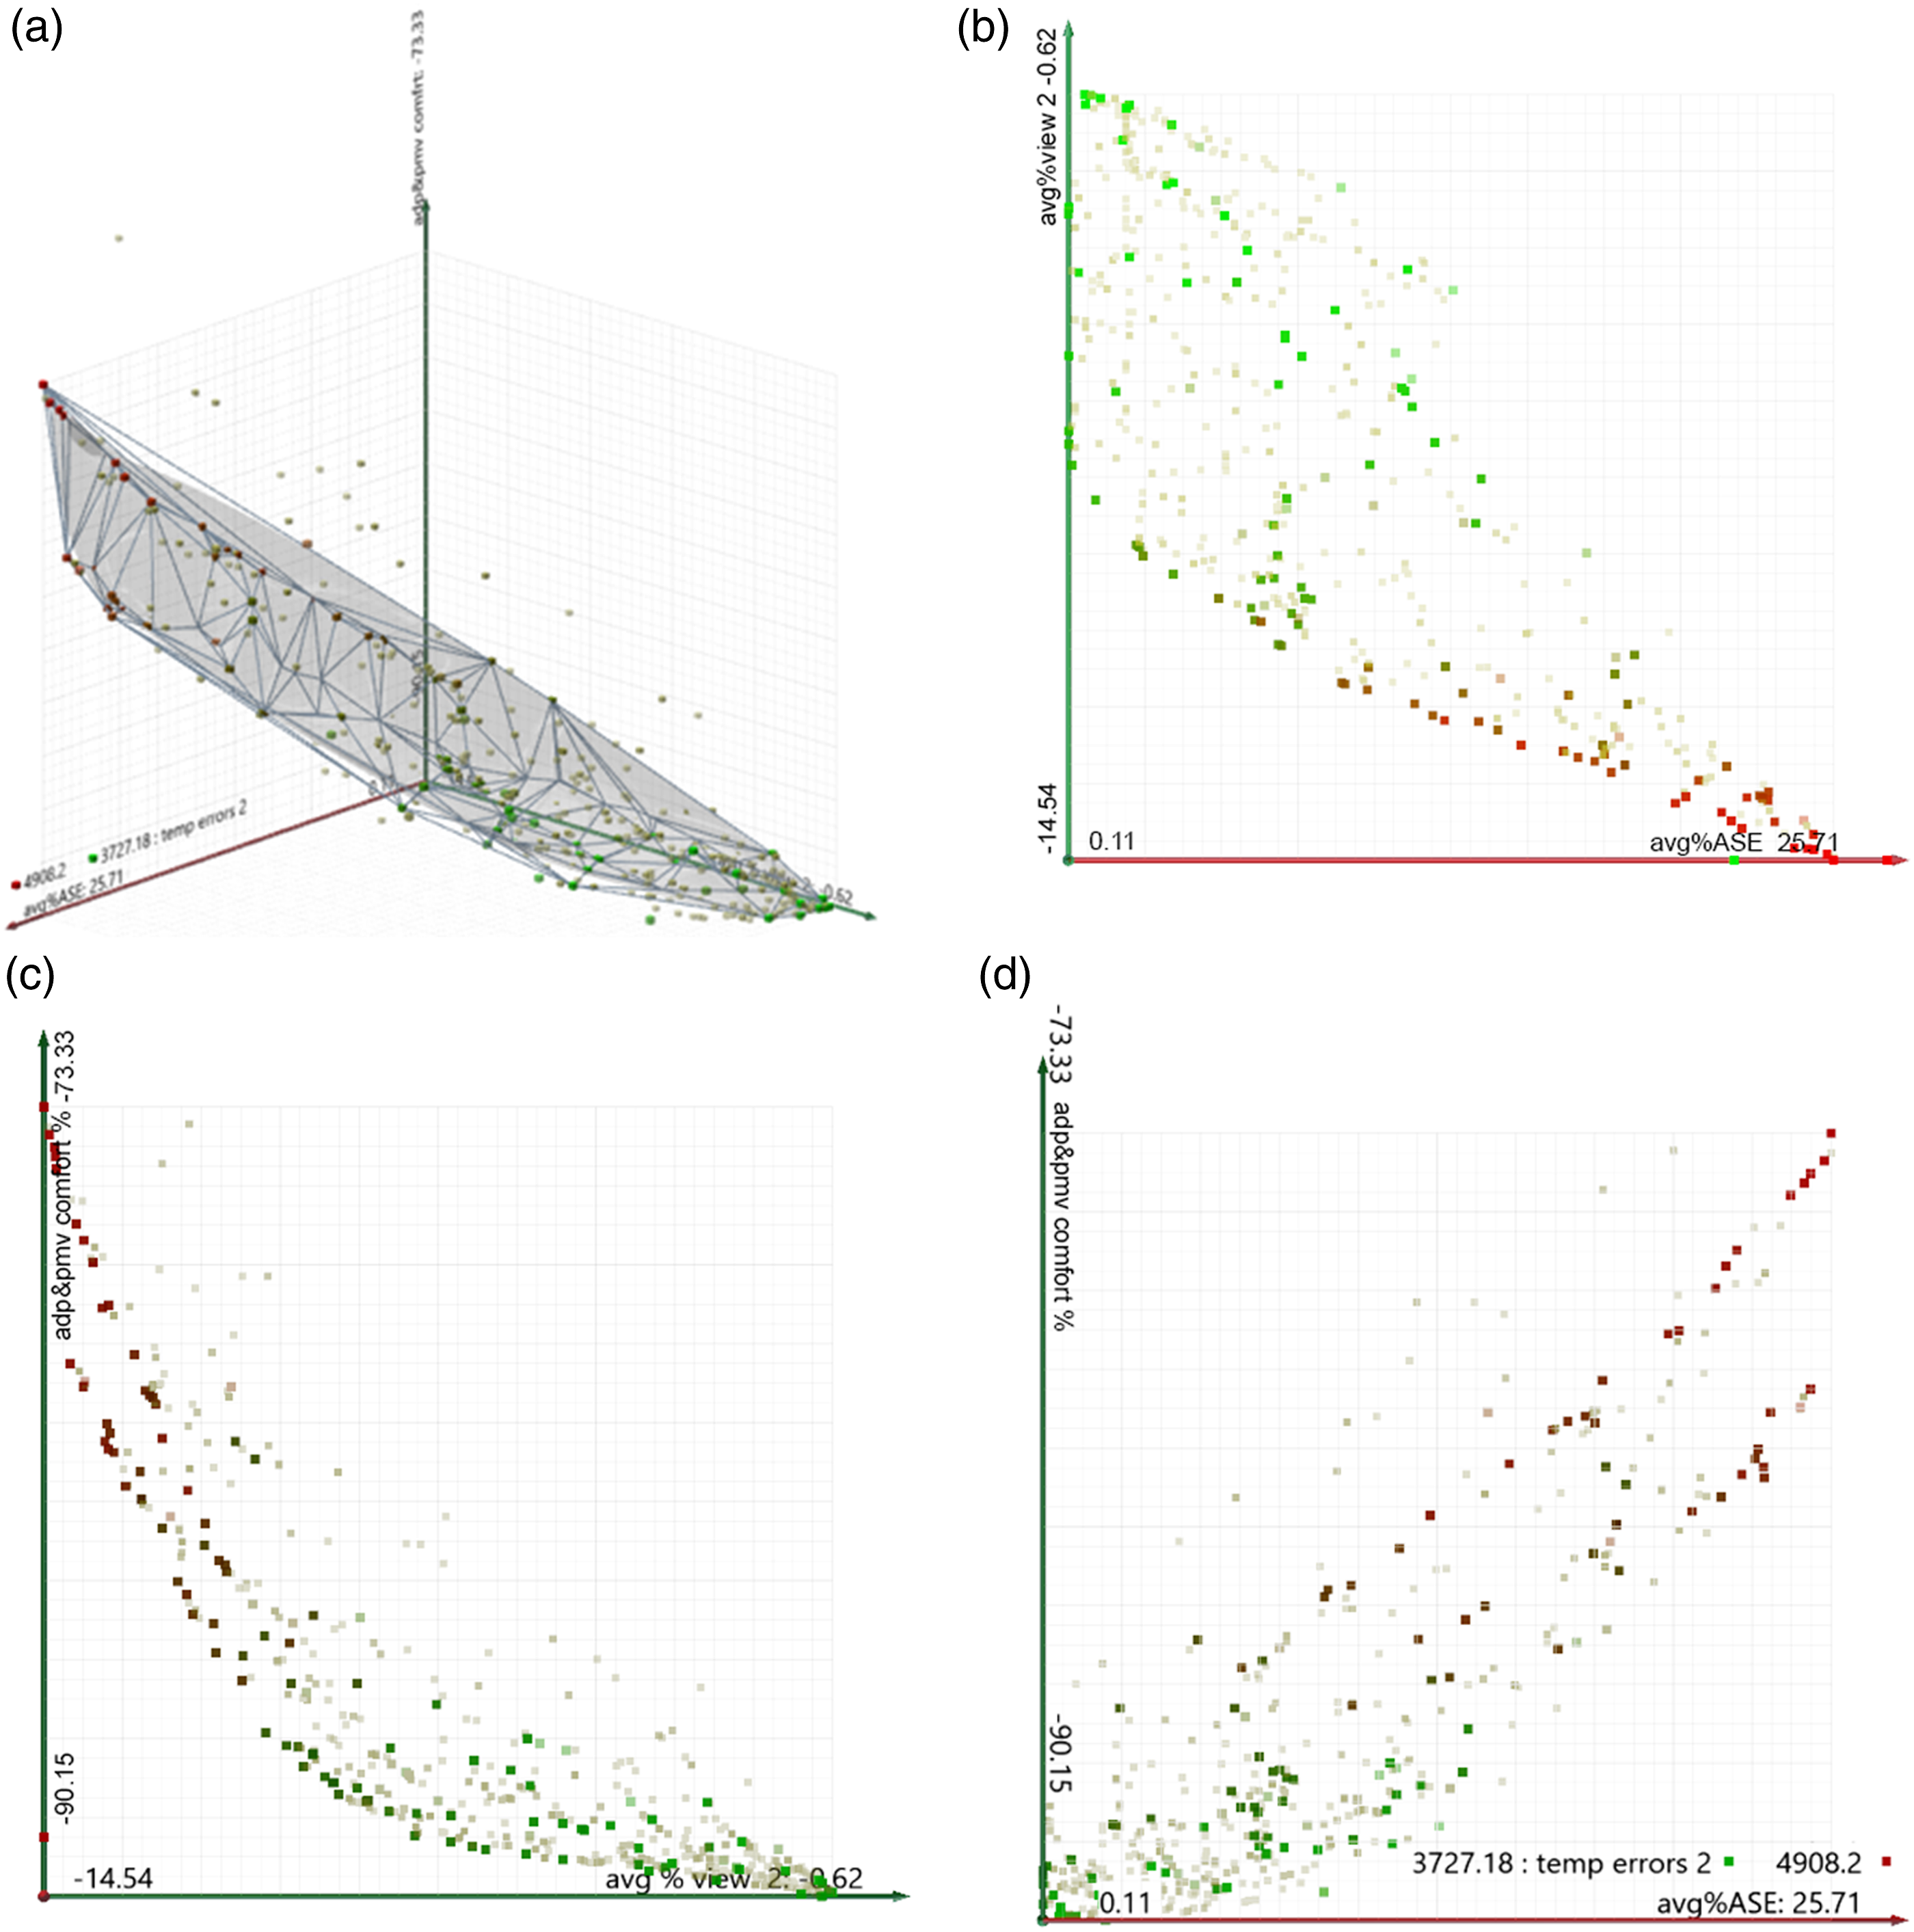
Post-processing
Filtering process in this case study (done with excel data filtering function).
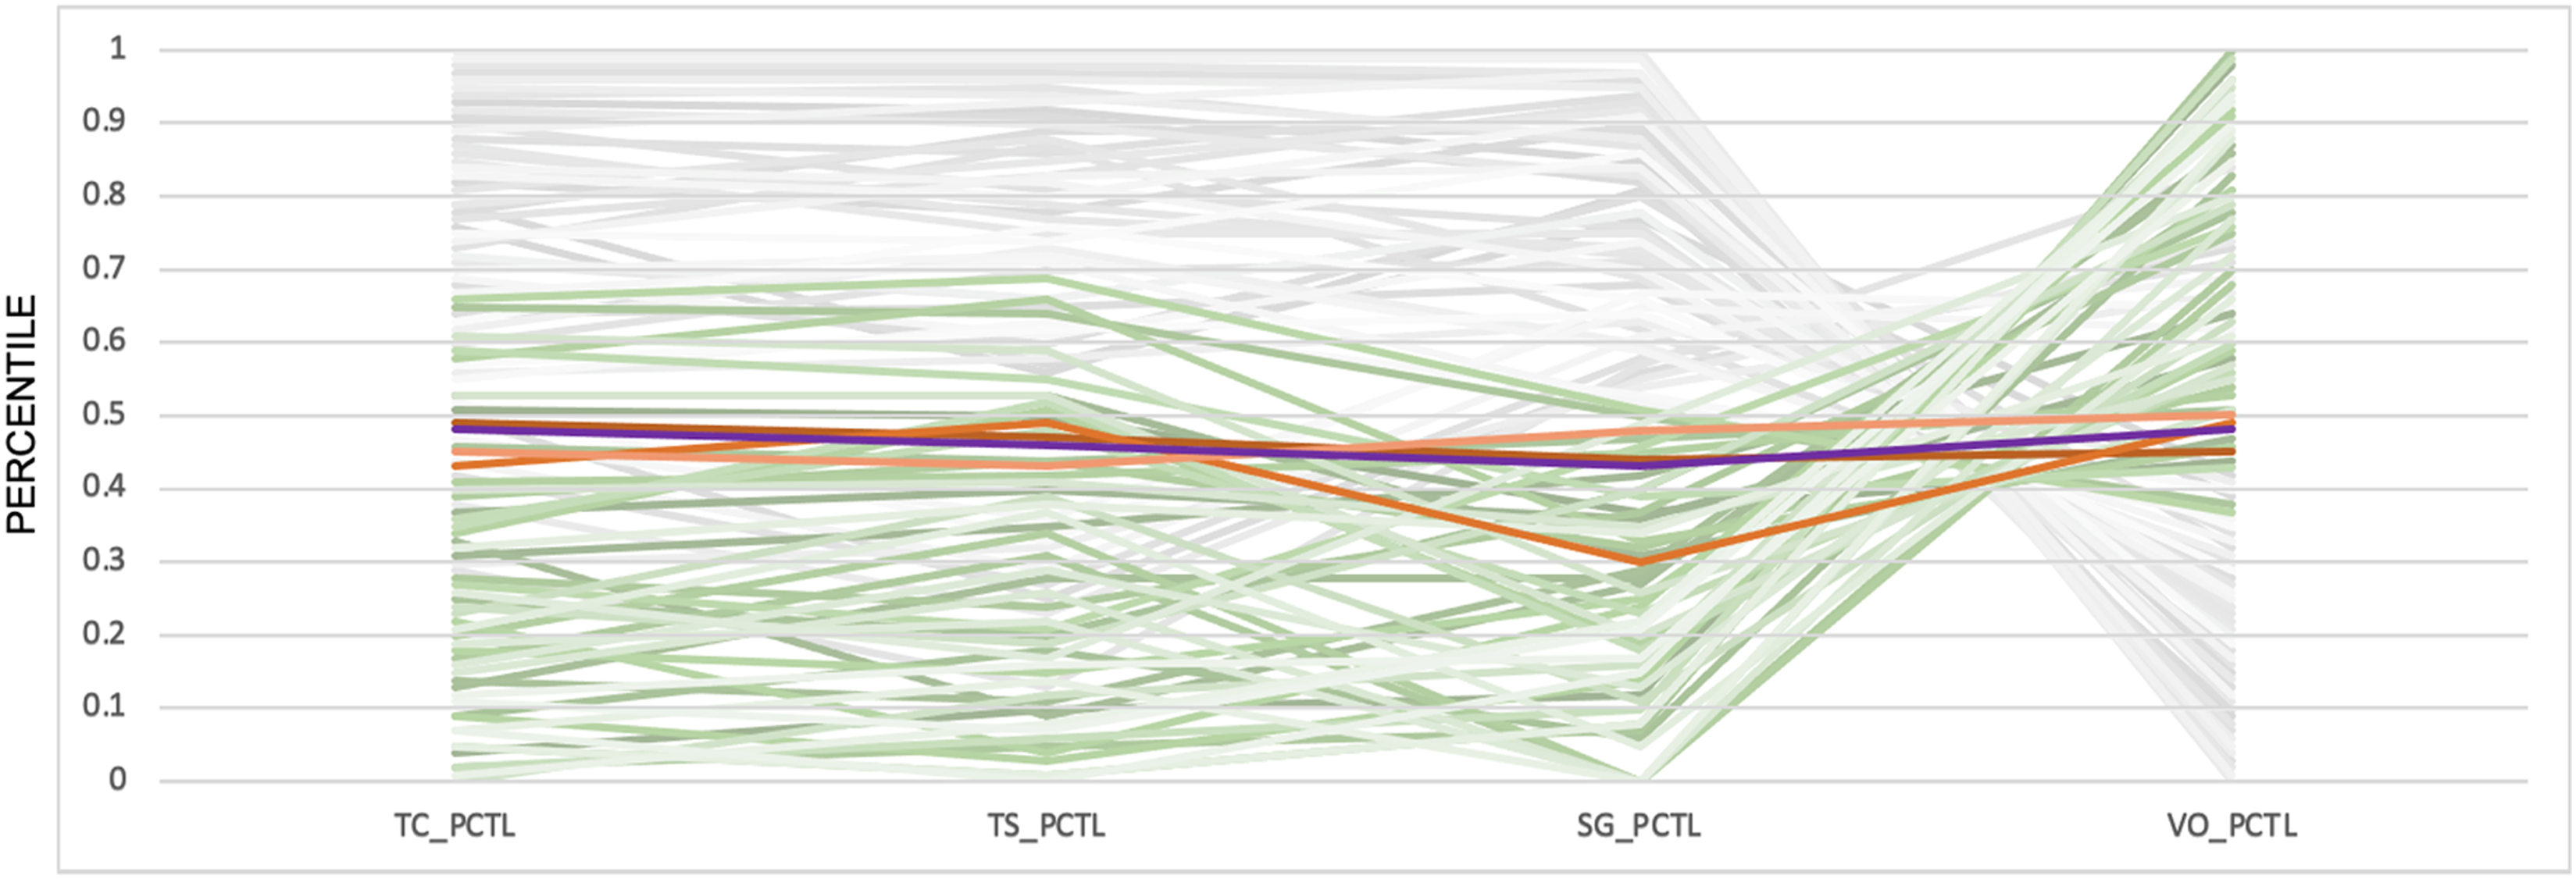
Result variations for the Pareto front. Each line represents the percentile result from an induvial candidate. The purple line represents the selected optimal solution. The orange lines represent the preferred candidates. The green lines represent the candidates that fulfil ASE 1000 lux, 250 hr < 10%. The grey lines represent the candidate that are “knocked-out”.
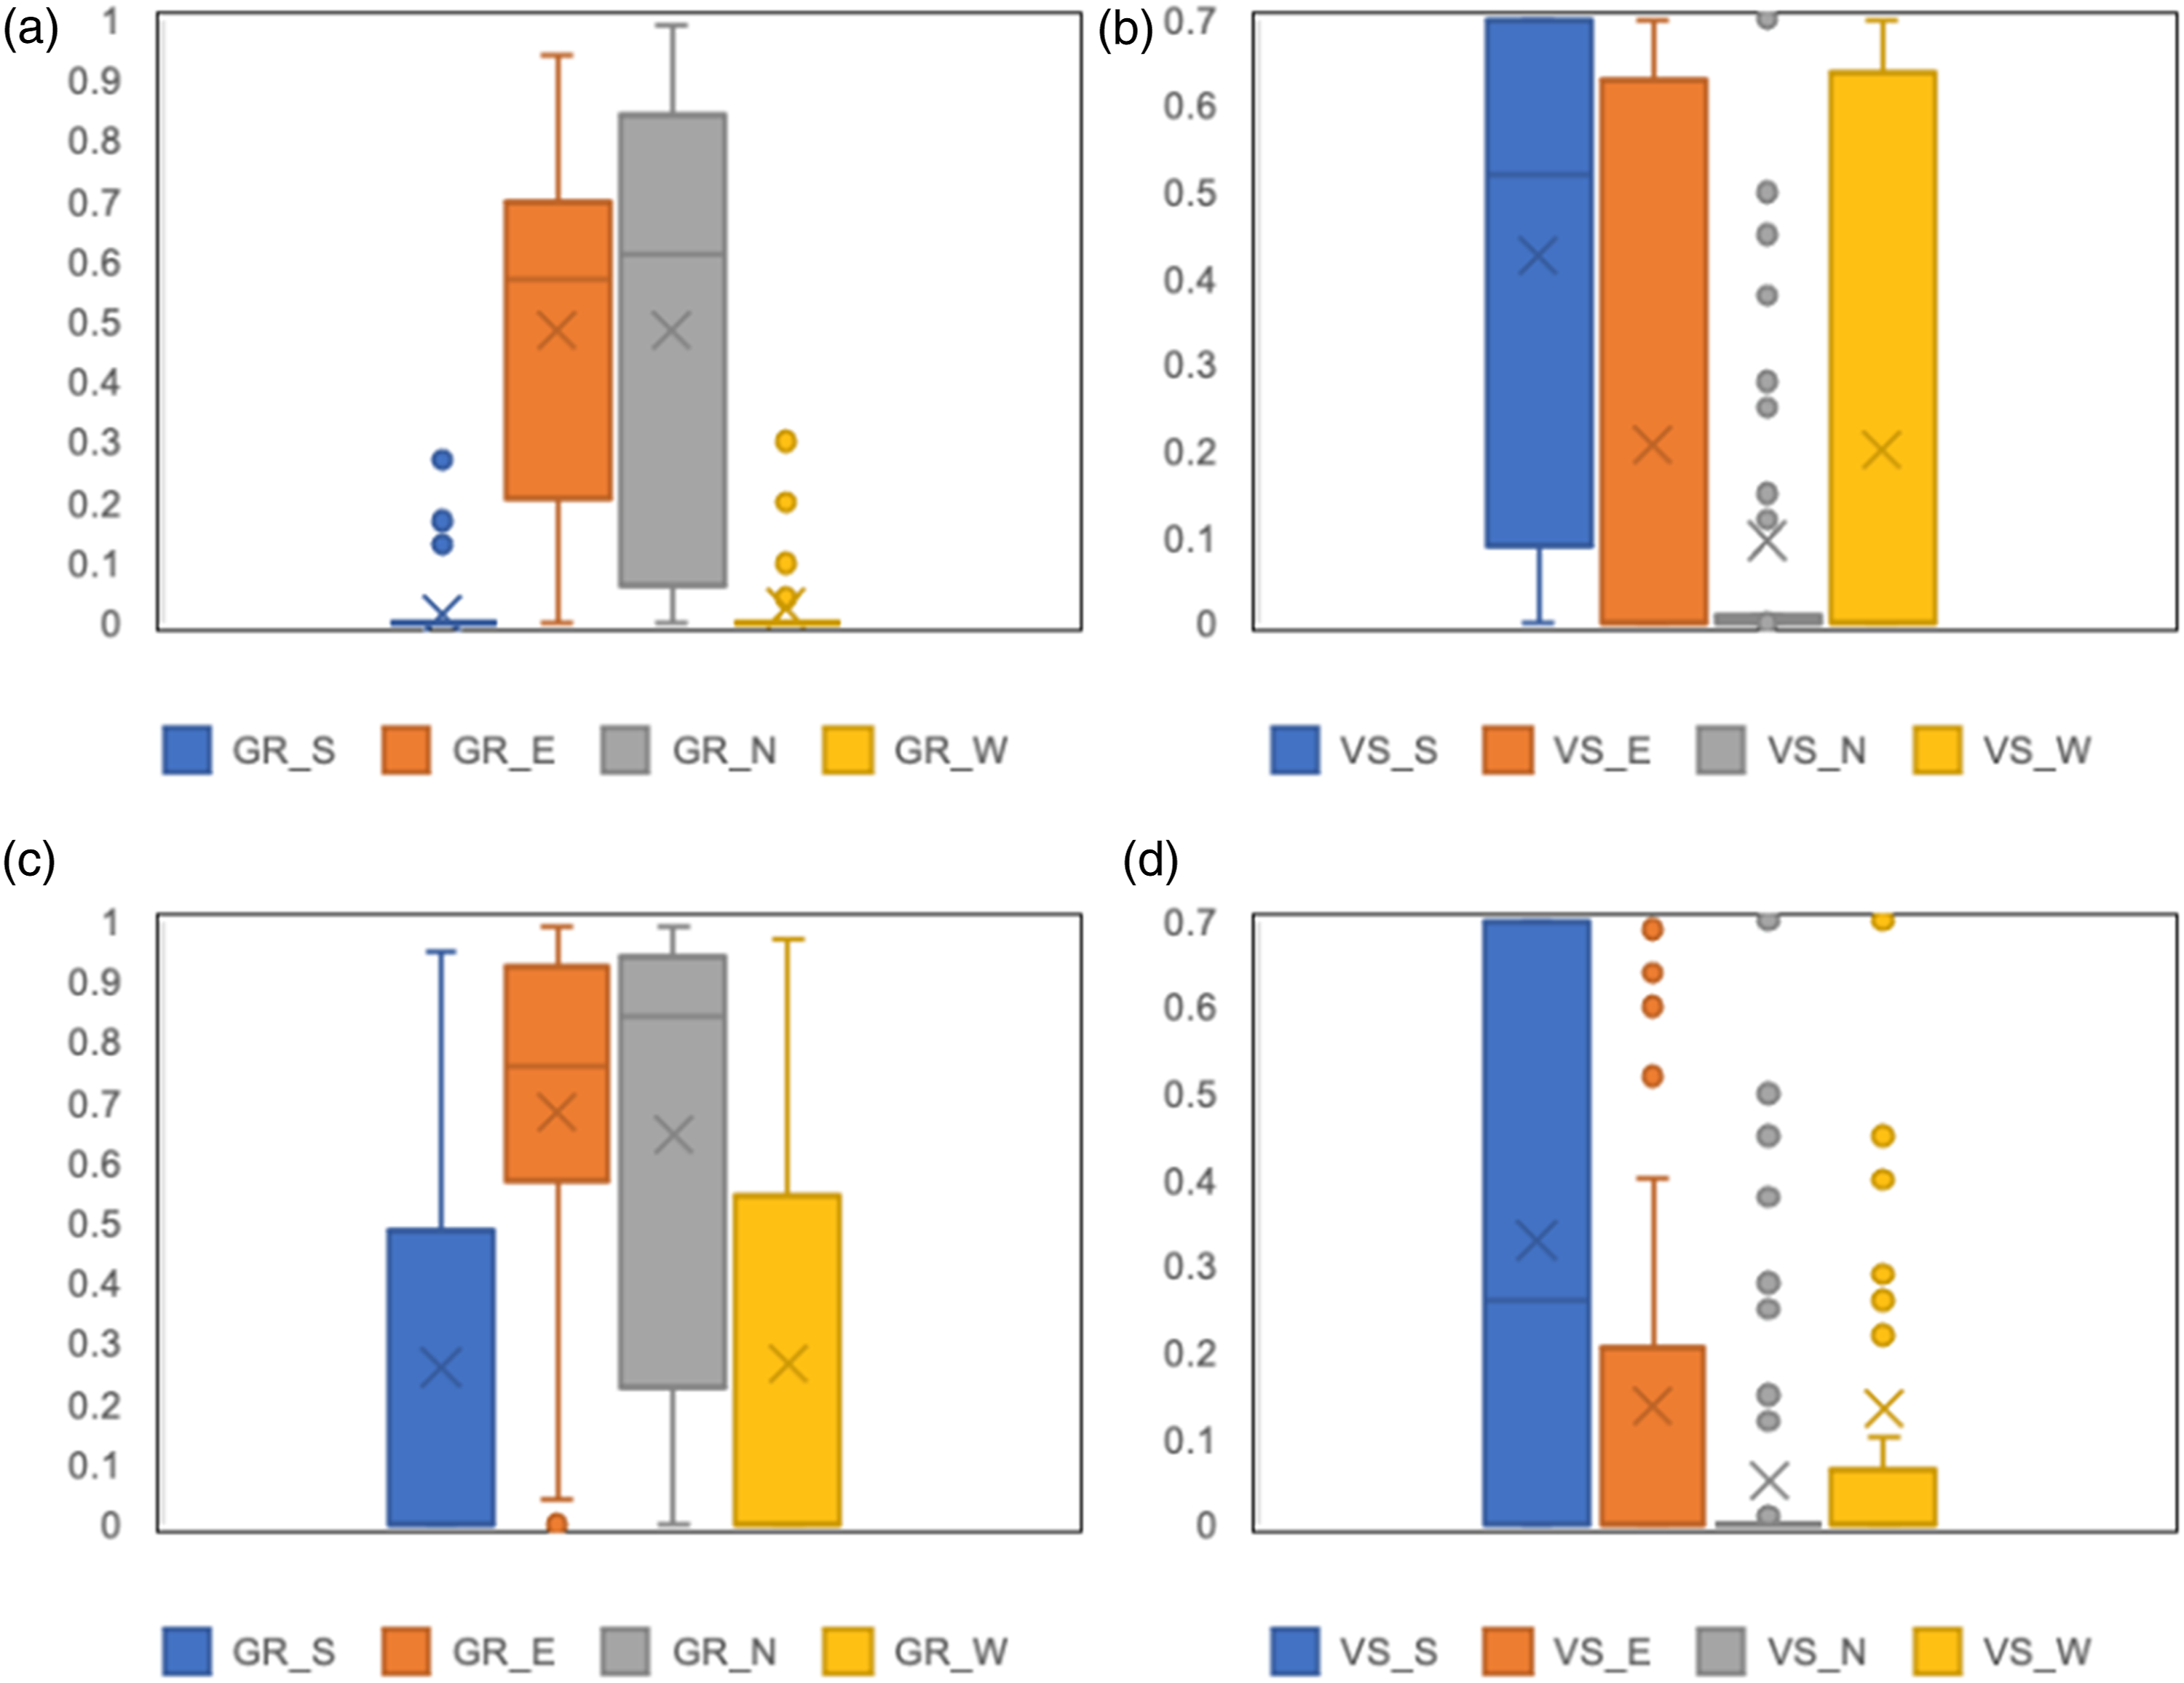
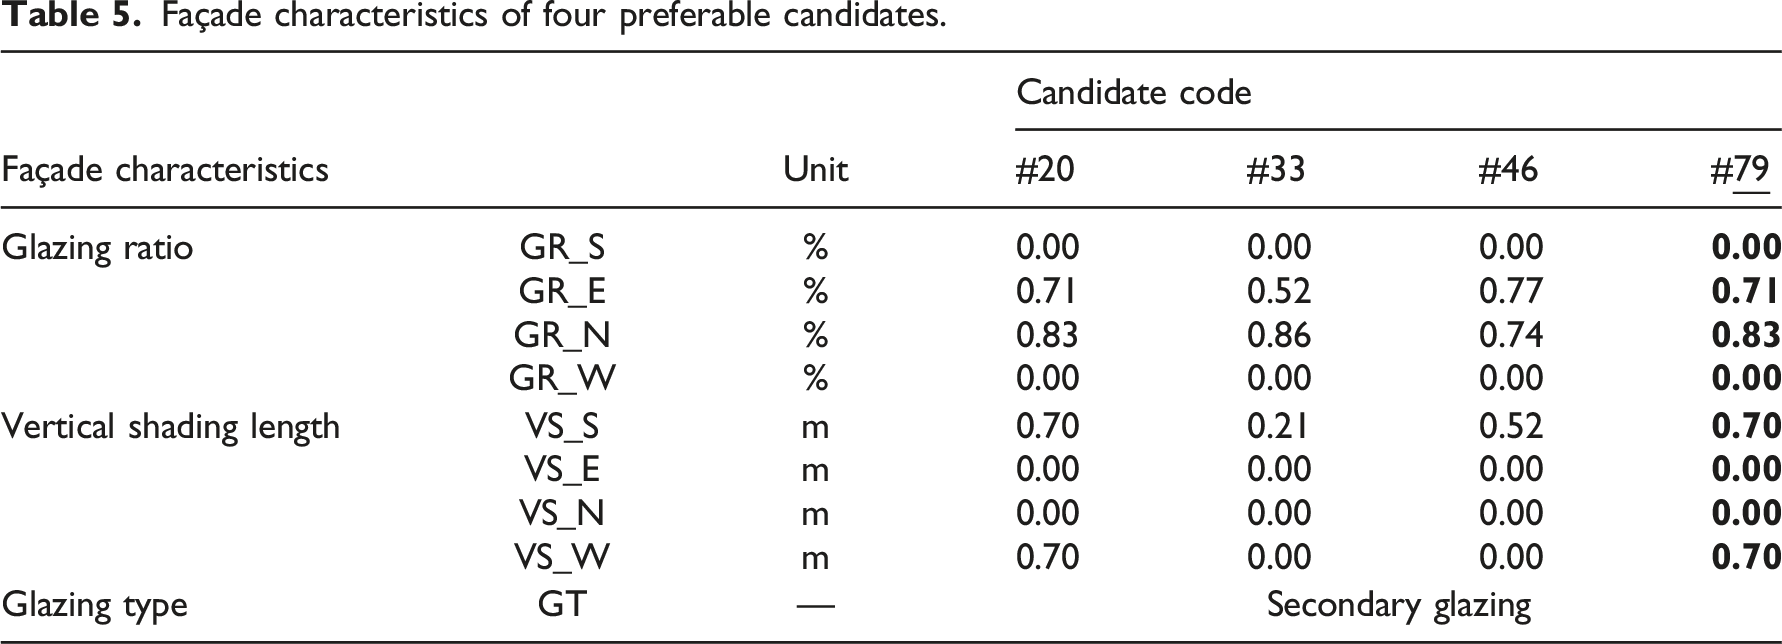
Façade characteristics of four preferable candidates.
Simulation results of four preferable candidates.
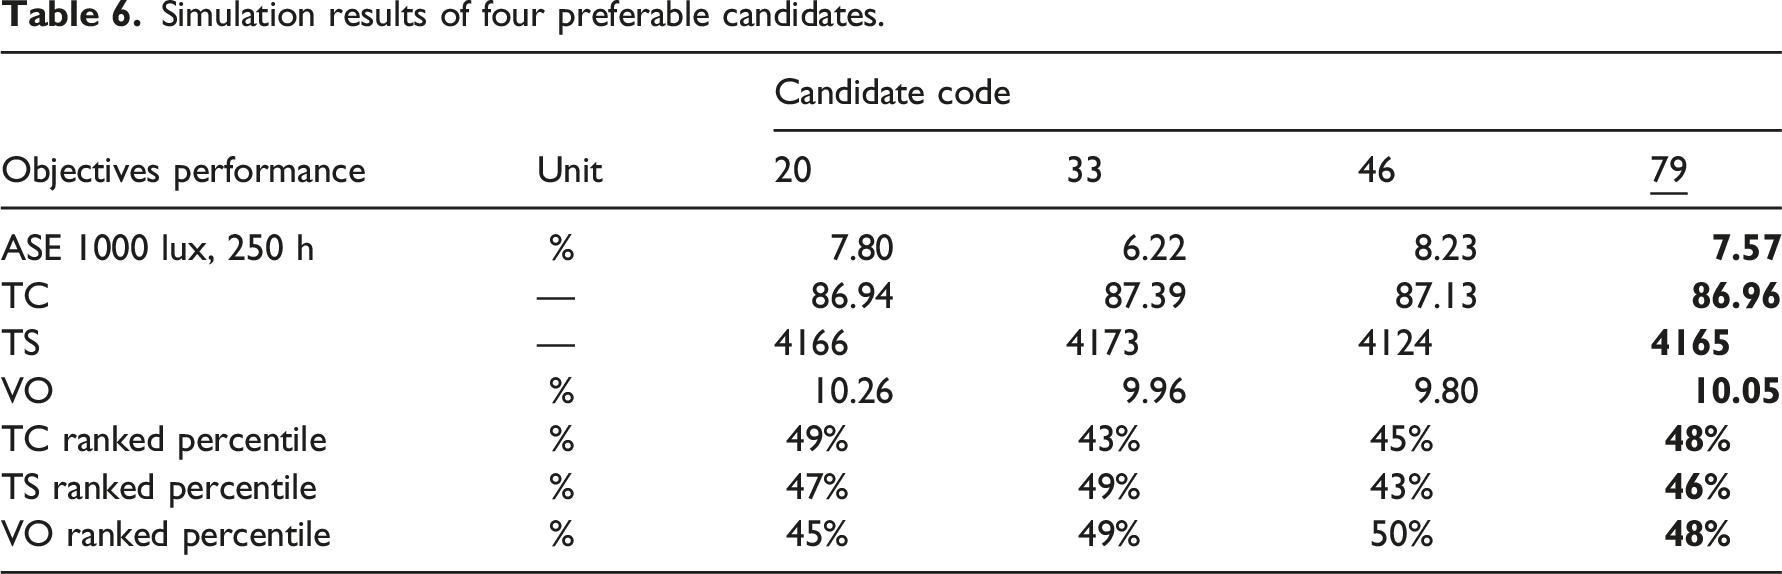
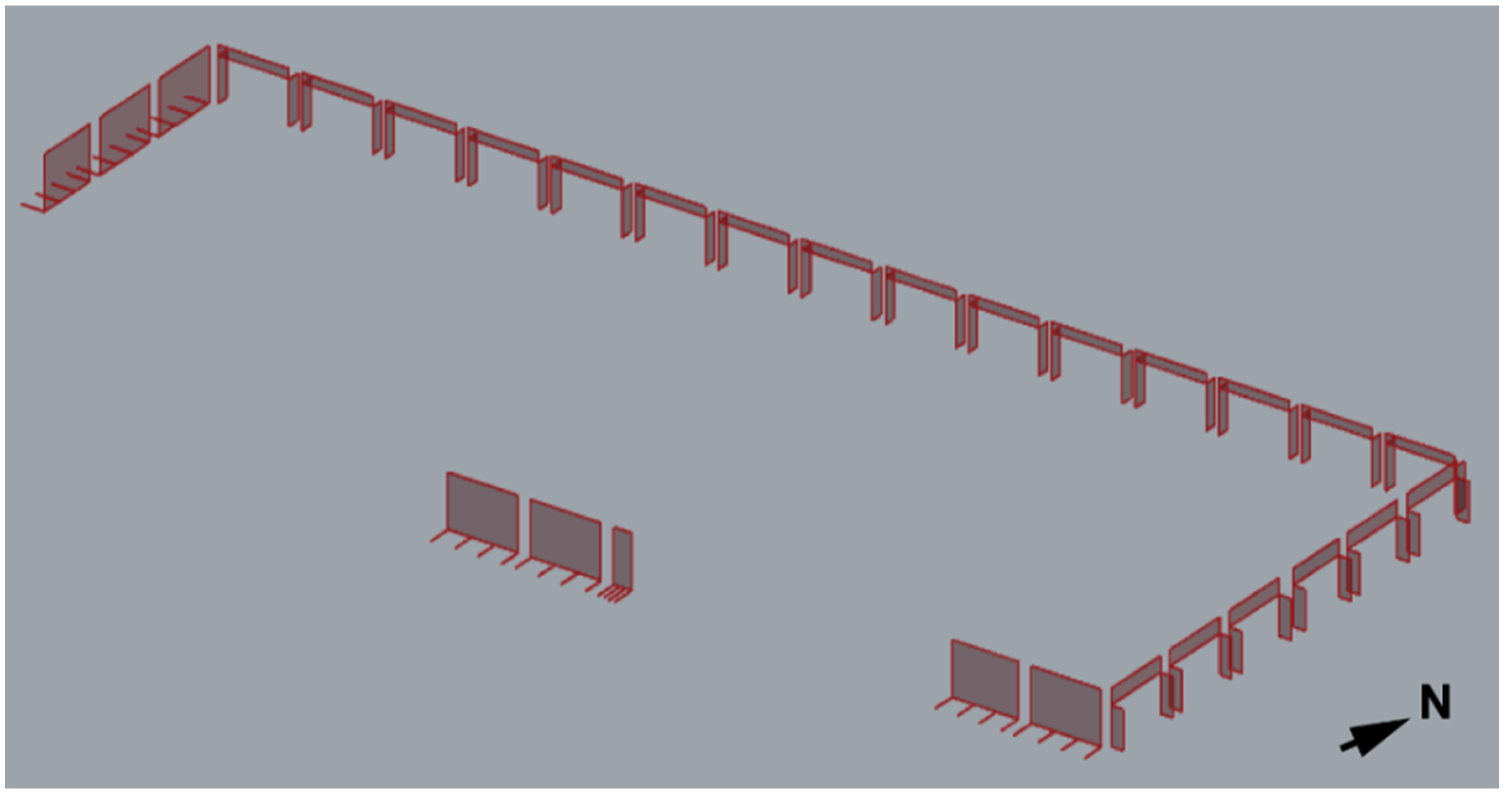
Model of optimal solution, candidate no. 79.
Optimal candidate results
The optimal solution was compared with the baseline model. The improvement was substantial for the glare but marginal for TC. 86% of the occupied hour was predicted comfortable in summer, creating a satisfactory summer working environment. That in winter, however, dropped to about 1% from 3%. The TS slightly improved with improved glazing type.
Comparing the simulated objectives results of the optimal solution to the baseline.
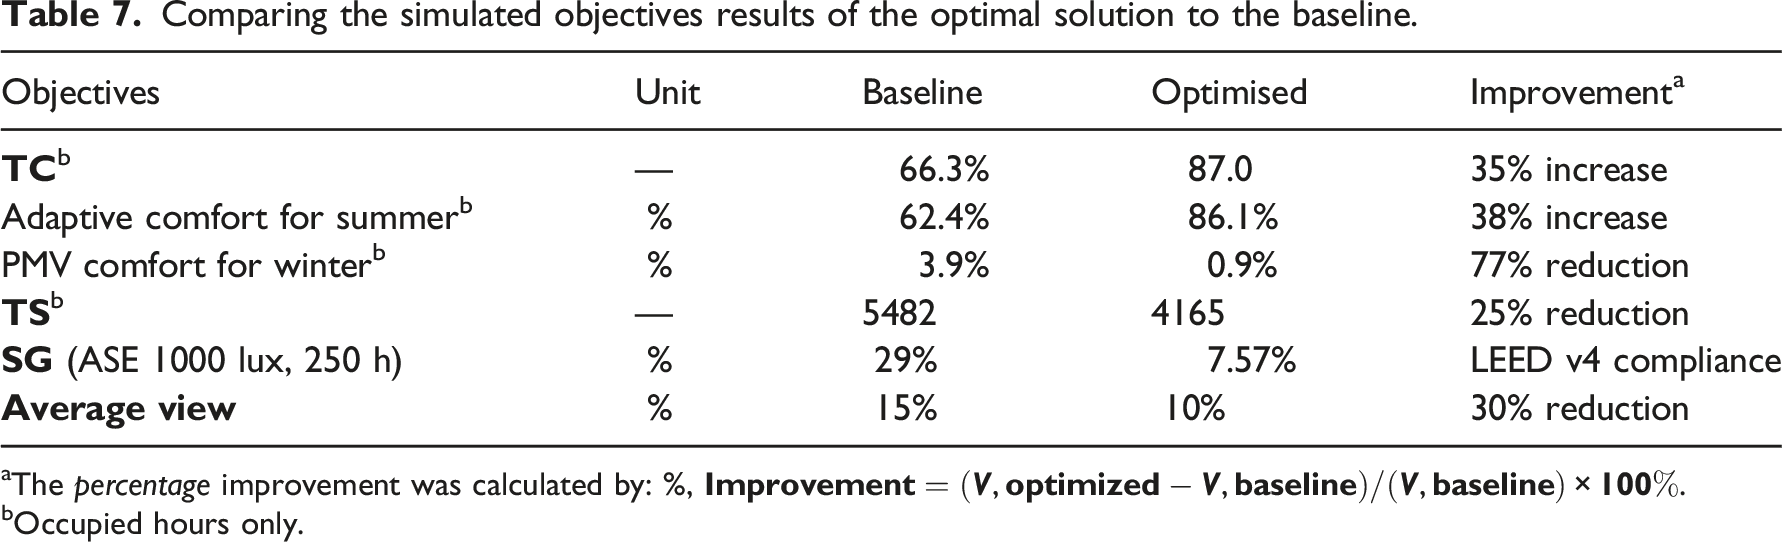
aThe percentage improvement was calculated by: %,
bOccupied hours only.
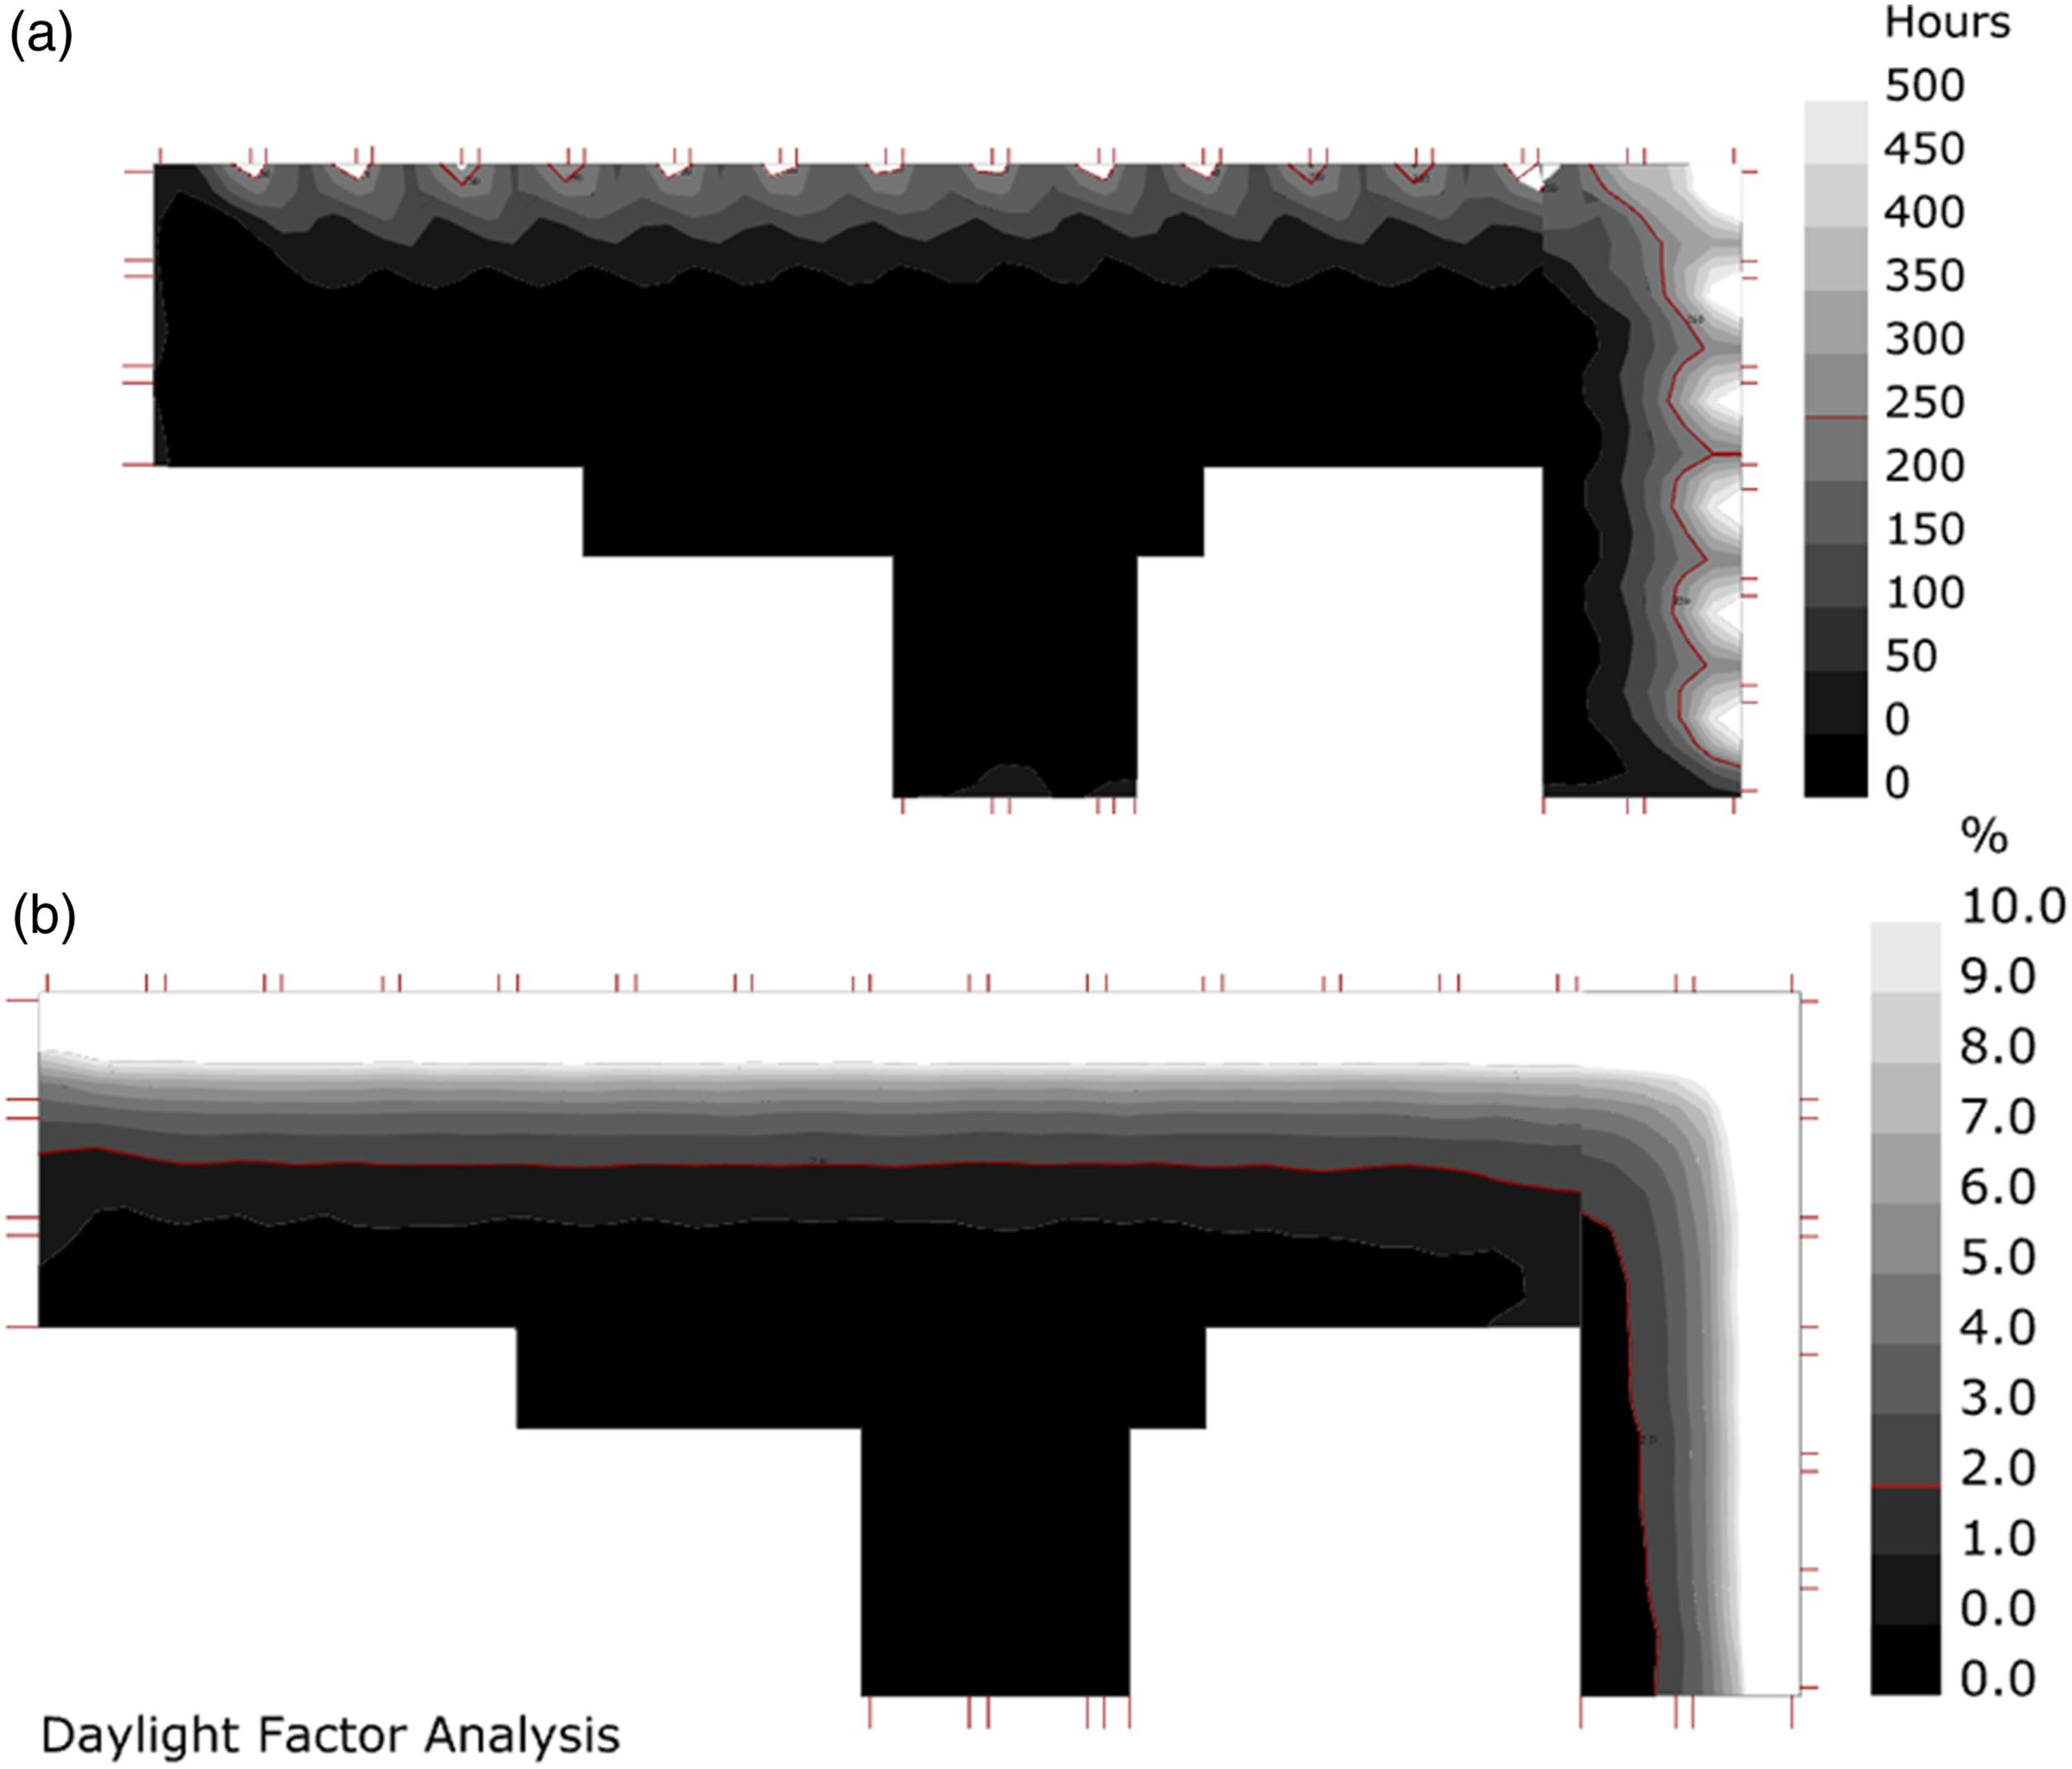
Glare probability analysis with ASE simulation (a) and daylight factor analysis (b) for the optimal solution.
In terms of TC, MOO chose to bias the comfort in summer and omit the winter comfort, because the two indices were calculated together instead of separately. The poor building thermal construction also amplified the winter thermal discomfort, making the MOO bias the easier summer comfort solutions. Analysis to the pareto front also indicated that improving the glazing only cannot improve the winter TC to the required comfort level. The office required a thorough retrofit for both opaque and transparent envelope components as well as the equipment to achieve the required thermal performance.
Conclusion
This study developed a systematic framework to identify critical comfort issues with POE and generate an optimised design option with MOO. The framework first cross-refers benchmarking and correlation study and integrates them with non-linear satisfaction theory to determine the critical comfort factors. The method then parameterises the critical comfort factors with building simulation programs and sets them as objectives in the design optimisation program. The study also presents a case study. In this case, the open-plan layout for easy noise propagation, large glazing area for SG, unsatisfactory building thermal performance, and ineffective heating system are identified as key comfort problems. To maintain sufficient daylighting indoors, the simulation suggests fully insulating the south and west façade, while only insulating the top part of the north and east façade without extra shading devices. Also, the results also suggested adding a secondary glazing system and improving the opaque elements for winter comfort.
The integration of different techniques simplifies the overall workflow of MOO and makes the design result and suggestions more reliable with support from simulation. The computer-based workflow creatively combined POE, statistical analysis, and MOO program, which replace most human analysis effort throughout a design cycle from the initial design input to design suggestion in the early design stage. Based on the initial design concept, the generated optimal results and preferred candidate suggested several key design strategies for design developments. The process replaced the trial-and-error iterative process in optimising environment design solutions. Different from typical design workflow where DM is usually empirical, MOO examines a large number of design alternatives and gradually finds the optimal through statical analysis and logical comparisons. The application of parametric design also allows for generating a novel optimal design under a new design concept by simply modifying the geometry and BPS models. The proposed framework reduces the process of redoing the manual modelling and the iterative process from the beginning.
The limitation of the process might be that it is a black box method which might introduce undetectable errors. The time for MOO was quite long due to the excessive time in BPS. Further study might study the surrogate model to perform BPS with much less time, making it more applicable for the tightly scheduled design industry. In addition, the correlation study was found to have several limitations which might affect the identification of key IEQ factors, including false correlation and disruption by small sample size. In this study, these disruptions were not rare, which might be due to the small sample size. For example, “sense of safety” to “air freshness in summer” was reported related with ρ = 0.492. Therefore, it is recommended to cross-validate the result with a different analysis, e.g., descriptive analysis, correlation analysis and ANOVA, to avoid potential disruptions.
Footnotes
Acknowledgements
The authors would like to express their gratefulness to Dr Hector Altamirano at University College London (UCL) and Alessandro Baldini at the Eckersley O’Callaghan office for their help and guidance throughout this study. The authors are grateful for Adrian Leaman at Useable Buildings for his generous support with BUS methodology questionnaires.
Declaration of conflicting interests
The author(s) declared no potential conflicts of interest with respect to the research, authorship, and/or publication of this article.
Funding
The author(s) received no financial support for the research, authorship, and/or publication of this article.