
Abstract
The built environment has been a significant contributor to global carbon emissions. It, therefore, has a vital role to play in the reduction efforts of future climate change. While the design of buildings may determine future energy use for cooling, heating, and lighting during the operational stage of the building, this study aims to observe the effect of the building design on the operational as well as the whole-life carbon emissions. Past studies have focused on either the operational carbon or the embodied carbon of a building. Using a cradle-to-grave assessment of a typical UK supermarket, this study explores the relationship between embodied carbon and operational carbon. Additionally, it examines the effects of the variables between three approved construction methods of the same design on the whole life of carbon. These methods are a steel structural frame and cladding panel external wall, steel frame and poroton walls, precast concrete and glulam frame and precast concrete walls. The findings of this research will contribute to mitigation strategies for the environmental impacts of supermarket building construction whilst providing a framework for future assessment of the whole-life carbon of supermarket buildings.
Practical Application
Employing the life cycle assessment methodology, this paper examines the potential of minimising both embodied and operational carbon by observing the whole life carbon. Highlighting the influence of the GHG emission contributing factors in each stage on each other. Additionally, the recommended methodology for the supermarket building types of this case study, could be adapted for other types of buildings. The findings could also augment carbon emission research and guide the development of supermarket buildings to low carbon intensive. Furthermore, collaboration with the industry in carrying out this research aids in adopting the findings as practical and theoretical guides for engineers and designers in reducing the building sector’s harmful environmental impact.
Introduction
Background & whole life carbon
The rise of global warming and climate change has resulted in many actions by different bodies. The UK government has approved the Climate Change Act 2008, which sets legally binding targets for greenhouse gas (GHG) emission reduction, with the Committee on Climate Change (CCC) mandated regular government progress reports on reaching the target of net-zero emissions by 2050. 1 The building sector is one of the most energy-intensive and prominent contributors to GHG emissions. According to the International Energy Agency (IEA) based in Paris, the building and construction sectors are responsible for approximately one-third of total global final energy consumption and nearly 15% of direct CO2 emissions. 2 Data published in 2019 shows the sector accounts for 39 and 11% of global energy-based emissions, respectively. 3 The 2020 CCC Sixth Carbon Budget reported that UK buildings are responsible for 59% of the UK electricity consumption and 87 MtCO2e of direct GHG emissions. In contrast, when including the indirect emissions, the total percentage rises to 23% of total UK emissions. 4 According to the “Global Status Report”, 4 28% of the global carbon emissions are related to the operation of buildings compared to 11% attributed to embodied emissions which involve emissions associated with the construction industry. This report equally highlights the importance of reducing embodied energy and carbon emissions as a primary concern for action. However, the report gave no action plan to reduce carbon emissions and mitigate climate change. Additionally, the construction sector uses up to 36% of the world’s natural resources and accounts for approximately 50% of the solid waste sent to landfills.5,6 Therefore, there is immense pressure on the building and construction sector to reduce emissions.3,6
Carbon emissions are generally categorised into 2 types: embodied carbon and operational carbon. Embodied carbon are the emissions produced during the material extraction, processing, manufacturing, transportation, construction, demolition and final disposal of construction material, also called “capital carbon”. 7 Conversely, operational carbon are the emissions produced from energy used for heating and cooling, lighting, equipment load, and energy loads for any ongoing use. The Whole Life Carbon (WLC) refers to both the operational and embodied carbon of a building.
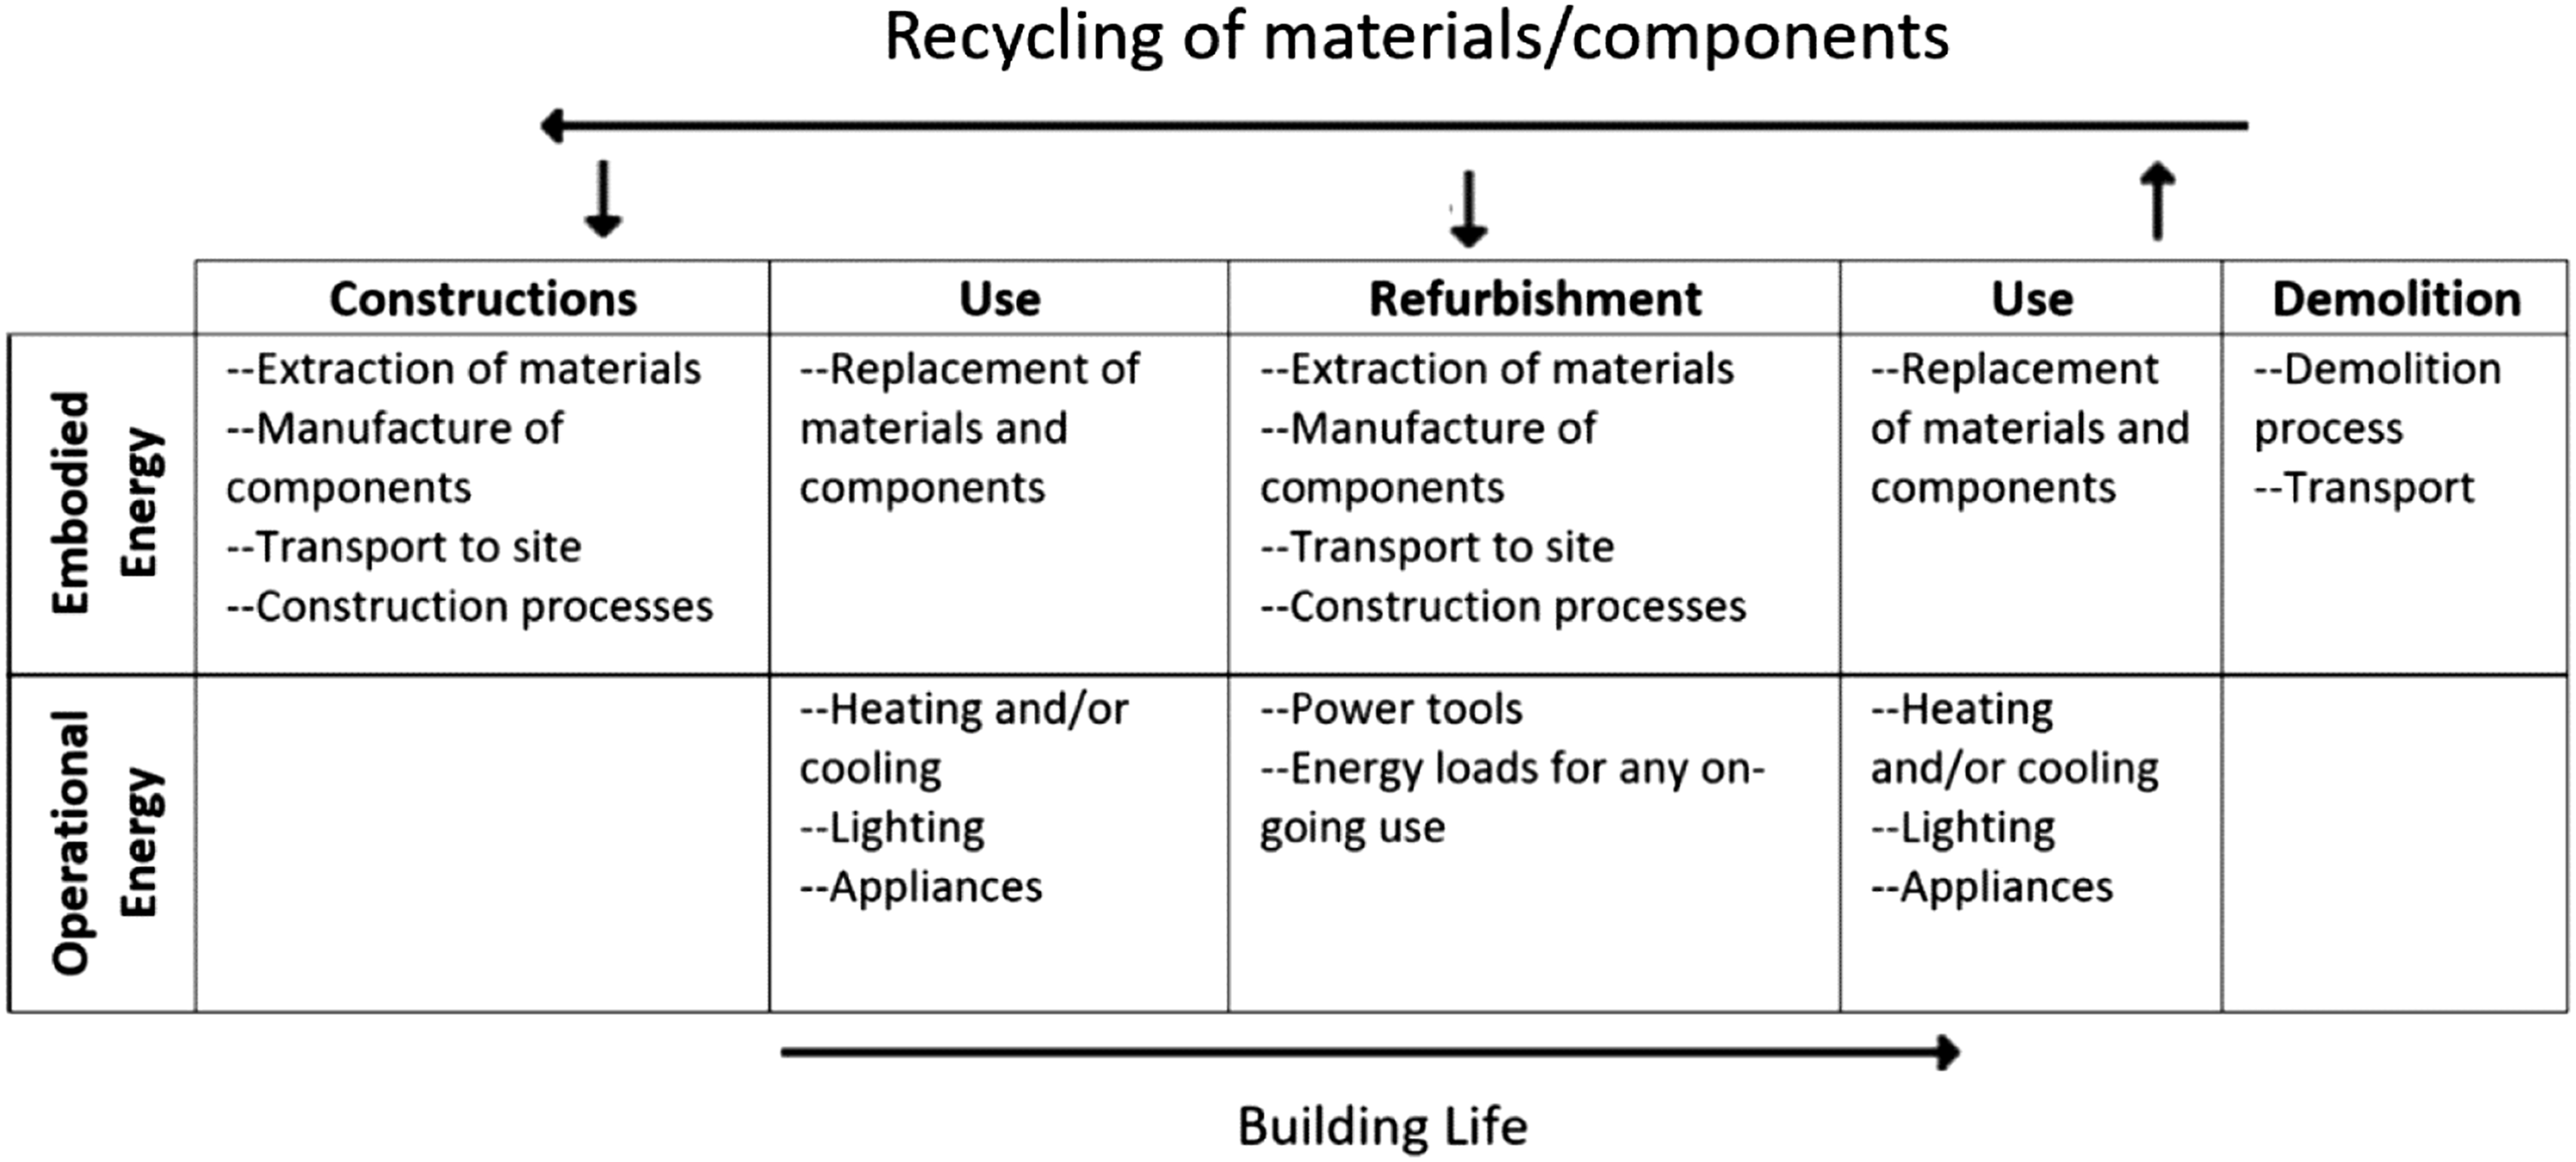
Whole life carbon reduction faces significant challenges, partially due to the emissions occurring at different stages of the life cycle. Reduction of WLC emissions and optimising building design, it is vital to study both the operational and embodied emissions of all the available alternate design options, which would involve the inputs, processes, and outputs of the building at each stage. As demonstrated in Figure 1, the embodied carbon emissions can be examined in two stages. The emissions produced during the building’s construction (including emissions emitted from material production, transport of material, and on-site activities) are termed upfront carbon. And the emissions produced during the demolition or deconstruction of the building (including the transportation of demolished materials, processing of waste and final disposal of waste materials) are termed end-of-life carbon.
8
This distinction is vital as, juxtaposed to the end-of-life emissions, the upfront emissions occur before the building is in use. Operational energy or operational carbon in buildings arises from the building’s lighting, heating, ventilation, air conditioning (HVAC), and appliances. Whilst, these emissions occur at different stages of the lifespan of the building and varying magnitudes, they all significantly contribute to the WLC emissions of a building.7,8 In the past the majority of the focus of the industry has been on reducing operational carbon. This has partially been due to the importance assigned to operational carbon and energy consumption. Indicative components of embodied and operational energy over an illustrative building life cycle recreated from.
9
A study by Moncaster and Symons 10 investigating the carbon impact of each stage of the life cycle in residential buildings, showed that the proportion of the end-of-life stage ranges between 5 and 21% of total carbon emissions. Peng 11 notes that in a comparison study examining the whole life carbon emissions of the domestic sector operational carbon accounts for nearly 85.4% of the WLC. Likewise, a study by Iddon and Firth, 12 focused on the embodied and operational carbon of new-build housing in the UK, concluded that operational carbon accounts for approximately 74–80% of WLC over a 60 years period. Additionally, several studies have revealed that the operational phase is responsible for 80–85% of the life cycle carbon emissions in buildings,13,14 while the remaining stages of a building’s life cycle account for 15–20%. 15
In contrast, a study by Röck et al. 16 conducted a systematic review to ascertain the global trends of carbon emissions occurring throughout the life cycle of buildings, analysing over 650 LCA case studies. The review categorised different energy performance classes based on a final sample of 238 cases. The study found that while the average embodied carbon emissions from buildings is about 20–25%, the share of embodied carbon rises to about 45–50% in highly energy-efficient buildings and can exceed 90% in extreme instances. Likewise, Andersen et al. 17 carried out a systematic review of 226 different scenarios to investigate embodied carbon emission results reported in Life Cycle Assessment (LCA) studies. The analysis concluded that, in general, the average reported values of timber buildings to range between 33 and 50% of embodied carbon emissions of buildings. Nevertheless, the findings showed that the importance of operational carbon is reducing. In contrast, the significance of embodied carbon becomes greater due to advances in energy efficiency and stricter regulations for energy efficiency in buildings. These reviews highlight an increasing need and significance to optimise both operational and embodied carbon emissions of buildings.
Whole life carbon in supermarket buildings
Additionally, there is limited research available focusing on UK supermarket’s operational carbon emissions and less attention has been placed on quantifying and reducing the impacts of the other phases of the building’s life cycle. 18 Several studies have focused on calculating and lowering the emissions of the commercial buildings and specifically supermarkets. Such as a study in 2018 conducted on Spanish supermarkets with sale areas of 400–2500 m2, which focused on reducing the final energy consumption of its building services such as lighting, cooling, air conditioning, ventilation, and bakery ovens. Reducing it by an average of 25% using natural light, installing presence detectors, time programmers for light, replacing old air conditioning systems with a better efficient system, and installing an industry automation system. 19 On the other hand, the adoption of ca circular economy (CE), which addresses issues of resource scarcity and climate change, 20 is considered an appropriate solution for managing waste from electrical and electronic equipment (WEEE). As it seeks to close the loop of the product life cycle, reduce emissions and retain the highest value of the product. 21 The use of refrigerators and other appliances makes the supermarket an ideal field for the potential implementation of CE.22,23 A study conducted in 2015 analysed energy consumption data of 565 supermarkets in the UK and revealed a 3.30% annual reduction in energy consumption between the years 2013 and 2017 where in over the 5 years, the total energy consumption reductions achieved were a 32% reduction in lighting, 20% in refrigeration and 8% in HVAC systems. 24
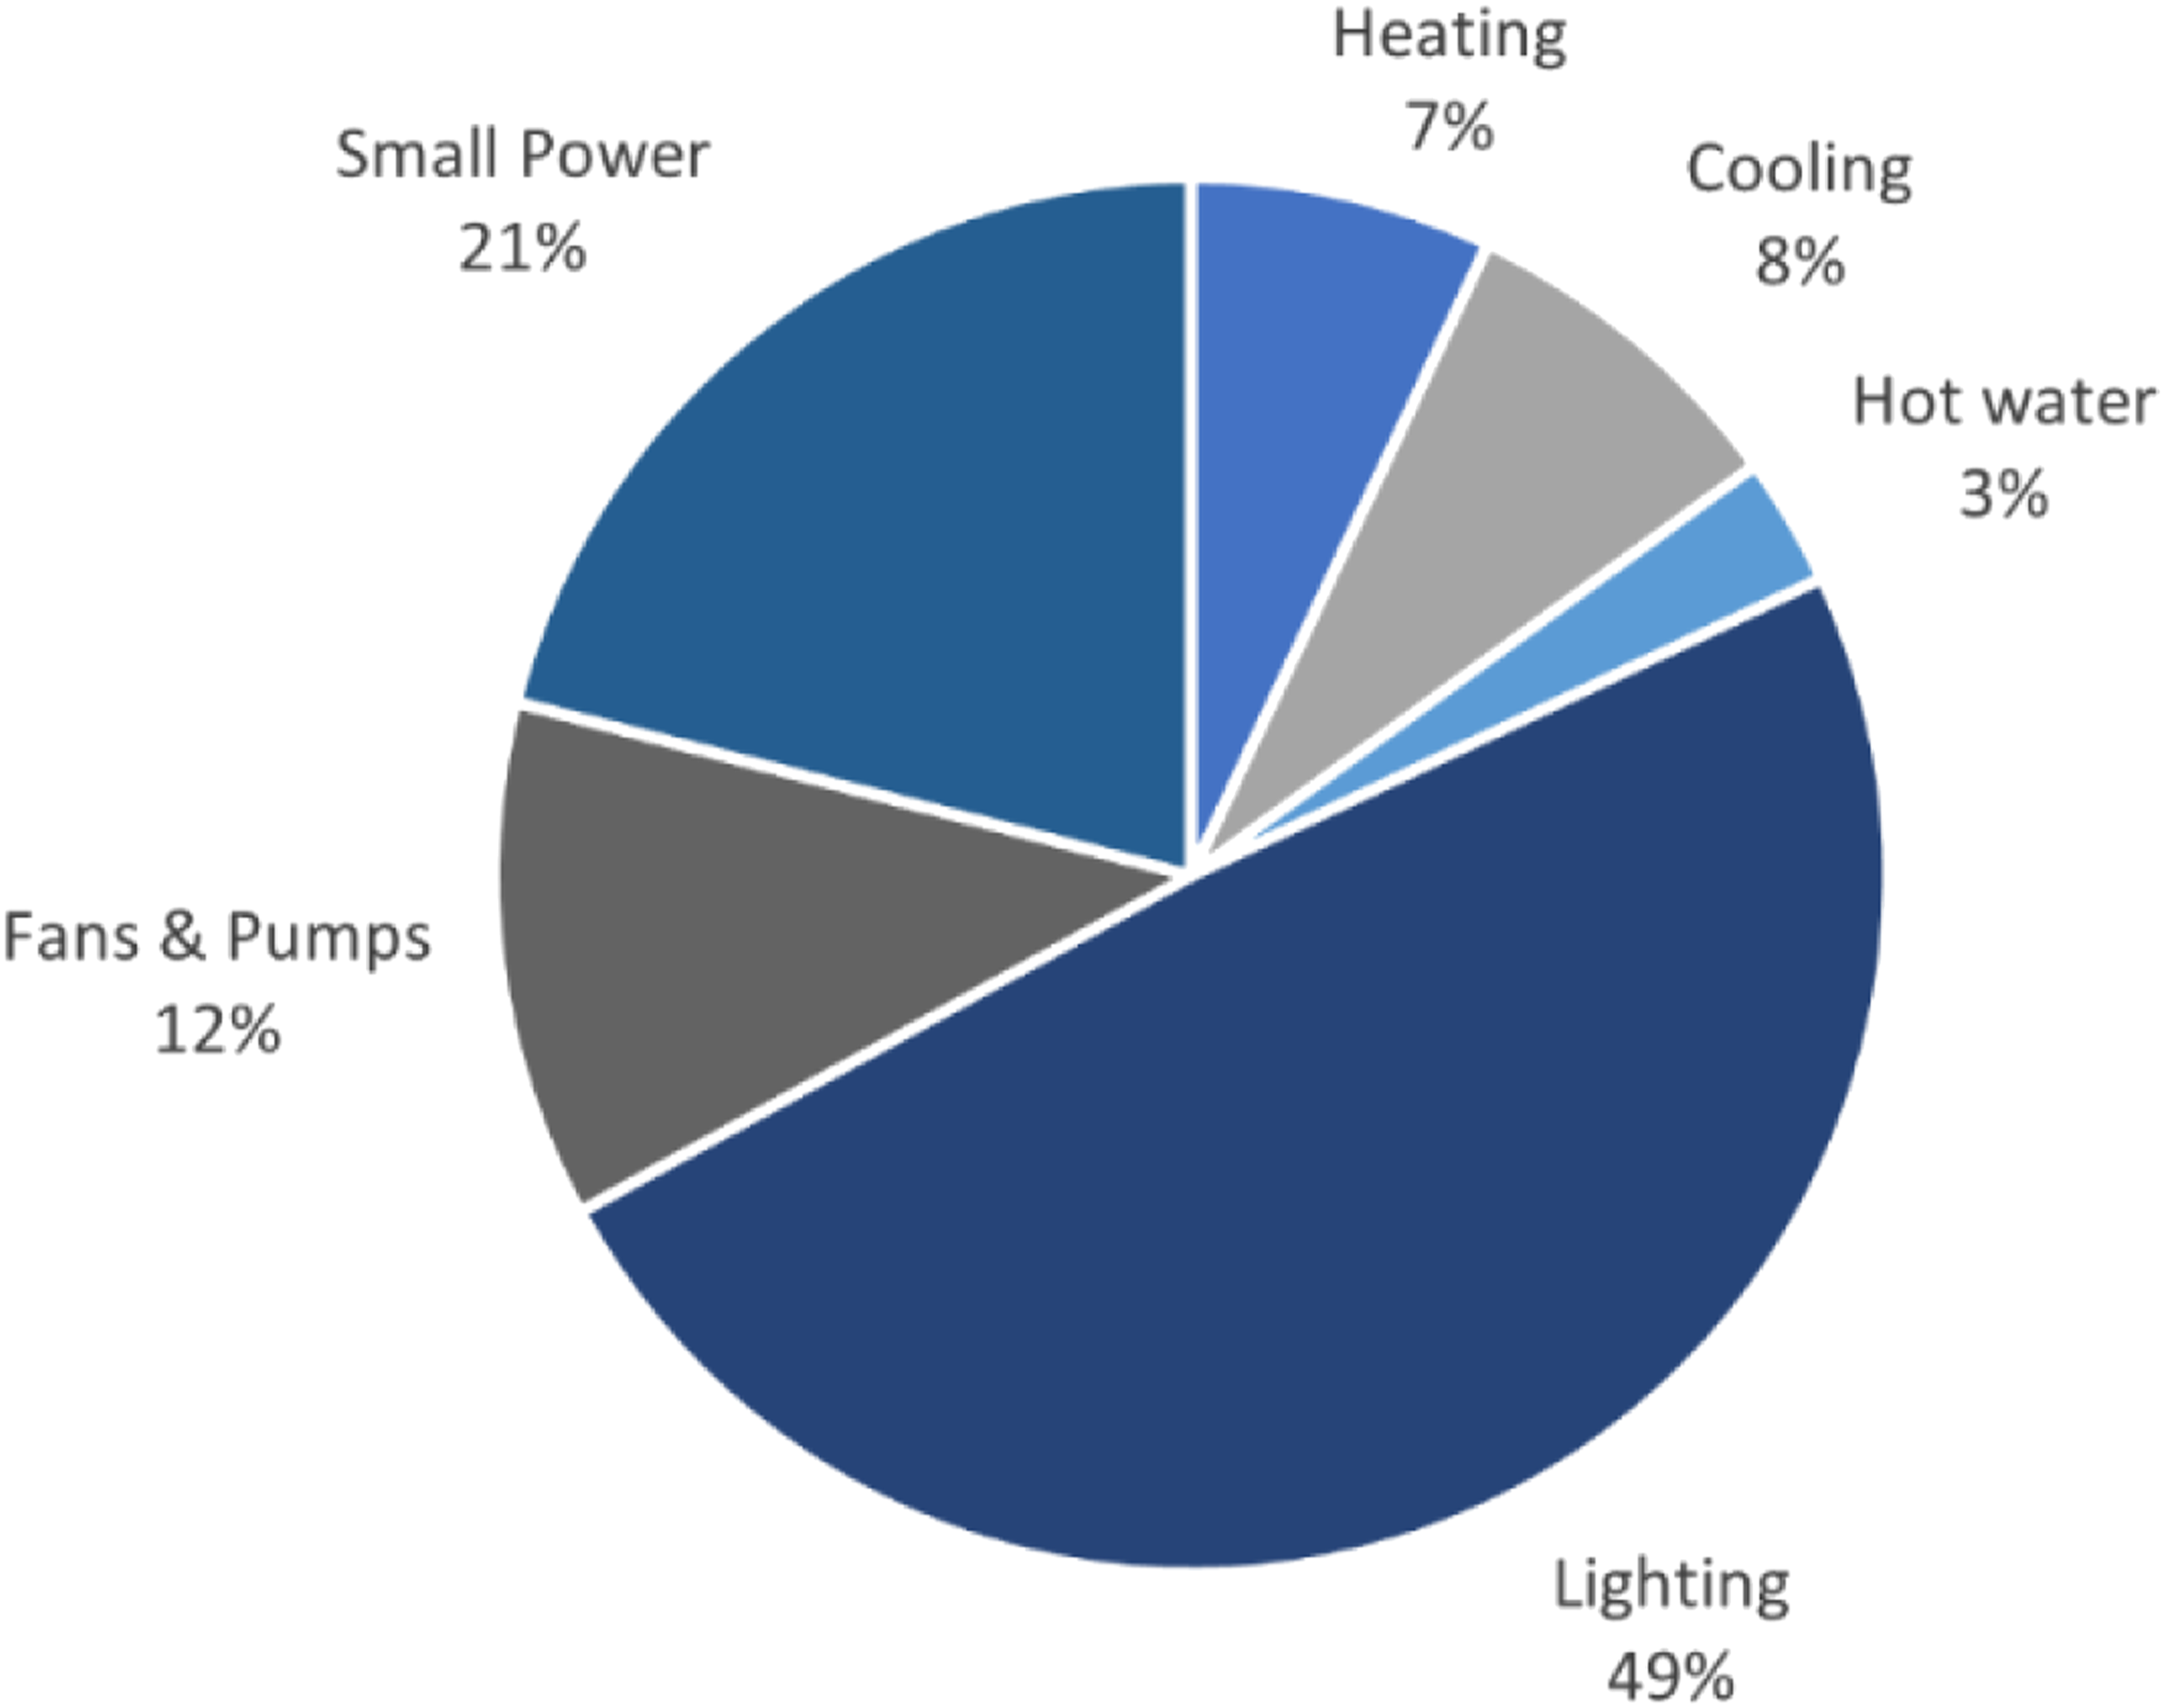
Typical supermarkets in the UK are described as high energy usage intensity (EUI) buildings due to their increased refrigeration and lighting needs. By examining the breakdown of the energy use in these buildings (Figure 2), it can be observed that small power demands (referring to energy used by small appliances, equipment and CCTV) represent a significant proportion of total emissions and that lighting is the greatest regulated energy use.
23
Considering this, structural and building fabric differences could affect the emissions of each stage of the building’s life cycle differently. Breakdown of energy use in a typical supermarket.
25
Additionally, there is no specific agreed single value for the whole life carbon emissions for supermarket buildings in the UK, and this is due to several reasons such as unavailability of Environmental Product Declarations (EPDs), unavailable or missing information regarding the raw materials used, varying use of building services equipment and specific technical details regarding equipment.
Numerous studies have attempted to explain the comparative ecological advantages of concrete, steel and timber structural systems.26–28 Although extensive research has been carried out on structural systems, no single study exists that analyses supermarkets’ construction developments. Therefore, it is vital to have a fresh insight into the environmental impacts of such construction developments. This paper seeks to provide a holistic view of supermarkets’ material components and construction developments. Comparing the embodied carbon with the operational carbon and whole life carbon of three construction approaches of a supermarket in the UK.
Life Cycle Assessment (LCA)
Life cycle assessment (LCA) is an internationally accepted systematic and holistic methodological technique used to evaluate the environmental impacts of any product or procedure, including building materials and construction developments. An LCA can be used to assess the environmental effects of a product throughout its life span - from raw materials extraction to final disposal. Not only does an LCA quantify the impacts of the construction of a building at different phases, but it also provides a better understanding overview of an extensive variety of building components. The literature on life-cycle analysis has highlighted the importance of building materials and embodied energy in a whole life-cycle carbon emissions assessment of buildings.29–31
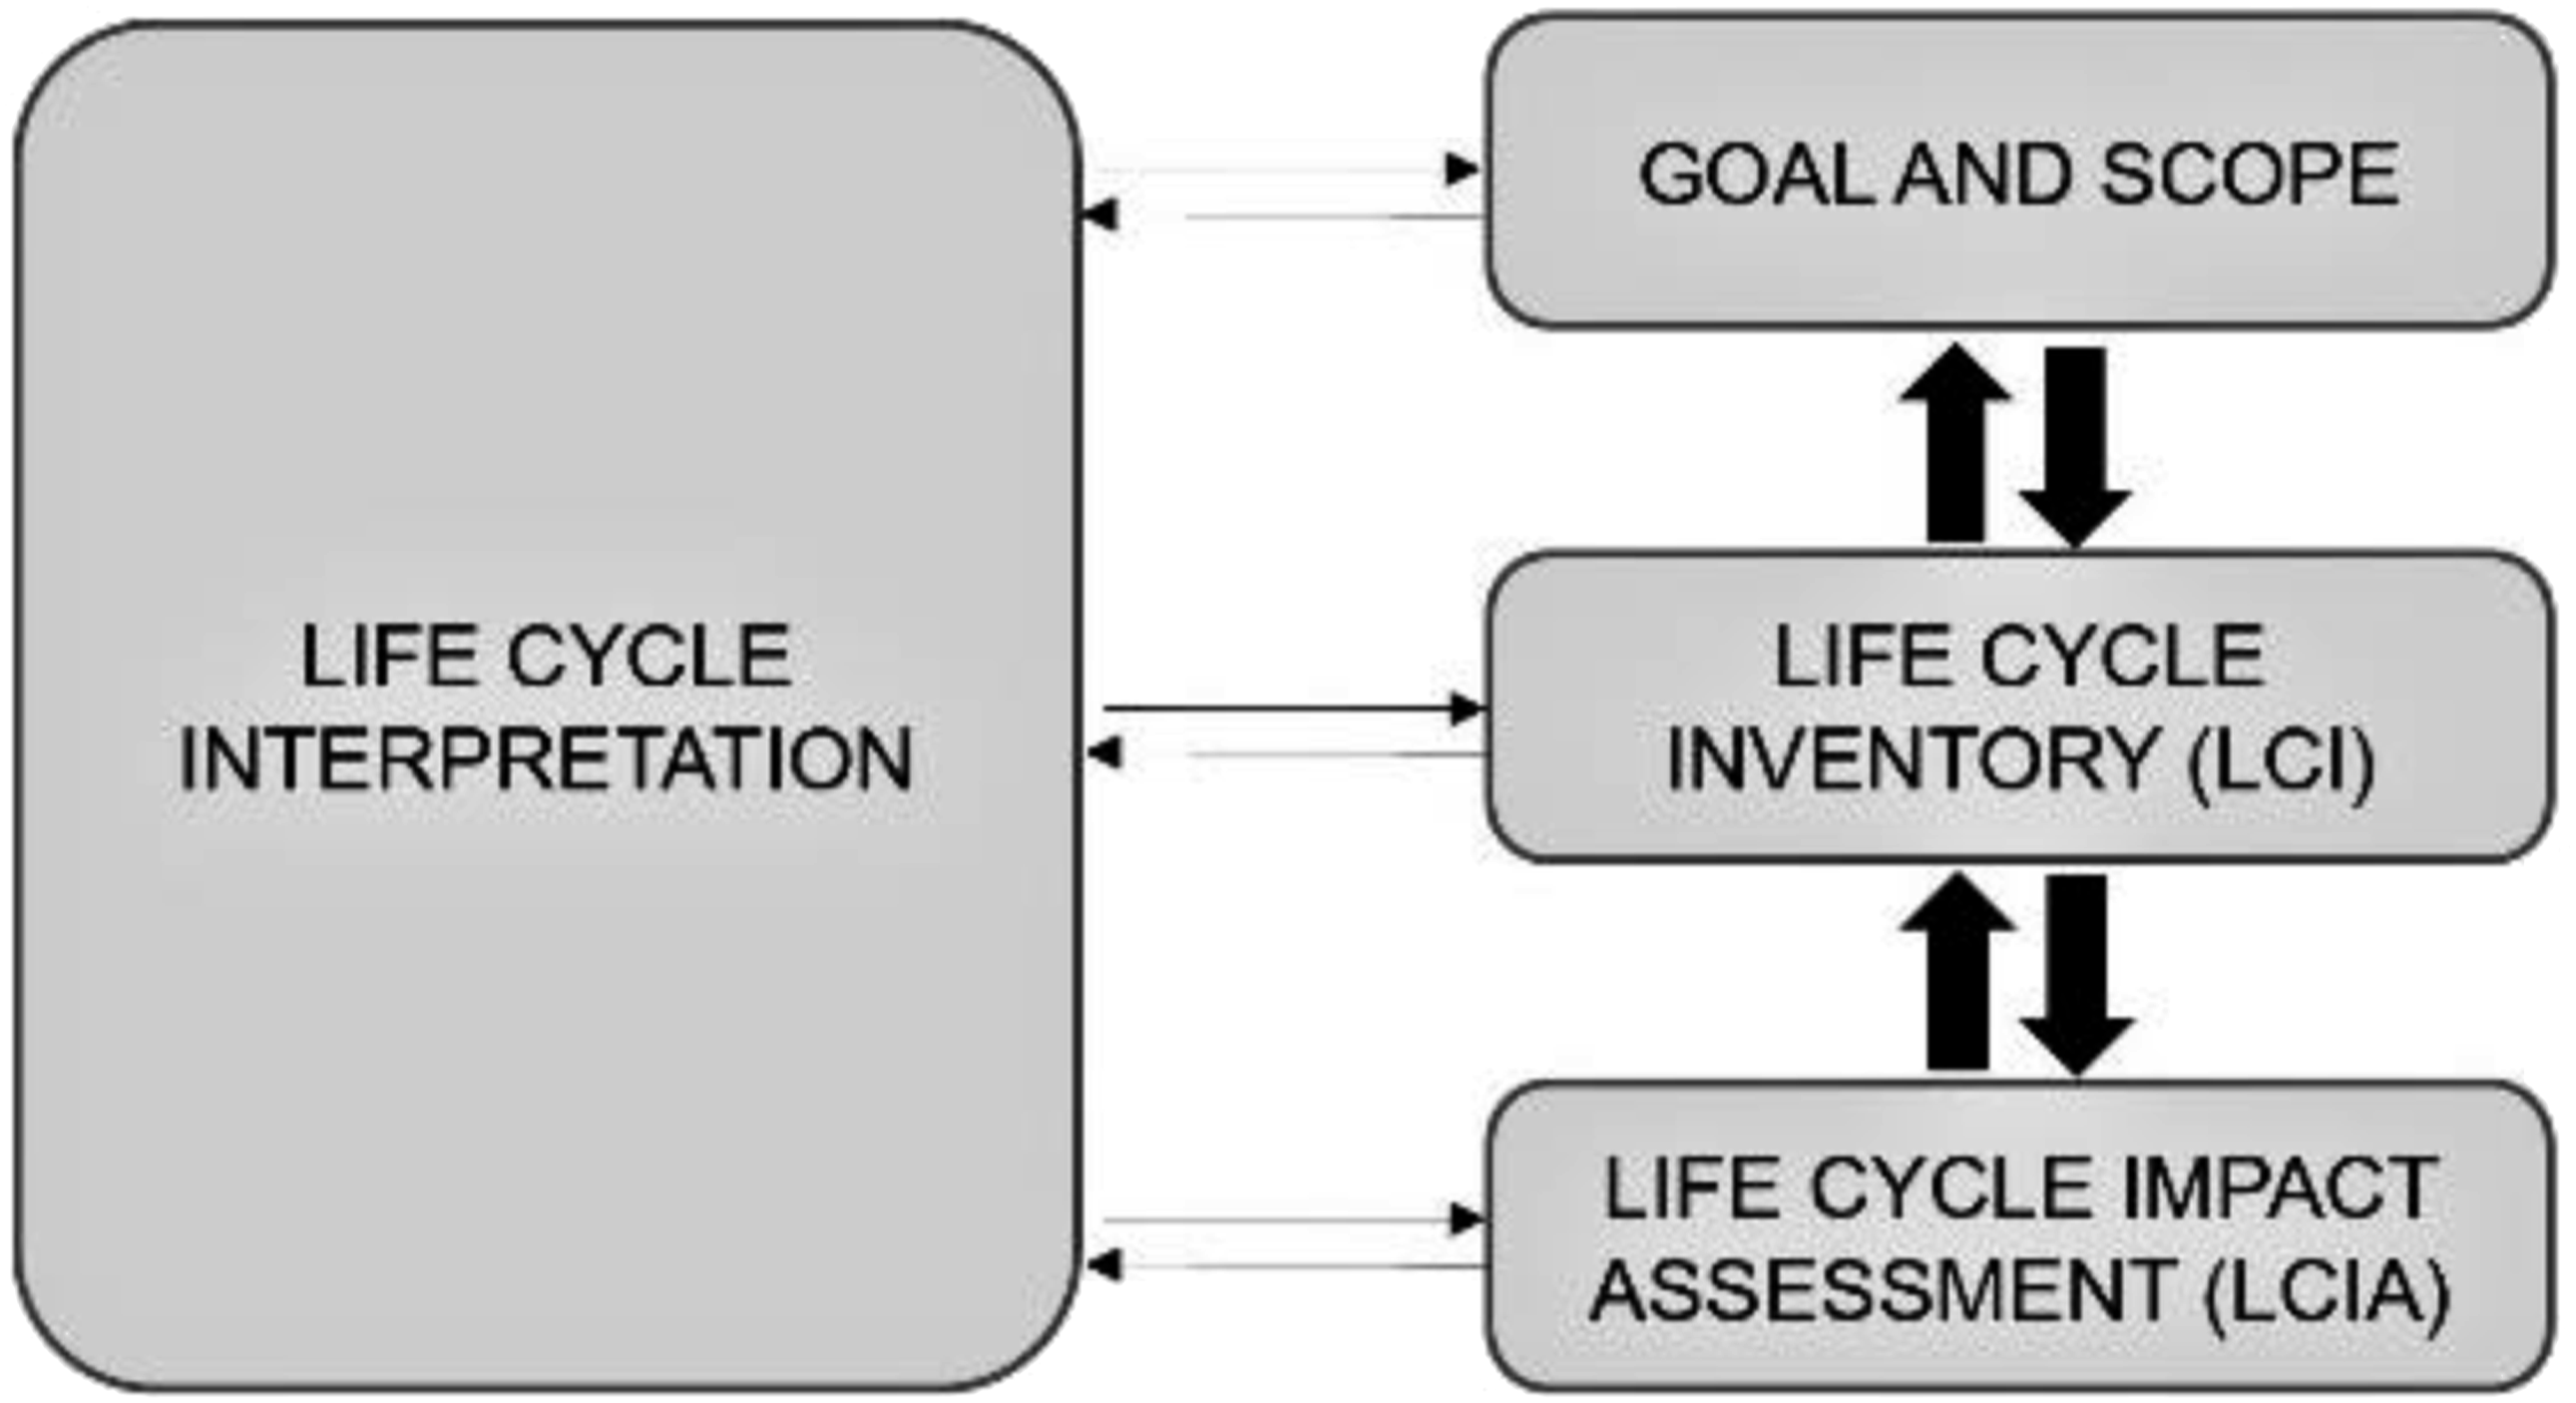
An LCA is primarily performed in four stages (Figure 3). In the first stage, the Goal and Scope, based on the goal of the assessment, the scope and the stages included are determined. In the second stage, the Life Cycle Inventory (LCI), all data required for the assessment are identified and collected. In the third stage, Life Cycle Impact Assessment (LCIA), the potential environmental impact of the stages included in the scope are calculated. The final stage is the Life Cycle Interpretation stage, in which the results from the LCI and LCIA stages are evaluated. LCA stages reproduced from ISO 14040.
32
This research aims to estimate and evaluate the embodied and operational GHG emissions of supermarket buildings in the UK. This is achieved by calculating the life cycle carbon emissions. The results can offer quantifiable and comparable carbon emissions for further carbon reduction in similar buildings in the UK.
Goal & scope
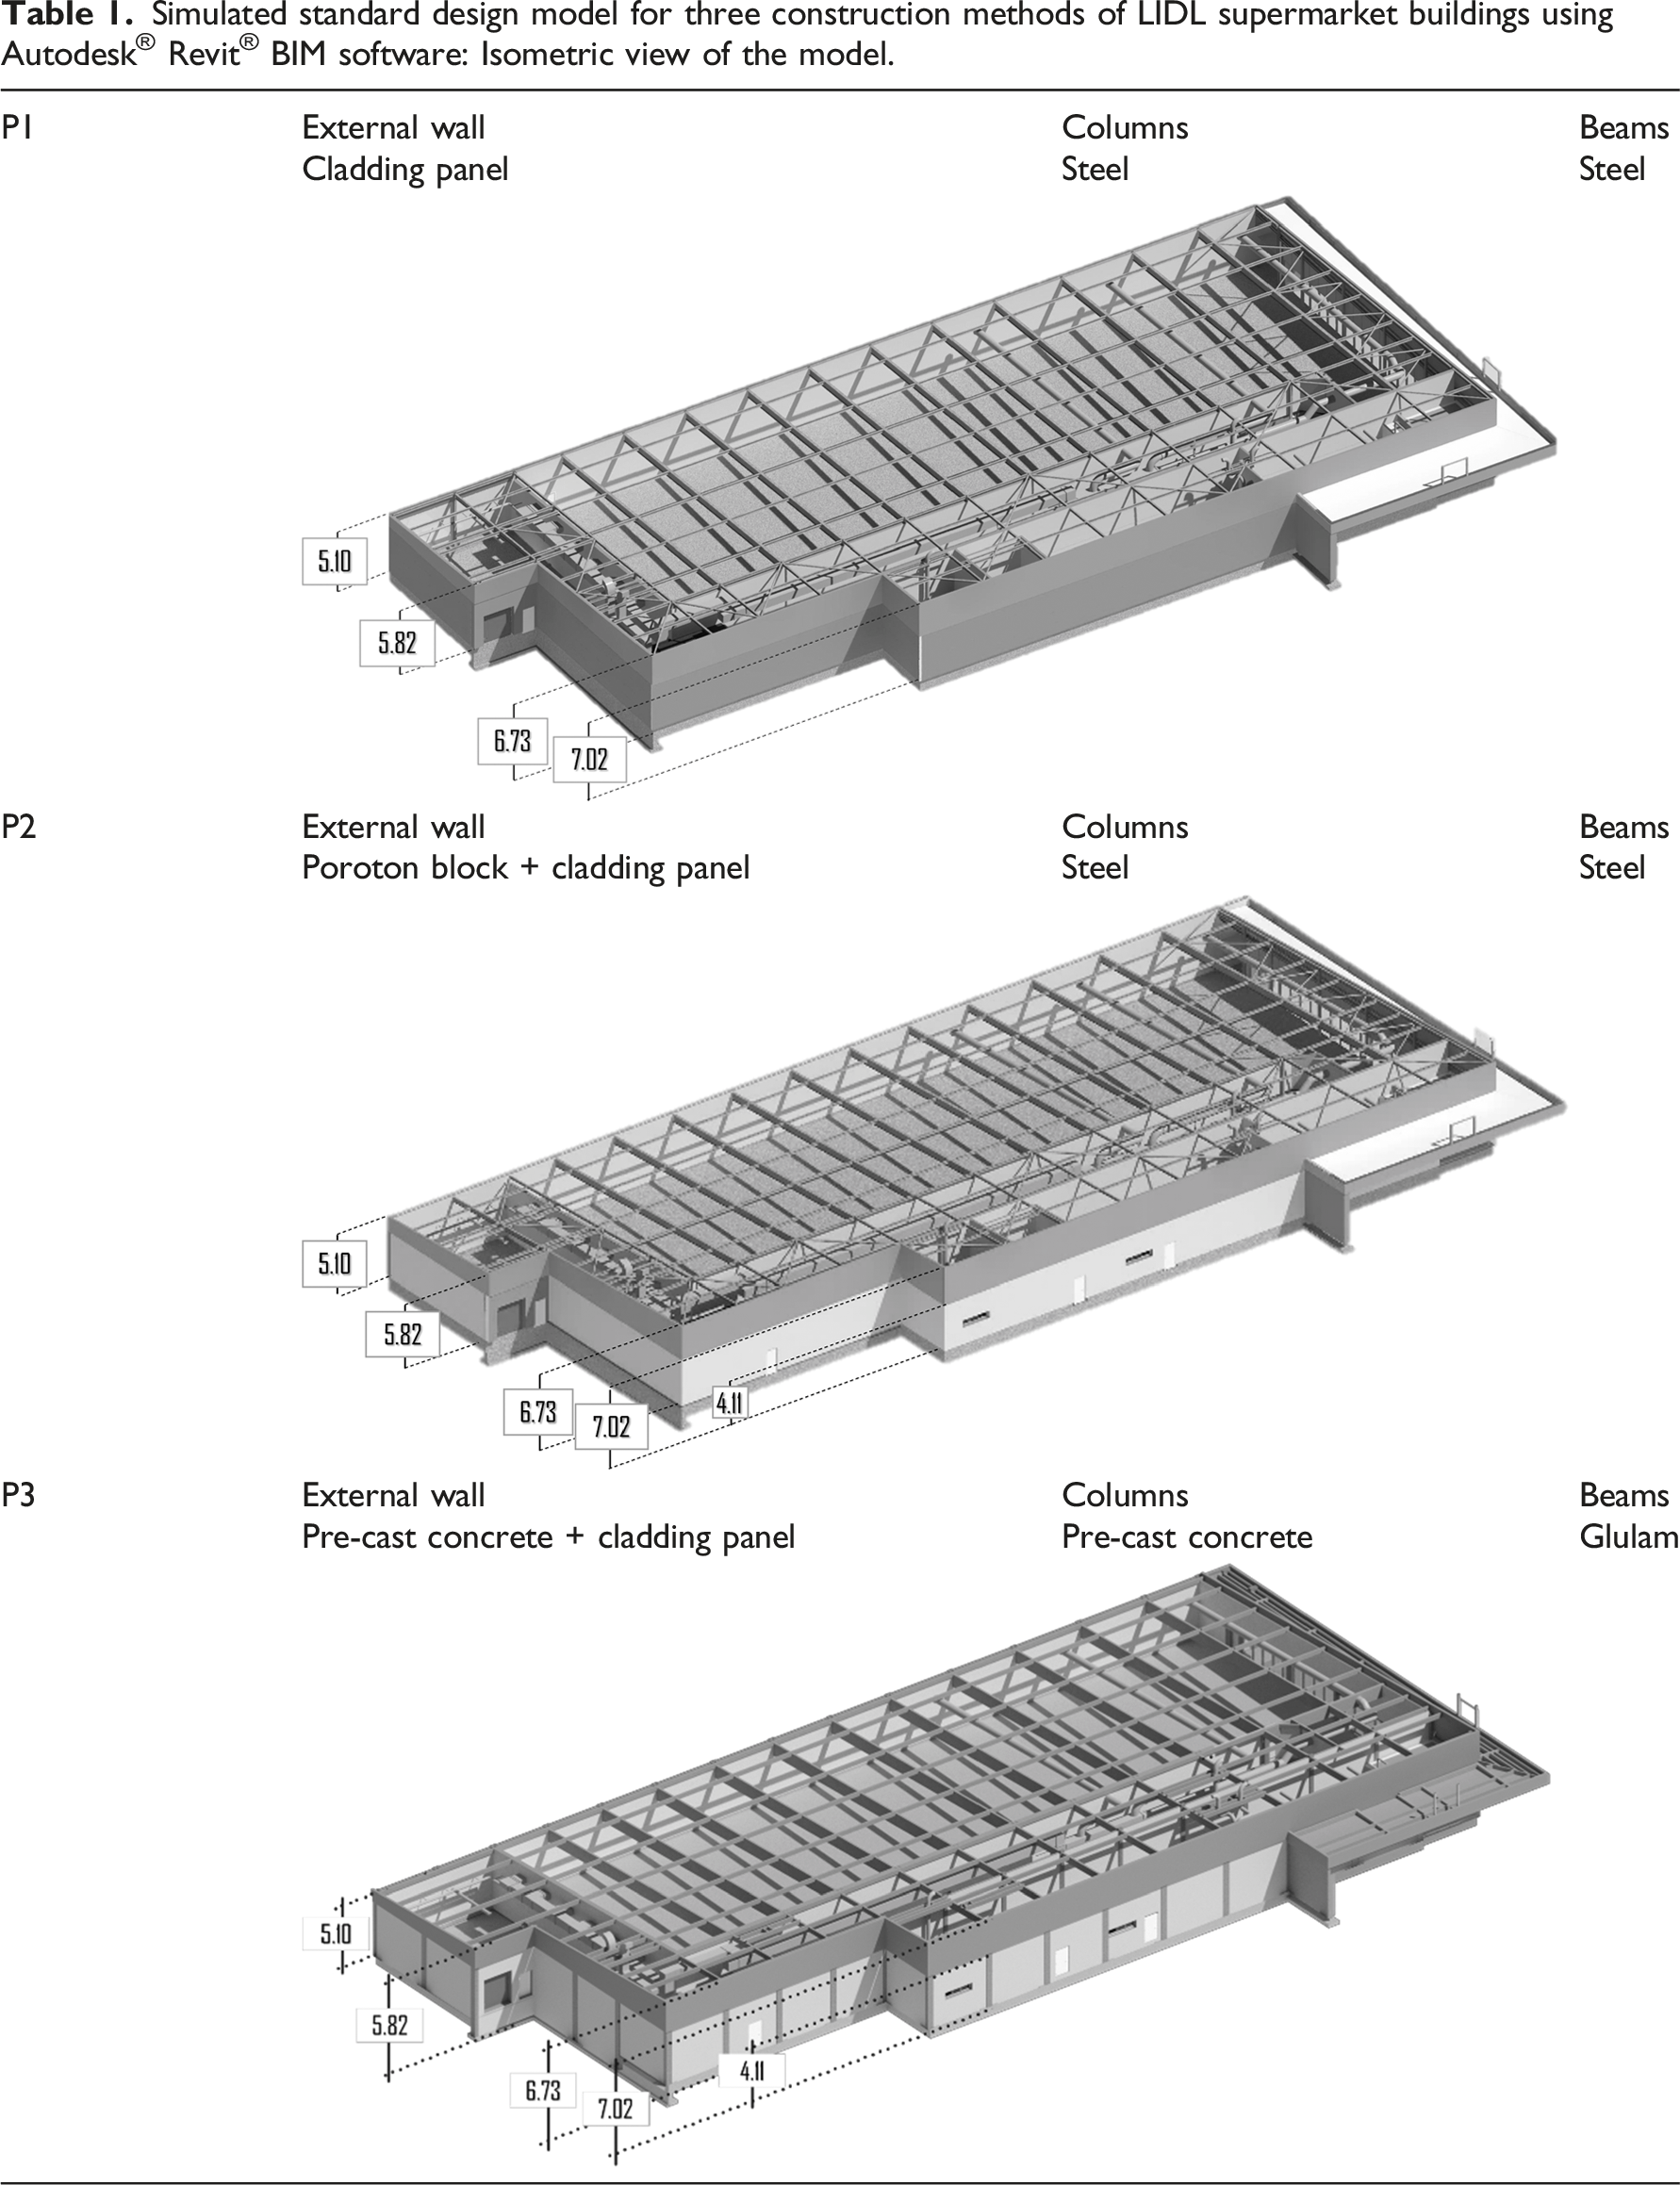
Simulated standard design model for three construction methods of LIDL supermarket buildings using Autodesk® Revit® BIM software: Isometric view of the model.
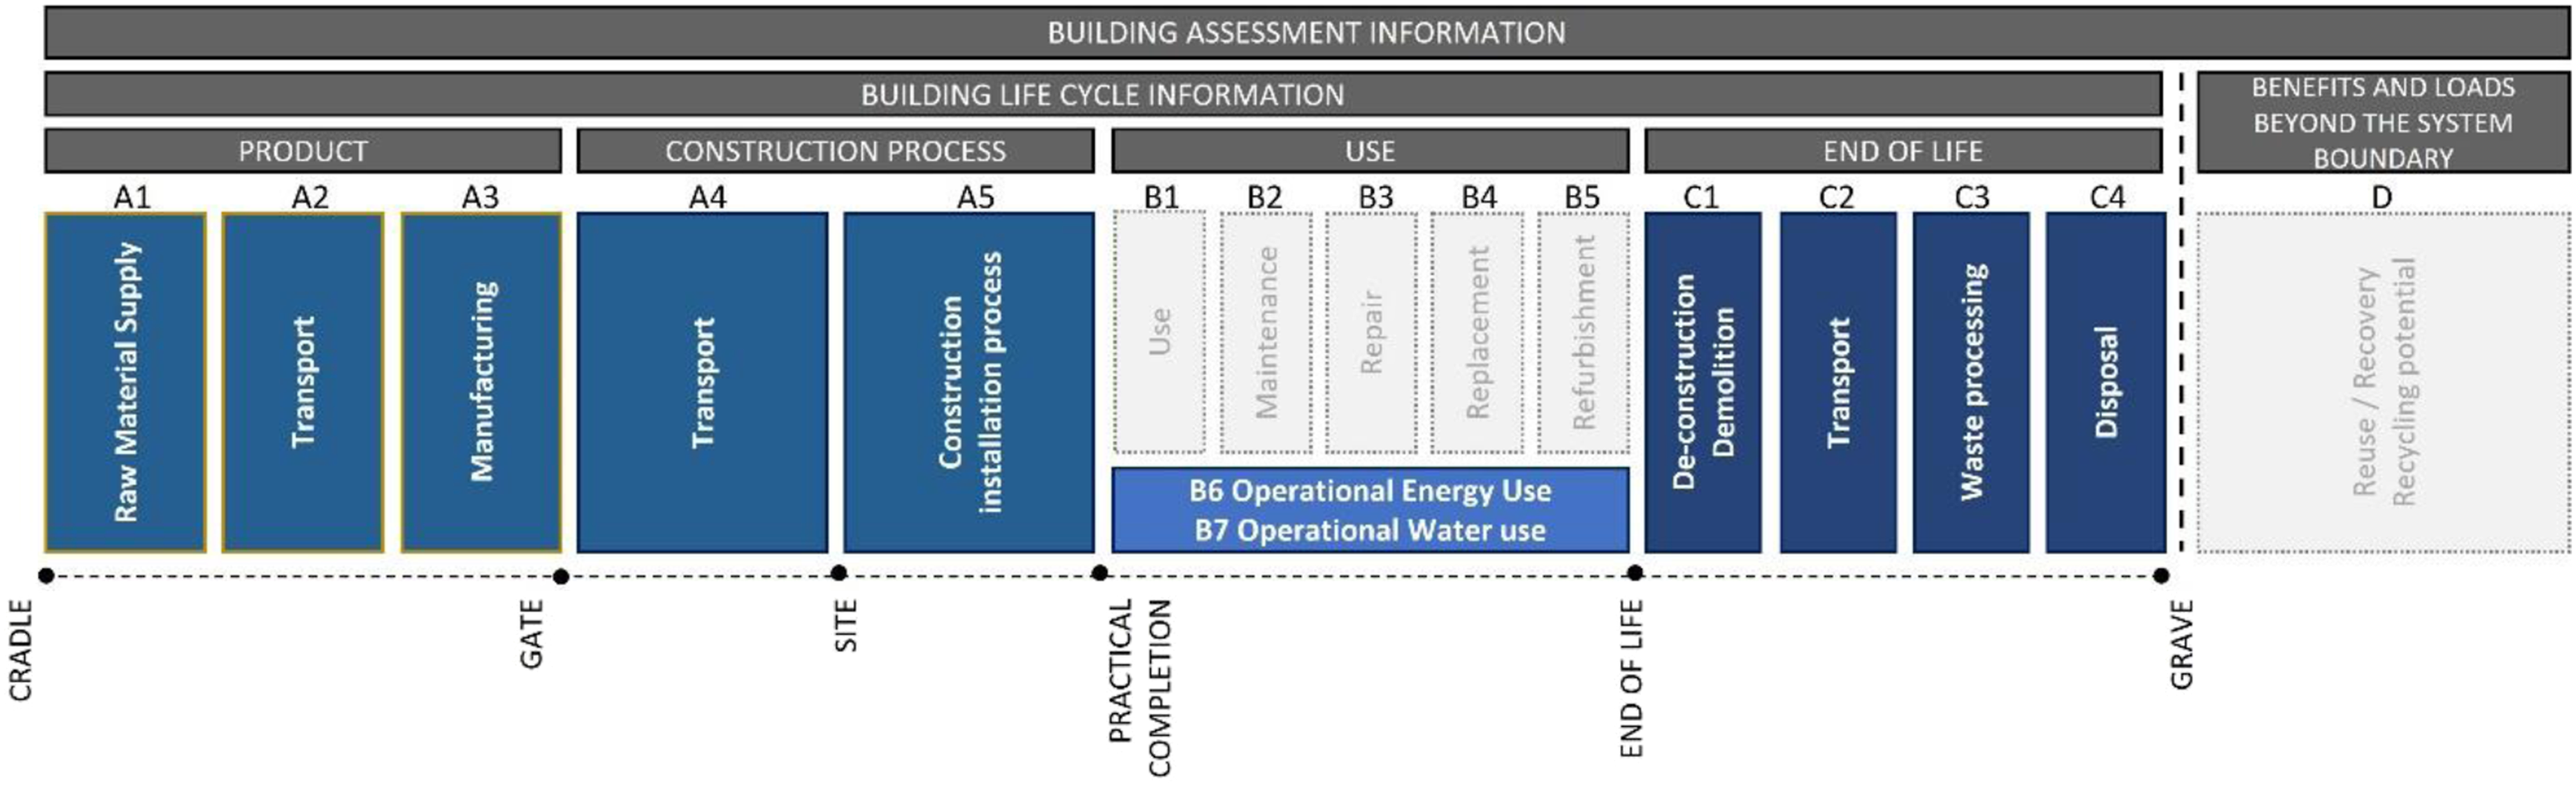
The life cycle of a building has been conventionally divided into four stages including, A (product and construction); B (in use and operation), C (end of life), and D (beyond the life cycle) (Figure 4). The scope of this research consists of the embodied and operational carbon emissions of the three defined buildings, including A1 – A3 phases termed as “extraction of material”, “transportation” and “manufacturing”, A4 – A5’ construction’, B6-B7’ use’ and C1 – C4’ end of life phases. These four stages as illustrated in Figure 4, are considered the system boundary of this study. Life cycle stages reproduced from BS EN 15,978-2011.
35
Methodology
Case study
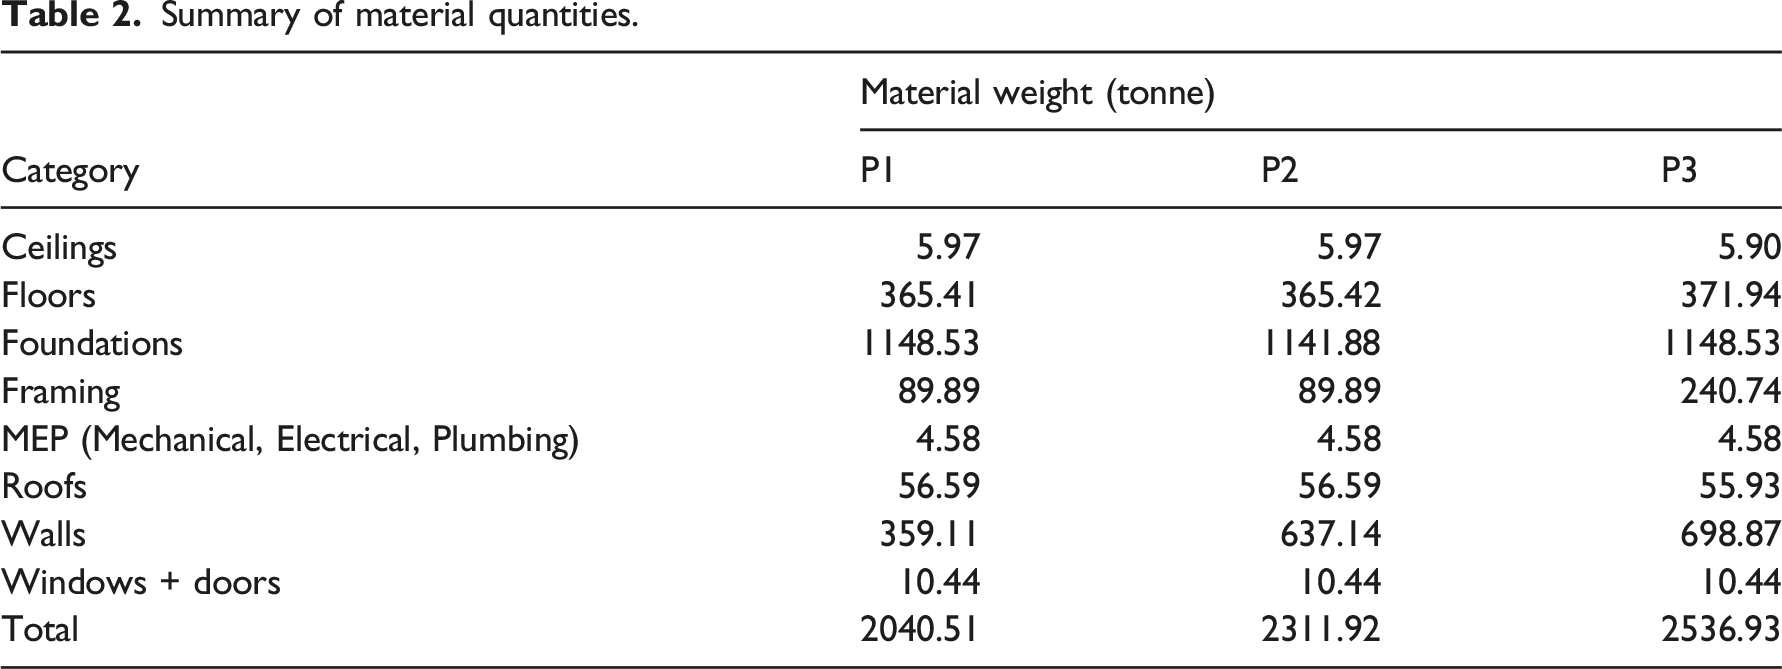
The building chosen for this case study, was the standard design of a LIDL supermarket. The standard design comprises a 2500 m2 single-story building. For this standard design there are three approved methods of construction as depicted in Table 1. The first method of construction (referred to as P1) is composed of a steel column and beam structural frame, cladding panel external walls and a concrete slab foundation. The second method of construction (referred to as P2) is composed of a steel column and beam structural frame, proton external walls up to Height(H) = 4.109 m and cladding panel external walls from H = 4.109 m to H = 5.104–7.02 m, with a concrete slab foundation. The third method of construction (referred to as P3) is composed of a pre-cast concrete column and glulam beam structural frame, pre-cast concrete external walls up to H = 4.109 m and cladding panel external walls from H = 4.109 m to H = 5.104–7.02 m, with a concrete slab foundation. The internal wall finishes for P1, P2 and P3 include paint to plasterboard. The floor coverings are ceramic tiles, vinyl, and paint. The windows are glazed and aluminium-framed with steel external doors.
A Whole Life Carbon (WLC) assessment was carried out within the previously defined boundaries for each of the three construction methods (P1, P2, P3).
Life Cycle Inventory (LCI)
In this study, two different software tools have been utilised to aid the WLC assessment. The Autodesk® Revit® BIM software and the TAS (Thermal Analysis software) by EDSL.
Summary of material quantities.
Additionally, in order to keep the findings of this study in line with the goal of the research certain limitations were placed on the consideration of different factors which could be explored in future studies. Such as the use of refrigerants in the supermarket store, and refrigerant leakage. However, this omission does allow for the methodology for calculating the WLC to be further adapted to other building types such as offices, retail buildings and warehouses.
The TAS software which incorporates CIBSE weather files and complies with the building regulations guidance 2010: Part L2 for England and Wales.
36
was used to calculate the energy use and emission of the three models. As the software allows for changes to the building fabric and given that P1, P2 and P3 do not differ in floor plan design, a 3D model of the building was simulated (Figure 5). As these building plans are specific to the UK, the construction methodology is done according to the Building Regulations 2010.
30
A further explanation and detailed description of TAS have been outlined in previous papers.37,38 3D model building geometry in TAS – EDSL.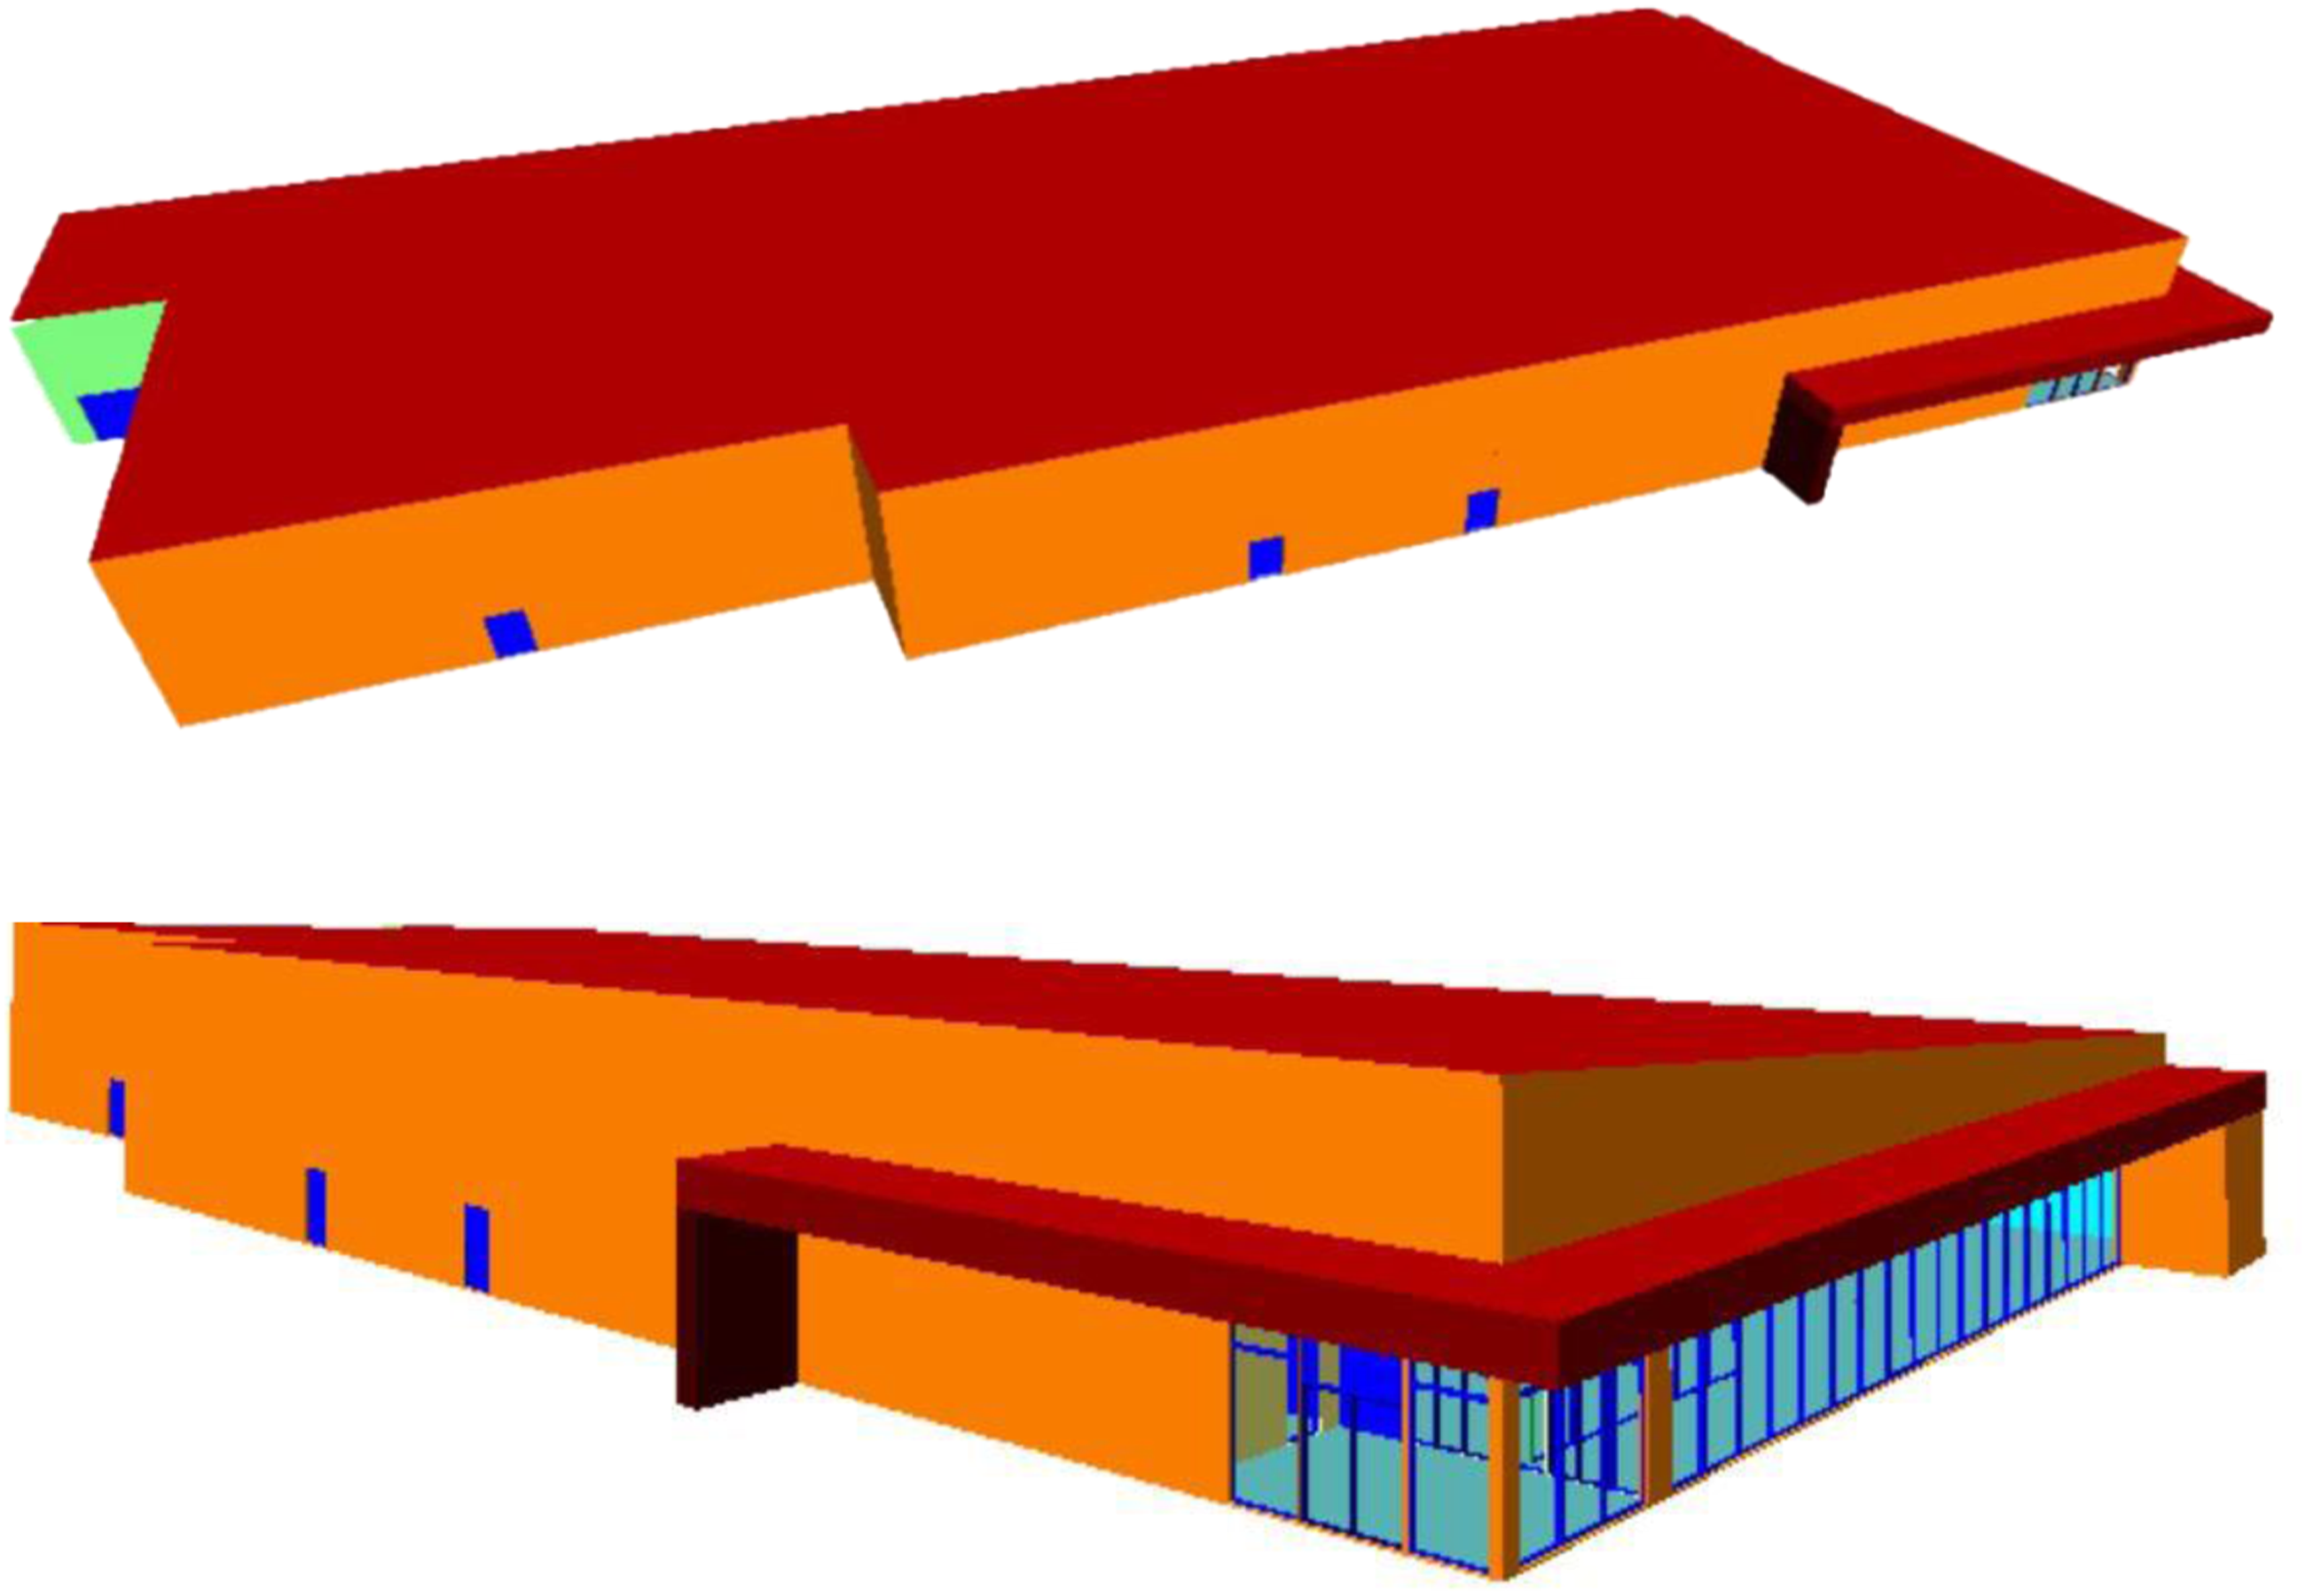
Calculation
Embodied carbon (A1-A5, C1-C4)
Table depicting the available embodied carbon factors provided in the EPDs.
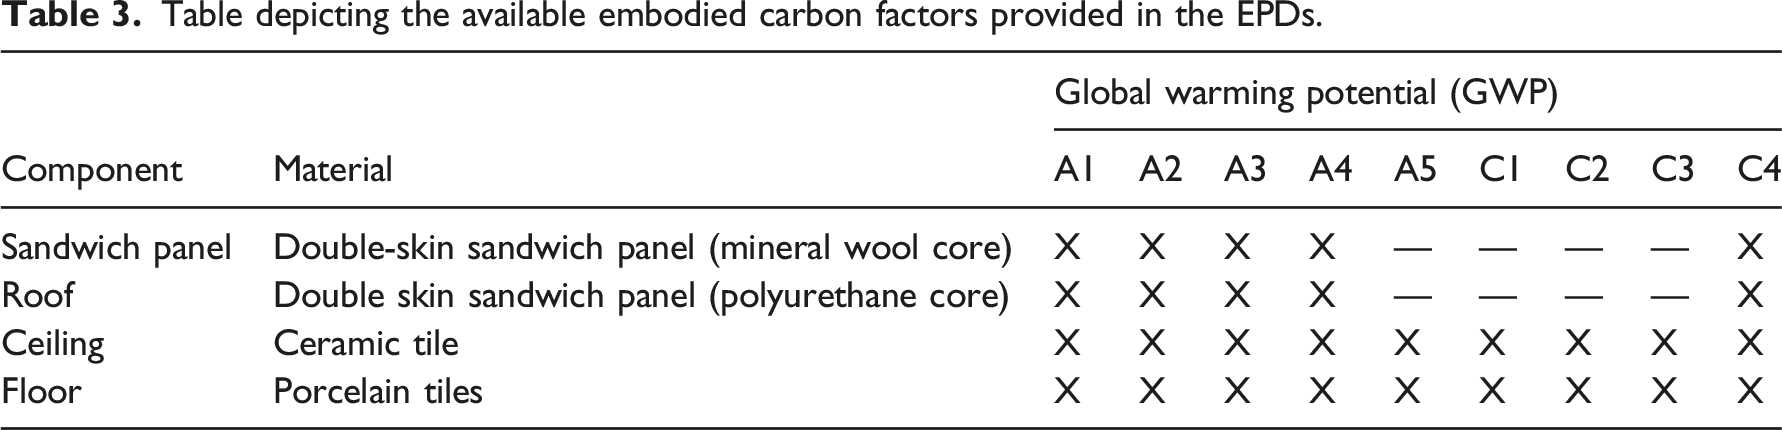
Upfront embodied carbon involves A1-A3 – the emissions from the production process of the building materials. In lieu of the availability of an EPD for the materials, these values were calculated via equation (1). Which ECF represents the embodied carbon factor which is the potential environmental impact of each material or process per unit weight. The best resource for ECFs in the UK has been shown to be the ICE database, 39 which has been utilized this research.
Equation 1 – Embodied carbon for material production (A1-A3)
40
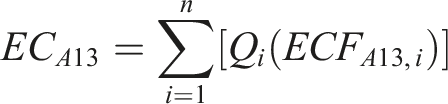
Q i = quantity of ith material
ECFA13,i = embodied carbon factor of ith material
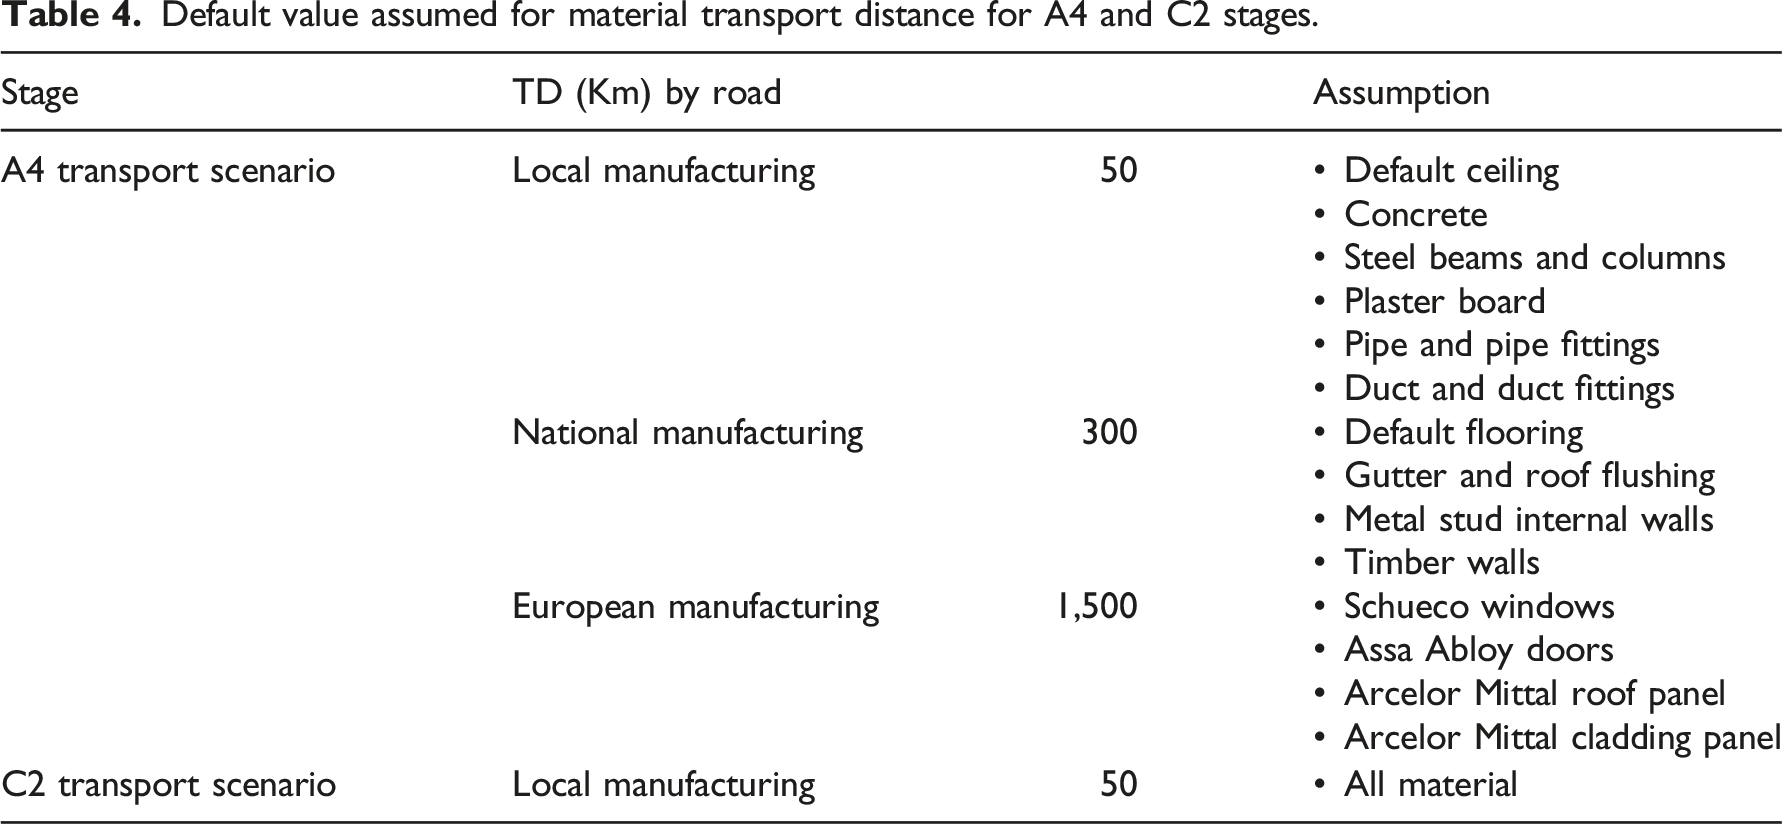
In line with industry standard practice, an assumption of steel with 59% recycled content for the steel frame, and precast concrete beams and columns with steel reinforced with European recycled steel was made. For the remaining components, the assumption of virgin materials was made to avoid undercalculation of the environmental impact. Additionally, based on LIDL’s practices the assumption of locally or nationally sourced materials was assumed unless the source was specifically stated. The A1-A3 embodied carbon of the glulam frame was calculated with the assumption of no carbon storage. The inclusion of the sequestered carbon value in the A1-A3 EC of the glulam frame, is dependent on the end-of-life scenario.
Default value assumed for material transport distance for A4 and C2 stages.
Equation 2 - Carbon factor for transportation (A4,C2)
40
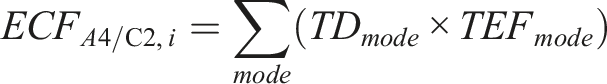
TDmode = transport distance for each transport mode considered
TEFmode = transport emission factor for each transport mode considered
The emissions from on-site waste (ECA5w) were calculated using equation (3), where WF represents the waste factor. Where applicable, the WF chart from the WRAP Net Waste Tool data was used and where not applicable based on the guidelines a default value of 1% was assigned. 40
Equation 3 - Embodied carbon for construction waste (A5w)
40
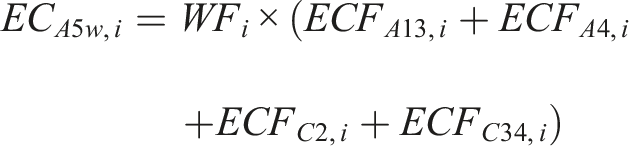
WF i = waste factor for ith material given by equation 4
ECFc2,i = transportation away from the site, calculated in the same way as ECFA4, i but transport distance is assumed to be 50 km by road if taken for reuse or recycling
ECFc34,i = waste processing and disposal emissions associated with construction waste material
ECFA13,i = carbon sequestration for any timber products wasted during construction
The embodied carbon associated with deconstruction/demolition (ECC1) was estimated using equation (4). Where m is the type of machinery for on-site operation, and e is the type of energy used. And the carbon emission associated with the processing of demolished waste (ECC3) was calculated using equation (5).
Equation 4 - Embodied carbon for deconstruction/demolition (C1)
34

Q machinery,mi = the type of plant/equipment used in the demolition of the buildings
Q energy,mi = the type of fuel used by the demolition plant/equipment
ECF energy,m = carbon emissions per unit consumption of fuel
Equation 5 - Embodied carbon for demolished waste (C3)
40
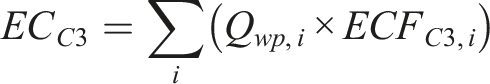
Qwp,i = quantity of ith material for waste processing
ECFc3,i = waste processing embodied carbon factor of ith material
The carbon emission associated with the treatment of demolished waste disposal (ECC4) was calculated using equation (6). At the end of the building’s useful life, the structure is assumed to be demolished, and materials are recycled according to the current UK recovery rate and the remaining are sent to landfill. As there is no current regulation an end-of-life scenario of reuse or recycling cannot be determined or guaranteed for the glulam timber material, the captured carbon for the glulam frame is assumed to be released during this stage.
Equation 6 - Embodied carbon for material disposal (C4)
40
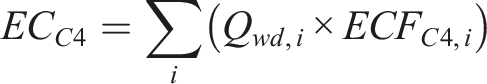
Qwd,i = quantity of ith material for waste disposal
ECFc4,i = waste disposal embodied carbon factor of ith material
The total amount of the embodied carbon of the building was calculated using equation 7.
Equation 7 – Total embodied carbon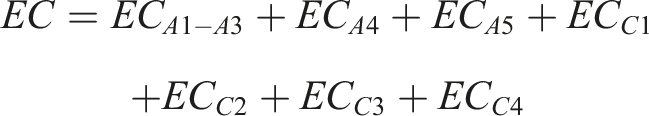
Operational carbon (B6–B7)
The operational energy consumption and the associated emissions of P1, P2 and P3 were calculated using TAS software in which the building services were kept identical, and the fabric of the building was changed accordingly. The simulation of the LIDL supermarket building was taken as a typical UK supermarket building. The model was designed with the closest accuracy to the plan’s measurements. The sales area, entrance lobby, bakery, warehouse, toilets, and other offices including IT room, cash room, utility, meeting room, cloakroom, and welfare canteen were defined in the model.
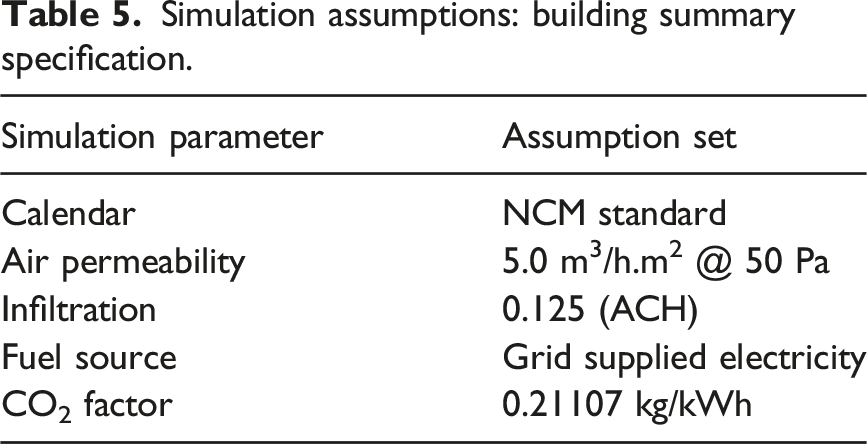
Simulation assumptions: building summary specification.
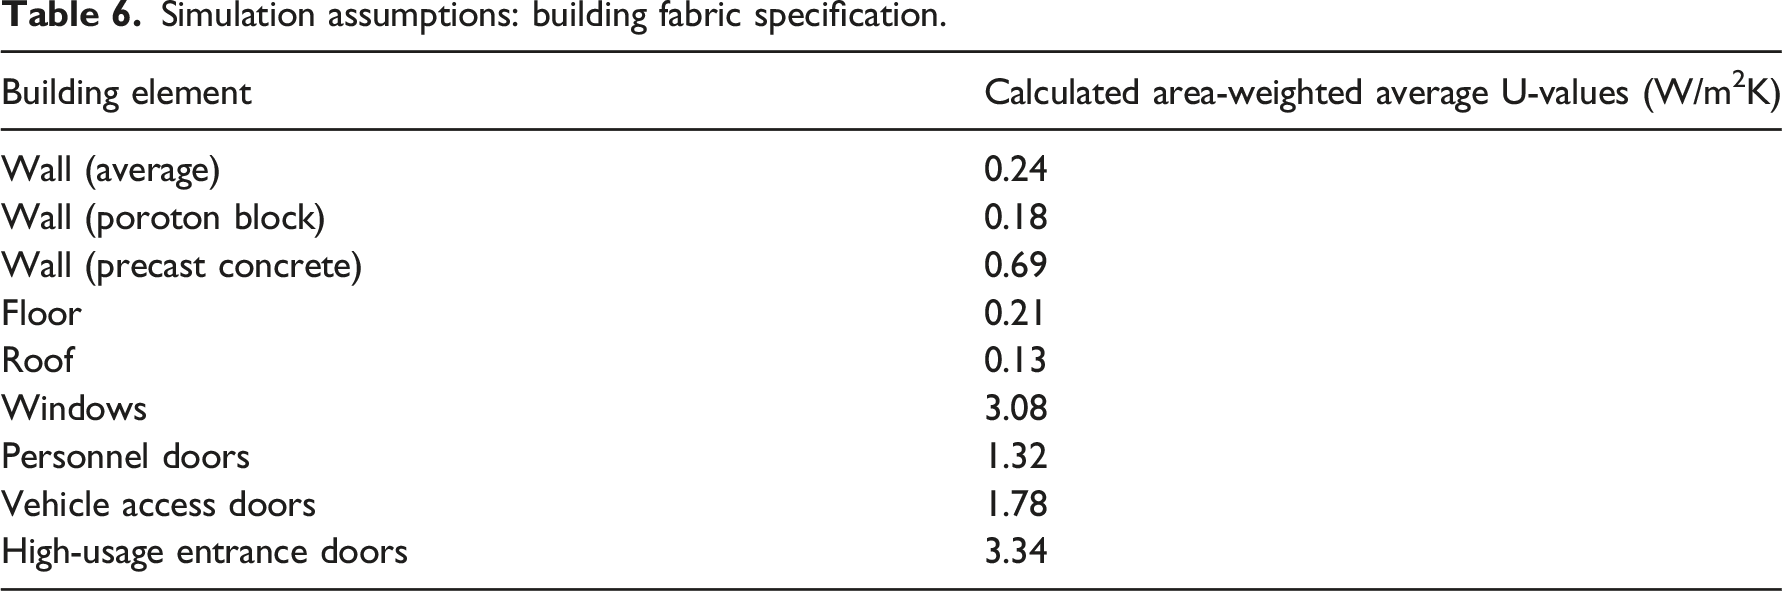
Simulation assumptions: building fabric specification.
The HVAC systems applied in the operation of the building include the heating, cooling, and domestic hot water circuits as prescribed for each individual zone of the supermarket building. The systems are equipped with plantrooms consisting of 3-pipe variable refrigerant flow circuits (VRF), sales air handling unit (AHU) VRF circuits, and local electric DHW circuits with grid-supplied electricity as a fuel source. The VRF HVAC systems consists of outdoor units connected to multiple indoor units via refrigerant piping providing cooling and heating to individual zones. A natural vent is used for the entrance lobby with no heating or cooling. The sales area uses a VRF with mechanical ventilation. The welfare and storage airside configuration consists of mechanical ventilation with heat recovery (MVHR) with direct/storage electric heater or heat pump (electric) for heating and air conditioning (AC) for cooling. Furthermore, an AC only VRF for extract only with no heating or cooling is applied to the storage/delivery warehouse, bakery, and customer WC.
Additionally, in order to keep the findings of this study in line with the goal of the research certain limitations were placed on the consideration of different factors, such as the application of on-site renewable energy sources, such as photovoltaics (PV), wind turbines, combined heat, and power (CHP). However, exploring these options would go beyond listing the magnitude and direction of random and systematic errors, affecting the validity process of this study. Further studies could investigate various on-site renewable energy sources, quantifying their impact on energy and cost savings over a fixed period. Similarly investigating the EC calculation of HVAC systems being used in the supermarket building, as well as consideration of various refrigerant systems (e.g., R404a/R448) and refrigerant leakage.
Previous studies have been carried out observing the supermarket buildings’ performance in other major cities such as London, Manchester, and South Hampton. As Norwich is located in a different part of the climatic region of the UK than the other major cities, the city of Norwich is selected as it lies in the specific climatic region of Eastern England, about 100 miles North-East of London and is the largest city in East Anglia.
For energy use analysis, CIBSE provides two datasets, namely Test Reference Year (TRY) files for energy assessments and Design Summer Year (DSY) files for overheating analysis. As the model is designed in Norwich, this study will be making use of current, and future CIBSE Norwich TRY weather files for evaluation purposes 43 The CIBSE future TRYs are based on the UKCP09 projections. 44 Furthermore, the TRY files are used for predicting average energy consumption and compliance with the UK building regulations, which is a requirement while planning a new building. 45 Due to the limited literature available focusing on energy consumption and carbon emissions analysis in building this paper focuses on the supermarket building located in the city of Norwich.
Results and discussion
Embodied carbon
The embodied carbon of P1, P2 and P3 which were calculated within the defined parameters (Figure 6). The results obtained from the preliminary carbon emission analysis show that the P2 model contributed the least carbon emissions, with a total EC of 1037.7 tCO2e. Followed by the P1 model with a total EC of about 1223.2 tCO2e, while the P3 model contributes the highest carbon emissions with a total EC of 1338.9 tCO2e. Calculated embodied carbon contribution of models P1, P2, P3.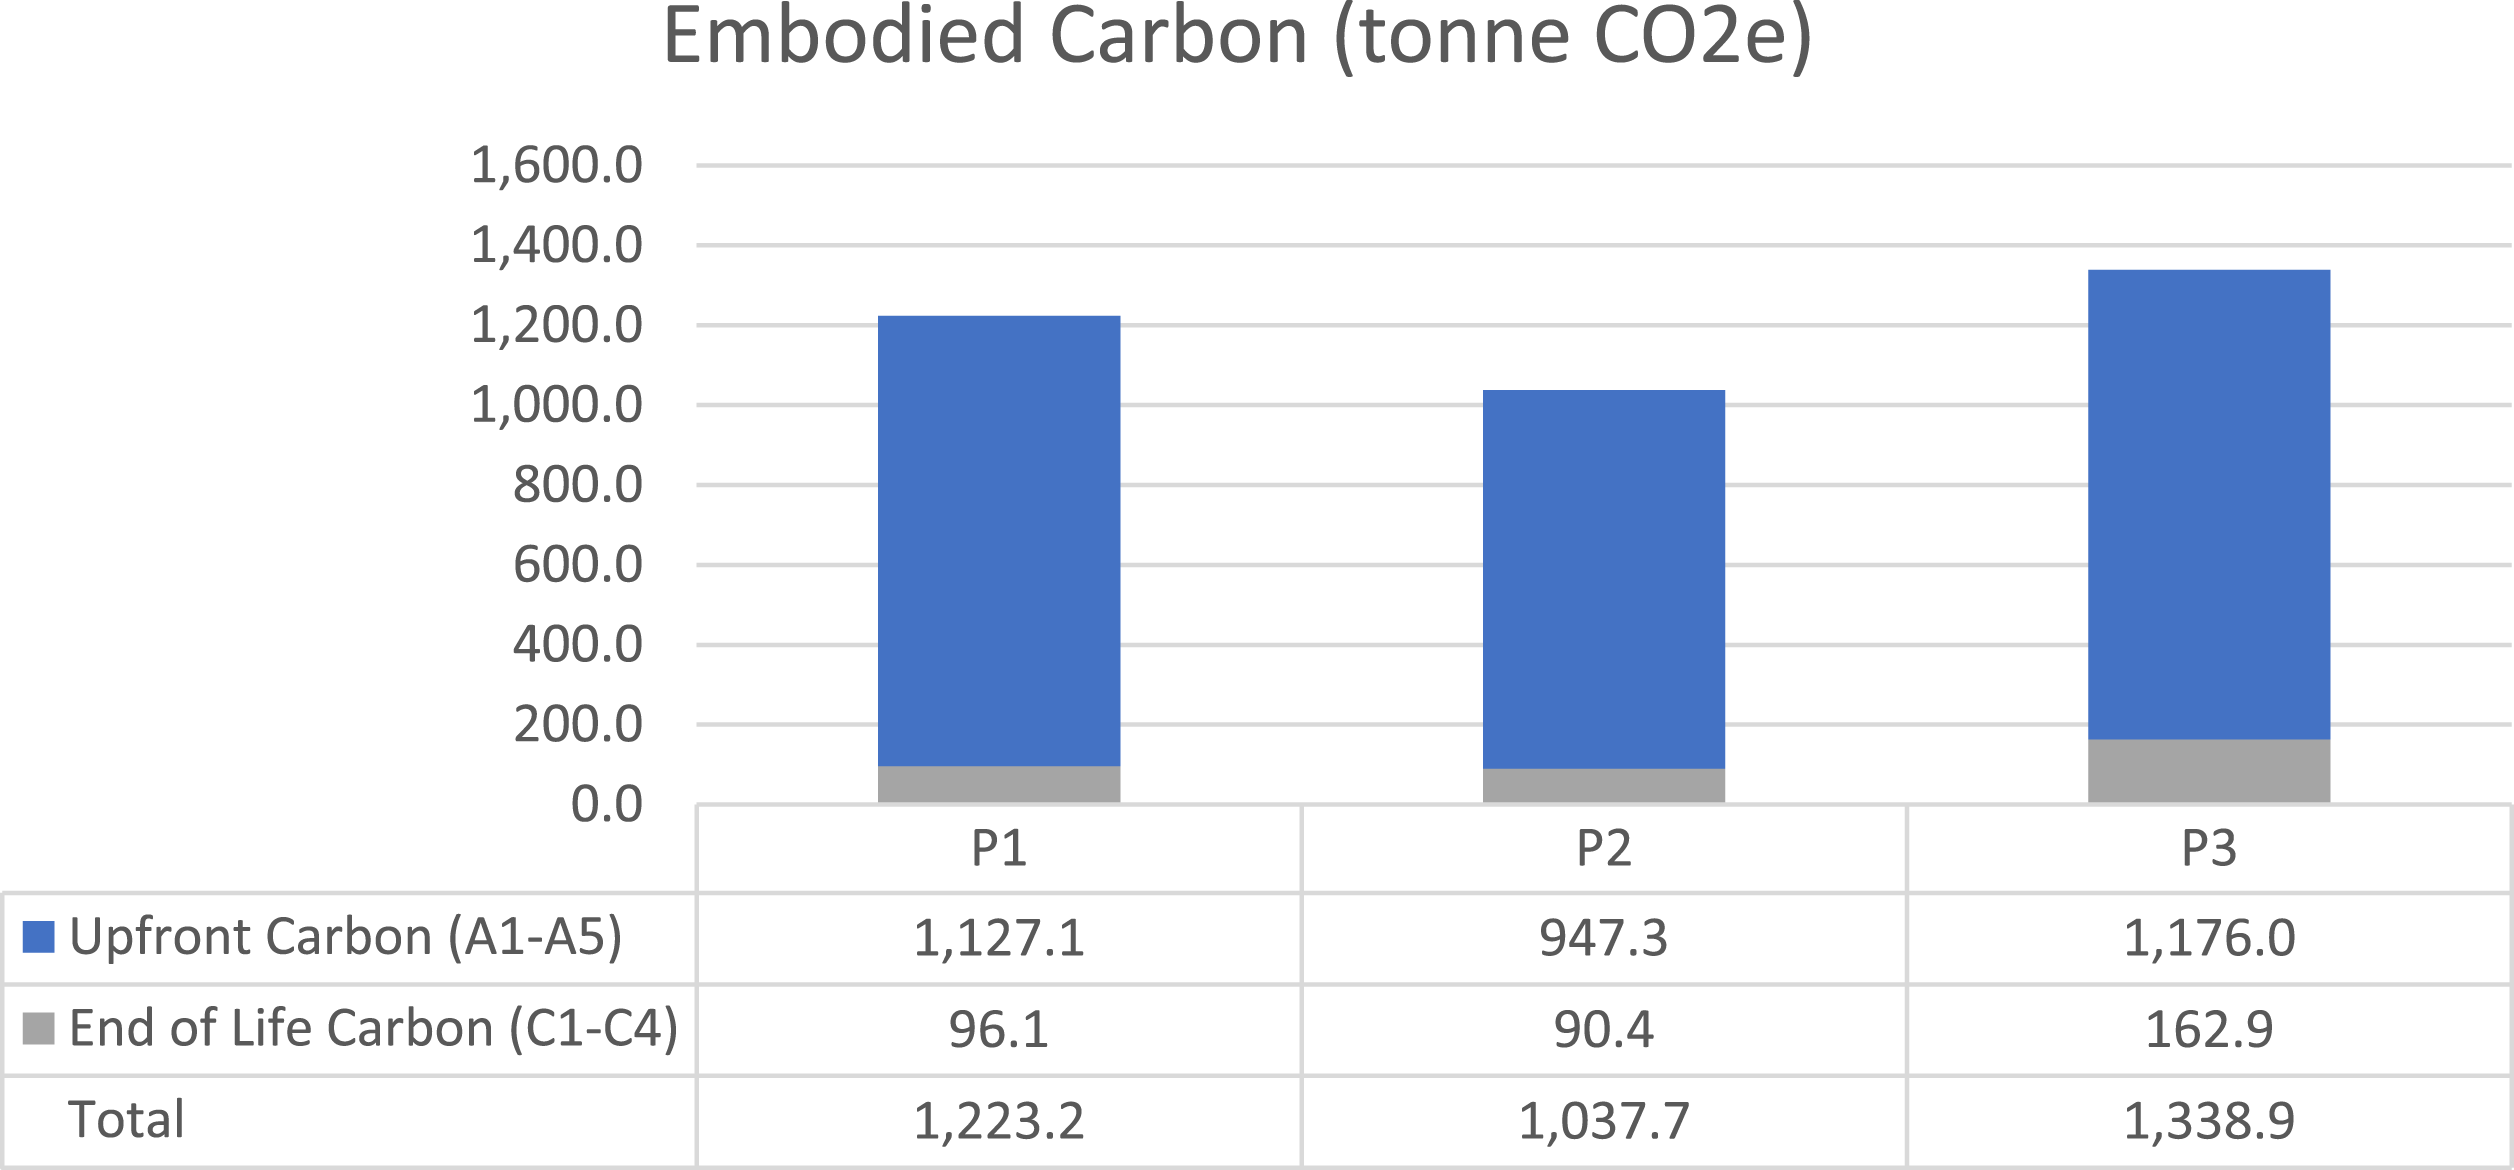
It could be assumed that a glulam frame would contain a lower embodied carbon due to timbers’ intrinsic capability of absorbing CO2. 46 Many studies such as Hafner and Schäfer, 47 Spear et al. 48 and Hart, D’Amico and Pomponi 28 have respectively observed a potential 9–56% EC reduction in timber-based materials compared to mineral substitutes, a possible 20% EC reduction by substituting masonry with timber frames and a potential 43% EC reduction by use of timber frames compared to concrete and steel frames; the reduction or potential reduction is achieved by the inclusion of sequestered carbon in the results. Although it might appear that the findings of this study do not align with such studies, in order to avoid the risk of misleading results, a carbon-neutral calculation approach is assumed for wood-based materials. 49
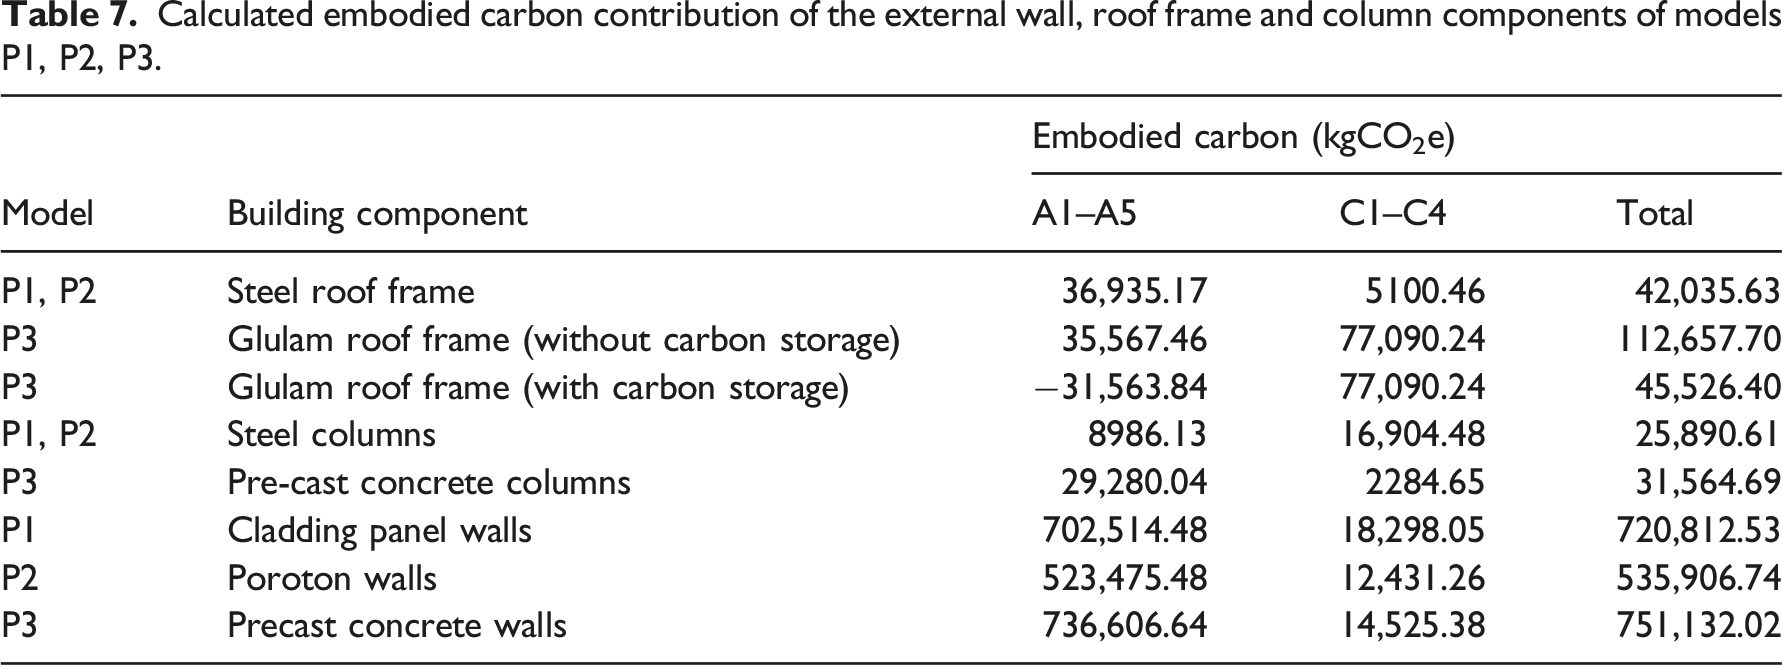
Calculated embodied carbon contribution of the external wall, roof frame and column components of models P1, P2, P3.
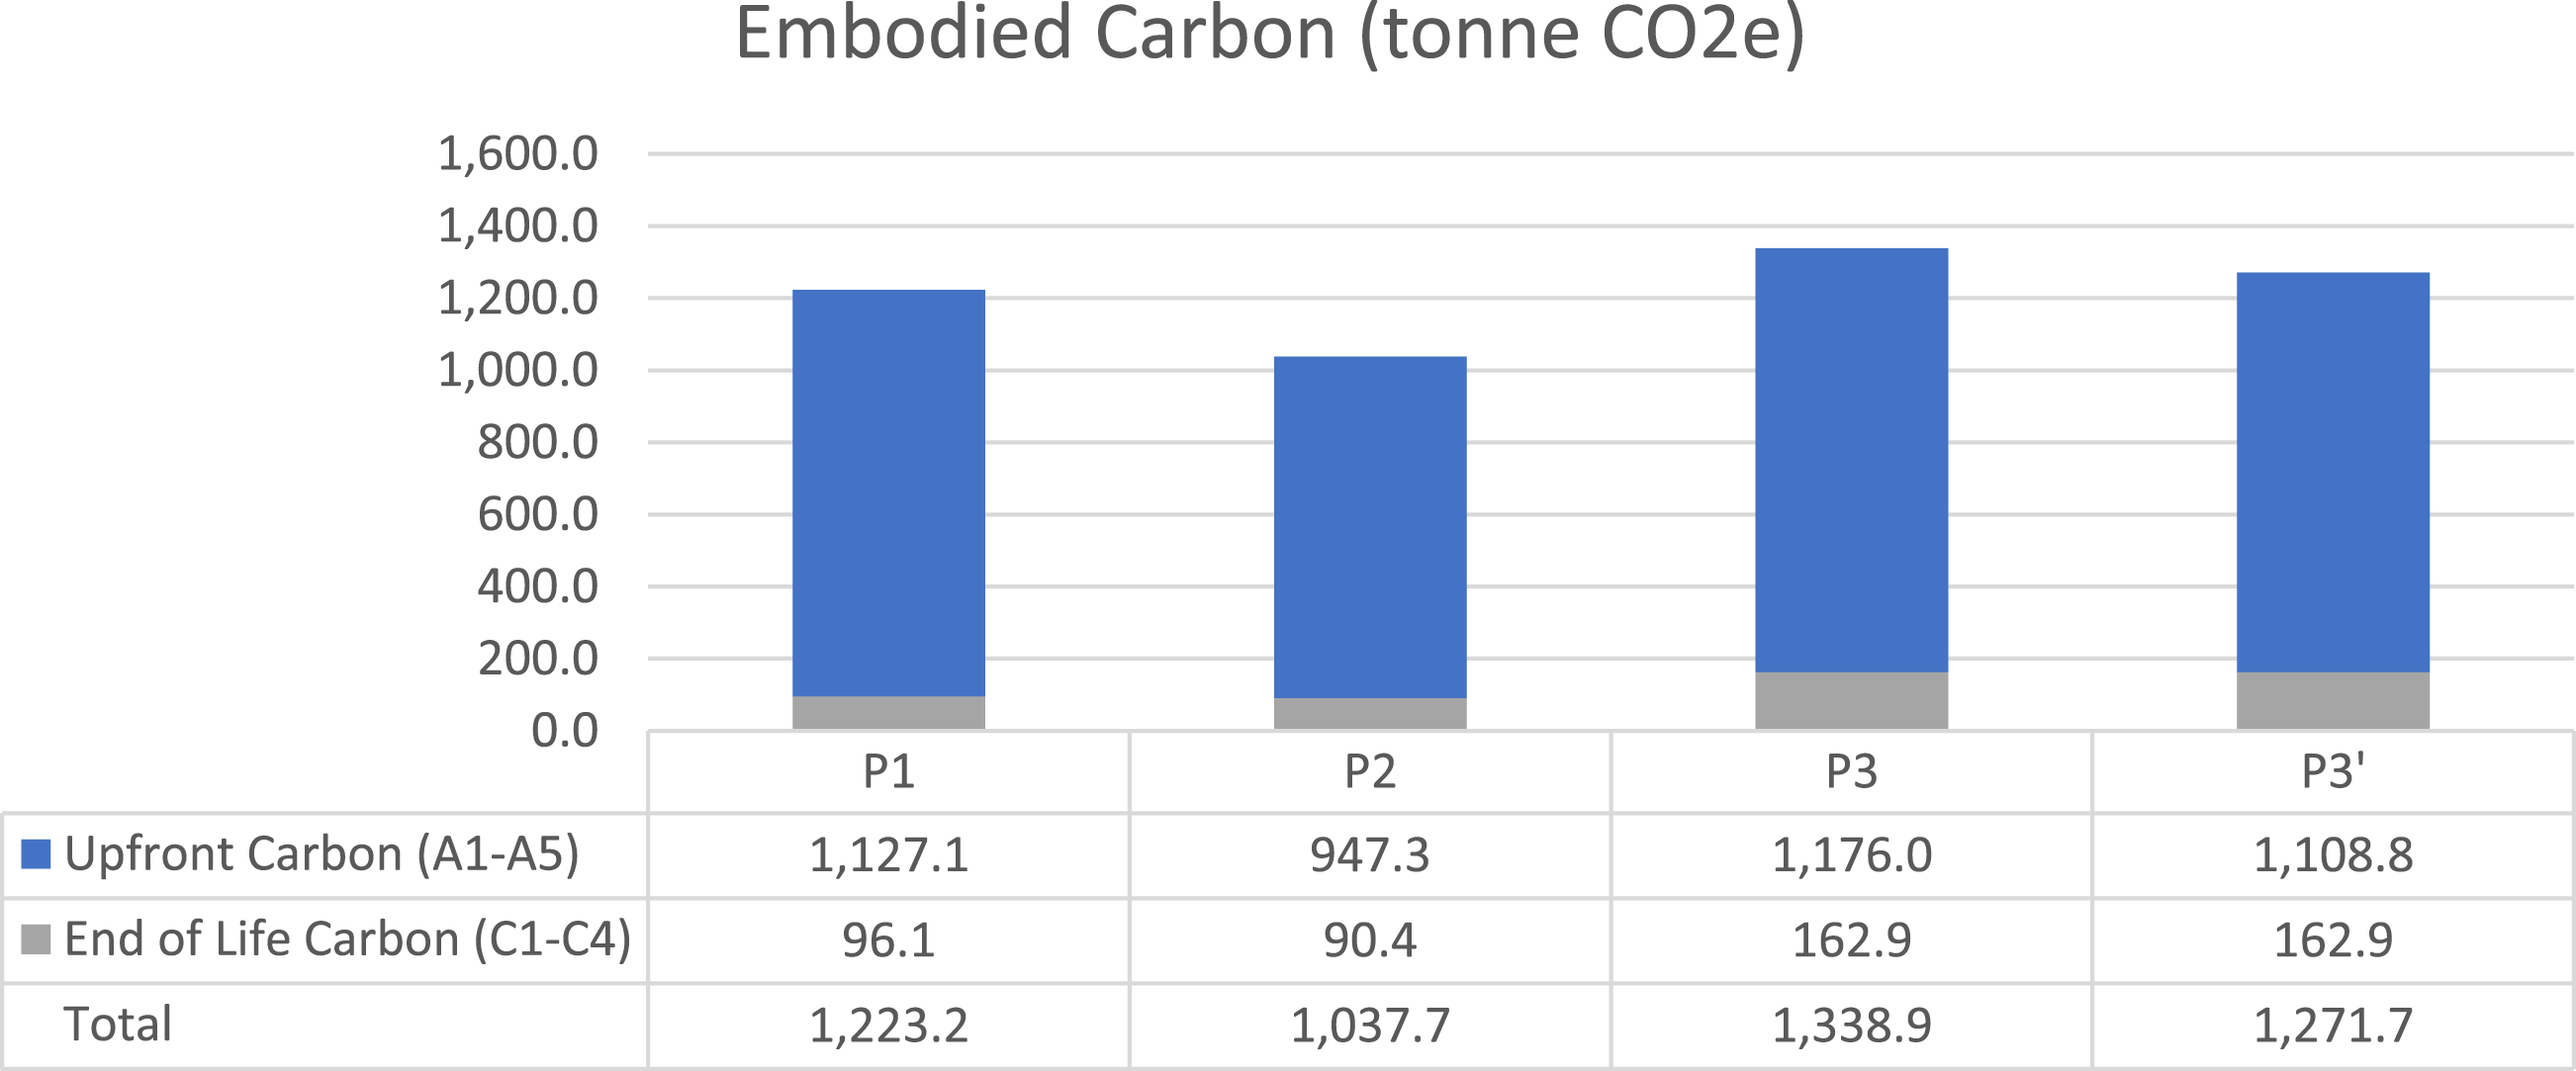
Calculated embodied carbon comparison of models P1, P2, P3, P3’ (including timber sequestered carbon).
Operational energy/carbon
Current scenario
To calculate the operational energy and carbon emissions of the supermarket building located in Norwich, the CIBSE Test Reference Year (TRY) for Norwich, has been used. The annual energy consumption (kWh/m2) and annual CO2 emissions (kg/m2) of P1, P2 and P3 were calculated within the defined parameters (Figure 8) using the Norwich current TRY files. Showing that the operational phase of models P1, P2 and P3 are nearly identical; however, model P3 consumes slightly less energy as well as produces fewer emissions. Operational energy and carbon emissions of models P1, P2 and P3 under the current scenario.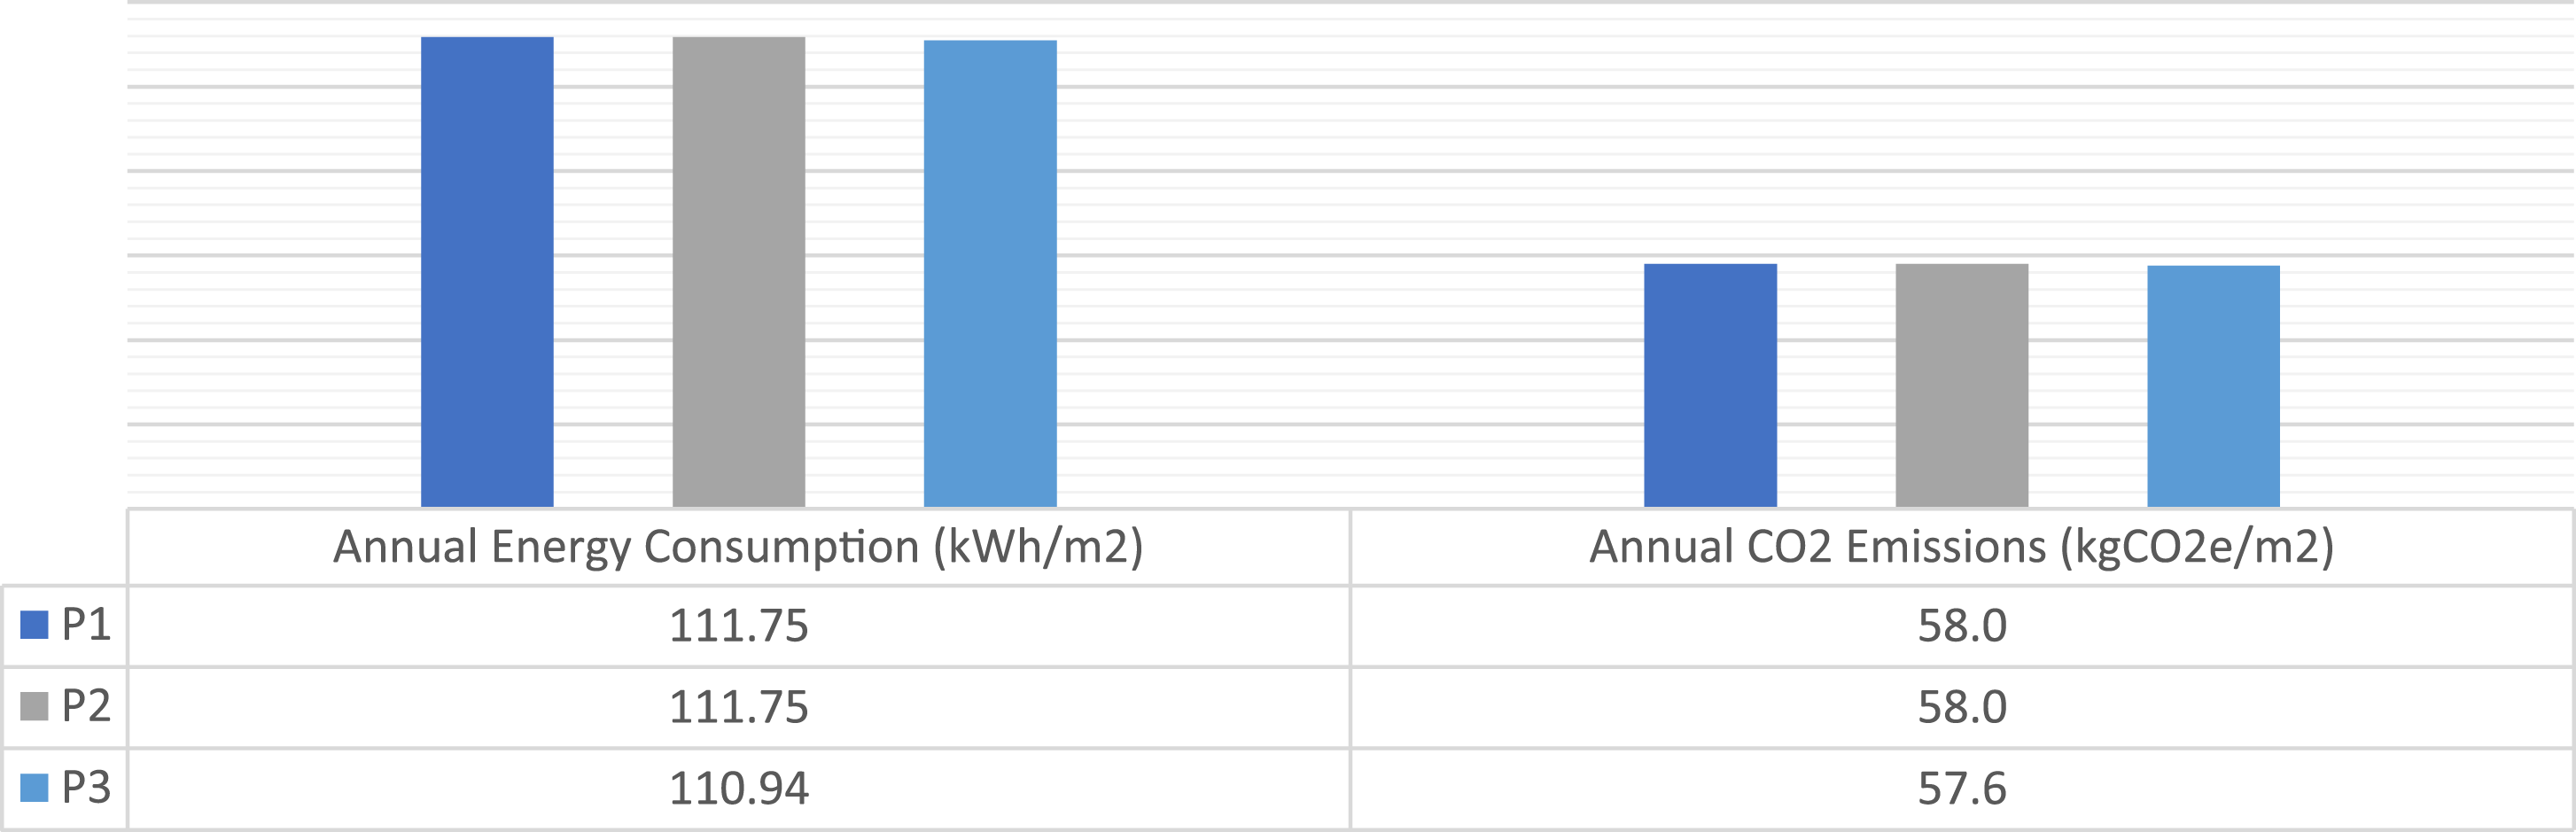
These results indicate the energy consumption and subsequent carbon emissions from controlled, fixed building services and fittings, including space heating and cooling, hot water, ventilation and lighting. However, energy consumption from processes that are not controlled, which TAS categorises as equipment use, cannot be considered towards the total energy consumption. Given that these processes such as IT equipment, lift, escalators, refrigeration systems, external lighting, and small power equipment, are dependent on user/customer actions, which cannot be predicted and can vary throughout the buildings lifecycle.
Future scenario (20-year period)
As mentioned, the observed service life for this study is 20 years. Assuming that the energy consumption and associated carbon emissions of the supermarket building remain the same for the next 20 years, the results based on the use of the current TRY obtained in calculated for the current scenario are then multiplied by 20, to obtain projections of future energy usage. Retaining the remaining factors, the annual energy consumption and carbon emissions of the next two decades of P1, P2 and P3 were calculated. While this assumption creates some limitations and uncertainty it does provide a valid benchmark comparison for all three models. Adjusting for future changes using CIBSE emission scenarios of 2050s (low, medium, and high each with 10th, 50th and 90th percentile) would produce unclear and confusing results for any given model under investigation and would not provide results for this study’s purposes.
The results presented in Figure 9 showing, as expected, the near identical annual energy consumption and carbon emissions of all three models for the next two decades. With P1 and P2 consuming 5,587,500 kWh energy and P3 consuming 5,547,000 kWh. And P1 and P2 producing 2,900,000 kgCO2, and P3 producing 2,880,000 kgCO2 of carbon emissions. Highlighting that due to the quantity of operational emissions, even small differences could make a significant difference. As seen in the 20 tonnes of carbon emissions difference between models P1 and P2 with P3. Operational energy and carbon emissions of models P1, P2, P3 under future scenario.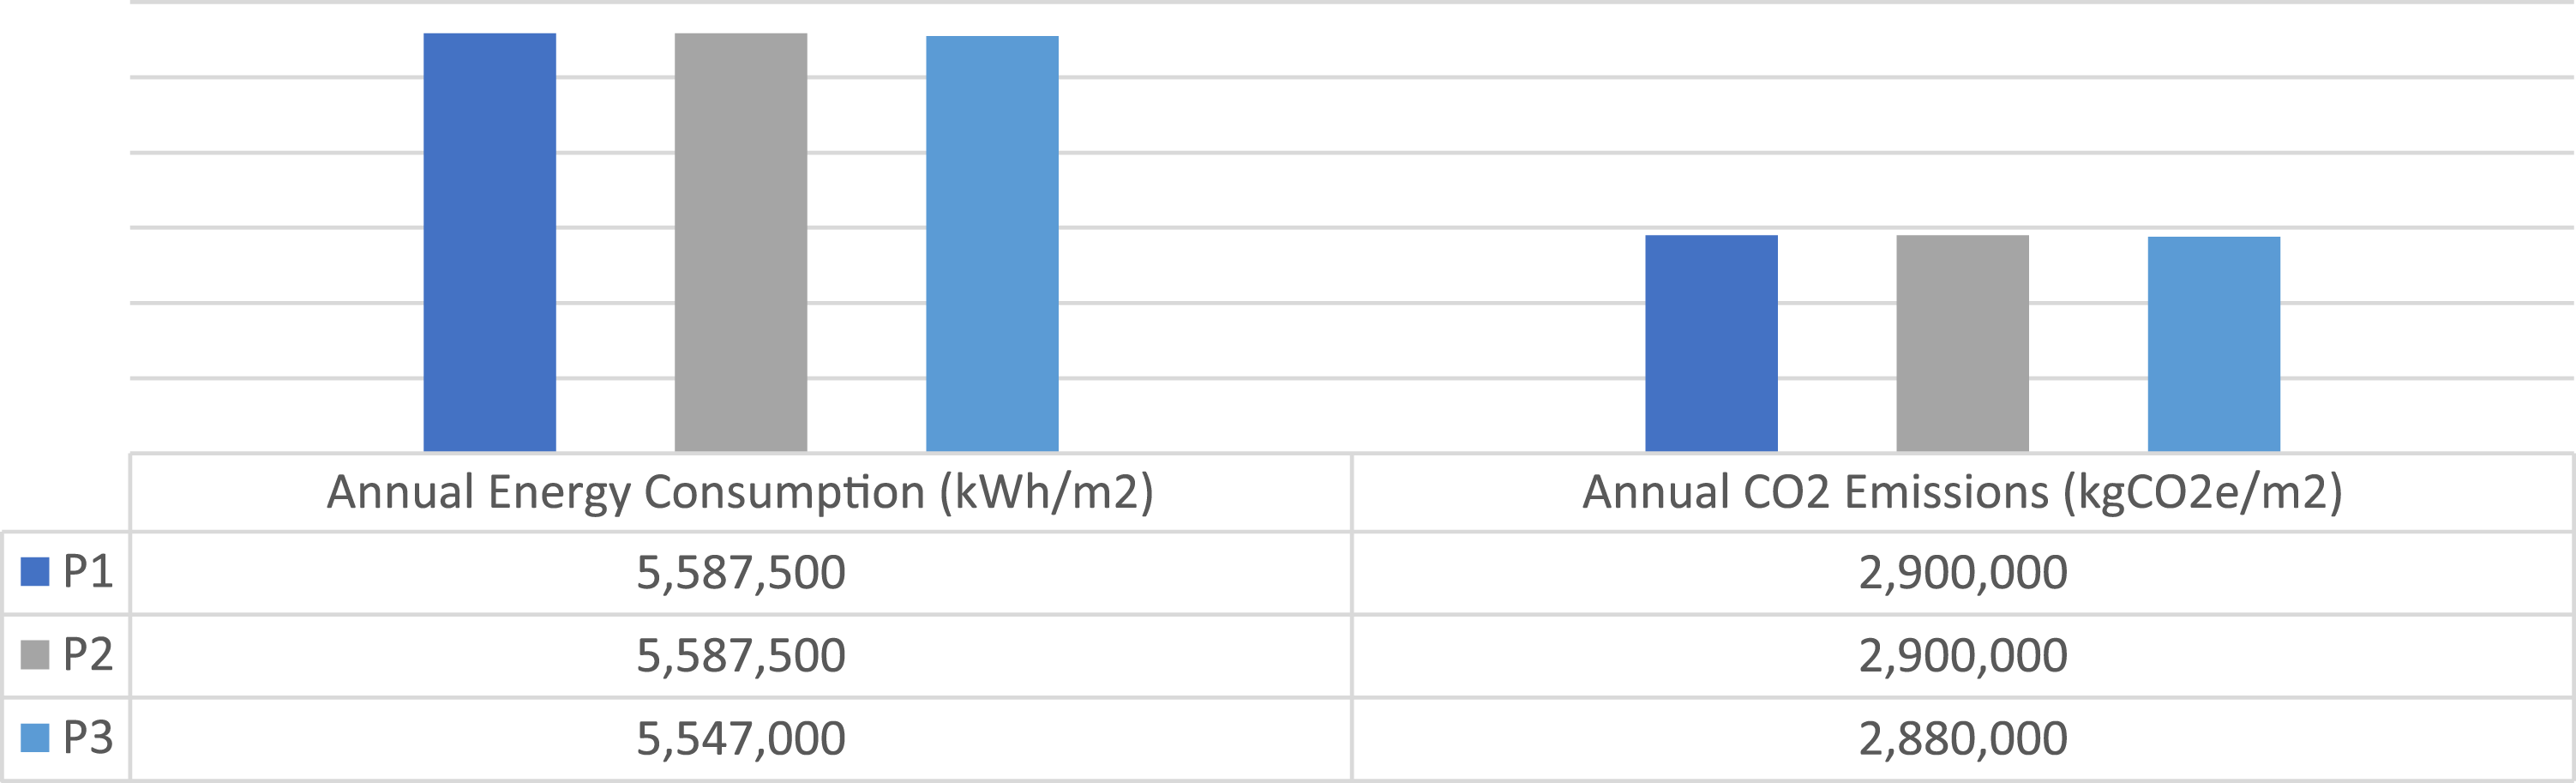
As supermarket stores are primarily powered by the national grid, it is also important to understand the decarbonisation of this energy system which means moving from a centralised, fossil fuel-dependent system to a green and renewable energy system. 51 In 2021 a landmark commitment to decarbonise the UK’s electricity system by 2035 was confirmed by the UK government by introducing a ten point plan for a Green Industrial Revolution via home-grown, green technologies. 52 However, at this moment there are no further explanatory notes or details available from the official sources.
Verifying simulation results
There are distinct possibilities of differences between simulation results and actual building performance due to use of different assessors, different tools, unknown data, or uncertain information such as user activity. With certain studies suggesting a possibility of energy performance gap as high as 30%. 53 Therefore, it is important to investigate the reliability of the simulation results. The reliability of the TAS simulation results was tested by validating the results against measured energy consumption of a LIDL supermarket building of similar proportions and building performance operation in the UK. According to survey and real-time annual energy measurements recorded over five consecutive years, a consumption range of 137.31 kWh/m2 to 150.53 kWh/m2 was observed. These values are slightly higher compared to the 111.75 kWh/m2 calculated using TAS. However, these differences are affected by various factors such as the exact location of the building, weather database difference and historical climate change, dissimilar HVAC systems, air infiltration systems, as well as use of TAS instead of Simplified Building Energy Model (SBEM) methodology carried out by independent commercial assessors.
Benchmarking results
For the purposes of benchmarking the results against the nominal values of a notional building of a similar size, it is important to have the exact corresponding values. A notional building is a theoretical design of a compliant specification and is intended to be an aid to designers, showing how compliance might be achieved using certain technologies or u-values. The operational carbon energy and emissions of a notional building would approximately consume 109 KWh/m2 and produce 53 KgCO2/m2 depending upon the model type used.
As previously mentioned, the lack of regulation and significantly less case studies for embodied carbon, prohibits the ability to create a benchmark comparison value. The London Energy Transformation Initiative (LETI) published a design guide in 2020 providing some data for residential, commercial office and school buildings suggesting a that the latter would produce approximately 1000 kgCO2e/m2 in the A1-A5 stages, with a reduction goal of 600 kgCO2e/m2. 54 The case studies in this research produced between 378.92 kgCO2e/m2 and 470.39 kgCO2e/m2. Although, a Built Environment Carbon Database (BECD) is being developed by several bodied including RIBA, the RICS, CIBSE, BRE, CIOB, IStructE, and ICE which will soft launch in 2023, which could be a vital tool for future research. 55
Whole life carbon
In order to examine the whole life carbon of the three models, the operational carbon, adjusted for the 2,500 m2 floor area of the building, and the embodied carbon were consolidated. It can be observed that the Whole Life Carbon (WLC), as depicted in Figure 10, follow the same trend as the embodied and operational carbon individually. With model P2 having the lowest WLC of 3937.7 tonneCO2e, followed by model P1 with a 4123.2 tonneCO2e WLC impact and P3 having the highest impact, with a WLC of 4218.9 tonneCO2e. Moreover, even considering the sequestered carbon, the WLC of P3′ is still higher than the WLC of P1 and P2, with a value of 4151.7 tonneCO2e. The upfront, operational and end-of-life emissions contribution of models P1, P2, P3, P3′.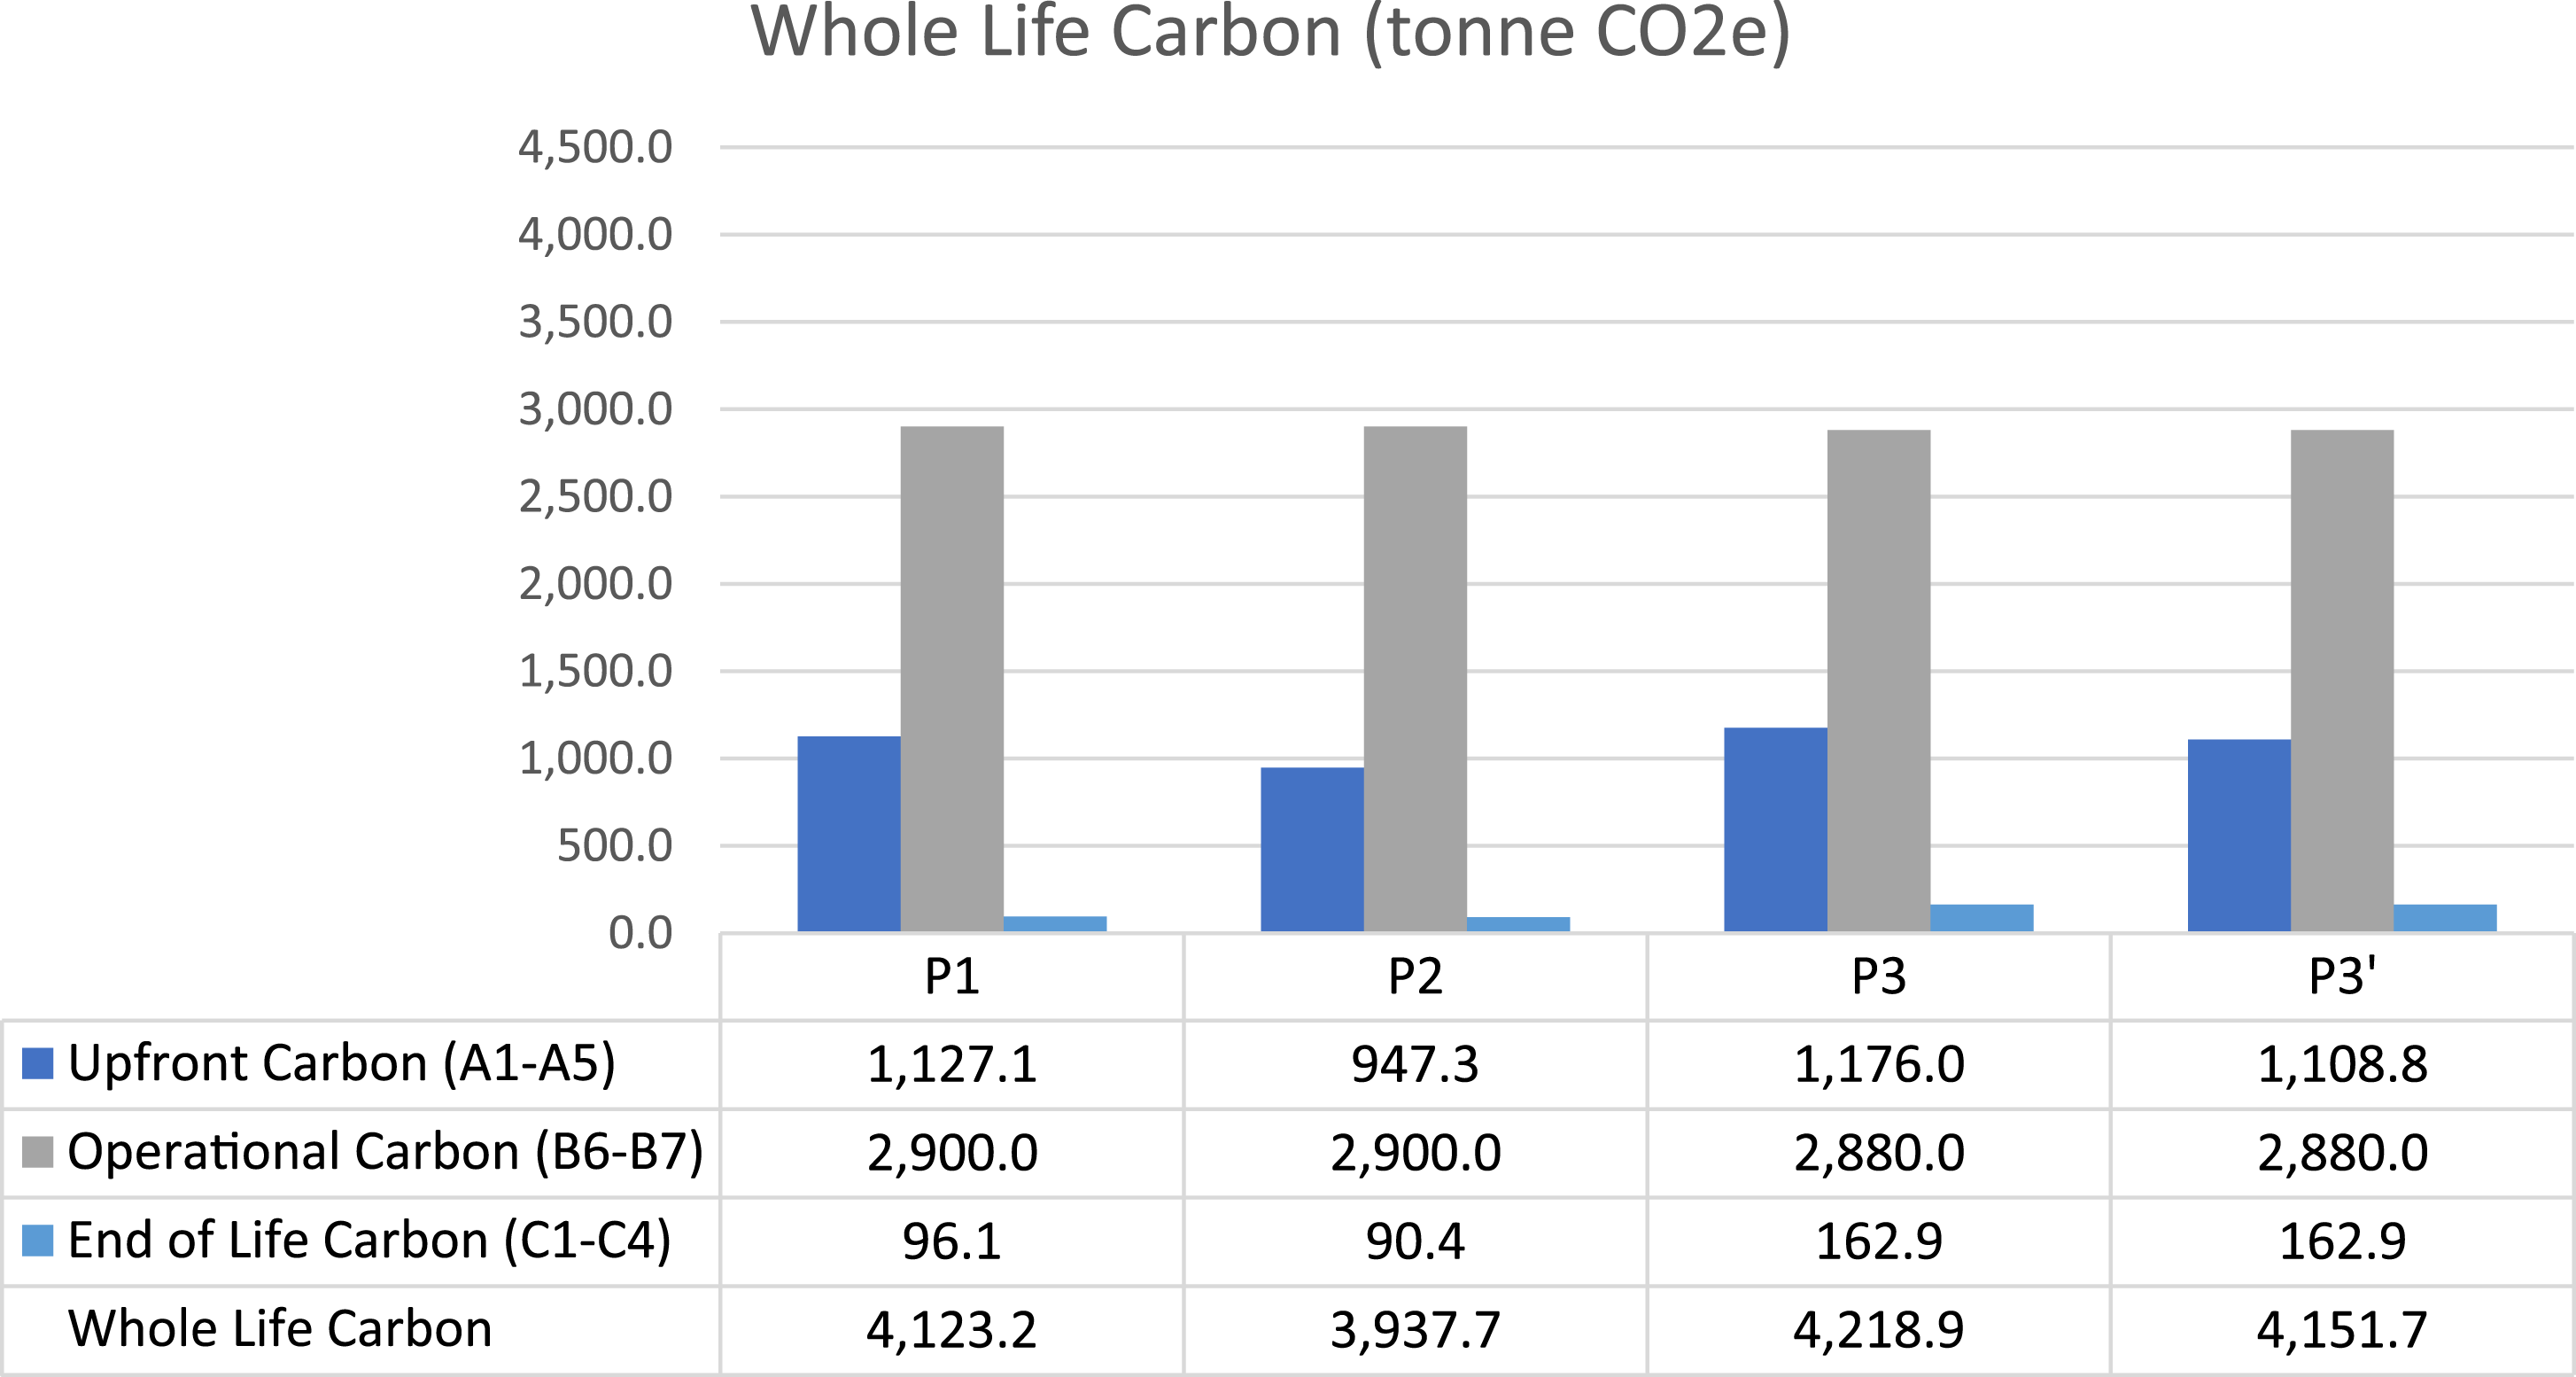
Examining the embodied and operational carbon separately provided an insight into the reasons regarding the issues of performing a WLC assessment. The percentage breakdown as depicted in Figure 11 show that the presentation of WLC within this format could be misleading without providing the vital context of the results. Whilst the results of this study present a comparison where the Operational Carbon (OC) has minimal difference between the three models, in other studies this may result in misplaced focused of reduction efforts. Contributions of the upfront, operational, and end-of-life emissions of models P1, P2, P3 to the Whole life carbon.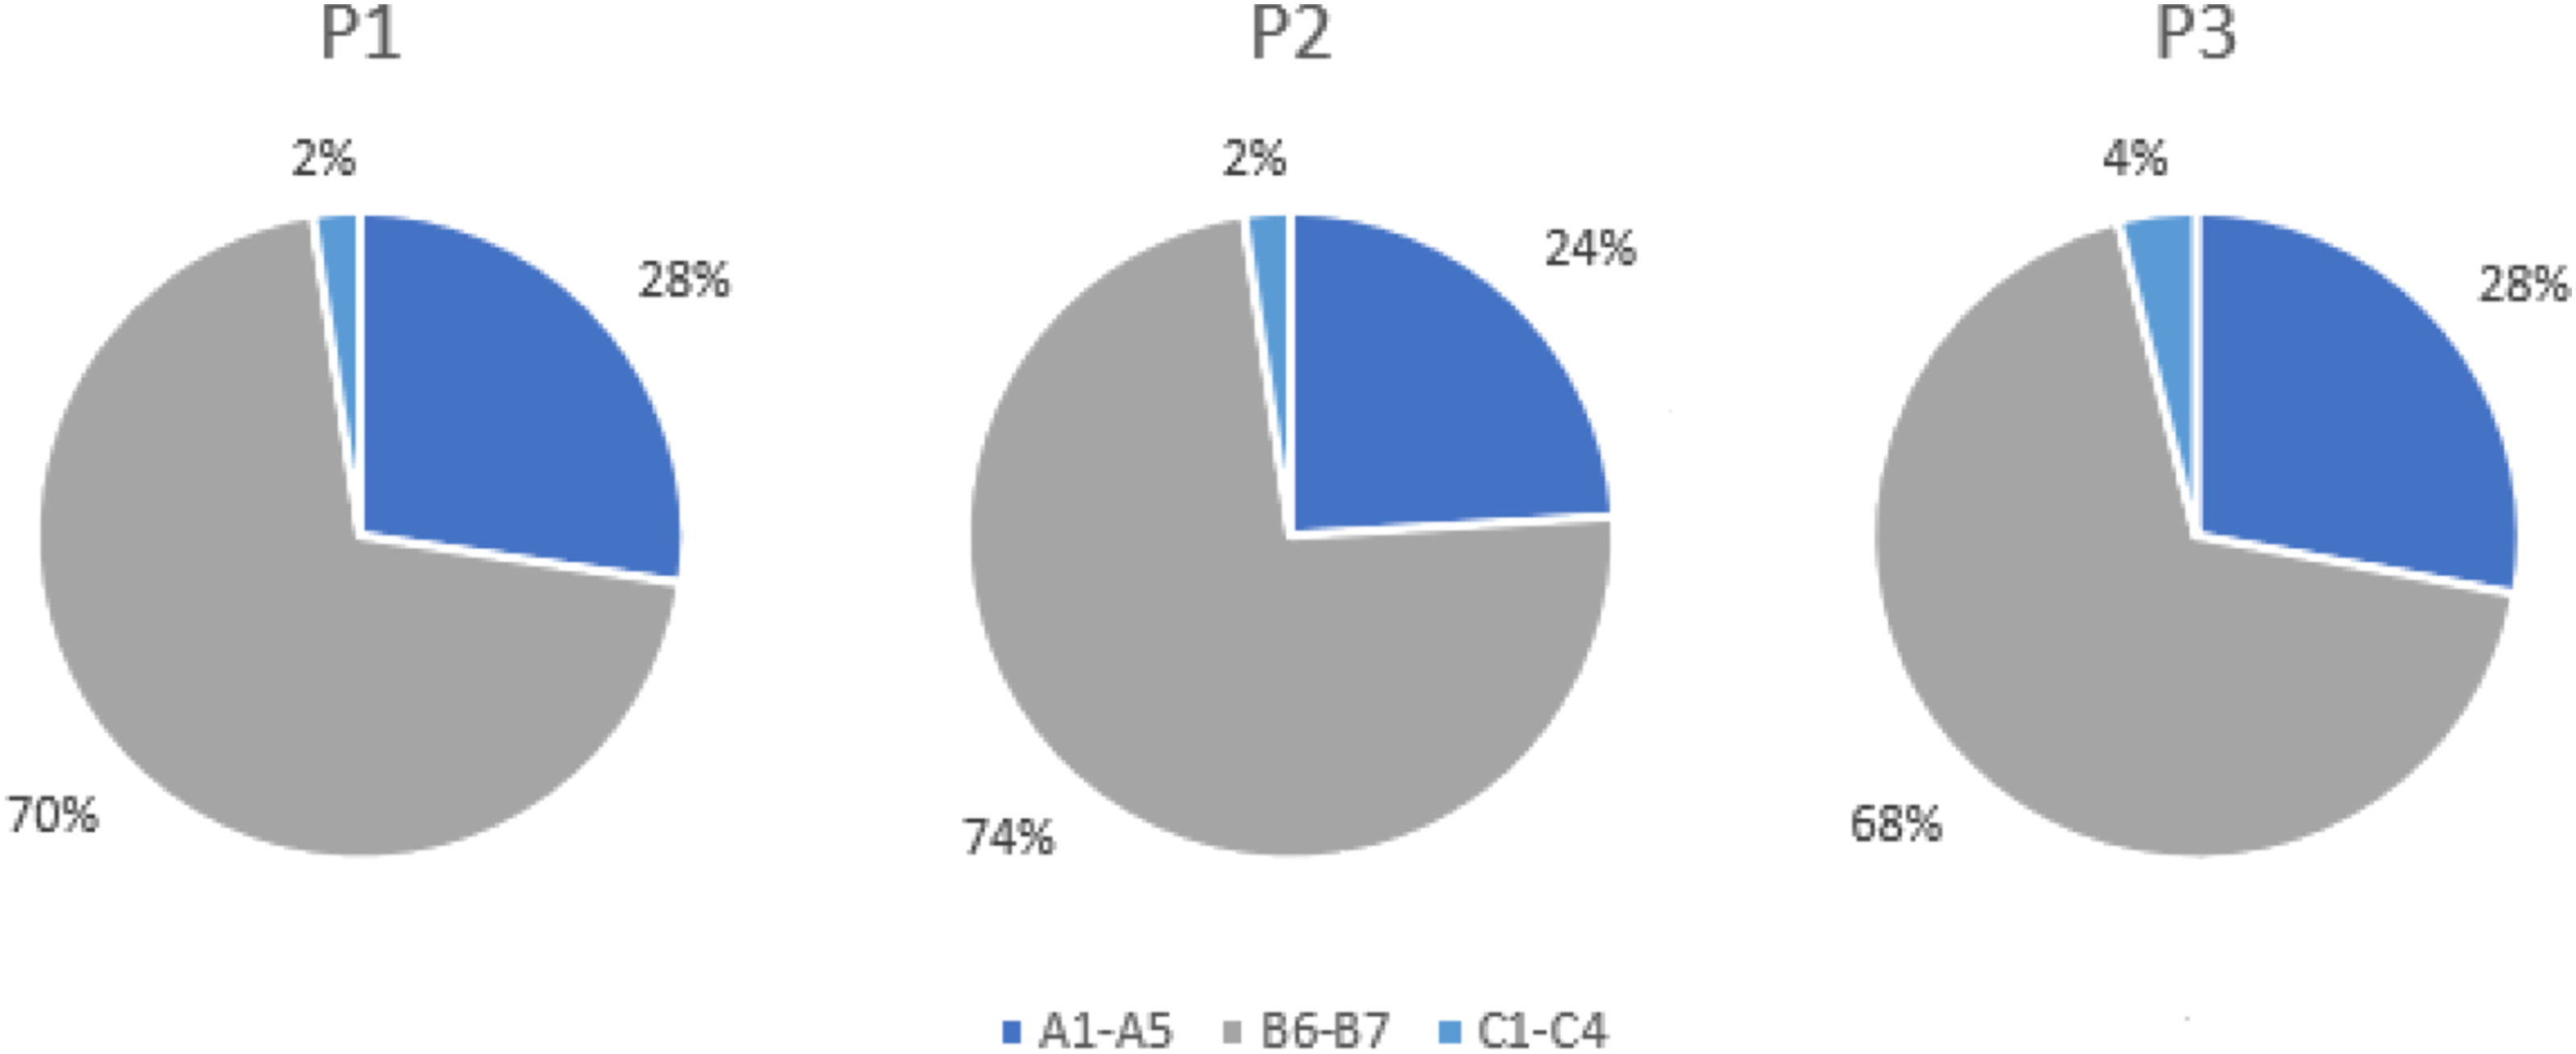
The factors contributing to the largest portions of the OC, such as lighting, are considered negligible when calculating the EC. Consequently, while it might be expected that the building fabric, the largest single contributor to the EC in all three models, contributing 30% of P1, 26% of P2 and 32% of P3’s EC, would affect the OC of the buildings. The nature of the building use and the subsequent energy use breakdown, and where all 3 models are designed with the same HVAC system as presented in this study, factors such as building fabric which significantly affect the difference in EC do not affect the OC as substantially. It could be concluded that the ability to observe the effects of each factor on the emissions of each stage separately would provide more accurate information which would be ideal for future environmental impact reduction efforts. However, adopting this conclusion outside the parameters of this case study would not be practical. As mentioned, one of the possible factors of this result is the specific design and use of the building. Additionally, these results can inform future WLC reduction strategies which could be implemented. As the variable factors in this study affecting the environmental impact of each stage are observable, changes to any factor to reduce the impact of any particular stage can be considered with the knowledge of the effect on the WLC. Furthermore, this study provides a framework for the future study of the non-variable factors between the three models, such as the building design, HVAC system, and the effects on the whole life carbon and further reduction efforts.
Conclusions
This research aimed to examine the material components and construction developments of buildings by comparing embodied (EC) and operational carbon (OC) emissions of three construction approaches. The life cycle phases included in the analysis were production, construction, operation, and disposal (A1-A5, B6-B7, C1-C4). A case study of a typical UK supermarket building LCA was performed to evaluate three construction approaches with different building materials. The whole life carbon (WLC) emissions were shown to be 4123 tonneCO2e for the P1 model, of which the EC accounted for 30%. Showing a 3938 tonneCO2e WLC emission for the P2 model, of which the EC contributed 26%. The three construction approaches were analysed, considering the potential to reduce embodied carbon emissions over the whole life span of the building. Relevant findings from the preliminary calculations using Revit and TAS tools for the models revealed that P3 has the largest WLC of 4219 tonneCO2e representing an EC contribution increase of 32% increase without considering the biogenic carbon. The findings of this investigation observe that the carbon emissions of supermarket buildings could be reduced (approximately 6.6% reduction), by carefully making material choices without the need of extreme redesigns or reconfigurations to building systems. Additionally, as the three structures were designed with identical building services, the results showed that this method of embodied carbon reduction in these structures has limited influence on the operational carbon. Future studies could also explore the influence reduction of OC via the implementation of alternative building structures and examining the influence of those reduction strategies on the EC. These insights may assist designers and engineers in making the right design decisions for buildings regarding a comprehensive carbon emissions reduction strategy. These findings could also provide foundational information in the development of further WLC reduction strategies such as design changes in the plan, size, and layout of similar buildings.
Additionally, highlighting that it is imperative to consider the WLC when making design decisions. Unless the processes of all stages can be controlled, considering the lack of legislations for many processes, in particular end of life, carbon savings in one stage may be negated in other stages. And consideration of carbon savings from captured carbon to inform design decisions should be examined beyond the lifecycle. It is, therefore, crucial to develop this further knowledge along with the enrichment of relevant information.
This study contributes to our understanding of embodied and operational carbon emissions. Additionally, the method employed in this study assessing the WLC of UK supermarket buildings, could assist in providing a framework for the calculation of future cradle to grave impact assessments of other building types. Allowing for and encouraging more informed design decisions by investors, developers and institutions to lower carbon emissions associated with their building stock. Furthermore, given the need to provide futureproofing of buildings against the changing climate whilst reducing future harm, it is vital that the introduction of passive design technologies and incorporation of high-efficiency HVAC systems could provide a realistic plan to secure the built environment ahead of the expected change in the climate.
Footnotes
Declaration of conflicting interests
The author(s) declared no potential conflicts of interest with respect to the research, authorship, and/or publication of this article.
Funding
The author(s) received no financial support for the research, authorship, and/or publication of this article.