
Abstract
Prefabricated timber houses have received growing attention in China recently as being one possible approach to mitigating climate change impacts. This article presents the results from a dynamic thermal simulation parametric analysis of building characteristics and primary energy consumption, embodied and operational carbon of newly built prefabricated timber house types in northern China for current and future climates (2050 and 2080). The dynamic thermal modelling software DesignBuilder (+EnergyPlus) was adopted as the simulation package. The main findings from the study were: (i) by 2080 climate change could increase energy demand by 13% for a terraced house, by 10% for a semi-detached house, and by 6% for a detached house, with corresponding increased carbon emissions of 27%, 26% and 23% respectively; (ii) in 2080, a terraced house would achieve 74% energy demand and 90% carbon emissions of a detached house; (iii) increasing the window-to-wall ratio from 0.25 to 0.45 would lead to 31% increase in energy demand, and 42% increase in carbon emissions in 2080; (iv) adjusting the configuration of key timber structural components (walls and floors) could lead to reductions of 19% in primary energy demand, 23% in operational carbon, and 6% in embodied carbon.
Practical applications
A terraced timber house with south-facing and a window-to-wall ratio of 0.25 would be an optimal configuration to mitigate climate change impacts in northern China. The adjustment of prefabricated timber wall structure could give rise to significant reductions in primary energy consumption, operational carbon emissions, and embodied carbon.
Keywords
Introduction
Climate change, energy consumption, and carbon emissions in houses
The building sector is responsible, predominately through the construction and operation of buildings, for approximately 36% of global final energy consumption and 37% of energy-related CO2 emissions. 1 The building sector and related human activities have a significantly negative impact on climate change, 2 whilst the future climate change will largely influence the building energy consumptions and energy-related carbon emissions in cities. 3 Around 24% of global energy consumption is found in residential buildings and this percentage will tend to rise, producing an increasing risk of global warming. 4 Thus, it is urgent to seek appropriate solutions to mitigate climate change and improve energy efficiency in houses.
Timber houses: Energy performance & carbon emissions
Timber has been applied as a construction material for thousands of years. 5 In recent years, timber has increasingly attracted interest from building designers and engineers, due to its ability to achieve energy efficiency and mitigate the impact of climate change by reducing greenhouse gas emissions compared to other construction materials such as concrete.6,7
Since 1999, the energy and carbon performances of timber houses have been widely investigated across different climatic regions.8, 9,10 A Swedish apartment building built from wood had a total expected energy use (heating and cooling) of 47.6 kWh/m2, which was considerably lower than the normal energy consumption in similar buildings. 11 Using dynamic simulations, several studies have investigated the effects of building characteristics on energy demand (heating and cooling) in a series of houses, considering various European climates.12,13 When the wood was used as an alternative to conventional high-density materials, such as brick and concrete, an Australian study found that the timber envelope has apparently lower initial and recurrent embodied energy and end-of-life energy. 14 In addition, the use of timber material can deliver a clearly shorter construction duration than the brick, which would further save energy and cost. 14
Various investigations have been implemented to compare conventional buildings and timber buildings in terms of environmental benefits. Compared with conventional concrete-based houses, timber-based dwellings have been recognized to achieve a significantly lower lifecycle carbon emission. 15 Based on a full life cycle assessment in Poland, the timber buildings achieved an 85.3% reduction in greenhouse gas emissions compared to their masonry counterparts. 16 In addition, with the excellent carbon sequestration of trees, timber structures can give rise to a much lower environmental impact than steel and concrete buildings, particularly in the material production stage and end of life stages of a building. 17
Prefabricated construction: Energy efficiency & carbon emissions
As a novel construction method to lower environment impact, prefabrication has been widely applied in housing for the past few years.18,19 The potential benefits of prefabricated building mainly comprise of reduced construction-induced carbon emissions, reduced construction waste and increased material quality. 20 An American study of a prefabricated modular house pointed out that materials production was the most important phase in the embodied impact (embodied energy and greenhouse gas emissions) and that the structures made with timber had the lowest impacts. 21 In a Turkish reconstruction project, it was found that prefabricated housing had 25.1% and 29.7% lower life cycle energy and cost requirements than a normal construction. 22 A comparison analysis between a prefabricated steel house and a concrete house indicated that the prefabricated structure delivered a better performance for the more important environmental impact categories, namely Respiratory Inorganics, Global Warming and Non-Renewable Energy. 23 A Chinese study showed that the life-cycle energy use of one prefabricated building component ranged from 7.33 GJ/m3 for precast to 13.34 GJ/m3 for cast-in-place, and that the recycling process could achieve 16%–24% energy reduction. 24
Research gap and the present study
Based on the studies above, prefabricated timber houses have recently become a new focus in the building industry, as they can provide environmental benefits which arise due to the substitution of higher impact materials, the storage of sequestered atmospheric carbon in long-life products and the recovery of inherent energy in the material at the end of life.21,25 Currently, China has embarked on the promotion of prefabricated building construction as an ambitious governmental initiative, 26 In line with this purpose, there is an increasing trend to encourage prefabricated timber buildings, especially for dwellings. 27 However, in the Chinese building industry, there is a clear lack of knowledge in terms of prefabricated timber house design and construction, particularly for energy and carbon performances under various Chinese climates. 27
This article presents a parametric analysis of primary energy performance, operational carbon emission and embodied carbon in a prefabricated timber house in northern China, considering climate change and various architecture characteristics in terms of layout, orientation, house shape, structure, and window size. The results could be developed into practical guidelines to achieve energy efficient and low-carbon prefabricated timber houses under current and future climate scenarios in China.
Methods
Location and climate
The location studied was Tianjin city in northern China (Latitude: 39.12° N, Longitude: 117.19° E). Tianjin has a temperate continental-type monsoon climate. 28 The warmest month, on average, is July with an average temperature of 27°C, while the coolest month on average is January, with an average temperature of −3.5°C. 28
Prefabricated timber house model
As shown in Figure 1(a), a newly built house in Tianjin was studied in this article, which is the typical timber residential building type in China.
29
It was a prefabricated timber house with two floors and one attic space. Based on the requirements of prefabricated timber construction technology and structure safety,27,30 a typical rectangle plan was adopted in this house with one kitchen and one living room at the ground floor, and two bedrooms at the first floor - see Figure 1(b). It has a total floor area of 143.56 m2 and a height of 11.8 m (Figure 1(c)). The timber house studied (a), plan of the house (b), elevations of the house (c). (Note: the orientation was defined using the red dash line with arrow).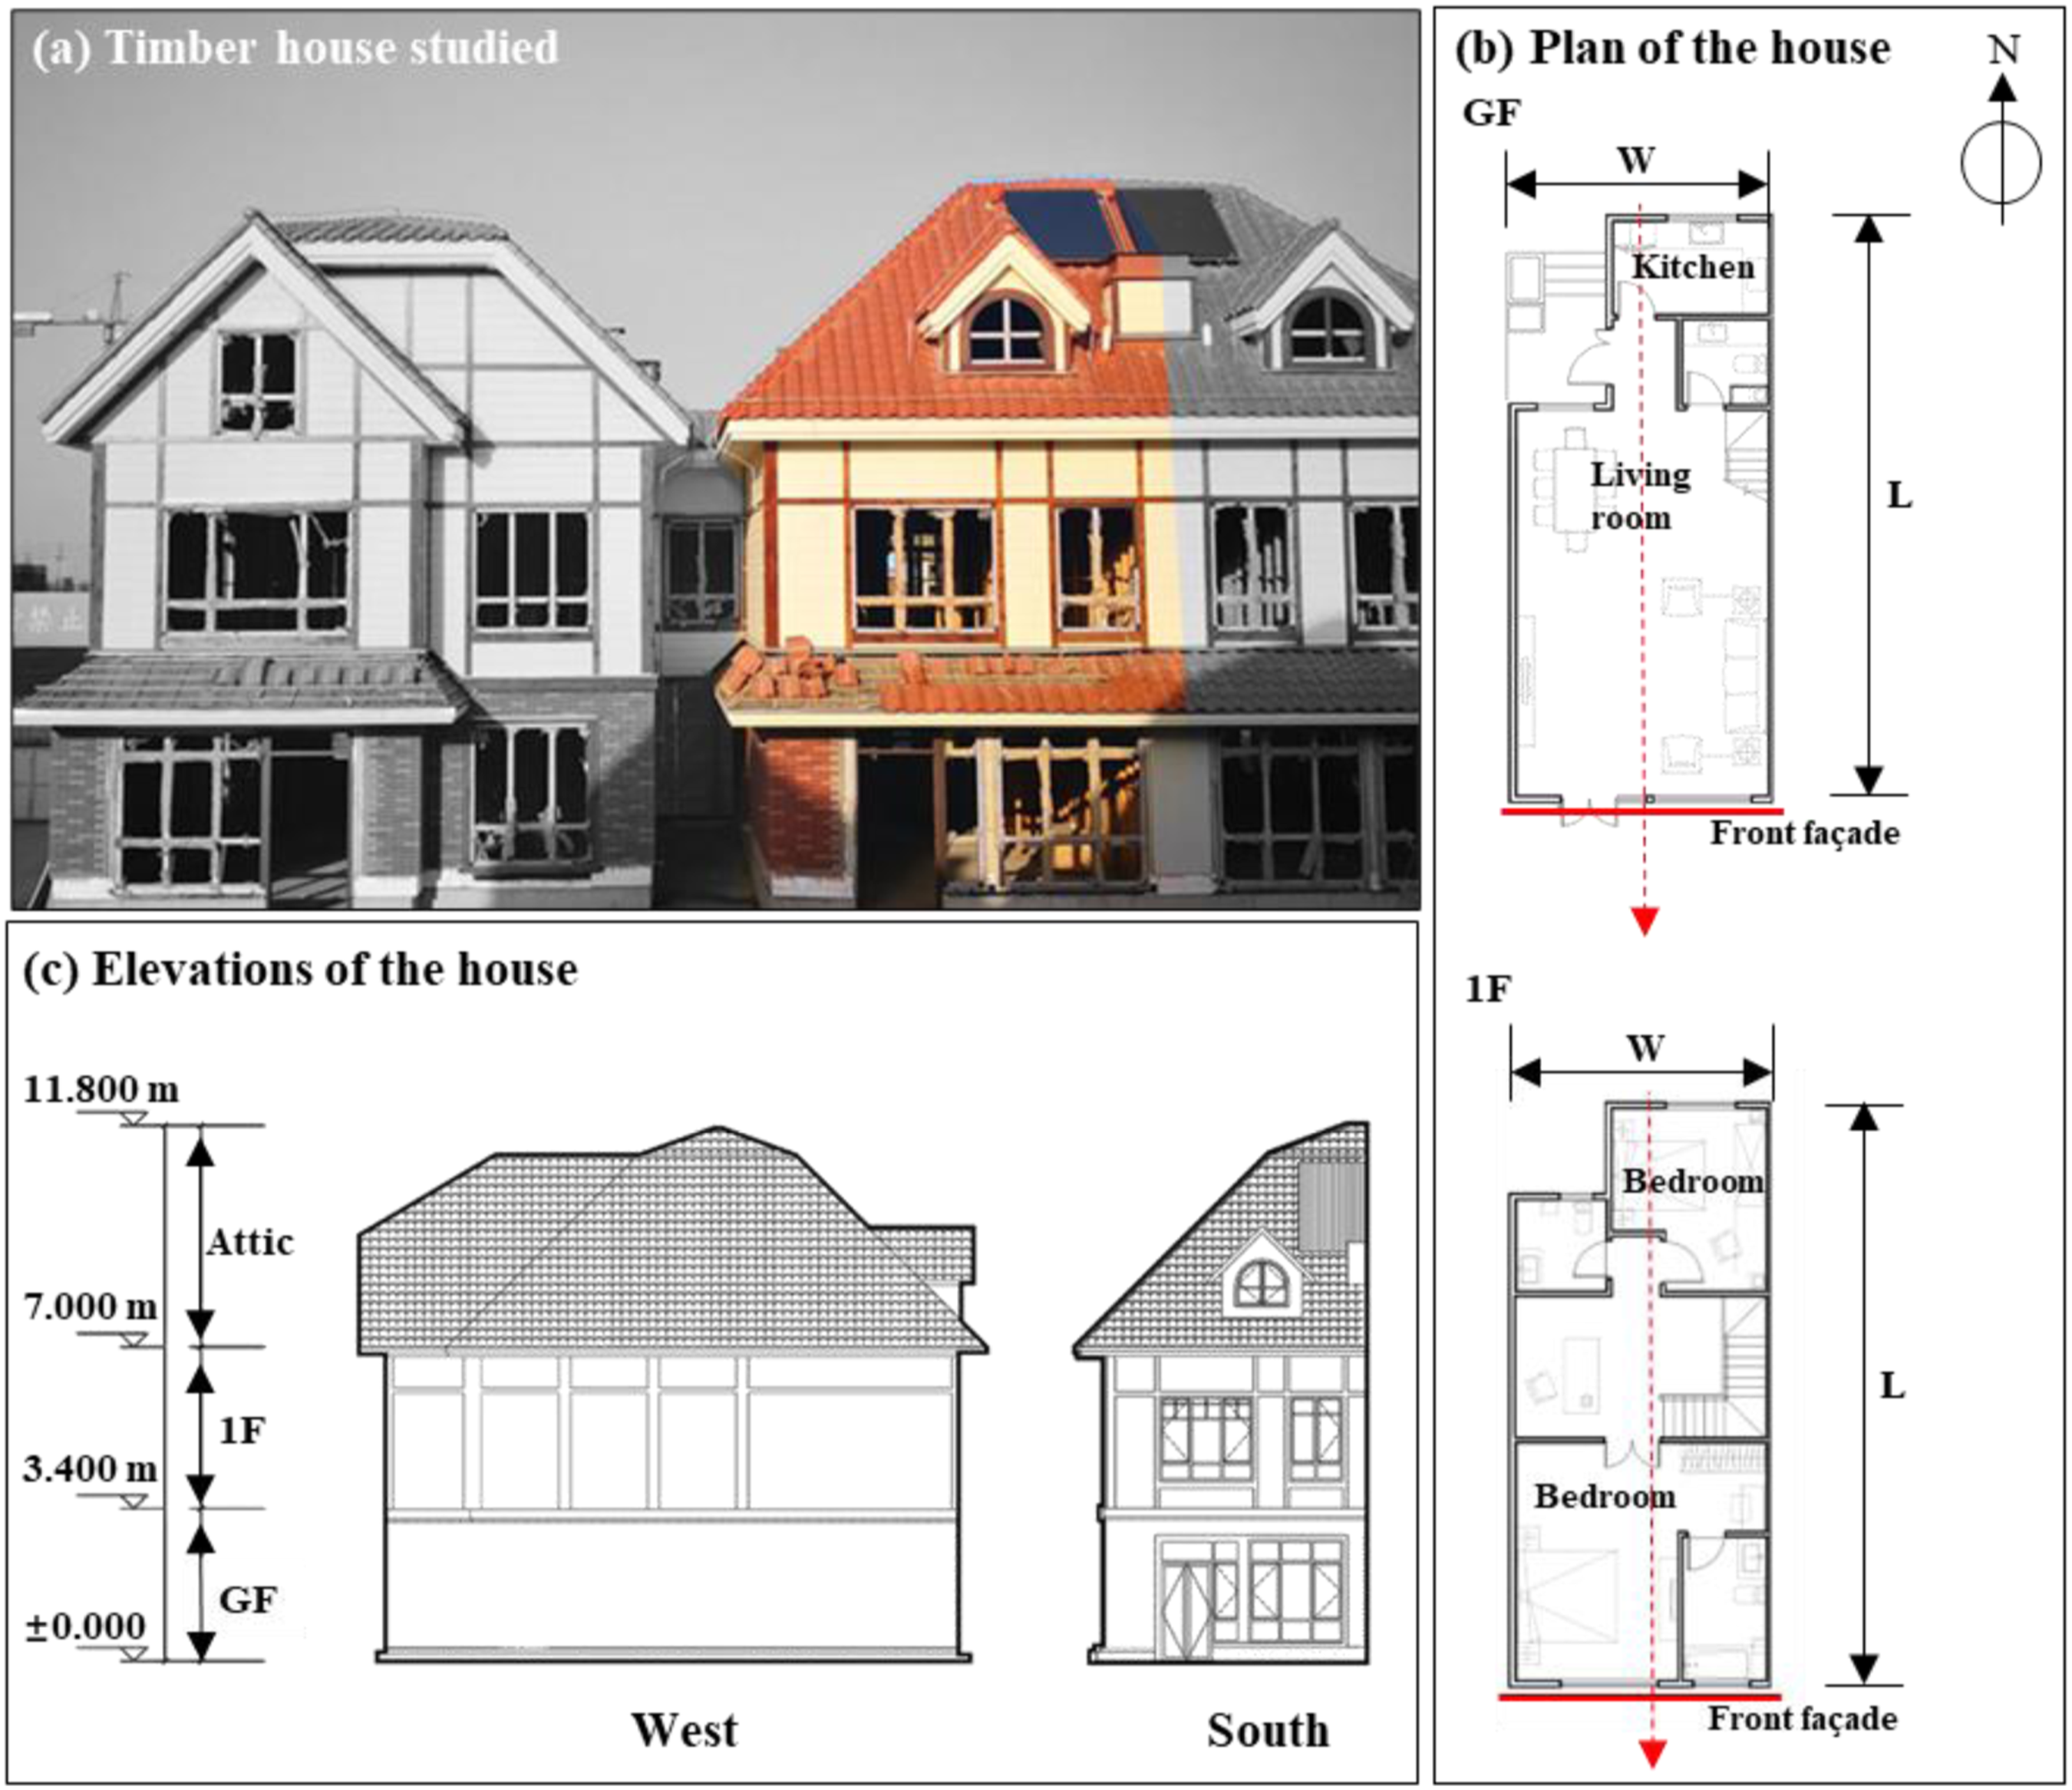
This house adopted a prefabricated platform-frame timber structure, which is currently the most common type of light-frame timber housing construction in China.
27
For this structure, key house components (including wall, floor, roof) were assembled in the factory. In addition, doors and windows were fitted and even electrics and plumbing were installed within the wall and floor sections. Figure 2(a) shows the prefabricated construction process of the house was as follows: (1) The prefabricated ground floors were fixed by metal fastener in line with the defined house plan (step 1). (2) The prefabricated walls were lifted onto the ground floor by crane and bolted together (step 2). (3) The prefabricated floors and walls of the first floor were lifted onto the ground wall and bolted together (step 3∼4). (4) The prefabricated roofs were installed on external walls of the first floor (step 5∼6). The process of prefabricated construction (a); components of wall structure and cladding panel (b).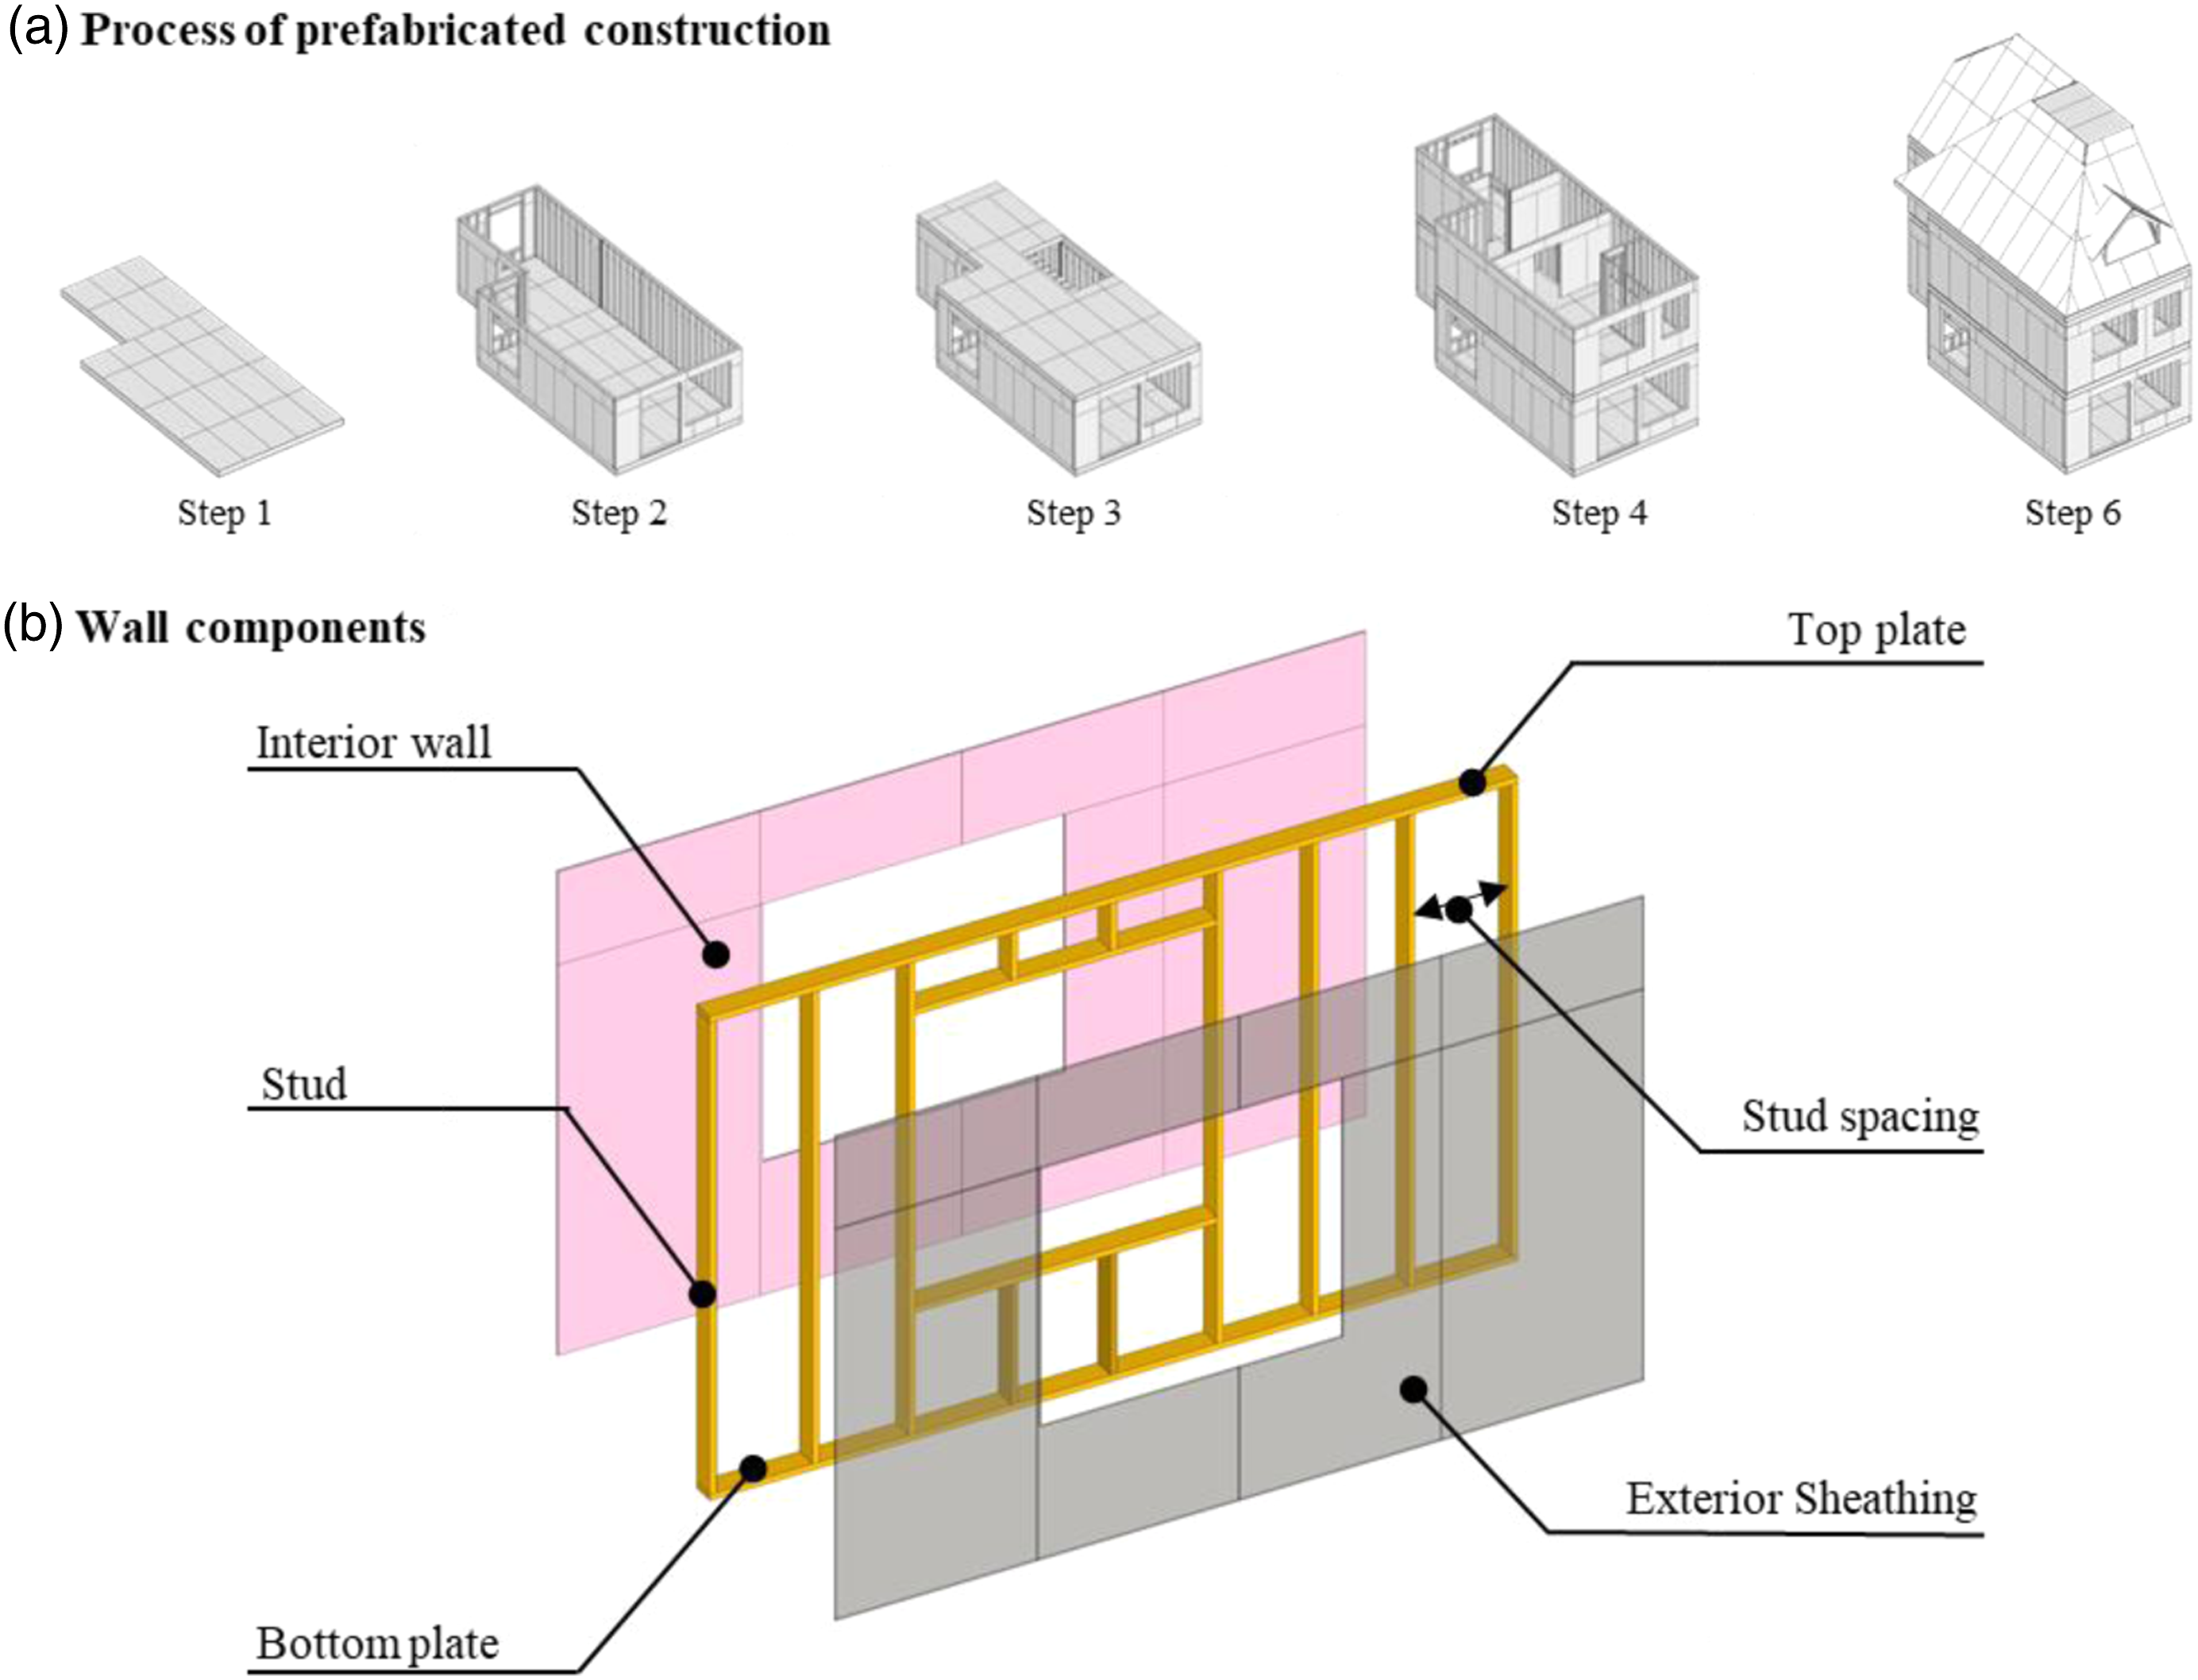
As given in Figure 2(b), key components of the prefabricated wall can be divided into two types: frame structure and cladding panel. The frame structure included top plate (horizontal), bottom plate (horizontal), and studs (vertical). The studs were arranged with a specific spacing (the centre distance between two adjacent studs) and connected to top and bottom plates using nails. The cladding panel was composed of internal wall and exterior sheathing wall. The unit cladding panel applied in this prefabricated wall had a standard dimension of 1220 × 2440 × 15 mm, which was defined by the manufacturers. During the construction of this house, the standard cladding panels can be connected or cut to fit the designed dimensions of various walls. In addition, the cladding butt joints should be spliced on the stud and be staggered. The cavity between interior wall and exterior sheathing was filled with the insulation materials. 27
The material of the wall structure (stud and plate) was Spruce-Pine-Fir (SPF), which is a typical commercial softwood product made in Canada and is widely used as a structural material in current Chinese timber houses. 27 In this study, three section dimensions of each structure component were applied as: 40 × 90 mm, 40 × 140 mm, and 40 × 235 mm. For the cladding panels, the sheathing wall was constructed using plywood, while the interior wall was made of gypsum board (GB). The prefabricated floors and roofs in this house had the same structure and materials as the walls.
Building parameters studied
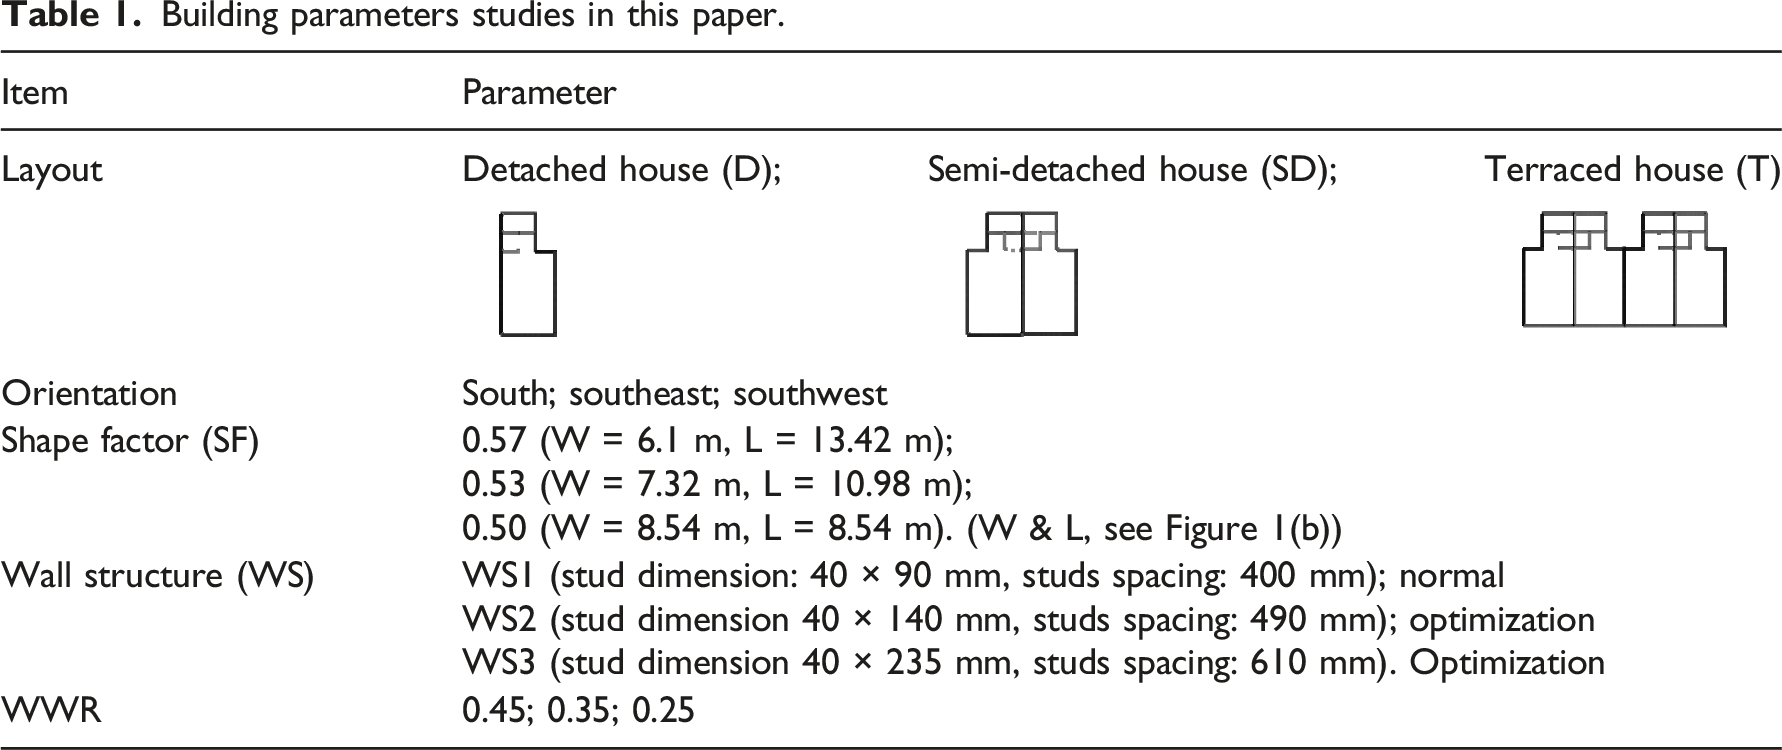
Five key building parameters of this timber house were studied (as shown in Table 1): • Layout: a detached house (one unit), a semi-detached house (two units), and terraced house (four units). The unit was the basic house model presented in Figure 1(b). • Orientation: South (S), Southeast (SE), Southwest (SW). This was defined along the axial direction of length, as marked by the red dash line in Figure 1(b). • Shape Factor (SF): three sizes of the basic house model were studied in terms of width (W) and length (L) (see Figure 1(b)). These dimensions were defined in accordance with the prefabricated timber construction requirements, i.e., to be in line with the standard cladding dimensions (1220 × 2440 mm) to achieve the minimum material waste.
27
The plan size was also defined to meet the requirements of structure safety and zone function.27,30 Given a fixed volume of the basic house model (479.26 m3), three various SF values applied were 0.50, 0.53, and 0.57. • Wall Structure (WS): three wall structures were used in terms of wall thicknesses and studs spacings, which were defined according to the requirements of structural safety and cladding dimension.27,30 • WWR (window-to-wall ratio): three ratios were studied - 0.45 (large), 0.35 (medium), and 0.25 (small). According to the requirements of energy performance and timber structure construction technology,27,31 the windows were only set at north and south facades of these houses (Figure 1). Building parameters studies in this paper.
Future climate change
The impact of future climate change was also assessed through the comparison of three scenarios: current (2020), future year (2050), and future year (2080). The future weather data were achieved through the MORPHING method
32
and the weather data generator software Meteonorm (https://meteonorm.com). Figure 3 shows the variations of monthly average temperature and solar radiation for current and future climate scenarios (2020, 2050, 2080) in Tianjin. For each climate scenario, the warmest period is found from June to August while the solar radiation may peak in May. December and January can see the lowest values of temperature and solar radiation. The annual average temperature would increase by 2.3°C over the period from 2020 to 2080 due to the increasing trend of global warming. The average winter temperature will warm from −2.7°C in 2020 to 0.4°C in 2080, whilst a rise can be found in average summer temperature from 26.8°C to 28.9°C during the same period. However, there would be no big change of solar radiation in the period from 2020 to 2080. Monthly average temperature and solar radiation in current and future climate scenarios (2020, 2050, 2080) in Tianjin.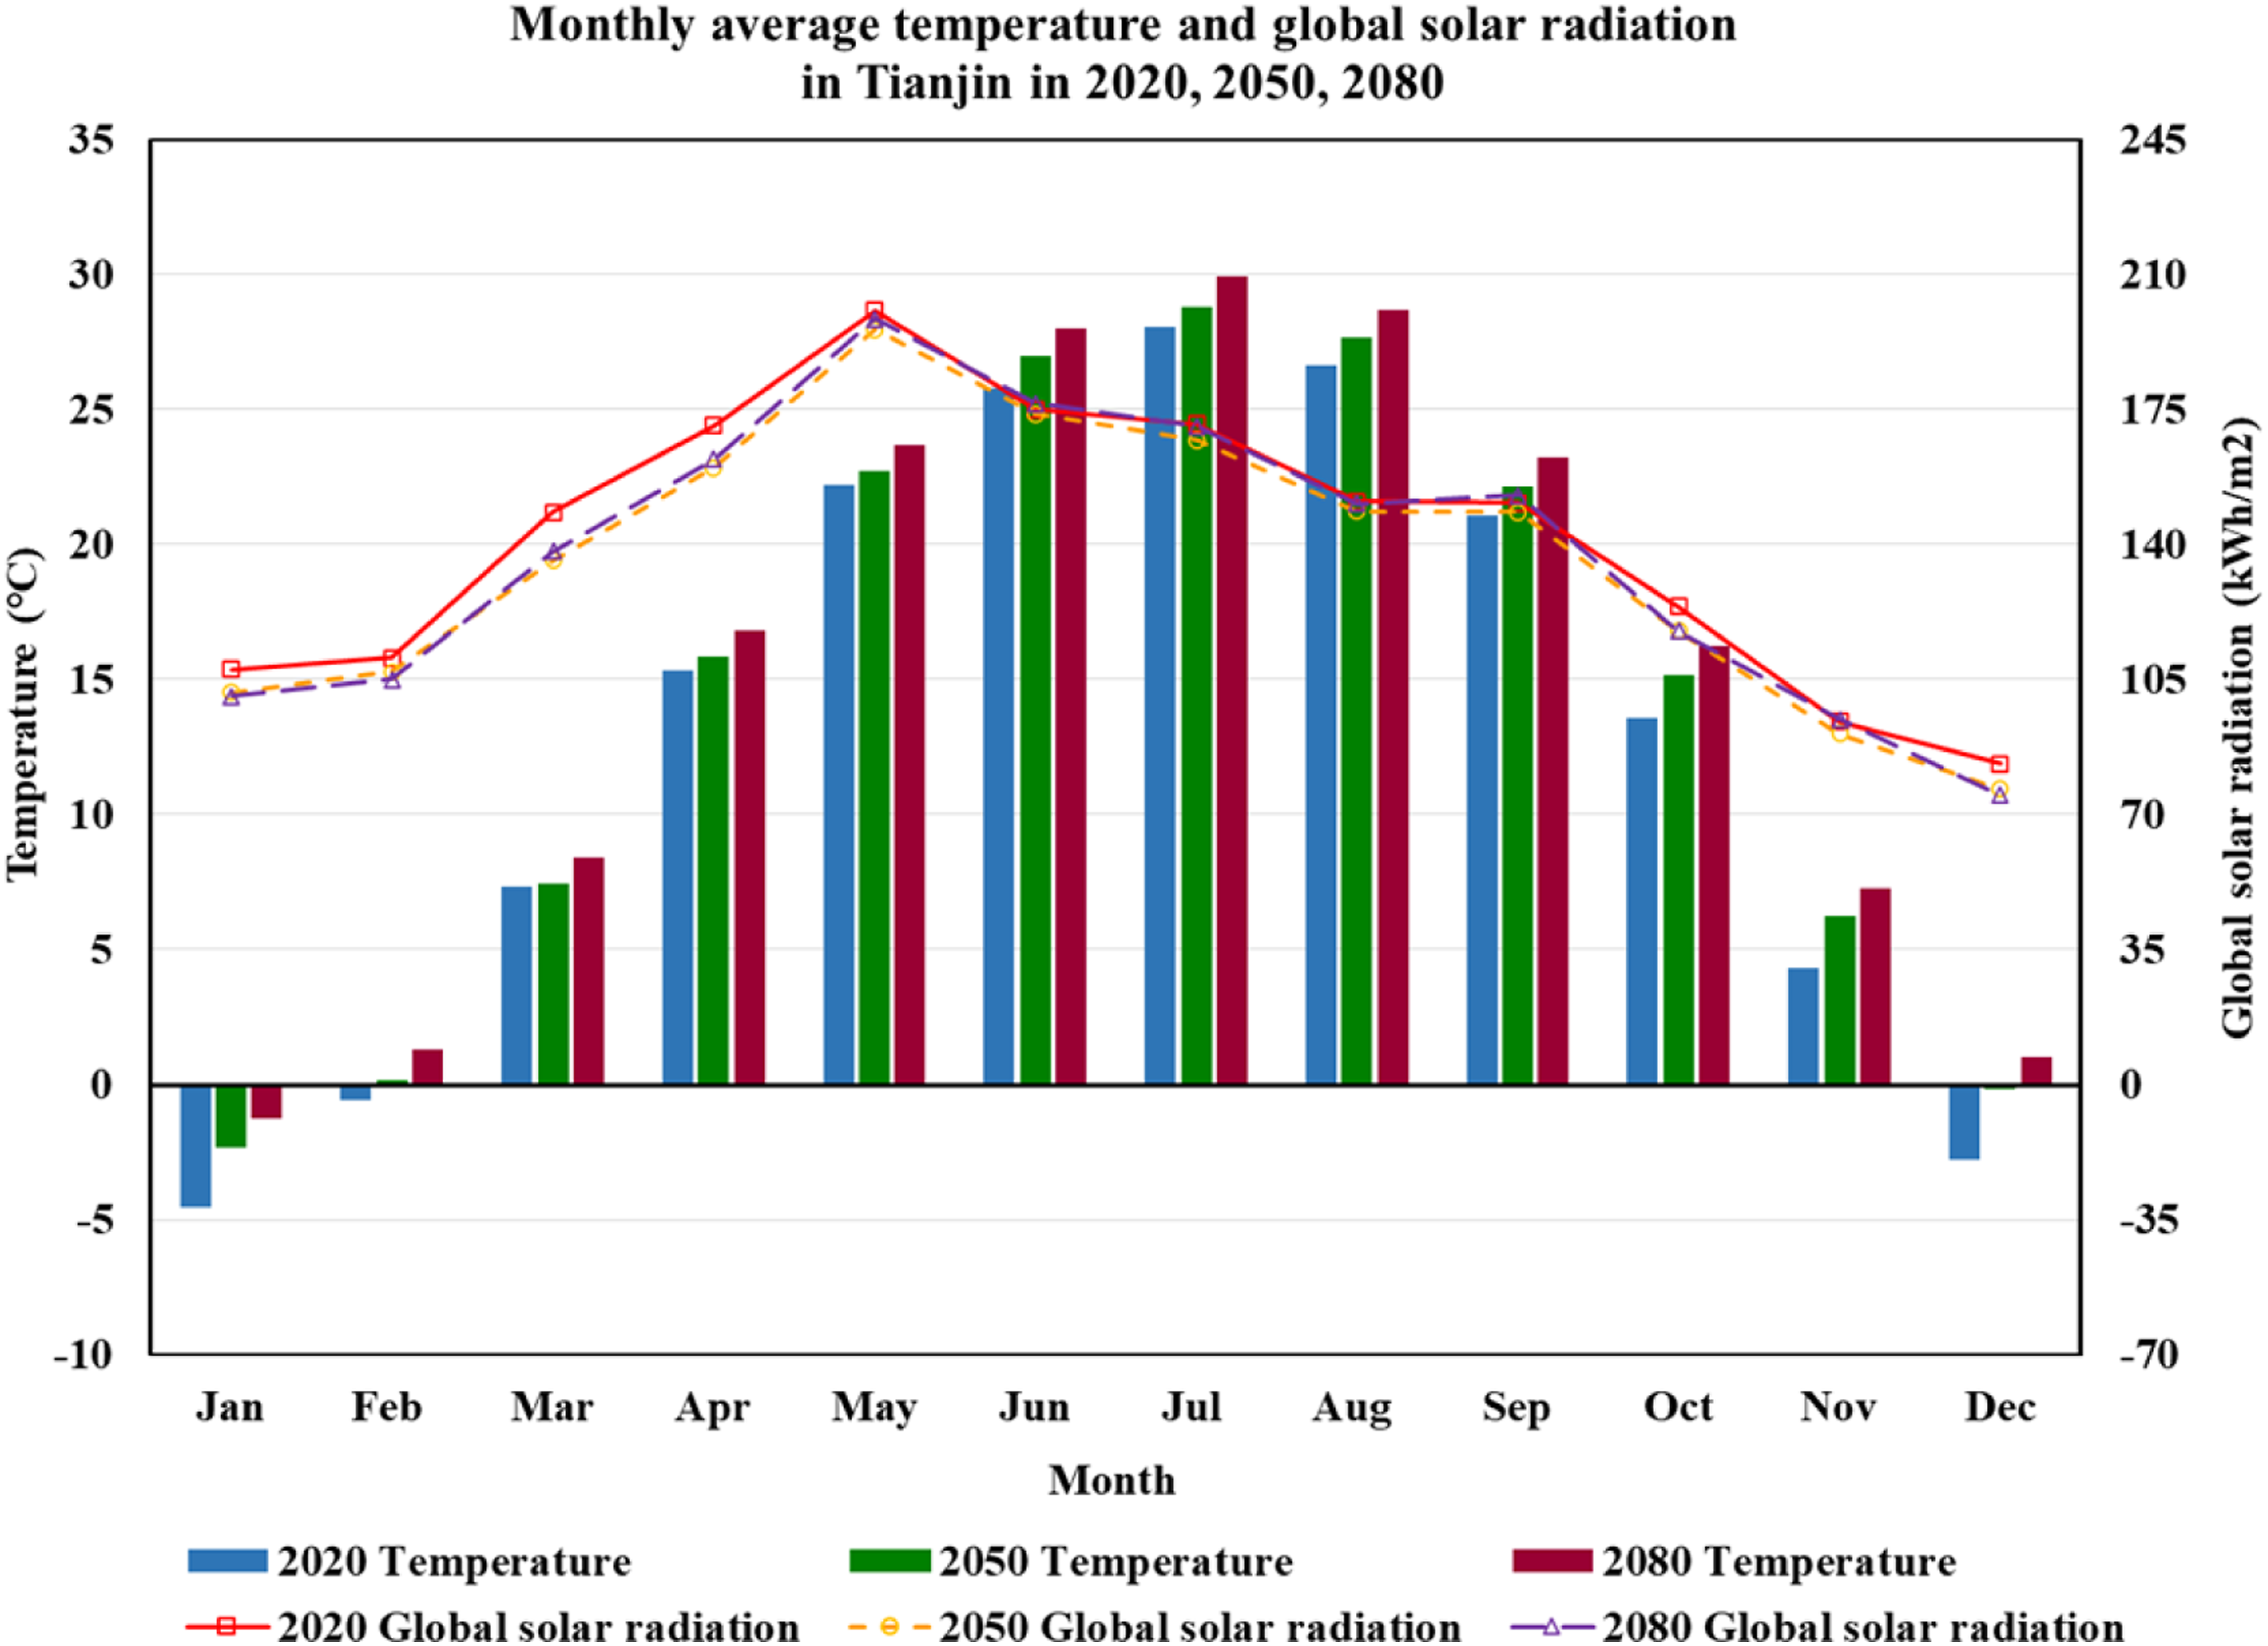
Simulation: energy consumption and operational carbon emissions
In this study, annual primary energy demands (heating and cooling) and operational carbon emissions in the house have been simulated using the dynamic thermal simulation software DesignBuilder (+EnergyPlus 33 ) (https://designbuilder.co.uk), taking into account current and future climate scenarios.
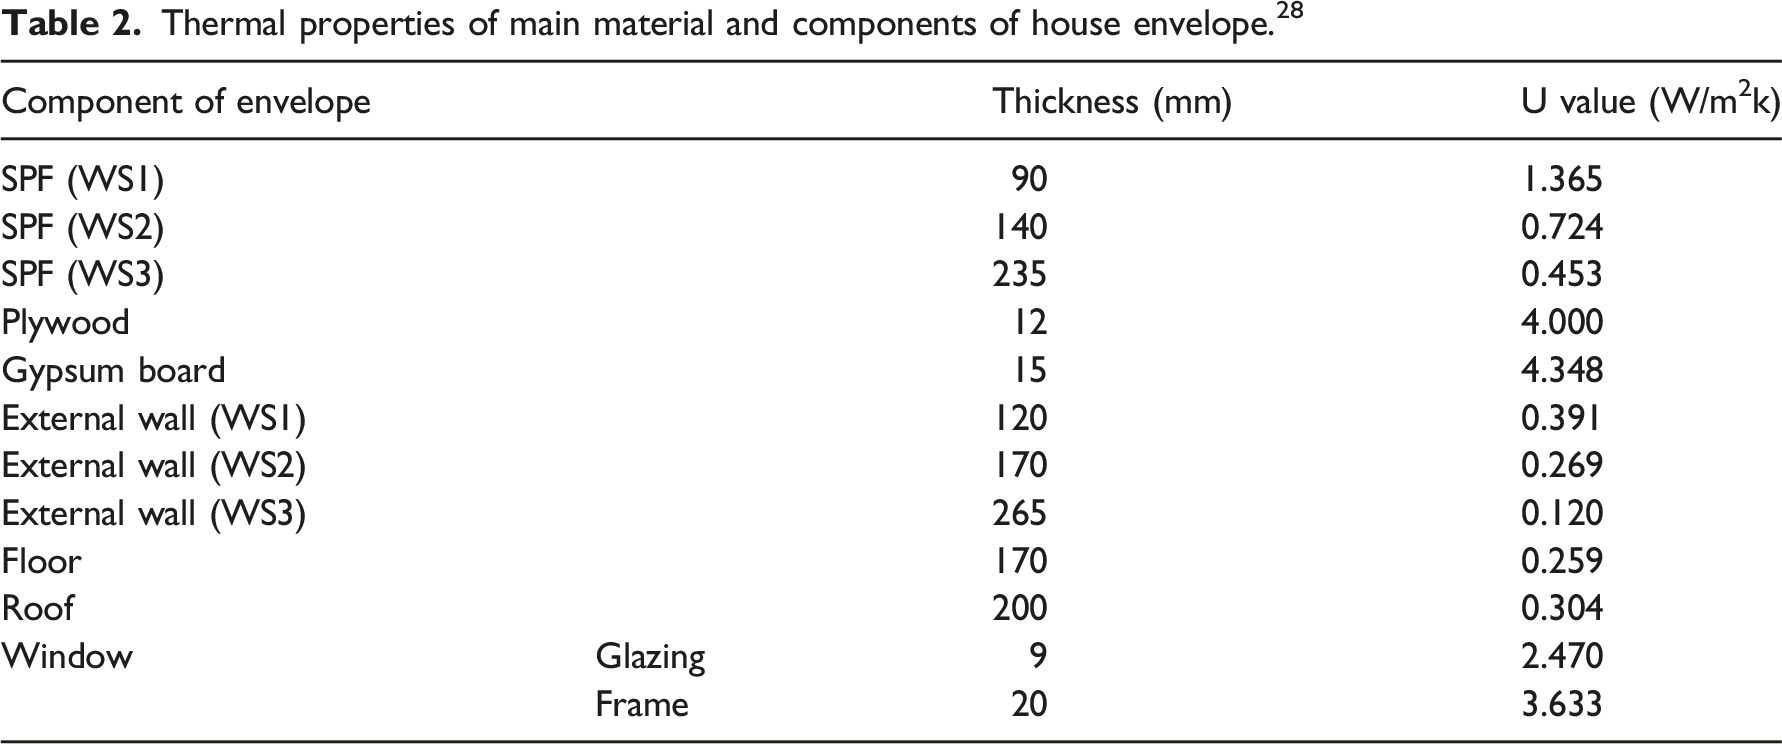
Thermal properties of main material and components of house envelope. 28
In addition, the setpoints of heating and cooling were 18°C and 26°C, respectively. 34 The internal gain was set as 2 W/m2 while the infiltration rate was adopted at 1.5 ach@50pa.34,35 For these simulations, natural gas was used for providing heating while electricity was used for cooling and lighting systems. In China, the CO2 emissions factors of natural gas and electricity are 0.202 kg/kWh and 0.878 kg/kWh respectively, 36 which were applied in the analysis of annual carbon emissions in this study.
Algorithm of embodied carbon
In this study, the embodied carbon analysis focused on three construction materials including SPF, plywood and gypsum panel, which were the main materials of timber structures of this house (wall, floor, and roof).
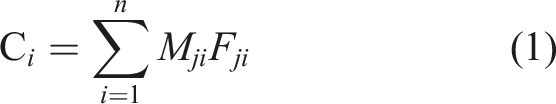
Declared unit: 1 m3 of SPF; 1 m2 of 12 mm-thick plywood panel; 1 m2 of 15 mm-thick gypsum panel. Transport distance: 500 km.
The carbon factor refers to CO2 emission value per unit of the product and service of building and is expressed as kg CO2 eq/declared unit. Its value is adopted from Environmental Product Declaration (EPD) reports of products/materials. Based on standards (EN 15804, EN 15978 and ISO 14044), the EPD reports can provide quantified information of environmental impacts and aspects for products and services for use in the assessment of the environmental performance of a building.38–40 In EPD reports used in this study, the declared units are 1 m3 (SPF timber), 1 m2 (12mm-thick Plywood), and 1 m2 (15mm-thick gypsum board).41,42 With the aim to analyse embodied carbon in this study, the system boundary of the life cycle analysis includes: • Product stage: raw material extraction and processing, processing of secondary material input (module A1); transport to the manufacturer (module A2); manufacturing (module A3). • Construction process stage: transport to the building site (module A4); installation into the building (module A5). • End-of-life stage: de-construction, demolition (module C1); transport to waste processing (module C2); waste processing for reuse, recovery and/or recycling (module C3); disposal (module C4).
Results
Effect of layout on heating and cooling demands
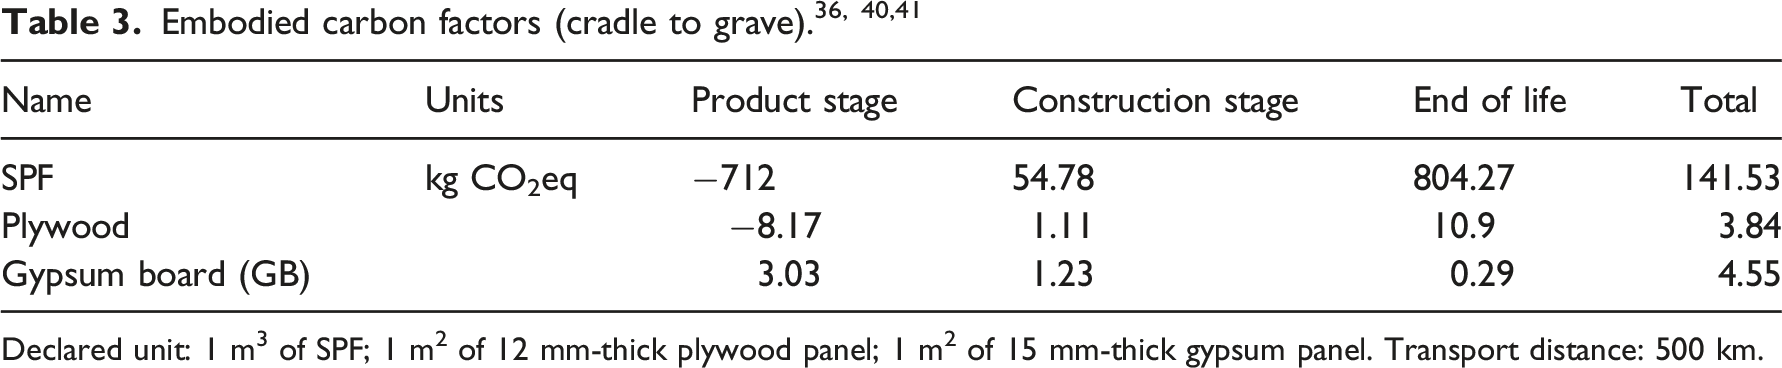
Figure 4 presents the effects of house layout on the annual primary energy demand (heating and cooling) with various climate scenarios (model: south-facing, SF = 0.57, WS2, WWR = 0.45). The future climate can take effect on the primary energy demand. The primary energy demands in three houses are predicted to increase substantially from 2020 to 2080, with growth rates as 6% (detached), 10% (semi-detached), 13% (terraced). In this period, there will be decreases in heating demand (D: 21%, SD: 23%, T: 24%), while big increases will be found in cooling demand (D:33%, SD:33%, T:34%). For current year (2020), the three houses have the primary energy demands as 63.81 kWh/m2 (D), 50.43 kWh/m2 (SD) and 44.31 kWh/m2 (T). However, these values will tend to become 66.55 kWh/m2 (D), 54.10 kWh/m2 (SD), 48.27 kWh/m2 (T) in 2050, and 67.68 kWh/m2 (D), 55.62 kWh/m2 (SD), and 50.11kWh/m2 (T) in 2080. Annual energy demand with climate scenarios and various house layouts: (a) detached, (b) semi-detached, (c) terraced. (Model: South-facing, SF = 0.57, WS2, WWR = 0.45).
Peak energy demand (hourly) varying in house layout and climate scenario.
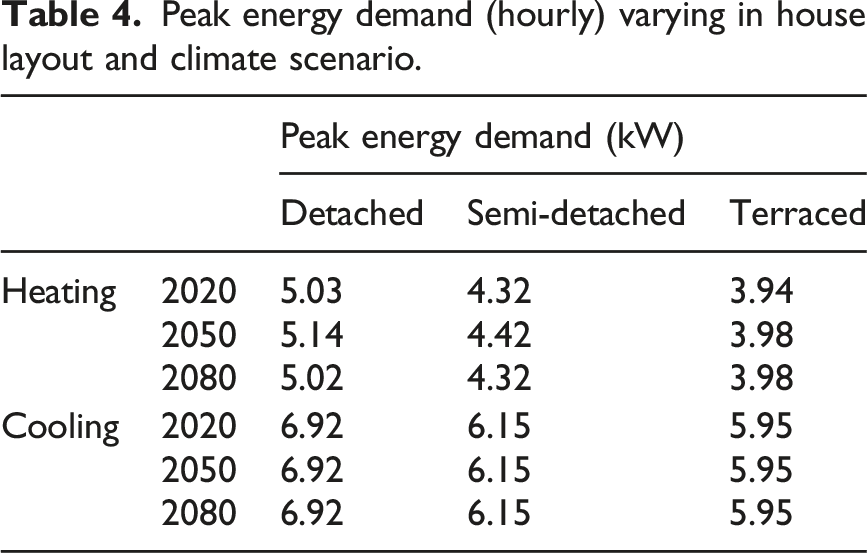
Apparently, compared with detached and semi-detached houses, the terraced house has the smallest envelope area, indicating the lowest impact of external environmental on the indoor climate. This can explain that the terrace house will deliver the lowest energy demand (heating and cooling) for current and future climate scenarios.
Effect of orientation on heating and cooling demands
Figure 5 shows the effects of orientation on the annual primary energy demand with various climate scenarios in the house (model: semi-detached, SF = 0.57, WS2, WWR = 0.45). For three orientations, the increase can be found in both primary energy demand and cooling demand from 2020 to 2080, while the heating demand tends to decrease. The increases in cooling demand of the three orientations from 2020 to 2080 are 34% (S), 29% (SW), 31% (SE), whilst the reduction in heating demand is around 23% for each orientation. For each climate scenario, the primary energy demands of SE and SW are similar, including 59.16 kWh/m2 (SE, 2020), 59.82 kWh/m2 (SW, 2020), 62.56 kWh/m2 (SE, 2050), 62.8 kWh/m2 (SW, 2050), 64.35 kWh/m2 (SE, 2080), and 64.34 kWh/m2 (SW, 2080). The south orientation can achieve the lowest primary energy demands (50.43 kWh/m2 (2020), 54.10 kWh/m2 (2050), and 55.62 kWh/m2 (2080)). Annual energy demand with climate scenarios and various orientations: (a) South; (b) southeast; (c) Southwest. (Model: Semi-detached, SF = 0.57, WS2, WWR = 0.45).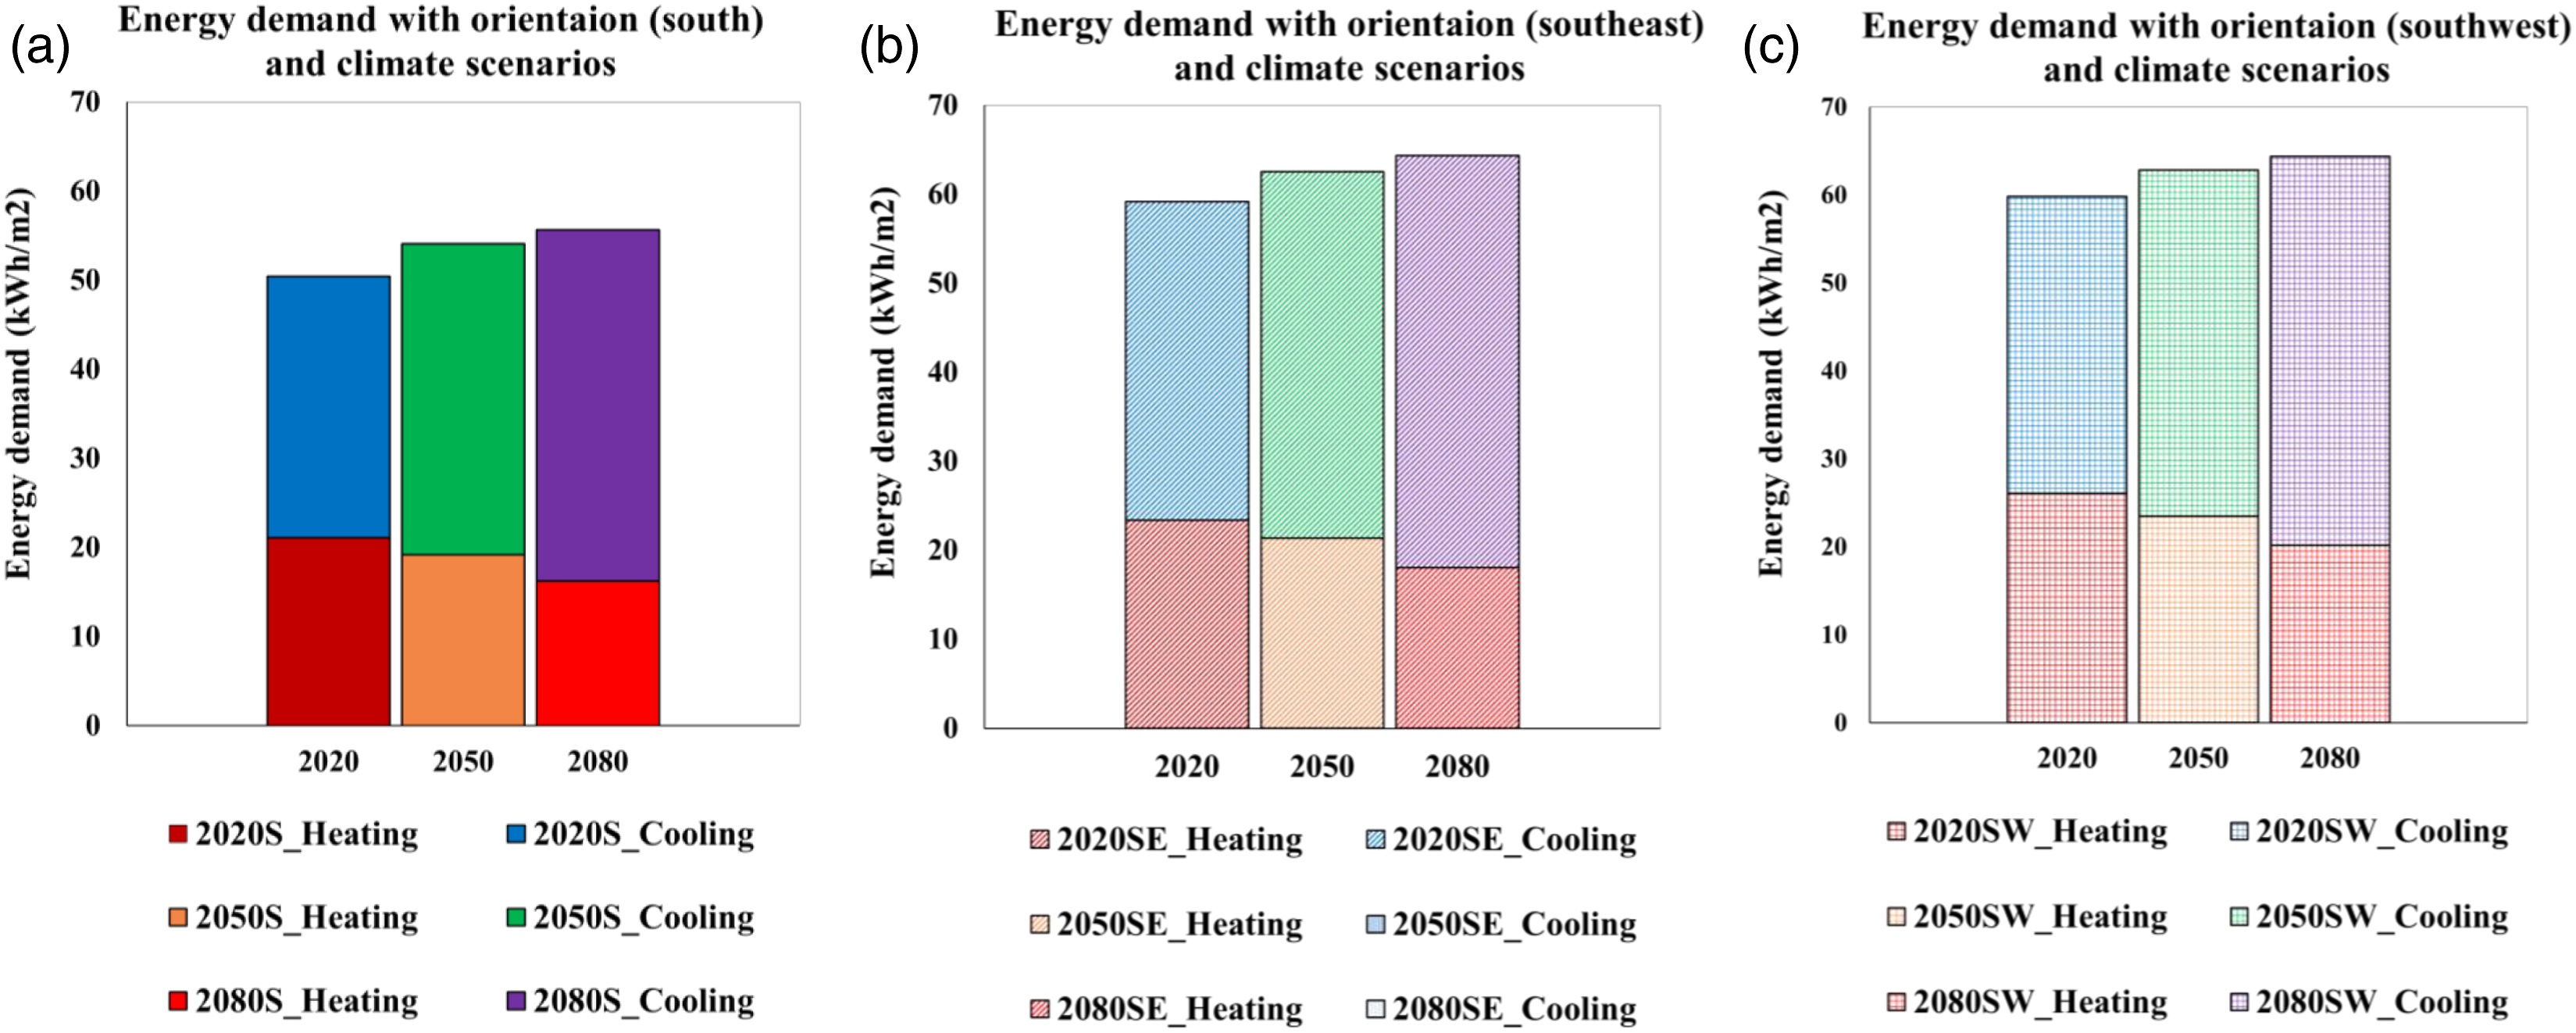
Peak energy demand (hourly) varying in orientation and climate scenario.
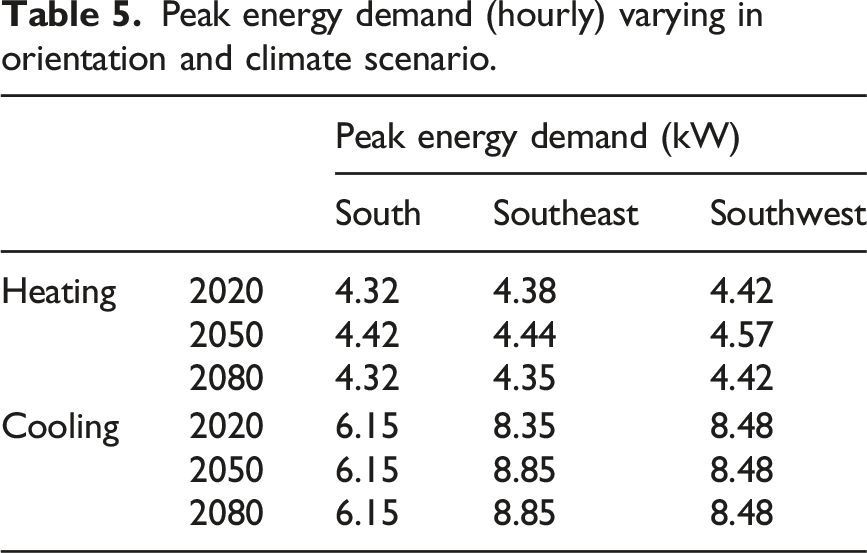
For the same WWR and shape factor, the semi-detached house can benefit from the south facing orientation in that the indoor space will receive the higher solar gain in heating season and the lower solar gain in cooling season. This could explain that there will be the least primary energy demand with the south facing orientation.
Effect of shape factor on heating and cooling demands
Figure 6 indicates the impact of climate change and shape factor on the annual primary energy demand in the house (model: semi-detached, south-facing, WS2, WWR = 0.45). For each shape factor, both primary energy and cooling demands will go up from 2020 to 2080, while the heating demands will decrease. Taking the year of 2020 as the reference, relative differences of primary energy, cooling, and heating demands in 2080 of each shape factor will be around 10%, 34%, and −23%, respectively. In addition, decreasing shape factor will not significantly reduce all energy demands. Taking model (SF = 0.57) as the reference, models (SF = 0.53 and SF = 0.5) will achieve reduction in primary energy demand as 2.57% (SF = 0.50, 2020), 1.18% (SF = 0.53, 2020); 2.57% (SF = 0.50, 2050), 1.27% (SF = 0.53, 2050); 2.57% (SF = 0.50, 2080), and 1.3% (SF = 0.53, 2080). Annual energy demand with climate scenarios and various shape factors (SF): (a) SF = 0.57; (b) SF = 0.53; (C) SF = 0.50. (Model: Semi-detached, south-facing, WS2, WWR = 0.45).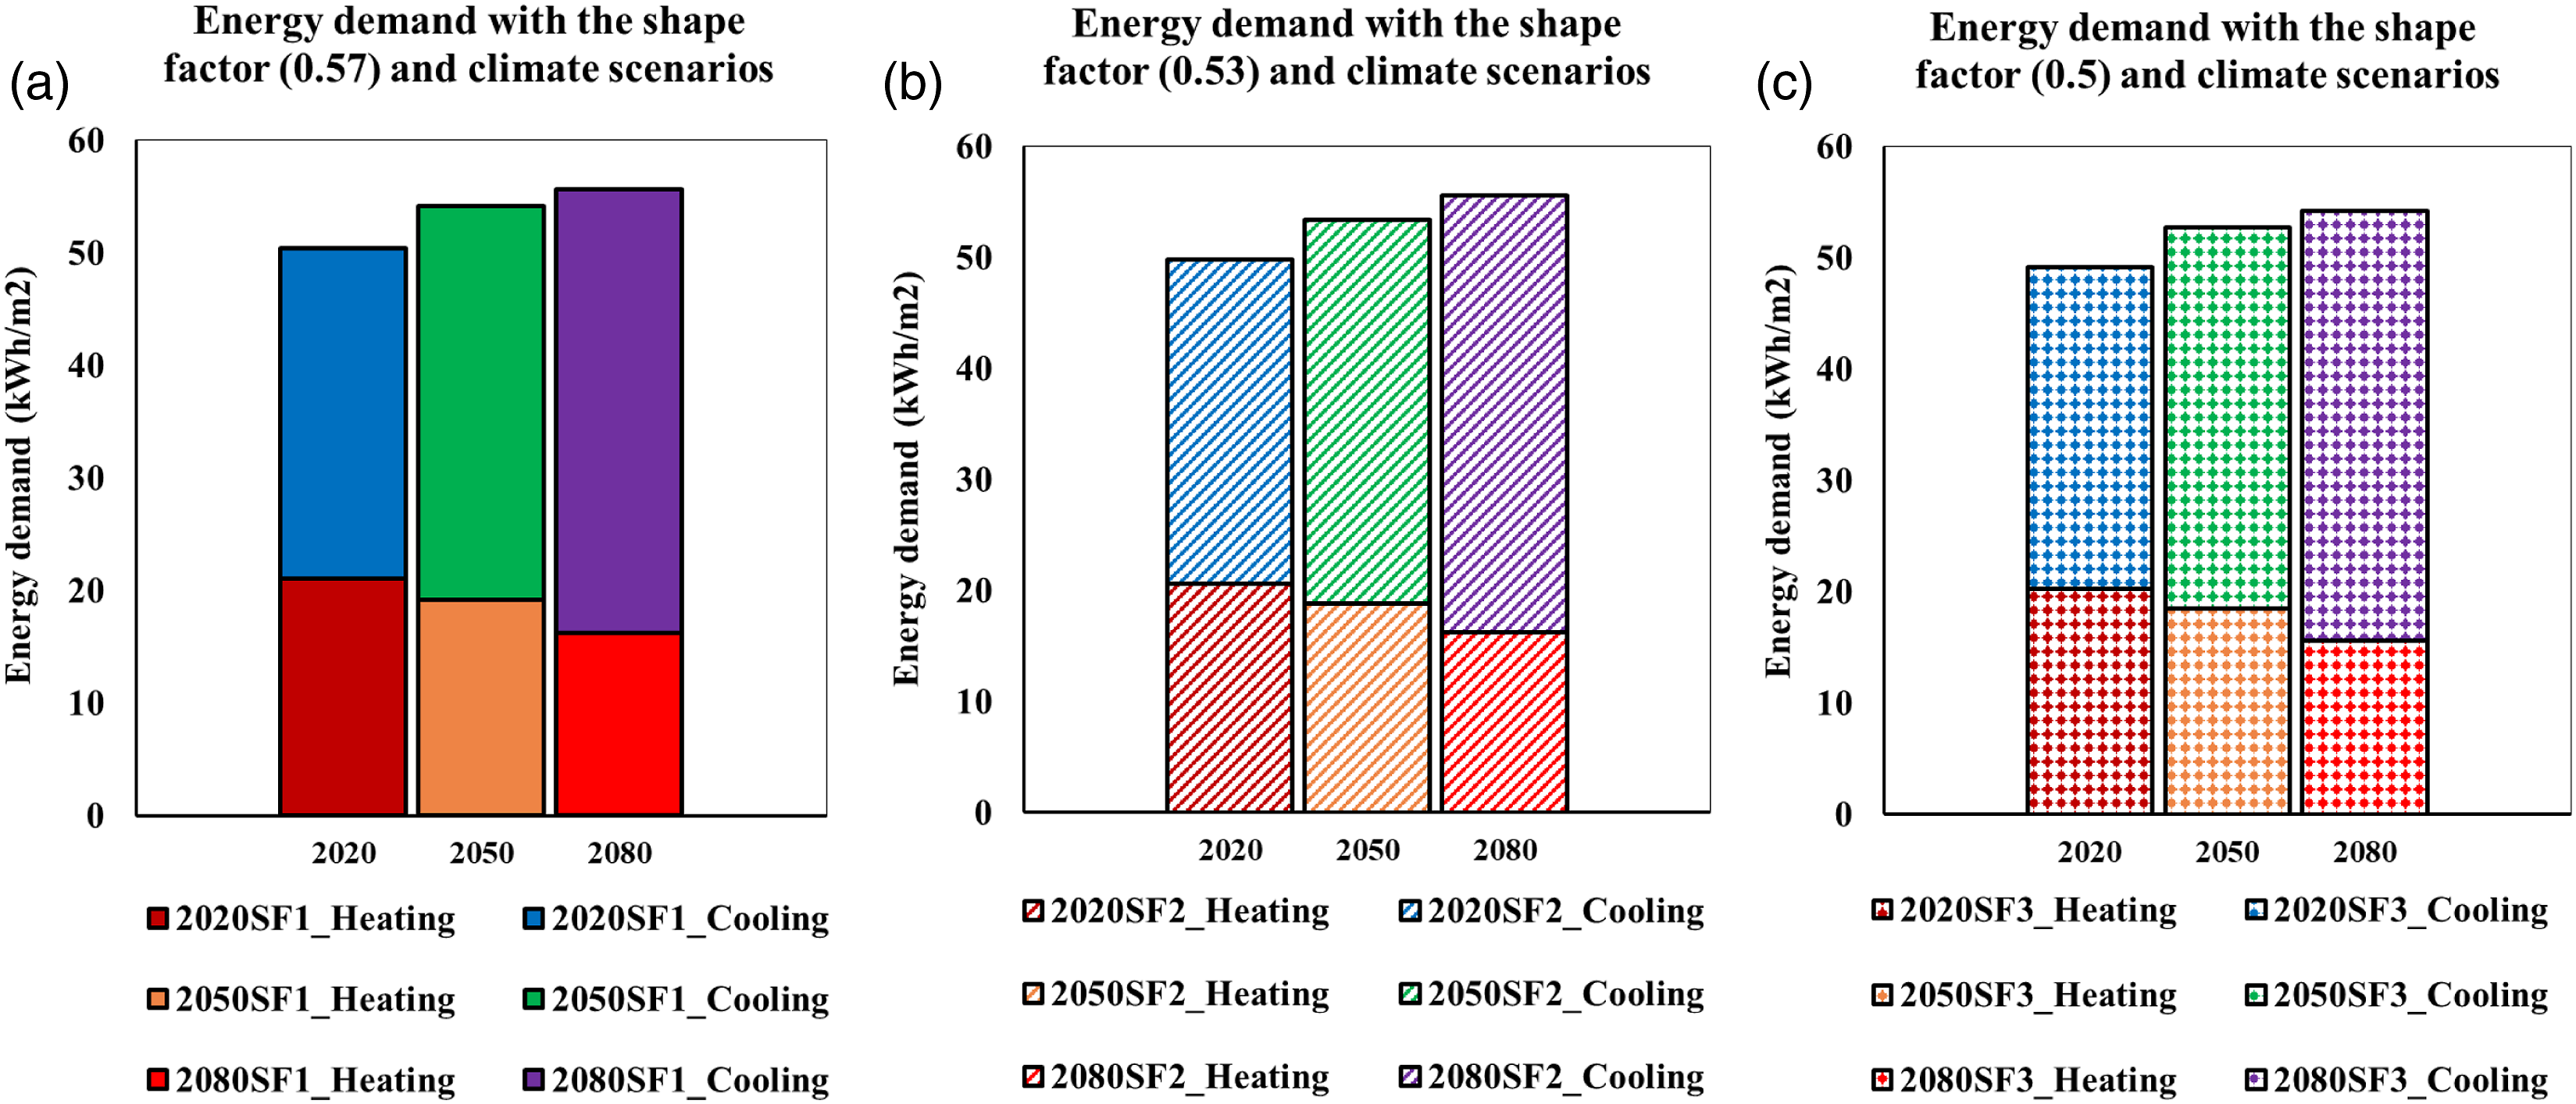
Peak energy demand (hourly) varying in shape factor and climate scenario.
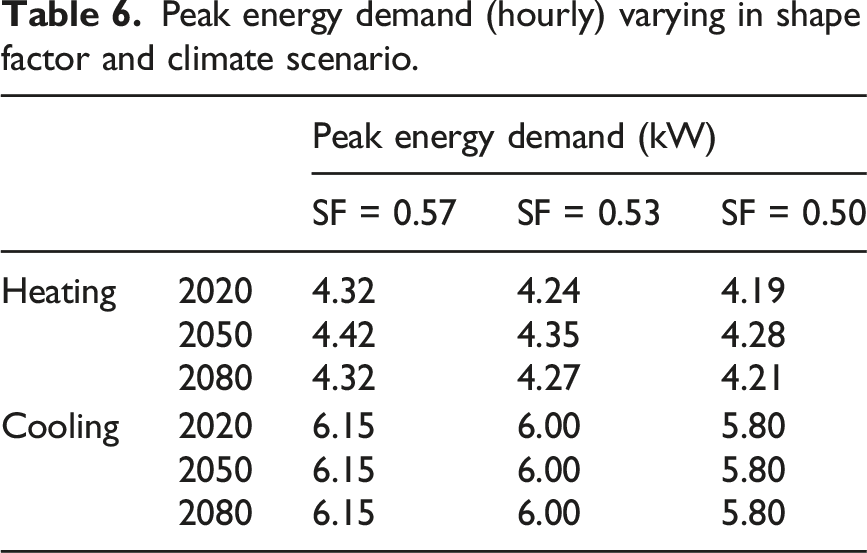
As mentioned in Methods, the setting of house dimensions will have to meet the requirements of prefabricated technology and structure safety. Thus, only a relatively small range of SF (0.5∼0.57) was applied. Combined with a well-insulted envelop, the energy performance of this house will not receive a clear impact of SF for current and future climates.
Effect of WWR on heating and cooling demands
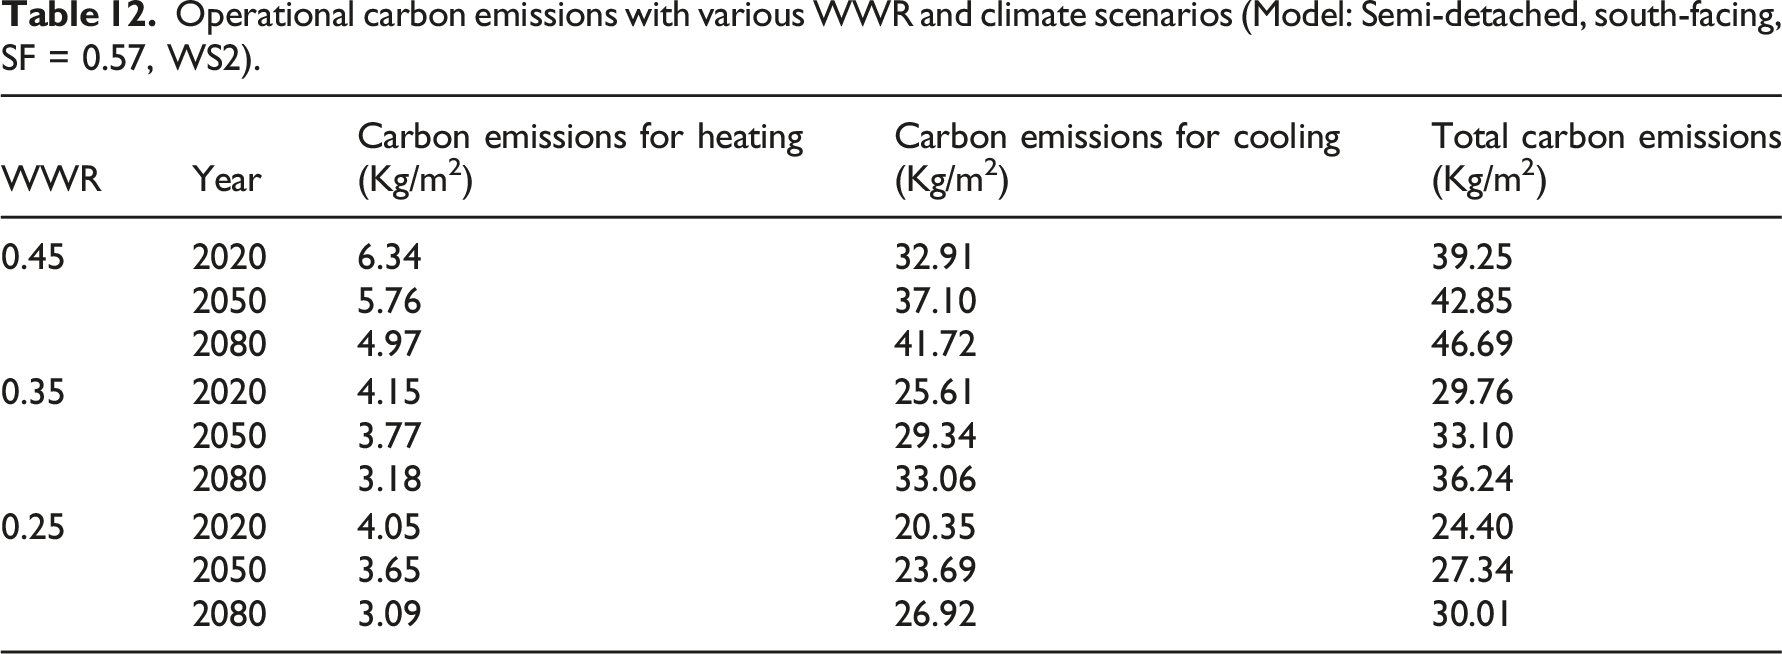
Figure 7 shows the variation of annual energy demands for different WWR and climate scenarios (model: semi-detached house, south-facing, SF = 0.57, WS2). From 2020 to 2080 the cooling demand is predicted to significantly increase with all WWR values (growth rates in 2080 > 34%), while a substantial decrease in heating demand can be found (reductions in 2080 > 23%). However, the primary energy demand over this period will still rise (7% < growth rate in 2080 < 11%). For each year, increasing WWR will clearly increase energy demands, especially in cooling and primary energy demands. In 2080, taking the lowest WWR (0.25) as the reference, other models will have relative differences of energy demands as 46.3% (WWR 0.45, cooling), 5.72% (WWR 0.45, heating), 31.57% (WWR 0.45, primary energy), 22.79% (WWR 0.35, cooling), 3.21% (WWR 0.35, heating), and 15.68% (WWR 0.35, primary energy). Annual energy demand with various climate scenarios and WWR: (a) 0.45; (b) 0.35; (c) 0.25. (Model: Semi-detached, south-facing, SF = 0.57, WS2).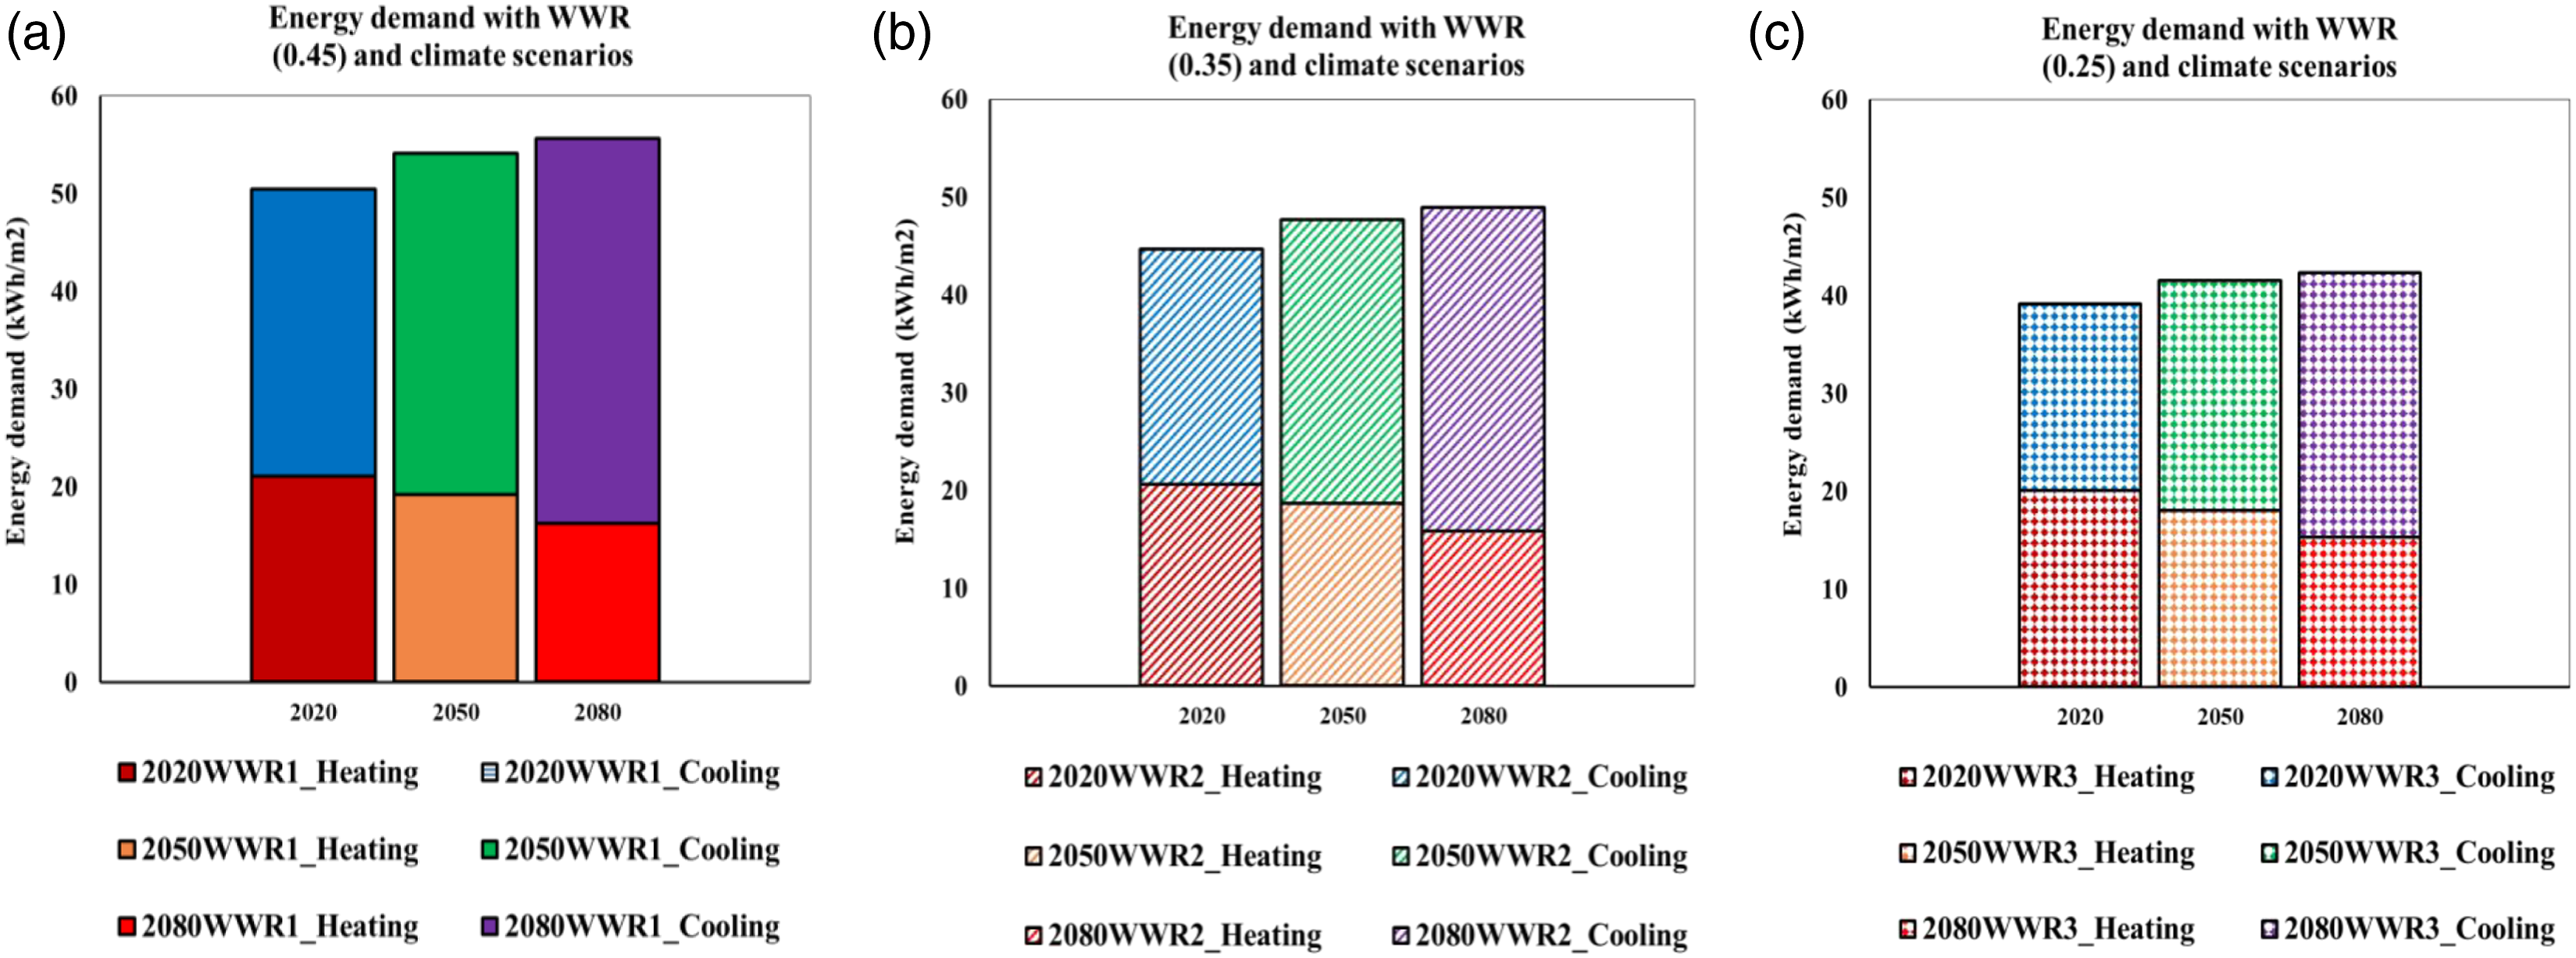
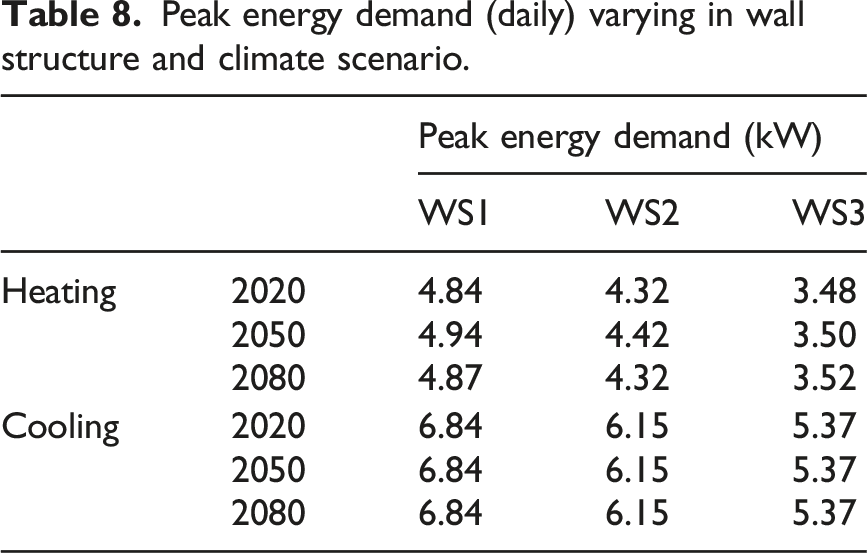
Peak energy demand (daily) varying in WWR and climate scenario.
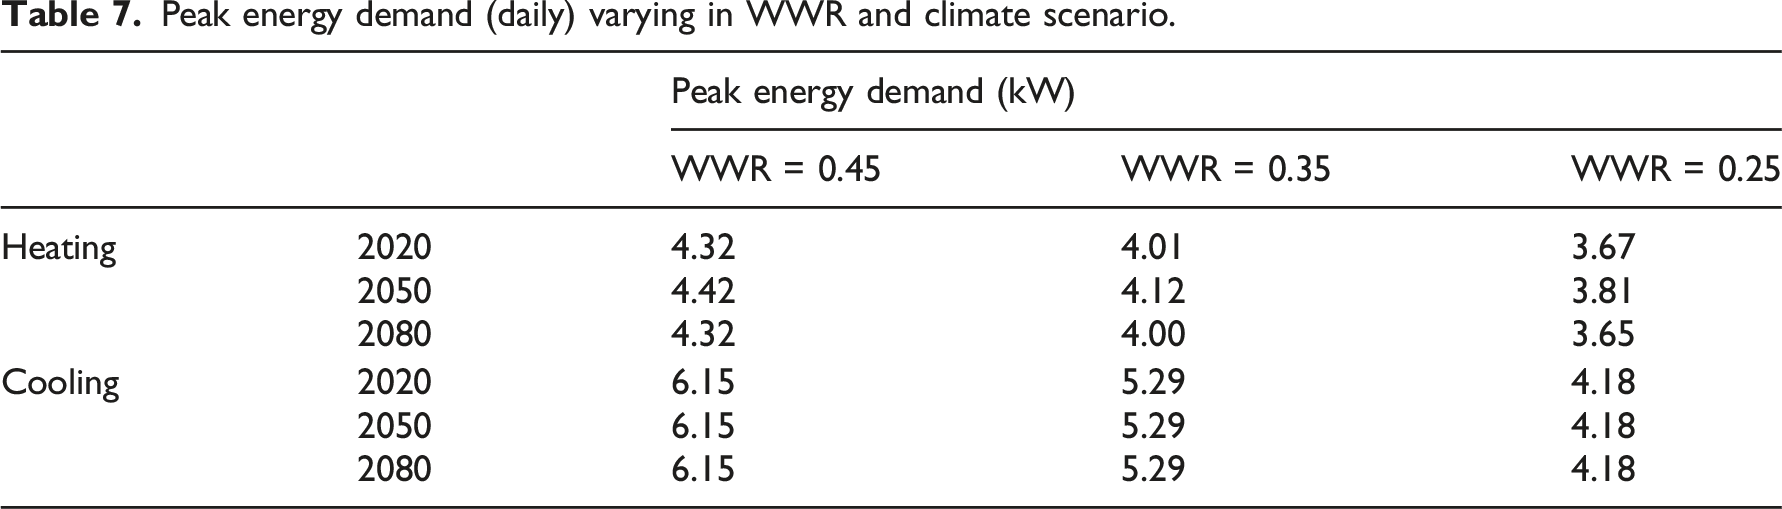
It is clear that the windows will deliver larger thermal transfer and receive higher solar gain than the well-insulated walls in this small timber house. The smaller window area will lead to a lower heating demand in winter and a lower cooling demand in summer.
Effect of wall structure on heating and cooling demands
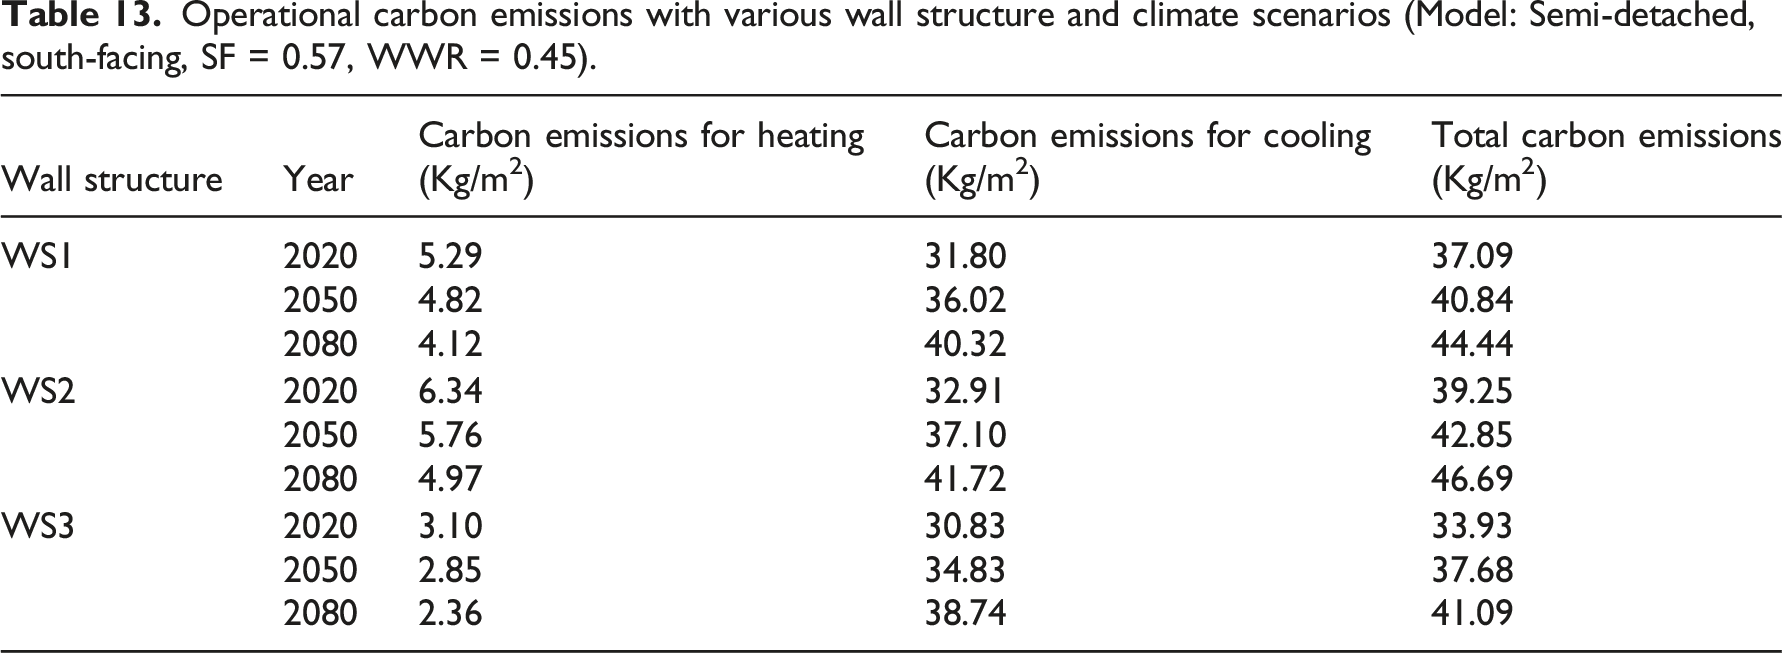
Figure 8 shows the effects of climate and wall structure on the annual primary energy demand in the house (model: semi-detached, south-facing, SF = 0.57, WWR = 0.45). Both primary energy and cooling demands in the three models will rise from 2020 to 2080, while a decrease can be seen in heating demand. Taking the year of 2020 as the reference, relative differences of energy demand in 2080 are 8.06% (WS1, primary energy), 10.30% (WS2, primary energy), 13.9% (WS3, primary energy), 34.21% (WS1, cooling demand), 34.25% (WS2, cooling demand), 34.87% (WS3, cooling demand), −22.11% (WS1, heating demand), −23.04% (WS2, heating demand), and −24.28% (WS3, heating demand). In 2020, compared with WS1, energy demands of WS2 & WS3 will significantly decrease by 11.28% (WS2, primary energy), 3.61% (WS2, cooling), 20.12% (WS2, heating), 22.86% (WS3, primary energy), 7.05% (WS3, cooling), and 41.10% (WS3, heating). Similar trends can be found for both 2050 and 2080. Annual energy demand with various climate scenarios and wall structures: (a) WS1; (b) WS2; (c) WS3. (Model: Semi-detached, south-facing, SF = 0.57, WS2).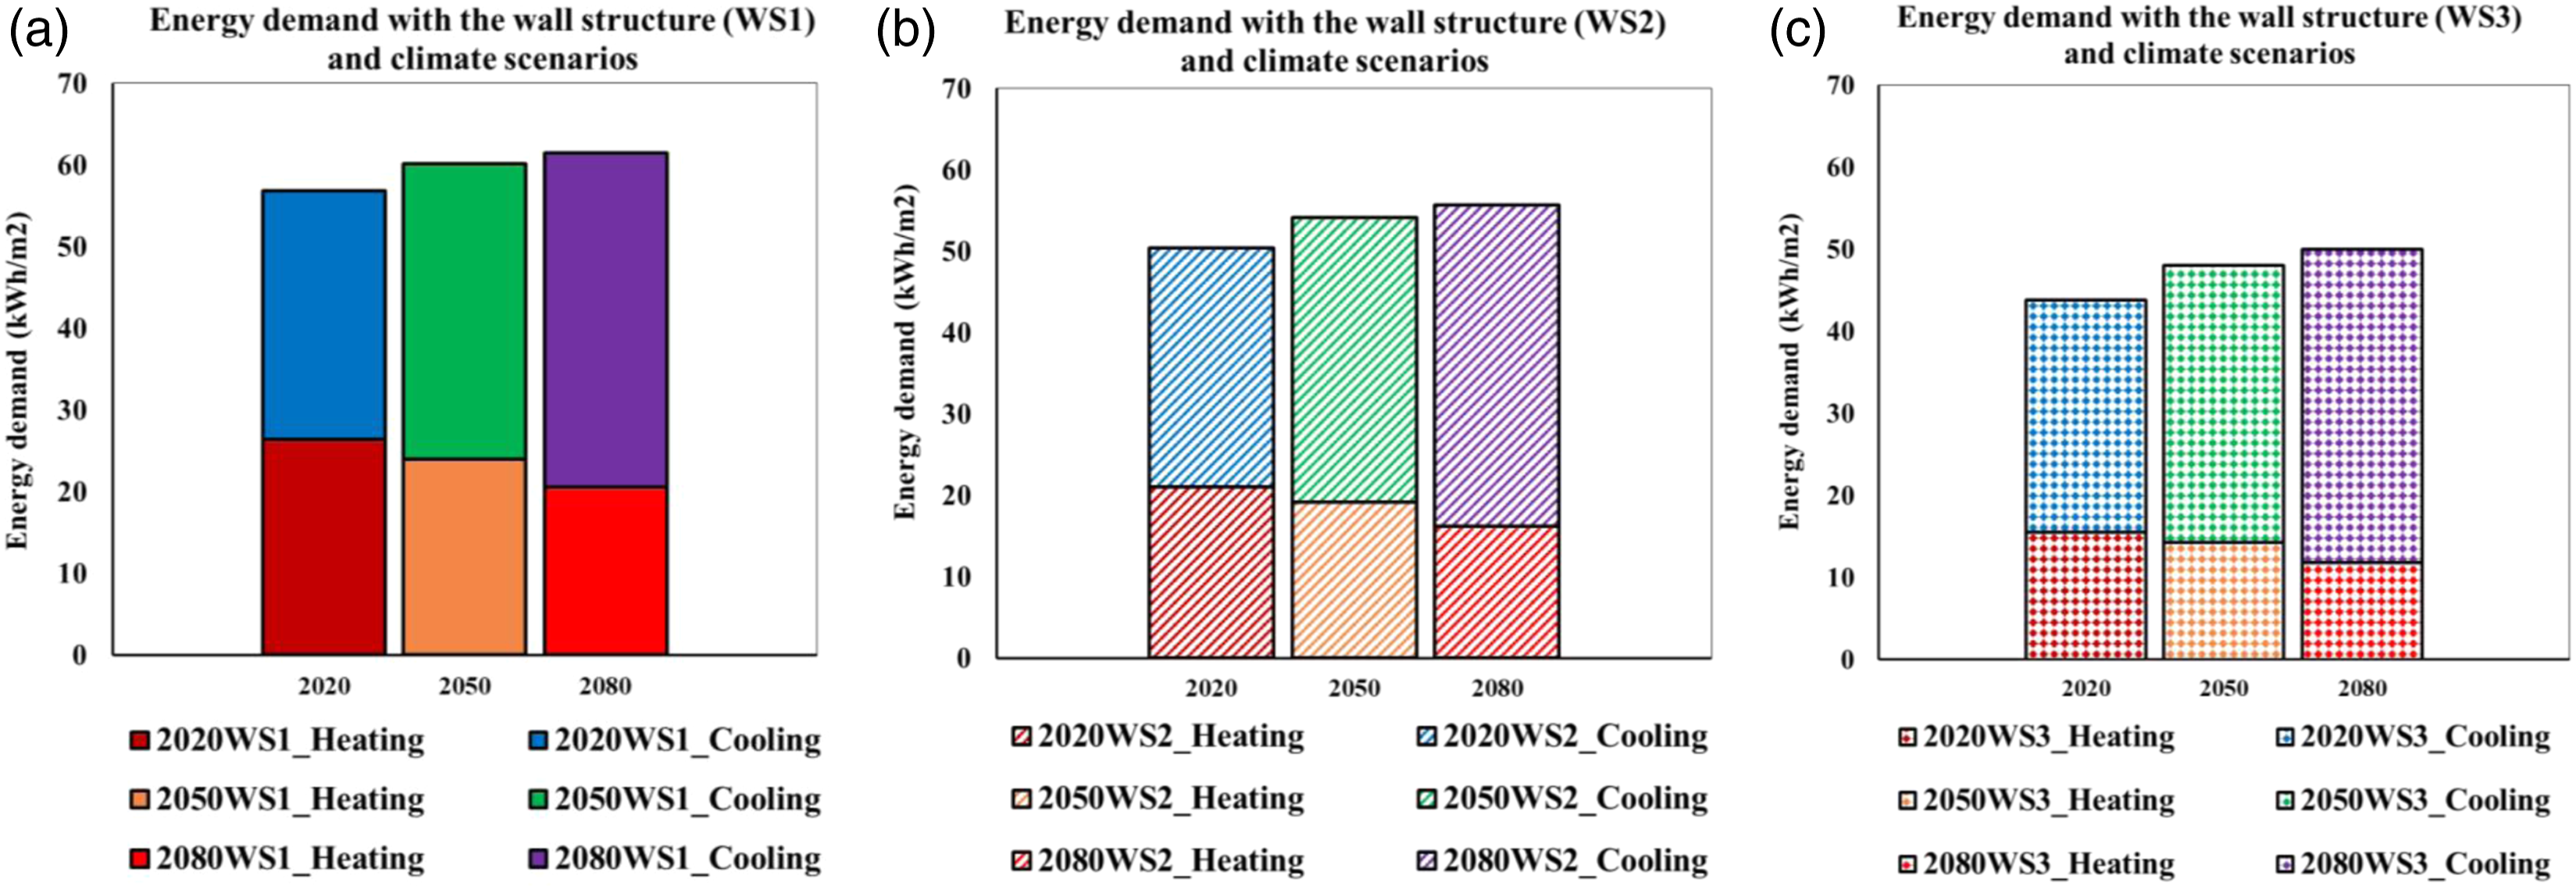
Peak energy demand (daily) varying in wall structure and climate scenario.
According to the wall configuration and thermal properties in Table 2, the thicker wall will have a better thermal insulation performance. Therefore, compared with other models (WS1, WS2), the house applied with the wall (WS3) can achieve the lowest energy demand, especially for the heating energy.
Annual operational carbon emissions: Five building parameters
This section presents effects of five building characteristics (layout, orientation, shape factor, WWR, and wall structure) on annal operational carbon emissions with three climate scenarios.
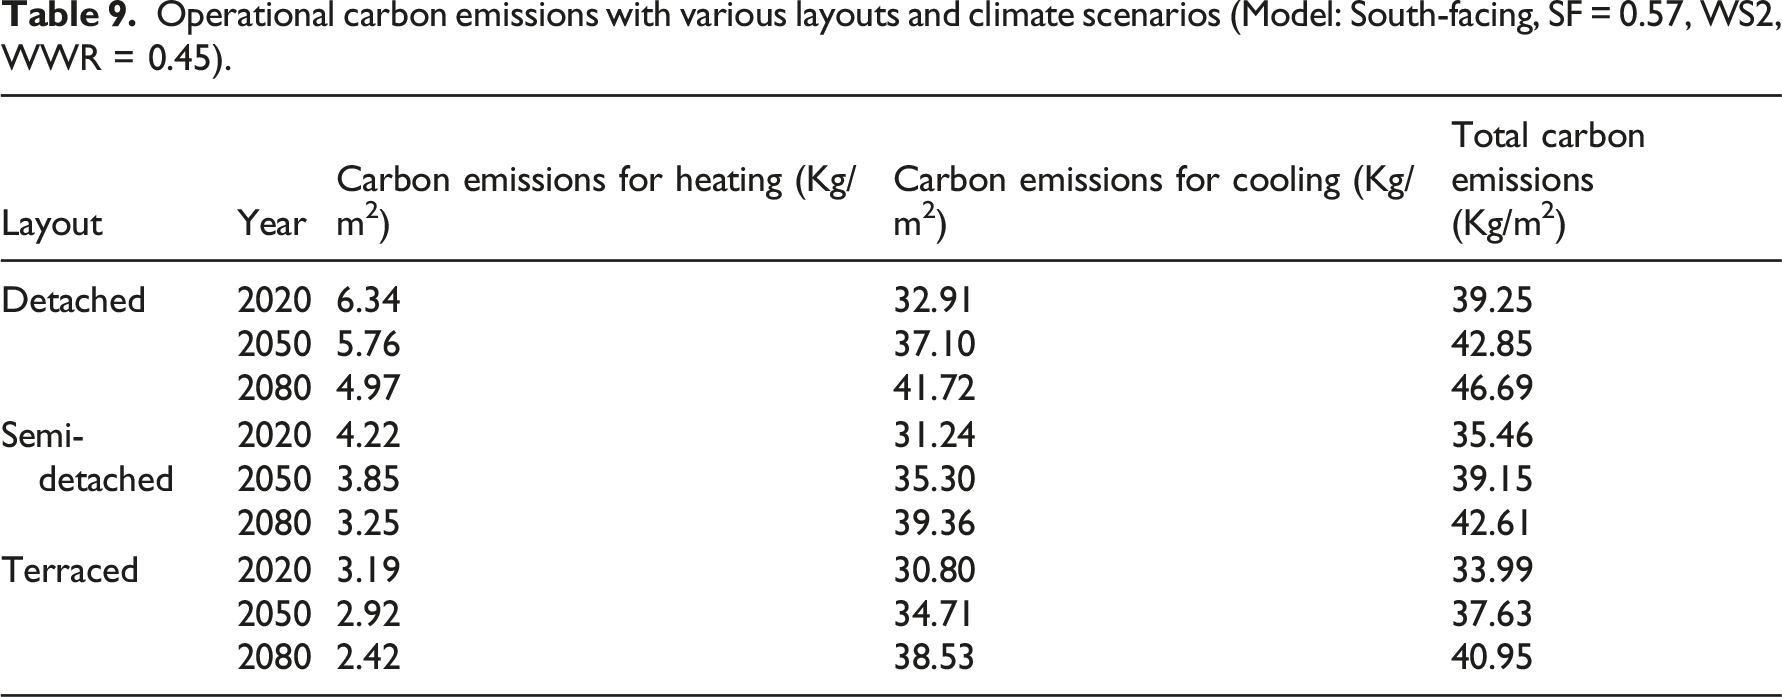
Operational carbon emissions with various layouts and climate scenarios (Model: South-facing, SF = 0.57, WS2, WWR = 0.45).
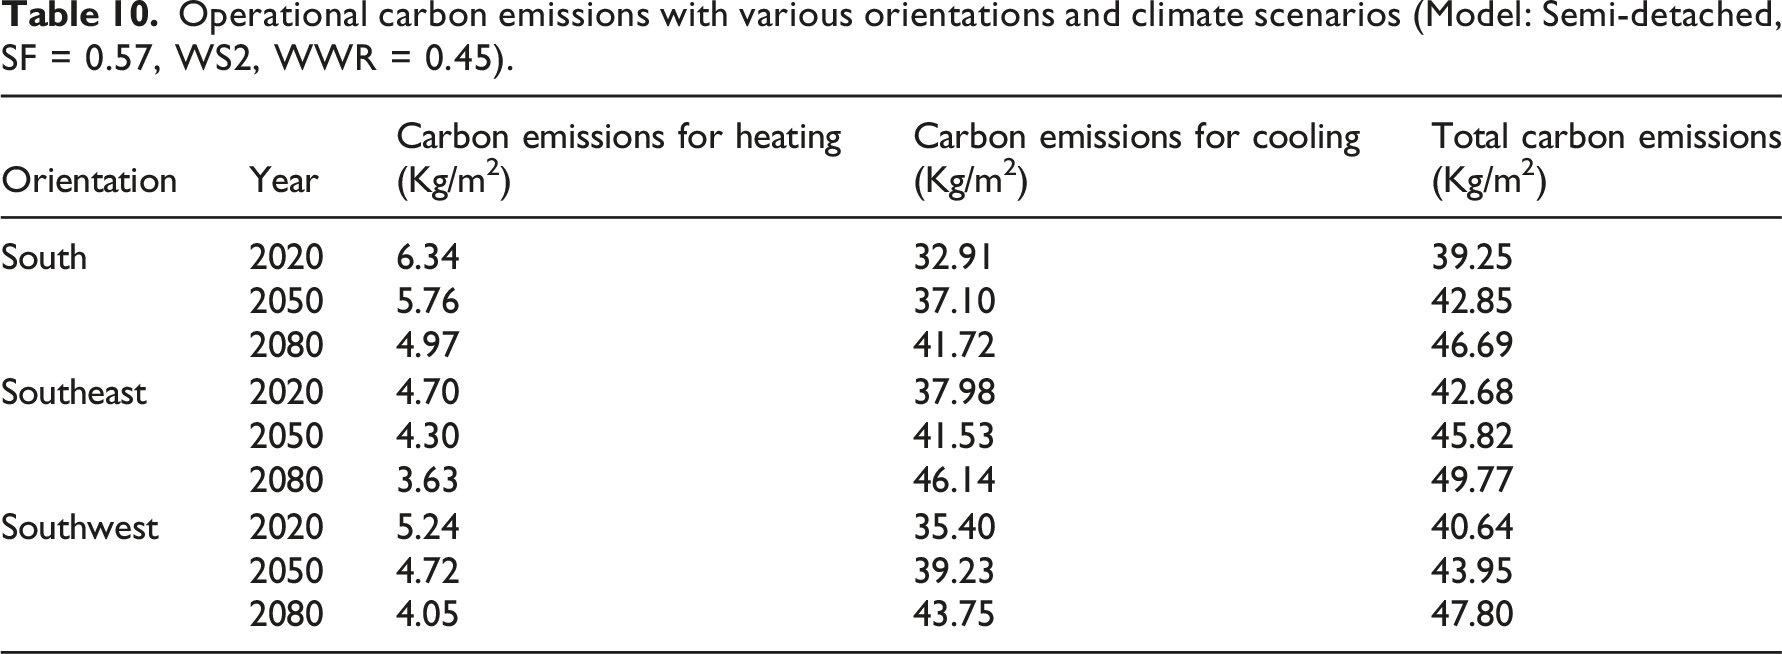
Operational carbon emissions with various orientations and climate scenarios (Model: Semi-detached, SF = 0.57, WS2, WWR = 0.45).
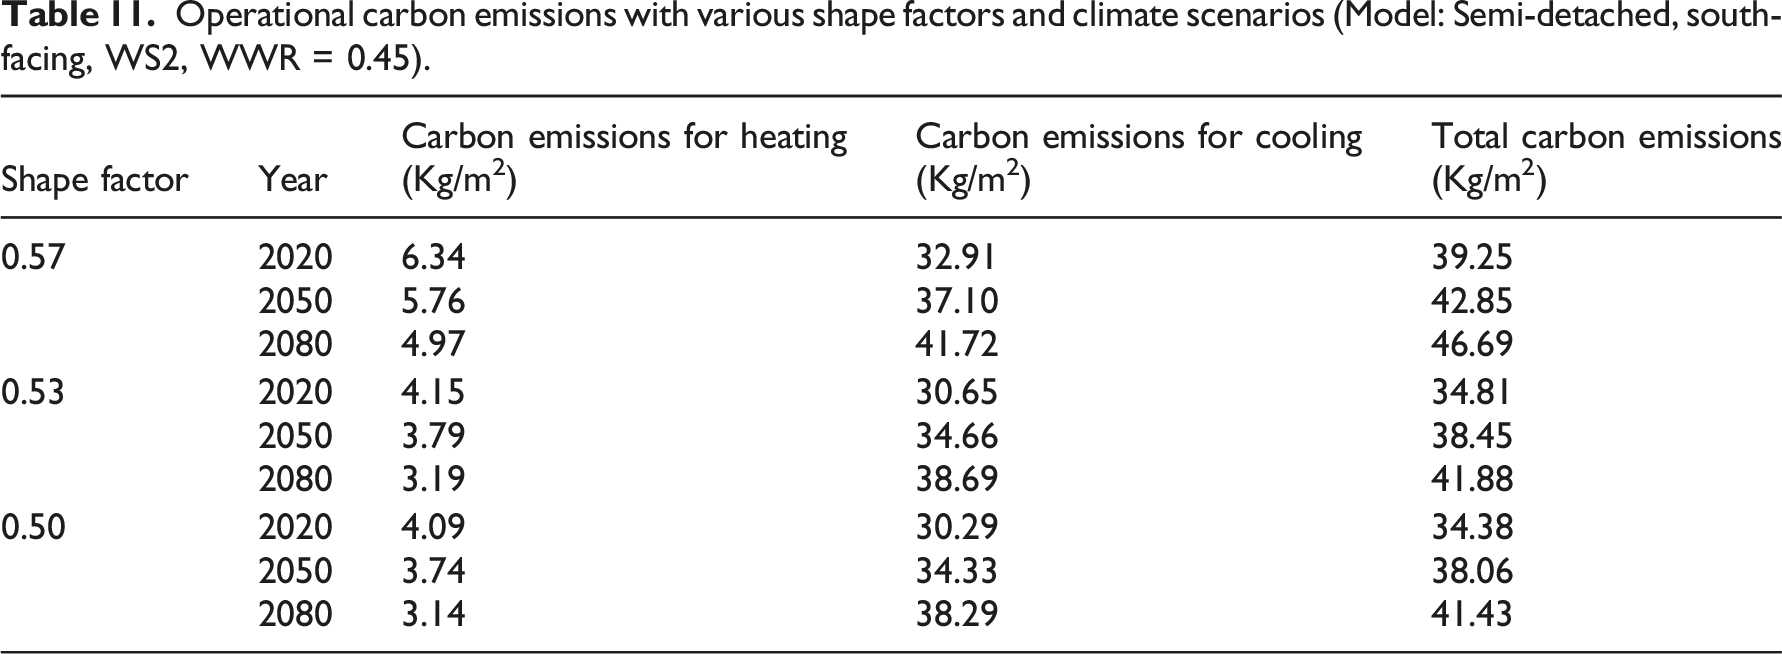
Operational carbon emissions with various shape factors and climate scenarios (Model: Semi-detached, south-facing, WS2, WWR = 0.45).
Operational carbon emissions with various WWR and climate scenarios (Model: Semi-detached, south-facing, SF = 0.57, WS2).
Operational carbon emissions with various wall structure and climate scenarios (Model: Semi-detached, south-facing, SF = 0.57, WWR = 0.45).
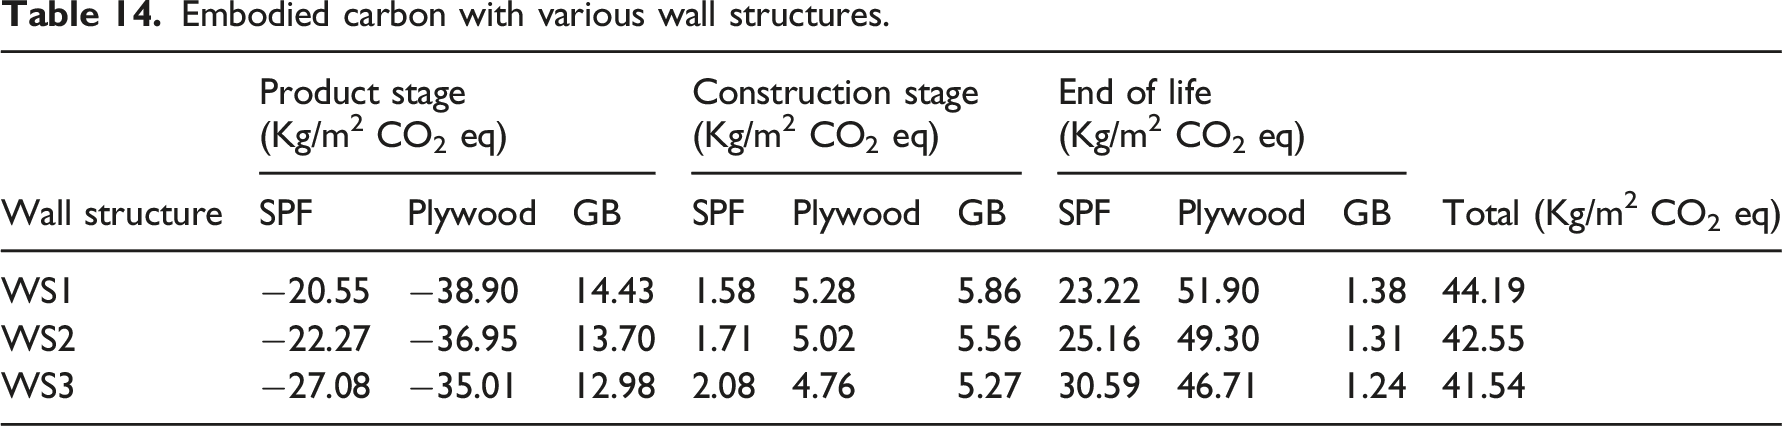
Embodied carbon: Effect of wall structure
Based on the construction of this timber house (Figure 2), the analysis of embodied carbon focuses on the effect of the prefabricated timber wall.
Embodied carbon with various wall structures.
Life cycle analysis: Effect of wall structure
Given Tables 13 and 14, compared with models (WS2 & WS3), the model (WS1) can achieve the largest carbon emission of the whole life cycle in terms of current (81.28 kg/m2) and future (88.63 kg/m2) climate scenarios. Taking the example of future climate scenario (2080), for product stage, the carbon emissions are negative in all models. The model (WS1) has the highest embodied carbon emission (−45.02 kg/m2). In construction stage, the largest carbon emission can be found in the model (WS1) as 12.72 kg/m2. For the use stage, the model (WS1) can produce the largest operational carbon emissions as 44.44 kg/m2. In end-of-life stage, the carbon emission of the model (WS1) is the lowest (76.50 kg/m2). In addition, the model (WS 3) can achieve the lowest carbon emissions in terms of the whole life cycle, production, construction and use stage as: 82.63 kg/m2 (whole life cycle), −49.10 kg/m2 (product stage), 12.11 kg/m2 (construction stage), 41.09 kg/m2 (use stage). For the end-of-life stage, the model (WS 3) has the largest carbon emissions (78.54 kg/m2).
Discussions and conclusions
This article presented a simulation analysis in terms of climate change, building layout, orientation, shape factor, WWR, and wall structure in a prefabricated timber house in Northern China (continental climate). The energy demand, operational carbon emissions and embodied carbon were calculated and compared in various models. Some achieved findings are discussed below.
First, the predicted climate change between 2020–2080 will significantly affect annual energy demands and operational carbon emissions in the timber house studied. Over this period, the annual cooling demand will significantly rise, while a decrease can be found for the annual heating demand. The annual primary energy demand (heating + cooling) will generally increase towards 2080. The annual operational carbon emissions can achieve similar varying trends. By contrast, there will be no clear effect of climate change (2020–2080) on peak heating and cooling demands. As indicated in Figure 3, Tianjin (the location) will have rising monthly and annual average temperatures from 2020 to 2080, which can result in more frequent hot days and fewer cold days. 2 This future trend of climate change could explain the change of annual energy demands. In addition, it seems that the increase of temperature in the cooling season will be higher than the decrease in temperature in the heating season. Thus, the primary energy demand will still go up. Compared with the temperature, effects of climate change on the solar radiation from 2020 to 2080 would not be so clear, especially during the cooling season (June – August) (Figure 3). The relatively stable solar gain combined with the well-insulated building envelope (see Table 2) could explain why peak cooling or heating demands will not substantially vary by year.
Second, under current and future climate scenarios, annual primary energy demands and operational carbon emissions in the timber house can be clearly affected by its architectural characteristics, including layout, orientation, and WWR, but not the shape. Detailed findings are given as follows. (1) Terraced and semi-detached houses can achieve 70% and 80% energy demands, 87% and 90% carbon emissions compared to the detached house in 2020, and 74% and 82% energy demands, 90% and 93% carbon emissions of the detached house in 2080. (2) Climate change by 2080 would increase energy demand by 13% (terraced), 10% (semi-detached), and 6% (detached), and carbon emissions by 27% (terraced), 26% (semi-detached), and 23% (detached). (3) In 2080, south-facing would help deliver 14% lower energy demand and 13% less carbon emissions than south-west or south-east. (4) Increasing 80% window area would lead to a 31% increase in energy demand, and 42% increase in carbon emissions in 2080. (5) However, within the range of 0.5–0.6, the shape factor cannot cause significant impacts on energy and carbon performances for each year. These findings could be explained by the design and configuration of this timber house: it has a narrow rectangular plan with the north and south facades placed along the width, and the east and west facades placed along the length; the windows were only set at the south and north facades. Thus, compared with the well-insulated east and west facades, north and south facades would receive a significantly higher impact from the outdoor environment and the orientation. In addition, the narrow range of shape factor (0.5–0.6), which was defined based on the prefabricated construction requirements, did not bring a substantial change to the house shape. It was thus not surprising that the energy demand will not vary in the shape factor.
Under current and future climate scenarios, it is possible to reduce annual energy demands and operational carbon emissions, and at the same time to lower the embodied carbon of construction materials in this timber house, through the adjustment of prefabricated wall structure. In this study, it has been found that in comparison with a normal wall structure (WS1), an optimised wall structure (WS3) would decrease energy demand, operational carbon emissions and embodied carbon by 19%, 23% and 6% in 2080, respectively.
Limitations and future work
Some limitations and future work are discussed as follows. First, these conclusions were obviously limited to a simple house model. More architectural characteristics (e.g., façade configurations, shading devices, etc.) will be tested in the next stage. Second, there were no surroundings considered in this study. The impact of surrounding environments with various conditions will be studied late. Third, for the life cycle analysis, this study has just calculated the operational carbon from heating and cooling systems. However, it would be reasonable to include all domestic functions (e.g., cooking, washing, etc.) 43 if a proper assessment of environmental impact can be achieved in such houses. Thus, a comprehensive environmental impact caused by various domestic activities will be considered in the future. Finally, the algorithm to predict the carbon emission in this study was relatively simple. A more complicated method (an advanced strategy: revised TRIZ 44 ) will be adopted to further assess environment impacts in similar timber houses.
Footnotes
Declaration of conflicting interests
The author(s) declared no potential conflicts of interest with respect to the research, authorship, and/or publication of this article.
Funding
The author(s) received no financial support for the research, authorship, and/or publication of this article.