
Abstract
As the high temperatures experienced during the summer of 2018 may become commonplace by 2050, adaptation to higher indoor temperatures while minimising the need for mechanical cooling is required. A thorough understanding of the factors that influence indoor temperatures can enable the design of healthier and safer dwellings under a warming climate. The aim of this paper is to provide further insight into the topic of indoor overheating through the analysis of the largest recent sample of English dwellings, the 2011 Energy Follow-Up Survey, comprised of 823 dwellings. Following the pre-processing stage, the indoor overheating risk of 795 living rooms and 799 bedrooms was quantified using the criteria defined within CIBSE's Technical Memorandum 59. Approximately 2.5% of the dwellings were found to exceed Criterion 1, with this figure approaching 26% when Criterion 2 was considered. Subsequently, the indoor temperatures were standardised against external weather conditions and the correlation of 11 dwelling and 9 household characteristics was examined. Factors such as the main heating system, tenure and occupant vulnerability were all found to have a statistically significant association with the indoor temperatures. Further analysis revealed multiple correlations between household and dwelling characteristics, highlighting the complexity of the indoor overheating problem.
Introduction
The summer of 2018 was the hottest on record in England. 1 As a result of anthropogenic greenhouse gas (GHG) emissions, 2 the chance of such high summer temperatures will increase from less than 10% (1981–2000) to approximately 50% by 2050. 3 To mitigate the worst of the possible consequences of climate change, the UK introduced in 2008 the Climate Change Act and set the aim of reducing GHG emissions to 80% below the 1990s levels by 2050. 4 With increased levels of building thermal insulation and airtightness, along with the use of better-performing boilers, the GHG emissions of the domestic stock were reduced by 22% compared to 1990s levels, despite a 25% increase in the number of homes. 5 Alongside further reductions in the GHG emissions of homes, 5 the need for adaptation to the higher indoor temperatures associated with the increased ambient temperatures is also clear,6,7 especially since people spend most of their time indoors. 8 Higher outdoor temperatures can drive indoor thermal discomfort, a phenomenon referred to as indoor overheating, 9 which could impair the occupants sleep10,11 and general wellbeing. 6 During periods of extreme hot weather, the increased heat stress could also result in serious health consequences and even death, especially for older people or individuals with illnesses and physical disabilities. 12 During the 10-day period of the 2003 heatwave, the mortality rate of people aged 75 or older by location of death increased in Southern England by: 33% in their own home, 42% in nursing homes and approximately 29% in residential homes 13 (although the harvesting effect may have influenced the exact figures). 14
Although the possible implications of focusing on winter thermal comfort instead of whole-year thermal comfort have long being debated, 15 presently, an assessment of indoor overheating risk is not enforced within the building regulations. 16 The Approved Document L1A for new dwellings suggests the use of a steady-state model described in Appendix P of SAP 2012 to ensure that summer heat gains are limited 17 while the equivalent document for existing dwellings, Approved Document L1B, does not provide any advice on the assessment of indoor overheating. 18 Numerous concerns regarding the efficacy of the SAP 2012 model in identifying dwellings at high risk of indoor overheating have been raised. 16 In the recent release of SAP 10, which is not currently used for official purposes, the indoor overheating assessment was improved through the option for reduced air-change rate in the case of noise or security concerns. 19 However, the same steady-state model and monthly mean temperatures as in SAP 2012 are used, with no distinction between bedrooms and living rooms being made. Thus, concerns regarding the ability of this method to adequately capture the stochastic nature of human behaviour or account for future heatwaves may be raised. Nonetheless, evidence from the application of the SAP 10 model are required before drawing any final conclusions. An alternative approach for the assessment of indoor overheating risk at the building design stage was provided by the Chartered Institution of Building Services Engineers (CIBSE) with the release of Technical Memorandum 59 (TM59). 20 The method is based on the use of building performance simulation (BPS) tools, with two threshold criteria defined based on the theory of adaptive thermal comfort and previous research on sleep quality.21–23 However, these criteria have been challenged, since they are based on old field studies primarily in offices that may not capture adequately the occupants' adaptive capacity.24,25 Therefore, despite the plethora of modelling and monitoring studies on the drivers of indoor overheating risk,26–30 our understanding of how to effectively quantify and reduce indoor overheating risk at the building design or refurbishment stage is incomplete.
This study aims at providing further evidence on how dwelling and household characteristics may influence indoor temperatures. This will be achieved through the statistical analysis of the largest recent monitoring campaign of English dwellings, the 2011 Energy Follow-Up Survey (EFUS) with a sample of 823 dwellings. Specifically, this study seeks to answer the following questions:
What is the indoor overheating risk of the monitored EFUS dwellings according to the threshold criteria defined in TM59? Which dwelling and household characteristics have a statistically significant association with higher indoor temperature? Which dwelling and household characteristics are statistically correlated?
This will be the first England-wide assessment of indoor overheating risk using the TM59 criteria, while the statistical investigation of the factors that may influence the summer indoor temperatures aim to inform our adaptation efforts to a warming climate.
Literature review
Over the last few years, there have been a series of monitoring campaigns that investigated the factors that influence summer indoor temperatures in the UK. A comprehensive summary of recent monitoring campaigns was provided by Pathan et al. 26 and Fosas et al. 31 with some key findings discussed below.
Within a monitoring campaign of 55 dwellings located in Exeter, vulnerable households (with older occupants or occupants with illnesses and physical disabilities) and overcrowded households were exposed to higher mean temperatures than non-vulnerable and non-overcrowded households. 27 In a 2009 monitoring campaign that involved 230 dwellings in Leicester, occupants aged over 70 years were more likely to heat their homes over the summer. 30 The same study also revealed that heated homes were amongst the 13% warmest homes monitored and that typology is another influential factor with flats identified as the warmest. A London monitoring campaign of 122 dwellings over the summers of 2009 and 2010, identified overheating as a widespread problem with 75% of the bedrooms failing at least one of the two fixed overheating thresholds used. 26 From this result, the authors concluded that targeting particular categories of dwellings may not adequately address the issue of indoor overheating. 26 The monitoring of eight social housing London dwellings, indicated that indoor overheating is already experienced even during mild summers, although the severity depends on the criterion used. 28 A post-occupancy evaluation undertaken in 26 Scottish dwellings built after 2009 demonstrated that indoor overheating risk is not localised to the southern United Kingdom. 32 A few dwellings were found to overheat even during non-summer periods and numerous dwelling characteristics (e.g. heat loss parameter) and occupant-related actions (e.g. thermostatic control) were identified as influential. Another key point raised was the discrepancy between indoor overheating assessments and stated thermal discomfort – occupants of some dwellings with a relatively high percentage of overheating hours did not identify overheating as a problem, with the opposite being true for a few dwellings with a relatively low number of overheating hours recorded. 32
A common limitation between the monitoring studies in English dwellings discussed above is the focus on a single location. An exception is the 2007–2008 nationwide Carbon Reduction in Buildings (CaRB) study of 207 dwellings. 33 The static overheating criteria and mean monitored temperatures over the summer period were used to determine whether significant differences exist due to location, external wall type, age band and building type. However, as suggested by the literature,27,32,33 numerous other factors could influence the indoor environment. In addition, as the distribution of characteristics (e.g. building type) is not necessarily uniform between different regions, a statistical comparison of mean temperatures or static thresholds is likely influenced by the local weather.
During the 2010/2011 EFUS, 2616 households were interviewed, with 943 receiving temperature loggers and 823 returning them with adequate data for analysis. 34 Overall, 20% of the interviewees reported difficulty in keeping at least one room cool during the summer months and identified insufficient shade as the primary reason for overheating. Bivariate analysis on the factors that influence the likelihood of occupants expressing thermal discomfort suggested dwelling age, floor area and location to all be important. Households with SAP rating > 70 were associated with a higher thermal discomfort and so were occupants of registered social landlord (RSL) dwellings. Larger households or households without a pensioner present were also more likely to report thermal discomfort. Despite the thorough analysis of stated thermal discomfort, the analysis conducted on the summer indoor temperatures was limited. Hulme et al. did not differentiate between bedrooms and living rooms which could be an important distinction due to their different use. In addition, as the prediction of indoor overheating risk is based on indoor temperatures and the association between temperatures and thermal discomfort is yet unclear, a detailed analysis of indoor temperatures would complement the analysis of Hulme et al.
Methods
The English Housing Survey (EHS) is a national survey, commissioned by the Ministry of Housing Communities and Local Government (previously Department for Communities and Local Government), that takes place every two years and consists of household interviews and physical surveys. 35 The interviews typically cover topics such as demography, employment and income while the surveys gather information regarding the dwelling conditions and energy efficiency measures. 36 As a follow up to the 2010–2011 EHS, the EFUS survey conducted further interviews and surveys in 2616 dwellings with the purpose of updating the modelling assumptions regarding how energy is used at home. 36 For 943 dwellings, the indoor air temperature was monitored using TinyTag Transit 2 loggers 36 at 20-minute intervals in the living room, bedroom and hallway from the time of installation (December 2010 to April 2011) until they were returned (April/May 2012). Adequate data for at least one room were returned by 823 dwellings. The monitored temperatures, interviews and survey data can be linked to the data within the EHS through access to the UK Data Service.37–39
Weather data were obtained from the Met Office Integrated Data Archive System (MIDAS) database
40
for the weather stations in the six regions identified in Figure 1 and as described in more detail by Symonds et al.
41
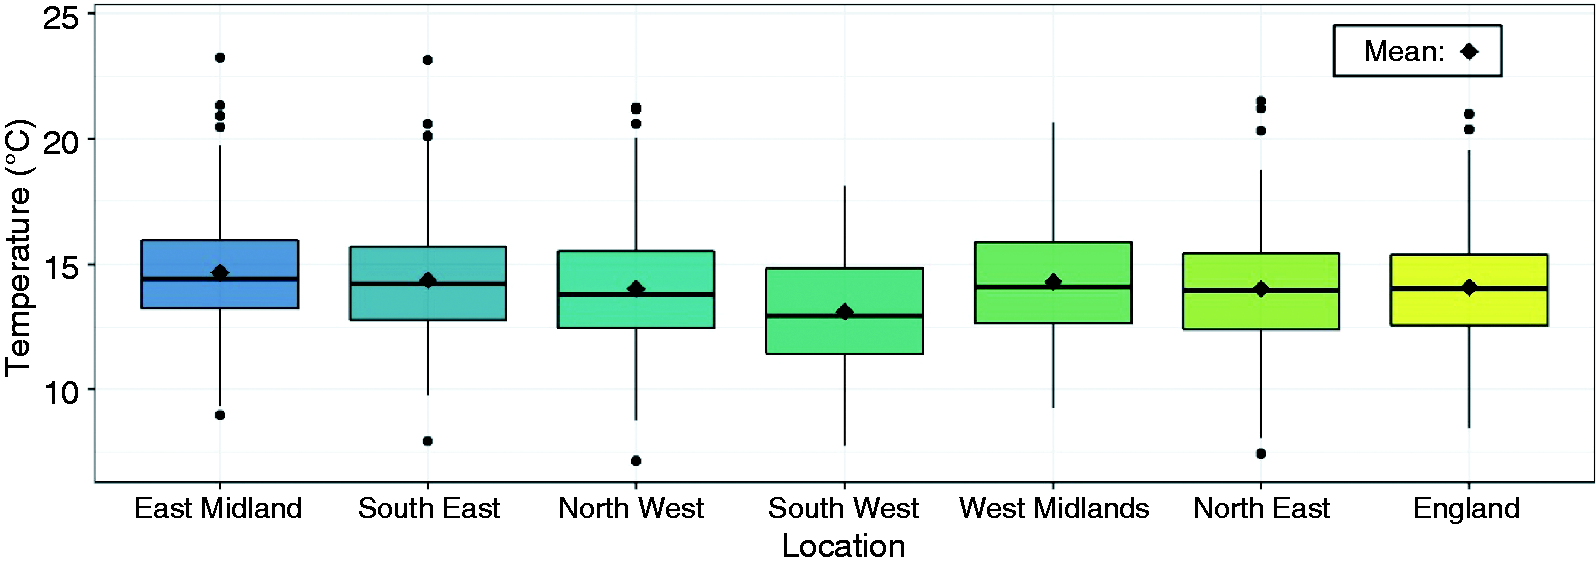
A summary of the daily-mean temperature of each region is provided in Figure 2. Depending on its Government Office Region (GOR), each dwelling was associated with one of the six regions. At the pre-processing stage, the monitored indoor temperatures of each dwelling were analysed with the purpose of identifying extreme values that could be the result of faulty or misplaced data loggers (e.g. positioned near heat sources). Given the relatively cool conditions during the summer of 2011, individual recordings that exceeded 40℃ were removed and the temperatures measured at 20-minute intervals were averaged to give hourly values. In the case that multiple recordings exceeded 40℃, that logger was removed from the dataset. Subsequently, for each region, the temperature profiles of statistical outliers were qualitatively assessed to determine whether further elimination was required (e.g. in case of year-long flat temperature profiles). In the case of missing data from bedroom or living room loggers during the period May–September (inclusive), the rooms of these dwellings were not included in the overheating assessment. Following the pre-processing stage and from an initial sample of 823 dwellings, the temperatures monitored in 795 living rooms and 799 bedrooms were considered adequate for analysis.
Location of the weather stations used for each region. Reproduced from Symonds et al.
41
Box plots of the daily mean temperature recorded by the six weather stations between May and September. The box-plot of England represents the average daily mean temperature across the stations.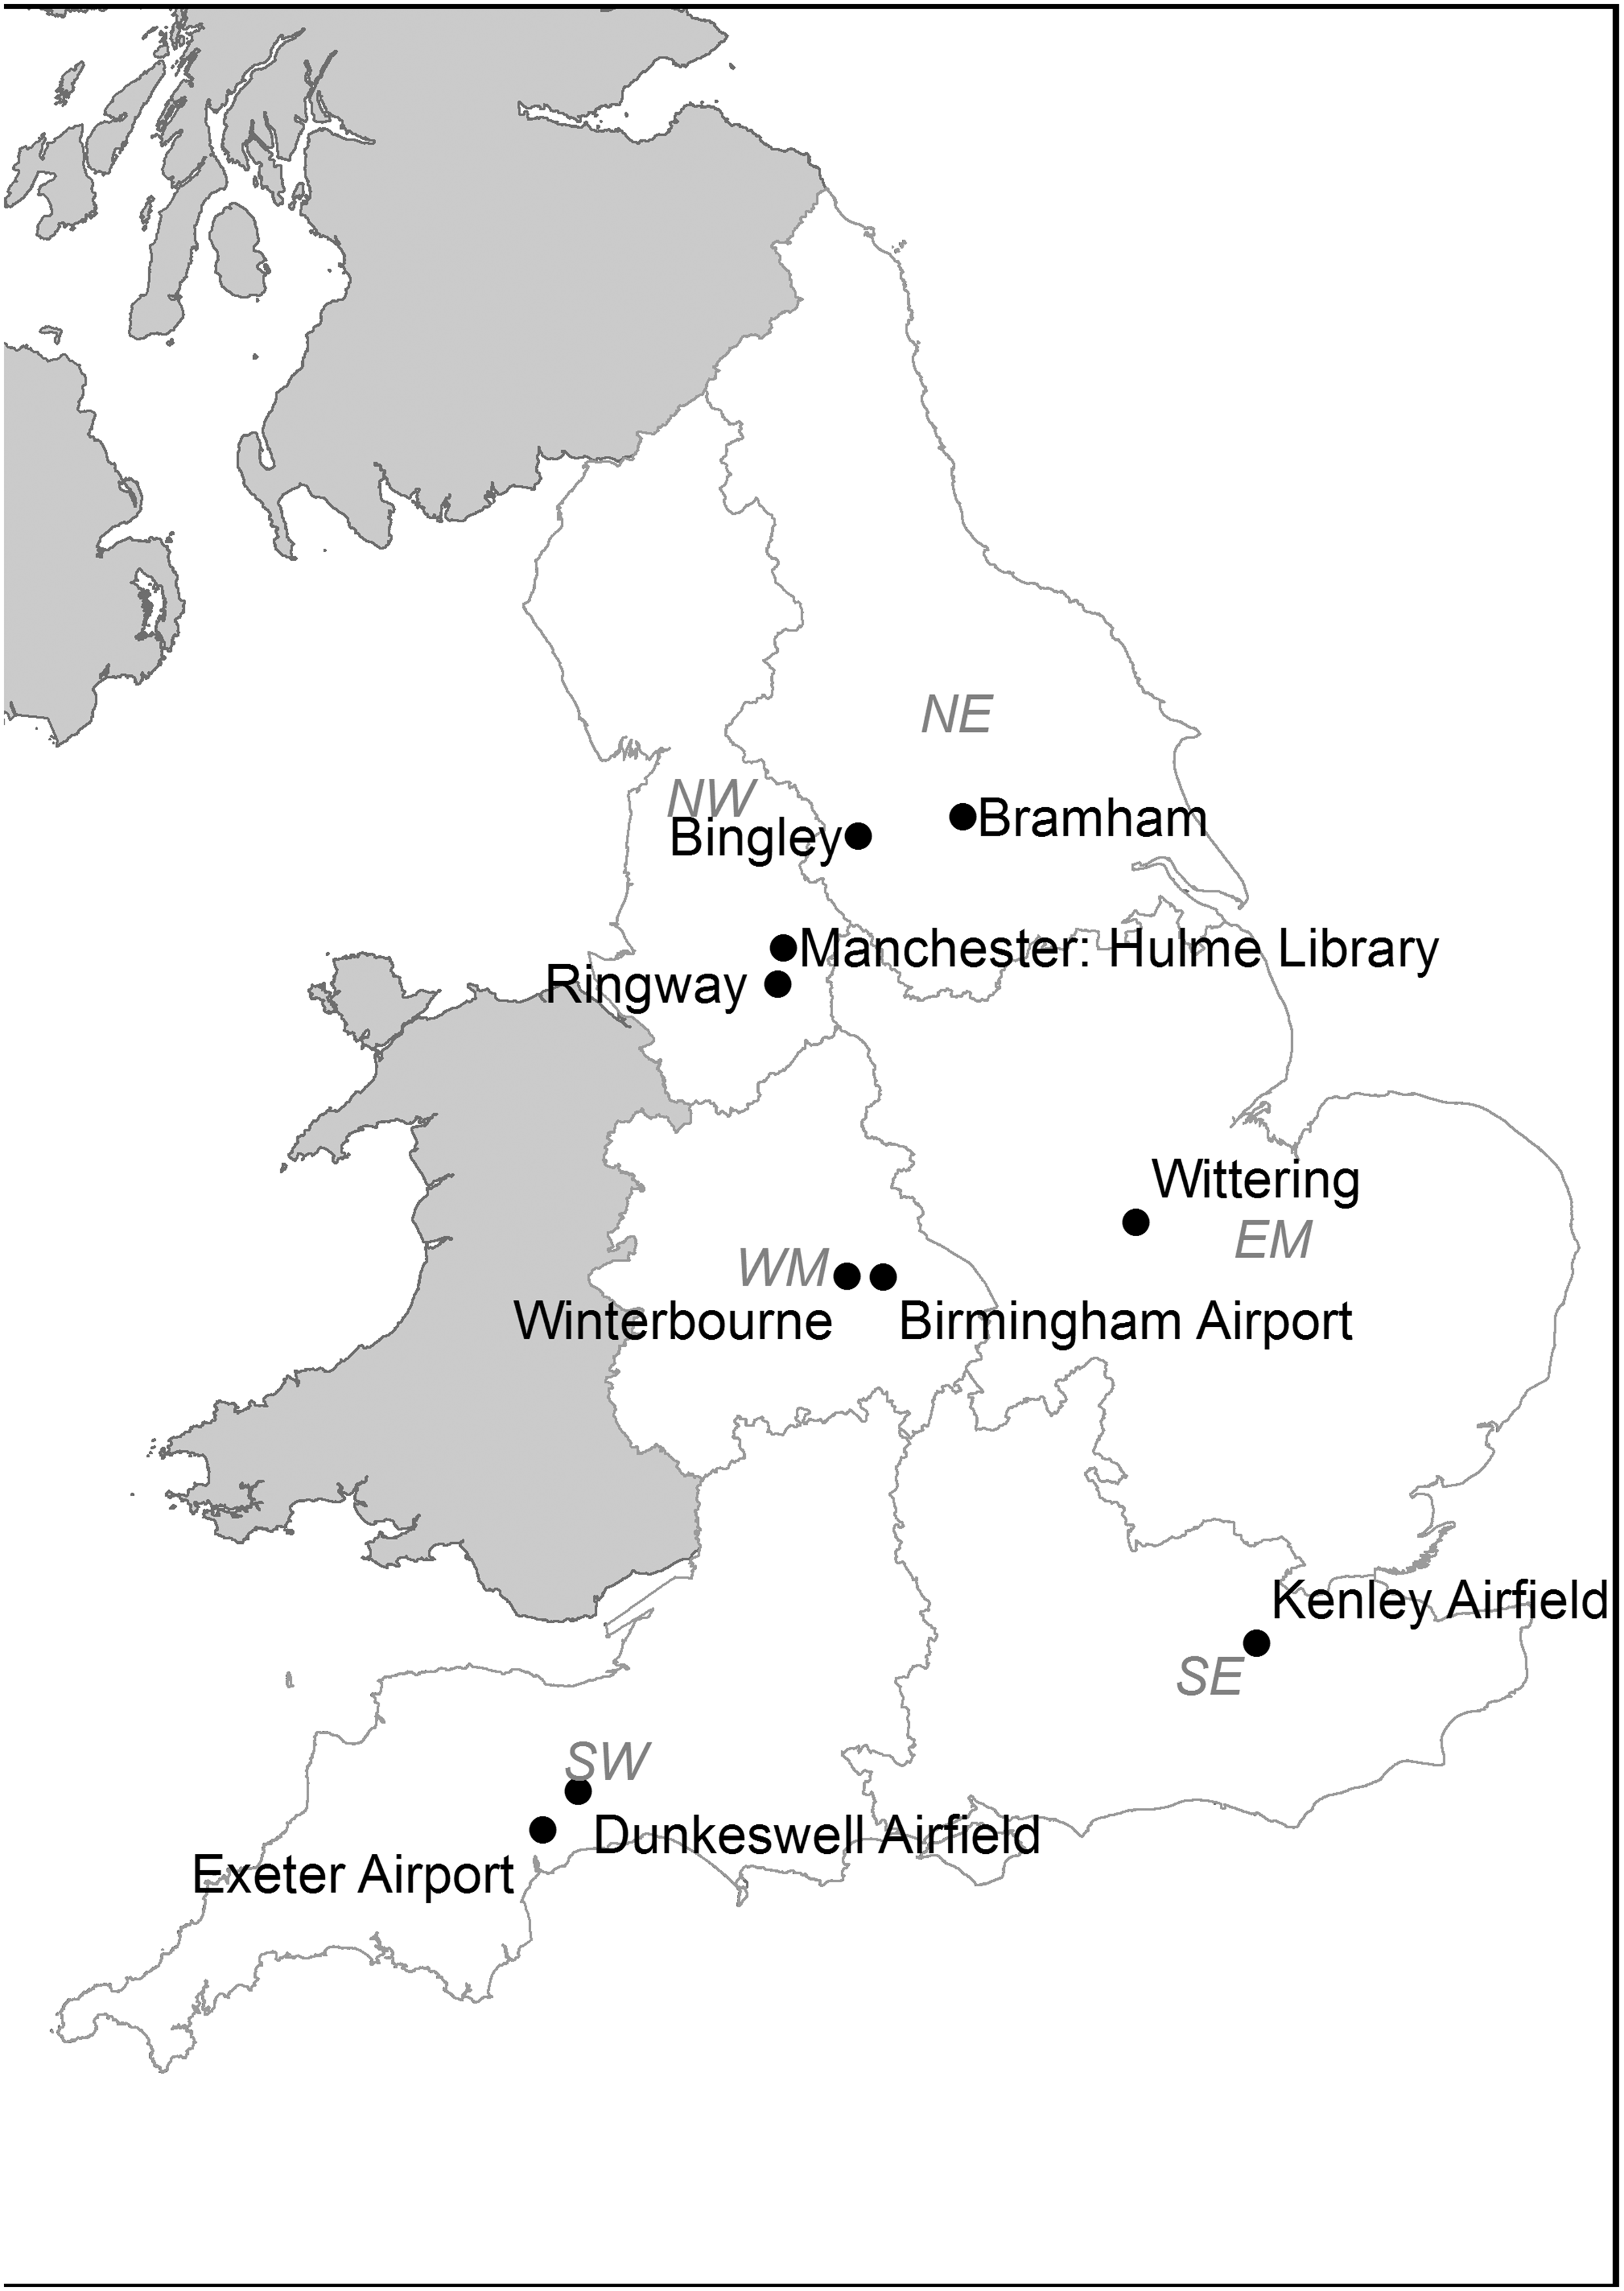
Indoor overheating assessment
To translate indoor temperatures into overheating risk, the two criteria defined in TM5920 for naturally ventilated dwellings were used. This does not imply that this is a validation study of TM59, a design stage guidance that is based on the use of BPS tools. However, as TM59 is the only overheating guidance focused on dwellings, it was deemed appropriate to utilise the same criteria. A form of these criteria, but not the combination of, has been used in the past to assess overheating risk in previous in-use studies.27,30,42 A high risk of indoor overheating was assumed if either of the following thresholds is exceeded:
20
The percentage of occupied hours where the operative temperature (T
op
) exceeds the maximum allowable temperature (T
max
) by 1℃ or more during the period May to September, inclusive, should not exceed 3%. Bedroom operative temperature should not exceed 26℃ for more than 1% of the assumed sleeping hours (22:00–07:00) annually (equivalent to 32 h).
Local weather data were used to estimate a Tmax for each region using the equations in CIBSE TM52. 9 The dwellings were assumed to be predominantly naturally ventilated, with the living room being occupied between 09:00 and 22:00 and the bedroom being always occupied, as suggested in TM59. 20 As only the air temperature was monitored, this was used instead of the operative temperature in the overheating risk assessment. This assumption does not capture the influence of radiant temperatures on thermal comfort. 9 However, given the data available, this limitation could not be overcome.
Standardisation of indoor temperatures
To account for the inter-regional variations in local weather, the indoor temperatures were standardised against the external conditions to allow for a direct comparison between the monitored temperatures of the entire housing stock. A similar method has been used in the past to analyse winter temperatures43,44 and enables the nationwide investigation of factors that influence the indoor environment.
Amongst the numerous models evaluated, a balance was struck between model efficacy and simplicity for a model that was based on linear terms of daily-mean outdoor temperature (

Statistical analysis
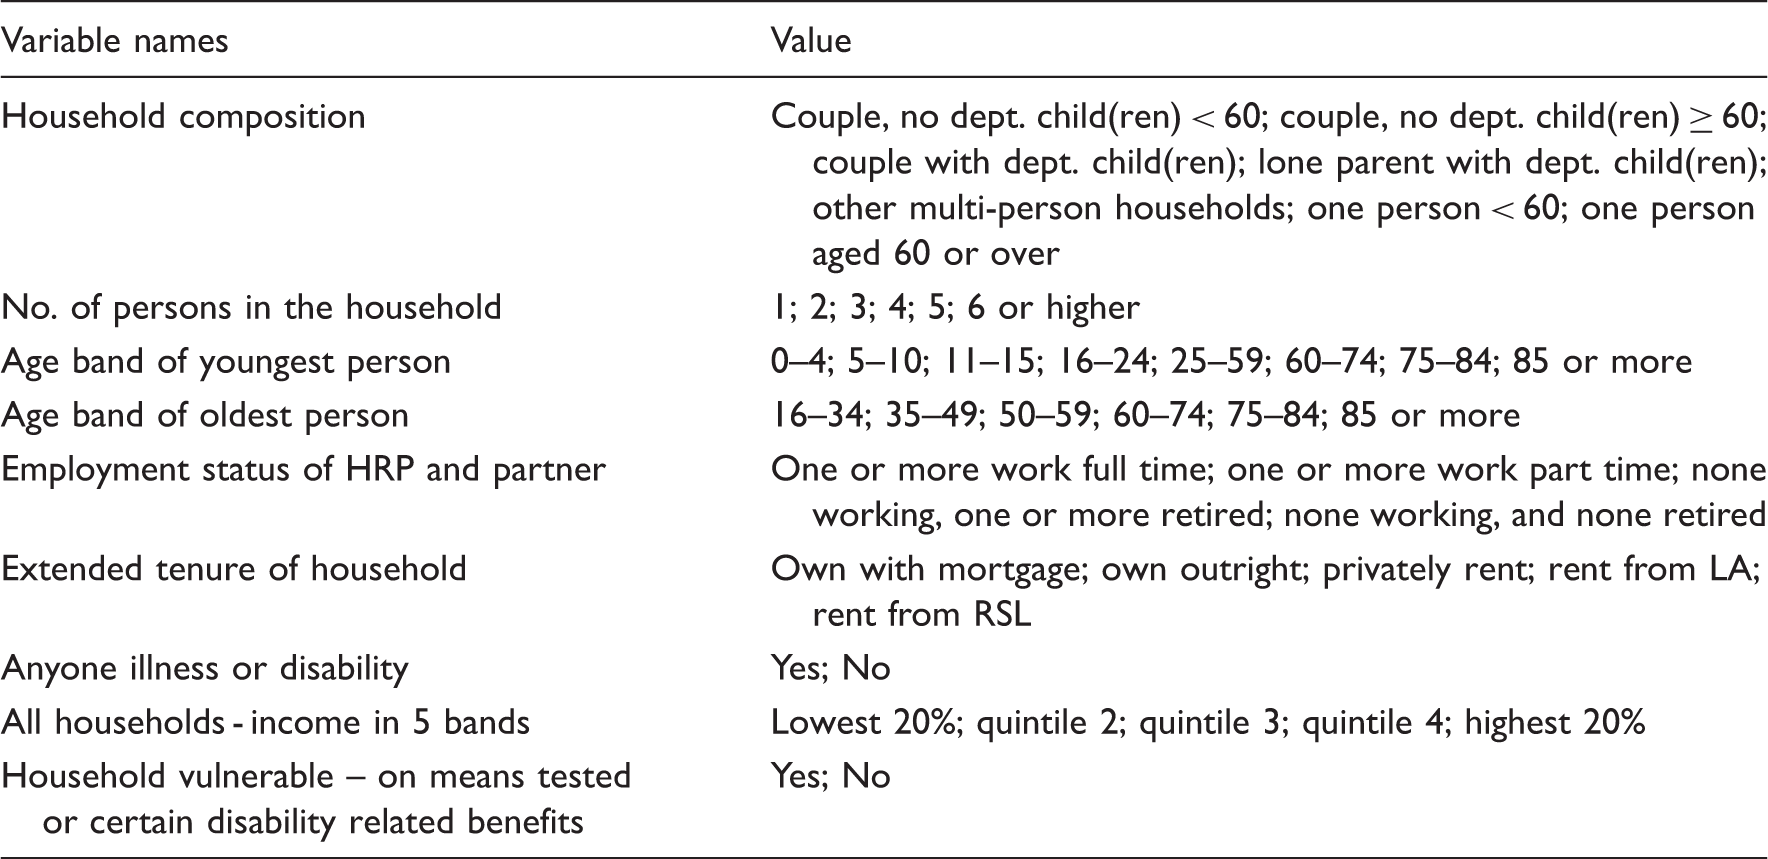
Summary of the household variables analysed.
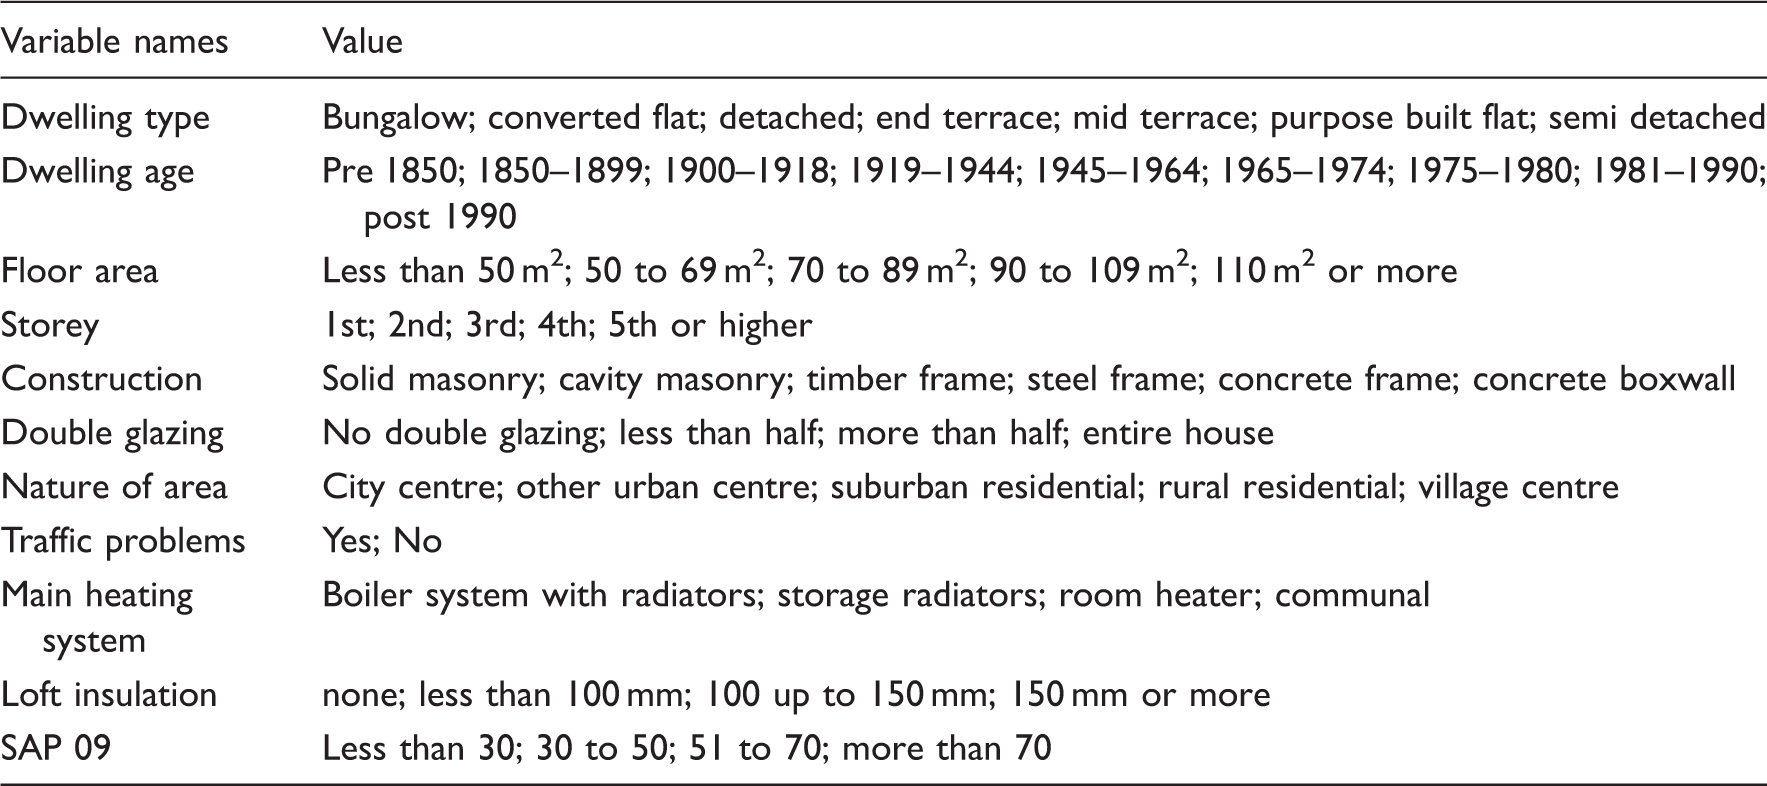
Summary of the dwelling variables analysed.
The median SIT across the different levels (sub-groups) of each explanatory variable is the same at a signficance level of 5%.
There is no statistical association between categorical explanatory variables at a signficance level of 5%.
Results
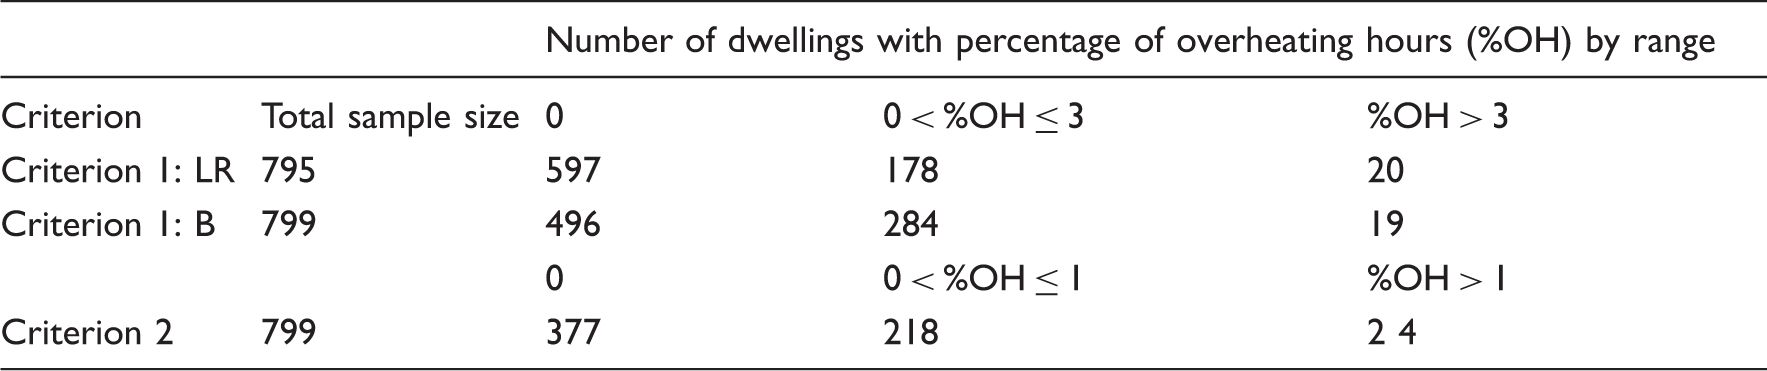
Following the methods discussed above, the indoor overheating risk was estimated for 795 living rooms and 799 bedrooms, with the results summarised in Table 3. Subsequently, the relation between the SIT and the dwelling and household characteristics was explored, with the results summarised in Tables 4 to 7 and visualised in Figure 3. Finally, the correlation between dwelling and household characteristics is shown in Table 8 and Figure 4.
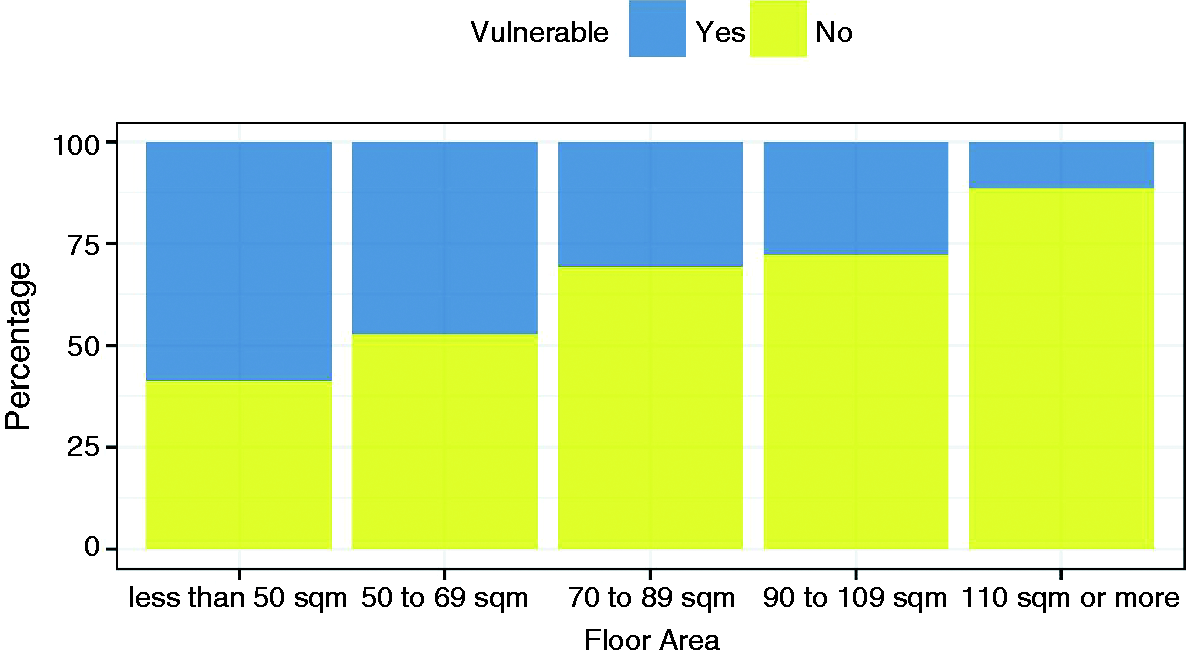
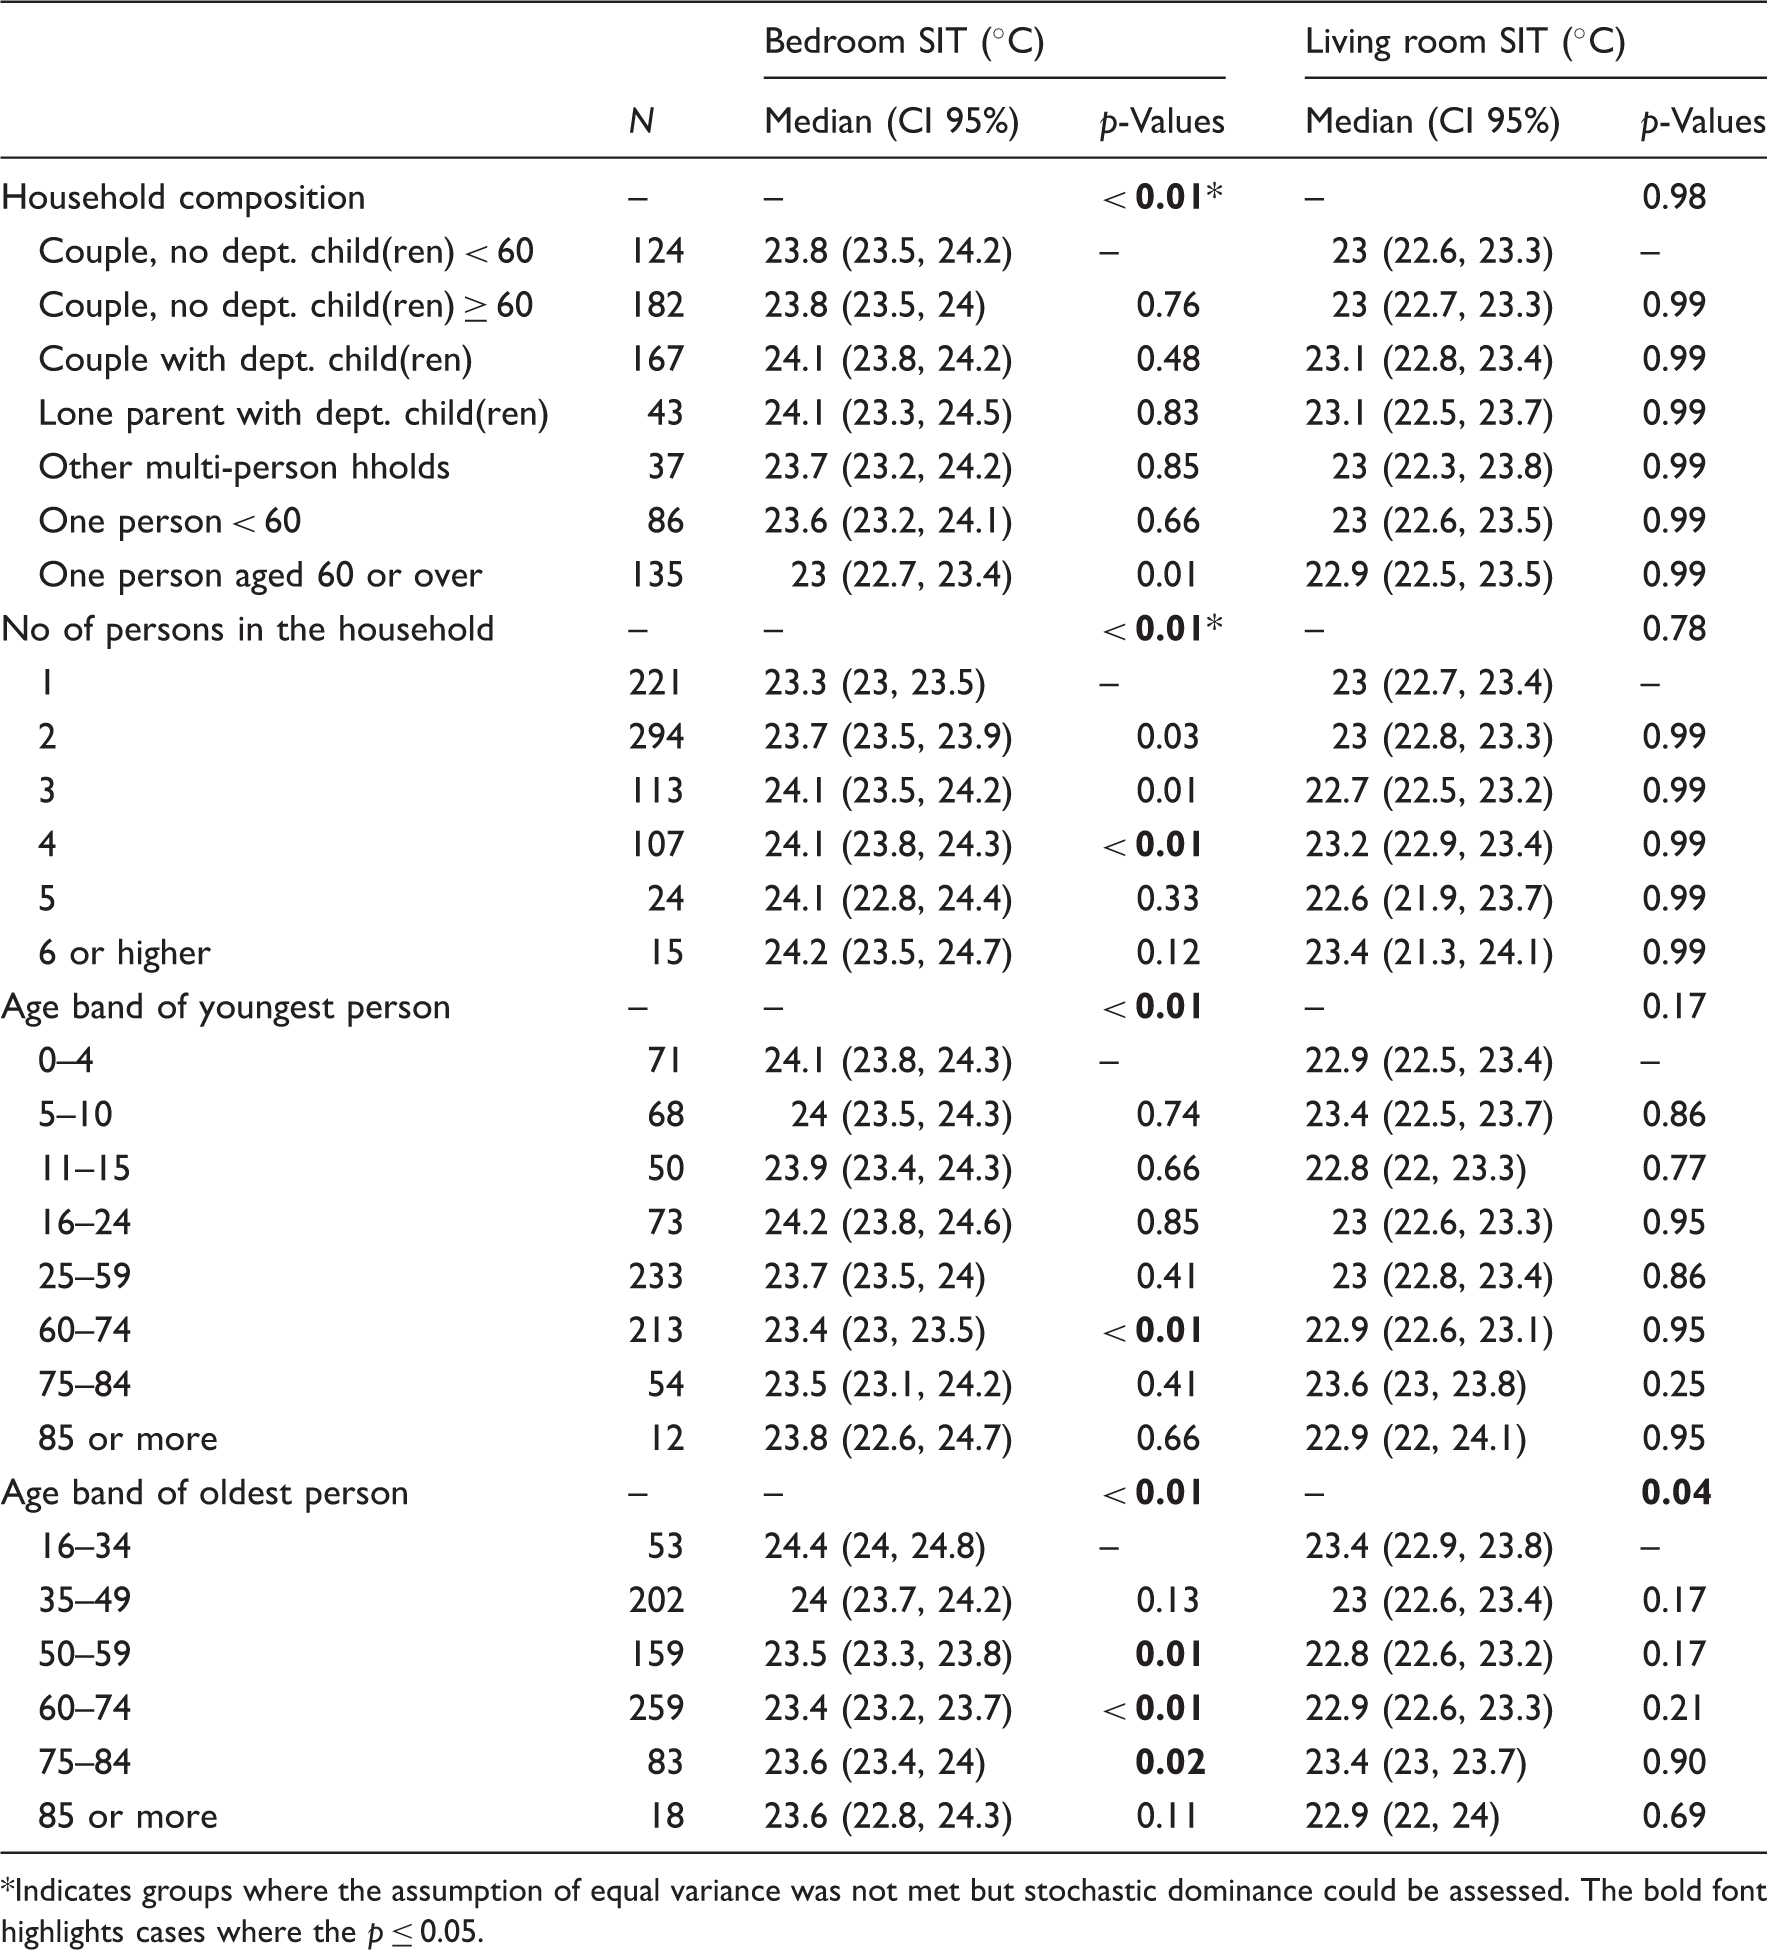
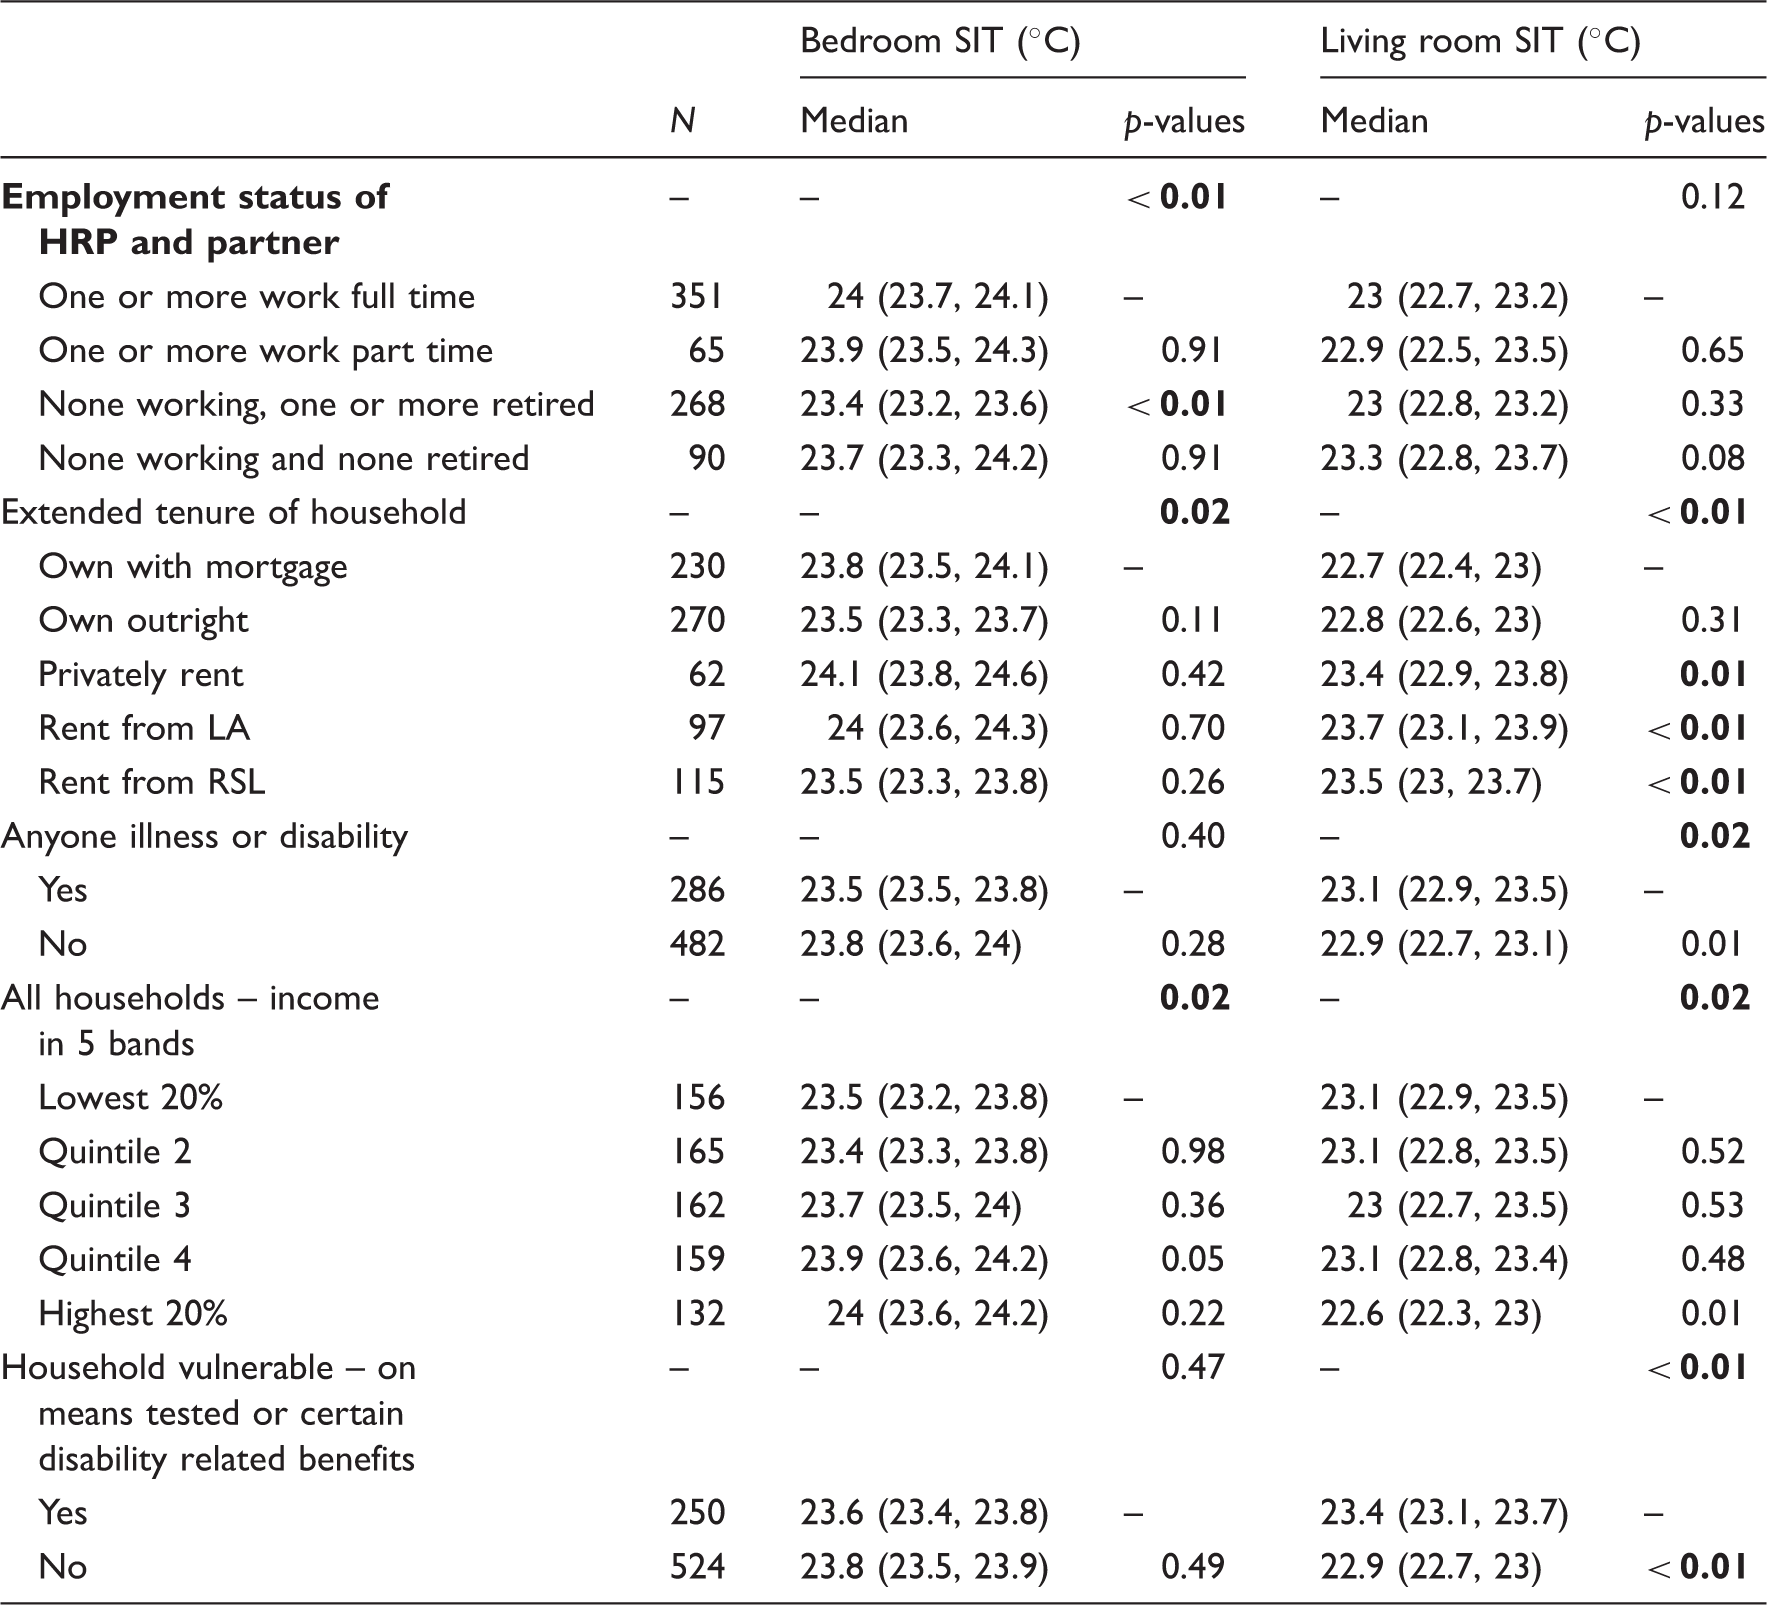
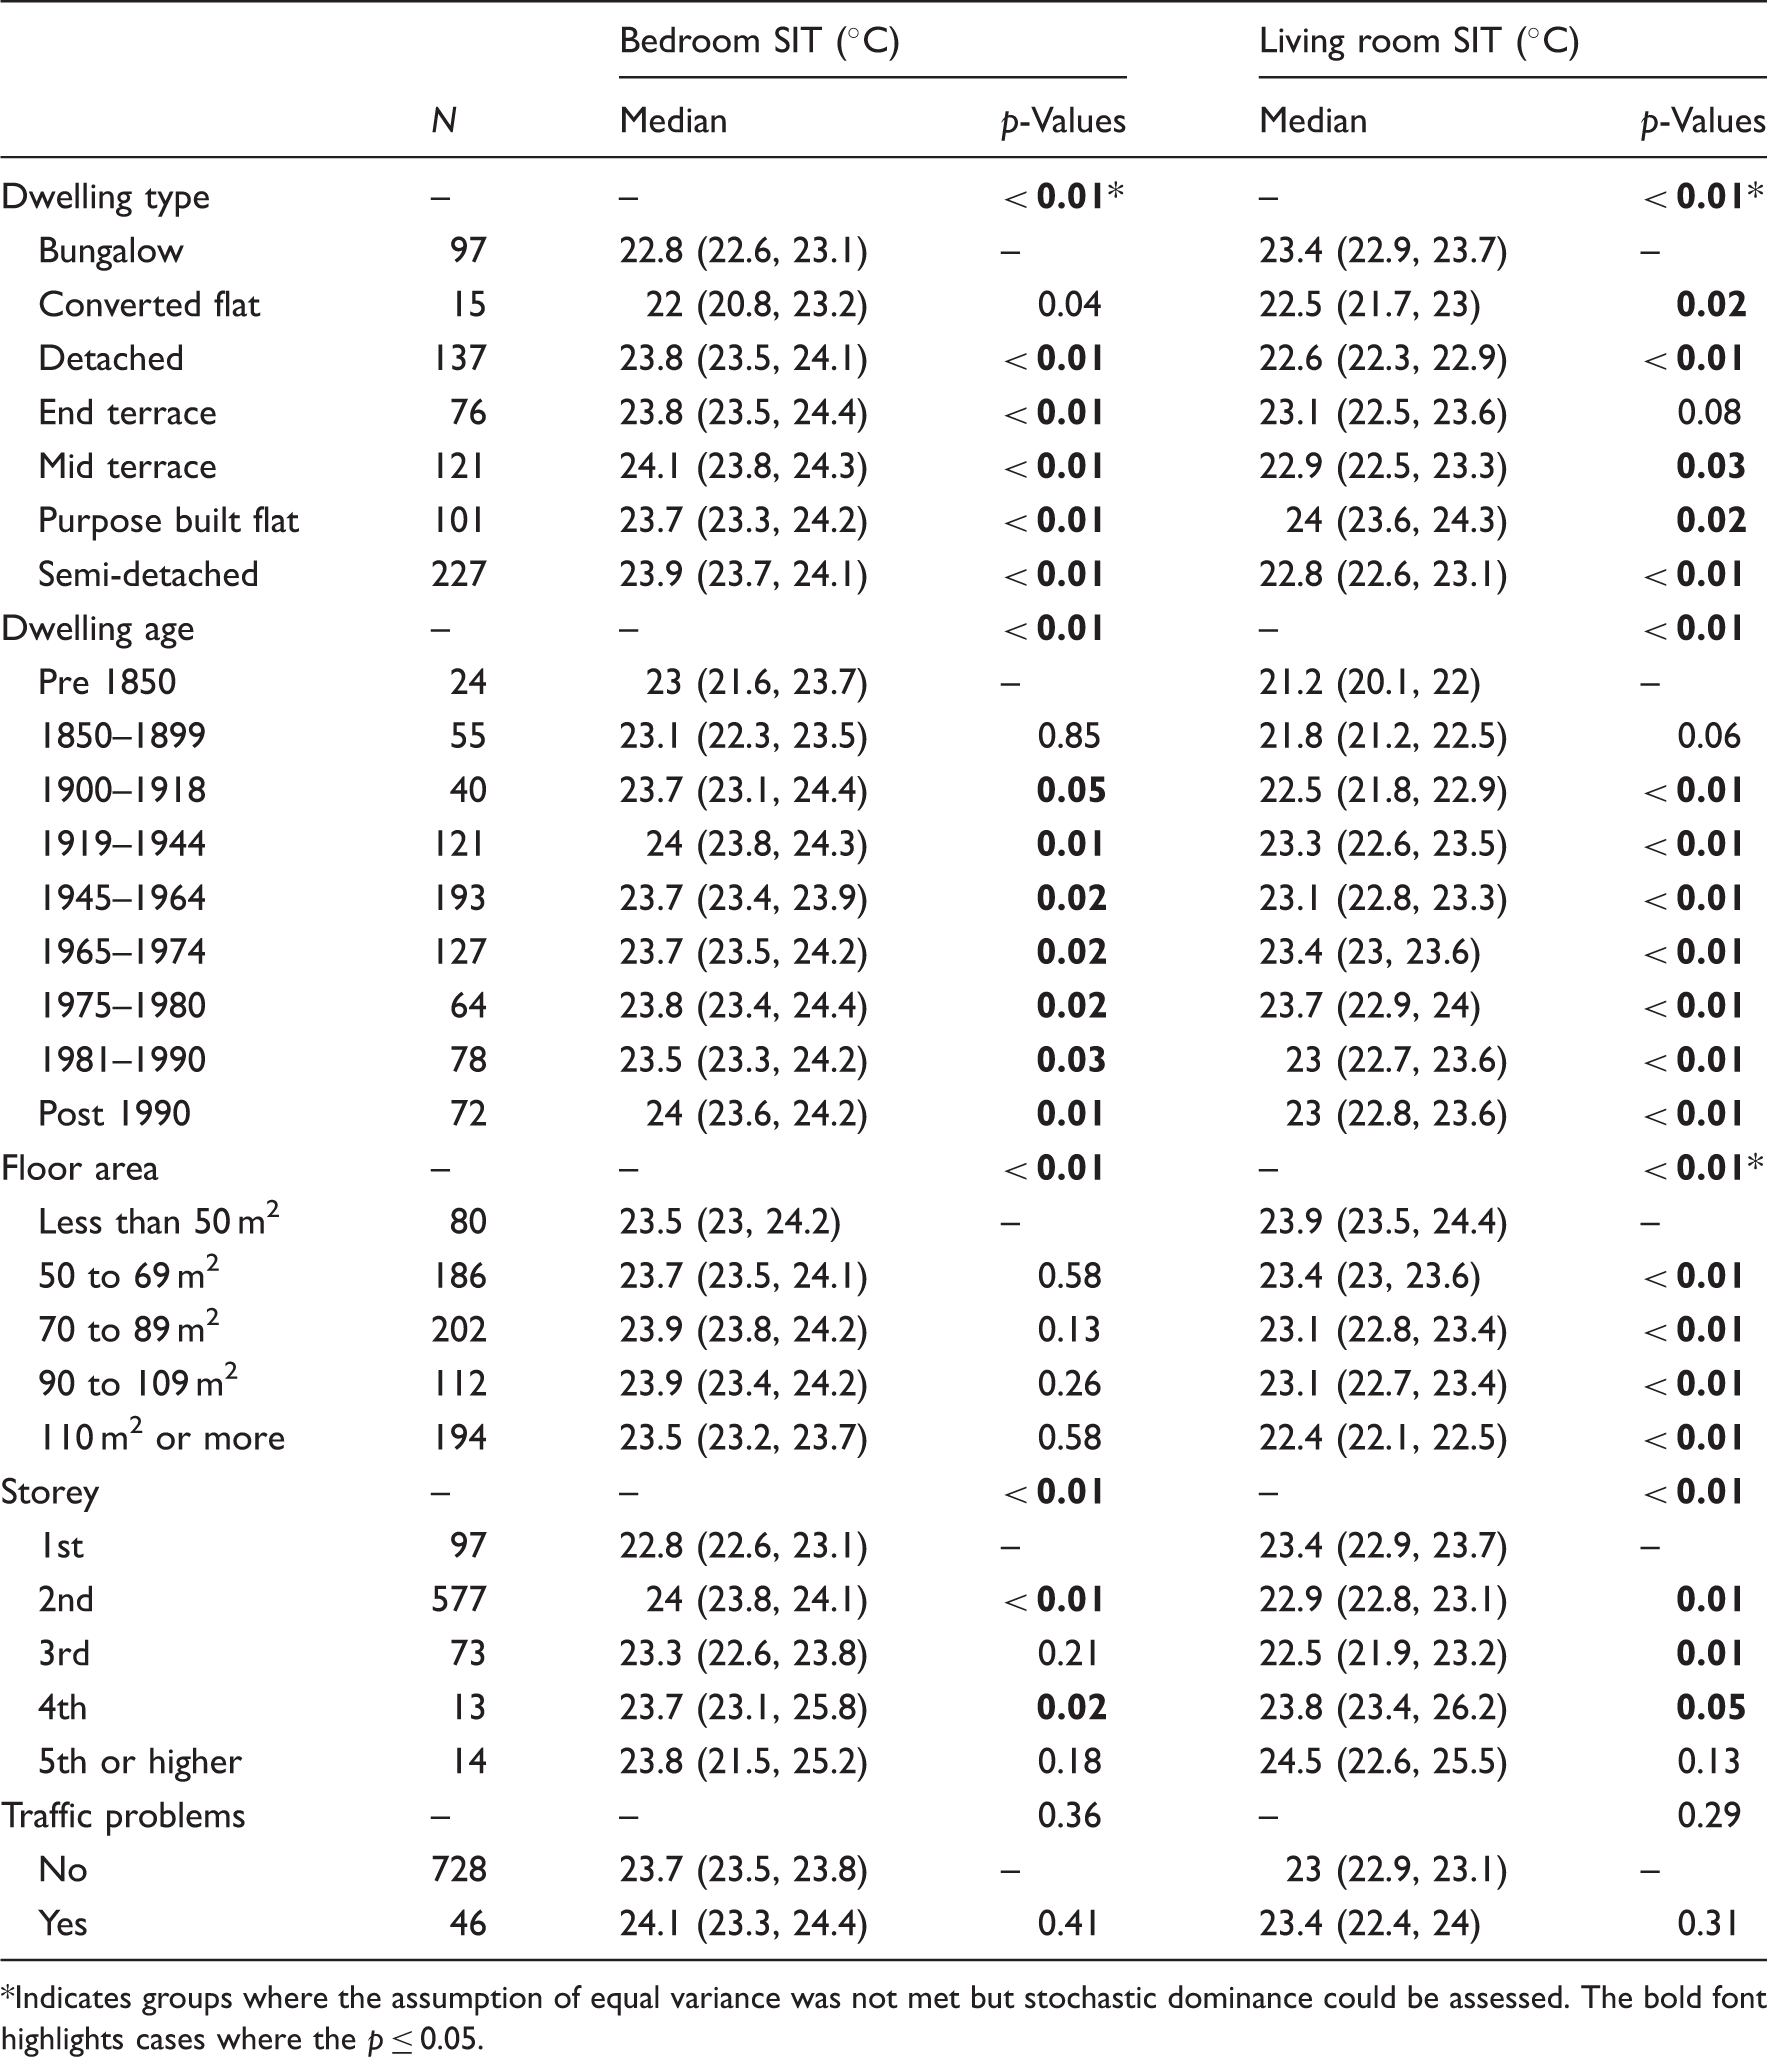
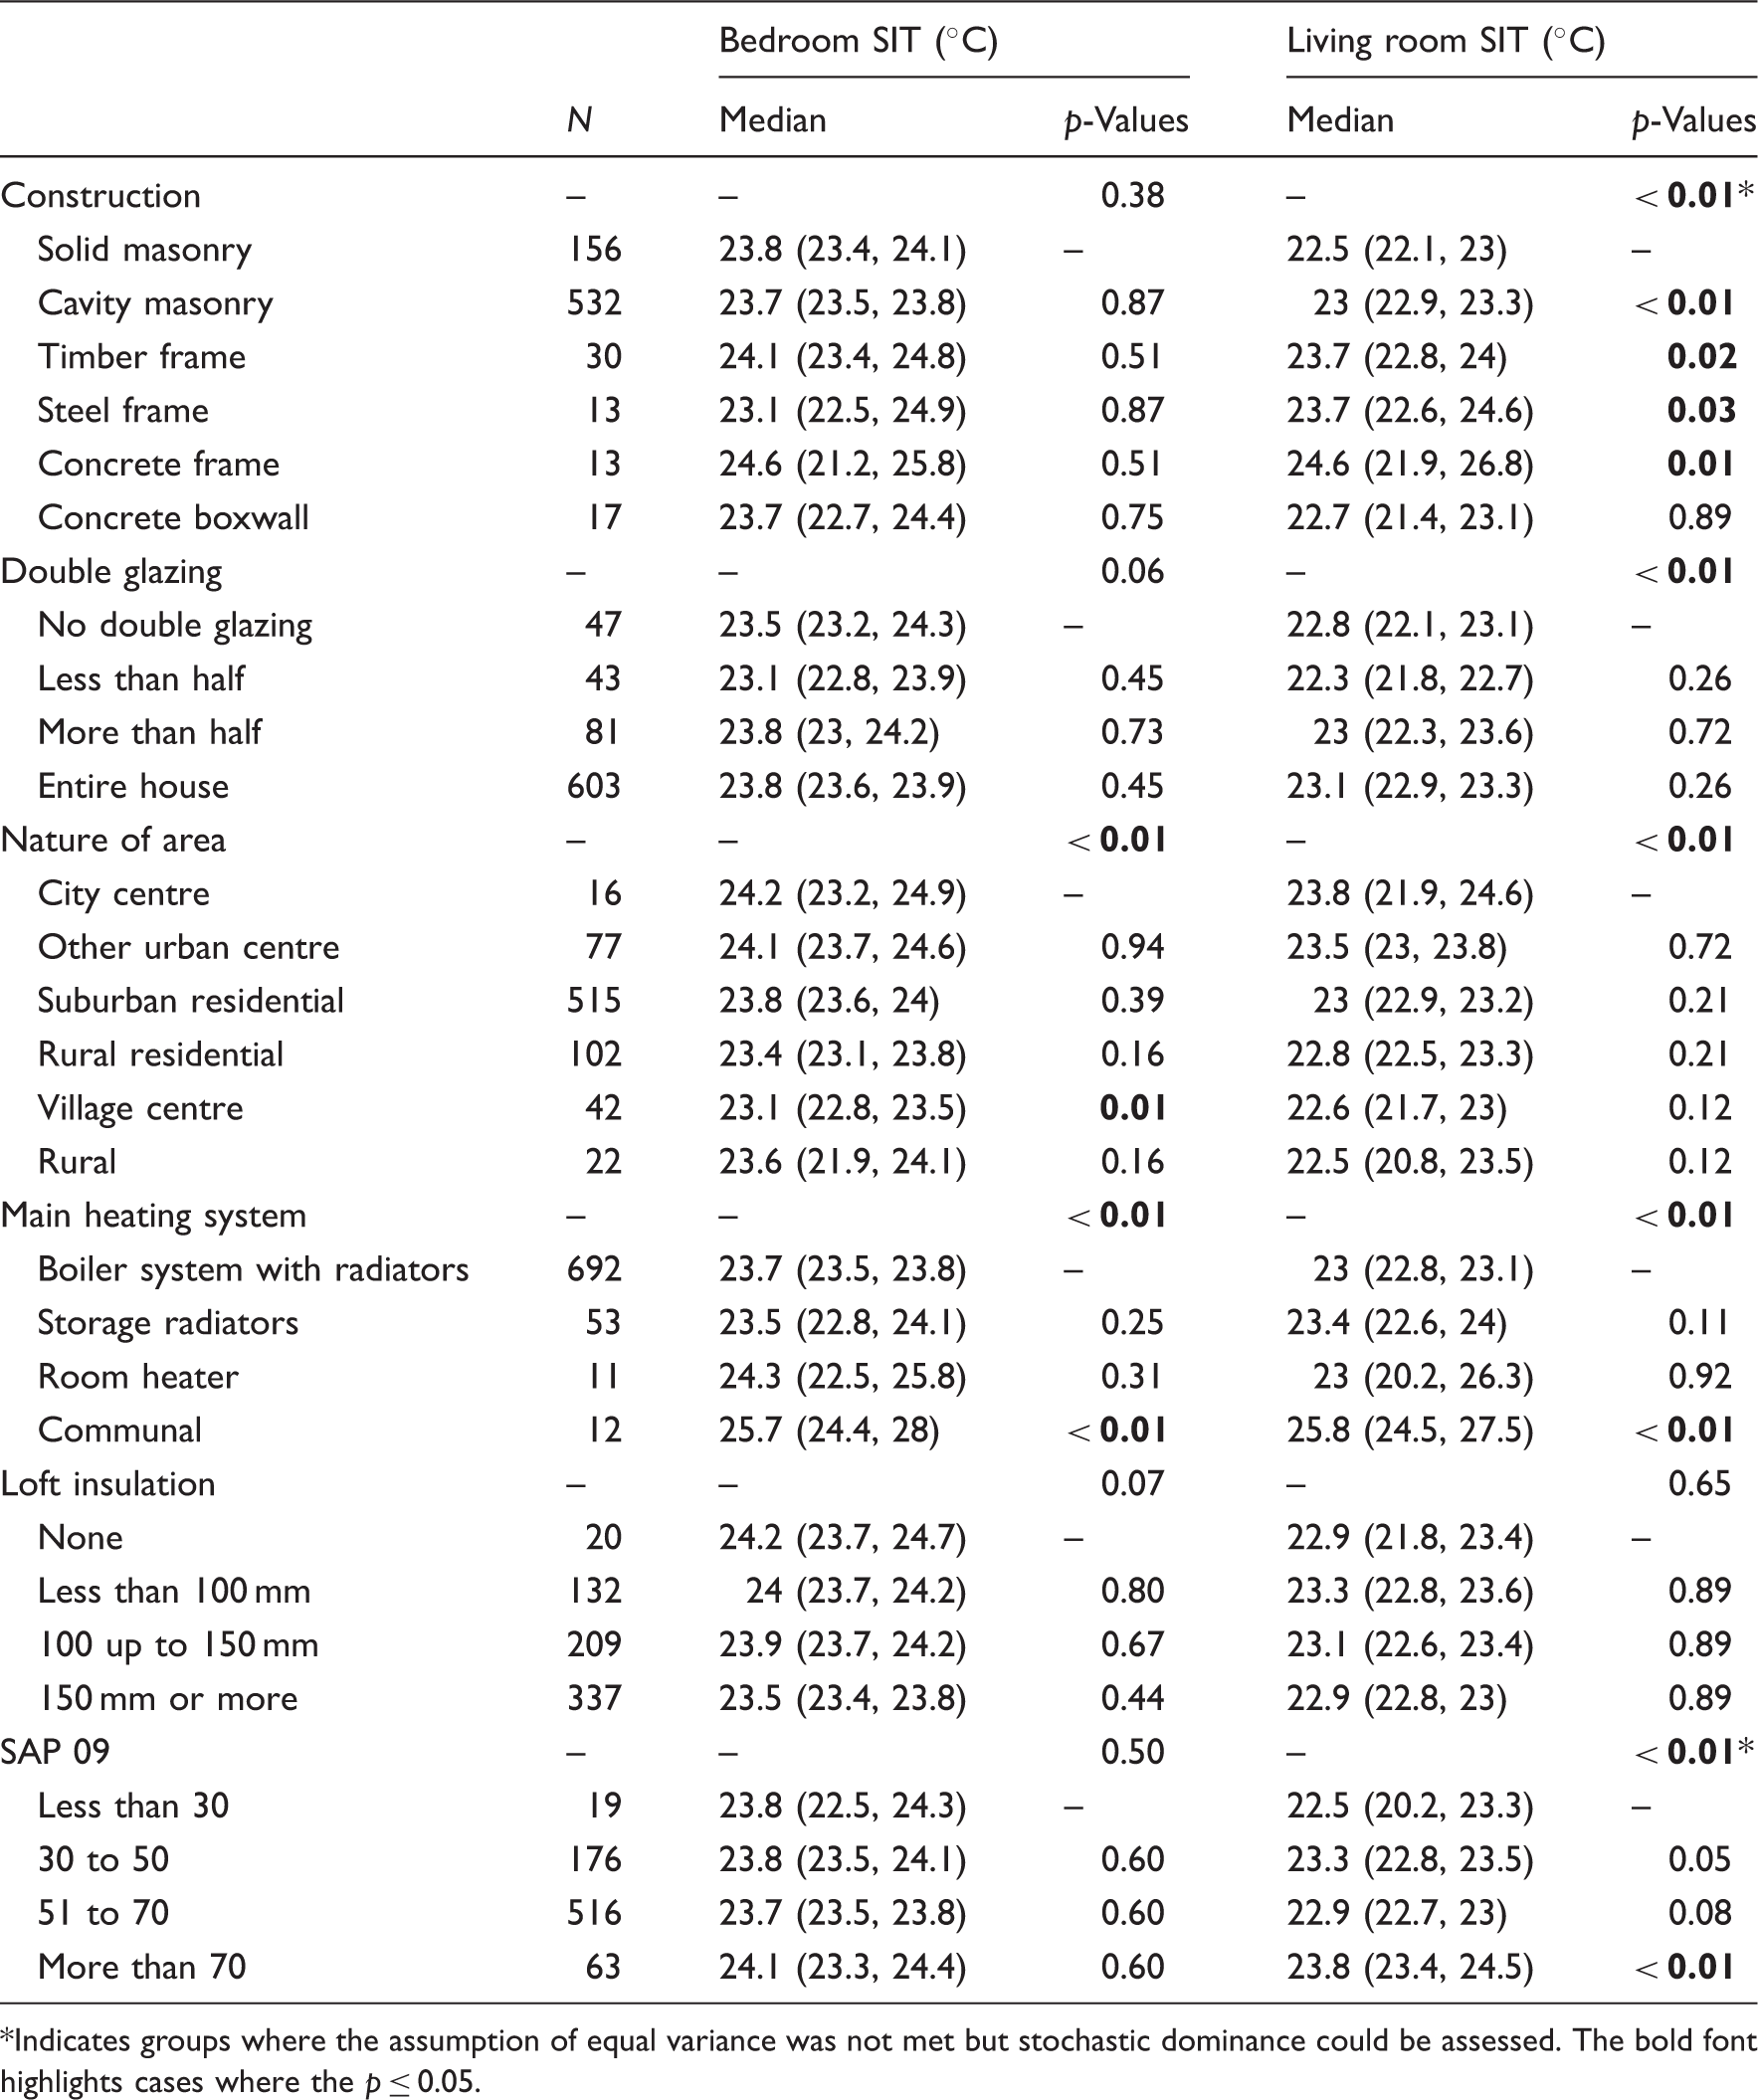
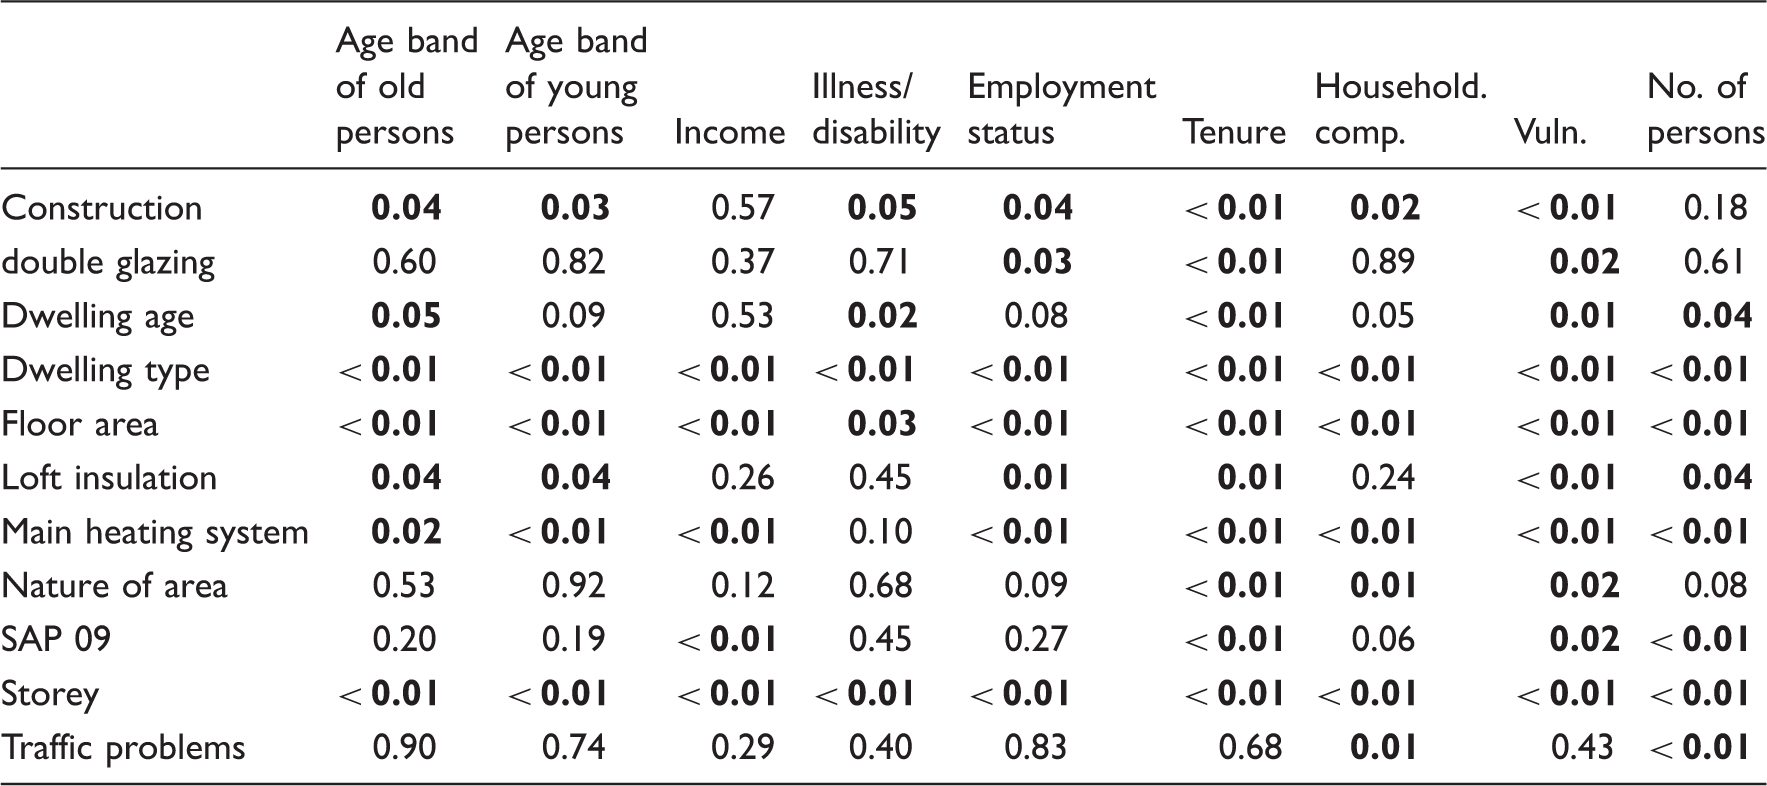
Box plots of standardised indoor bedroom and living room temperatures. The whiskers represent the 5th and 95th percentile. Outliers were masked for data privacy reasons. * on p-values indicates groups where the assumption of equal variance was not met but where the stochastic dominance could be assessed. Bar plots of association between floor area and household vulnerability (defined in EFUS as dwellings on means tested or certain disability benefits). Summary of the TM59 assessment results for the bedroom (B) and living room (LR) of each dwelling. Summary of the median standardised indoor temperatures (SIT), 95% confidence interval (CI) and significance test results. The p-values associated with each variable are the results of the Kruskal–Wallis test and the p-values associated with each level of the variable are the result of the pairwise Mann–Whitney U-tests. Indicates groups where the assumption of equal variance was not met but stochastic dominance could be assessed. The bold font highlights cases where the p ≤ 0.05. Summary of the median standardised indoor temperatures (SIT), 95% confidence interval (CI) and significance test results. The p-values associated with each variable are the results the Kruskal–Wallis test and the p-values associated with each level of the variable are the result of the pairwise Mann–Whitney U-tests. Summary of the median standardised indoor temperatures (SIT), 95% confidence interval (CI) and significance test results. The p-values associated with each variable are the results the Kruskal–Wallis test and the p-values associated with each level of the variable are the result of the pairwise Mann–Whitney U-tests. Indicates groups where the assumption of equal variance was not met but stochastic dominance could be assessed. The bold font highlights cases where the p ≤ 0.05. Summary of the median standardised indoor temperatures (SIT), 95% confidence interval (CI) and significance test results. The p-values associated with each variable are the results of the Kruskal–Wallis test and the p-values associated with each level of the variable are the result of the pairwise Mann–Whitney U-tests. Indicates groups where the assumption of equal variance was not met but stochastic dominance could be assessed. The bold font highlights cases where the p ≤ 0.05. Summary of the p-values of the Fisher's exact test that tests the significance of association between categorical variables. A statistically significant association is assumed for p ≤ 0.05 and is indicated by the bold font.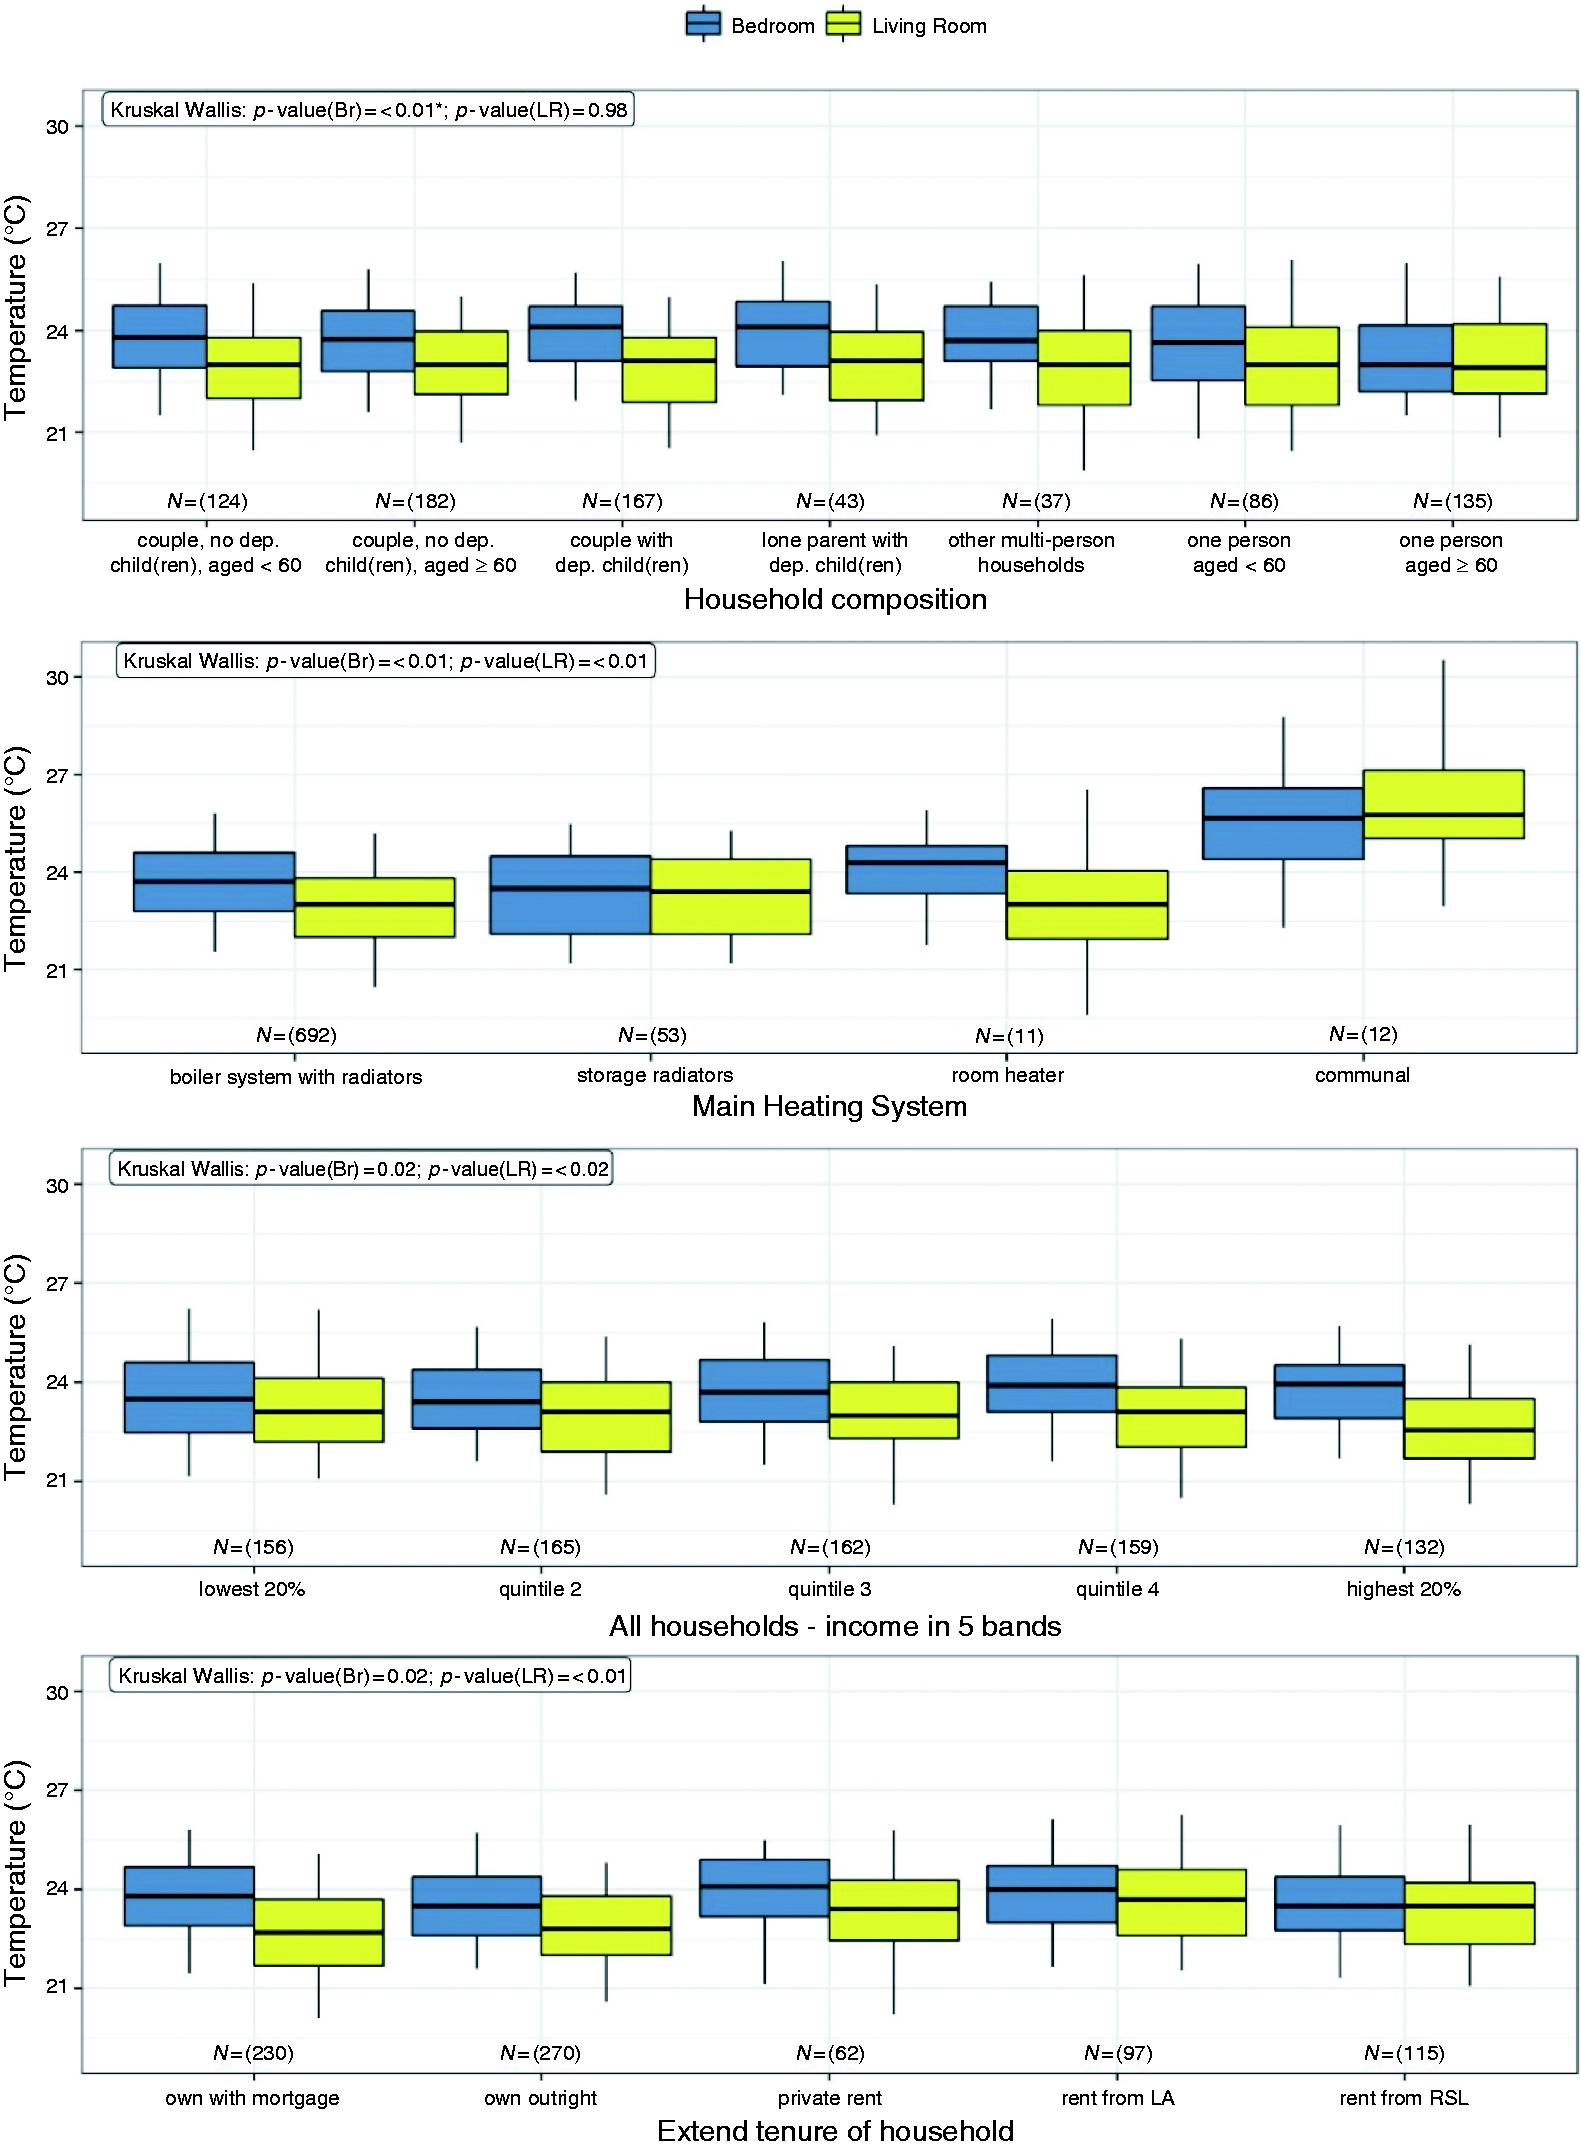
Indoor overheating assessment
A total of 20 living rooms exceeded the threshold of Criterion 1, while 178 living rooms recorded some overheating hours. A similarly small number of dwellings failed Criterion 1 for the bedroom (19), while a greater number (284) experienced some hours of overheating. The extent of indoor overheating appears to be different when Criterion 2 is used, with 204 bedrooms having exceeded the static threshold. As part of the interviews conducted during EFUS, the occupants were asked whether they find it difficult to keep the bedroom cool. From a total number of 61 who responded positively, 29 were found to exceed the Criterion 2 threshold, 21 had some hours of overheating recorded while 11 had no hours recorded. The agreement between predicted and stated indoor overheating was lower when looking at Criterion 1 (the exact number is not provided to reduce the chance of identification).
Household characteristics
Tables 4 and 5 summarise the median and 95% confidence intervals (CI) of the SIT for each household characteristic. The associated p-values indicate whether a statistically significant difference (if p ≤ 0.05) exists. For household composition, there was no significant difference in the living room, with the median SIT lying within a range of 0.2℃. On the contrary, the bedroom median SIT deviated significantly, with the value for a single occupant aged 60 or over being at 23℃ (CI (22.7, 23.4)℃), 1.1℃ lower than the maximum median bedroom SIT observed for this variable. The number of people in the household was significant only in relation to the bedroom SIT, with the median values generally increasing with the number of people. An association may exist between the SIT and the age band of the youngest and oldest occupant, as the older age bands experienced lower temperatures than the younger age bands. Households with no one working or one or more retiree had a lower median bedroom SIT than any other category under the employment status variable. A statistically significant effect was also observed for the household's tenure with regard to both the bedroom and living room SIT, with the living rooms of homes rented from a local authority being up to 1℃ warmer than homes owned with mortgage or outright (Figure 3). Households that might be considered vulnerable (by being on means tested or certain disability benefits) or where someone suffers from an illness or disability (but does not necessarily receive any benefits) had statistically higher median living room SIT. Statistically significant and opposite trends were observed for the income bands; the bedroom median SIT was slightly greater for higher income bands, while the opposite was true for the living room SIT.
Dwelling characteristics
A summary of the median SIT and 95% CI for the dwelling characteristics along with the associated p-values is provided in Tables 6 and 7. Dwelling type and age, floor area, storey, construction and main heating system all appeared to have a statistically significant association with the SIT. Bungalows and converted flats had the lowest median SIT, while mid-terraced had the highest median bedroom SIT with 24.1℃ (CI (23.8, 24.3)℃) and purpose-built flats the highest median living room SIT with 24℃ (CI (23.6, 24.3)℃). Pre-1900 dwellings were overall cooler than post-1900 homes while the floor area of dwellings appeared to have a negative correlation with the median living room temperature. Storey was an important factor although the effect of increasing temperature with storey was greater for the living room than for the bedroom. The median SIT of dwellings with communal heating was 2℃ higher for the bedroom and 2.8℃ for the living room (Figure 3) compared to the more common gas boiler. Significant differences were also discovered for the terrain type, with urban dwellings being the warmest. The traffic problems variable was assumed to be a possible indication of local noise or air pollution that could deter occupants from keeping their windows open. However, it is also likely that dwellings whose occupants expressed traffic problems were located near the centre of the Urban Heat Island effect that is not captured by this analysis. Although a statistically significant result was not observed, occupants that were influenced by traffic problems had a median temperature 0.4℃ greater than the ones that did not experience traffic problems. A pattern of decreasing median bedroom SIT was observed with increased levels of loft insulation although no such pattern exists for the living room. The SIT was significantly different for different SAP ratings only in the living room; however, the median SIT was the highest in either room for a SAP rating > 70.
Correlations between dwelling and household variables
Prior to any causation being attributed to individual variables analysed in Tables 4 to 7, any correlation between variables should be explored. Table 8 provides a matrix of p-values resulting from the Fisher's exact test with the null hypothesis of independent variables. By assessing the association of dwelling characteristics against household characteristics, a statistically significant association was obtained for each variable with at least one other variable. A further investigation in the suggested relationship between household vulnerability and floor area is displayed in Figure 4. With increased floor area, the percentage (and probability) of a dwelling's occupants being classified as vulnerable decreased.
Discussion
Using the criteria defined within the methods section, approximately 2.5% of the 795 living rooms and 799 bedrooms failed Criterion 1, and 26% failed Criterion 2. These results were not in full agreement with the stated thermal discomfort of the occupants. Although the interviews did not necessarily take place during the summer and could, thus, be influenced by factors such as recall bias, the discrepancies between overheating criteria and stated thermal discomfort resemble previous findings. 32 The large (175) number of dwellings that failed Criterion 2 while their occupants did not report thermal discomfort may provide further evidence of support to the ongoing discussion on the strictness of the 26℃ threshold. 25 However, most dwellings that reported thermal discomfort in the bedroom did not exceed the threshold (32 of 61). As the summer of 2011 was relatively cool, with a mean summer (June–August) temperature across England of 14.8℃ (0.7℃ lower than the 1981–2010 average 47 ) it could be hypothesised that a large percentage of English dwellings would fail Criterion 2 with the projected increase in summer temperatures. 3
The analysis of household and dwelling characteristics generally confirmed the observations of previous studies26,27,30 and highlighted the differences between bedrooms and living rooms. As an example, increased levels of loft insulation appear to reduce indoor temperatures in bedrooms but have no clear effect on the living room. This is likely due to bedrooms being more frequently located directly under the roof and hence influenced more by the heat transfer through that surface. Thus, adding thermal insulation to a dwelling's loft may only reduce indoor overheating risk for the top-floor rooms. The living room SIT of dwellings rented from RSL or LA is significantly higher, in partial agreement with Hulme et al. 34 A SAP rating > 70 was also associated with significantly higher living room SIT, resonating with the concerns of the unintended consequences of energy efficiency.15,48 The dwelling age, type, floor area and height were also statistically significant for both rooms in agreement with previous monitoring campaigns.30,33 The number of occupants and household composition had a strong influence on the bedroom temperatures but not on the living room. In agreement with Hulme et al., 34 simply the presence of young children and adults (indicated by the age band variables) was associated with greater bedroom temperatures. Households with occupants that are on means tested or other benefits also had statistically higher temperatures in the living room but lower in the bedroom. The choice of main heating system could be a key factor for indoor overheating risk, as dwellings with communal heating had a significantly greater indoor temperature in both rooms compared to dwellings with any other heating system. Although the sample size of dwellings with communal heating was small and the possibility of confounding variables exists, this result reinforces the importance of careful planning when designing and implementing communal heating systems. 49
The multiple correlations between household and dwelling characteristics and the further investigation of the floor area and vulnerability association demonstrate the complexity of the indoor overheating problem. As the floor area increased, the living room SIT decreased. If considered independently, this might be expected since given the same solar and internal gains, a smaller room will reach a higher internal temperature. Another observation was that the median living room SIT of vulnerable occupants (on means tested or other disability benefits) was higher than that of non-vulnerable occupants. A plausible explanation is that individuals with disabilities may spend more time at home, resulting in increased internal gains and their limited mobility may lead to reduced ventilation. 27 However, it was also observed that as the floor area decreased, there was an increased probability of an occupant being classified as vulnerable. If a reasonable explanation for the differences in temperature could be provided for either variable, which one is correct? It is expected that both factors and many more contribute to the observed differences and causation should be attributed with caution.
Limitations
At the pre-processing stage, some data were eliminated on the base of faulty or misplaced loggers. However, it is possible that certain erroneous data remained within the analysed dataset. Furthermore, uncertainties may also arise from the answers provided during the interview and survey stage.
Although local weather data were used, they did not necessarily represent the ambient weather conditions at the exact location of each dwelling. This is especially true for dwellings located in urban areas, as the weather data may not effectively capture the influence of the urban heat island effect or the local microclimate. 50
Performing the Kruskal–Wallis test at a significance level of 5% suggests that the null hypothesis may falsely be rejected (type I error) in 5% of the cases.45,51 Readers are thus advised to look at both statistical tests conducted, and the associated median SIT values provided for each variable.
The dataset analysed is the largest recent one that is currently available. Although weight factors for four variables (GOR, tenure, dwelling type and household working status) were provided to enable EFUS to be a broadly representative study of the English housing stock, the numerous other variables that could influence indoor temperatures limit the generalisability of this study's results. Finally, the correlation established between variables does not, of course, imply causation and conclusions should be drawn from this work with caution.
Implications
The discrepancy between the occupants' stated thermal discomfort and the criteria-based overheating prediction may highlight the need to refine the thresholds for in-use studies within the industry. However, given the potential uncertainties resulting from the interview process, further evidence is required to support this action. As there are many factors that might influence the summer indoor temperatures, the use of dynamic building thermal simulations as suggested in TM5920 may indeed enable a better prediction of the indoor environment provided concerns regarding these tools and their inputs are addressed.52,53
Further academic work is required to address the complexity of the indoor overheating problem, especially for household and occupancy-related factors. Research on understanding the reasons behinds any significant results observed during this study, possibly through a mixture of detailed monitoring and further interviews will be greatly informative. In addition, refining the overheating criteria requires further work in defining domestic overheating in terms of temperature and potentially other variables.
In agreement with previous studies, the occurrence of indoor overheating in the existing housing stock even during a mild summer, 28 in conjunction with the finding that indoor temperatures were highest for dwellings with a SAP rating > 7034 (possibly a consequence of increased fabric thermal insulation and airtighness15,48), reinforce the concerns regarding the current lack of indoor overheating assessment within the approved documents for the Building Regulations at the refurbishment stage and the limited guidance for new builds. With a warming climate, an ageing population and the subgroup of dwellings with the highest SAP rating being the warmest, the need to act is clear. Otherwise, alongside the risks to health, mechanical cooling is more likely to be widely adopted, 54 increasing the summer energy demand and associated carbon emissions.
Conclusions
The indoor overheating risk according to the criteria defined within Technical Memorandum 59 was estimated for the largest recent dataset currently available – the ‘Energy Follow Up Survey’. Although the prevalence of indoor overheating according to Criterion 1 was low, with only 2.5% of dwellings exceeding the threshold, almost 26% of dwellings failed Criterion 2, even during a relatively cool summer. Therefore, if these criteria were to be used for in-use assessments and with the projected increase in outdoor temperatures associated with climate change, a large percentage of dwellings will exceed the Criterion 2 threshold in the future.
By regressing the monitored indoor temperatures against the external weather conditions, the bedroom and living room temperatures were standardised to explore their correlation with the nine household and eleven dwelling characteristics. The bedroom standardised indoor temperatures were highest for the mid-terraced houses (24.1 (CI: 23.8, 24.3)℃) and the living room temperatures were highest for purpose-built flats (24 (CI: 23.6, 24.3)℃). The median living room temperature decreased with increased floor area, while the presence of children was associated with higher bedroom temperatures and so was the presence of occupants on means tested or certain disability benefits. Dwellings with SAP rating > 70 were the warmest, providing further support for the need of an indoor overheating assessment at the building design and refurbishment stage.
Importantly, multiple correlations between household and dwelling variables were also revealed. For example, with increased floor area, the likelihood of a dwelling's occupants being classified as vulnerable decreases. Therefore, drawing conclusions directly from individual variables should be approached with caution while further work is required to disentangle the complex relationships identified.
Footnotes
Acknowledgements
This work would not be possible without the provision of data from the Building Research Establishment, Department of Energy and Climate Change (now Department of Business, Energy & Industrial Strategy) and Department for Communities and Local Government (now Ministry of Housing, Communities & Local Government). We would also like to thank the UK Data Service that stores and protects the data used within this work.
Declaration of conflicting interests
The author(s) declared no potential conflicts of interest with respect to the research, authorship, and/or publication of this article.
Funding
The author(s) disclosed receipt of the following financial support for the research, authorship, and/or publication of this article: This research was made possible by support from the EPSRC Centre for Doctoral Training in energy Demand (LoLo), grant numbers EP/L0157X/1 and EP/H009612/1, the Chartered Institution of Building Services Engineers. In addition, this work was also supported by the National Institute for Health Research Health Protection Research Unit (NIHR HPRU) (HPRU-2012-10016) in Environmental Change and Health at the London School of Hygiene and Tropical Medicine in partnership with Public Health England (PHE), and in collaboration with the University of Exeter, University College London, and the Met Office. This work was also partly funded by the Wellcome Trust for the ‘Complex Urban Systems for Sustainability and Health’ (CUSSH) project, award codes 205207/Z/16/Z and 209387/Z/17/Z.