
Abstract
There are over 70 low energy and carbon standards in use around the world. None of these standards have been designed by the clients who pay for and occupy the buildings in question. In this work, the client was asked to define the building code for the construction of a new 2800 m2 building via a structured survey. The resulting zero-energy standard simply required the building to incur no energy utility bill. One year of monitoring of the completed building was used to see if the standard had been met. The result of this work is a new way of thinking about environmental building standards that solves many of the issues of obtaining and maintaining buy-in from the client.
Introduction
There are many low- and zero-energy and carbon building standards in use around the world. They all have the common aim of reducing the environmental impact of buildings, particularly from the perspective of energy consumption in use. Most of these standards have developed over time with the input of construction industry professionals and experts, and while some are optional, others form part of national legislation which governments use to set minimum standards. There are subtle differences between these standards, for example what elements should be included in the determination of a building's energy demand and whether or not off-site renewable energy production can be used to offset this demand. The design of a building aiming to comply with one particular standard may be quite different to that pursuing an alternative standard, although both may be described as zero-energy or zero-carbon. Where a client wishes to commission a low- or zero-energy/carbon building, and has the freedom to choose between standards, it may be difficult for them to comprehend the implications of the differences between such standards and the resulting impact on the design of the building. There is strong potential for a client to end up with a building that does not perform as they expect it to, even though it is deemed to comply with a low-/zero-energy/carbon standard. Given the levels of detail involved, this is particularly likely to be the case where an expert-devised standard is used to provide a building for a non-expert client. An alternative approach which could help align the building's performance with the client's expectations may be to allow the client themselves to have some input into the definition of the low-/zero-energy/carbon building standard with which their building should comply. This will not only allow them a sense of ownership over the building standard, but will also encourage them to understand how the building is designed to work in order to comply with the standard.
This paper examines how a team faced with the challenge of building a zero-energy/carbon building might proceed in a logical way. It starts with a discussion about the various low- and zero-energy/carbon standards currently promoted across the world, and uses this to highlight the complexity any client might face when trying to commission a low- or zero-energy/carbon building. It then presents a new way of developing such a standard, and the approach is applied to the construction of a building. Finally, results from a year's monitoring of the building are presented.
A brief review of low- and zero-energy standards
The world of low-/zero-energy/carbon standards is a confusing and complex one full of surprises and pitfalls through which a design team or client must navigate. Often key terms lack transparency, or the methodology can lead to unforeseen consequences when applied within a design environment. For example, the European Energy Performance of Buildings Directive (EPBD) requires that any new building built after 2020 should be ‘nearly zero-energy’. This is defined as a building that has a ‘very high’ energy performance, and where the ‘nearly zero’ or ‘very low’ amount of energy required should be covered to ‘a very significant extent’ by energy from renewable sources which may be on-site or ‘nearby’. 1 To facilitate transition to nearly zero-energy buildings (ZEBs), during the period leading up to 2021, the EPBD specifies the identification by Member States of a cost optimal level of building performance for use as national benchmarks. The methodology used to calculate this level, for different categories of building, is based on the economic lifecycle trade-off between energy-related investment costs (including maintenance and operation) and the resultant energy savings and earnings from renewable energy production. In order to demonstrate either achievement of nearly zero-energy status or compliance with cost optimal performance levels, it will be necessary to be able to predict and possibly measure the energy performance of the building as well as any relevant renewable energy generation. However, finding a transparent means to do this is far from straightforward. Indeed, the method with which a building is assessed has major implications for the form of building that is delivered. For example, in the UK where CO2 emissions is the metric, a building that uses electric heating and is connected to the grid will look like it performs less well than a building which has the same heating load but relies on gas. This is because, in the UK, the requirement is that electricity use is converted to carbon using the standard UK emission factor of 0.519 kg CO2 per kWh even if the building is equipped with enough photovoltaics (PV) to meet its annual demand. By comparison, the emission factor for mains gas is 0.216 kg CO2 per kWh. 2 Rather than the final metric describing the efficiency with which a building uses energy, the differentiation between the buildings is based to a large extent on the existence of the grid connection.
In addition, with the intended decarbonisation of the electricity grid in the UK, 3 the relative performance of these two buildings, as calculated in future, will change dramatically. This begs the question, should today's emission factor, or predictions of that of the future, be used when calculating whole-life carbon emissions?
The use of CO2 emissions factors is only one example where the methodology lying behind a zero-carbon/energy standard has a substantial impact on the final building. Equally important are questions such as: How to define the energy demand and calculate it? What energy balance period is seen as appropriate? How to calculate offsets in the energy balance calculation? Whether embodied energy (EE) is to be considered or not?
Defining energy demand
As part of a report for the European Commission,
4
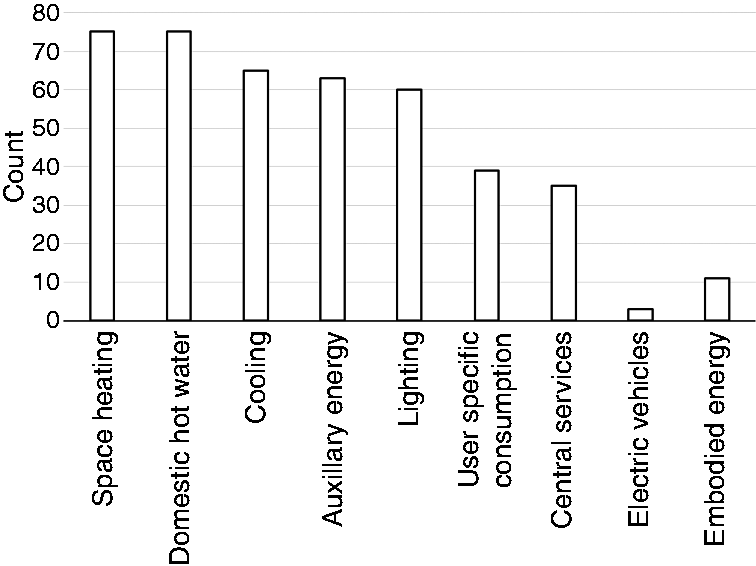
a review of international literature on the subject identifies 75 different definitions for nearly ZEBs, and demonstrates the lack of consistency with which these definitions approach calculating the total energy demand (see Figure 1). While the charging of electric vehicles is not currently common practice and may be reasonably ignored in the general assessment of a building's energy consumption, EE for example does play a significant role
5
and overlooking its contribution may be less easily justified.
The number of nearly zero-energy building calculation methodologies that include certain forms of energy demand. Data from Hermelink et al.
4
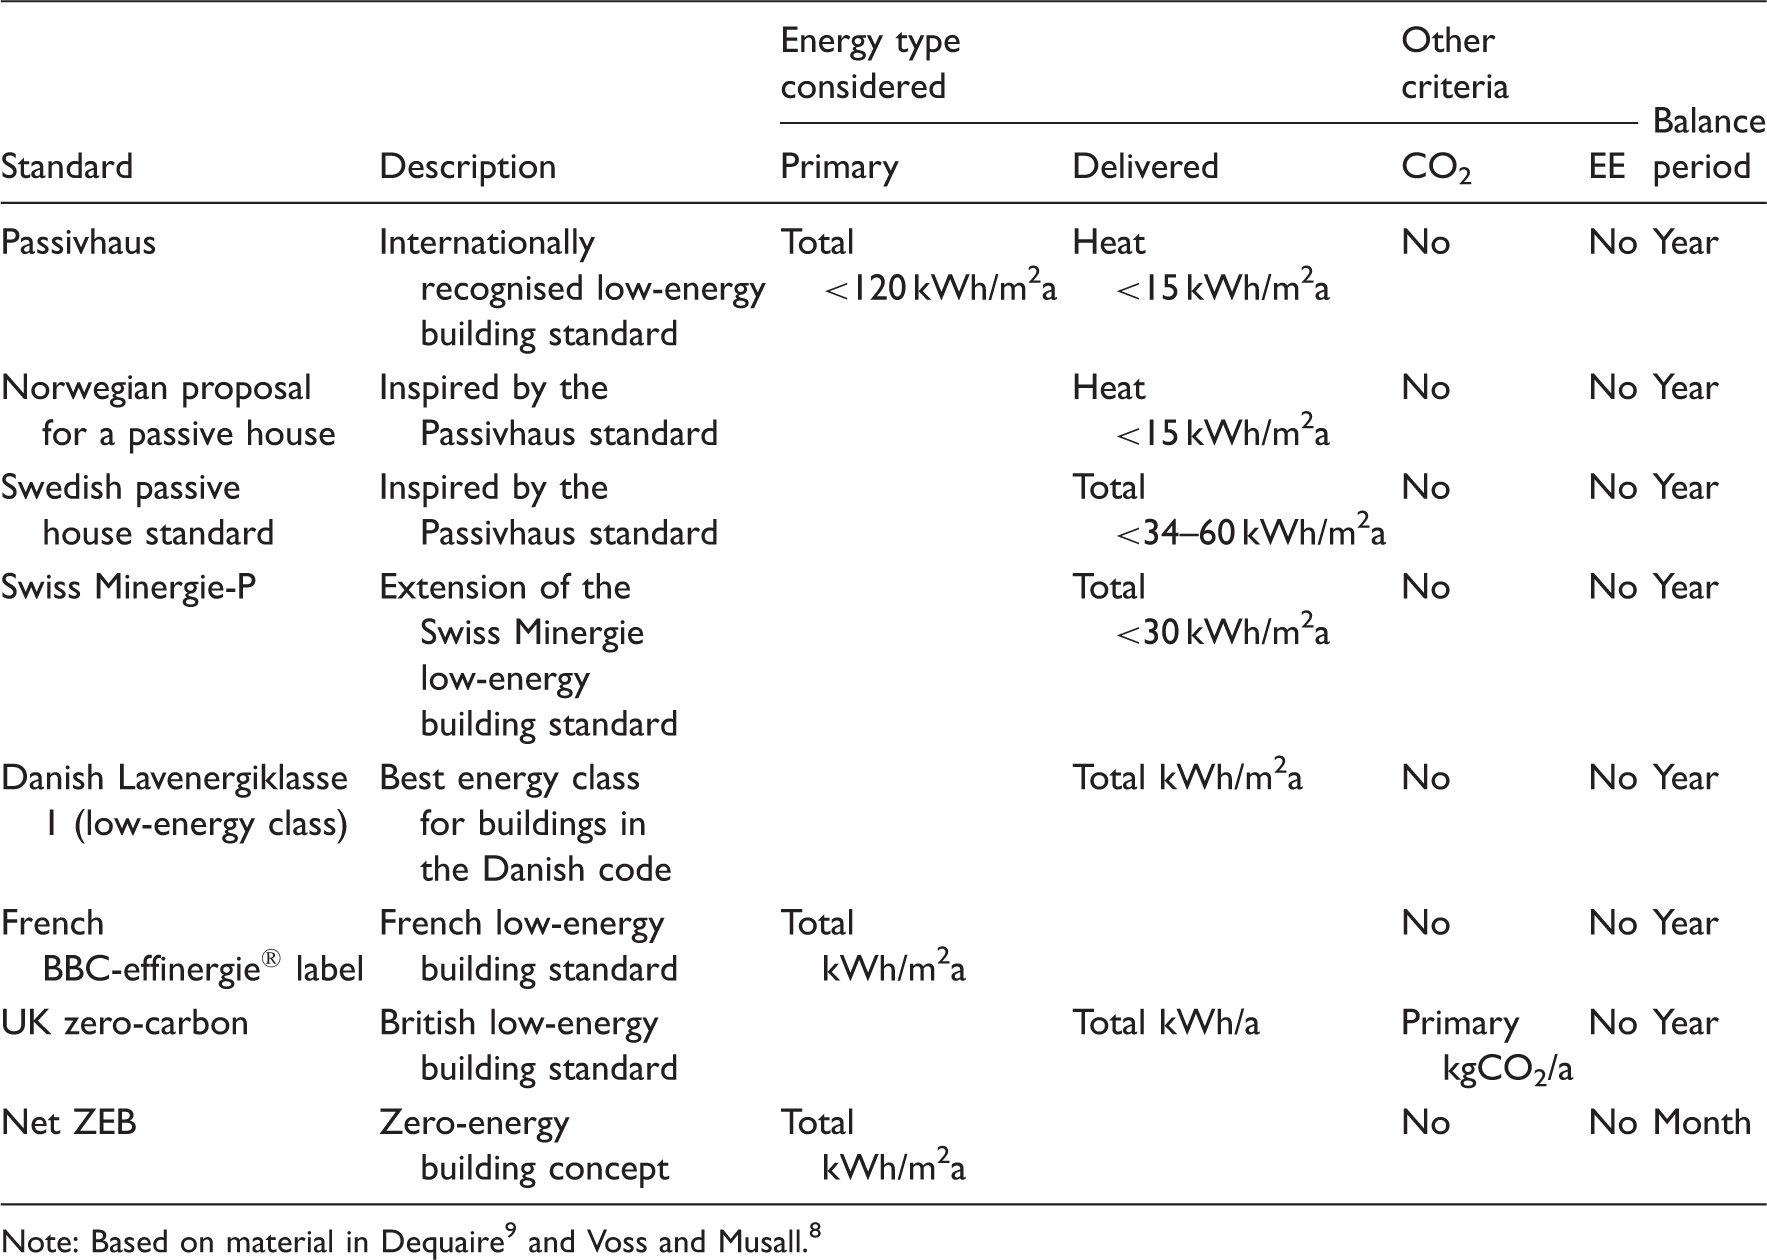
Metrics used in the definition of a sub-set of European low-energy building standards.
The energy balance period
The design of a building may allow it to produce energy equivalent to, or even exceeding, its demand. However, it is usually the case that demand and production do not match all the time, and the building will import or export energy at certain times of the day or year. A net ZEB is defined as an energy-efficient building that, within its annual balance sum, covers its entire annual primary energy demand in connection to the electrical grid and further grids if required, based on a monthly balance via primary energy credits for surplus energy feed-in.
8
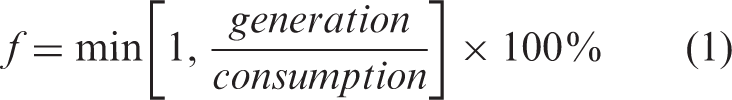
The 12 monthly factors are then averaged over the year. Under the net ZEB rules the load-match factor can never be greater than one (100%), and any surplus energy is considered separately. 8 The aim is to encourage the design of buildings and renewable energy technologies where energy demand and production correspond temporally, at least when measured on a monthly cycle. This is in contrast to the situation where a large amount of energy is exported to the grid at a time when the building does not require much energy and production is high (for example from roof-mounted PV in summer) which is offset by an equal amount of energy drawn from the grid at a different time (for example in winter). Assessing the load-match on a monthly basis is advocated as it allows the demand on grid storage, with its consequent CO2 emissions usually hidden in annual demand/generation calculations, to be better appreciated. This mechanism still does not determine with any accuracy the true level of demand from the grid, as total monthly generation and consumption are being compared, but it helps to demonstrate the seasonal variation in dependency of the building on the grid. Where demand can be better covered by self-generation when and where required, grid effects will be less significant than where the grid is effectively used as a storage facility. This is because any excess energy ‘stored’ in the grid and ‘retrieved’ when needed incurs the normal environmental costs such as transmission losses and primary energy factors. Unless a building is truly self-sufficient, it will always rely on being able to draw some energy from the grid at times when demand for energy exceeds the renewable energy supply.
The importance of the temporal relationship between energy demand and supply has been identified. 10 A finer load-match resolution, for example on a daily, hourly or even minute-by-minute basis, would provide an even more accurate representation of the building's reliance on grid storage. However, the challenge of estimating the energy demand to such levels of detail would be significant. As mentioned above, the Living Building Challenge standard 7 overcomes this problem by using measured energy consumption data in its determination of compliance.
Offsetting demand in the energy balance
As well as identifying what should be included in the calculation of the energy demand of a building, it is also necessary to determine how this energy can be offset in calculations. This computational adjustment is necessary as most buildings are connected to some form of energy grid, and are rarely entirely self-sufficient. The simple way, and the way most frequently used in the various standards, is to balance the annual energy demand of a building against its annual renewable energy production. However, aside from the balance period complication addressed in The energy balance period, this raises the question of what should count as new and relevant renewable energy production. Energy produced by a technology attached to the building, can clearly be attributed to the building, but it may be the case that the energy for offsetting is produced by local renewable energy infrastructure that the building is connected to. There is also the need to consider what is meant by local. For example is a PV panel sited on a bike shed adjacent to the building truly part of the building, and is a wind turbine on a university campus any different than one several hundreds of miles away if both are owned by the same university? Torcellini et al. 11 describe four different ways this is tackled in ZEB standards: site energy balance; source (primary) energy balance; energy cost balance; and related energy emissions balance. These different definitions lead to the design of different buildings. The range stretches from ‘aggressive energy efficiency’ for a site energy ZEB, to the need for no energy demand savings for an off-site ZEB where the goal can be reached by simply purchasing off-site renewable energy. A similar approach is taken in the UK definition of a zero-carbon building, where some of the carbon cost of the building can be offset with ‘allowable solutions’ which may include investment in offsite renewable energy infrastructure, or payment of a carbon fee. 12 Here the building doesn't even necessarily need to be receiving the additional renewable energy to be classed as zero carbon.
Global development of zero-energy standards
The developed world, particularly the EU and the US, already has well established energy policies13,14 that have filtered down into building energy standards. National energy policies, such as building standards, play an important role in the control of energy consumption, and where strong policies are absent, growth in energy consumption and carbon emissions is evident. 15 Developing countries tend not to have comprehensive building energy policies, but there is evidence that climate change related legislation in many such countries is growing rapidly. 13 For example, China, India and South Korea are all actively pursuing pilot schemes or legislation focussed on pricing and trading carbon emissions. In the case of South Korea the government has set a target of 2025 by which time all new buildings will be zero-energy. 15
While building energy policies contribute to reduced energy consumption, many argue that these need to work in conjunction with end-user engagement in order to be as effective as anticipated. 14 In addition to consideration of the thermal envelope and passive heating and cooling strategies, human factors were also accounted for in the design of a net ZEB in China. 16 Facilities for composting and greywater treatment were incorporated to encourage the occupants to engage in environmentally conscious behaviour and reduce energy consumption and carbon emissions. As zero-energy/carbon building standards develop, more emphasis may need to be placed on factors such as occupant behaviour and wider government policies aimed at the evolution of energy infrastructure.
A new way of creating a zero-energy standard
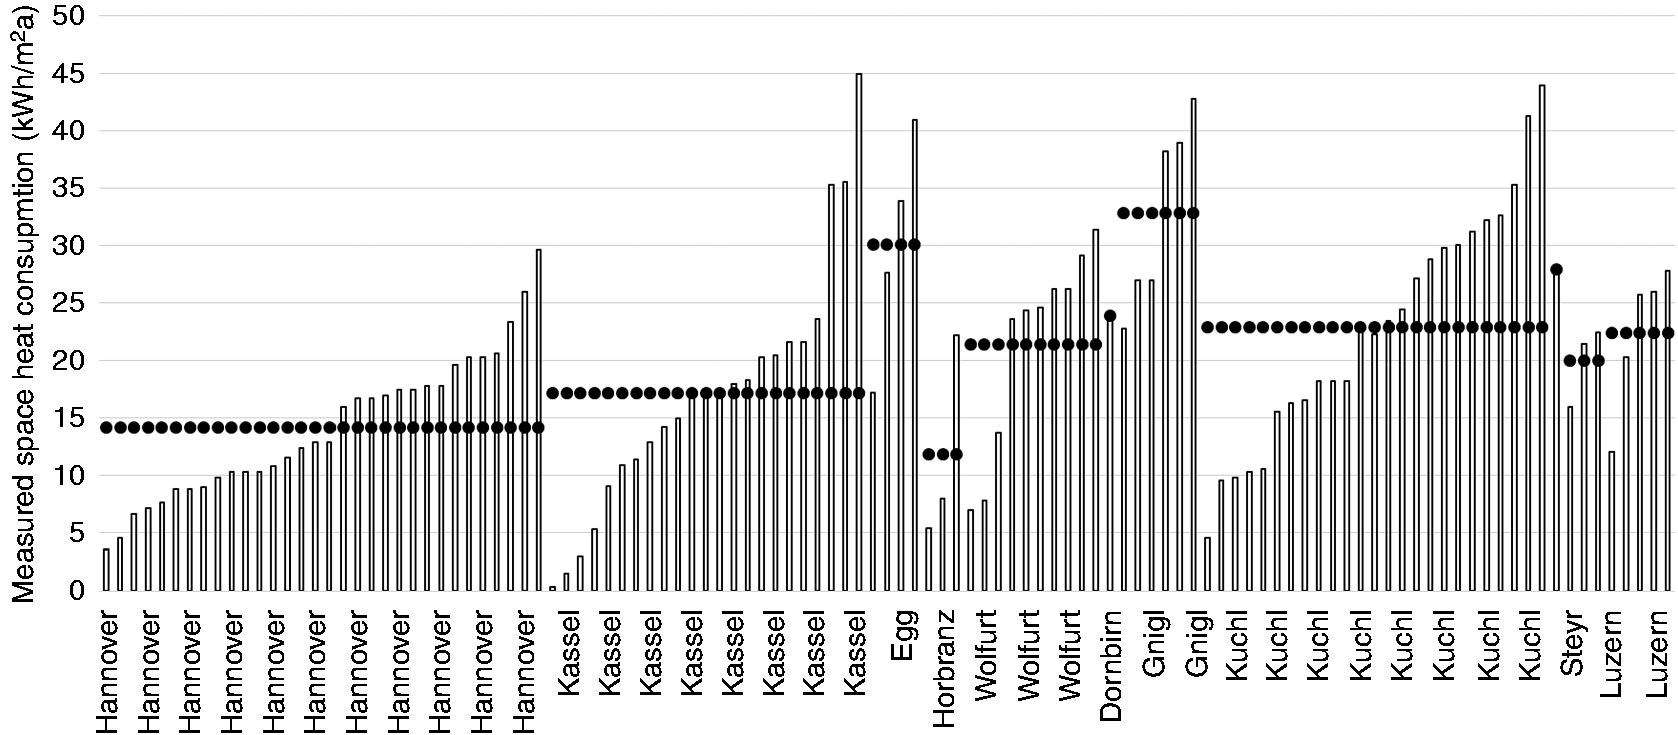
Given the plethora of possible standards and proto-standards, a design team has great flexibility in choosing a low-energy standard, but because of the inherent complexities summarised above, there is also the possibility that they will be left swimming in a sea of confusion. Additionally, there may be the need to consider the client's perspective about what is meant by a low- or zero-energy building. Most standards are in terms of intent, whereas the public think in terms of reality. To the public, a low-energy building is probably one that uses little energy in practice, not one that is designed to use little energy. Such is the scale of the performance gap that the reality is that many buildings designed to low-energy standards use no less energy than buildings constructed against normal building codes thirty or more years ago.17,18 The Passivhaus (PH) standard has an advantage in this area due to the number of buildings that have been built (>50,000) with a close match between intent and results as shown in numerous field trials, see Figure 2.
19
However, for a client that wishes to create a zero-energy rather than a low-energy building, PH creates a problem in that it does not yet include a way to account for renewables or EE. It is also a design not a performance standard.
Measured space heating consumption of various Passivhaus buildings in a series of locations. Dotted lines indicate mean consumption for each location. Data from CEPHEUS.
19
The PH standard was excluded from consideration in Hermelink's report 4 (discussed in Defining energy demand), as it was not deemed to comply with the nearly zero-energy concept. It was, however, acknowledged that heat demand is drastically reduced where the PH strategy is followed. 4 In contrast to the nearly zero-energy concept, with its focus on the energy demand/generation balance, the PH building standard concentrates on energy efficiency and sets specific maximum energy demand targets. The two PH energy limits (15 kWh/m2a heat demand, 120 kWh/m2a total primary energy demand) are deliberately set to encourage the design of buildings that use energy efficiently, 20 rather than buildings that can produce lots of energy. In response to the EPBD's requirement for renewable energy generation, the Passive House Institute recently discussed two additional categories in the PH standard. 21 The definition of these new PH levels is based on the amount of energy generated in relation to the building's footprint (e.g. kWh/m2grounda).
Given the issues and complexity identified, one logical way for a design team to select a zero-energy/carbon standard might be to simply ask the clients what their view of the term zero-energy is. For example: Is it an environmentally-driven design intent? Or do they expect to simply never receive a utility bill? Are they interested in including EE? Do they consider emissions related to the transport of those using the building over its lifetime to be relevant? Ultimately the use of standards that lead to the construction of buildings that genuinely reflect the views of clients and occupants are likely to help in ensuring the zero-energy concept gains traction and leads to mass construction of such buildings. This fits in well with the findings in Kershaw and Simm 22 where they state that: ‘It is suggested that most barriers [to low-energy design] could be overcome by improving communication between the design team, client and end users’.
Method
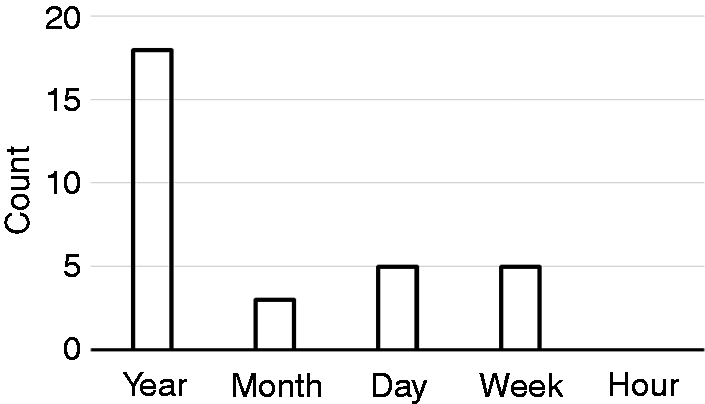
To discover if the creation of a client-led zero-energy standard was possible, practical and might ultimately lead to a successful building, a client group was identified that was about to commission a low-/zero-energy/carbon building. The proposed building was a 450 pupil school. The client group where defined as the head teacher, 16 members of teaching staff, three members of non-teaching staff, five parents and six representatives of the local authority (who were paying for the construction of the building). The architect, engineers and the construction company used on the project were not considered part of the client group. As the client group were non-expert in the field of ZEBs they were given a lecture (approximately 30 min) on climate change and UK energy policy, and a lecture (also approximately 30 min) on zero and low-energy building standards from around the world with terms such as EE and emission factor being explained. The purpose of the lectures was to inform the group about the concepts and language surrounding energy, CO2 emissions and building standards, and the different methods that can be used to achieve a ZEB. It is possible that the lectures may have influenced the client group's view on the overall value of ZEBs, however it was necessary to provide them with relevant information in order that they could meaningfully consider what a ZEB meant to them. They were then asked to anonymously complete a questionnaire designed to determine what they thought should and should not be used as criteria for the zero-energy/carbon standard used for the new building. Nineteen possible endings to the statement ‘the criteria for the definition of a zero-carbon building should …’ were presented along with a scale allowing the respondent to indicate how strongly they agreed with the criteria. The five-point scale ranged from minus 2 (strongly disagree) to plus 2 (strongly agree) with 0 expressing neutrality. The final question asked the respondent to indicate what they thought was an appropriate balance period. In order to maintain the anonymity of the respondents the completed questionnaires were analysed collectively without identifying individuals and their particular responses. Figures 3 and 4 show the results. All members of the client group completed all the questions.
Client agreement with zero-energy criteria. Mean response values shown. Interquartile range indicated by box lengths. Where outside the interquartile range, the maximum and minimum response values are indicated by horizontal line lengths. The number of client responses for the question about different potential balance periods.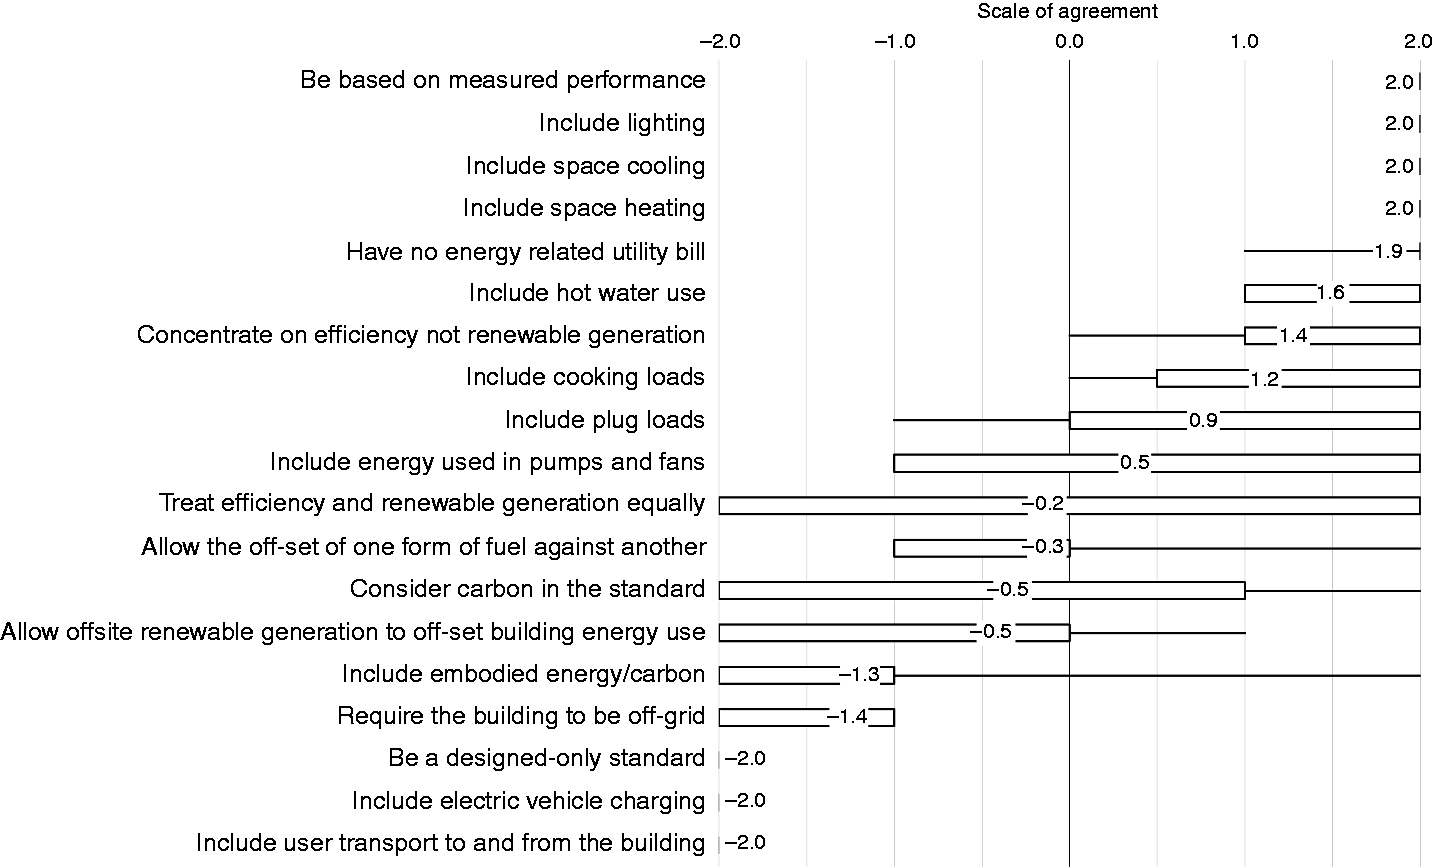
Given the results shown in Figure 3, the key lessons learnt from this exercise were that, for this client group, a zero-energy/carbon standard: is a performance not a design standard; should lead to no energy bills; and should be based on efficiency not generation. It was evident that issues like EE and transport were much less important to the client group.
After analysis of the survey results, the following definition of a zero-energy/carbon standard was presented to the client group: The building will be zero-energy in-use as defined by having no energy utility bill, and this will be a performance not a design standard.
Using the same feedback process with other client groups and sites might produce different results.
Implications
The standard created by the client group is a very simple succinct standard, especially when compared to the standards discussed above, but it left many questions about delivery unanswered. Most worrying for the design team and the builder was that it is a performance not a design standard, and, because it is related to the utility bill, left little room to manoeuver if the standard was found to not have been met once the building was constructed.
The Passivhaus concept was chosen for the basic design philosophy because of the success that Passivhaus has had in matching intent to reality (Figure 2). The standard takes an holistic approach to both the design and the construction process, and makes very specific demands such as: compulsory qualification of designers (Certified Passive House Designer/Consultant Examination); use of a single software environment (PHPP) that has been proven against post construction data; minimising the size of heat systems, so poor occupant behaviour is less likely to lead to excessive energy use; policing of the design and build (in country); and policing of the policers (back in Germany). Adopting Passivhaus can be viewed as a way of minimising risk if the client's expectation is for a ZEB with compliance judged from measured energy consumption.
After deciding upon Passivhaus as the heating/cooling energy standard, it was necessary to choose a method for the inclusion of renewables into the calculation. The survey results indicated that the clients seemed to appreciate the rationale of offsetting imports and exports of the same fuel over the property boundary when balanced over a time period that is common and visceral. The survey showed a preference for balancing over a year, see Figure 4, so the design team chose a 365 day cycle for balancing. In addition, it would be easier to meet the zero-energy target when balancing over this period (data is presented later to show this). The implication of this was that a utility cost might result over the winter period, but this would be offset by a negative bill over the summer.
Based on the survey results, it was decided that the building could not be connected to the gas main. This was because gas flows cannot be directly offset on a like-for-like basis, unless a building is fitted with the technology to produce hydrogen or methane for injection into the gas main. This was not to be the case here, and in essence meant the creation of an all-electric building, or the use of biomass. Given the intent to use the Passivhaus standard for the project, the space heating load would be very low and the design would not include radiators or underfloor heating. In addition, in order to comply with the Passivhaus requirement for primary energy (demand limit of 120 kWh/m2a), solar thermal would be used for much of the domestic hot water (DHW) demand. This and the very low space heat demand led the engineers to consider that biomass would not be economic.
This left the choice between PV and wind for the generation of power. Small-scale wind has a poor record in the urban environment (the site is situated in the middle of a town) with generation often being far lower than suggested at design stage. 23 Hence many see it as a risky strategy at such locations. PV on the other hand has the opposite reputation, with annual generation often being equal to or exceeding that suggested at design.24,25 To match with the client group's view of not offsetting across the boundary of the building it was deemed likely that they would only see the building as zero-energy if the PV was mounted on the building. This conclusion had a strong influence on the shape of the building (see Primary energy consumption and renewable energy generation).
In summary, in order to produce a cost effective building, with an acceptable level of risk, that matched with the environmental standard this particular client group created, and would therefore be accepted by them as zero-energy/carbon, there was a logic in choosing to build an all-electric Passivhaus with roof-mounted PV generation, where the annual cycle is used for balancing demand against production, and which ignores the questions of EE and transport etc. It is perhaps not surprising that a client should want their ZEB to incur no energy bill. However, most ZEB standards focus on design, rather than performance, and there is often a gap between design intent and reality. There is therefore potential for the current top-down government- or industry-imposed definitions of the term ‘zero-energy’ to have limited meaning in practice from the client's perspective, despite a building's compliance with the zero-energy definition used. The client-led approach to defining the building standard described here means that compliance must be demonstrable through performance in a way that is clearly understandable by the client.
Application
In a design environment where teams are used to only meeting unambitious national building codes and where the energy aspects of these are only design standards, not in-use requirements, the need to design a building that would survive the pressures and vagaries of the construction process, be within budget and whose success would be measured in terms of the first year's energy bills was a considerable risk. This led to the selection of products and methods for the construction that had been applied before by the team, were not novel and where the measured performance was most likely to closely match prediction.
Fabric and heat demand solutions
The chosen solution was the off-site construction of insulated concrete panels. This was potentially unfortunate as it ensured the EE and embodied carbon of the school would be high, but this was felt justified if the approach meant it would be easier to meet the zero-energy in-use target, and because EE had not been considered an issue by the clients.
With the building designed to Passivhaus standards, it was felt that the very small amount of heat required did not justify a separate heating system or the use of hot water based heater batteries, so simple electric heating elements were placed in the air supply ducts to each classroom.
There is a natural synergy between heat gains provided by school pupils, Passivhaus design and thermal mass. The heat output of a person is around 100 W, 26 and a high mass approach that maximises the retention of the pulse of heat provided by the pupils has merit; especially if this pulse is greater than the typical overnight winter losses. In a typical school occupancy density can be very high in some areas (>0.6 people per m2), but very low in other areas when averaged over the school day. The difference in occupancy densities between spaces suggests that the natural approach would be to supply fresh air to each classroom and let this air flow through corridors and rooms with low occupancy, thereby heating these low occupancy density areas. This is only likely to be successful if the thermal mass is high, allowing the moderation of internal temperatures, and a mechanical ventilation with heat recovery (MVHR) unit is included in the ventilation system.
There is an extensive literature on problems with building management systems (BMS) causing buildings to be run in an incorrect and possibly inefficient way, often due to poor commissioning or maintenance of the BMS. 17 In schools this has led to the heating system operating when windows have been left open or during the holiday periods. Hence it was decided to control the duct heaters via a simple teacher-operated switch in each classroom that gives 15 min of heat. The design team were aware that electrically driven windows under BMS control also had a reputation for being expensive and poorly controlled, so manually opening windows were used for the majority of the building. The idea being that given the heating system could not make up for the losses from inappropriate use (because of the 10 W/m2 Passivhaus limit), staff would not leave them open in winter unnecessarily, or overnight, as they would be cold the next day if they did. This matched well with the presence of the MVHR system, as it allowed the school to ensure that classrooms would have good air quality with the windows closed, and hence could simply inform the staff which months they should keep the windows closed.
Primary energy consumption and renewable energy generation
The PH standard places an overall limit on the total primary energy consumption (120 kWh/m2a). One potential problem with the school that was known from conception was its location in a neighbourhood of low average income. This meant the proportion of pupils having free school meals would be high, meaning the kitchens would have a higher than typical energy requirement. In addition, given the growing use of IT in schools, it was clear that electricity use needed to be minimised aggressively.
Kitchen energy demand was reduced in three ways: induction hobs, solar hot water and a DHW heat pump. The induction hobs and heat pump arising as a natural implication of the building being all-electric. One, non-energy, benefit of the induction hobs being that even young pupils could safely use the kitchen for cookery lessons. IT energy use was reduced in two ways: replacing all PCs with laptops and the use of charging trollies. At the end of each day, all the laptops are plugged into these trollies and wheeled into secure cupboards. The cupboards are then supplied with electricity for 2 h. This means computers cannot be left on charge over holiday periods, and are secure against theft.
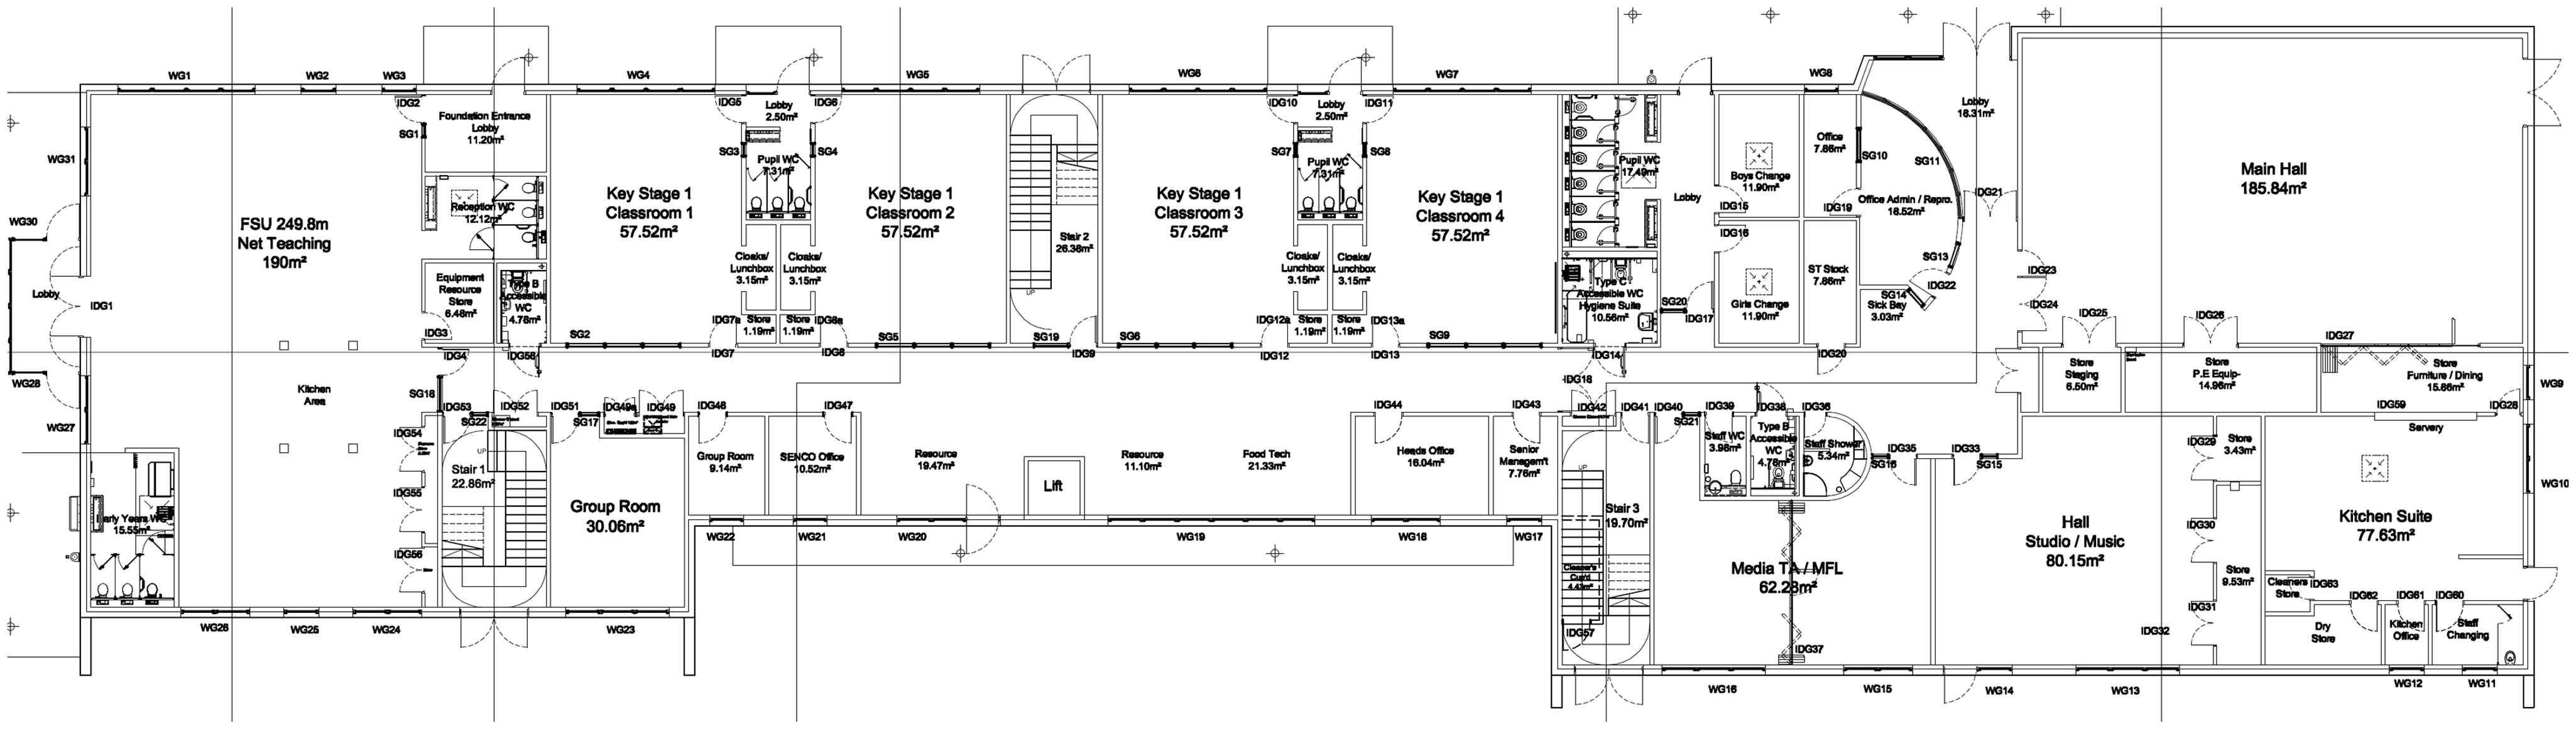
The need to find a cost effective solution which had enough space on its roof for the amount of PV needed to support the various activities of a school suggested the basic form and orientation of the building, this choice was aided by the requirement of Passivhaus of a low ratio of surface to floor area. The resulting design was a single building (rather than a series of detached blocks), rectangular in plan, and wedge shaped, with the slope (roof) of the wedge facing south and covered in PV (see Figures 5 to 7). This left the main, double storey, facade of the building facing North, and a single storey facing South. This is an ideal situation for a school, as the classroom accommodation needed is of approximately twice the floor area of the sum of the areas needed by other forms of accommodation, and ideally needs to face North to ensure solar gains are not an issue in densely occupied spaces and that the sun cannot make the use of white boards difficult. A side effect of the wedge shape was that it left a large attic space ideal for housing the large MVHR units, PV inverters, solar hot water storage vessels and air source heat pump. The heat pump is used to provide DHW when the solar hot water system cannot meet the demand.
Section of the school. Ground floor plan of the school. First floor plan of the school.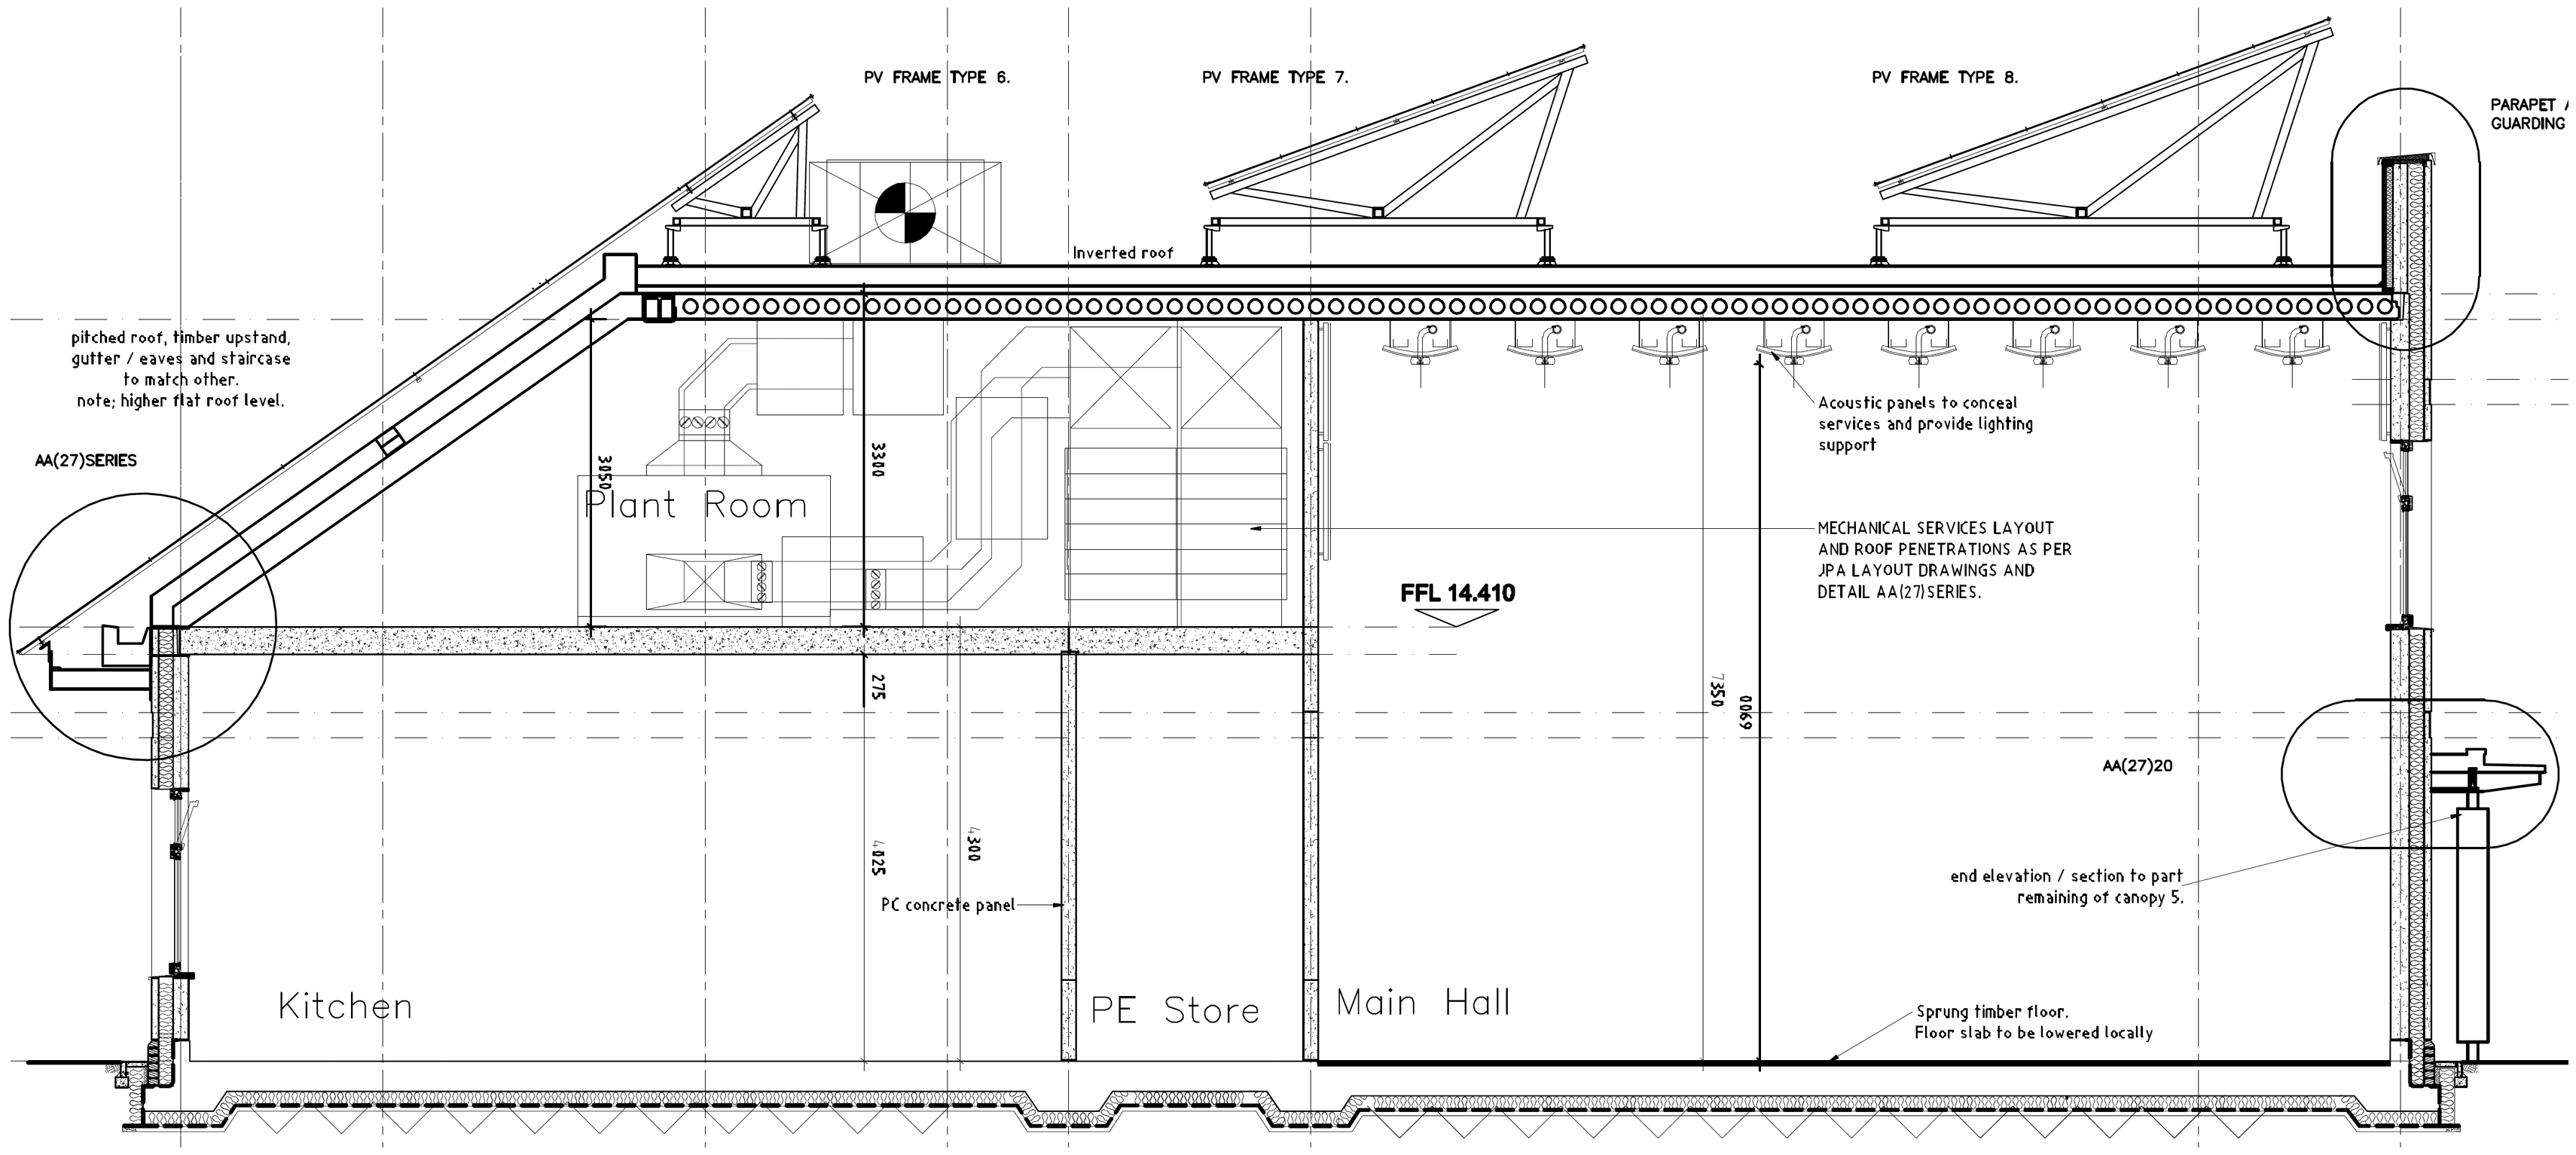
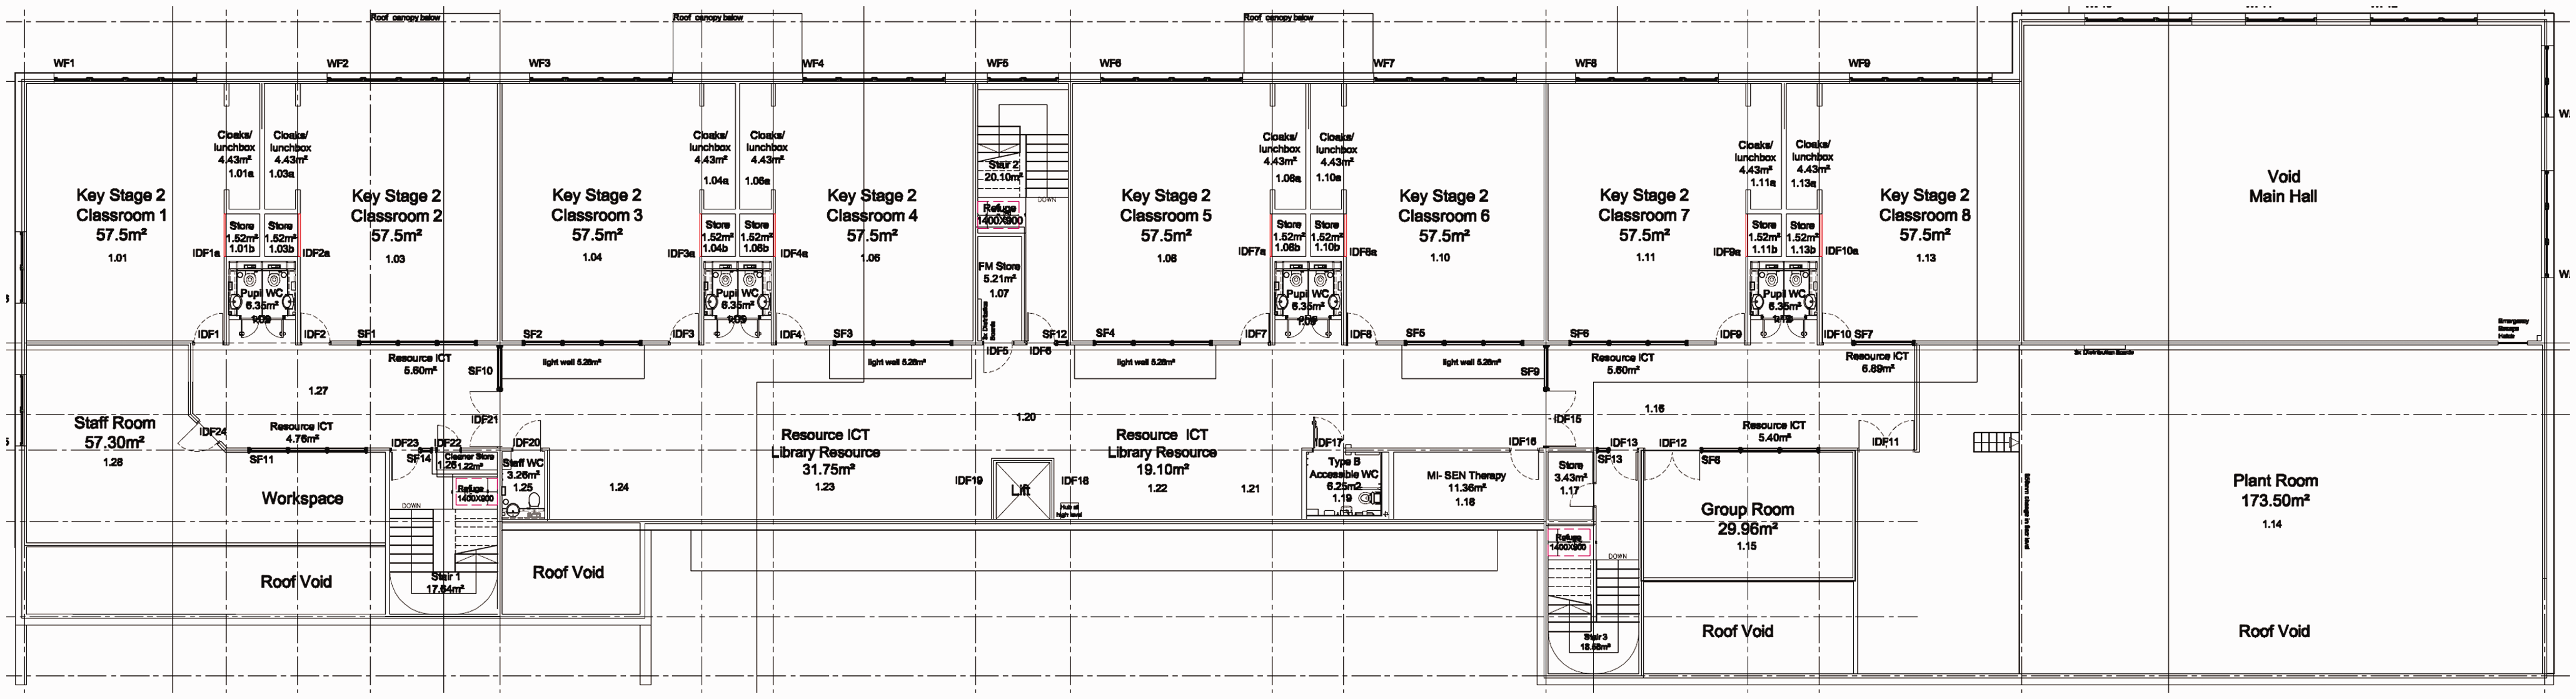
The 120 kWh/m2 Passivhaus annual limit on primary energy, together with the need for all generation to fit on the available roof area, were found to be surprisingly well matched. The result was a 2786 m2 school for 450 pupils which opened in October 2011.
Monitoring results
The building is being monitored using both the data from the BMS, the main utility meters and a variety of other sensors. Of particular interest here is the data relating to energy use and PV electricity generation, although data on various other environmental performance indicators, such as carbon dioxide levels, internal temperatures and acoustics were also assessed. The main reason for the monitoring is to provide evidence to the client group that their definition had been met without other environmental expectations being compromised. For example, while the Passivhaus standard aims to reduce heat demand, the requirement for an air-tight building envelope to minimise heat loss through infiltration has the potential to result in poor internal air quality if the MVHR unit is not used successfully by the occupants. Also, the use of an MVHR system which uses the corridors as the return air path necessitates the free flow of air within the building which could present acoustic problems.
Electricity
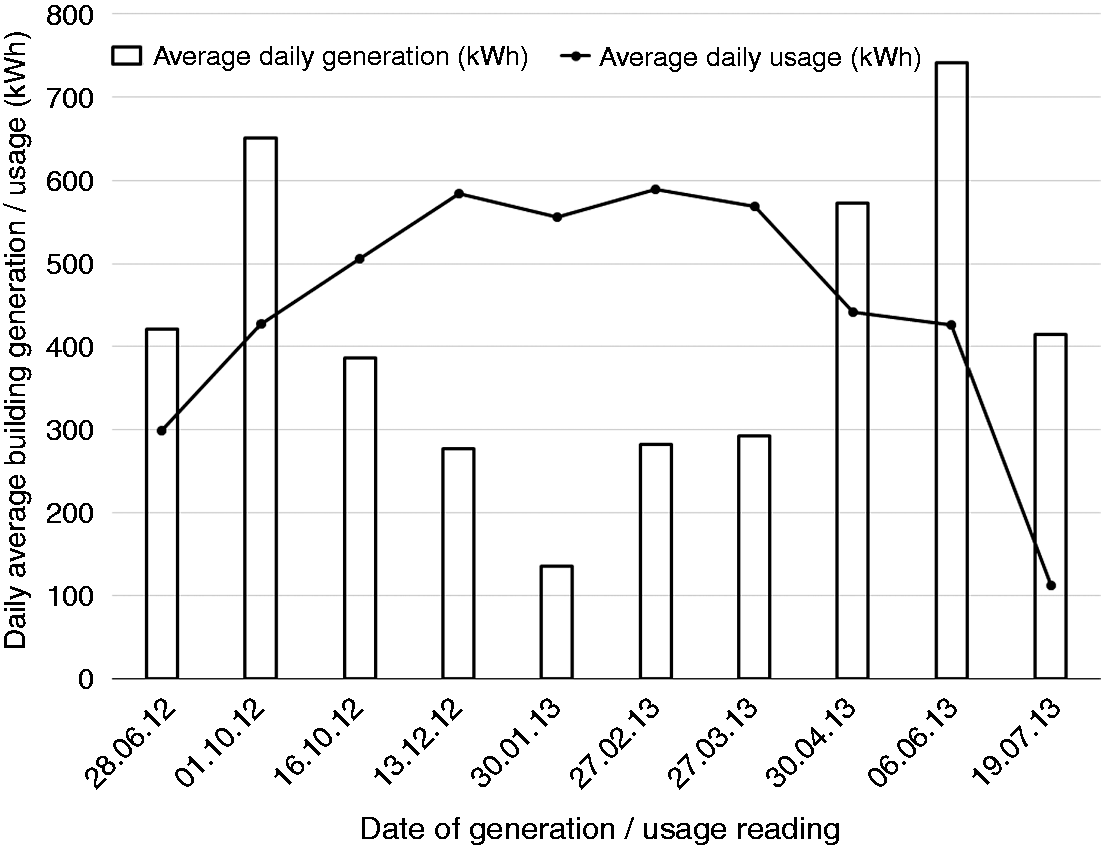
Half-hourly readings from the inverter control panels were used to determine the amount of electricity generated by the PV panels. Over the course of a school day it can be seen that there are periods when electricity is imported from the grid (in particular overnight), and periods when the PV production is such that little or no import is needed (see Figure 8). PV production and the consequent electricity import required varies with the available levels of sunlight. The monthly profiles show, as expected, a decline in output during the autumn and a rise in spring (see Figure 9), with the ratio between maximum and minimum monthly generation being approximately 4. This suggests that if a strict monthly balance had been demanded as part of the zero-energy standard, a 554 kWpeak array would have been required (instead of the 168 kWpeak one fitted). Aside from the fact that this would have added greatly to the cost of the building, there is not sufficient roof space to accommodate such an array.
Measured electricity import and PV production over a sunny Tuesday in October 2012. Consecutive measurements of electricity generation and usage during the period 15 April 2012 to 19 July 2013 normalised to reflect the number of days between readings.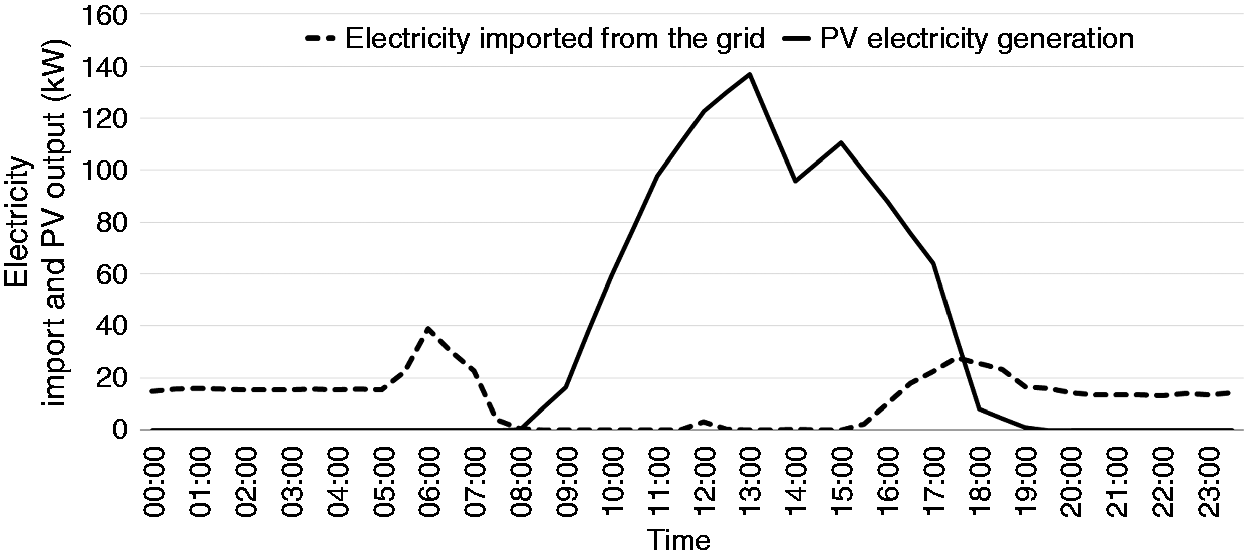
This observation clearly indicates that care will be need if a zero-carbon standard is defined in terms of a measured monthly balance of import and export. This is because the variation in generation between the same month in different years is far greater than the difference in total annual production between years. For the UK variation in hours of sunshine for a month compared to the long-term average for that month can be in excess of 40%, whereas the annual variation is likely to around 5%. This could easily lead to the building failing to meet a measured monthly energy balance.
Measurements running from 23 September 2013 to 8 September 2014, show a net export of 20,870 kWh (13.1% of the school energy demand during this period). Energy consumption during this period was 159,199 kWh. This is 59 kWh/m2a (assuming a floor area of 2786 m2).
Applying a primary energy factor of 2.6 (as is used in PHPP) and factoring up for the monitoring period being slightly less than a year gives 153.4 kWh/m2a. Applying the UK primary energy factor of 3.072 results in a value greater than the Passivhaus primary energy design limit. However, as Figure 10 shows, the school's energy demand is much lower than UK good practice for primary schools,
27
and falls within the lowest 10% of consumption for primary schools in England and Wales.
28
Measured school energy demand compared with CIBSE typical and good practice benchmarks.
27
Measured school PV generation also shown.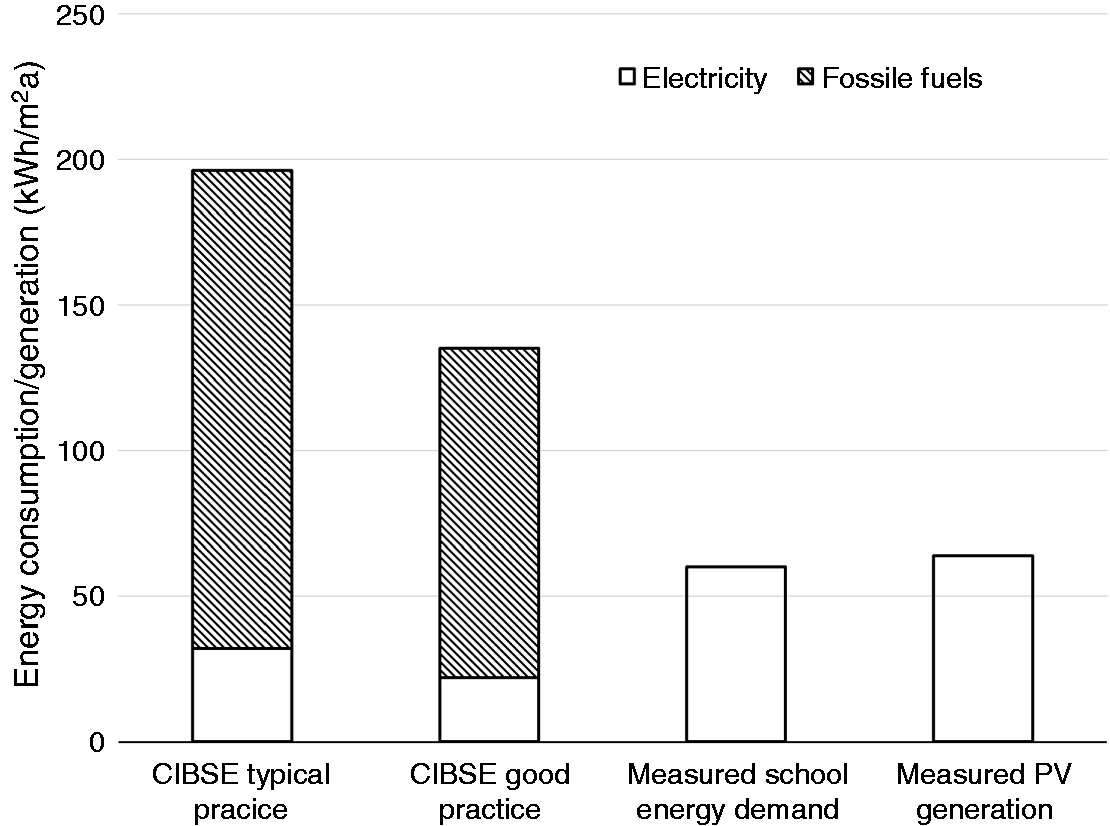
Internal temperatures
Temperature statistics from dataloggers.
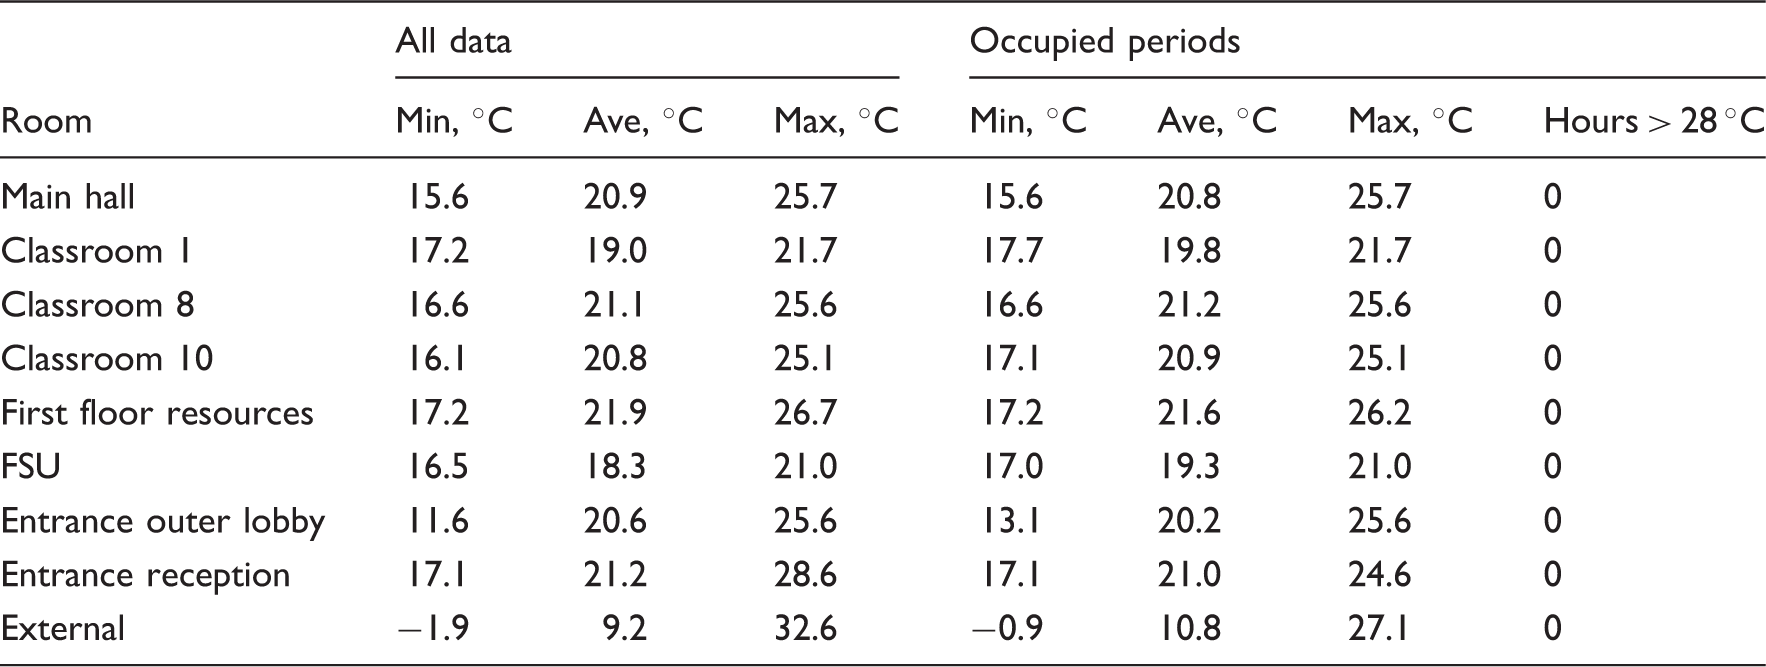
No internal temperatures exceeded 28℃ during occupied periods, indicating that overheating appears to not be a problem, and average temperatures are comfortable. Minimum temperatures whilst cool are above 15℃.
Internal carbon dioxide concentrations and acoustics
CO2 concentrations are indicative of the adequacy of ventilation. Building Bulletin 10129 recommends that ventilation provision in teaching and learning spaces should be sufficient to ensure that the average CO2 concentration at seated head height should not exceed 1500 ppm averaged across the school day, and that the maximum CO2 concentration should not exceed 5000 ppm.
The average CO2 concentration was calculated from the half-hourly readings for each school day (between 09:00 and 15:30), and was determined to be 938 ppm. The occupied CO2 concentration never rose above 5000 ppm, and only two days during the first year of operation had an occupied average exceeding 1500 ppm. Figure 11 shows an example daily profile of indoor CO2 concentration.
Measured indoor CO2 concentration levels in a classroom over a Monday in January 2013.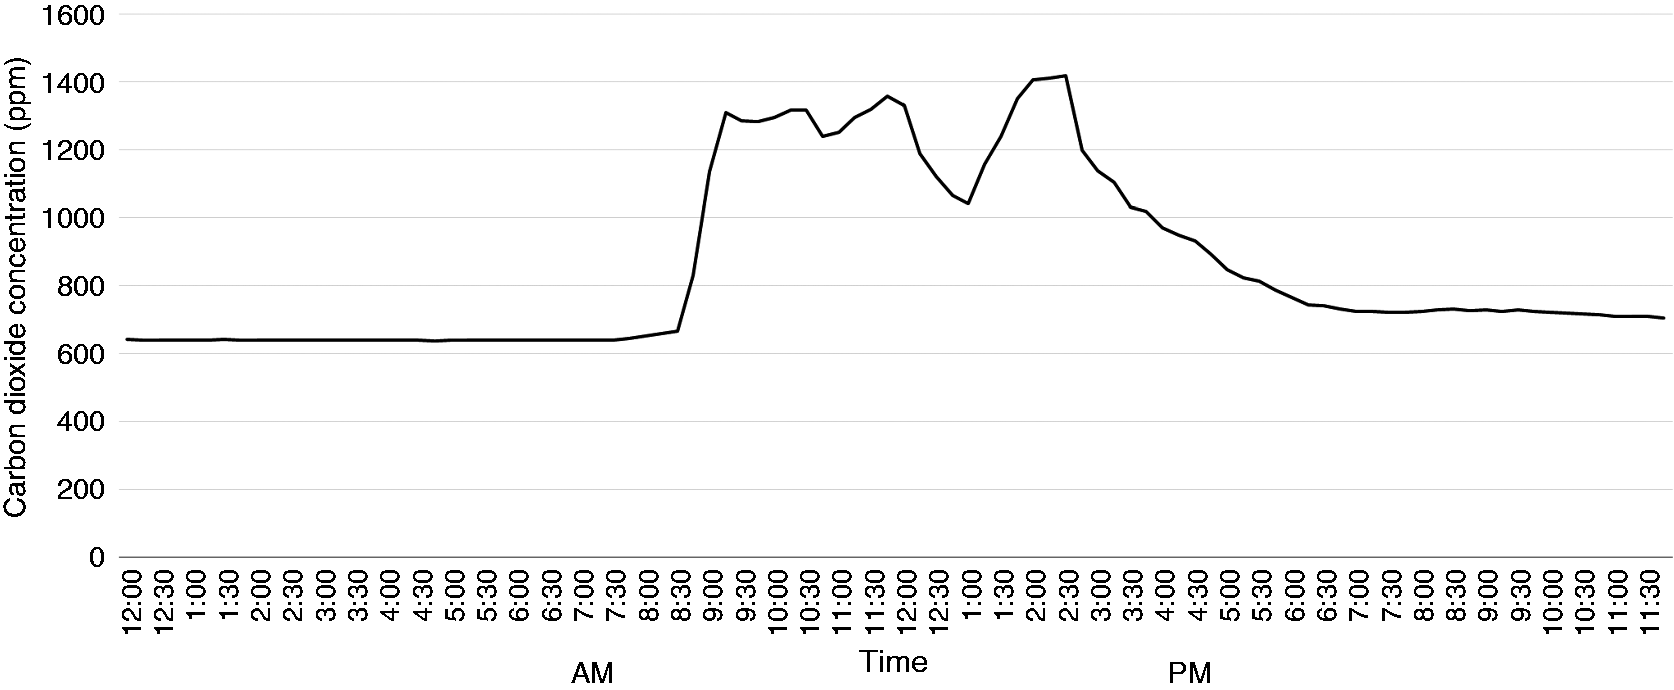
The acoustics of the school in terms of reverberation, ingress, room-to-room transmittance and background noise from services were all found to be compliant against national standards, as given in Building Bulletin 93. 30
Conclusion
This is the first time that a client-based method for defining an energy standard has been derived from a systematic survey and implemented in a building project. The work demonstrates that a client group is capable of engaging with the zero-energy concept and contributing towards relevant design criteria. It is also evident that such criteria can successfully be incorporated into a building that fulfils both the needs of the building users and the demands of the client-based zero-energy standard.
A survey of the client group's view of zero-energy crystallized into a standard that required the school building to be zero-energy in use, i.e. incurring no annual energy utility bill. This had deep implications for the overall design of the building, as it was necessary to accommodate enough PV on the roof for the generation of sufficient electricity to offset annual consumption. The resulting shape and layout of the school worked well to satisfy the needs of the building users, and also provided a natural space to accommodate the MVHR, and other, services required in the design.
The Passivhaus design philosophy followed has resulted in a building that maintains an acceptable internal environment, from the perspective of temperature, CO2 levels and acoustics, while keeping the primary energy demand very low at approximately 153.4 kWh/m2a and the heating energy use to almost zero. This is even despite the fact that the school has to provide an above average number of hot meals. With a PV array capable of generating more energy than the annual demand, the building has been successful in meeting the design criteria, in particular the client group's view of what a ZEB is.
Footnotes
Data access statement
This publication is supported by multiple datasets. The data used to produce Figures 3, 4, 8 and 10 are available from the University of Bath data archive at http://dx.doi.org/10.15125/BATH-00124 Remaining data was obtained upon request and is available to SWEEG members at ![]() The sources of existing data cited in the text are listed in the references section.
The sources of existing data cited in the text are listed in the references section.
Acknowledgements
Declaration of conflicting interests
The author(s) declared no potential conflicts of interest with respect to the research, authorship, and/or publication of this article.
Funding
The author(s) disclosed receipt of the following financial support for the research, authorship, and/or publication of this article: This research was partly funded by the Engineering and Physical Sciences Research Council (grant number: EP/L016869/1).