
Abstract
The total electrical energy consumption of buildings has garnered the interest of scholars. Efforts have been undertaken to establish near-low-consumption edifices to ensure comfort and optimize resource management. Building energy modeling is a notably adaptable method for enhancing energy efficiency. This tool assists energy managers in selecting technology to minimize energy consumption. This research seeks to evaluate the implementation of diverse, active technologies in traditional buildings by utilizing building energy models to develop net-zero emission structures in response to the circumstances above. A comprehensive energy model of the building utilizing EnergyPlus was employed to examine the potential energy savings from implementing diverse, active technologies. An analysis of a solar system addressing building demand was conducted using the PV*SOL tool. The results of the digital building model demonstrated that the active technologies implemented would substantially reduce electricity consumption in electrical equipment and air conditioning systems. Nevertheless, even with the implementation of best practices, the lighting system did not realize the expected energy savings.
Keywords
Introduction
The forecasts of energy demand indicate the need to limit energy use in buildings (Paone and Bacher, 2018). In 2021, 40% of the total energy used corresponds to the building sectors, as stated by the EIA (Energy Information Administration) (U.S. Energy Information Administration (EIA), 2023). Energy-efficiency improvement is running at a slow pace of around 2% in Europe and the U.S. and under 15% of regular decreases in energy intensity. In its report (McIntyre et al., 2023), it presents that The Caribbean Community (CARICOM) Energy Policy (CEP) intends to reduce its intensity by 2027 by 33%. Data deficiency regarding reduced energy costs, cost-sensitive retrofit approaches, and the inability to rigorously quantify the advantages of energy retrofitting can be traced as culprits (Szcześniak et al., 2022). Therefore, energy efficiency strategies in multiple countries have brought forth the Net Zero Energy Building (NZEB) approach in building planning to address their pattern of rising energy use (Omrany et al., 2022). The development that NZEB has had to reduce the demand for buildings and achieve sustainable development objectives is also due to academic research, improvements in construction technology, and the viability of renewable energy sources applied to buildings (Arif et al., 2021).
Renewable energy and efficiency can supply as much energy as NZEB requires (Harkouss et al., 2018; Moran et al., 2020). Multiple advantages to the climate, operating and maintenance costs, and resiliency in the face of blackouts by NZEB producing their energy (Pallis et al., 2019). Sun-powered buildings are gaining acceptance and are regarded as positive or at least net-zero energy constructions. Some examples of Sun-Powered buildings that are NZEB are presented in (Bot et al., 2021; Ferrari et al., 2023), as well as Sun-powered microgridsith facilities (Ahmed et al., 2020). It is anticipated that the energy utilization of renewable energy sources will decrease and energy efficiency will increase by NZEB (Kilkis, 2022). Net Zero results require selecting technologies that are energy-efficient and stable energy sources (Dhakal et al., 2021).
Building Energy Modelling (BEM) techniques and other novel decision-making tools are necessary for optimizing the performance of buildings (Faure et al., 2022). Elbeltagi et al. (Elbeltagi and Wefki, 2021) explain that through virtual technologies, BEM allows us to predict energy demand. The pursuit of energy efficiency in buildings is a common focus of BEM research (González et al., 2021). By applying BEM to existing buildings, it can obtain support in researching cost-efficient modification opportunities without intervention (De Oliveira et al., 2021). Energy simulations are essential as a support methodology during the whole building cycle life, from design to everyday building operations and demolition actions (Chiesa et al., 2021). There are examples of BEM applications in different types of buildings, such as Office (Loche et al., 2021), Residential (Gercek and Durmuş Arsan, 2019), Hospital (Yao et al., 2022), Office (Li et al., 2019), and Office and Education (García Kerdan et al., 2016).
Current researchers such as Nabil et al. have presented roadmaps for energy efficiency in buildings (Nabil and Labidine, 2022). To devise an energy model, Fazel-pour et al. used efficiency techniques with insulation materials for windows, roofs, and walls (Fazelpour et al., 2022). The building design for various environments was optimized to increase energy efficiency by developing a double-skin facade and green roof simulation. In Caponetto et al. (2022), a contrast between frequently implemented technologies and benchmarked analyses of multiple green building techniques. Webb (2022), as opposed to other building envelope energy efficiencies or improvements for reducing energy demand, suggested a perfusion façade. Guo et al. (2022) conducted a natural ventilation assessment of medium-sized exercise rooms in subtropical countries as they are affected by local climatic conditions and building structures.
An energy management system (EMS) is essential to optimize operations and profitability, and numerous technologies coexist in modern buildings. EMS solutions can be categorized into two types: passive and active. Analyzing complex building EMS requires a combination of building simulation and programming tools. Building simulation is a well-established technique for assessing performance under various conditions (Zhang et al., 2022). Rule-Based Control (RBC) and Model Predictive Control (MPC) are the two most frequently used strategies for active EMS. RBC is a series of automated decisions triggered by real-time monitoring and predefined “IF-THEN” rules. These rules often involve threshold comparisons between reference and measured values (Di Piazza et al., 2017).
Several research studies have applied RBC to various control scenarios., including multi-appliance systems (Shakeri et al., 2017), swimming pool temperature (Yuan et al., 2021), and indoor CO2 levels in offices (Vand et al., 2020). Occupancy patterns can be incorporated into these rules, enabling set-back and pre-cooling modes based on occupancy profiles (Baldi et al., 2018). RBC relies solely on current conditions, minimizing the need for predictive information like weather forecasts and load predictions. Its simplicity and ease of implementation facilitate integration with building and technological analytical models (Masy et al., 2015).
While passive solutions offer effectiveness in new or renovated buildings, their application in existing structures is often hindered by cost, complexity, and structural limitations. Active technologies provide a more flexible and non-invasive approach. These technologies enable real-time optimization of energy consumption and adaptive control, making them suitable for improving the operational sustainability of existing buildings. Implementing such solutions can achieve immediate and effective energy efficiency gains, aligning with broader environmental goals within urban contexts. Based on the preceding information, this paper presents an approach to evaluate the application of active technologies based on rule-based control in conventional buildings, applying building energy modeling to transform them into sustainable buildings. The main contributions of this research are as follows:
Assessment of the application of active technologies to transform conventional buildings into sustainable buildings utilizing building energy modeling. A methodology to assess the impact that implementing different energy efficiency measures can have in traditional buildings for the transition to net zero energy buildings.
The paper sections are arranged as follows: Section 2 describes the digital twin of the building's development process. The several active technologies used in the proposed building's digital twins are described in Section 3. The findings of comparing a building with and without the implementation of active technologies are presented in Section 4, and the conclusions are presented in Section 5.
Development of the building energy performance simulation model
The building analyzed is situated in the Dominican Republic, a nation with a tropical climate marked by elevated temperatures most of the year. The National Meteorological Office (ONMET) records indicate an average high temperature of 30.6 °C and an average low temperature of 21.8 °C. The structure exhibits a traditional construction that diverges from environmental or bioclimatic requirements, significantly affecting energy efficiency.
Its structure features extensive, transparent glass apertures in its façade, facilitating ample natural light and expansive vistas. The abovementioned factors may result in issues regulating thermal energy and solar radiation.
In a tropical region, prolonged sun exposure can substantially elevate inside temperatures, necessitating increased reliance on air conditioning equipment to sustain a comfortable atmosphere. This results in heightened energy consumption, elevated expenses, and detrimental environmental effects due to increasing greenhouse gas emissions.
Ercilia Pepín building case study
A virtual model was subsequently developed to implement modifications to reduce electrical energy consumption within the building's attributes. After creating this optimized virtual representation, a comparative analysis was conducted between the initial and virtual models. The Ercilia Pepín (EP) Building was specifically selected inside the Instituto Tecnológico de Santo Domingo campus, as illustrated in Figure 1. The EP Building encompasses a total constructed area of 1180.24 square meters, split across three levels, including one subterranean floor. The basement has research laboratories and classrooms; the first story features a student lounge and administrative offices, and the second floor comprises classrooms and more administrative offices. The building is constructed with traditional materials, including reinforced concrete walls, a concrete slab roof, hydraulic slab floors, and glass windows, which are crucial for natural lighting but may contribute to substantial heat gain in summer if not designed for energy efficiency.

Architectural perspective of the selected building.
The OpenStudio software was used for the digital model simulation. OpenStudio is a software with a collection of tools elaborated by the U.S. Department of Energy to assist with whole-building energy modeling using EnergyPlus (Faure et al., 2022).
Virtual representation with an unrestricted envelope
The initial phase involved simulating the building solely based on its physical architecture, disregarding energy consumption and load profiles. Given the absence of architectural blueprints, a laser distance meter was employed to acquire precise measurements of the building. The subsequent survey yielded a detailed spatial distribution of the structure. Measurements were collected for the distance between the roof, walls, and the area of the windows in touch with the outside. Table 1 presents the specifications recovered from the measurements and the results from the virtual representation.
Building model specifications.

Only outside-facing windows were considered because the interior windows had little influence on the model simulation. Additionally, to avoid conflicts in the model and since the student recreation space functions with its wide doors open, it was shaped as a large window with airflow. Figure 2 (a) shows the 3D distribution of the measurements taken. In Figure 2 (b), the spaces are divided according to their contact with the environment, where in blue are denoted the parts that have contact with the exterior and receive sun and wind, while in beige are denoted the subway parts of the building.

(a) BEM with unconditioned envelope. (b) Model display by limits.
Consumption and loads information
As local power metering was absent, OpenStudio was used to estimate the building's electric energy consumption. To complete the building model, spaces were categorized based on their electric and thermal loads. The description of these loads suggested that each Area inside the building was evaluated throughout the data-collecting phase; the volume of people moving through the space, the work schedule, how employees used the equipment throughout the day, and workplace operations were considered.
This model categorized loads into electrical equipment, lighting, and occupancy. Occupancy loads were determined by the maximum number of occupants, the heat generated by their presence, and the rate of CO2 emissions per person. These characterizations correspond to the occupancy loads produced in each zone with their presence.
The definitions of lighting loads accurately represent the intended lighting loads. These were determined by the maximum power (W) used by the lighting components corresponding to each sector, the heat that lights release to raise the surrounding temperature through thermal radiation, and the heat that lights produce through visible radiation. Electric equipment specifications are characterized by electrical equipment identified by the maximum power consumption (W) corresponding to the space's electrical components. In thermal emission, the equipment's heat output raises the ambient temperature. It also creates humidity as its temperature rises and wastes energy by transforming one form of energy into another. The selection of metal roofing in specific portions of a building can substantially influence the environment's ambient temperature. The abovementioned is due to the physical features of metal roofs, which render them exceptional heat conductors. This trait renders them unsuitable for hot regions since it can substantially increase the building's internal temperature, resulting in significant thermal discomfort for the occupants.
The metal roof exhibits significant solar heat gain, transmitting thermal energy into the building's interior. As a result, on days of high solar irradiance, the building may experience excessive heat, compromising occupant comfort and productivity.
The total numbers for people, electrical equipment, and lighting definitions for all regions are shown in Table 2.
Load definition values for all areas in total.

Loads schedules
Multiplier parameters for a set of schedules have been specified for the several loads for each zone. According to the categories of loads that we are applying to describe the spaces, each sequence of itineraries has:
A schedule describes how a person's load should behave. Given the population and the actions that these individuals are engaged in. A schedule that specifies the lighting components’ hourly actions depending on the devices that are operational and how long it is on. A schedule that uses the same logic used for lighting loads to specify how electrical equipment should behave. A timetable outlining how unacceptable air incursion occurs.
The different amounts in the various hours oscillate between 0 and 1. These parameters were devised to act as multiples of the maximum load. These would represent the maximum load percentage that works within each hour. Based on an appraisal of the metabolic pace (W/person) created by individuals corresponding to the actions they carry out inside the area of the building where they are positioned, people conduct the relevant planned activities. These estimations’ reference values were acquired and are shown in Table 3.
Metabolic ratios for different actions.

Types of spaces and zone conditions
The types of spaces determine the energy behavior profile of a given area. These types of spaces are comprised of itineraries, or schedules, that correspond to the space and the untreated/conditioned air infiltration designation. It includes what is referred to as the outside air design specification. The American Society of Heating and Air-Conditioning Engineers (ASHRAE) Standards 62.1 and 62.2 were used to guide the selection of those specification values. The OpenStudio default value was used as a reference for selecting the design infiltration flow rate. Figure 3 shows the average outdoor air infiltration during occupied hours for each thermal zone in the building.

Average outdoor air infiltration during occupied hours.
A combination of the software's physical representation and the different area's energy profiles was used to define the spaces. The concept included halls, classrooms, labs, bathroom facilities, administration offices, and student commons as types of space. Each space had a connection to a default structural configuration, a default timetable, a default thermal zone, and a kind of space. The loads related to each area were also included since the variety of spaces only included the infiltration behavior specifications and the schedule. Figure 4 shows some of the schedules used in the different zones.

(a) Classroom schedule overview. (b) Corridors schedule overview. (c) Laboratory schedule overview. (d) Office schedule overview.
Active technologies
Openstudio measures
The OpenStudio measures were used as soon as the energy model of the selected building was created. Measures are an unmistakable quality of OpenStudio and are scripts created in the Ruby programming language. The measures apply changes compared to energy efficiency actions (Elbeltagi and Wefki, 2021). The measures used in the first model were obtained from the Building Component Library of the National Renewable Energy Laboratory (Chiesa et al., 2021).
The ideal measures were chosen after consulting the ASHRAE Advanced Energy Design Guides (AEDG). AEDG is a series of distributions created to suggest ways to save energy beyond the requirements of ANSI/ASHRAE/IES Standard 90.1's base code. The AEDG for small/medium office buildings (González et al., 2021) was chosen as an allusion to several ASHRAE guidelines. This manual was chosen since administrative offices occupy many of the EP building's areas. The following steps were taken, as stated in Table 4, to enhance the initial construction model:
Install a daytime sensor between spaces with a designated space type (DS). Areas with space types assigned that have names that contain the string in the contention should have daylighting controls added. Lower the NLL (nighttime lighting loads). Switch out the lights around evening time without interfering with building inhabitants’ everyday activities. Electric Equipment Controls (EEC) for Small to Medium Offices (AEDG). This feature reduces the electric equipment schedule values to match reductions brought on by equipment controls. This tactic uses outlets or adapters that depend on occupancy. Lower Electric Equipment Loads (EEL) at Night. Switch out equipment around the evening without interfering with building customers’ everyday activities.
Actions used in each zone.

Implementation of renewable energy
The implementation of photovoltaic (PV) panels in the EP Building was studied due to the need to integrate renewable energy resources to transition a conventional building into a sustainable building. Based on a comprehensive review of residential PV-battery systems in the Dominican Republic, which identified PV*SOL as a leading analysis tool, the software was employed to analyze the PV installation (Garabitos Lara and Santos García, 2021). In addition, an extensive database of photovoltaic and climatic components facilitates the selection of equipment and adaptation to different conditions. This tool uses advanced mathematical models to simulate the PV system's performance. The 3D shading analysis feature is particularly of note since it grants the ability to represent the shadows produced on the installation by nearby elements (De Oliveira et al., 2021). As the rooftop of the building is not accessible, the employment of the PV system was analyzed in a space intended for parking next to the building (see Figure 5). The INTEC parking lot is located at 18.487893°N, −69.961373°W in the Dominican Republic. Given the country's tropical location, the optimal tilt for solar panels in this area is between 18° and 19°, aligning with the local latitude. This inclination ensures maximum solar radiation absorption year-round. For optimal energy production, the panels should be oriented due south, perpendicular to the sun's rays at solar noon. The Dominican Republic's abundant solar resource (GHI values: 4.6–6.2 kWh/m²/day) allows for widespread solar technology implementation (Garabitos Lara and Santos García, 2021).
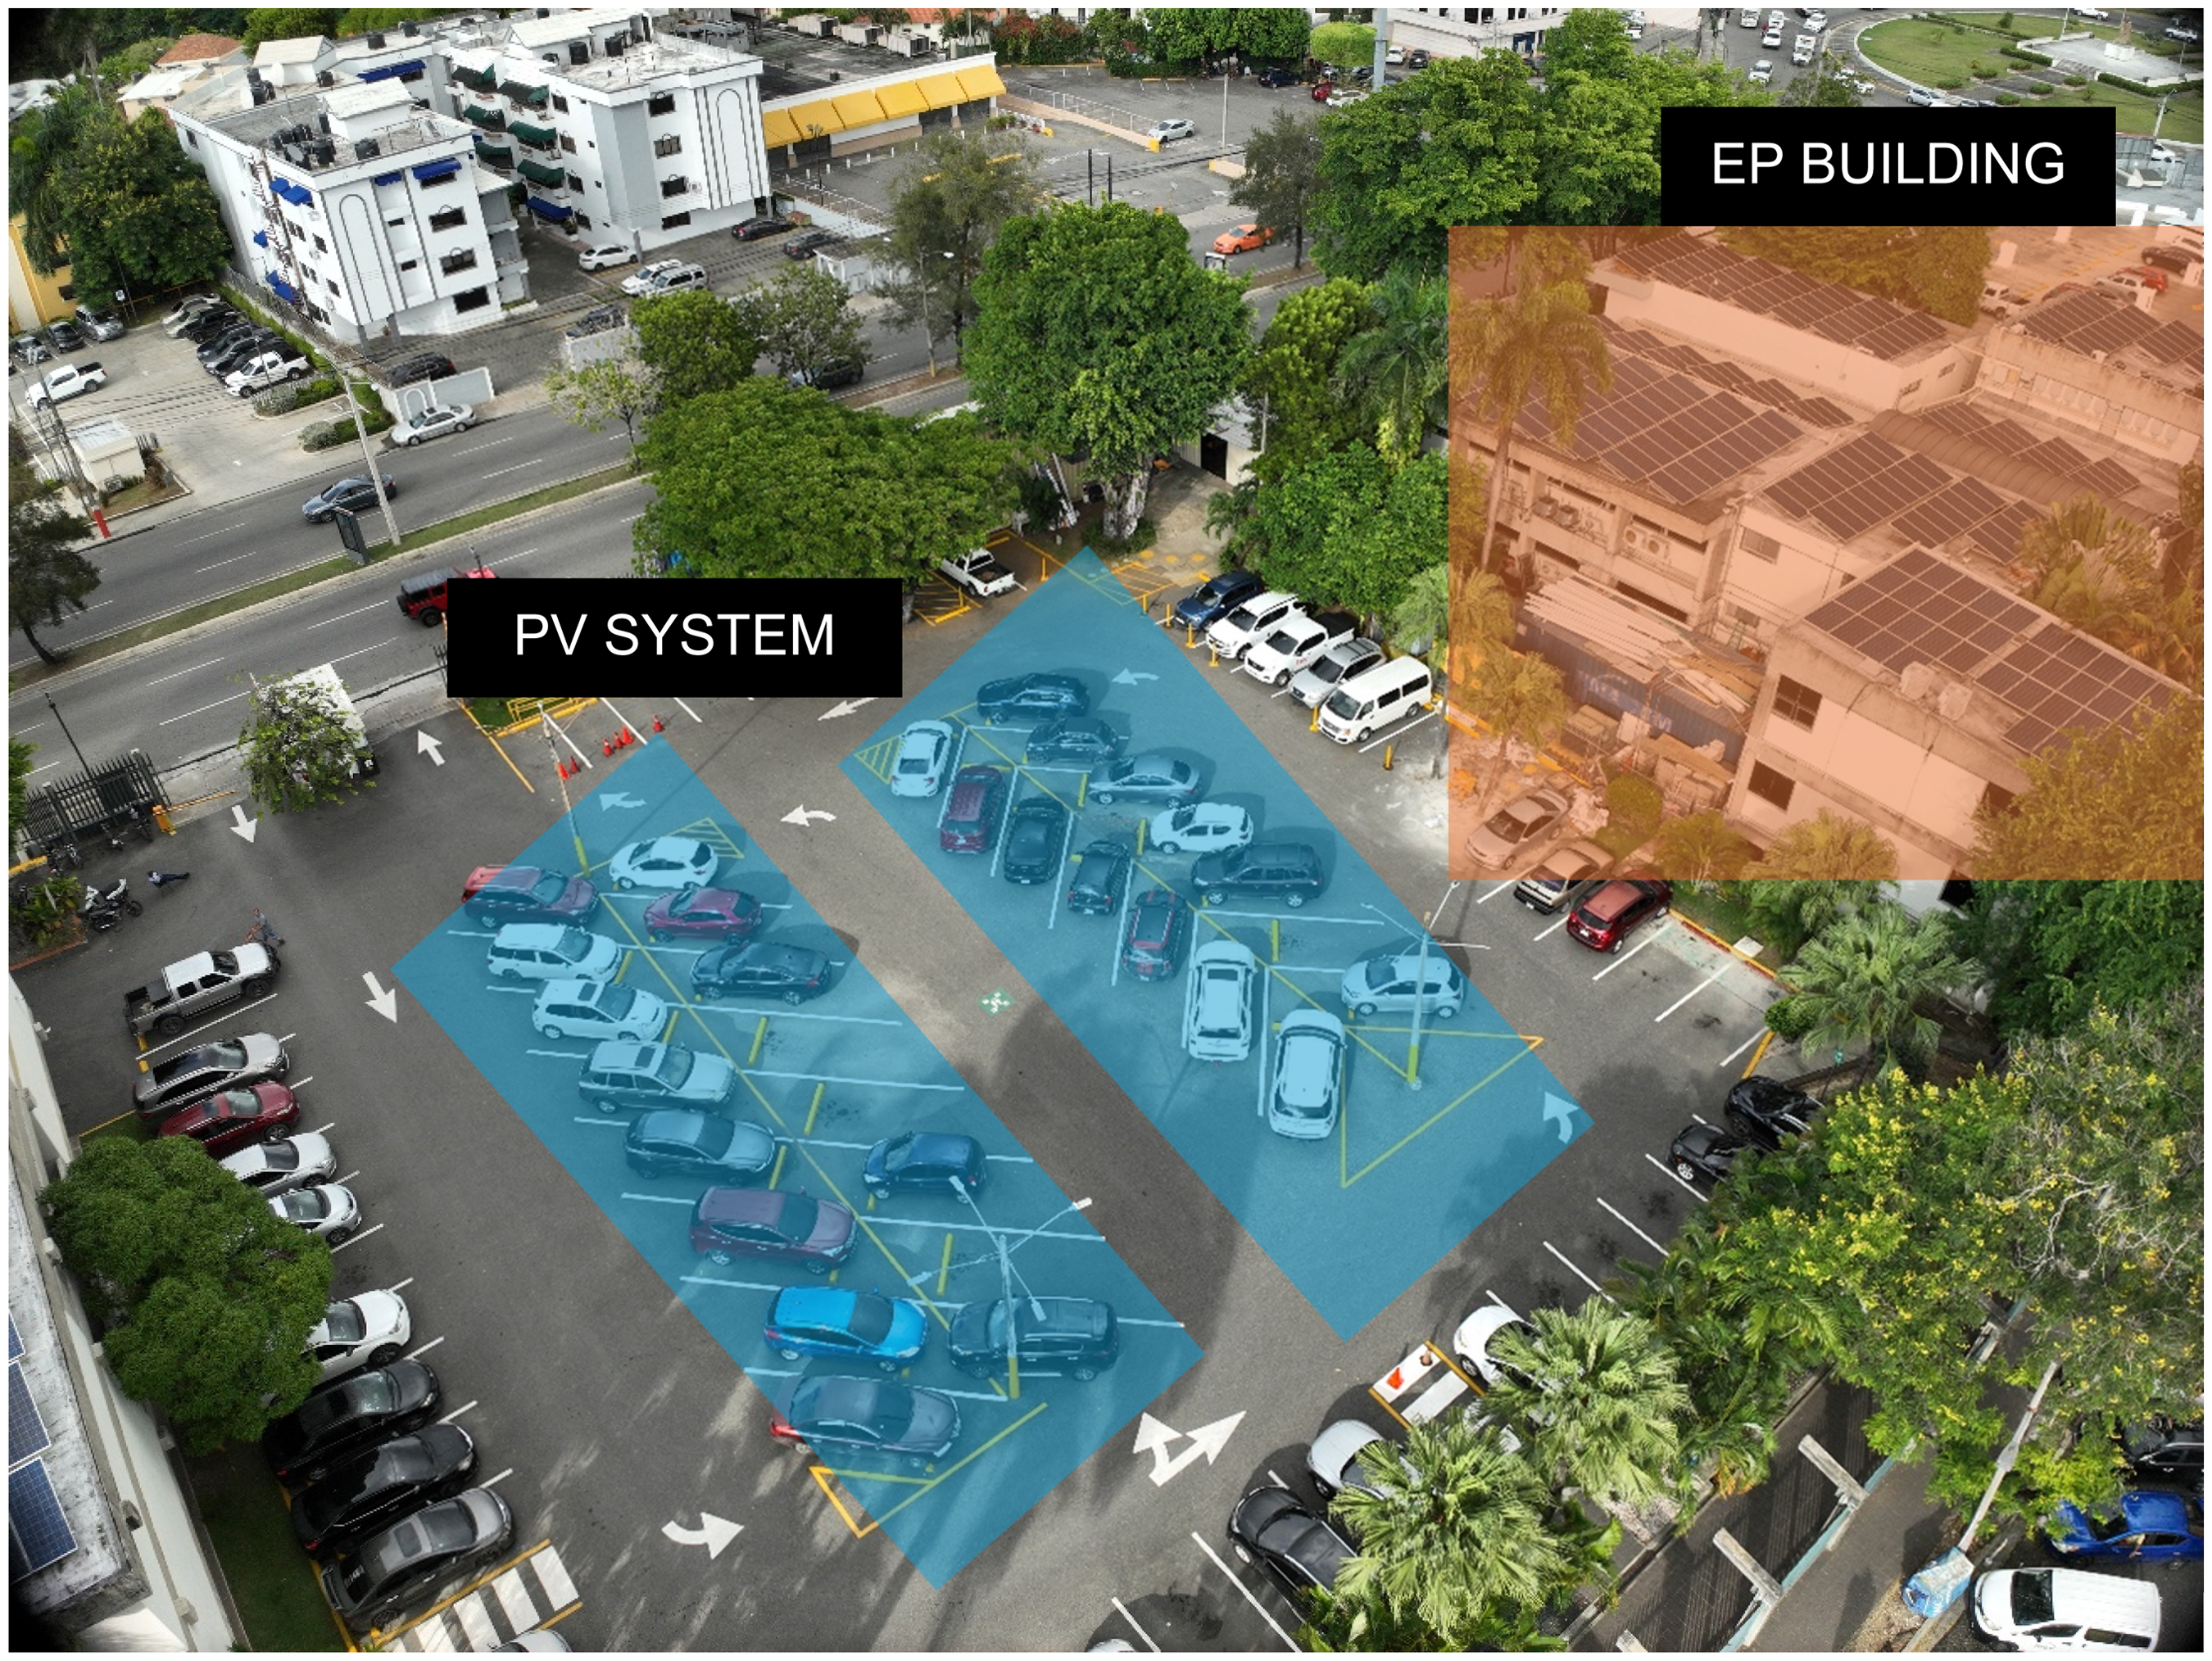
PV System Position.
The calculating PV module numbers for the chosen space decided a sum of 354 modules with a peak power generated of 83.19 kWp, increased by the quantity of functional long periods of daylight of 4.5 h, recognized by the PV*SOL programming for the country. A sum of 374.355 kWh of energy was generated during the day. These PV*SOL-generated data were used as input for the OpenStudio model.
Even though it was possible for the designated space to accommodate a more extensive PV system installation, a better balance between the space used and the energy produced was given a high focus. Table 5 shows the most relevant attributes that were considered for the establishment of the system:
Pv system relevant characteristics.

Results and discussion
An assessment was made of the energy consumption (kBtu) of several loads while acquiring the outcomes of the initial and enhanced models, as shown in Table 6. The data analysis showed a slight increase in lighting equipment consumption in the improved model. This greater lighting consumption is caused by the sunlight sensor measure that can switch on the lighting during partial cloudiness. Regardless, the enhanced model still obtains better outcomes due to lighting having negligible effects, representing less than 5% of the total consumption.
Yearly outline between initial model versus enhanced model.

The enhanced model appears more energy-efficient, especially regarding internal equipment and cooling. The abovementioned suggests that improvements made to the building, such as using outlets or adapters that depend on occupancy and switching out equipment around the evening without interfering with building customers’ everyday activities, have resulted in significant energy savings. However, the slight increase in internal lighting consumption indicates potential areas for further optimization, such as implementing more efficient lighting fixtures or adjusting lighting schedules.
Figure 6 shows that the actions diminished the total electrical energy demand from over 8000 kWh/month to under 7500 kWh/month. Nonetheless, the electric energy utilized by the lighting system was raised since the simulation settings anticipate that most of the lighting load is off around evening time. As a control system was added, these produced a minor increase in demand.

(a) Monthly overview of equipment consumption previously and afterward actions. (b) Monthly overview of lighting consumption, as well as previous and afterward actions.
After applying the actions, there was a decrease in the cooling load of the building, as can be seen in Figure 7. With the utilization of automatic controls, the working season of the cooling system is diminished, which converts into a lessening between 2 MBtu and 2.5 MBtu of the cooling load.

HVAC month-to-month demand profile previously and afterward actions.
Table 7 shows the solar panels’ monthly energy output. This information is obtained from a PV*SOL simulation of the photovoltaic system. Following the implementation of the upgrades and the electric energy extra that would occur if the climatic circumstances permitted the energy output predicted by the program, the building's monthly electrical energy usage is also shown.
Month-to-month outline of building demand, power generation, and excess energy.

Table 7 reveals a clear seasonal pattern in both demand and generation. Peak demand seems to occur during the summer months (June-August), likely due to increased cooling needs. Similarly, peak generation occurs in the sunnier months (March-September). Additionally, the building consistently generates more energy than it consumes from March to September, resulting in positive excess energy values. The above suggests that the renewable energy system effectively meets the building's energy needs during these months.
The institution is preparing to install electric chargers, considering the current increase in electric vehicle usage. The excess energy from the photovoltaic systems is sent into the grid to power electric car chargers.
Conclusions
This paper presents a study that emphasizes the opportunity conceived by using building energy modeling software to plan when designing sustainable energy strategies in existing buildings, avoiding the necessity for considerable investment or suspending building operations. The tools presented also allow for analyzing active technologies for optimal resource management, comfort, and efficiency, such as automatic on/off lights, electrical equipment, night light shutdown, and natural light sensors. The results derived from the digital model demonstrate an average reduction of 10.35% in interior equipment energy consumption and a 2.58% reduction in cooling load across all months after the implementation of the measures.
Consumption was not permanently reduced by the measures applied. Combining various technologies was often necessary apart from just implementing them. Although not significant to the overall electric power use in the other systems, an increase of 0.33% in lighting consumption could be perceived. Only control restrictions were considered; therefore, due to the shape of the building, the benefits were lower than expected.
Lastly, holidays or vacation periods were not considered in the model of the building's operation since it is not expected to be used during those periods. The cooling loads were considered electric equipment in this model's simulation. In future research, it would be suggested that these exceptions be applied to observe the effects on the building's electrical consumption behavior.
Evaluate design and construction methodologies incorporating sufficient heat insulation, reflecting materials, and adequate ventilation systems. The abovementioned factors can diminish energy use and lower operating costs over time.
Future works
Future research should focus on validating the OpenStudio and PV*SOL models through rigorous testing and calibration with real-world data. Additionally, experimental validation through monitoring building energy consumption and PV system performance will enhance the accuracy of simulations. Analyzing the impact of uncertainties in input data and climate variations will lead to more robust and reliable energy modeling, ultimately supporting informed decision-making for energy-efficient buildings and renewable energy integration.
Similarly, future research should consider incorporating additional metrics, such as percentage energy savings and CO2 emissions reduction, to further enhance the evaluation of the implemented improvements.
Footnotes
Acknowledgments
This research was funded by Fondocyt Grant No. (FONDO-CYT-2023-1-3C1-0547) in the Dominican Republic. The authors acknowledge the support provided by the Thematic Network 723RT0150 “Red para la integración a gran escala de energías renovables en sistemas eléctricos (RIBIERSE-CYTED)”.
Author contributions
Conceptualization: D.M.-H. and MA-M.; methodology: D.M.-H. and MA-M.; investigation: D.M.-H., G.S.-S., A.J.T.C. and Y.R.R; writing—original draft: D.M.-H. and MA-M..; software: D.M.-H.; formal analysis: D.M.-H., MA-M., G.S.-S., A.J.T.C. and Y.R.R.; writing—review and editing: D.M.-H., MA-M., G.S.-S., A.J.T.C. and Y.R.R.; validation: D.M.-H., MA-M., G.S.-S., A.J.T.C. and Y.R.R. ; supervision: D.M.-H. All authors have read and agreed to the published version of the manuscript.
Declaration of conflicting interests
The authors declared no potential conflicts of interest with respect to the research, authorship, and/or publication of this article.
Funding
The authors received no financial support for the research, authorship, and/or publication of this article.