
Abstract
This study compares early gesture and lexical development in 1,199 infants (0;8–1;6) across South Africa’s 11 official spoken languages using the MacArthur-Bates Communicative Development Inventory: Words and Gestures. We examined the effect of age, sex, ecological (urban-rural) setting, and maternal level of education (MLE) on early language development. Age was a significant predictor of gesture, comprehension, and production. There was no evidence of a female advantage, except in one language (Sesotho sa Leboa), where females were more likely to produce words. For ecological setting, results were mixed, with five out of 11 languages showing both positive and negative effects for urban versus rural environments. We found no evidence for the impact of MLE in seven out of 11 languages. We discuss possible explanations for these results.
Introduction
We compare developmental trajectories of early gesture and lexical development in 1,199 infants 0;8 to 1;6 across South Africa’s 11 official spoken languages using the MacArthur-Bates Communicative Development Inventory: Words and Gestures (MB-CDI:WG): a parent-report tool for measuring early language development (Fenson et al., 1994; Frank et al., 2021; Marchman & Dale, 2023).
Studies of early language development using the MB-CDI:WG show similar trends in gesture and lexical acquisition (Bleses et al., 2008a; Dale & Goodman, 2005; Frank et al., 2021). Gesture development mostly follows a similar sequence at comparable ages (Frank et al., 2021). Lexical development increases with age but shows considerable individual variation, an asymmetry between comprehension and production, and a production spurt late in the second year (Bleses et al., 2008a). Direct crosslinguistic comparisons of MB-CDI studies show consistent trends in gesture production but some variability in the acquisition of specific gestures (Frank et al., 2021). There is also considerable variation in lexical comprehension and production scores across languages (Bleses, et al., 2008a; Urek et al., 2019).
Although the above studies propose various explanations for these differences, the lack of standardization in MB-CDI adaptation processes makes reliable crosslinguistic comparisons challenging (Bleses et al., 2008a; Jarůšková et al., 2023). Jarůšková et al.’s (2023) review of 43 MB-CDI adaptations notes that MB-CDIs do not always cover the same types and number of gestures, words vary considerably in number and difficulty, and the availability of information on adaptation and administration varies.
Our aim was to identify and compare trends in early gesture and lexical development across 11 languages using a standardized adaptation process of the MB-CDI:WG along with similar administrative protocols to explore the impact of three demographic factors, two that have often been found to affect variability in child language development: sex and maternal level of education (MLE) and, less commonly, urban versus rural settings. Some studies have found urban-rural differences in lexical development, suggesting that ecological settings may have an impact (see Bornstein & Cote, 2005 for Argentina, Italy, USA; Smith-Hefner, 1988 for Indonesia; Southwood et al., 2021 for South Africa; Vogt et al., 2015; Vogt & Mastin, 2013 for Mozambique).
This study’s 11 languages belong to two language families: nine southern Bantu languages in four groups (Nguni: isiNdebele, isiXhosa, isiZulu, Siswati; Sotho-Tswana: Sesotho, Sesotho sa Leboa, Setswana; Tswa-Ronga: Xitsonga; and Tshivenda), and two West Germanic languages: South African English (SA English) and Afrikaans.
We give an overview of South Africa’s main linguistic and socioeconomic characteristics and then summarize what is known about gesture and early lexical development and the impact of sex, urban-rural settings, and MLE. We briefly describe our adaptation, instrument harmonization across languages, and data collection procedure. We report our main findings and discuss their implications for how language, individual differences, and different environments may influence language development.
Linguistic and Socioeconomic Context
The population of South Africa is 62 million (Statistics South Africa (SSA), 2023). Table 1 shows the number and proportion of speakers for each language. 1
Number and Proportion of Official Language Speakers in South Africa.
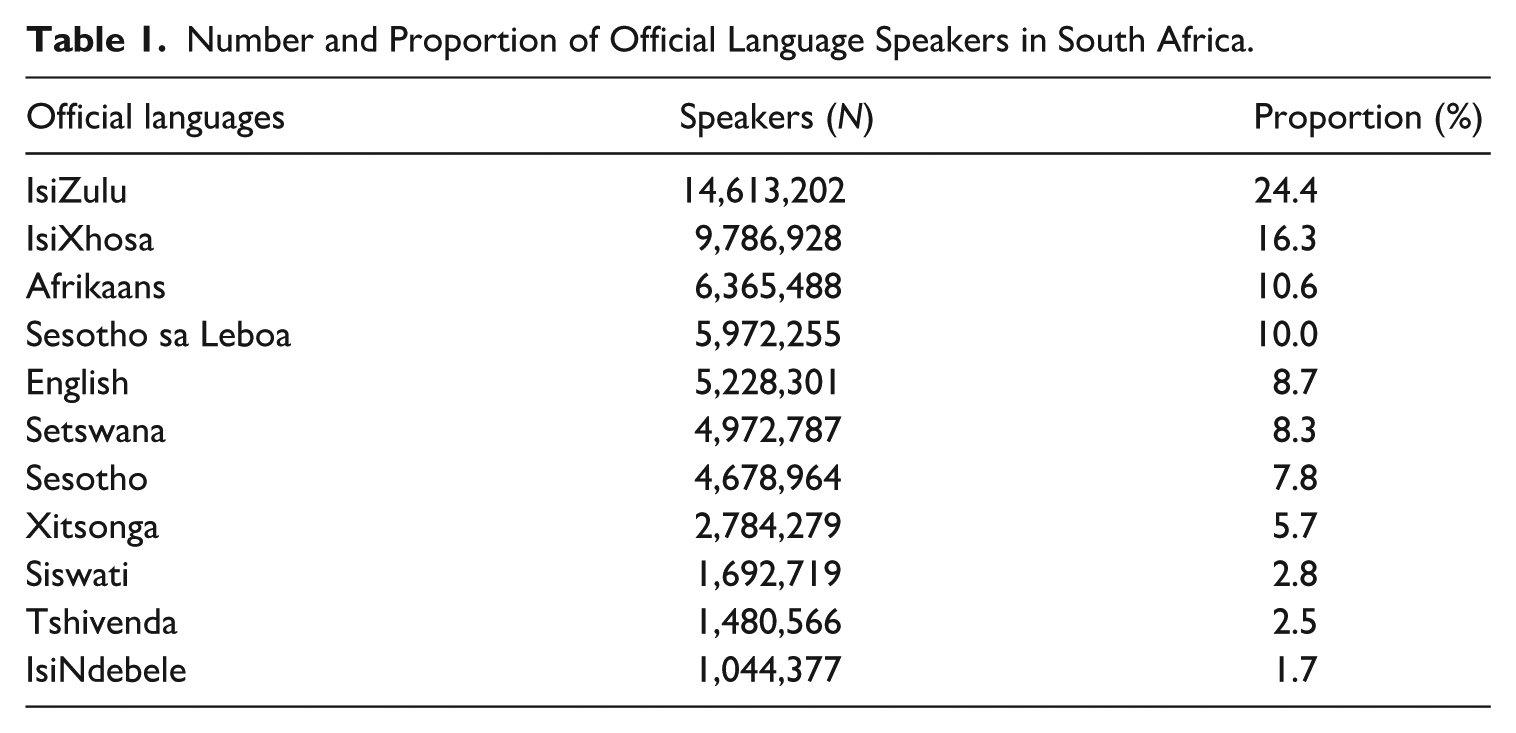
Languages are largely regionally represented except in Gauteng province, where speakers of all South African languages are found (Figure 1). SA English and isiNdebele are not dominant in any region. Most South Africans acquire English as an additional language.
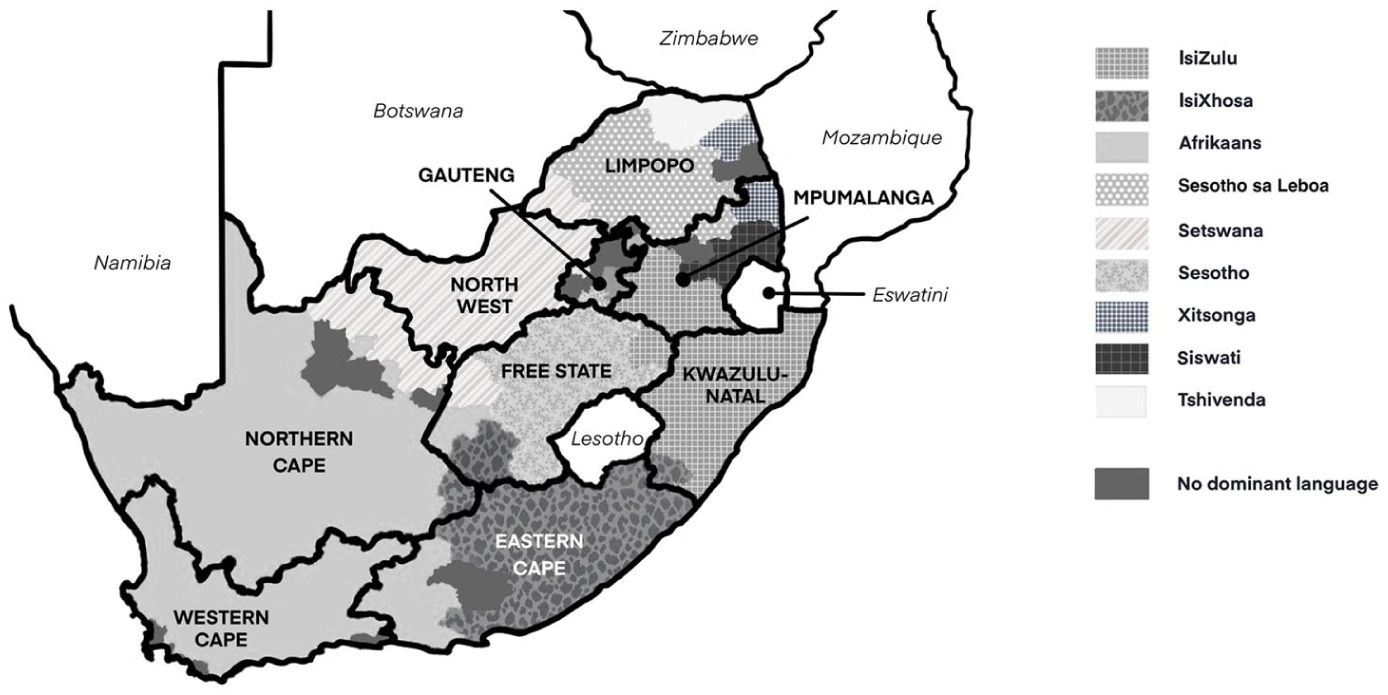
Map of South Africa showing distribution of regionally dominant languages.
Each language has regional variation and is influenced by contact with other languages (see Bloom Ström, 2018 for isiXhosa; Carstens & Raidt, 2019 for Afrikaans; Herbert & Bailey, 2002 on Bantu languages; Kubheka, 1979 for isiZulu; Rapeane, 1997 for Sesotho; Kula & Marten, 2023 for Setswana; Louwrens et al., 1995 for Sesotho sa Leboa; and Mulaudzi, 2010 for Tshivenda; and Rapeane, 1997 for Sesotho).
The southern Bantu languages are agglutinative and morphologically rich. Nouns fall into roughly 16 grammatical classes, varying by language. Nouns are marked with class prefixes. Verbs, adjectives, and function words must agree with the nouns’ class through prefixation. Verbs take markers for tense, aspect, mood, and negation. High–low tone systems make grammatical and lexical distinctions (Gowlett, 2003). Bantu languages use a high proportion of bound morphemes and few standalone roots (Nurse & Philippson, 2004).
English and Afrikaans are analytic, with limited inflectional morphology and minimal agreement. Afrikaans has few verb conjugations but retains verb-second word order and employs extensive compounding. Afrikaans and SA English use a high number of free roots and have a low morpheme per word ratio (Brookes et al., 2025).
Sixty-nine percent of South Africans live in urban areas (SSA, 2025). Yet, 40% of children reside in rural areas, rising above 60% in four provinces (Hall et al., 2024). Median household annual income is 95,770 ZAR or $5,258 (SSA, 2025). In 2018, the per capita Gini index was 67, reflecting significant income inequality (Sulla et al., 2022). Unemployment stands at 41% (SSA, 2025). Among citizens 20 years and older, 7% have no formal education, 4% have seven or fewer years of schooling, 38% completed high school, and 12% have post-school qualifications. Sixteen percent of children under six years do not live with their biological mothers (Hall et al., 2024). For children under five years, 36% attend daycare (SSA, 2023).
Early Language Development
Gesture Development
Early gesture acquisition follows a similar developmental path across languages (Bates et al, 1979; Cameron-Faulkner et al., 2021; Liszkowski et al., 2012; Tamis-LeMonda et al., 2012). Crosslinguistic comparisons of American English, French, Hebrew, Italian, Korean, Mexican Spanish, Norwegian, and Slovak MB-CDIs show that children’s first communicative gestures develop similarly (Frank et al., 2021). Deictic gestures such as reaching, requesting, and giving emerge early (Fenson et al., 1994). Pointing appears across languages between 0;10 and 1;2 (Liszkowski et al., 2012). Conventional gestures—waving and games like “peekaboo”—are also produced early (Frank et al., 2021). Studies using MB-CDIs of American English (Frank et al., 2021) and Peruvian Spanish (Fernández-Flecha et al., 2021) report that almost all early communicative gestures (e.g., giving, head nods) are present by 0;8 to 0;9. Representational gestures start emerging at around 1;0 (Schults et al., 2012). Gestures imitating adult actions and pretend play emerge later (Frank et al., 2021). Overall, the development of early gestures appears similar across languages, but studies have noted differences in the onset of some gestures (Frank et al., 2021).
MB-CDI studies show that females are ahead of males in early gesture production (0;8–1;4) (Alcock et al., 2025; Eriksson et al., 2012; Fenson et al., 1994; Simonsen et al., 2014). Fenson et al. (1994) observed a significant advantage for American English females (0;8–1;4) in overall gesture production in four of five gesture categories but emphasized that sex accounted for only 1.25% of variance. Using proportional scores with age as a fixed effect, Fenson et al. (1994) found females were ahead of males in the category Pretending to be a Parent, but males were ahead in Imitating Other Adult Actions, that contained stereotypically male actions. Simonsen et al. (2014) also found that females were significantly ahead except in Imitating Other Adult Actions, where males scored significantly higher. Eriksson et al. (2012) reanalyzed MB-CDI data of 4,691 infants (0;8–1;4) from 10 European languages and found females were slightly but significantly ahead of males in gesture production. Only Eriksson and Berglund (1999) found no sex differences for gesture development in Swedish children (0;8–1;4).
The only traceable MB-CDI study that systematically examines the impact of MLE and income on gesture production found that while MLE is not significant, lower gesture production correlates significantly with lower income (Alcock et al., 2025). We found no MB-CDI studies that measure the impact of rural-urban settings on gesture production.
Lexical Development
Studies of early lexical development show substantial individual variability (Fenson et al., 1994; Hamilton et al., 2000; Urek et al., 2019). In general, comprehension appears between 0;8 and 0;10 (Schults et al., 2012) with minimal production before 1;0 (Fenson et al., 1994). The main constants in word acquisition across languages are considerable individual variation, an asymmetry between comprehension and production, and a production spurt late in the second year (Bleses et al., 2008a; Urek et al., 2019).
Bleses et al. (2008a) found differences in the size and rate of vocabulary acquisition among MB-CDI studies of 17 languages. Urek et al. (2019) compared MB-CDI vocabulary scores of American, Latvian, Norwegian, and Russian infants (0;8–1;4). Latvian and Russian infants had significantly higher receptive scores, while Latvian and American infants had significantly higher productive scores. Also using MB-CDIs, Hamilton et al. (2000) found British English children (1;0–2;1) underperformed compared to American children in lexical comprehension and production. However, a larger UK study did not replicate these findings (Alcock et al., 2020). Various explanations for crosslinguistic differences are offered, including semantic and structural differences between languages (Bleses et al., 2008a), and differences in ecological settings (discussed below).
MB-CDI studies often show a female advantage in lexical development. Based on 2,550 American English children (0;8–2;6), Fenson et al. (1994) found that females outperformed males in comprehension and production. Between 0;8 and 1;4, females had a slight advantage for comprehension and production, but sex accounted for less than 2% of variance (Fenson et al., 1994, 2000). Norwegian females (0;8–1;8) also significantly outperformed males in comprehension and production (Simonsen et al., 2014). Schults et al.’s (2012) study of 592 Estonian children (0;8–1;4) found females outperformed males in production, but not in comprehension. Kern (2007) reports a similar finding for French infants.
Bleses et al. (2008b) found no difference in comprehension between Danish females and males (0;8–1;2), although females outpaced males after 1;2. Similarly, using the MB-CDI, Bornstein et al. (2004) report no differences between the combined lexical scores of females and males at 1;1, but at 1;8 females scored higher in production. Danish females only began to show a significant and consistent advantage over males in production from 1;4 (Bleses et al., 2008b). Eriksson et al. (2012) found that females were ahead of males in producing words from 0;8 to 2;6. Unlike Fenson et al. (1994) and Simonsen et al. (2014), they did not find sex-related differences in comprehension.
Some studies do not find evidence of sex-related lexical differences. Eriksson and Berglund (1999) found no differences in Swedish children (0;8–1;4) for comprehension or production. Similarly, Alcock et al. (2025) and Jago et al. (2023) observed no differences in vocabulary in UK samples (0;8–1;6). No sex-related difference in production was found in US Spanish-speaking children (0;8–2;7) (Jackson-Maldonado et al., 1993). Overall, it appears that the female advantage varies across age and language and may increase with age, but sex-related differences are modest (Frank et al., 2021; Schults et al., 2012).
Fewer studies compare lexical development across urban and rural settings. Vogt et al.’s (2015) MB-CDI study of lexical development in Mozambican children (1;0–2;1) found significant urban-rural differences. Urban children had larger vocabularies that correlated with higher socioeconomic status (SES) and MLE. They attributed these differences to variation in urban-rural socialization practices (Vogt & Mastin, 2013; Vogt et al., 2015). For infants (0;8–1;6), Alcock et al. (2025) found no differences among UK English children’s comprehension and production between areas with different indices of multiple deprivation. For older children, Southwood et al. (2021) examined production in children (1;4–2;8) acquiring Afrikaans, isiXhosa, SA English, and Xitsonga. Being urban or rural predicted vocabulary size in some languages, but in specific semantic categories. IsiXhosa-speaking rural children produced significantly more words for Animals, Toys, and Food than urban children, but Afrikaans urban children produced significantly more Animal and Toy words than rural children from poorer households.
Other studies of slightly older children also report mixed results. Bornstein and Cote (2005) used the Early Language Inventory to compare Argentinian Spanish, US English, and Italian rural and urban children at 1;8. They found that urban children produced significantly more words than rural children, except in Italy. Further analysis showed that the syntactic composition of children’s vocabulary was different. Argentinian urban children used significantly more nouns, verbs, adjectives and closed-class words than their rural counterparts. In the United States, urban children produced more nouns and adjectives, and in Italy, rural children used more verbs. Additionally, rural Italian children outperformed their Argentinian peers in nouns, verbs, and adjectives. Rural US children used more verbs than rural Argentinian children. Comparing semantic categories, Argentinian and Italian children produced significantly more People words than US children, and urban children produced significantly more words for Outside things and Places to go.
Across MB-CDI studies, Frank et al. (2021) found that the relationship between MLE and lexical development varies across countries, suggesting other environmental factors at play. However, they found that higher production was consistently associated with maternal post-school education. Children of post-school educated mothers had larger vocabularies, but negatively correlated comprehension scores. They suggest that these effects may be due to reporting biases, as judging children’s comprehension is more ambiguous than production. They also note that the small production vocabularies of infants make it difficult to reliably examine the impact of factors such as MLE on very early lexical production.
Research Questions
Using a standardized adaptation process to generate comparable cross-linguistic data for our 11 languages, we examine the impact of age, sex, urban-rural settings, and MLE in linguistic and sociocultural contexts that have been largely underrepresented in previous research. Our main questions are:
We anticipate that gesture production and lexical comprehension and production will increase with age, but with considerable variability. Based on the literature, we expect to observe female and urban advantages with some crosslinguistic differences. As is standard in child language development studies, we account for possible SES differences using MLE (Ensminger & Fothergill, 2003; Frank et al., 2021). Despite evidence of MLE’s impact on language development in some contexts (Frank et al., 2021), we anticipate that MLE may have minimal impact on early lexical development given our sociocultural environment (see Discussion below and Southwood et al., 2021).
Methods
Instrument Adaptation
The MB-CDI:WG was adapted following the MB-CDI Board’s guidelines (https://mb-cdi.stanford.edu). 2 Language teams—all first language speakers—adapted the MB-CDIs for 11 languages and developed a demographic questionnaire. Due to our funding cycle and the challenges of adapting 11 languages simultaneously, we first adapted six languages and then the remaining five (Brookes et al., 2025). 3
Our adaptations followed the American MB-CDI with three sections: Comprehension of Phrases, Actions and Gestures, and Lexical Comprehension and Production. Our Actions and Gestures section had the same structure as the American MB-CDI, although we adapted items to ensure cultural relevance while remaining close to previous MB-CDIs. For example, we broadened greeting gestures beyond waving to include those from our context, and we replaced vacuuming with sweeping/mopping to reflect local household norms (15% of South Africans own a vacuum cleaner (SSA, 2023)).
Adapting the lexical comprehension and production section, we accounted for children’s exposure across cultural, geographic, and SES contexts, as well as linguistic differences in concept categorization. Unfamiliar items (e.g., moose) were removed, while locally relevant ones (e.g., matches) were added. Regionally restricted words like mango were tested across languages. We also considered dialectal and generational differences. The Bantu language MB-CDIs included no pronouns and fewer function words: clitic agreement markers perform the same functions as Germanic pronouns, and absolute pronouns are used solely for emphatic statements; affixes in Bantu languages fulfill the roles of most Germanic function words (see Gowlett, 2003).
Each language team used 30-minute spontaneous language samples of six children (2;0–2;2) to identify common gestures and lexical items. At least two focus groups (four to six members) of first language speaking early child development professionals and parents/caregivers reviewed each adaptation.
We collected pilot data from 20 urban and 20 rural children with the adapted MB-CDIs of each of the first six languages. We then eliminated words from the adapted MB-CDIs that did not meet four criteria: (a) significant correlation with age, (b) frequency of at least 10% to avoid floor effects, (c) frequency of 90% or less to avoid ceiling effects, and (d) a scale correlation of ⩾0.3. To ensure crosslinguistic comparability, words were retained in all languages if they met these criteria in at least two of the six languages. Some exceptions were made; for instance, word pairs (e.g., yes and no) were retained if one of the words had been retained. We retained a few words known by more than 90% of children to allow caregivers to check at least some items for young infants. We also retained some words that held conceptual or cultural significance, even if they did not fully meet the inclusion thresholds. We adapted the MB-CDIs for the remaining five languages from these shortened and adapted MB-CDIs (see Brookes et al., 2025). Finally, we collected data from approximately 100 caregivers for each language (N = 1,199) 4 to complete the MB-CDI adaptations.
Data Collection
Trained fieldworkers administered the MB-CDIs to respondents using Qualtrics (2020–2023). Approximately half of the urban Afrikaans and SA English-speaking respondents completed the MB-CDI independently. Data collected by fieldworkers had higher completion rates and better data quality, with only 10% to 15% of questionnaires requiring exclusion and replacement for reasons outlined below. In contrast, 20% of independently completed questionnaires were incomplete or otherwise unsuitable.
The Qualtrics platform allowed us to review each submission immediately. Reviewed questionnaires were excluded and replaced if they were: (a) incomplete, (b) completed in under 20 min, or (c) if the child had daily exposure to another language for more than four hours a day (see Höhle et al., 2020 on 20% other-language exposure that typically defines bilingualism; Brookes et al., 2025; Southwood et al., 2021).
We flagged questionnaires for closer review if: (a) completed in 21 to 30 min, (b) children under 1;3’s production exceeded comprehension, (c) there were disproportionately high numbers of late-acquired words (e.g., quantifiers, wh-words) than early acquired words (e.g., food, household items), or (d) the lexical comprehension and production score was exceptionally high for the child’s age. The definition of “exceptionally high” was on a sliding age scale, using the top scores from high-quality responses in the same age and language group. Any score that significantly exceeded peers’ scores—by several hundred—was considered out of range. Such anomalies occurred when caregivers indiscriminately checked many or all items. Exceptionally high score questionnaires were not excluded unless they also violated exclusion criteria (a), (b), and/or (c).
Participants
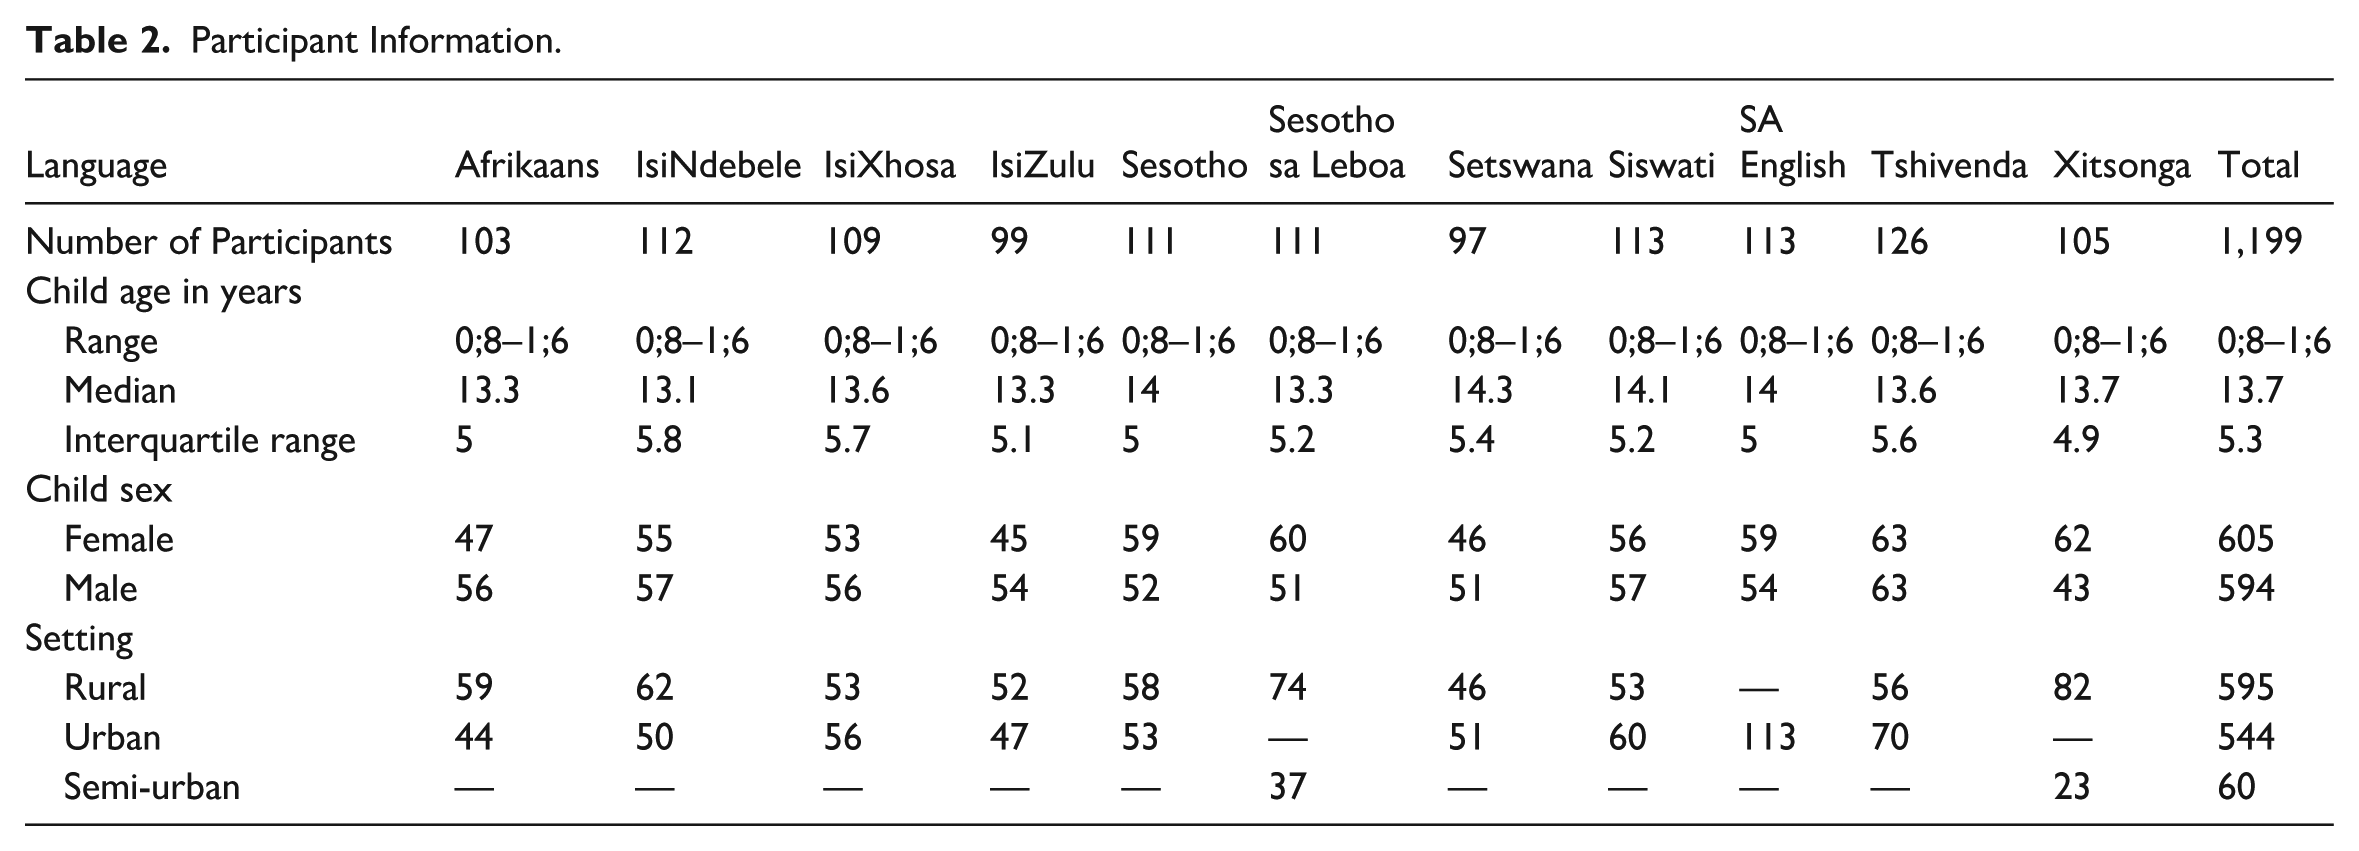
Participants were balanced by age and sex, and by ecological setting (urban-rural), except for SA English participants (who are concentrated in urban areas), and Sesotho sa Leboa and Xitsonga participants from rural and semi-urban areas (see Table 2). The urban-rural divide is continuous rather than sharp and is shaped by South Africa’s apartheid legacy. Former designated black settlements known as “townships” in metropolitan areas (urban) contrast with townships on the outskirts of mid-size towns (semi-urban) and smaller towns (rural) that are close to traditional homesteads typical of rural areas.
Participant Information.
Statistical Analysis
Addressing RQ1, growth trends for gestures and lexical comprehension and production were plotted at the median for each language. Smoothed quantiles were calculated using the quantregGrowth package in R (version 4.3.3), and quantile regression curves were fitted. For comparability, raw scores were transformed into proportions as the number of lexical items varied by language from 733 to 770.
For RQ2, a Generalized Additive Model (GAM) using Tweedie distribution was applied to predict gesture and comprehension. Tweedie distribution is particularly appropriate for handling over-dispersed data, including skewed and heavy-tailed distributions. The R (version 4.4.1) model used the mgcv package and included age as a smooth term to allow for nonlinear developmental trajectories. Sex, area, and MLE were included as fixed effects. All dependent variables were converted to proportions.
For the production analysis, a two-component hurdle model was employed. The components are a zero model that predicts the likelihood of obtaining a nonzero production score using a quasibinomial logistic regression, and a nonzero model that analyses the variation among the nonzero production scores using beta regression. Both models included fixed effects for age, sex, setting, and MLE. Analyses were conducted in R (version 4.4.1) using the glm function for the quasibinomial model and the betareg package for the beta regression.
Results
Gesture Production
The gesture score for each child was calculated as the sum of affirmative responses to the 68 Actions and Gestures items (see Table 3).
Gesture Production Scores by Age, Sex, Setting, and Language.
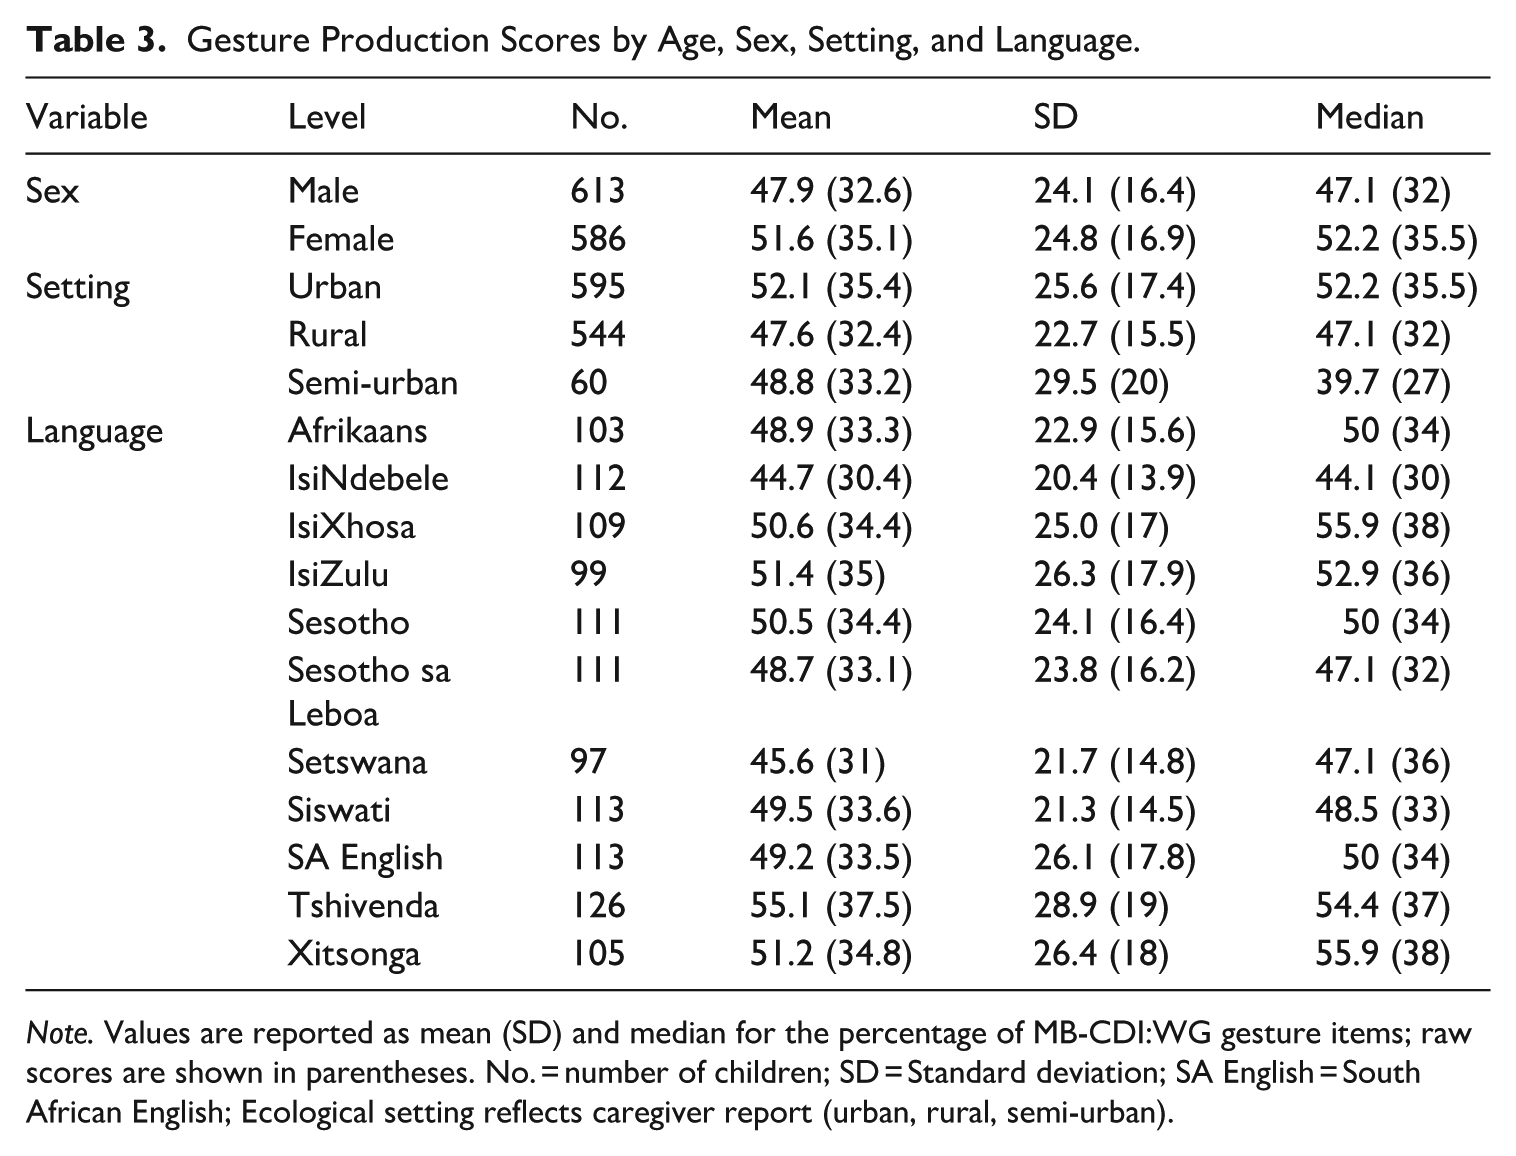
Note. Values are reported as mean (SD) and median for the percentage of MB-CDI:WG gesture items; raw scores are shown in parentheses. No. = number of children; SD = Standard deviation; SA English = South African English; Ecological setting reflects caregiver report (urban, rural, semi-urban).
For the developmental trajectory of gestures, we calculated growth trends for all languages combined and for individual languages. Combined, we observed a steady growth in gesture production with children at the median registering 17% to 32% of gestures at 0;8, increasing to between 65% and 78% of gestures at 1;6 (Figure 2).
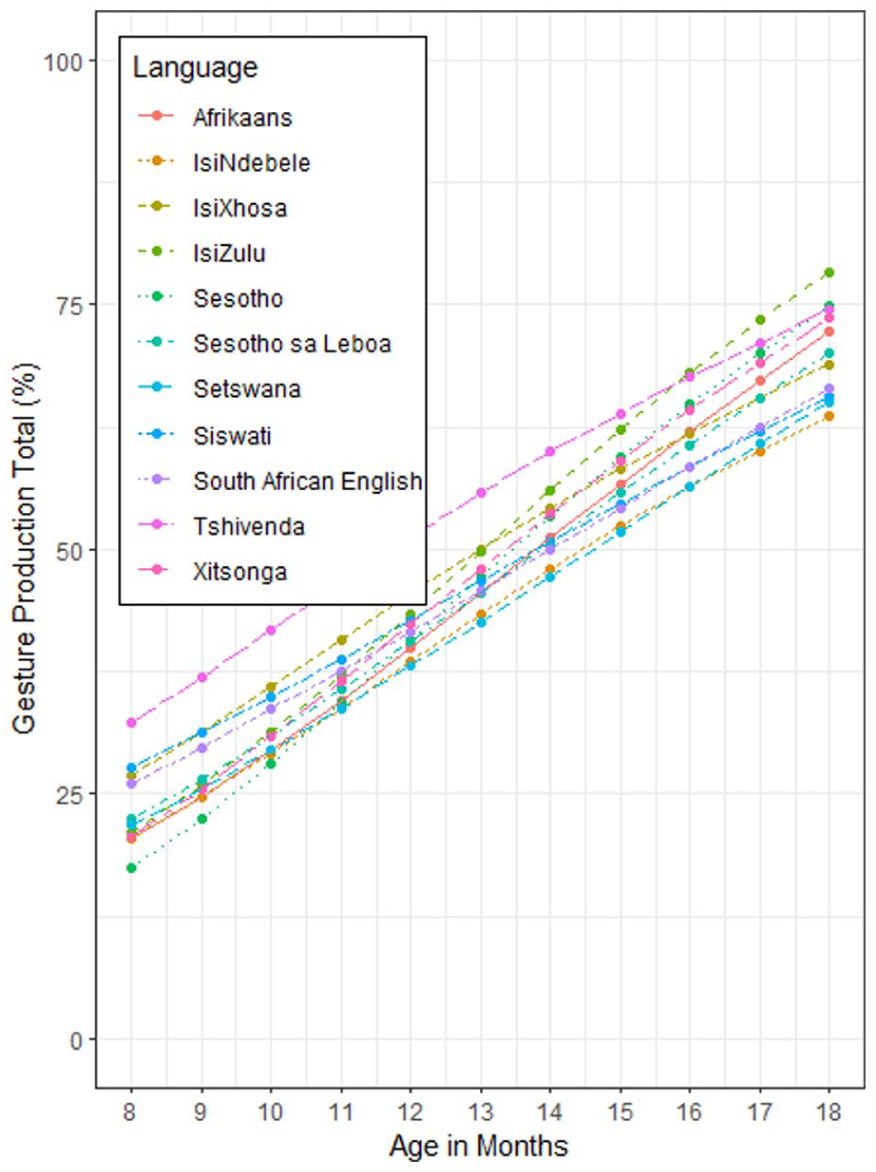
Median gesture production scores (%) by age in months for each language.
Table 4 shows the results of the GAMs predicting gesture use across languages. The models examine the effects of age (modeled as a smoothed term), sex, setting, and MLE.
Generalized Additive Models Predicting Gesture by Language.
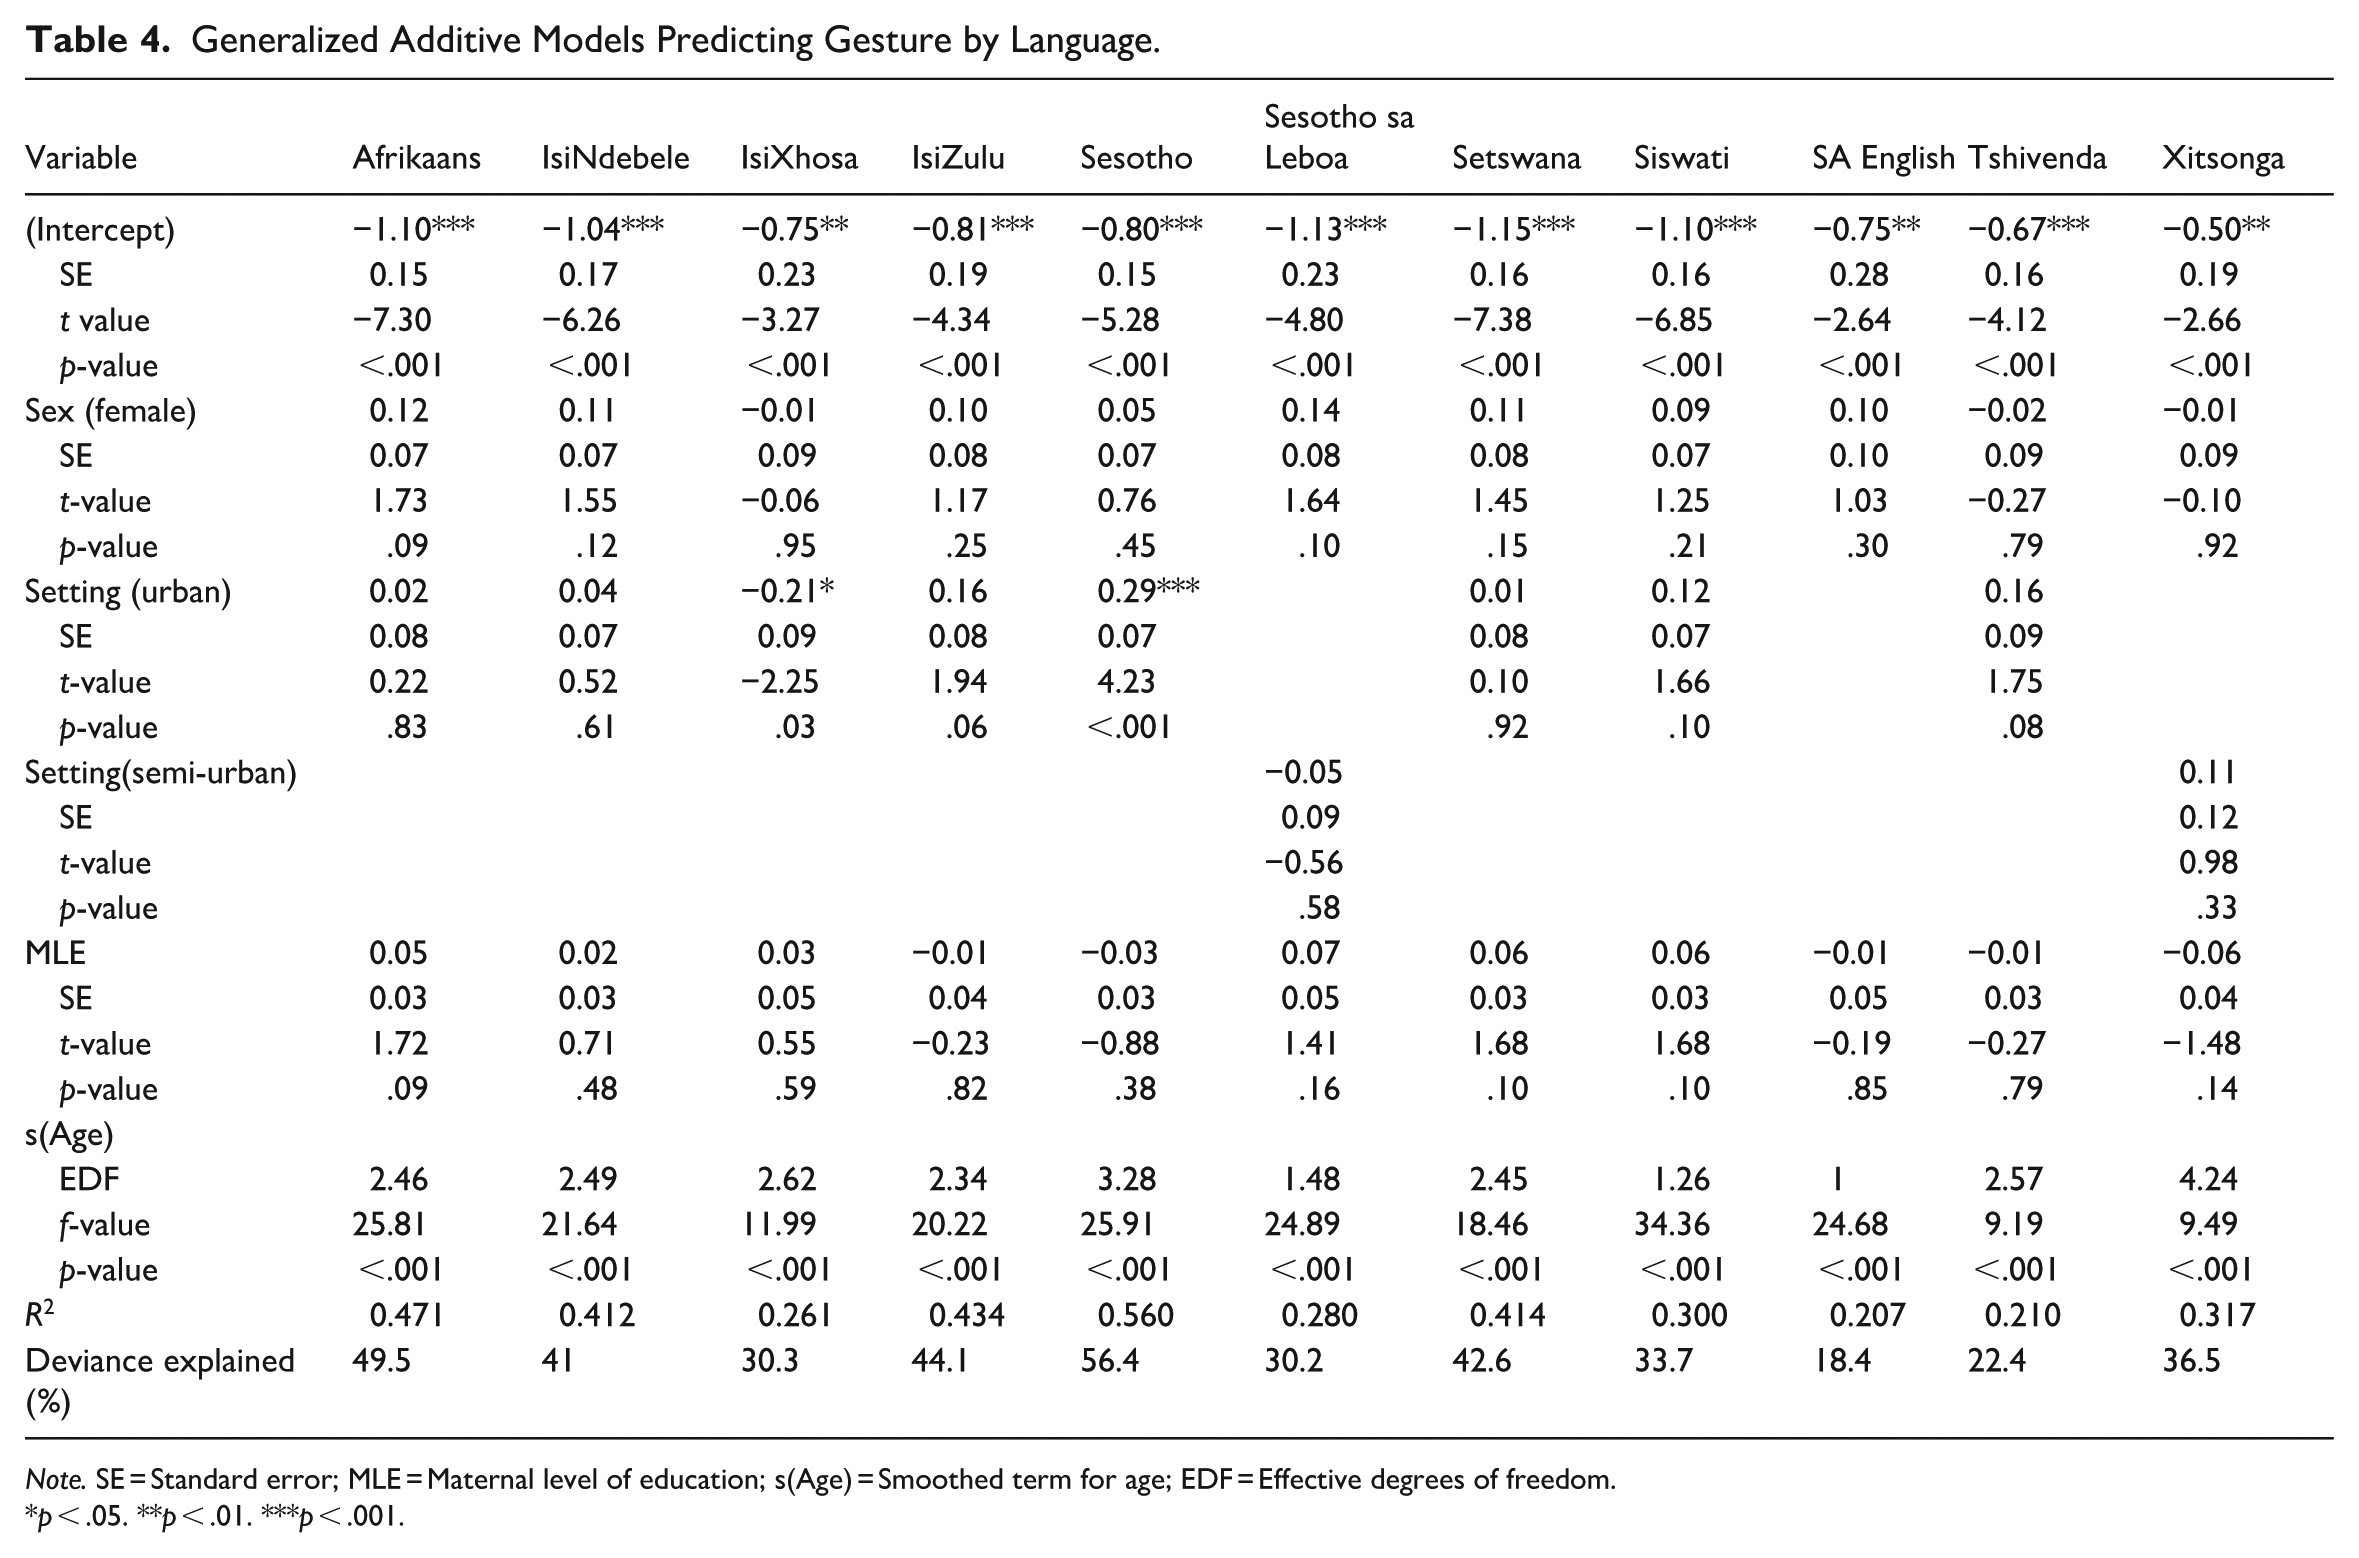
Note. SE = Standard error; MLE = Maternal level of education; s(Age) = Smoothed term for age; EDF = Effective degrees of freedom.
p < .05. **p < .01. ***p < .001.
A significant nonlinear effect of age was observed across all languages (p < .001). The effective degrees of freedom (EDF) varied across languages, ranging from 1.0 for SA English to 4.24 for Xitsonga, where one indicates a more linear relationship and scores greater than two indicate a highly nonlinear relationship. Across languages, there are differing degrees of complexity in the developmental trajectory of gesture use.
For fixed effects, there were no substantial differences between males and females in gesture use. Residing in an urban setting was associated with significantly higher gesture use in Sesotho (β = .29, p < .001), while for isiXhosa (β = −.21, p = .03), urban children used significantly fewer gestures than their rural counterparts. MLE was not a significant predictor in any language.
Lexical Comprehension
Scores for comprehension are shown in Table 5. Across all languages, there was a steady growth in comprehension with median scores of 5% to 19% of words comprehended at 0;8, and 23% to 65% at 1;6 (Figure 3).
Comprehension Scores by Age, Sex, Setting, and Language.
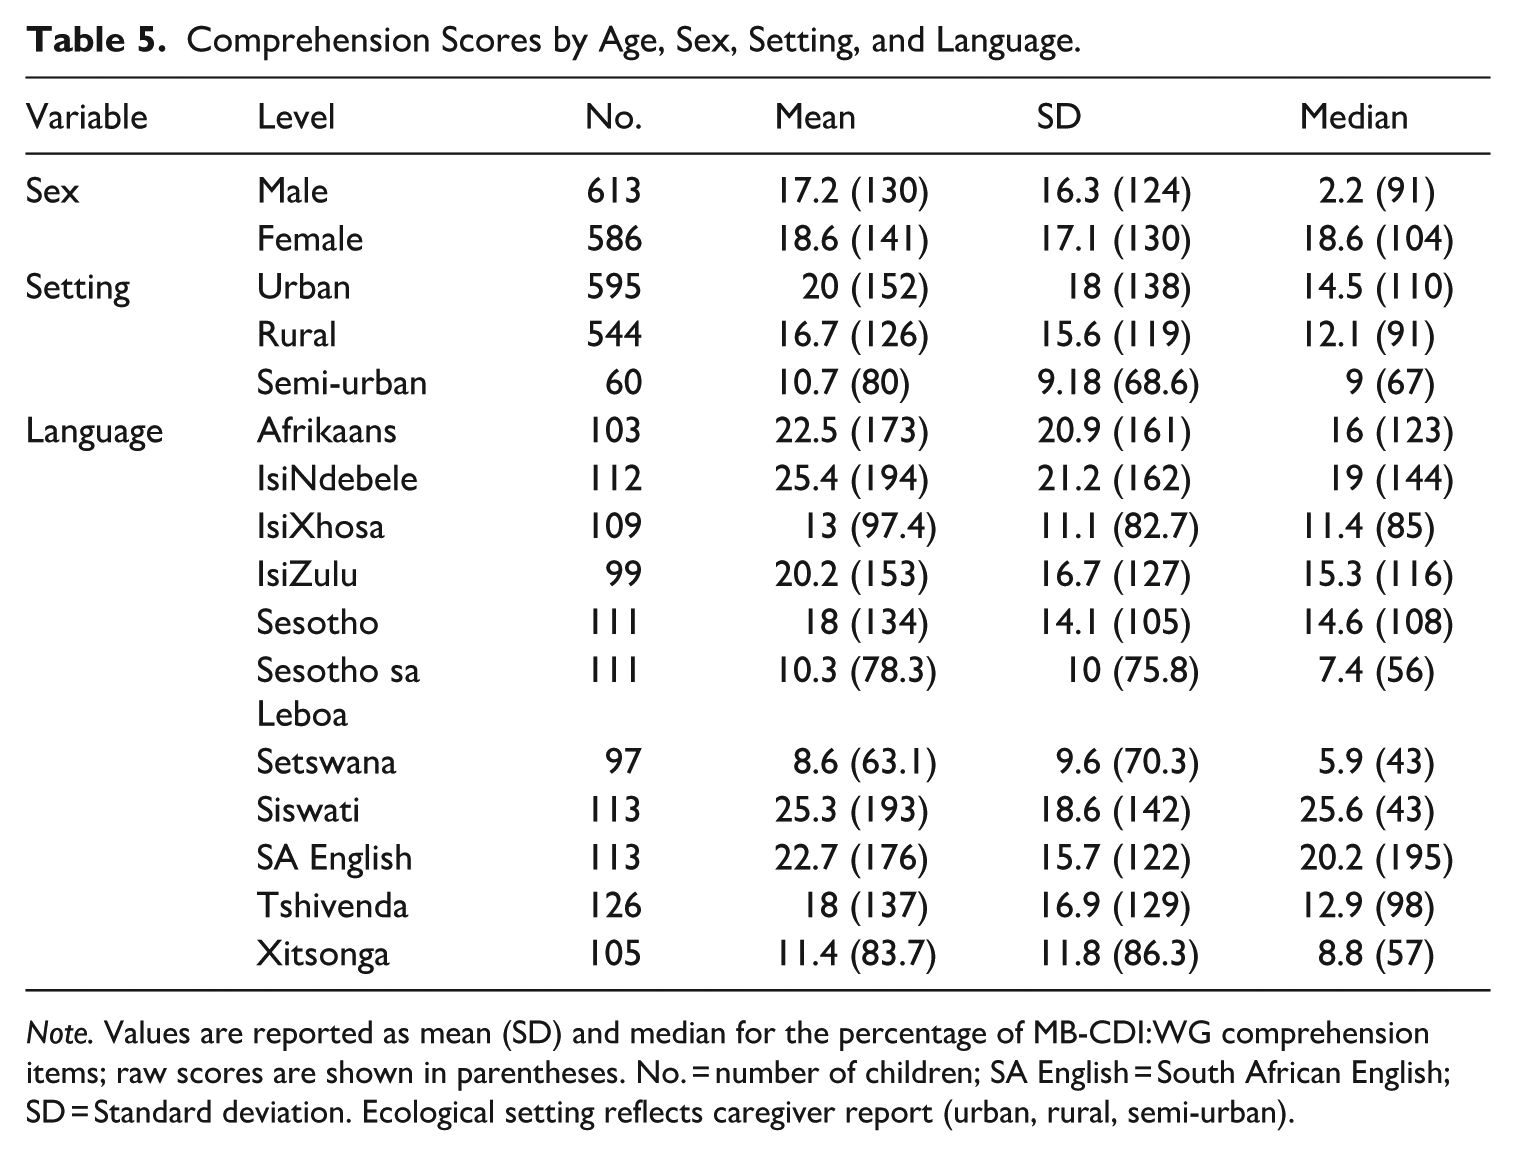
Note. Values are reported as mean (SD) and median for the percentage of MB-CDI:WG comprehension items; raw scores are shown in parentheses. No. = number of children; SA English = South African English; SD = Standard deviation. Ecological setting reflects caregiver report (urban, rural, semi-urban).
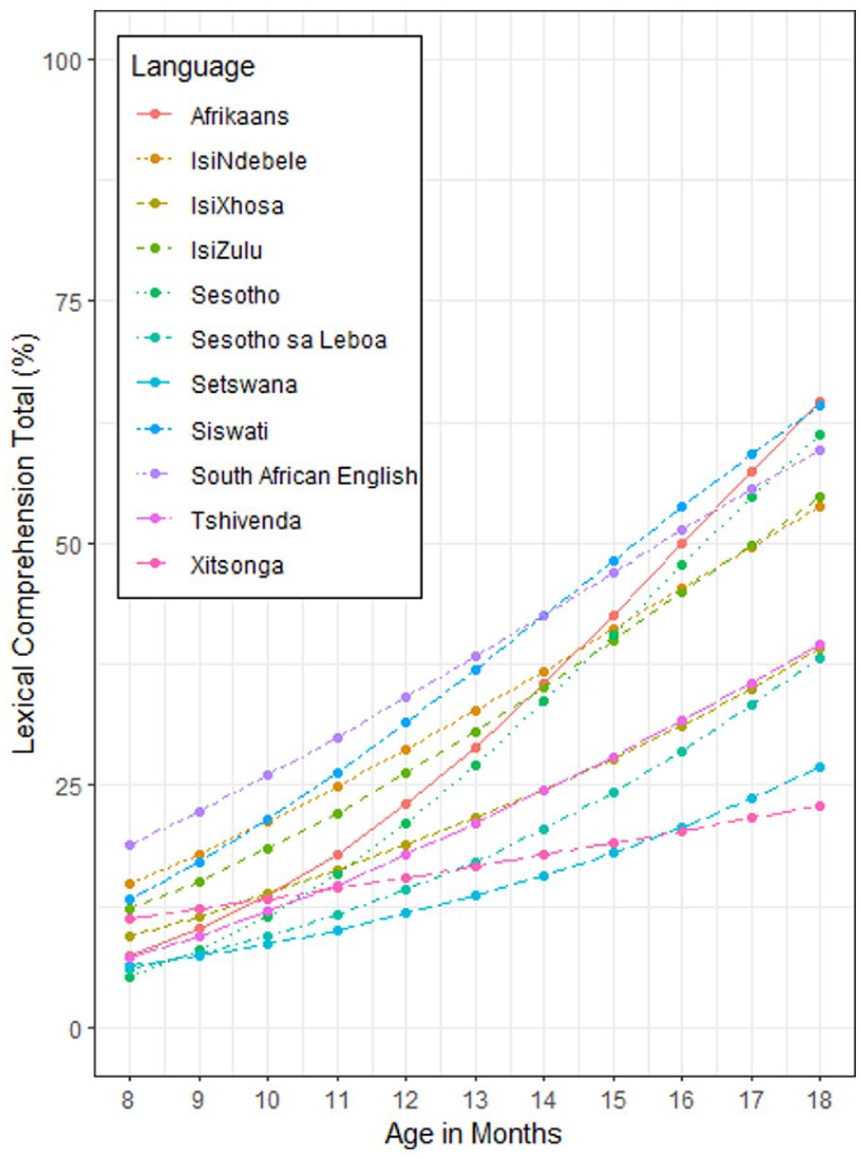
Median lexical comprehension scores (%) by age in months for each language.
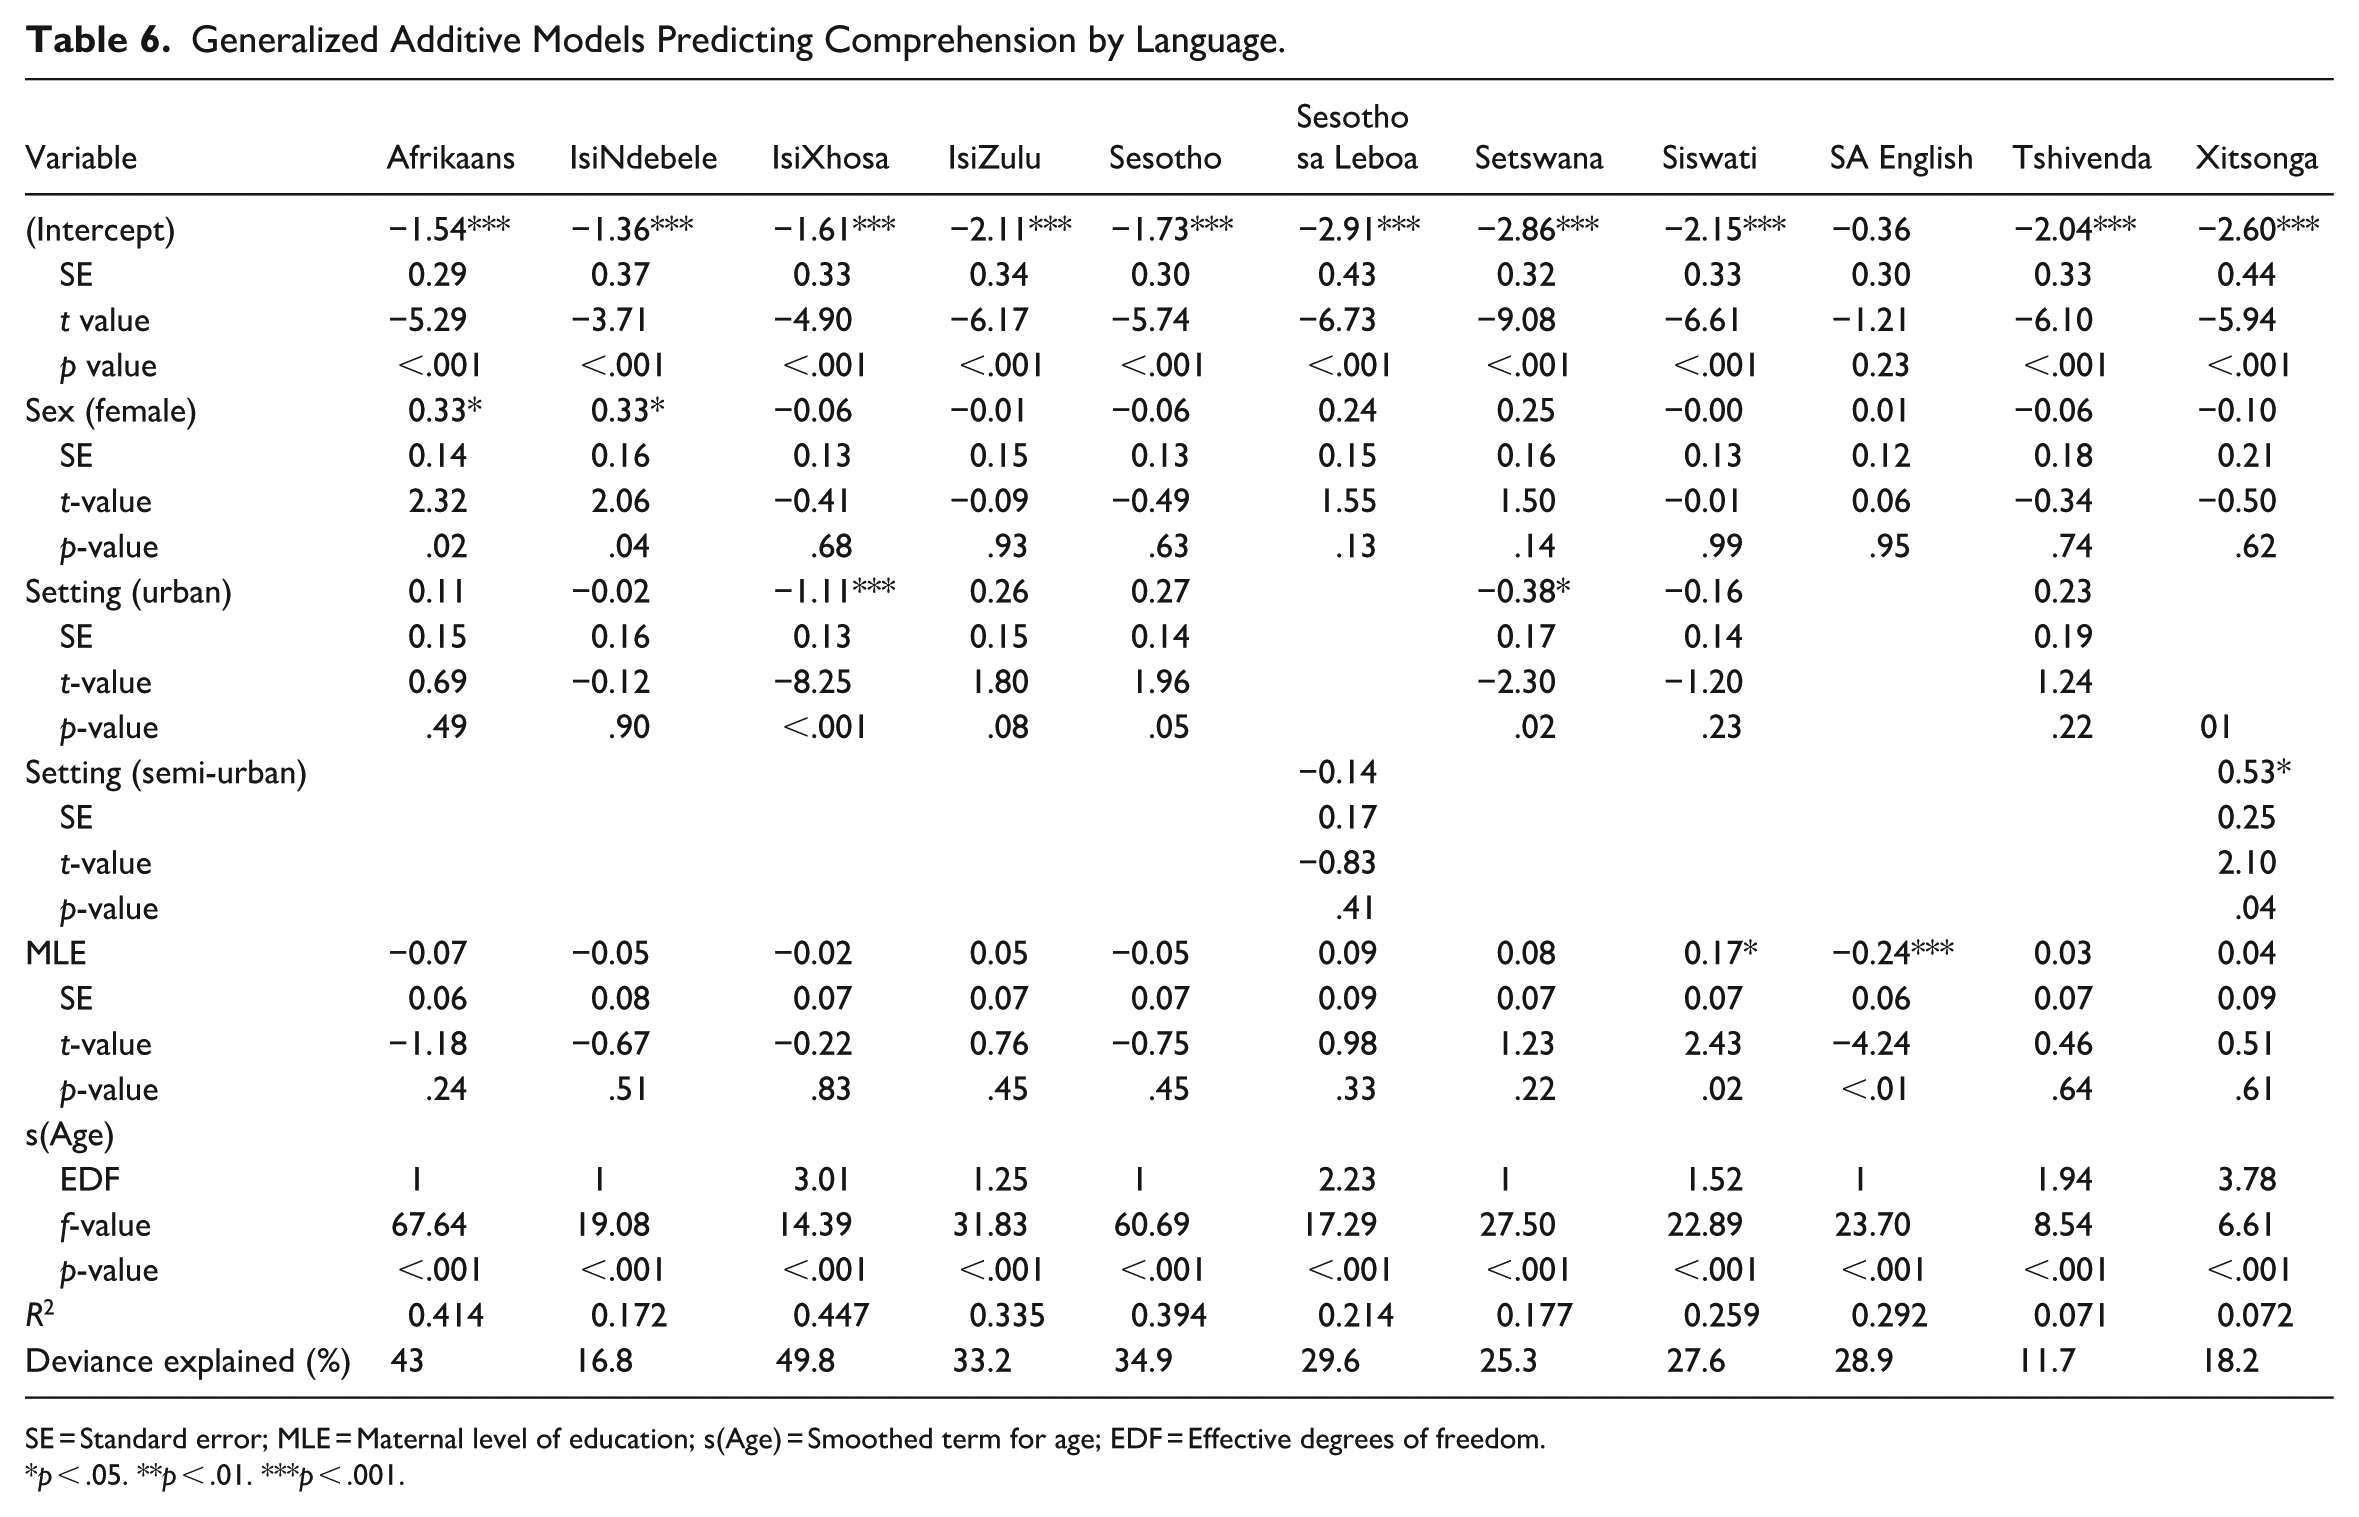
The results of the GAMs predicting word comprehension across languages are shown in Table 6. As with gesture above, the models assess the effects of age (modeled as a smoothed term), sex, setting, and MLE.
Generalized Additive Models Predicting Comprehension by Language.
SE = Standard error; MLE = Maternal level of education; s(Age) = Smoothed term for age; EDF = Effective degrees of freedom.
p < .05. **p < .01. ***p < .001.
A significant nonlinear effect of age was observed across all languages (p < .001), suggesting that the relationship between age and word comprehension varies over development. The EDF ranged from one (Afrikaans, SA English, Setswana, Sesotho) to 3.78 (Xitsonga), indicating that comprehension develops more linearly in the former, but follows a more complex trajectory in Xitsonga.
There was a small but significant effect of sex for Afrikaans (β = .33, p = .02) and isiNdebele (β = .33, p = .04). Females had slightly higher word comprehension scores. No significant sex differences were observed in other languages.
Urban children had significantly lower comprehension scores for isiXhosa (β = −1.11, p < .001) and Setswana (β = −.38, p = .02), while Xitsonga semi-urban children had higher comprehension scores (β = .53, p = .04) than rural children. The effect of MLE was not consistently significant across languages. Higher MLE was associated with significantly lower comprehension scores for SA English (β = −.24, p < .01), while for Siswati (β = .17, p = .02), children of more educated mothers had better comprehension scores.
Lexical Production
Table 7 provides lexical production scores. Across all languages, we observed median scores of 0% to 1% of words produced at 0;8, and 2% to 11% of words produced at 1;6. Before 1;1, growth is relatively slow and flat across all languages, with a noticeable increase in lexical production around 1;2 to 1;3 (Figure 4).
Lexical Production Scores by Age, Sex, Setting, and Language.
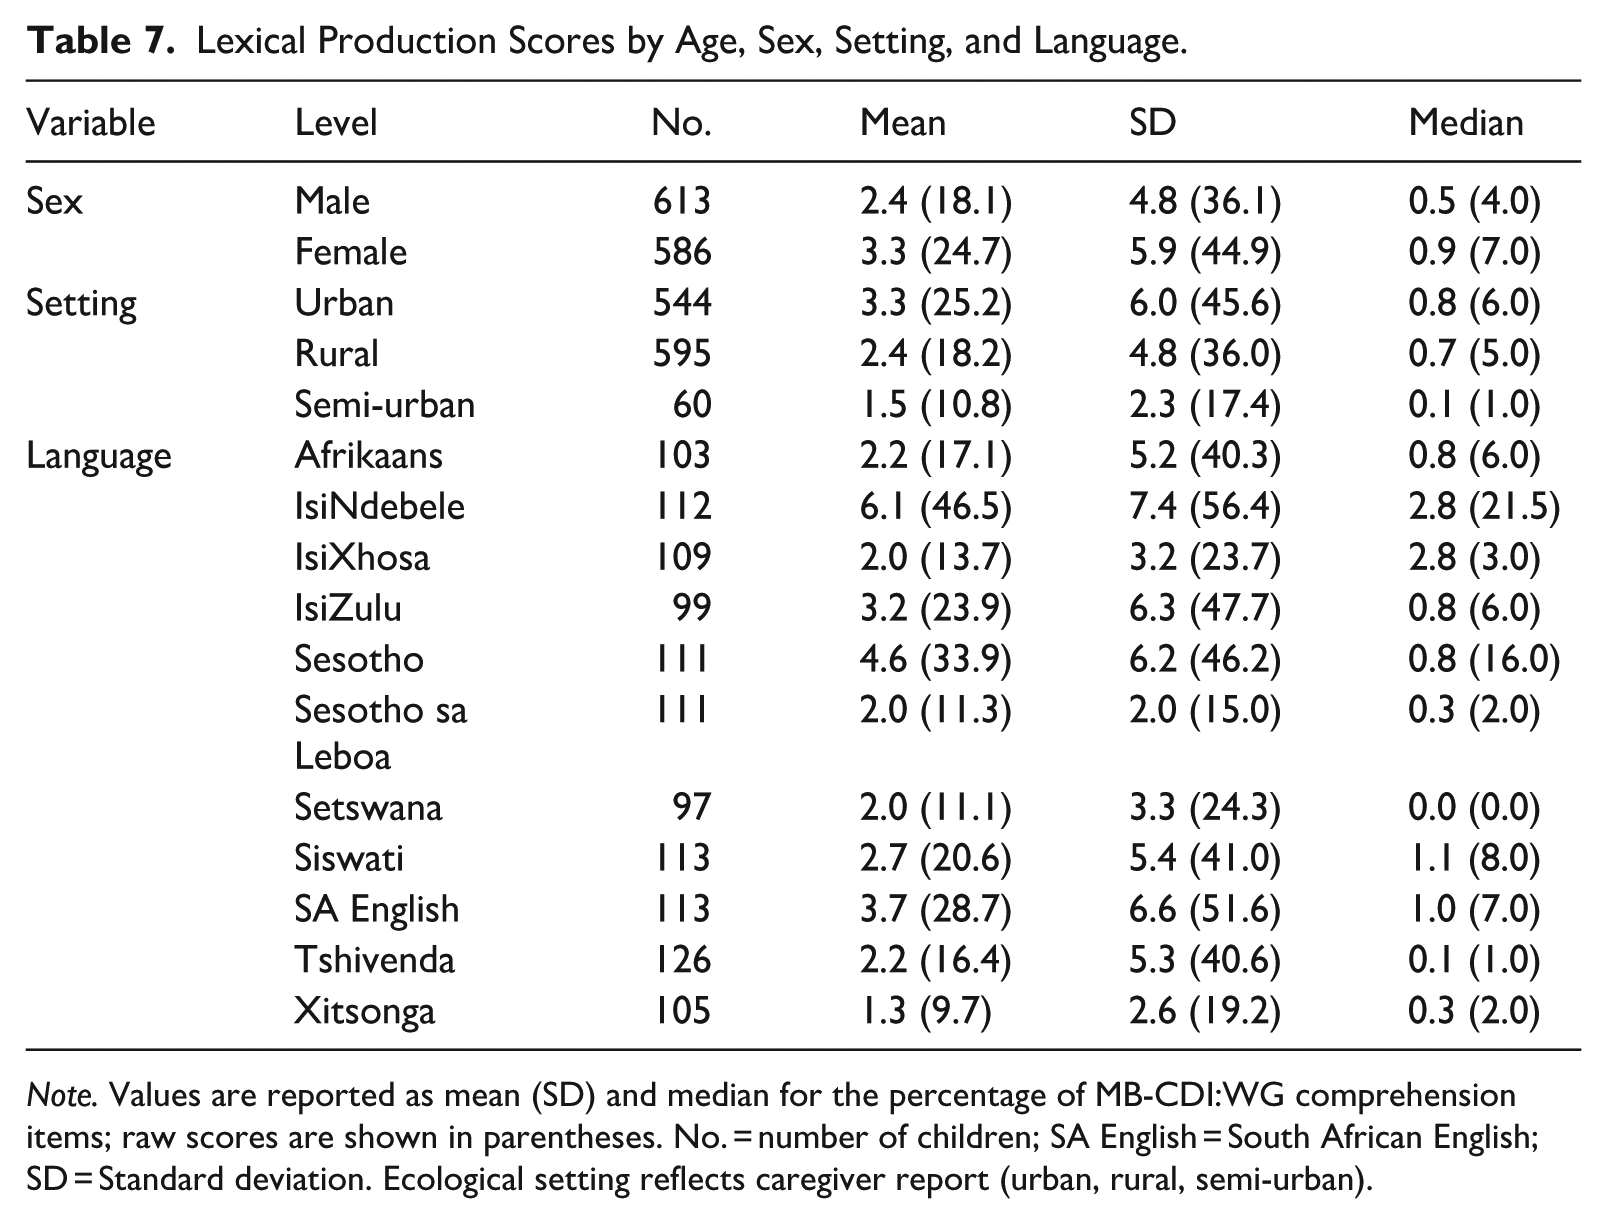
Note. Values are reported as mean (SD) and median for the percentage of MB-CDI:WG comprehension items; raw scores are shown in parentheses. No. = number of children; SA English = South African English; SD = Standard deviation. Ecological setting reflects caregiver report (urban, rural, semi-urban).
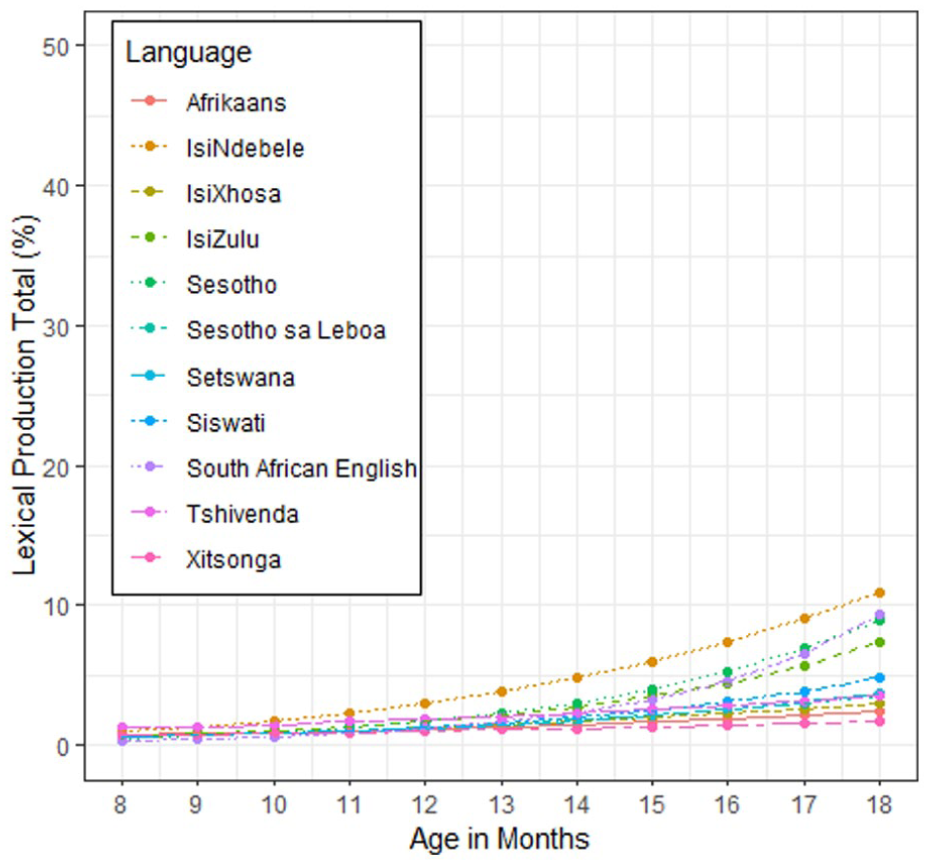
Median lexical production scores (%) by age in months for each language.
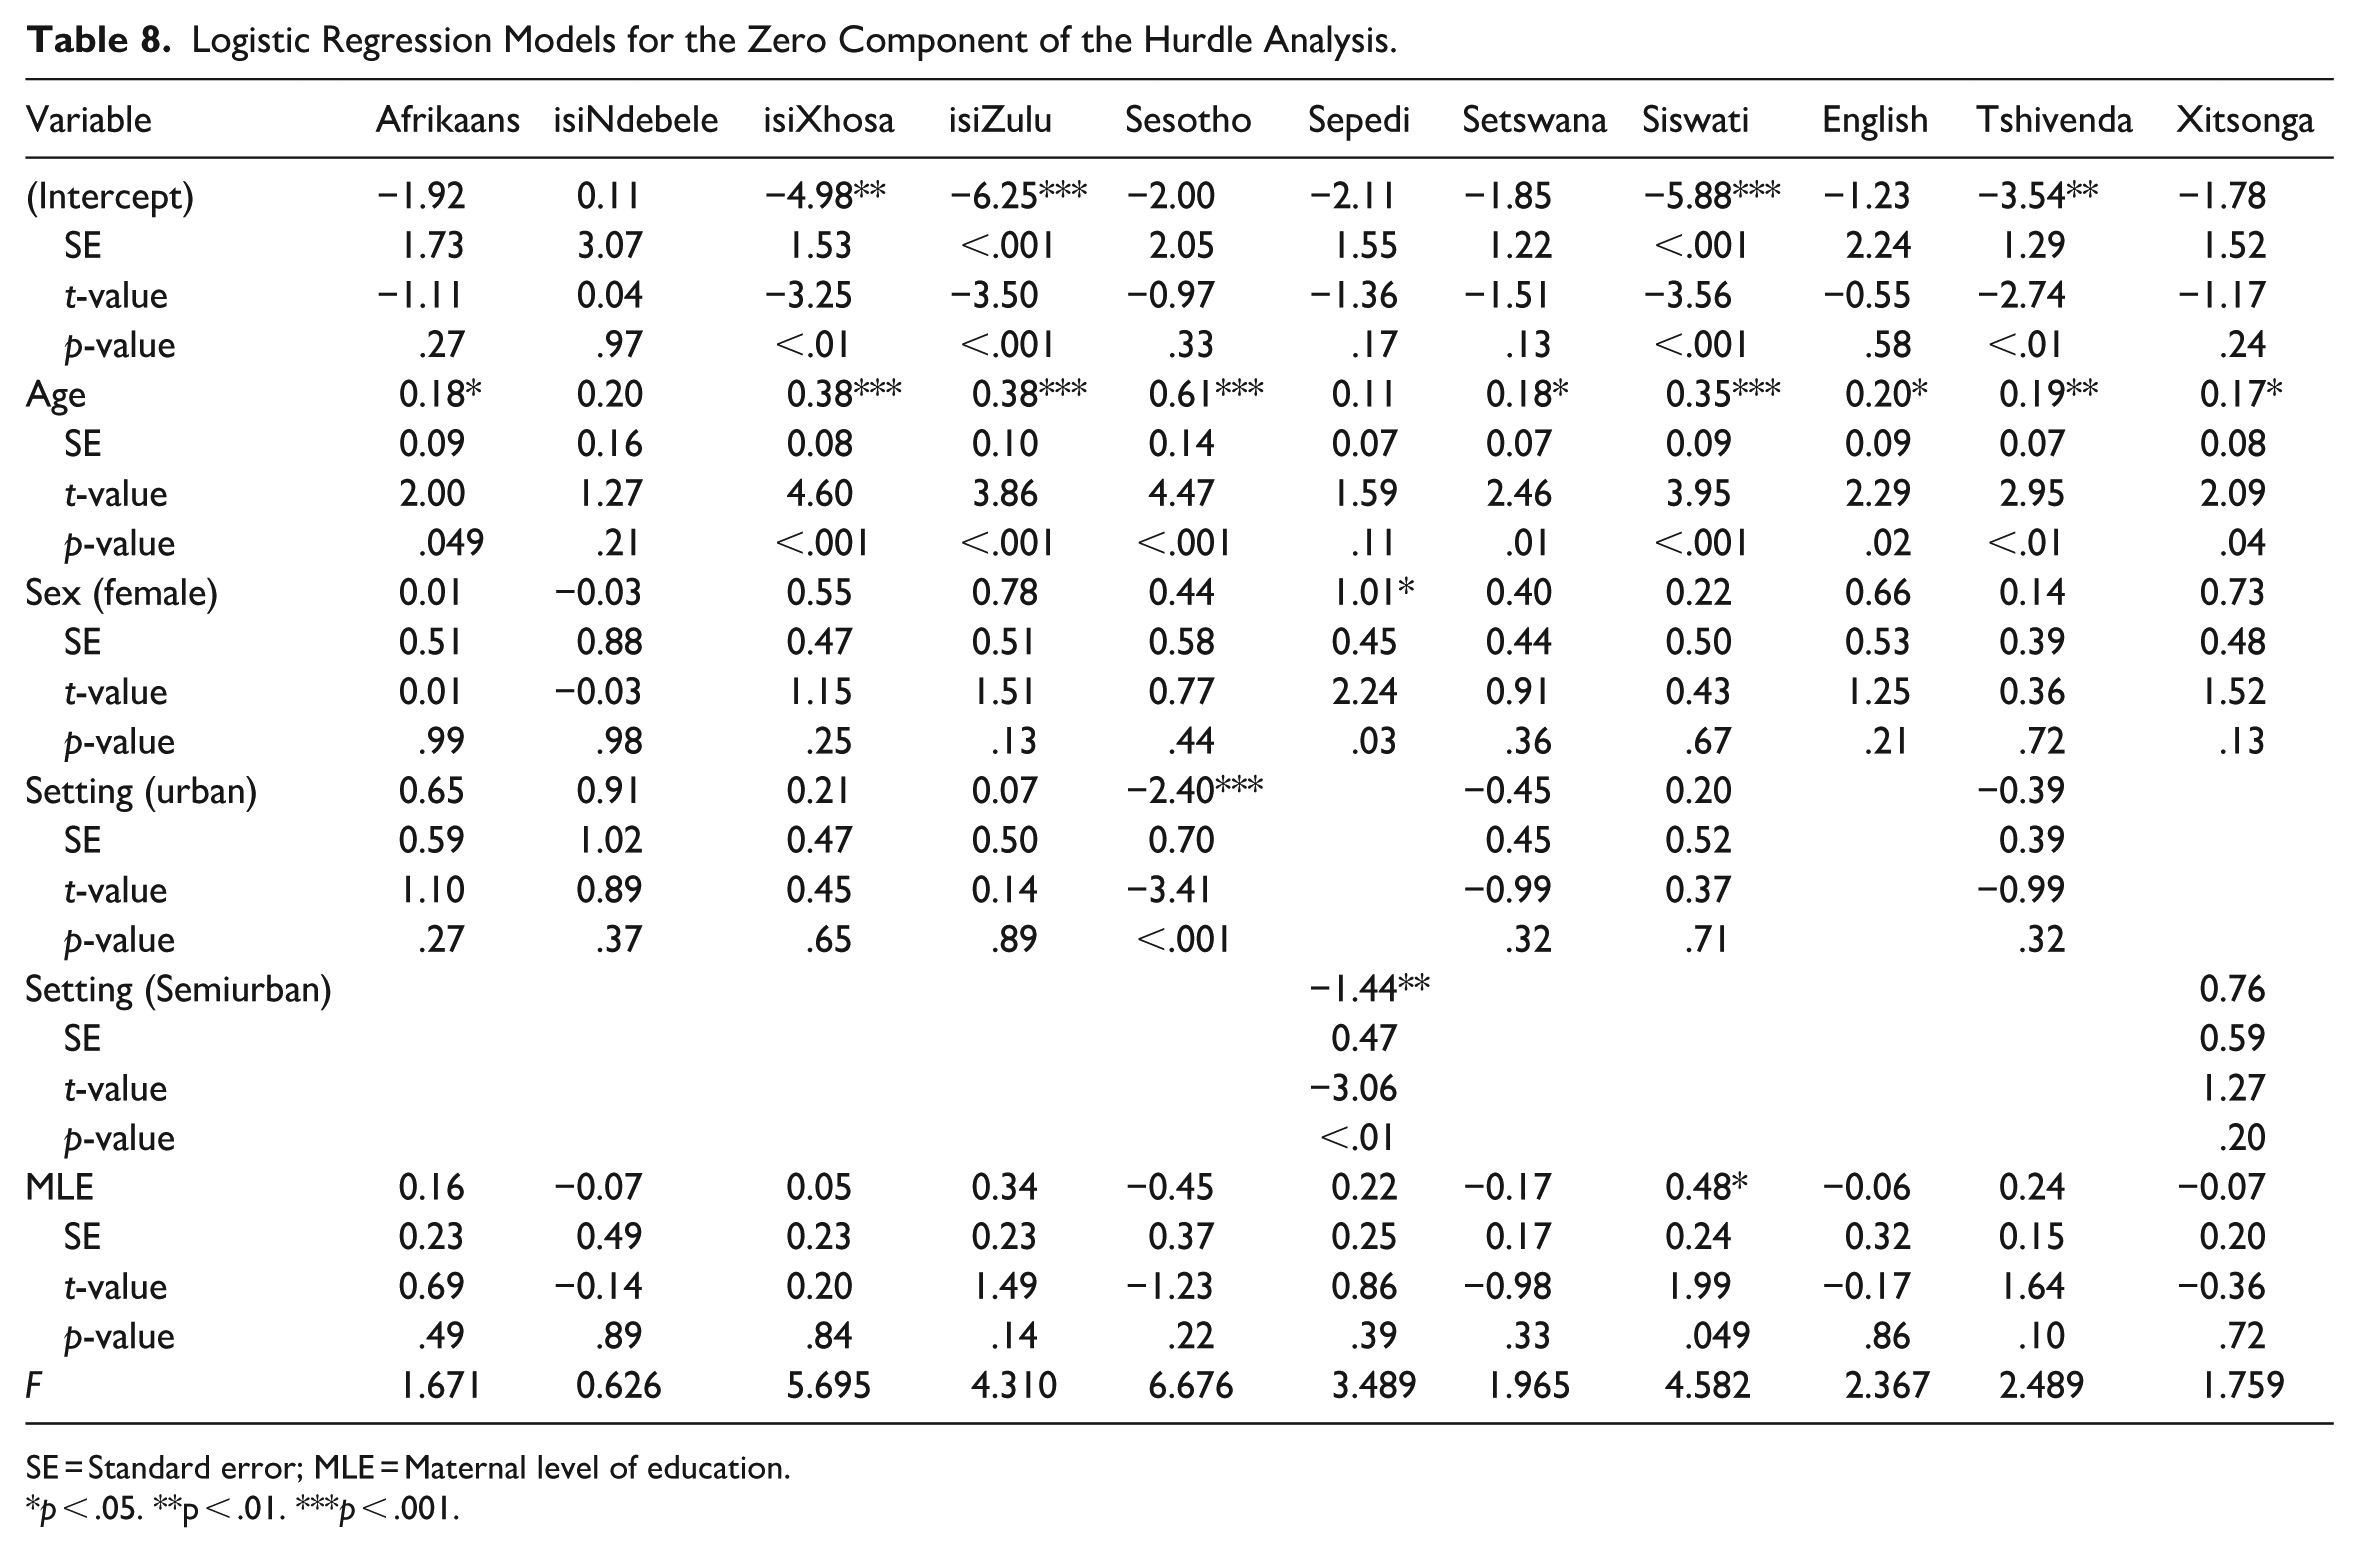
A logistic regression model was used to assess the likelihood of producing any word (zero component), with age, sex, setting, and MLE as predictors. The results are presented by language in Table 8.
Logistic Regression Models for the Zero Component of the Hurdle Analysis.
SE = Standard error; MLE = Maternal level of education.
p < .05. **p < .01. ***p < .001.
Across languages, age was a significant predictor in most models, with older children being more likely to produce affirmative responses. However, for Sesotho sa Leboa and isiNdebele, the effect of age was not significant.
Sex was a significant predictor in one language, Sesotho sa Leboa (β = 1.01, p = .03). MLE did not show consistent effects across languages, with only a marginal effect observed in Siswati (β = .48, p = .049).
The effect of ecological setting varied, with a significant negative effect found in Sesotho (β = −2.40, p < .001), indicating that urban participants were less likely to produce words than their rural counterparts. Similarly, semi-urban Sesotho sa Leboa children were less likely to produce words than their rural peers (β = −1.44, p < .01). There was no significant effect for other languages.
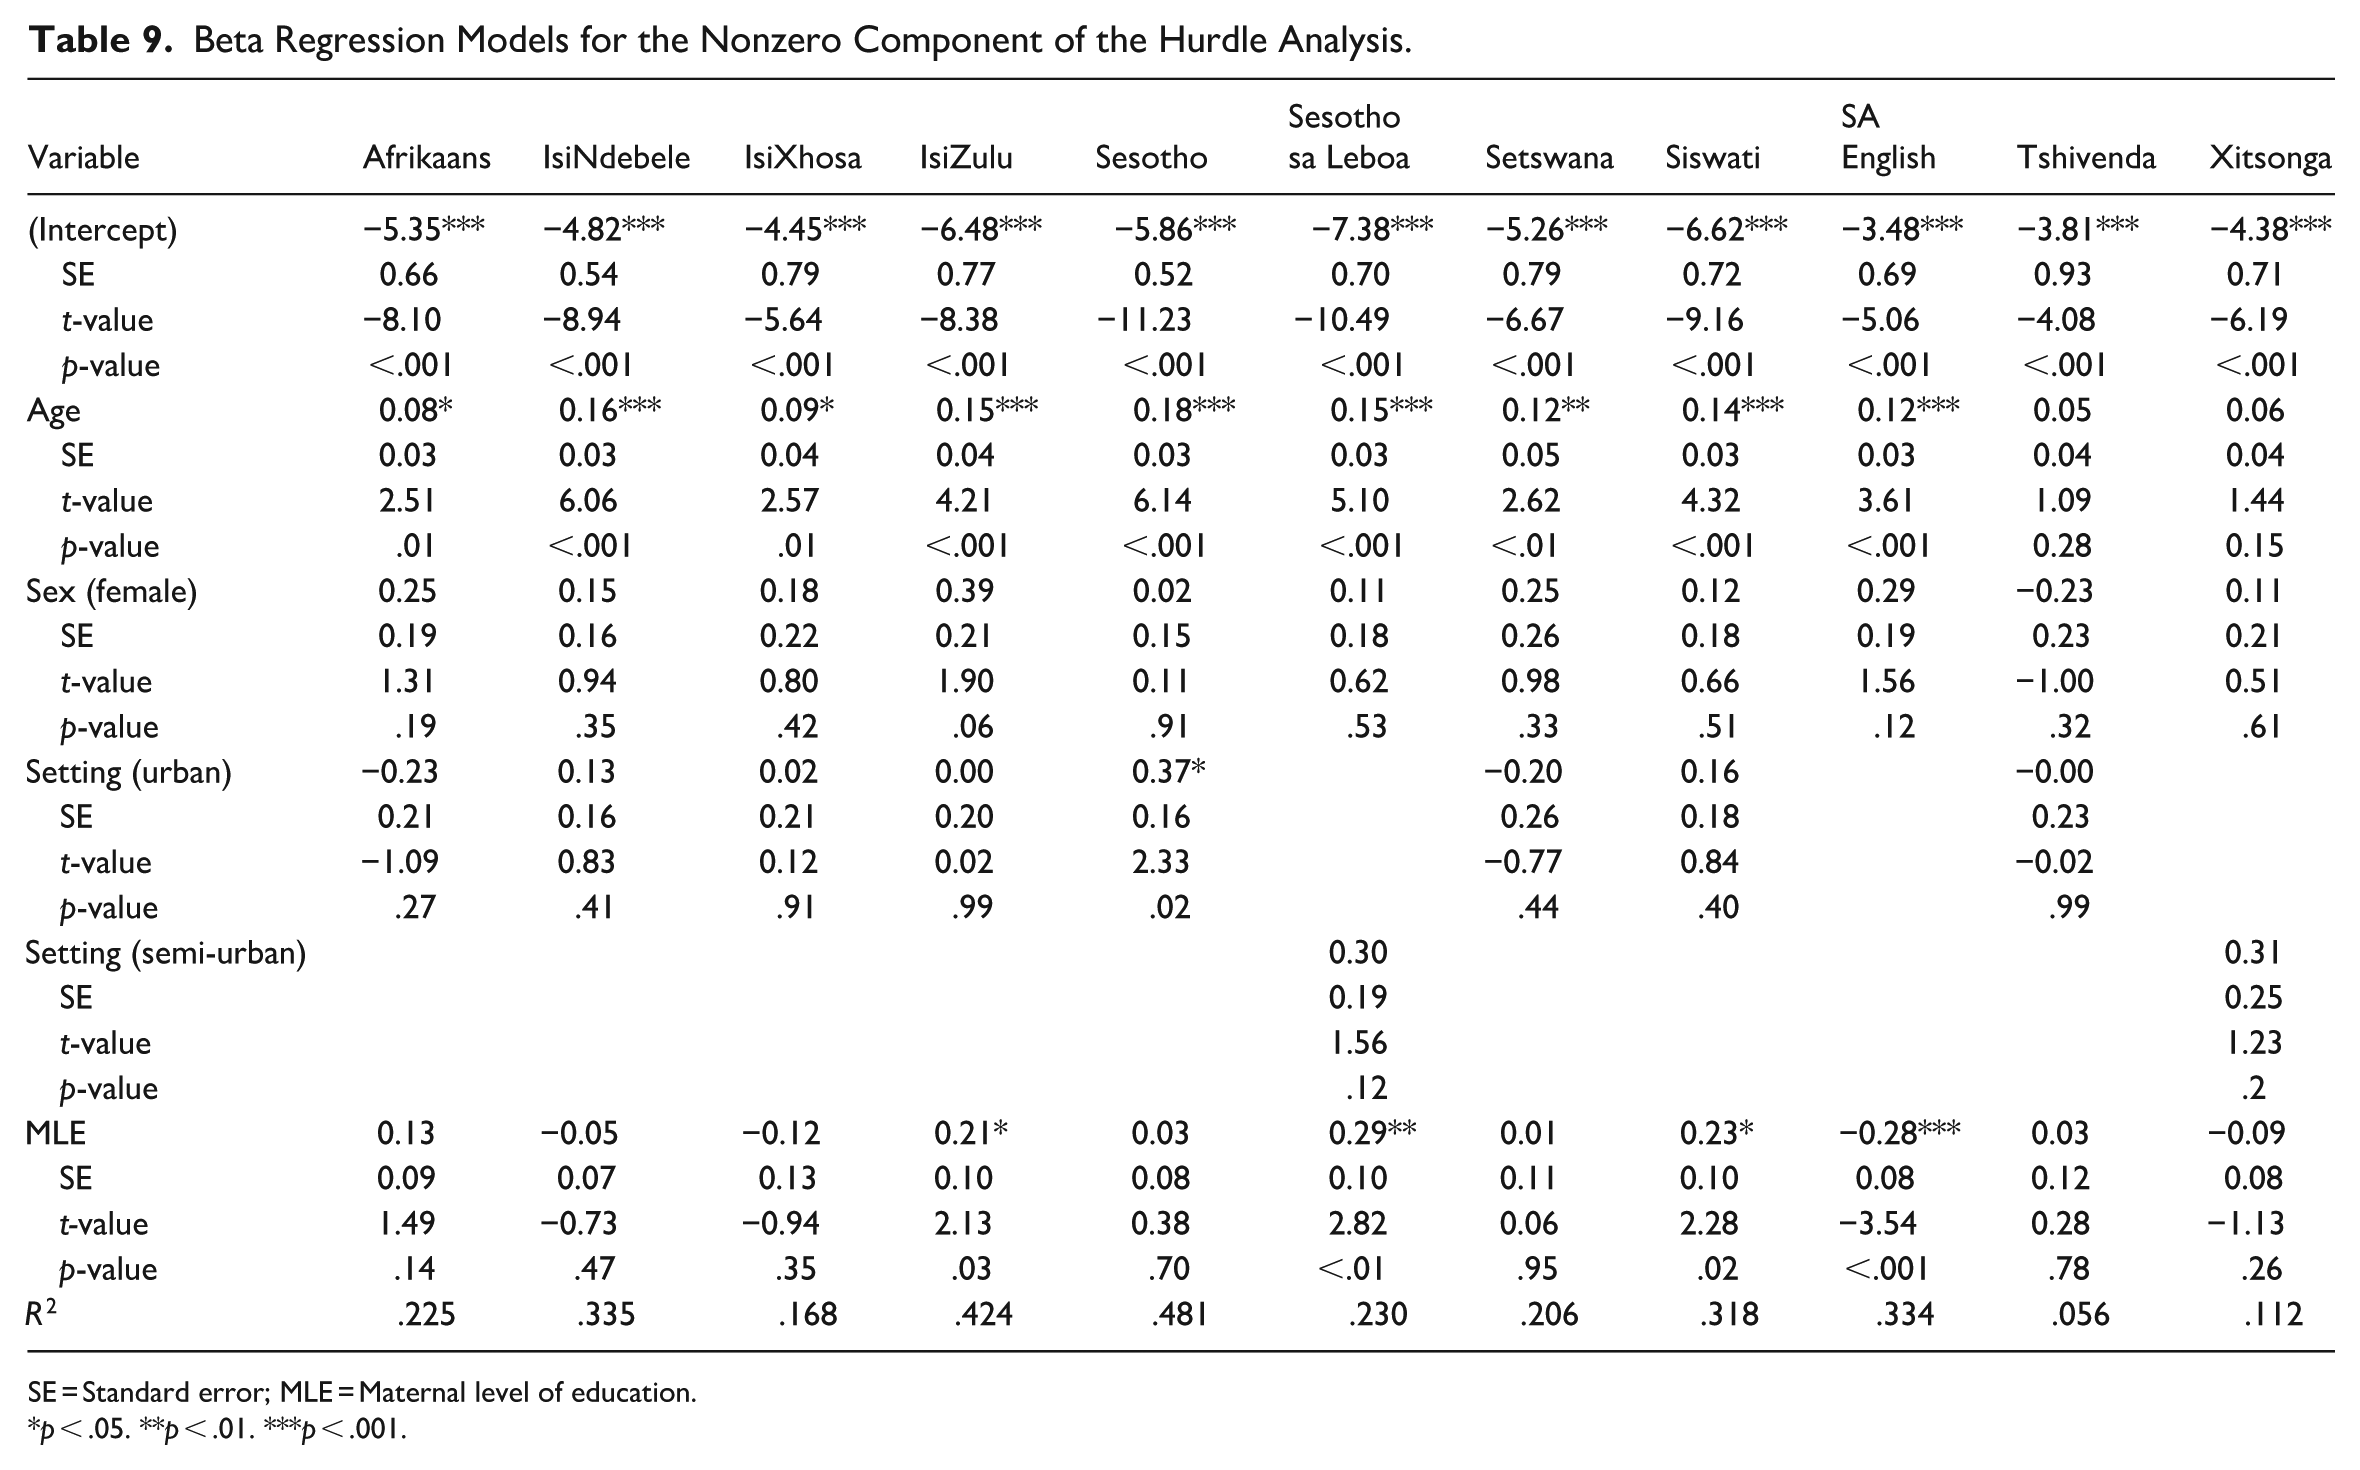
Table 9 presents the results of the Beta regression models for the nonzero component of the hurdle analysis, examining the relationship between age, sex, setting, and MLE with the proportion of affirmative production scores across languages.
Beta Regression Models for the Nonzero Component of the Hurdle Analysis.
SE = Standard error; MLE = Maternal level of education.
p < .05. **p < .01. ***p < .001.
A significant effect of age was observed in most languages, indicating that older children tended to have higher production scores. However, age was not significantly associated with production scores in Tshivenda (β = .05, p = .28) or Xitsonga (β = .06, p = .15).
Sex was not a significant predictor in all models, suggesting that males and females performed similarly across languages. For setting, significant differences emerged in Sesotho (β = .37, p = .02), where urban children had higher production scores than their rural counterparts.
MLE showed mixed effects. For isiZulu (β = .21, p = .03), Sesotho sa Leboa (β = .29, p < .01), and Siswati (β = .23, p = .02), higher MLE was associated with higher production scores. In contrast, SA English (β = −.28, p < .001) showed a significant negative relationship.
Discussion
Age predicted the developmental trajectory of gestures, lexical comprehension and production, but with wide variation in line with previous studies (Bleses et al., 2008b; Hamilton et al., 2000; Wehberg et al., 2008). Eriksson et al.’s (2012) comparison of 10 European languages also found considerable variation in language skills between language communities. Overall, there was minimal lexical production before 1;1, similar to findings for other languages (Fenson et al., 1994; Hamilton et al., 2000). We found a nonlinear effect of age, suggesting that the relationship between age and word learning varies across development. Age effects are often nonlinear with children’s vocabulary growth accelerating or decelerating throughout infancy and childhood. (See Day et al.’s (2025) longitudinal MB-CDI study using Gompertz growth curves, illustrating both nonlinear growth and significant inter-child variability).
Age significantly predicted gesture production, although our results suggest age affects gesture use differently depending on the language. With similar findings, Eriksson et al. (2012) suggest that children may use more gesture types at an earlier age in some communities. All languages showed a positive effect of age for lexical comprehension. For lexical production, the effect of age was mixed for the hurdle analysis zero component. There was a positive effect for all languages except isiNdebele and Sesotho sa Leboa, where there was no evidence of an age effect on the likelihood of producing any word. A different pattern emerged for expressive vocabulary size in the hurdle analysis nonzero component. Age was a significant positive predictor for all languages except Tshivenda and Xitsonga, where no effect was found. Low production and great variability particularly in lexical production up to 1;6, may explain these mixed results.
There was no female advantage in gesture production in any language, a similar finding to Eriksson and Berglund’s (1999) Swedish study. However, these results contrast with other MB-CDI studies (Fenson et al., 1994; Simonsen et al., 2014) and with crosslinguistic MB-CDI studies (Eriksson et al., 2012) that found significant female advantages.
We also found no female advantage in lexical comprehension and production except for Afrikaans and isiNdebele. Other studies also produce mixed results. There was no female advantage for lexical comprehension in a similar age range in Estonian (Schults et al., 2012), French (Kern, 2007), Danish (Bleses et al., 2008b), or American English (Feldman et. al., 2000 for children 0;10–1;1). Eriksson et al. (2012) showed no significant comprehension differences. Other studies of American English and Norwegian showed a slight female advantage (Fenson et al., 1994; Simonsen et al., 2014). Frank et al. (2021) found a small female advantage in comprehension in 16 of 22 languages.
For lexical production, females were more likely to produce any word (zero model) for Sesotho sa Leboa only, with no effect observed in other languages. Sex was not a significant predictor in the nonzero models, showing that males and females perform similarly across languages in this age range. Studies often report a female advantage in production (Eriksson et al., 2012; Fenson et al., 1994; Fenson et al., 2000; Kern, 2007; Schults et al., 2012; Simonsen et al., 2014), but some studies have found no evidence of sex-related differences in early production (Eriksson & Berglund, 1999; Jackson-Maldonado et al., 1993; Jago et al., 2023). A female advantage in production possibly emerges later around 1;4 to 1;8 (Bleses et al., 2008b; Bornstein et al., 2004). Although our results are in line with some studies but not others, a common pattern is the absence of any male advantage. Given the consistent absence of sex differences in our data, we can infer that cultural, individual, or linguistic influences may not yet be evident at this age. We should also consider that high individual variation and low word production at this age may contribute to the lack of observable sex differences, which may emerge in slightly older children.
We observed no significant gesture production differences between urban and rural children in most languages. Exceptions were urban Sesotho infants, who had a significant advantage in gesture production and urban isiXhosa infants, who produced significantly fewer gestures than rural peers. Although studies find many commonalities in early gesture acquisition across languages (Frank et al., 2021), we found no studies that compare ecological settings across languages in gesture development between 0;8 and 1;6. The absence of significant differences across the other languages suggests that the influence of environmental factors on gesture at this stage may be small or negligible.
For lexical comprehension, semi-urban Xitsonga infants had an advantage over rural peers. Conversely, isiXhosa and Setswana urban infants had lower lexical comprehension scores than rural peers. A rural advantage was observed for Sesotho and Sesotho sa Leboa in the likelihood of producing any word. However, for Sesotho infants who did produce words, being urban had a positive effect on the number of words produced. Previous literature on comprehension and production reflects mixed results (Bornstein and Cote, 2005). Local studies report a production advantage for urban children in samples that include older age cohorts: South African children (1;4–2;6) (Southwood et al., 2021) and children in neighboring Mozambique (1;0–2;1) (Vogt et al., 2015). As children get older, consistent differences in ecological settings may become more evident, with variations in urban and rural environmental exposure and socialization shaping both the quantity and diversity of words produced (Bornstein & Cote, 2005; Resches et al., 2023; Southwood et al., 2021; Vogt & Mastin, 2013). These mixed results for urban and rural children could also stem from the variability of the urban-rural distinction across areas and language groups.
There was no effect of MLE on gesture development in any language. In seven languages, MLE also appears not to play a role in lexical development. In the remaining languages, higher MLE was associated with higher comprehension scores and with a higher likelihood of producing any word for Siswati. More educated mothers were positively associated with a larger productive vocabulary for Siswati, isiZulu and Sesotho sa Leboa. In contrast, MLE had a negative association for SA English, predicting lower comprehension and production scores.
Our findings that MLE does not have an impact in seven languages—and has a negative impact for SA English—require explanation. Our SA English mothers had the lowest proportion of incomplete high school education and the second highest proportion of post-school education, indicating a more educated sample than the other language groups. Frank et al. (2021) have suggested that more educated mothers may underestimate their children’s comprehension, a trend that has been found in college-educated mothers.
Frank et al. (2021) argue that SES impacts the earliest language development phases. Although MLE can be a reliable proxy for SES (Bornstein et al., 2003; Hoff, 2003), Frank et al. (2021) report that the relationship between MLE and children’s vocabulary varies across countries/languages, suggesting that additional environmental factors are at play. In our context and other non-Western environments, cultural and economic factors mean childrearing is often the responsibility of other family members. In South Africa, 23% of children do not live with their mother, and 32% of households are non-nuclear or extended families (UNICEF, 2024). Apart from childrearing being a wider family responsibility, children may reside with extended family members if the mother is employed elsewhere. These factors may explain the absence of an effect of MLE on children’s vocabulary development in most South African languages. The number, identity, and education of additional caregivers, time spent caregiving, and economic markers such as income need to be analyzed to address the limitations of using MLE in this sociocultural context.
Conclusion
This paper examined the developmental trajectories of gesture production and lexical comprehension and production between 0;8 and 1;6 across 11 languages using a standardized protocol. Age was a significant predictor for gesture and lexical comprehension and production. We expected a female advantage, but this was not evident in gesture and was only found in two languages for lexical comprehension and one language for lexical production. Many studies find sex-related differences in early lexical development (Urm & Tulviste, 2016), but these findings are not always consistent and may not apply at all stages of language development. Where sex differences are observed, they are generally small and tend to favor females (Bornstein et al., 2004). For urban-rural differences, we had mixed results, with five languages showing sometimes positive effects and sometimes negative effects for urban and rural environments. Despite strong evidence in the literature for the impact of MLE on language development (Frank et al., 2021), we found none for seven languages, a positive effect for three languages, and a negative effect for one language, SA English.
As the MB-CDIs were developed together, cross-linguistic differences due to length are unlikely: the MB-CDIs were similar in length and proportions were used for analyses. Although some variation in form construction is possible, IRT-based latent ability scores suggest that item difficulty was balanced across MB-CDIs (Brookes et al., 2025). A key point is that early production is highly variable and difficult to interpret because of small vocabulary sizes at 0;8 to 1;6 (Frank et al., 2021). Frank et al.’s (2021) analyses did not include early production below 1;4. Analysis of older children from 1;6 to 2;6 using the MB-CDI: Words and Sentences might show an outcome more in line with other studies. Still, Southwood et al.’s (2021) MB-CDI study of children (1;6–2;8) in four South African languages showed that children’s expressive vocabulary scores were not strongly associated with MLE or other indicators of SES. They argue for an alternative theory on the impact of MLE and SES that considers the interaction of different cultural and environmental factors. Although care was taken to provide consistent training and administration across languages, we must consider the possibility of some inconsistencies. Caregivers’ cultural expectations of production and language ability in children may also explain some differences in our results.
While the development of early gesture and speech appears similar across languages (Liszkowski et al., 2012; Tamis-LeMonda et al., 2012), there may be differences that result from interactional input, social practices, and environment (Cameron-Faulkner et al., 2021; Salomo & Liszkowski, 2013) especially as children grow older (Cattani et al., 2019; Marentette et al., 2016; Pettenati et al., 2012; Tamis-LeMonda et al., 2012). This study confirms some common trends in early language development but also some differences, while adding to our knowledge about which factors influence early language development. Future research should adopt a by-language approach with increased sample sizes to confirm these findings.
Footnotes
Acknowledgements
This study was supported by the South African Centre for Digital Language Resources (SADiLaR), a research infrastructure established by the South African Department of Science, Technology and Innovation as part of the South African Research Infrastructure Roadmap (SARIR). We thank the MB-CDI Advisory Board for permission to adapt the MB-CDI, Dr K. J. Alcock, Lancaster University and Prof F. Little, University of Cape Town for their input. Any opinion, findings, conclusions or recommendations expressed are those of the authors.
Author’s Note
Mikateko Ndhambi is now affiliated to Natural and Rehabilitative Sciences, University of Fort Hare, Alice, South Africa.
ORCID iDs
Ethical Considerations
Social, Behavioural and Education Research Ethics Committee (REC: SBE), University of Stellenbosch, 19139, Communicative Development Inventories for all South Africa’s eleven official languages – Phase Two. Ethics Committee of the Linguistics Section, University of Cape Town, 281116, Adaptation of the MacArthur Bates Communicative Developmental Inventory (MB-CDI) Infants’ and Toddlers’ Form: “Gestures and Words” and “Words and Sentences” to Setswana, Sesotho, isiXhosa, Afrikaans and South African English. Faculty of Health Sciences Human Research Ethics Committee University of Cape Town, 166/2019, Adaptation of Xitsonga CDI; 328/2019, Adaptation of Setswana CDI; 313/2021, Adaptation of isiZulu CDI.
Consent to Participate
Informed consent was written.
Author Contributions
Declaration of Conflicting Interests
The authors declared no potential conflicts of interest with respect to the research, authorship, and/or publication of this article.
Funding
The authors disclosed receipt of the following financial support for the research, authorship, and/or publication of this article: This work was supported by the South African Centre for Digital Language Resources (SADiLaR). Communicative Development Inventories for all South Africa’s eleven official languages. (no grant number); Additional funding: National Research Foundation of South Africa (NRF) (HSD170602236563). Preparatory funding: The British Academy Newton Fund (NG160093); NRF/Swedish Foundation for International Cooperation in Research and Higher Education (NRF/STINT160918188417).