
Abstract
This study examines the psychometric properties of the ORAC-PCQ, a fourth-generation actuarial tool designed to assess recidivism risk and criminogenic needs among individuals serving short sentences in Quebec. The instrument consists of three sections: Sociocriminological Profile (eight items), Criminogenic Needs (16 items), and Clinical Information (26 unscored items). Based on a sample of 14,320 individuals, we report normative data, optimal cutoff scores, and predictive validity across four subgroups defined by gender and Indigenous status. The ORAC-PCQ demonstrated satisfactory overall predictive accuracy (AUC = .75), with slightly higher values for non-Indigenous individuals and women. Exploratory and confirmatory factor analyses revealed a stable four-factor structure—Criminal Background, Substance Abuse, Interpersonal Conflicts, and Employment Problems—across all groups, supporting structural validity and measurement invariance. These findings provide initial evidence of both construct and predictive validity for a new risk assessment tool specifically tailored to short-sentence populations.
Keywords
Introduction
Risk assessment inventories are essential tools for predicting criminal recidivism and identifying criminogenic needs. They also play a crucial role in decision-making, particularly in determining whether a convicted person may benefit from programs and interventions aimed at reducing the likelihood of reoffending. As Olver et al. (2014) highlight, risk assessment and management tools have evolved significantly over the past three decades. The first generation of risk assessment relied on clinical judgment, making evaluations highly subjective and dependent on the professional’s training and experience. As a result, these assessments were considered less reliable than structured alternatives (Ægisdóttir et al., 2006; Grove et al., 2000). By the 1970s, a second generation of tools emerged, grounded in actuarial science (Gottfredson & Moriarty, 2006). These actuarial models systematically incorporated factors—such as criminal history and substance use—that were statistically linked to recidivism risk. However, as Bonta and Andrews (2023) note, this approach remained purely empirical, focusing on static factors that do not change over time and lacking a theoretical foundation. The third generation of risk assessment tools introduced dynamic risk factors—those that can change over time—allowing practitioners to better identify and respond to criminogenic needs. Unlike static risk factors such as prior convictions, dynamic risk factors like antisocial attitudes, substance use, and employment instability are amenable to change and align more closely with criminological and criminal justice psychology theories (Bonta & Andrews, 2023). The fourth generation of risk assessment tools goes a step further by integrating risk assessment with intervention and case management planning. Developed in the 1980s, the rehabilitation model—based on the principles of risk, need, and responsivity (RNR)—has been increasingly used to assess and rehabilitate convicted individuals in Canada and other regions of the world (Bonta & Andrews, 2023). Despite the success of widely used tools like the Level of Service/Case Management Inventory (LS/CMI; Andrews et al., 2004), few risk assessment instruments have been designed specifically for managing carceral populations under this model, particularly individuals serving short sentences.
This study examines the validity of a newly developed fourth-generation risk assessment tool designed for individuals serving short sentences. To establish a benchmark for its use, normative data will be presented, along with empirically derived cutoff points. Next, the tool’s predictive validity will be evaluated across the entire population of persons convicted in Quebec between January 2019 and December 2022, as well as specifically by gender and Indigenous status. Finally, the factorial structure of the scale will be analyzed and compared across these subgroups.
Convicted Person Assessment in Quebec and the Development of a New Actuarial Tool
The Correctional Services of Quebec oversees individuals serving sentences of less than 2 years. In 2002, following the highly publicized murder of a young boy by a convicted person under its supervision, the Act Respecting the Quebec Correctional Service (Government of Quebec, 2002) came into effect. This legislation mandated that the risk of recidivism be assessed for all convicted persons upon their admission into custody. During the initial years of implementation, no standardized assessment tool was officially required, and evaluations were conducted primarily through unstructured clinical judgment by correctional officers. In 2007, however, the LS/CMI was formally adopted as the mandatory risk assessment tool. While numerous studies have demonstrated that the LS/CMI has good predictive validity (Giguère & Lussier, 2016; Olver et al., 2014), its application posed significant challenges within the Quebec correctional context. Given that sentences under provincial jurisdiction are relatively short (less than 2 years, with a median supervision period of just 61 days; Giroux, 2011), the time required to complete the LS/CMI conflicted with the legal obligations of the Correctional Services. On average, officers had only 7 hours to complete the assessment, making its implementation impractical. To address this recurring challenge, authorities in Quebec’s Correctional Services initiated the development of a risk assessment and management tool better suited to their mandate. This led to the creation of the ORAC-PCQ (Outil d’évaluation du risque et de l’analyze clinique des personnes contrevenantes du Québec [Risk Assessment and Clinical Analysis Tool for Convicted Persons in Quebec]). To ensure the tool’s effectiveness, a psychometric assessment was undertaken to evaluate its validity.
Contemporary Issues in Actuarial Tool Validation
Psychometrics
Predicting adjudicated persons’ future behavior with certainty remains an unrealistic goal. However, despite these uncertainties, recidivism risk can be estimated with relative accuracy based on multiple risk factors known to influence criminal behavior. In terms of criterion validity, this predictive capacity represents a key psychometric strength. That said, an instrument’s quality should not be judged solely on its predictive validity (Brouillette-Alarie et al., 2023). If actuarial tools are to be considered legitimate psychometric instruments, they must meet additional psychometric criteria beyond predictive accuracy to ensure their overall reliability and validity.
In line with this perspective, Messick (1989, 1995) advocates for a unified approach to validity, which should be operationalized through a nomological network framework that maps the relationships between various constructs in the measurement process of an instrument. According to Messick’s model, construct validity comprises six distinct yet interrelated aspects: content, substantive, structural, generalizability, external, and consequential validity. To ensure a comprehensive evaluation, all these dimensions must be assessed to establish an instrument’s unified validity. Following this rationale, recidivism assessment and management tools, as psychometric instruments, should not rely solely on a demonstration of predictive validity. Instead, they must undergo a broader validation process that accounts for multiple facets of construct validity.
Most studies evaluating the validity of recidivism risk assessment instruments primarily focus on predictive validity, that is, whether these tools can accurately predict criminal recidivism. A meta-analysis of 28 studies found that most risk assessment instruments demonstrate moderate predictive accuracy (Yang et al., 2010). Furthermore, a separate meta-analysis of 31 studies (Viljoen et al., 2024) concluded that these tools outperform unstructured clinical judgment in predictive validity. While these findings are both encouraging and significant, they remain insufficient for fully assessing the validity of recidivism risk assessment tools. A more comprehensive validation process is needed to establish their overall reliability and effectiveness.
Another critical aspect of construct validity is an instrument’s structural properties, that is, what dimensions the tool assesses and how these dimensions are interrelated. Although relatively uncommon, some studies have examined the factor structure of recidivism risk assessment instruments. For instance, Hsu et al. (2011) analyzed data from the Level of Service Inventory-Revised (LSI-R; Andrews & Bonta, 1995) on convicted individuals in Australia, identifying a four-factor solution for women (Static Risk, Employment, Procriminal Attitudes, and Mental Health) a five-factor solution for men, which included the same four dimensions plus an additional factor labeled Protective Companions. Similarly, Zhang and Liu (2015) examined LSI-R data from Chinese probationers and found a four-factor structure, although the specific factors were not labeled in their analysis. Meanwhile, Gordon et al. (2015) found that the theoretical eight-factor model of the LS/CMI was not supported empirically; instead, their analysis yielded a two-factor structure comprising Criminal Conduct and Lifestyle Factors. Given the limited body of research on this topic, psychometric evidence regarding the internal or conceptual structure of actuarial instruments remains overshadowed by studies focusing on their ability to predict criminal recidivism. Expanding research in this area is essential to ensuring these tools are both theoretically sound and empirically valid.
Gender Considerations
The generalizability of a risk assessment instrument is a key component of its validity—specifically, whether the tool produces reliable results across different groups. In the context of the implementation and validation of the ORAC-PCQ, two subgroups warrant particular attention: women and Indigenous populations. Regarding gender, two main perspectives exist on the generalizability of risk tools. One group of researchers argues that these tools demonstrate comparable predictive validity for both men and women, effectively making them gender-neutral by default (e.g., Olver et al., 2014). In contrast, another group contends that risk assessment instruments have been developed primarily based on convicted male populations, potentially making them inappropriate for assessing convicted women (de Vogel & Nicholls, 2016; van der Knaap et al., 2012; Van Voorhis et al., 2010). Supporting the psychometric perspective, Andrews et al. (2011) found that the weighted mean predictive validity of risk and need domains was equal to or even higher for women than for men—a finding later reinforced by Olver et al.’s (2014) meta-analysis. Despite these findings, the question of gender neutrality in actuarial risk assessment tools remains a subject of ongoing debate. Ensuring that such instruments are applicable to convicted female is an important consideration in the development and validation of new risk management tools.
Applicability to Indigenous Persons
Indigenous populations are significantly overrepresented in both federal and provincial correctional facilities. Although they constitute only 4% of the adult population, Indigenous peoples account for 28% of admissions to provincial and territorial correctional services and 27% of admissions to federal correctional services (Statistics Canada, 2018). In their 2017–2018 annual report, the Correctional Investigator of Canada noted that, despite efforts spanning three decades, no government—regardless of political affiliation—has succeeded in reversing the overrepresentation of Indigenous peoples in Canadian jails and prisons (McIntosh & McKeen, 2018). This issue, first formally recognized by the federal government in 1984, remains unresolved, with incarceration rates continuing to rise year after year (Clark, 2019).
For Canada’s federal, provincial, and territorial correctional services, assessing the applicability of risk assessment tools for Indigenous peoples remains a significant challenge, particularly given their overrepresentation in the correctional system. This issue gained prominence following the Ewert v. Canada (2018) case. Jeffrey Ewert, an individual who identifies as Métis, challenged Correctional Service Canada on its use of risk assessment tools developed and validated primarily on non-Indigenous populations. He argued that no research supported their validity for Indigenous peoples, thereby violating the correctional services’ duty to ensure that the information used for assessments is current, accurate, and complete.
This case underscored the critical need to evaluate the generalizability of risk assessment tools in Indigenous populations. In a meta-analysis, Wilson and Gutierrez (2014) found that the total score of the Level of Supervision Inventory (LSI; Andrews, 1982) was significantly more predictive for non-Indigenous individuals than for Indigenous individuals. Similarly, Gutierrez et al. (2013) concluded that while the main risk/need factors were predictive of criminal recidivism among Indigenous peoples, certain factors—such as criminal history, substance use, and antisocial patterns—were significantly more predictive for non-Indigenous persons. More recently, Olver et al. (2024) reported that commonly used risk assessment tools demonstrated broadly moderate predictive validity for various recidivism outcomes in Indigenous samples; however, predictive accuracy was frequently higher for non-Indigenous samples, depending on the tool and outcome examined. These findings highlight the need for further research to ensure that risk assessment tools are both valid and equitable across diverse populations.
Study Objectives
Given the need for an efficient risk assessment tool for individuals serving short sentences and recognizing that validity must be evaluated across multiple dimensions, this article aims to present the first psychometric evidence for a newly implemented tool in Quebec, Canada: the ORAC-PCQ. The study has three main objectives. First, it aims to establish normative data for the tool as a benchmark for its use, while also proposing cutoff points based on empirical findings. Second, it seeks to evaluate predictive validity by examining recidivism outcomes and comparing results across subgroups to assess generalizability. Third, it assesses construct validity by analyzing the tool’s latent structure and comparing it across subgroups to further evaluate its generalizability.
Method
Sample
The current analysis is based on the entire population of individuals who were registered and assessed using the ORAC-PCQ between January 2019 and December 2022 in Quebec (N = 14,320). The ORAC-PCQ is administered exclusively to individuals sentenced to more than 6 months (but less than 2 years, as they fall under the jurisdiction of Quebec’s Correctional Services). No distinction is made between individuals serving custodial sentences and those sentenced to community supervision, as the ORAC-PCQ is completed in the same manner for both groups. Furthermore, an individual’s total score is not influenced by the judge’s decision to impose incarceration or community detention. To evaluate the generalizability of the findings, analyses were conducted and compared across four groups: non-Indigenous men (n = 11,421), non-Indigenous women (n = 2,093), Indigenous men (n = 675), and Indigenous women (n = 131). Table 1 presents the descriptive statistics for the full sample and each subgroup.
Descriptive Statistics
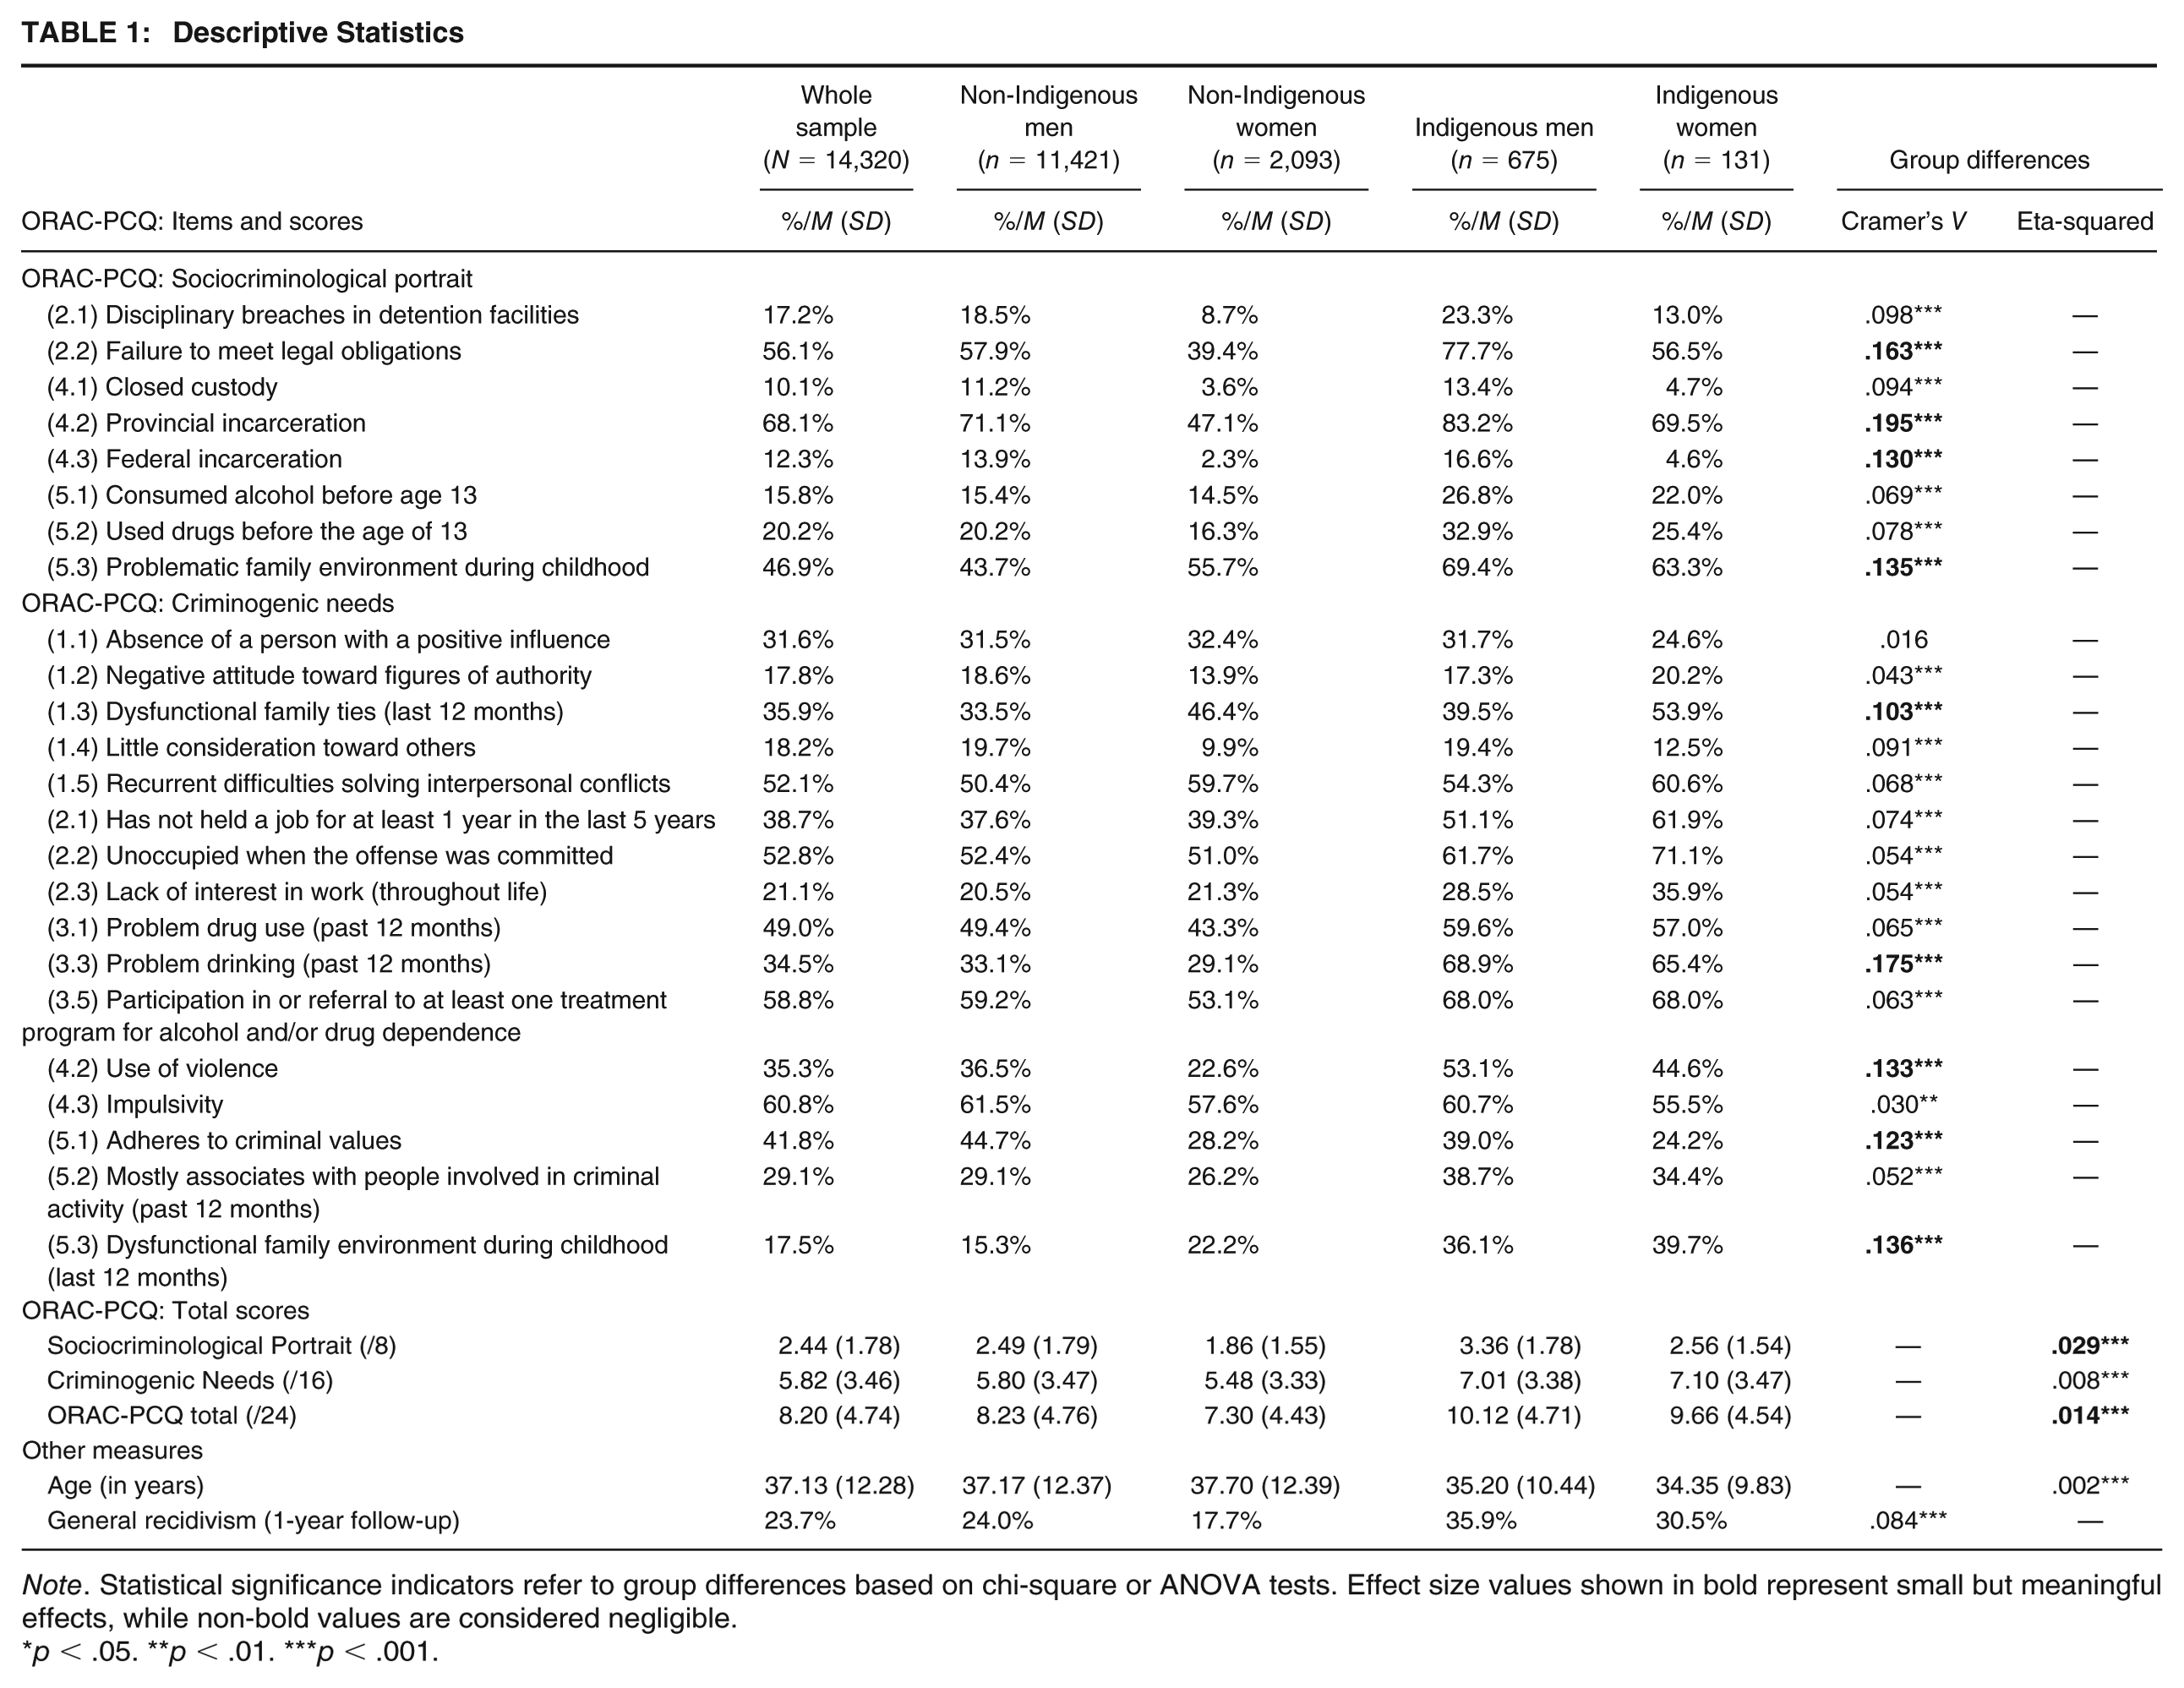
Note. Statistical significance indicators refer to group differences based on chi-square or ANOVA tests. Effect size values shown in bold represent small but meaningful effects, while non-bold values are considered negligible.
p < .05. **p < .01. ***p < .001.
Measures
The ORAC-PCQ
In 2012, correctional authorities sought to develop a new assessment tool for individuals sentenced to more than 6 months, whether in the community or in custody. The tool needed to be both aligned with Quebec’s correctional context and supported by a psychometric structure that met the standards of an actuarial measurement instrument. To initiate this process, a committee of experts in the assessment and intervention of justice-involved individuals was assembled. Over several months, the committee iteratively developed the tool’s first version, continuously adding, modifying, and removing items until reaching a satisfactory form. This process ensured that the items met the predefined requirements, establishing an initial foundation of content validity (Colquitt et al., 2019). Between 2015 and 2016, data collection was conducted within correctional services. To maintain standardization and objectivity participating correctional officers attended preparatory training sessions, with ongoing technical support provided throughout the process. Officers were recruited from all correctional regions of Quebec to ensure representative coverage of convicted individuals across the province. Following this phase, data analyses were performed, leading to the development of the first official version of the ORAC-PCQ, which was formally implemented in early 2019. Simultaneously, a specialized training program was designed to equip correctional officers with the necessary knowledge and skills to effectively administer the tool.
The latest version of the ORAC-PCQ consists of three sections. Section 1, Sociocriminological Portrait (eight items), includes static factors related to an individual’s background and criminal history, such as disciplinary infractions in correctional facilities, legal violations, number of current and prior offenses, closed custody, provincial and federal incarceration, alcohol use before age 13, drug use before age 13, and a problematic family environment during childhood. Section 2, Criminogenic Needs (16 items), assesses dynamic risk factors linked to recidivism, including substance abuse, interpersonal conflicts, and employment-related problems. Section 3, Clinical Information (26 items), provides a comprehensive responsivity profile by evaluating five key dimensions: convicted person characteristics (e.g., membership in a criminal organization, individual serving a long sentence), victimization history (e.g., history of physical, sexual, or psychological assault or neglect), readiness for intervention (e.g., failure to recognize the offense, minimizing responsibility), and health factors (e.g., psychopathy, mental disorders, personality disorders, depression, suicide attempts). Like for the LS/CMI, the Clinical Information section of the ORAC-PCQ is not included in the total risk score, as it comprises responsivity factors: personal characteristics that affect how effectively an individual can engage with correctional interventions, but that are not necessarily established as risk-relevant (Bonta & Andrews, 2023). Instead, this section is intended to help correctional staff design more comprehensive and individualized interventions that align with the person’s learning style, motivation, mental health status, and so on. Responsivity, in this context, reflects the principle of tailoring interventions beyond risk level to enhance engagement in correctional programming and promote successful reintegration. An individual’s risk score is thus determined by the total score from Sections 1 and 2, ranging from 0 to 24.
Since 2017, the ORAC-PCQ has been used to identify convicted persons’ criminogenic needs, assist correctional officers in developing intervention plans, and predict the risk of criminal recidivism after release. Over the years, the tool has undergone extensive analyses and revisions. It has been evaluated using both classical test theory and item response theory, with its items carefully examined to determine their difficulty level, predictive power, and potential bias. Based on these analyses, underperforming items were removed or moved to Section 3, resulting in the finalized version of the tool in 2022. Because no new items were added during this refinement process, earlier data remain valid for analysis, as the final version represents a streamlined subset of previous versions. Now that the ORAC-PCQ has reached maturity, the Correctional Services of Quebec has officially unveiled the tool and introduced it to the wider community.
The actuarial tool is integrated into a computerized system for assessment and follow-up (Système d’outils informatisés d’évaluation et de suivis [Computerized Tools System for Evaluation and Follow-up]), which automatically calculates scores for the three sections of the ORAC-PCQ. The database used for this study was generated through this system, with all data extracted in a fully anonymous manner.
Criminal Recidivism
Official criminal recidivism data were used to assess the predictive validity of the ORAC-PCQ. In this study, criminal recidivism is defined as the occurrence of at least one new conviction for a criminal offense during the follow-up period, with breaches of conditions excluded from this definition. The follow-up period for all participants was 1 year, beginning at the point when they were at risk of reoffending, meaning upon their release in the community.
Analytical Strategy
The objectives of this study were to establish the foundations of the ORAC-PCQ in terms of normative data, predictive validity, and factor structure.
Normative Data
The development of normative data for the ORAC-PCQ followed a two-step procedure. First, for the entire sample and each subgroup, recidivism rate tables were generated, stratified by every possible score on the instrument, using a fixed 1-year follow-up period. Second, cutoff scores were determined by testing multiple threshold combinations, using area under the curve (AUC) analyses to identify both the optimal number of risk categories and the specific cutoff points. Various risk category configurations (ranging from 2 to 5) were tested, and the results ultimately supported a three-category system: low, medium, and high risk. The methodology for defining these three categories—specifically, the process of determining two cutoff scores—is detailed below, along with the pseudo-algorithm used to establish these thresholds.
Initialization
The maximum possible score is denoted by K. A starting score k is initialized, typically k = 2.
Optimization
For a given k, the next optimal score k* is determined such that k* > k + 1. The variable k* is determined such that the AUC is maximized over the training sample. The area under the curve is computed for the pair (k, k*) in the validation dataset. We call this quantity AUC (k, k*).
Iteration
The score k is incremented k → k + 1. Steps 2 and 3 are repeated until k = K-1.
Optimal cutoffs
The optimal cutoffs c1 and c2 are the pairs of scores (k, k*) that minimize the area under the curve: c1, c2 = arg min AUC (k, k*).
The algorithm described above can be generalized to accommodate three or more risk categories, optimizing additional cutoff points by identifying thresholds to the left and right of k. This approach can also be applied independently to different score components, such as the Sociocriminological Profile or Criminogenic Needs, as well as to the total score of the ORAC-PCQ.
Predictive Validity
The predictive validity of the ORAC-PCQ was assessed using the AUC from receiver operating characteristic (ROC) curve analysis (Ruscio, 2008; Swets et al., 2000). To evaluate the effect size of predictors, the study followed the AUC guidelines established by Rice and Harris (2005), which classify AUC values as follows: .56 (or .44) corresponds to a small effect, .64 (or .36) to a moderate effect, and .71 (or .29) to a strong effect. AUC values are considered statistically significant when their 95% confidence interval does not include .50. Predictive validity was examined for the entire sample, as well as across the four subgroups.
Factorial Structure
Exploratory factor analysis
Exploratory factor analysis (EFA) was conducted to identify the latent constructs of the ORAC-PCQ, following the guidelines of Brouillette-Alarie et al. (2016). The analysis was performed on the entire sample, using tetrachoric correlations, which are less sensitive to the range restriction artifacts commonly observed when Pearson correlations are applied to dichotomous or ordinal data (Kubinger, 2003). Factors were extracted using the weighted least square means- and variance-adjusted (WLSMV) method, as recommended for EFA of dichotomous and ordinal data (Muthén & Muthén, 2017). Given that the extracted factors were expected to be correlated, an oblique (geomin) rotation was applied.
The number of factors retained was determined based on four complementary criteria: (a) the scree plot (Cattell, 1966), (b) parallel analysis (Horn, 1965), (c) Velicer’s minimum average partial (MAP) test (Velicer, 1976), and (d) fit indices (outlined below). Each factor retention method has its strengths and limitations, and using multiple approaches is generally preferred (Henson & Roberts, 2006). The final selection aimed to achieve consensus among these criteria while preserving face validity and theoretical coherence among the extracted factors.
To evaluate the overall model fit, four fit indices were used. The root mean square error of approximation (RMSEA) assesses the lack of fit relative to a perfect factor structure and should ideally not exceed .06 (Hu & Bentler, 1999). The comparative fit index (CFI) evaluates model fit relative to a baseline model with no item relationships, where a CFI of .90+ indicates adequate fit and .95+ indicates good fit (Hu & Bentler, 1999). The Tucker–Lewis Index (TLI) considers both model fit and parsimony, following the same interpretation as the CFI (Hu & Bentler, 1999; Tucker & Lewis, 1973). Finally, the standardized root mean square residual (SRMR) measures the average standardized residuals between observed and hypothesized covariance matrices, with a value of .08 or lower indicating good fit (Hu & Bentler, 1999).
Factor inclusion was determined by a loading threshold of .40 (Stevens, 1992). The magnitude of factor loadings was prioritized over statistical significance, as large samples can yield statistically significant yet practically meaningless cross-loadings. Items with factor loadings between .30 and .39 were retained if (a) their inclusion was theoretically justified and (b) they did not exhibit stronger loadings on another factor. All EFA analyses were conducted using Mplus 8.11 (Muthén & Muthén, 2017).
Confirmatory factor analysis and group invariance testing
Confirmatory factor analysis (CFA) was conducted to evaluate the fit of the factor solution across the four categories of convicted individuals in Quebec: non-Indigenous men, non-Indigenous women, Indigenous men, and Indigenous women. Analyses were performed using Mplus 8.11 (Muthén & Muthén, 2017) with the software’s default parameters for binary and polytomous variables, employing the WLSMV estimator. The factor structure was modeled based on the exploratory factor analysis (EFA) results, incorporating post hoc decisions to retain certain items with factor loadings between .30 and .40. Items that did not load on any factors were excluded from the CFA. The same fit index thresholds used in the EFA were applied to assess model fit in the CFA.
Measurement invariance across groups was assessed using multigroup confirmatory factor analysis. First, configural invariance was tested to determine whether the general factor structure—including the number of factors and the pattern of factor loadings—was consistent across groups. Next, scalar invariance was evaluated by constraining both factor loadings and item thresholds to equality, allowing for an assessment of group differences on latent factors. Metric invariance was not tested, as it is not identified under WLSMV estimation with binary variables (Muthén & Muthén, 2017).
To compare models, the study followed the guidelines of Cheung and Rensvold (2002) and Chen (2007), which propose alternatives to chi-square testing—a method that often produces statistically significant differences in large samples, leading to potential misinterpretations. Instead, measurement invariance was assessed by first verifying the acceptability of the fit indices for both the configural and scalar models. Then, invariance was confirmed if the transition from the configural to the scalar model resulted in only minimal changes in fit indices, specifically: Δ RMSEA ≤ 0.015, Δ CFI ≤ 0.01, and Δ SRMR ≤ 0.03.
Results
As illustrated on Table 1, on average, ORAC-PCQ scores were significantly higher for men than for women, and for Indigenous individuals compared to non-Indigenous individuals. Consistent with these risk scores, observed recidivism rates were also higher among men than women, and among Indigenous individuals than non-Indigenous individuals. The effect sizes were, however, small in magnitude.
Risk Distribution Table
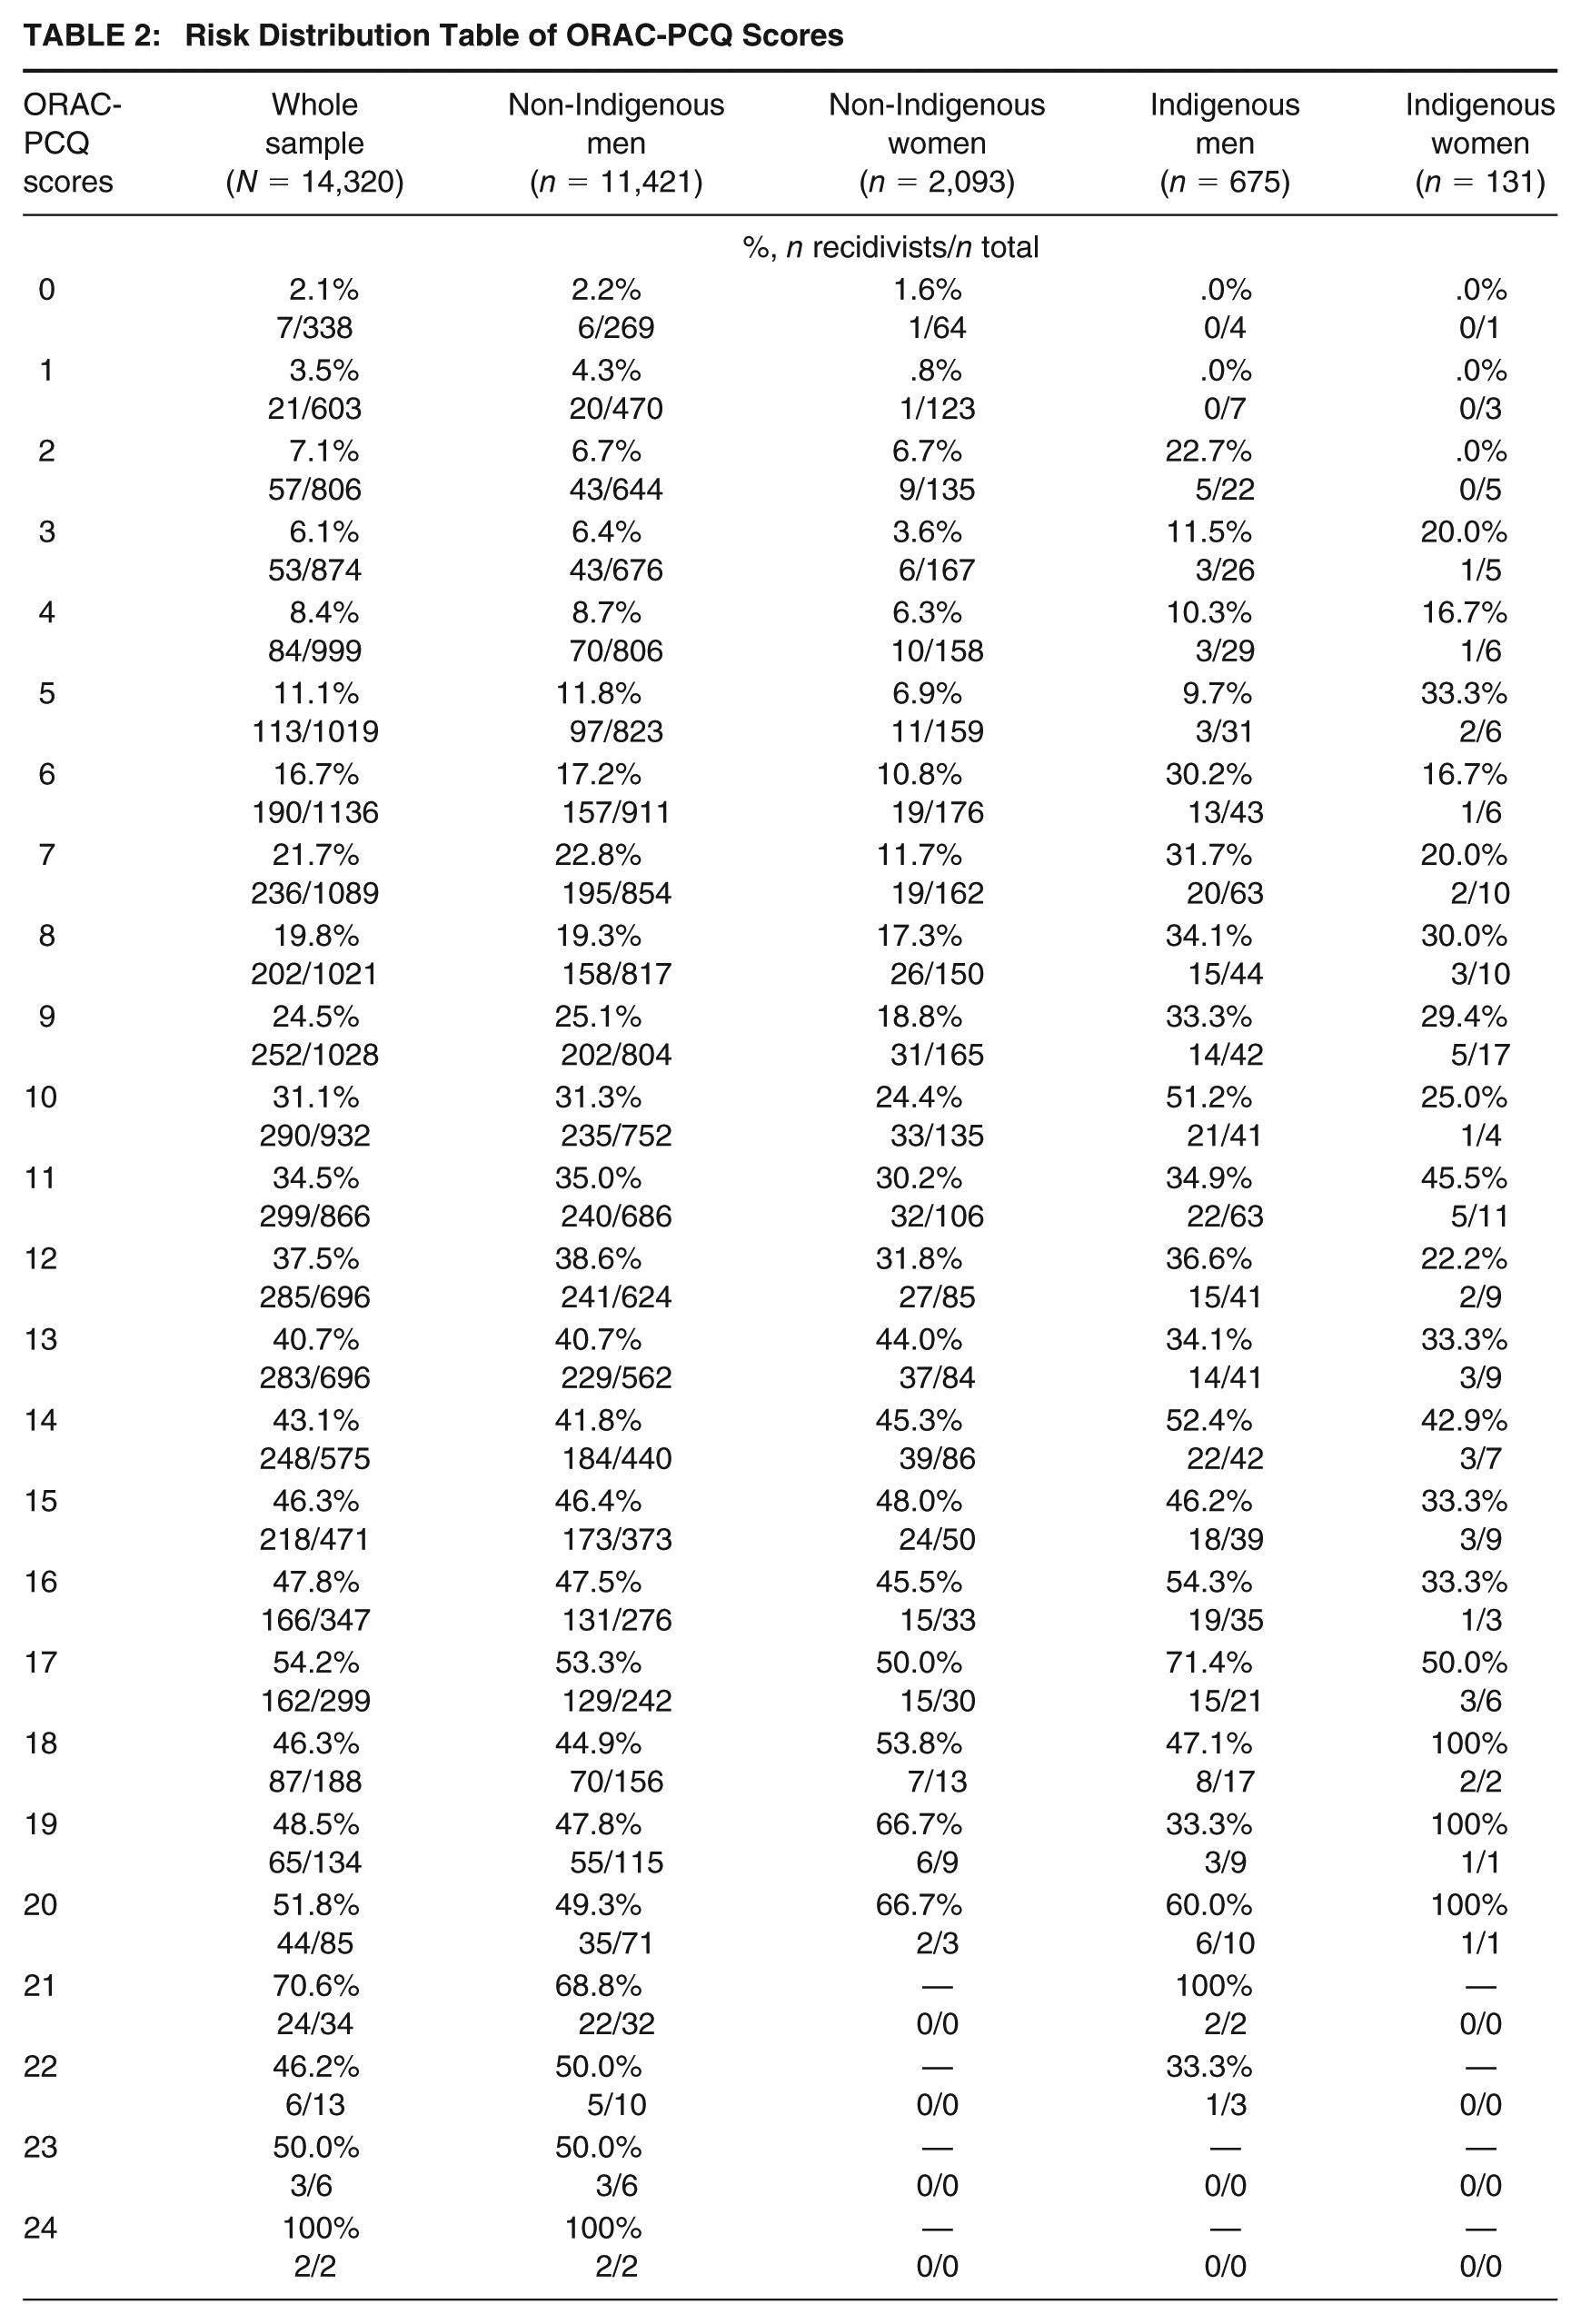
Table 2 presents the risk distribution of the ORAC-PCQ, showing the proportion of recidivists for each possible score on the tool, both for the entire sample and the four subgroups. Across all groups, a clear pattern emerged: higher scores were associated with an increased risk of recidivism. However, this trend was less stable among Indigenous populations and at higher ORAC-PCQ scores, as the small number of individuals per case resulted in less reliable estimates.
Risk Distribution Table of ORAC-PCQ Scores
Cutoff Scores for Risk Categories
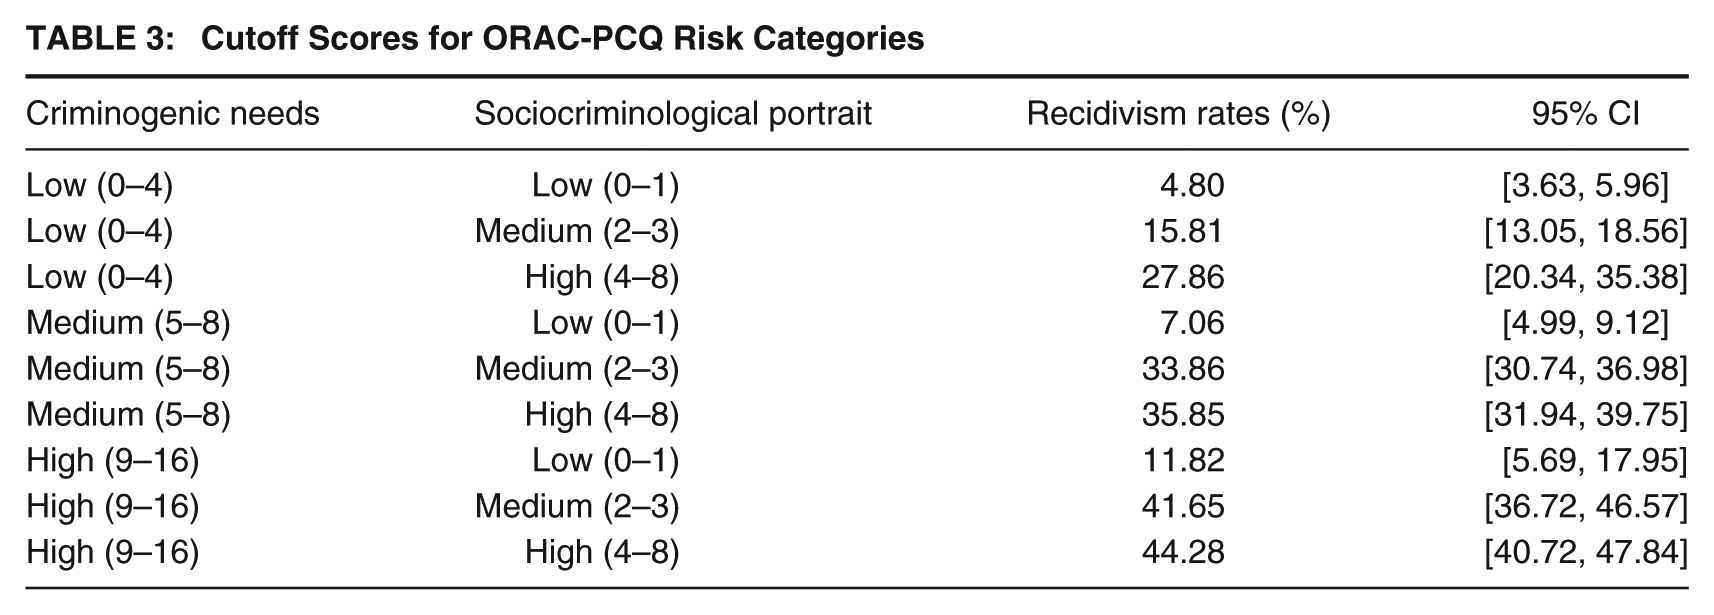
Table 3 presents the suggested cutoff scores for the ORAC-PCQ risk categories. In the Sociocriminological Portrait component, scores were classified into low (0–1), medium (2–3), and high (4–8). In the Criminogenic Needs component, the categories were defined as low (0–4), medium (5–8), and high (9–16). This classification into low-, medium-, and high-risk groups for both components was found to strongly correlate with recidivism likelihood in the validation sample. Table 3 also presents the recidivism rates, along with their 95% confidence intervals, for each combination of these two risk components.
Cutoff Scores for ORAC-PCQ Risk Categories
Predictive Validity
Table 4 presents the results of the predictive validity of the ORAC-PCQ, based on ROC curve analysis predicting recidivism as a function of scale scores for each subgroup. The predictive values were high for non-Indigenous individuals, while they were moderate for Indigenous populations.
Predictive Validity of the ORAC-PCQ
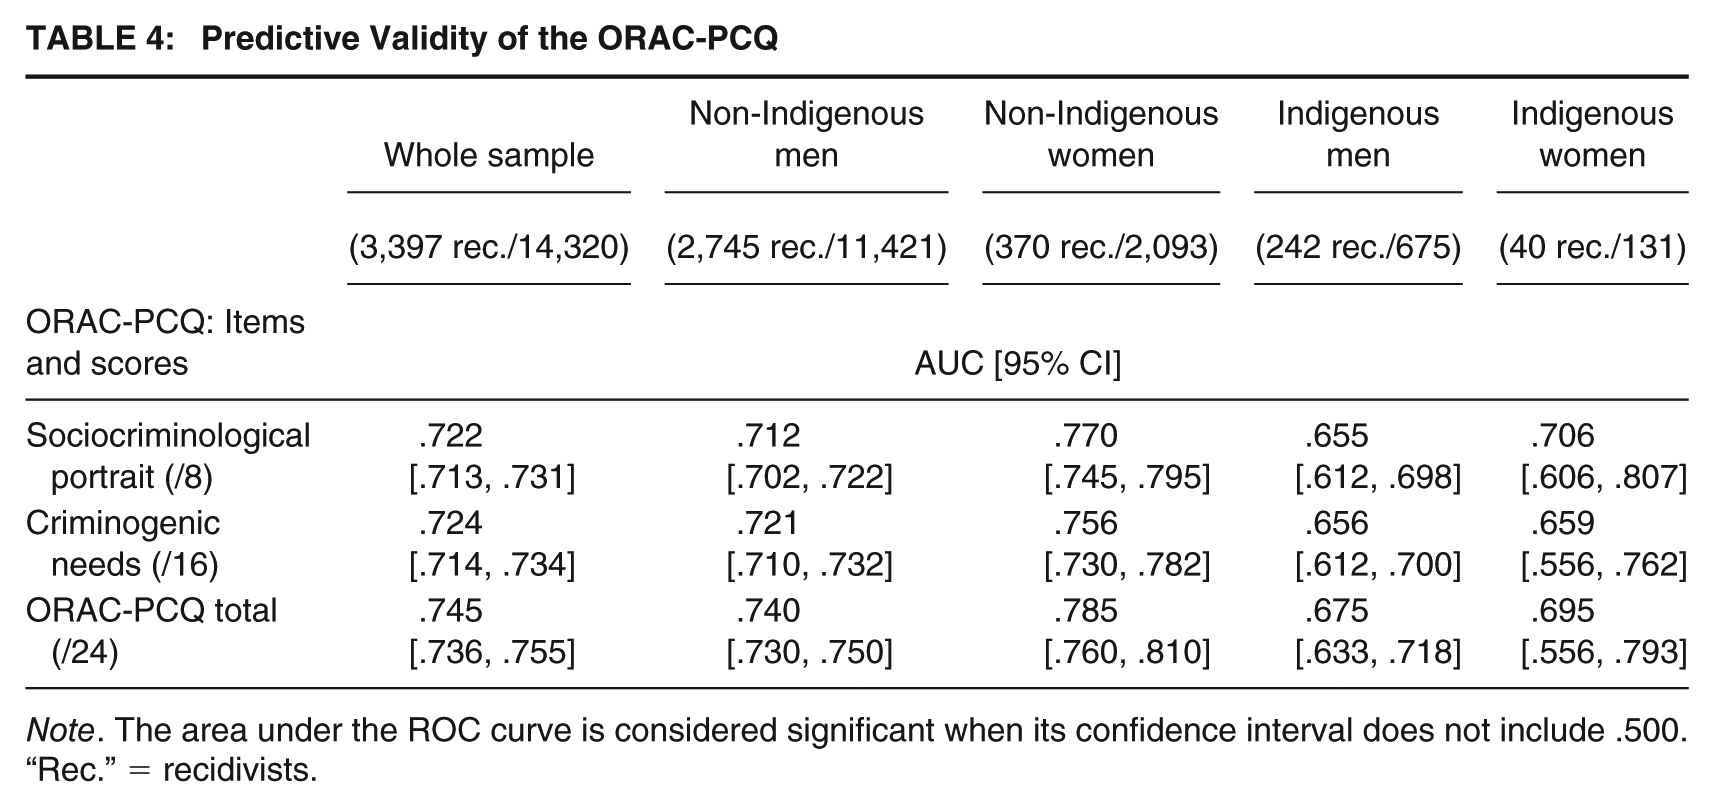
Note. The area under the ROC curve is considered significant when its confidence interval does not include .500. “Rec.” = recidivists.
Predictive validity was higher for women than for men, regardless of Indigenous status. In addition, combining the Sociocriminological Portrait and Criminogenic Needs components (i.e., the total ORAC-PCQ score) improved prediction accuracy compared to using either component alone—except for Indigenous women, where the Sociocriminological Portrait score slightly outperformed the total ORAC-PCQ score.
Exploratory Factor Analysis
Figure 1 presents the scree plot of the eigenvalues from the exploratory factor analysis (EFA) as a function of the number of extracted factors. No significant collinearity issues were observed (r > .90). The scree plot suggested a two- or four-factor solution; however, the two-factor model was theoretically inadequate and exhibited poor fit indices (see Table 5). Velicer’s revised MAP test (2000) suggested a three-factor solution, while both parallel analysis and Kaiser’s criterion (eigenvalues > 1) indicated a six-factor solution. Although consistency across factor retention criteria is preferable, the results pointed in different directions. Ultimately, a four-factor solution was selected, as the three-factor model did not exhibit sufficient fit indices, while the six-factor model contained “empty factors” (i.e., factors with only one or two items). The four-factor solution minimized cross-loadings and negative loadings, making it the cleanest and most theoretically sound factor structure.
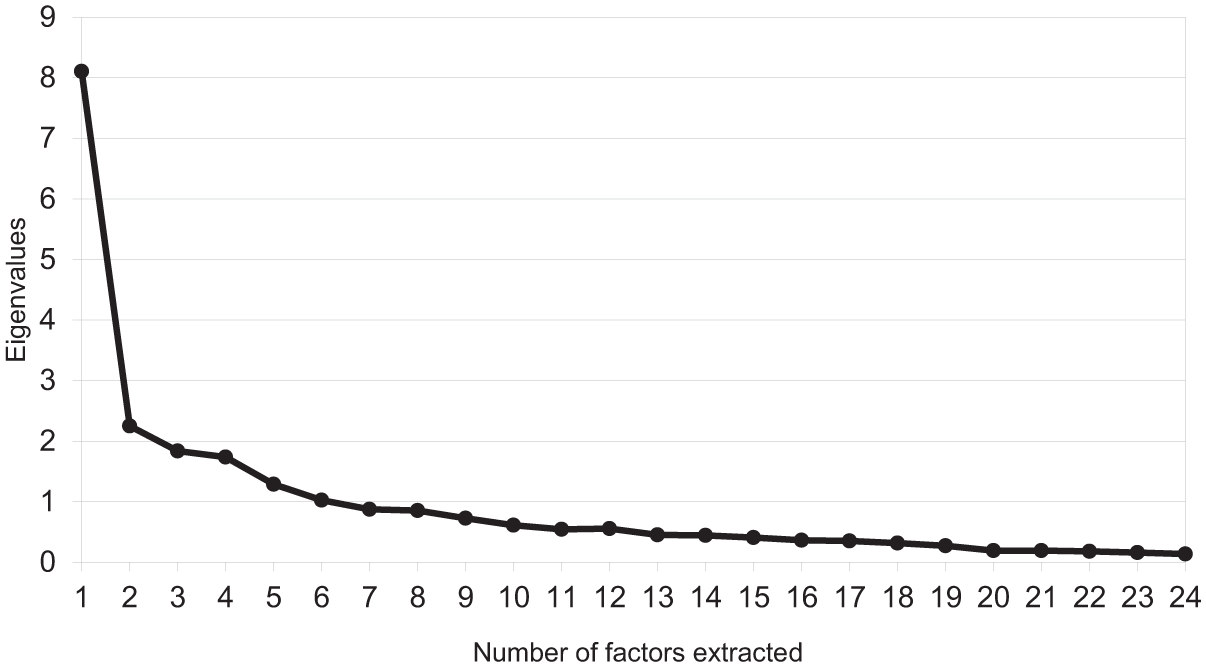
Scree Plot of the Eigenvalues From the Exploratory Factor Analysis
Eigenvalues, Parallel Analysis Results, and Fit Indices for Each Number of Extracted Factors
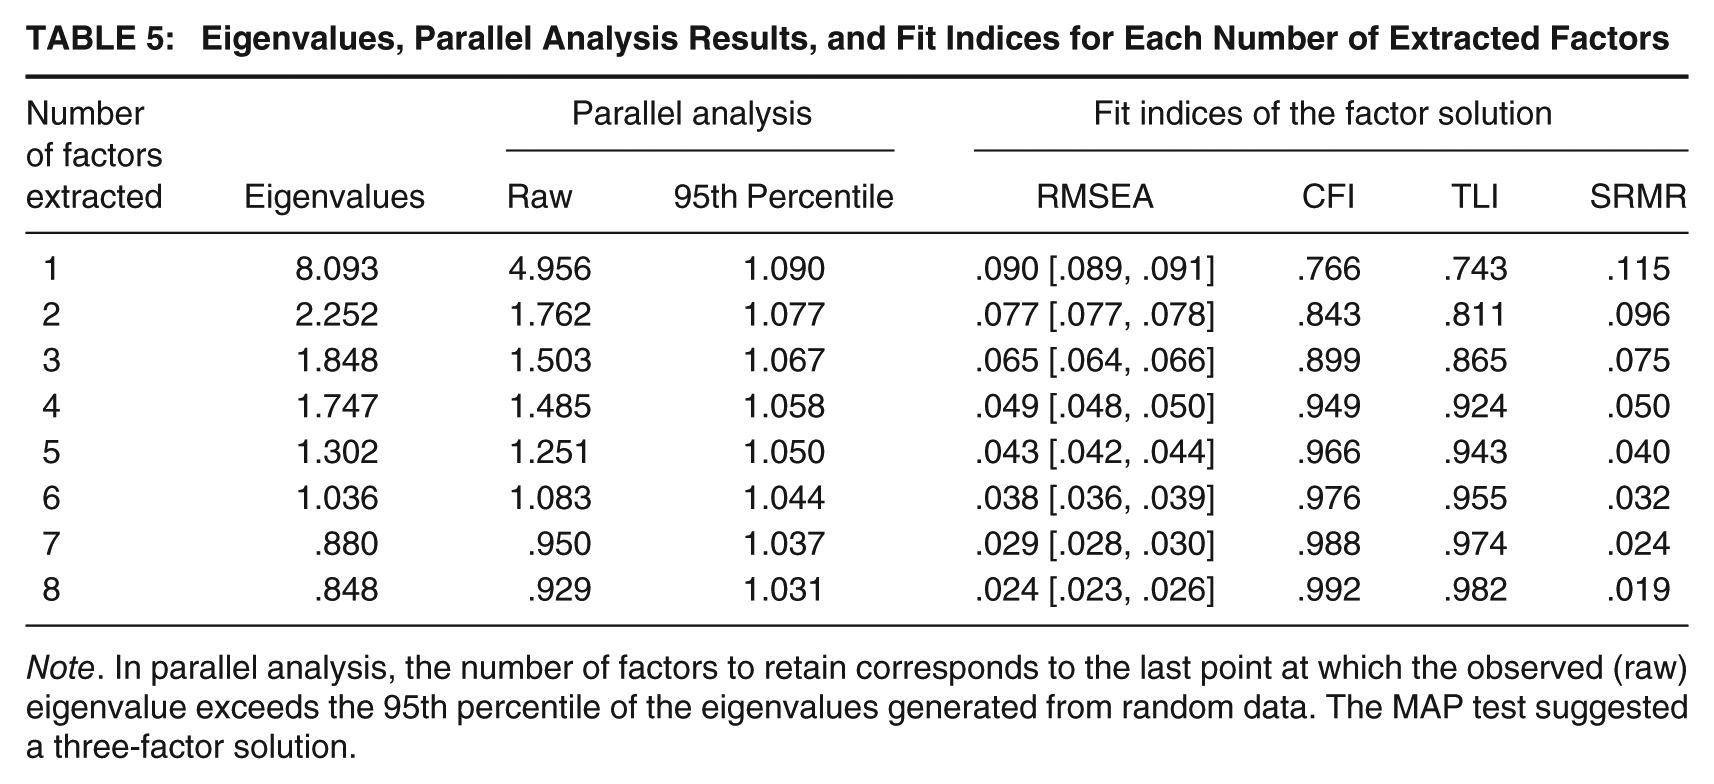
Note. In parallel analysis, the number of factors to retain corresponds to the last point at which the observed (raw) eigenvalue exceeds the 95th percentile of the eigenvalues generated from random data. The MAP test suggested a three-factor solution.
Table 6 presents the factor loadings for the four-factor solution. The first factor, Criminal Background, reflects an individual’s history of disciplinary breaches in detention facilities and other legal obligations, previous incarceration sentences, and adherence to criminal values. The second factor, Substance Abuse, captures alcohol and drug consumption, whether during youth or in the past 12 months, as well as participation in a dependency treatment program. The third factor, Interpersonal Conflicts, includes experiences of a problematic family environment during childhood, strained family relationships in the past 12 months, and negative attitudes toward authority figures. It also encompasses low consideration for others, difficulty resolving interpersonal problems, impulsivity, and the use of violence. The fourth factor, Employment Problems, pertains to an individual’s lack of employment history, being unoccupied at the time of the offense, low interest in work, and frequent association with individuals involved in criminal activity. Notably, two items did not load onto any factor: lack of ties to a person exerting a positive influence and presence of criminal activity in at least one significant family member within the past 12 months.
Factor Loadings of the Exploratory Factor Analysis of the ORAC-PCQ (N = 14,320)
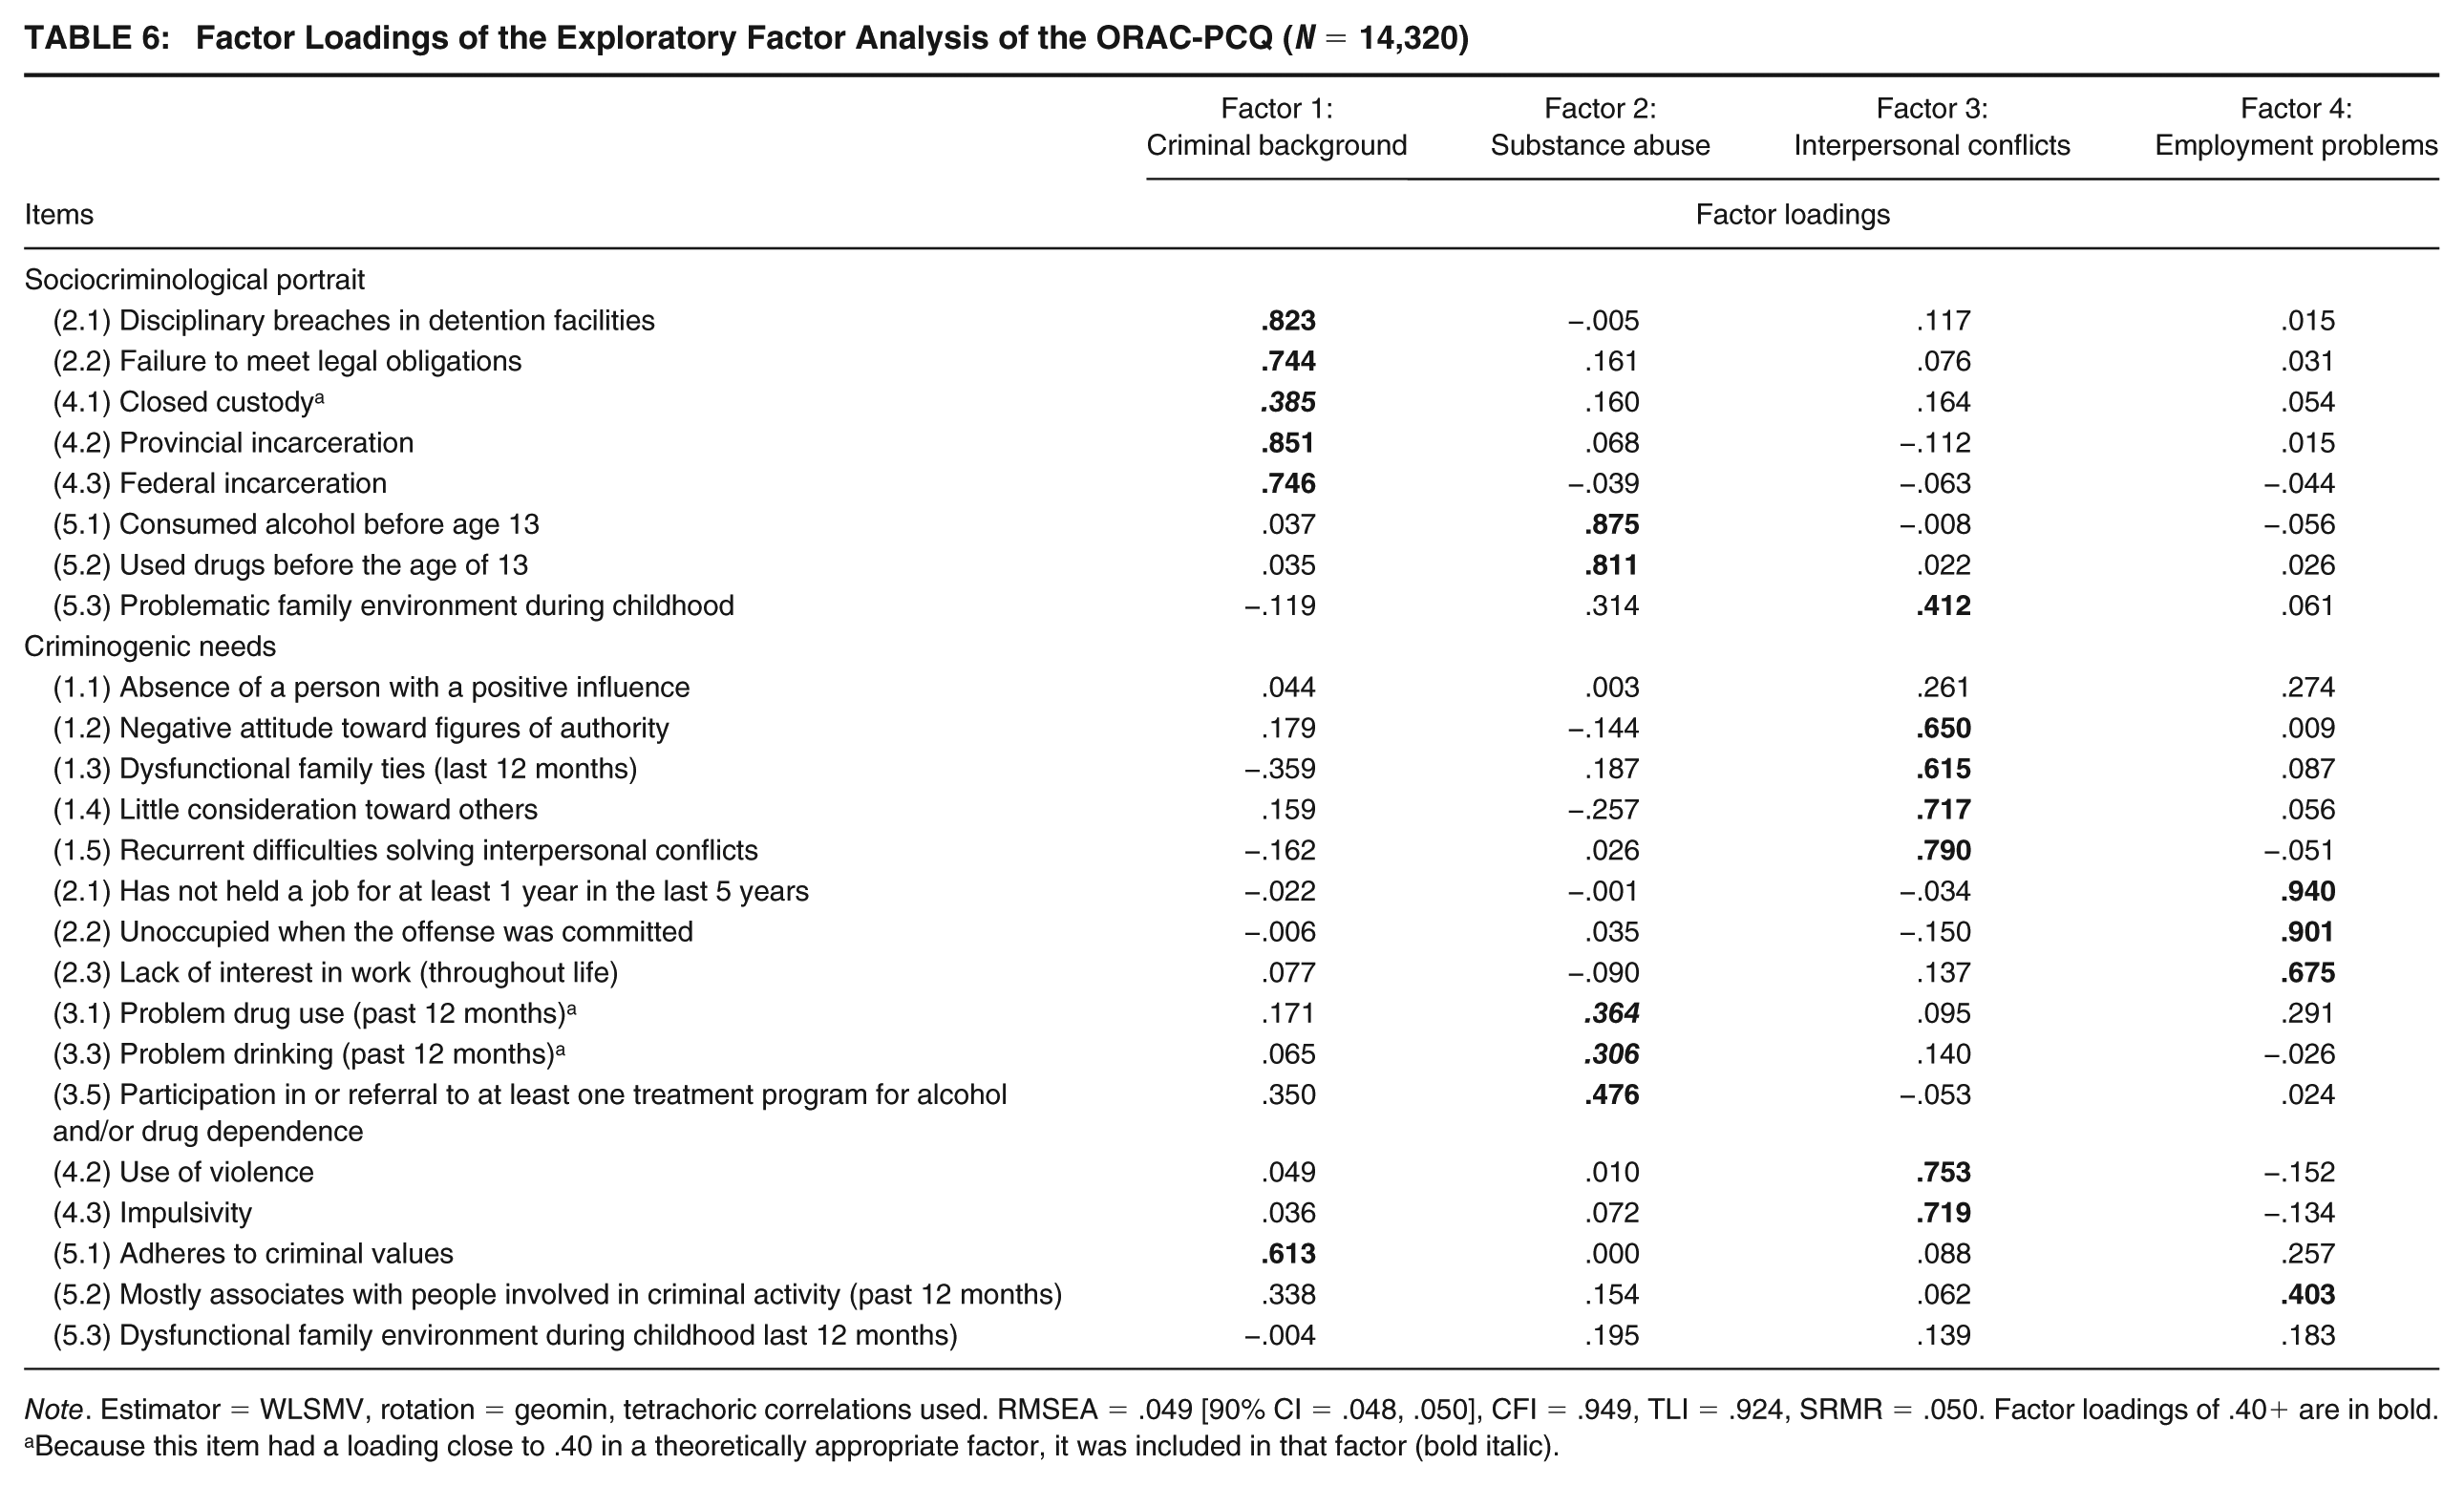
Note. Estimator = WLSMV, rotation = geomin, tetrachoric correlations used. RMSEA = .049 [90% CI = .048, .050], CFI = .949, TLI = .924, SRMR = .050. Factor loadings of .40+ are in bold.
Because this item had a loading close to .40 in a theoretically appropriate factor, it was included in that factor (bold italic).
The Criminal Background factor showed a correlation of .292 with Substance Abuse, .475 with Interpersonal Conflicts, and .418 with Employment Problems. In turn, Substance Abuse correlated .364 with Interpersonal Conflicts and .306 with Employment Problems. Finally, Interpersonal Conflicts had a correlation of .420 with Employment Problems.
Although the extracted factors were not optimized to maximize predictive validity, we report their individual predictive performance for the full sample as supplementary information. The predictive validity of the four factors was as follows: Criminal Background had an AUC of .734 [95% CI = .725–.742], Substance Abuse had an AUC of .661 [95% CI = .650–.671], Interpersonal Conflicts had an AUC of .650 [95% CI = .639–.660], and Employment Problems had an AUC of .659 [95% CI = .648–.670].
Confirmatory Factor Analysis and Group Invariance Testing
Table 7 presents the model fit indices for the Confirmatory Factor Analysis (CFA) of the ORAC-PCQ across each subgroup. This analysis included the 22 ORAC-PCQ items that loaded onto a factor in the Exploratory Factor Analysis (EFA), each assigned to its corresponding factor as previously described. No modification indices were applied, as the objective was to compare the fit of the factor structure across subgroups in its original form. Results indicate that the ORAC-PCQ demonstrated relatively consistent model fit across all subgroups, except for Indigenous women, for whom the fit indices were notably lower compared to the other groups.
Confirmatory Factor Analysis of the ORAC-PCQ Across Subgroups
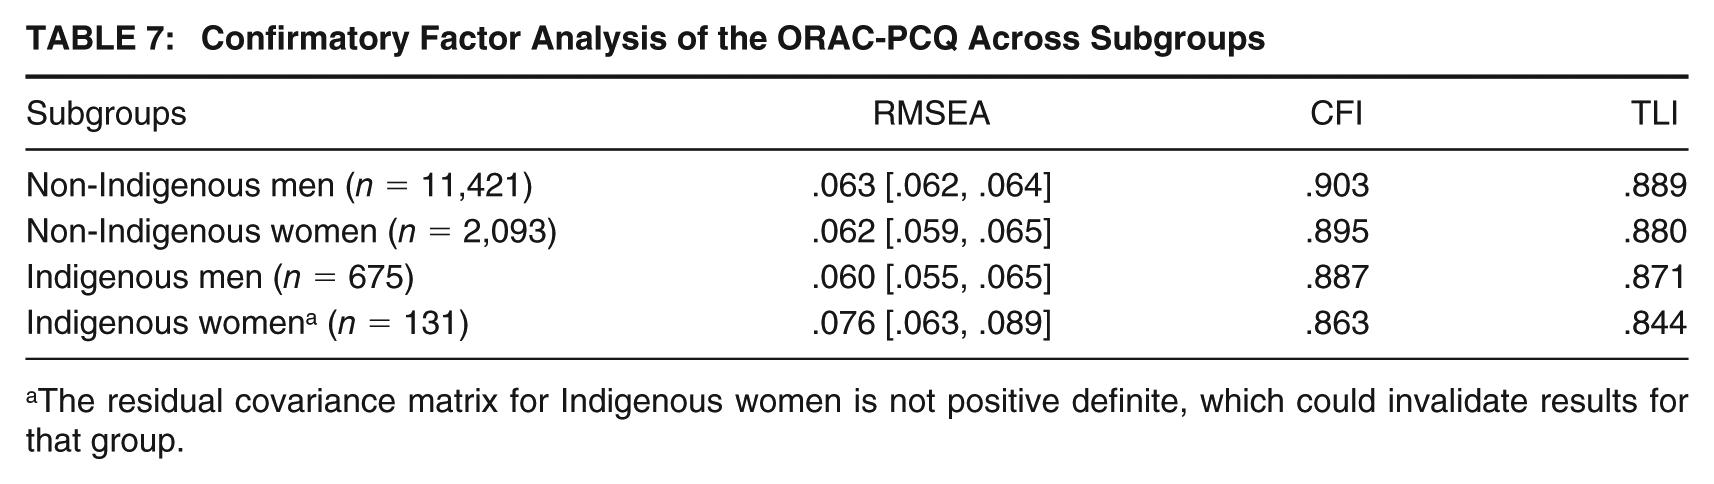
The residual covariance matrix for Indigenous women is not positive definite, which could invalidate results for that group.
Table 8 presents the results of the measurement invariance testing. Fit indices for both the configural and scalar models were acceptable, and the differences in fit indices between the two models were negligible. These findings indicate that the factor structure of the ORAC-PCQ is applicable across all subgroups, demonstrating both configural and scalar invariance.
Measurement Invariance Testing Across Groups
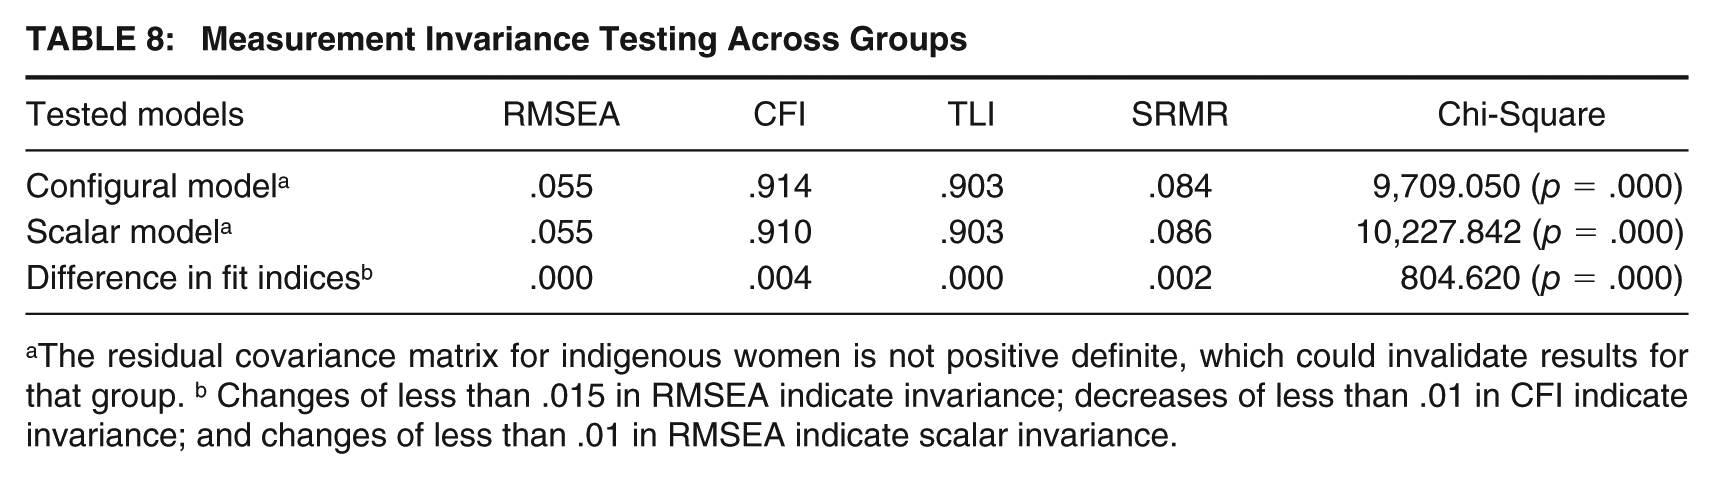
The residual covariance matrix for indigenous women is not positive definite, which could invalidate results for that group. b Changes of less than .015 in RMSEA indicate invariance; decreases of less than .01 in CFI indicate invariance; and changes of less than .01 in RMSEA indicate scalar invariance.
Discussion
This study examined the psychometric properties and validity of the ORAC-PCQ, a fourth-generation risk assessment tool implemented in Quebec, Canada, designed to evaluate recidivism risk and criminogenic needs among adjudicated individuals serving short sentences. In line with Messick’s (1989) framework, which emphasizes that validity should encompass multiple constructs within the measurement process, this study assessed various aspects of construct validity beyond predictive validity.
Normative Data for the ORAC-PCQ
Risk distribution data for the ORAC-PCQ were presented as a benchmark for its use, along with empirically derived cutoff points. By stratifying the entire sample and each subgroup’s recidivism outcomes according to every possible risk score, we observed a clear trend whereby higher ORAC-PCQ scores consistently corresponded to elevated rates of new convictions. It is also worth noting that some risk-score categories, particularly in the higher ranges or among smaller subgroups, contained very few participants, which can lead to instability in the observed recidivism rates. When only a handful of individuals fall into a given cell, a single recidivist (or non-recidivist) can appreciably alter the calculated risk percentage. Such fluctuations are especially salient for groups like Indigenous women, whose limited sample size yielded noticeable variability in the highest risk categories. As a result, although the overall pattern remains consistent across most scores, readers should interpret the exact recidivism percentages in these sparsely populated cells with caution. Considering these constraints, the most reliable estimates are those derived from the total (unified) sample, which minimizes sampling variability and provides a more stable basis for interpreting the relationship between ORAC-PCQ scores and recidivism. Moreover, the process by which risk classification cutoffs were determined—employing AUC analyses to compare different threshold configurations—ensured that each boundary within the low-, medium-, and high-risk bands were empirically anchored in actual recidivism patterns. By systematically testing numerous cutoff combinations, we were able to identify thresholds that maximize predictive accuracy while remaining user-friendly for frontline staff. Such an approach helps reduce the subjectivity that can arise from more arbitrary or purely theoretical categorization methods.
Predictive Validity
A central aim of this study was to determine how well the ORAC-PCQ predicts criminal recidivism, both in the overall sample and within specific subgroups (non-Indigenous men, non-Indigenous women, Indigenous men, and Indigenous women). The results were encouraging: the area under the ROC curve (AUC) analyses indicated satisfactory predictive accuracy across all groups. In particular, the ORAC-PCQ exhibited an AUC of .75 for the total sample, which is higher than the average predictive value of commonly used Level of Service (LS) instruments. As a point of reference, a meta-analysis by Olver et al. (2014) reported an average AUC of .67 for the LS across various populations and types of recidivism outcomes. These findings suggest that the ORAC-PCQ, at least within the Quebec context and for individuals serving short sentences, operates at the benchmark typically established by the LS family of tools.
Notably, the ORAC-PCQ’s predictive accuracy also held up across subgroups, showing AUC values of .74 for non-Indigenous men, .79 for non-Indigenous women, .68 for Indigenous men, and .70 for Indigenous women. Although the AUC for Indigenous men and women was somewhat lower, these values still exceeded the conventional .64 threshold for moderate predictive accuracy (Rice & Harris, 2005). This pattern of results mirrors those observed by Olver et al. (2024), who found that general risk/need tools tended to demonstrate acceptable predictive validity among Indigenous persons but typically performed better among non-Indigenous populations. This convergence underscores the importance of continued empirical evaluation of risk tools to ensure their consistent accuracy and fairness across population groups.
Predictive validity figures of the ORAC-PCQ compared favorably to previous findings on Level of Service instruments, which often hover in the low-to-mid .60s among Indigenous populations (Gutierrez et al., 2013; Wilson & Gutierrez, 2014). These results suggest that, at least within the Quebec context, the ORAC-PCQ can maintain a predictive accuracy for Indigenous individuals. However, it is important to interpret these results within the broader social and historical context of correctional involvement. The strong coherence between risk scores and observed recidivism may partly reflect structural inequities that influence both offending patterns and system responses (Giguère et al., 2025). For example, the legacy of colonialism—including systemic disadvantage, intergenerational trauma, and heightened surveillance—can increase both actual risk exposure and the visibility of reoffending among Indigenous persons (Ewert v. Canada, 2018; Hart, 2016). In such contexts, predictive validity may reflect real associations but also risks reinforcing existing disparities if scores are interpreted without attention to context (Gutierrez et al., 2013). These considerations do not diminish the value of actuarial tools like the ORAC-PCQ, which support consistency and transparency in correctional decision-making. Rather, they highlight the importance of embedding such tools within culturally informed and equity-oriented practices that ensure assessments serve not only predictive purposes, but also the broader goal of fair and effective intervention.
Latent Structure and Group Measurement Invariance
The latent structure of the ORAC-PCQ was assessed and compared across subgroups to evaluate the generalizability of its structural properties. While many risk assessment tools include subscales, these are often theoretically driven. Relatively few studies have attempted to empirically confirm these factorial structures using appropriate statistical analyses (for exceptions, see: Brouillette-Alarie et al., 2016; Gordon et al., 2015; Hsu et al., 2011; Zhang & Liu, 2015). Using exploratory factor analysis (EFA), we identified four underlying factors within the 24 items of the ORAC-PCQ: Criminal Background, Substance Abuse, Interpersonal Conflicts, and Employment Problems. While the ORAC-PCQ’s factorial structure does not perfectly align with the Central Eight risk factors of recidivism (Bonta & Andrews, 2023)—nor does it claim to—it remains conceptually consistent with these domains. The Criminal Background dimension aligned with the Central Eight’s domain of History of Antisocial Behavior, and the Substance Abuse factor mapped directly onto the Substance-Use domain. Interpersonal Conflicts merged features often discussed separately in the Central Eight—such as Antisocial Personality Patterns, Antisocial Attitudes, and Family/Marital Challenges—suggesting that, in this short-sentence population, these constructs coalesced into a broader “relational risk” dimension. Finally, Employment Problems paralleled the School/Work Instability domain of the Central Eight, as well as the Antisocial Associates. Confirmatory factor analyses (CFA) upheld the viability of this four-factor solution across key subgroups. Although the fit indices were somewhat attenuated for Indigenous women—possibly due to a smaller sample—overall results indicate consistent underlying constructs across varied demographic groups. From a practical standpoint, this stability of factor structure enhances the ORAC-PCQ’s claim to generalizability: officers and program staff can interpret these four risk dimensions in a similar way, regardless of an individual’s gender or Indigenous identity.
Limitations
This study presents certain limitations that should be recognized. First, all participants were under the supervision of Quebec’s Correctional Services, which only manage sentences of 2 years or less. Consequently, our findings may not be directly generalizable to individuals serving longer sentences in Canada’s federal penitentiaries, whose offense patterns and recidivism trajectories could differ. Second, even though our sample was relatively large, it was drawn primarily from non-Indigenous populations in Quebec. While we did include Indigenous subgroups, the size of these subgroups—particularly Indigenous women—was comparatively small, resulting in less stable estimates and potentially limiting the robustness of subgroup-specific conclusions. Third, the follow-up period for recidivism was restricted to 1 year, which aligns with the shorter sentences typically administered at the provincial level. However, this short follow-up window may overlook longer-term recidivism patterns that develop after the initial post-release period. Fourth, all available ORAC-PCQ data, including those used during the tool’s development and refinement, were included in the present analysis. This reuse of data introduces a potential risk of overfitting, as the tool may perform optimally on the dataset used to inform its design. Finally, because official conviction data were used to measure recidivism, our results do not account for unreported crimes or charges that did not lead to convictions, which may have led to an underestimation of actual reoffending.
Conclusion
The ORAC-PCQ, a new fourth-generation risk tool designed for adjudicated individuals serving short sentences, was developed in accordance with Messick’s (1989, 1995) framework and his concept of a nomological network. Consequently, this study aimed to evaluate the unified validity of the instrument. As discussed—though not extensively detailed in this paper—the items were created, validated, and refined based on the recommendations of a committee of correctional experts to ensure their relevance in measuring recidivism risk and to strengthen their content validity. The factor analysis presented in this study provided evidence of the substantive validity of the instrument’s underlying constructs, demonstrating coherence with criminological theories, existing literature, and comparable risk assessment tools. Further reinforcing the tool’s structural validity, measurement invariance analyses demonstrated that these latent factors function similarly across men, women, and Indigenous subgroups, although the small sample of Indigenous women calls for caution in interpreting factorial stability. Criterion validity was supported by robust predictive accuracy over a 1-year follow-up period, achieving area-under-the-curve values comparable to or exceeding modern standards (e.g., LS scales). Although some doubts remain regarding applicability for Indigenous women, these appear largely tied to the limited sample size, which constrains the stability of subgroup-specific estimates. Overall, the results suggest that the ORAC-PCQ is a promising, empirically grounded instrument for short-sentence populations in Quebec, with potential to inform risk assessment and intervention strategies more broadly.
Building on these findings, several avenues warrant further investigation. First, longer follow-up periods would help clarify how well the ORAC-PCQ predicts recidivism over multiple years and whether its predictive accuracy changes over time, thereby examining its dynamic properties. Second, although this study demonstrated promising results across subgroups, future research should include more diverse ethno-racial samples to ensure the tool’s validity beyond the Indigenous vs. non-Indigenous distinction. Third, collecting additional data on Indigenous women may stabilize factor analyses and risk estimates, thereby confirming (or refuting) the tool’s validity for this subgroup. Fourth, a more granular exploration of item functioning using advanced psychometric approaches (e.g., multidimensional item response theory) could reveal whether particular items disproportionately influence total scores or penalize certain groups. Finally, extending validation efforts to other jurisdictions or countries is essential for confirming the ORAC-PCQ’s broader applicability and determining whether cutoff scores require recalibration in new correctional contexts. Pursuing these directions will help refine the ORAC-PCQ, ensuring it remains both psychometrically robust and practically effective for the populations it serves.
Footnotes
Authors’ Note:
The views expressed are those of the authors and not necessarily those of the Ministère de la Sécurité publique du Québec. No AI tools were used to analyze data, interpret results, or generate theoretical or methodological content. All scientific reasoning, analyses, and discussion points reflect the authors’ original work. We have no conflict of interest to disclose.