
Abstract
The effect of teens’ exposure to televised aggression depends on the characteristics of the viewer and the portrayed aggression. However, few studies have investigated which teens prefer what forms of televised aggression. Therefore, this study investigated how teens’ trait aggression and sex guide their preferences for types (physical, verbal, and indirect) and contextual features of televised aggression (reward, punishment, justification, graphicness, realism, and humor). A linkage analysis combined survey data of 156 teens (balanced for trait aggression and sex, age 10-14 years) with a content analysis of 4,839 scenes from their favorite television programs. Aggressive teens preferred more physical aggression than less aggressive teens. Trait aggression was not related to preferences for contextual features of aggression. Boys preferred more physical aggression than girls, as well as more realistic, graphic, justified, rewarded, and punished aggression. This study underscores the importance of distinguishing between different viewers and forms of televised aggression.
Watching television remains the most popular media activity among children and teenagers, despite the availability of various newer forms of media (Nielsen Media Research, 2017). Many parents, educators, and policy makers are, therefore, concerned about youths’ frequent exposure to negative content on television, most notably aggression, because of its potential for harm (Strasburger et al., 2013). This concern is particularly directed at teens, as interest in aggressive content peaks in adolescence (Twitchell, 1989). However, there are large differences between teens in their exposure to televised aggression, which are guided by social and psychological characteristics (Knobloch-Westerwick, 2014). Two key viewer characteristics in this respect are trait aggression (TA; i.e., a personality trait that manifests in aggressive behavior, anger, and feelings of hostility; Buss & Perry, 1992) and sex, in that boys and individuals high in TA watch more televised aggression compared with girls and individuals low in TA (Weaver, 2011).
However, existing research into selective exposure as a result of TA and sex has two important limitations. First, previous studies have focused primarily on physical aggression (i.e., overt physical acts, such as pushing, hitting, or shooting someone; Weaver, 2011), thereby neglecting the attractiveness of verbal (i.e., overt verbal attacks, such as insulting or threatening someone; Glascock, 2008) and indirect aggression (i.e., behaviors that attack someone in a way that avoids direct confrontation, such as gossiping behind someone’s back; Card, Stucky, Sawalani, & Little, 2008). Verbal and indirect aggression may be especially attractive to girls, as these types of aggression are more accepted for and used by girls than physical aggression (Letendre, 2007). It is, therefore, important to learn more about differential preferences for physical, verbal, and indirect aggression on television.
A second limitation is that previous selective exposure research has not taken contextual features of aggression into account, that is, the circumstances in a program that form the setting for, and influence the interpretation of, aggressive behavior (Potter & Tomasello, 2003). Six contextual features have been identified that may predict teens’ preferences for televised aggression: the presence of reward, punishment, justification, graphicness, realism, and humor (see the appendix for definitions; Smith et al., 1998). Because contextual features can change the meaning of aggressive content, researchers have argued that it is perhaps not the presence of aggression in general that attracts (some) teens to certain television programs but the particular way in which it is presented (Tamborini, Weber, Bowman, Eden, & Skalski, 2013). For example, aggressive teens may specifically seek out justified aggression on television because of a need to justify their own aggressive behavior (Cantor & Nathanson, 1997). Yet, the contextual features of televised aggression have never been examined in relation to individual viewer characteristics.
This study responds to repeated calls for more systematic, in-depth research into the attractiveness of different forms of aggressive television content (e.g., Cantor & Nathanson, 1997; Weaver, 2011). We do so by examining how teens’ TA and sex are related to their preferences for three types (physical, verbal, indirect) and six contextual features of aggression (i.e., whether the aggression is rewarded, punished, justified, graphic, realistic, and/or humorously portrayed). To this end, we use a linkage analysis (Scharkow & Bachl, 2017), in which results from a content analysis are combined with individual survey data. This method has previously been employed in political communication but has not often been applied in other subfields of communication (De Vreese et al., 2017).
Explaining Differential Preferences
Prior theoretical work on selective exposure to aggressive television content has treated such content as relatively monolithic, by focusing on explaining either why (young) people are attracted to aggressive content (e.g., forbidden fruit hypothesis, Bushman & Stack, 1996) or why some individuals are more attracted to it than others (e.g., boys; gender socialization theory, Cantor, 1998). However, none of these theoretical accounts explain how different viewer characteristics may lead to preferences for different types or contexts of televised aggression. The Selective Exposure Self- and Affect-Management (SESAM) model (Knobloch-Westerwick, 2015) is the first to provide an integrative framework that helps link teens’ TA and sex to preferences for different forms of aggressive content.
The SESAM model postulates that media exposure motivations result from the viewer’s self-concept, which refers to a dynamic system of beliefs about the self, based on traits, demographics, cognitions, affect, and motivations (Knobloch-Westerwick, 2015). The model argues that people are motivated to select media content that connects with and supports their self-concept because constructing and maintaining a positive self-concept is pivotal for mental health and development, especially in adolescence (Ybrandt, 2008). The SESAM model specifies three self-related motivations that may explain why different people have differential preferences for media content: the need for (a) self-consistency, (b) self-enhancement, and (c) self-improvement.
The first self-related motivation, individuals’ need for self-consistency, leads them to prefer media content that reinforces preexisting views. According to the disposition-content congruency hypothesis (Valkenburg & Peter, 2013), people prefer content that does not diverge too much from their preexisting cognitions, emotions, attitudes, beliefs, and behavior (i.e., their self-concept in SESAM terms). Congruent content can be processed more fluently and be more easily related to existing mental schemata, which creates a feeling of familiarity and elicits positive affect (Reber, Schwarz, & Winkielman, 2004).
The second self-related motivation, the need for self-enhancement, leads viewers to prefer media content that portrays themselves or their in-group in a positive way (Knobloch-Westerwick, 2015). One’s in-group refers to “a set of people with whom one shares some attribute that contributes to one’s positive social identity” (Triandis, Bontempo, Villareal, Asai, & Lucca, 1988, p. 324). Through assimilation of the self with the in-group (Otten, 2005), individuals can obtain or maintain a stable and positive self-concept. Particularly in situations where aspects of the self are threatened, viewers may seek ways to enhance their self-concept, for example, by selecting media content that presents the threatened aspect of the self-concept in a positive light (Knobloch-Westerwick, 2015).
The third self-related motivation that may guide individuals’ content preferences is their need for self-improvement (Knobloch-Westerwick, 2015), described as “the desire to improve or change the self, to develop, grow, and fulfill one’s potential” (Markus & Wurf, 1987, p. 314). Individuals can improve themselves by observing important agents in their environment, such as characters on television (cf. social cognitive theory; Bandura, 2001). Selective exposure to specific content on television may teach viewers how to improve their own behavior to gain social rewards and minimize punishment. In this study, these three self-related motivations help formulate expectations about teens’ differential preferences for types and contextual features of televised aggression as a result of their TA and sex.
Aggressive Teens’ Preferences
To our knowledge, this is the first study to examine TA in relation to preferences for physical, verbal, and indirect aggression on television. Previous research has frequently found that aggressive individuals watch more physical aggression than their less aggressive counterparts (see Weaver, 2011, for a meta-analysis). In addition, three studies have examined differential preferences for either verbal or indirect aggression (Atkin, Greenberg, Korzenny, & McDermott, 1979; Banerjee, Greene, Krcmar, & Bagdasarov, 2009; Coyne & Archer, 2005). Banerjee and colleagues (2009) found that young adults high in TA showed a greater preference for verbal televised aggression than those low in TA. Atkin et al. (1979) found that more verbally aggressive youths watched more verbal aggression on television, whereas more physically aggressive youths watched more physical aggression. Finally, Coyne and Archer (2005) reported that indirectly aggressive adolescents preferred television programs with high amounts of indirect aggression.
However, none of these studies have explained in depth why aggressive teens would like to watch physical, verbal, and indirect aggression on television. The three self-related motivations from the SESAM model can be used to explain what teens may get out of watching these types of aggression on television. First, because aggressive teens are more likely to engage in physical, verbal, and indirect aggression in real life (Archer & Webb, 2006), watching these three types of aggression is congruent with their disposition, which should increase processing fluency and elicit positive affect (thereby satisfying their need for self-consistency). Second, because aggression is a salient part of aggressive teens’ self-concept, the fact that aggressive behavior is generally disapproved of by society (Perry, Perry, & Weiss, 1989) poses a threat to maintaining a positive self-concept. Aggressive teens may solve this threat by selecting content that puts their aggressive behavior in a more acceptable light (need for self-enhancement). Third, societal disapproval may also lead aggressive individuals to watch televised aggression in order to learn how to improve their own use of aggression, for example, to minimize the likelihood of punishment (need for self-improvement). Arguably, watching indirect (“behind the back”) aggression would be especially instructive because this is considered the form of aggression a perpetrator can most easily get away with (Card et al., 2008). Based on both the prior research findings and the SESAM model’s theoretical framework, we pose the following hypothesis:
Aggressive teens may also prefer aggression portrayed with certain contextual features. Because contextual features can change the meaning of aggression (Potter & Tomasello, 2003), aggressive teens may use the contextual features of aggression to construct a meaning that is in accordance with or favorable to their own self-concept, thereby fulfilling the needs specified by the SESAM model. To date, aggressive teens’ preferences for these features have never been examined. From a SESAM perspective, TA can be linked to five contextual features of aggression.
First, the three SESAM motivations would suggest that aggressive teens prefer aggression that is portrayed in a realistic way. Because it is similar to their own life, realistic aggression (a) increases teens’ processing fluency and elicits positive affect (need for self-consistency), (b) enables teens to shed more positive light on the use of aggression by categorizing the aggressor on television as a member of their in-group (need for self-enhancement), and (c) provides them with a situation they can learn from and incorporate in their own life (need for self-improvement). In addition, it has been argued that aggressive teens prefer justified aggression on television because it enables them to see their own aggressive behavior as acceptable (Cantor & Nathanson, 1997), thereby reducing the tension caused by societal disapproval (need for self-enhancement). Furthermore, we expect aggressive teens to prefer aggression that is not punished and preferably even rewarded because these contextual features enable them to see aggression as acceptable behavior (self-enhancement) and learn how aggression can be most effectively used (self-improvement). Likewise, humorously portrayed aggression may also be instructive for aggressive teens because learning how to express their aggressive feelings in a humorous way could reduce the likelihood of punishment because they can always say that “it was just a joke” (need for self-improvement). Therefore, we pose the following hypothesis:
Boys’ and Girls’ Preferences
This study is also the first to examine teens’ sex in relation to their preferences for physical, verbal, and indirect aggression on television. For boys, it is expected that they prefer more physical aggression on television than girls do (Weaver, 2011). First, boys are generally more physically aggressive than girls, both in real life and on television (Archer, 2004; Linder & Lyle, 2011). Therefore, watching physical aggression is more congruent with their self-concept (self-consistency). Second, boys may prefer physical aggression because male characters on television are typically rewarded for physically aggressive actions, which reflects positively on their in-group (self-enhancement). Third, boys may use physically aggressive television programs to observe how to behave as a “tough guy,” the stereotypical gender role for boys (self-improvement; Knobloch-Westerwick, 2014).
Conversely, girls reportedly watch more televised verbal (Atkin et al., 1979) and indirect aggression (Coyne & Archer, 2005) than boys do. These findings support expectations based on the SESAM motivations. First, as girls engage in more verbal (Archer, Pearson, & Westeman, 1988) and indirect aggression (Crick & Grotpeter, 1995) than boys do, watching such aggressive behaviors is more congruent with girls’ than boys’ self-concept (self-consistency). Second, sex differences in aggressive behavior are often explained by (a) girls’ weaker physical strength and stronger verbal skills, (b) girls experiencing greater disapproval for using aggression, and (c) their greater fear of sanctions for being considered aggressive, all of which may cause girls to seek more subtle and covert fighting strategies (Graves, 2007; Letendre, 2007), which they can learn by watching verbal and indirect aggression on television (self-improvement). Therefore, we pose the following hypothesis:
Boys and girls may also hold different preferences for aggression portrayed with certain contextual features. From a SESAM perspective, we expect the following: First, guided by the notion that aggression is more accepted for boys than girls (Graves, 2007) and thus more likely to be a salient part of boys’ self-concept, boys are expected to prefer realistic aggression because this is congruent with their self-concept (self-consistency) and provides them with situations from which to learn (self-improvement). This is supported by research on violent videogames, in which boys preferred games with realistic violence, while girls preferred games that contained fantasy violence (Buchman & Funk, 1996). Furthermore, because aggression is seen as more justified for boys and is sometimes even rewarded, whereas for girls aggression is punished with social derogation (Coyne, Archer, Eslea, & Liechty, 2008; Graves, 2007), we expect boys to prefer more justified and rewarded aggression and less punished televised aggression than girls (self-consistency).
In addition, boys are expected to prefer graphic aggression because watching graphic aggression may make them look like a “tough guy” (self-improvement; Mundorf, Weaver, & Zillmann, 1989). This is supported by research showing that boys have a greater preference for graphic violence than girls (Hoffner & Levine, 2005). Finally, we expect boys to show a greater preference for humorously portrayed aggression than girls. Watching humorous aggression is congruent with boys’ self-concept (self-consistency), because in real life, aggressive humor is more engaged in and appreciated by boys than by girls (Socha & Kelly, 1994). Therefore, we pose the following hypothesis:
Method
Sample and Procedure
This study used data from the first wave (collected in the fall of 2012) of a longitudinal survey study among 1,029 teens between 10 and 14 years of age in which they reported their TA level, sex, and up to three favorite television programs. For the current study, we selected a subsample of the original sample guided by three selection criteria. First, we only included teens who listed more than one favorite television program (n = 786) to increase the reliability of teens’ preference data. Second, because the original sample consisted of 49.9% sibling pairs, which can cause analytical problems due to nonindependent observations, we randomly selected one sibling per household (n = 473). Third, we adapted an extreme group approach (EGA), which entails selecting the most and least aggressive teens from the sample. When research is both exploratory and labor-intensive, EGA is a cost-effective way to find general trends in the data, as it can enhance the detectability of effects (Preacher, Rucker, MacCallum, & Nicewander, 2005). The use of EGA is preeminently appropriate when the distribution of the target variable is highly skewed (Preacher et al., 2005), which was the case for our TA scores. In fact, only a few teens had very high TA scores. With a randomly selected subsample, we would have risked excluding the most aggressive teens, our group of interest.
Regarding the EGA sampling method, guided by prior recommendations (Anderson, Gentile, & Buckley, 2007) and an a priori power analysis (with α = .05 and power of .80), we initially included the 10% most and 10% least aggressive teens (n = 117) and conducted a content analysis of their favorite television programs. However, when we examined teens’ differential preferences by linking the content analysis data to the individual survey data, this resulted in unforeseen power problems (range: .50-.74). We then conducted a second power analysis using the average effect size (f2= .07) from the first linkage analysis, which indicated that raising the sample size to 156 (i.e., 16.5% at each end) would result in sufficient power. Thus, we increased the sample size to 156, balanced for sex (i.e., 39 boys and 39 girls in the high and low TA groups). For the teens who were added to the sample, we also conducted a content analysis of their favorite television programs. The final sample did not differ from the original sample in terms of age, sex, level of parental education, and parent income. The average age of the participants was 11.76 years (SD = 1.46 years).
Self-Report Measures
TA
TA was measured using the short form of the Buss-Perry Aggression Questionnaire (BPAQ-SF; Bryant & Smith, 2001). The BPAQ-SF measures four subscales with three items each: physical aggression, verbal aggression, anger, and hostility. Participants rated their agreement with each statement on a 5-point Likert-type scale (1 = extremely uncharacteristic of me, 5 = extremely characteristic of me). Confirmatory factor analysis validated the factor structure of the BPAQ-SF subscales; χ2(48) = 172.06, p < .001, root mean square error of approximation (RMSEA) = 0.05, comparative fit index (CFI) = 0.96, and standardized root mean square residual (SRMR) = 0.04. Responses were averaged for each subscale and then summed to create an overall aggression score (Cronbach’s α = .94), with higher scores indicating greater TA. This score was used to select the respondents with the lowest (boys: M = 4.89, SD = 0.63; girls: M = 4.60, SD = 0.37) and highest TA scores (boys: M = 12.25, SD = 1.44; girls: M = 10.92, SD = 1.31).
Adolescents’ favorite television programs
Participants were asked to write down the titles of up to three favorite television programs (cf. Anderson & Dill, 2000). We included the first two valid titles of our 156 participants in the content analysis. A title was considered valid when it referred to an existing entertainment program, with “entertainment” defined as “programming designed with entertainment as the primary goal” (Gray, 2009, p. 3). This resulted in a list of 109 unique television program titles, of which nine could no longer be obtained. Thus, the final content analysis sample consisted of 100 television programs.
To obtain representative estimates of the aggression in each television program, we included two episodes per program in the content analysis (cf. Banerjee et al., 2009). These episodes were randomly selected from the season that was broadcast around the fall of 2012. First and final episodes of each season were excluded because these were expected to be less representative of an average episode (e.g., due to the introduction of new characters and cliffhangers). In total, 200 television episodes were included, ranging in time from 5 minutes to 2 hours, with a mean duration of 32 minutes and 41 seconds. This resulted in 109 hours of television content to be coded.
Content Analysis
Unit of analysis
All episodes were divided into scenes, which formed the unit of analysis. A scene was defined as “an uninterrupted sequence of thematically-related activities occurring within a given physical context” (cf. Weaver, 1991). On average, episodes consisted of 24.2 scenes (range: 4-66 scenes) with a mean duration of 1 minute and 21 seconds, resulting in a final coding sample of 4,839 scenes.
Coding scheme
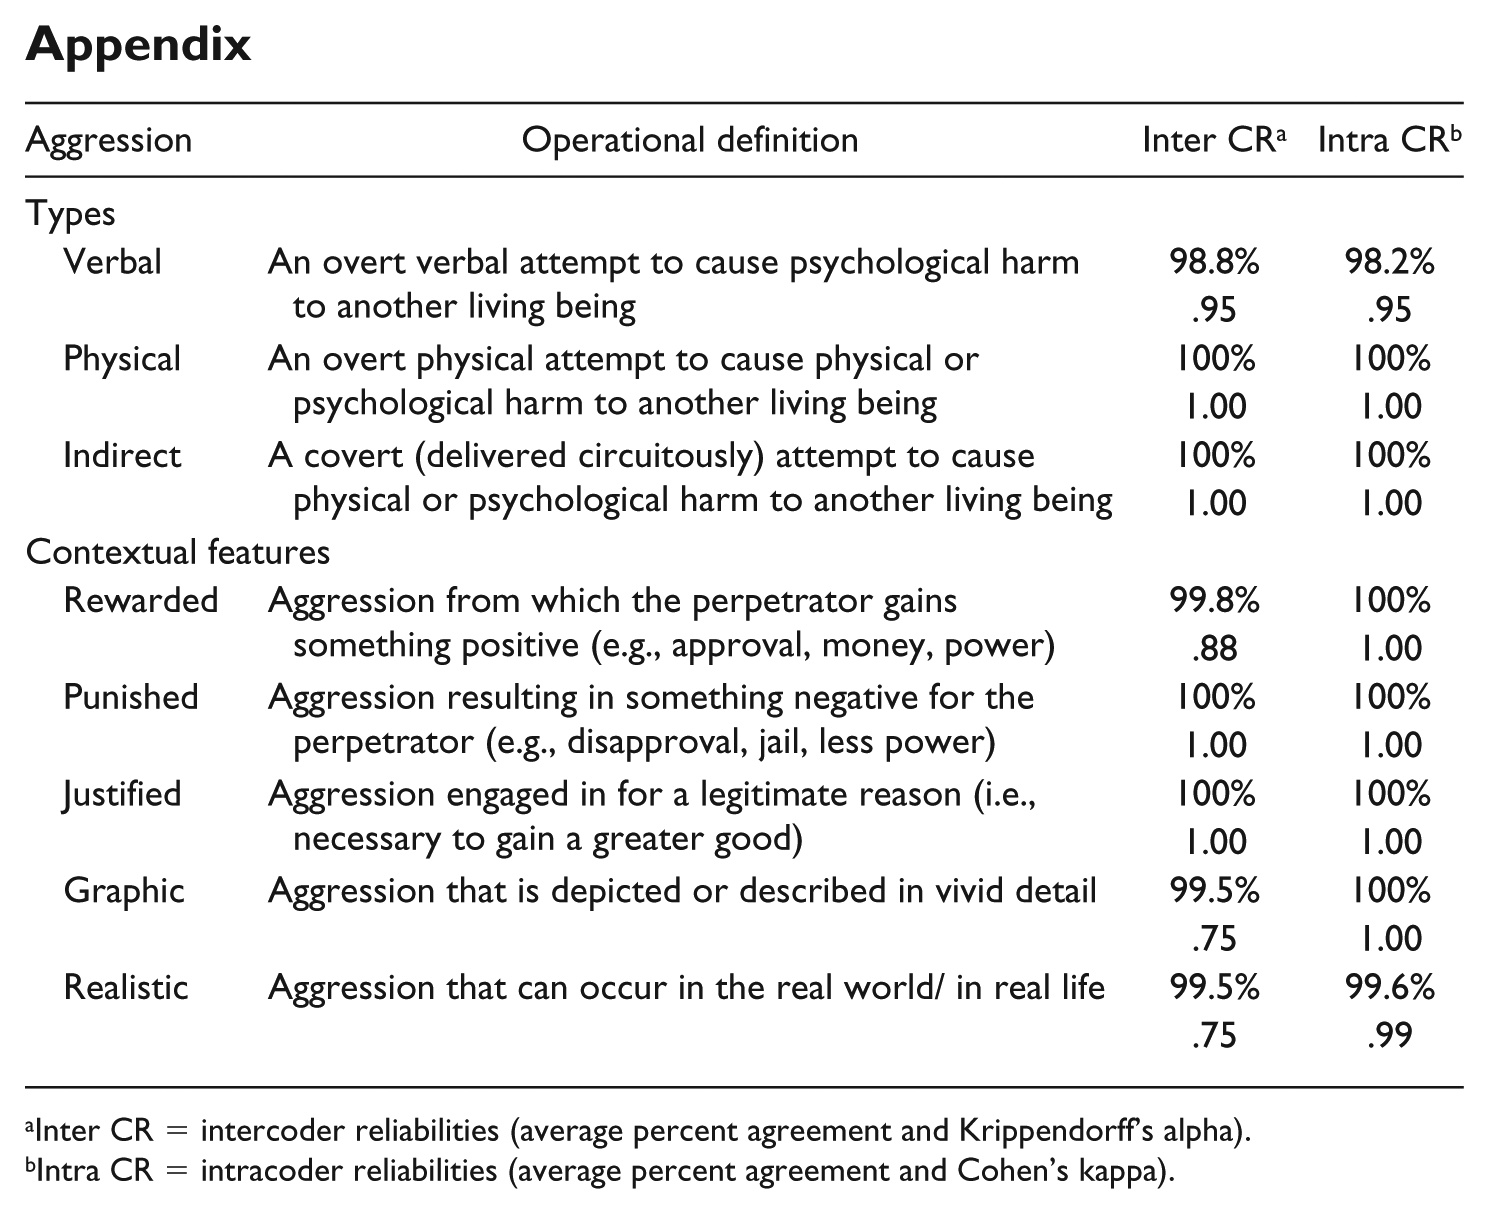
A coding manual was developed based on the literature to provide exact definitions of concepts, examples, and decision rules for coders to follow. The manual can be requested from the first author. For every scene, coders had to indicate whether or not aggression was present. Aggression was defined as any action intended to cause physical or psychological harm to another living being who is motivated to avoid that harm (cf. Anderson & Bushman, 2002). When coders indicated that a scene contained aggression, they subsequently coded whether the aggression was physical, verbal, or indirect (more than one type could be present within a scene); see the appendix for full definitions.
Next, for every type of aggression that was coded as present within a scene, coders assessed whether the aggression was (a) rewarded, (b) punished, (c) justified, (d) graphic, (e) realistic, and (f) humorously portrayed (definitions in the appendix). Although content coding took place on a scene level, justifications, rewards, and punishments of aggressive behavior could also occur in a later scene. Coders, therefore, also coded these features as “present” when a later scene in the same episode showed these contextual features. Coders were provided with examples of the contextual features for each of the three aggression types. However, although physical, verbal, and indirect aggression were coded separately for each scene, we had no theoretical expectations about teens’ preferences for contextual features of physical versus verbal versus indirect aggression. As such, we collapsed contextual features across the three aggression types for the analysis.
Coding process and reliability
Three coders were trained by the first author (who also participated in the coding) in two training sessions of 6 hours each using episodes that were not part of the main content analysis. In a third session, coders individually test-coded two episodes, after which they received feedback to resolve possible misunderstandings. The work of one coder was discontinued due to insufficient test coding.
After the training phase, each coder content-coded the same 10% of the sample to calculate intercoder reliability (cf. Lombard, Snyder-Duch, & Bracken, 2002). The results indicated good reliability of the coding categories, with average percent agreement ranging from 98.8% to 100% and Krippendorff’s alpha ranging from .75 to 1 (see the appendix).
The to-be-coded programs were then randomly distributed across coders. Coders were blind to the TA and sex of the teens who had listed these programs as their favorite. Coders watched every episode at least twice, first in its entirety to familiarize themselves with the content and then again scene-by-scene. During the second viewing, content coding questions were simultaneously completed using Qualtrics survey software.
In addition to intercoder reliability, intracoder reliability was calculated halfway through the content coding process (2 months after the intercoder reliability test) to ensure that coders’ understanding and use of the codebook had not changed over time. To test this, coders coded a program again that they had coded at the start of the project. The results indicated good reliability over time (cf. Gwet, 2008), with average percent agreement ranging from 98.8% to 100% and Cohen’s kappa from .95 to 1 (see the appendix).
Analytic Approach
Several steps were taken to link the scene-level content analysis data to individual-level TA and sex. First, we summed the number of scenes within an episode that contained aggression and then for the two episodes coded per television program. Since each participant had listed two favorite programs, we then summed these program-level sum scores to arrive at one score per coded variable per teen. For these teen-level variables, it was necessary to account for variation in the number of scenes a television program consisted of (because a higher number of scenes means a higher potential prevalence of aggression). Therefore, the teen-level sum scores were divided by the total number of scenes in their two favorite programs and then multiplied by 100 to create percentages. For the contextual features, teen-level sum scores were divided by the total number of scenes in their favorite programs containing aggression. These individual-level percentages were used as operationalization of teens’ preferences for different types and contextual features of aggression on television.
With these individual-level percentages as the dependent variables, hypotheses were tested using multivariate analyses of variance (MANOVAs). Because MANOVA does not allow accounting for classification error (a process recommended when working with content analytic data), we manually corrected for misclassification in the content analysis by applying matrix back-calculation based on obtained intercoder reliabilities (cf. Bachl & Scharkow, 2017). This led to minor changes in individual-level scores, but did not change the overall pattern of results.
Results
Content Analysis Findings
One hundred programs (a total of 4,839 scenes) were coded for three types and six contextual features of aggressive behavior. At the program level, 61.0% of participants’ favorite television programs contained aggression. At the scene level, aggression was present in 8.9% of scenes. When distinguishing between types of aggression, physical aggression was present in 51.0% of programs, verbal aggression in 43.0% of programs, and indirect aggression in 24.0% of programs. Prevalence was again lower when looking at the scene level: Physical aggression was present in 6.3% of all scenes, verbal aggression in 2.9%, and indirect aggression in 0.9% of all 4,839 scenes. Of the 432 scenes that contained aggression, aggression was presented as graphic in 18.1% of these scenes, as realistic in 30.8% of scenes, as justified in 33.3% of scenes, as rewarded in 39.6% of scenes, and as punished in 35.2% of scenes. Aggression was portrayed humorously in 44.7% of scenes containing aggression.
Aggressive Teens’ Preferences (H1, H2)
A one-way MANOVA with three dependent variables (physical, verbal, and indirect aggression) was conducted to examine how TA level (low, high) is related to preferences for different types of aggression. Means and standard deviations are reported in Table 1. Our results showed no main effect of TA level on preference for aggression type, Pillai’s trace = .04, F(3, 152) = 2.24, p = .086. Follow-up pairwise comparisons (Bonferroni corrected) showed that the difference between high and low aggressive teens in preference for physical aggression was significant, F(1, 154) = 4.28, p = .040, 95% confidence interval (CI) = [0.11, 4.53],
Mean Preference Scores (SD) for Physical, Verbal, and Indirect Televised Aggression for Low Versus High Trait Aggression and Girls Versus Boys.
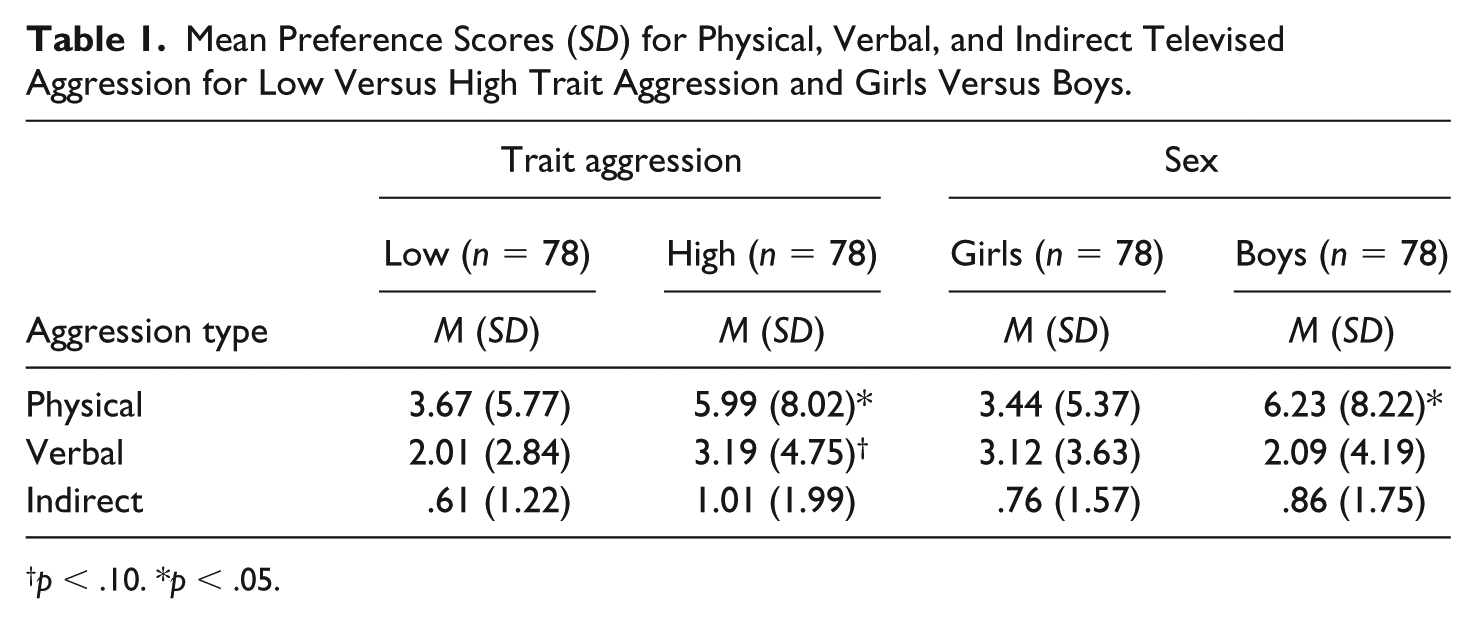
p < .10. *p < .05.
A one-way MANOVA with the six contextual features of aggression as dependent variables was conducted to examine how TA level is related to preferences for contextual features of aggression. Means and standard deviations can be found in Figure 1. No overall effect of TA on preference for contextual features was found, Pillai’s trace = .05, F(6, 117) = 1.01, p = .423. Follow-up pairwise comparisons (Bonferroni corrected) showed that none of the differences in preference for the contextual features of aggression were significant for high versus low aggressive teens, rejecting H2a-e.
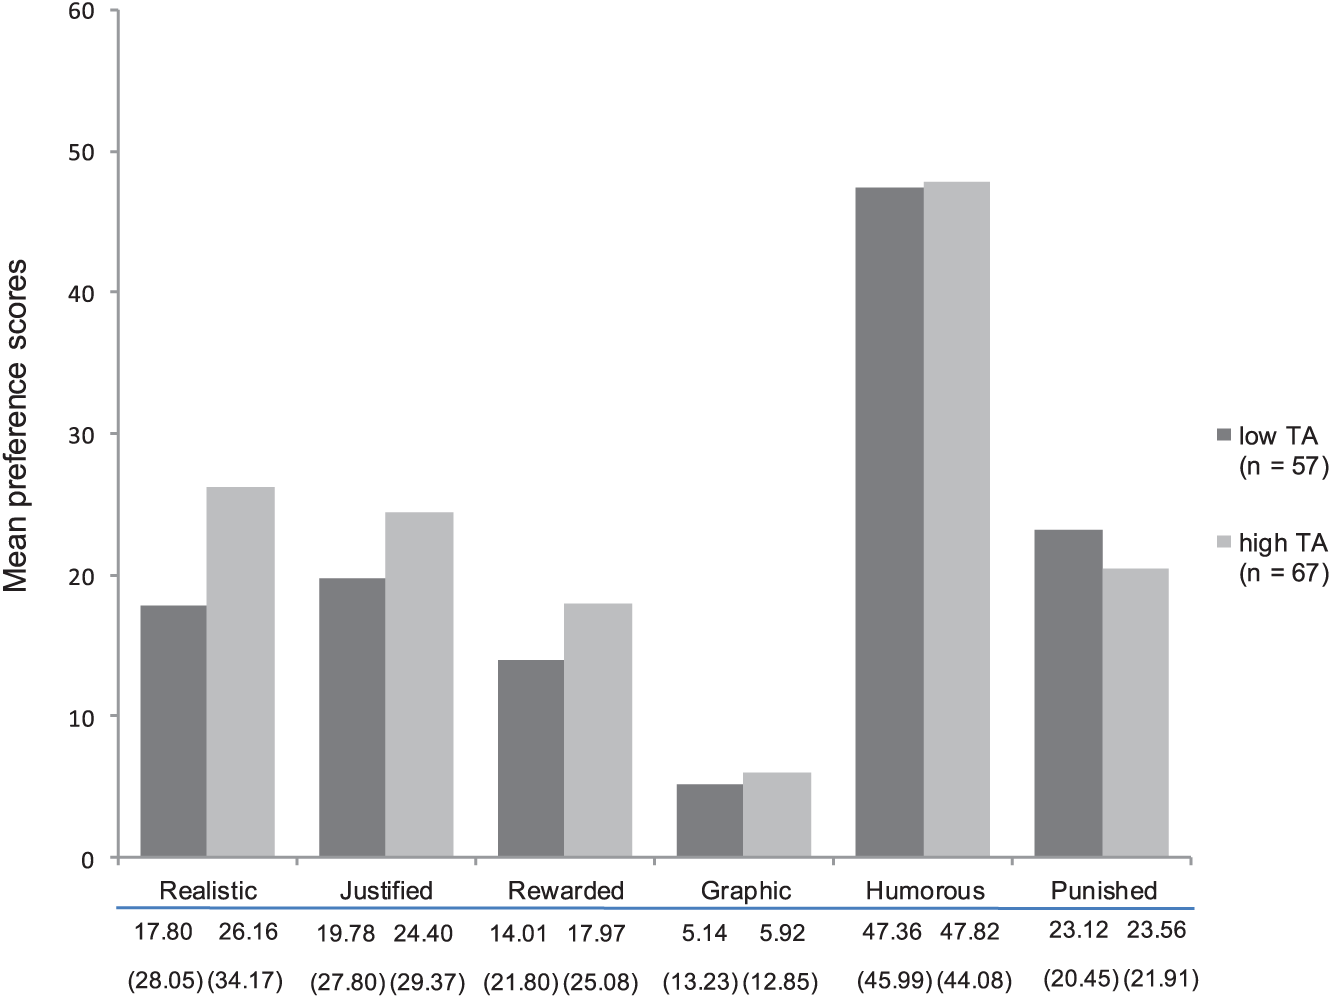
Mean preference scores (SD) for the different contextual features of aggression for low versus high trait aggression (TA).
Boys’ and Girls’ Preferences (H3, H4)
A one-way MANOVA with three dependent variables (physical, verbal, and indirect aggression) was conducted to examine how sex is related to preferences for different types of aggression. Means and standard deviations are reported in Table 1. There was a significant overall main effect of sex on preference for aggression type, Pillai’s trace = .10, F(3, 152) = 5.39, p = .002,
A one-way MANOVA was conducted to examine how teens’ sex predicts their preferences for contextual features of aggression. Means and standard deviations can be found in Figure 2. There was a significant overall main effect of sex on preference for contextual features, Pillai’s trace = .20, F(6, 117) = 4.72, p < .001,
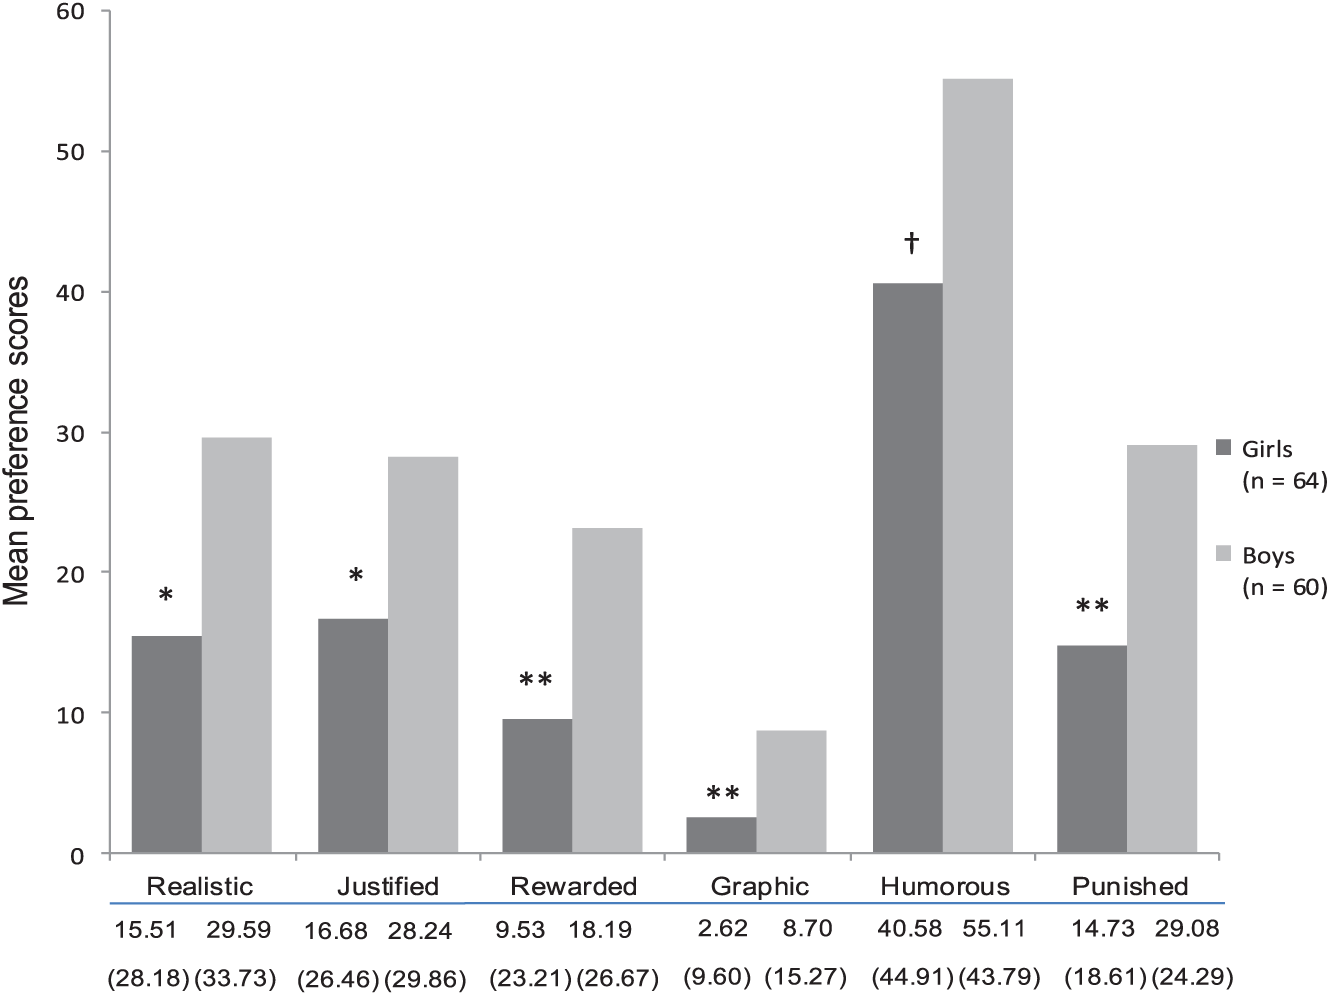
Mean preference scores (SD) for the different contextual features of aggression for girls versus boys.
Discussion
This study investigated how teens’ TA and sex are related to their preference for different types and contextual features of televised aggression. Guided by the SESAM model (Knobloch-Westerwick, 2015), our hypotheses were tested through a novel design called linkage analysis in which teens’ TA and sex were linked to the results of an in-depth content analysis of their favorite television programs. Our findings on the prevalence of physical and verbal aggression and the six contextual features of aggression were largely in line with previous content analyses (Coyne & Archer, 2004; Linder & Lyle, 2011; Smith et al., 1998). Physical aggression was found in 51% of the coded programs and verbal aggression in 43% of programs. In addition, aggression was portrayed as graphic in 18% of aggressive scenes and as justified, realistic, rewarded, punished, and humorous in 33% to 45% of these scenes.
Contrary to previous research (e.g., Coyne & Archer, 2004) that found that indirect aggression was the most prevalent aggression type, in our study, it was the least prevalent (i.e., in 24% of programs). This may be because, in our study, indirect aggression was only coded when it was a covert attempt (i.e., delivered circuitously, behind-the-back) to cause physical or psychological harm to another living being. Other researchers (e.g., Coyne & Archer, 2004) have defined indirect aggression more broadly to also include social and relational forms of aggression, such as leaving the room to make someone feel bad, giving someone a dirty look, or suing the person. In our study, such instances were not coded as indirectly aggressive because they are overt rather than covert. To enhance comparability between studies, it is important that researchers strive to reach consensus about what exactly constitutes indirect aggression on television.
Aggressive Teens’ Preferences
When linking the content analysis findings to teens’ TA, the results showed that more aggressive teens preferred more physical aggression on television than less aggressive teens, which is in line with our SESAM-based hypothesis and previous research (Weaver, 2011). Aggressive teens also had higher preference scores for verbal aggression, although this difference did not reach conventional levels of significance (p = .06). No differences were found in preference for indirect aggression. On the one hand, the very low prevalence of indirect aggression in teens’ favorite television shows may have made it more difficult to detect significant differences. On the other hand, indirect aggression may be a less salient part of aggressive teens’ self-concept than direct types of aggression (Richetin, Richardson, & Mason, 2010), implying that watching indirect aggression would not satisfy their self-related needs. This could explain why we found no differential preferences for indirect aggression.
No significant differences were found in aggressive and nonaggressive teens’ preferences for any of the contextual features of aggression tested in this study. It is possible that, for aggressive teens, simply exposing themselves to any form of physical or verbal aggression on television may already provide sufficient self-enhancement to maintain a positive self-concept, regardless of how that aggression is presented. Future research should test this more explicitly by employing an experimental design comparing conditions with and without the contextual features hypothesized to increase the self-acceptance of teens’ aggressive behavior.
Boys’ and Girls’ Preferences
Boys showed a significantly greater preference for physical aggression, which is again in line with our SESAM-based hypothesis and previous research (Weaver, 2011). Boys and girls did not differ significantly in preference for verbal aggression (although girls did have a higher preference score). Again, no differences were found in preference for indirect aggression. Similar explanations hold here: Indirect aggression may have been too infrequent in teens’ favorite television programs to detect significant differences, or the salience of indirect aggression may be relatively similar for boys and girls and consequently not lead to differential preferences. Therefore, future selective exposure research should examine directly whether indirect aggression is a salient part of teens’ self-concept (e.g., with an Implicit Association Task; Richetin et al., 2010) to clarify the relationship between viewer characteristics and preference for indirect aggression on television.
In contrast to the findings of TA, we found large differences between boys and girls in their preferences for contextual features of aggression. Boys preferred more realistic, justified, graphic, and rewarded aggression compared with girls. Unexpectedly, boys also showed a greater preference for punished aggression, which was hypothesized for girls. The fact that certain television formats present both rewarded and punished aggression may explain this finding. Crime series, for example, often present bad guys who engage in aggression and are later caught by the police with force (Sparks, 1992), in which case the aggression used by the bad guy is punished and the aggression used by the police is rewarded. Thus, boys in our sample may have liked programs which featured aggression that was not only rewarded (in accordance with what we expected) but also punished. This is in line with Cantor and Nathanson’s (1997) finding that boys show a greater preference than girls for justice-restoring programs.
Importantly, our findings indicate that boys have a preference for aggression presented in a context that increases the likelihood of imitating that behavior (Bandura, 2001). Given these findings, parents are advised to monitor not just the presence of physical aggression in television programs but also the contexts of the aggression to which their children (particularly boys) are exposed. To help parents to effectively monitor their children’s exposure, entertainment rating agencies may expand their current rating system to include the contextual features of aggression examined in the present study.
Theoretical Implications
The current study employed the SESAM model (Knobloch-Westerwick, 2015) to explain what aggressive teens and boys may get out of watching particular types and contextual features of aggression on television. A major theoretical contribution of the SESAM model is that it describes the media user’s self-concept (i.e., the way an individual views himself or herself) as pivotal in selective exposure choices. Our study provides partial support for the explanatory power of the SESAM model with regard to teens’ selective exposure to different forms of televised aggression. To encourage further inclusion of the model in future selective exposure research, we offer two observations.
First, the aim of this study was to understand the roles of TA and sex in guiding teens’ selective exposure. Because the SESAM model conceptualizes the self-concept as encompassing both situationally induced states and stable characteristics, it is difficult to isolate the unique role of such stable characteristics. This study has attempted to tackle this issue by examining the relationships between stable characteristics and the content of teens’ favorite television programs because such programs reflect a repetitive, more stable pattern of selective exposure choices (Knobloch-Westerwick, 2014). However, it is crucial for future work to examine the extent to which stable characteristics are salient for teens’ self-concept across different situations. Only then can we draw definitive conclusions about when and why stable characteristics result in specific selective exposure choices.
Second, this study used the SESAM’s need for self-consistency, self-enhancement, and self-improvement as theoretical underpinnings for the relationship between teens’ TA and sex and their preferences for different forms of aggressive content. This study was not designed to test whether these three needs indeed function as the mechanisms between viewer characteristics and preferences, so it cannot offer direct evidence about the role of these needs in guiding selective exposure. Future research should more explicitly examine whether and which of these needs best explain teens’ differential content preferences, either in an experimental design (in which these needs can be evoked and their effect on preferences can be examined) or through self-report indicators of motivations for watching aggressive content (e.g., an experience sampling method). The latter would also enable researchers to validate self-report measures of motivations/preferences with our content analytic measures of preference. More direct tests of the SESAM’s self-related motivations are a crucial next step in fully understanding individual differences in teens’ exposure to aggressive content and the SESAM model’s theoretical value in the field.
Methodological Implications
Our study used a novel approach in which we combined results from a content analysis with individual survey data (linkage analysis). Because linkage analysis can account for individual differences in exposure to particular types of media content (Scharkow & Bachl, 2017), it is seen as a major improvement when compared with survey-only and content-only designs (Schuck, Vliegenthart, & de Vreese, 2016). However, linkage analyses also come with some caveats, not in the least their proneness to power issues. Even though our content analysis included nearly 5,000 scenes, statistical power to test the relationship between TA/sex and preference for physical aggression was still too low (.54 and .70, respectively). This also precluded us from examining the interaction effects between TA and sex for aggression-type preferences. This low power was in part due to the low prevalence of aggression in teens’ favorite programs and large standard deviations across programs, both of which make it more difficult to detect effects (Button et al., 2013).
The power issues may also in part be due to our individual-level sample size (156 teens). The combination of an EGA and linkage analysis made it difficult to calculate beforehand the sample size needed for sufficient power because an EGA may inflate effect sizes and power (Preacher et al., 2005), whereas the use of linkage analysis can deflate effect sizes and power (Scharkow & Bachl, 2017). Future research could consider including more participants, but note that increasing the sample size also inevitably increases the number of scenes to be coded, which may not be feasible due to the labor-intensive nature of coding media content. The development of (semi)automatic ways to analyze media content could offer a solution to this problem.
Furthermore, as is common practice, in setting up our content analysis we adopted rather stringent operationalizations for the different types and contextual features of aggression to minimize coder subjectivity and enhance coding reliability. However, definitions used by researchers do not always correspond with how viewers perceive these concepts (Potter & Tomasello, 2003). For example, this study only coded aggression as “justified” when it was engaged in for legitimate reasons approved of by society (e.g., to save someone else/the world). Excluded from this operationalization was “provoked” aggression (e.g., hitting someone because he or she hit you first). However, Krcmar and Cooke (2001) found that young adolescents judged aggressive behavior in video clips as justified when the perpetrator was provoked. Therefore, future linkage research should consider combining survey data with a reception-based content analysis, in which audience perceptions of coding categories are included in the development of a coding scheme (Ahuvia, 2001).
Finally, the finding that approximately 9% of scenes contained aggression raises the question as to the content featured in the remaining 91% of scenes. In addition to aggressive content, television programs are composed of a variety of other content types that may contribute to their attractiveness, such as action, suspense, and humor (Valkenburg & Cantor, 2000). Given existing societal concerns about aggressive content, this study focused specifically on aggression, but future linkage research should also examine teens’ favorite television programs for the prevalence of other content types and investigate how these are related to viewer characteristics.
Conclusion
This study aimed to respond to societal concerns about teens’ exposure to potentially harmful aggressive content (Strasburger et al., 2013) by examining which teens prefer what forms of televised aggression. By employing a novel theoretical framework and research design, this study has taken an important first step in improving our understanding of how viewer characteristics, such as TA level and sex, relate to their preferences for different forms of aggression on television. Future research endeavors can benefit from the conceptual and methodological takeaways in this article to further improve our novel approach for studying individual differences in attraction to different forms of aggressive content.
Footnotes
Appendix
| Aggression | Operational definition | Inter CR a | Intra CR b |
|---|---|---|---|
| Types | |||
| Verbal | An overt verbal attempt to cause psychological harm to another living being | 98.8% | 98.2% |
| .95 | .95 | ||
| Physical | An overt physical attempt to cause physical or psychological harm to another living being | 100% | 100% |
| 1.00 | 1.00 | ||
| Indirect | A covert (delivered circuitously) attempt to cause physical or psychological harm to another living being | 100% | 100% |
| 1.00 | 1.00 | ||
| Contextual features | |||
| Rewarded | Aggression from which the perpetrator gains something positive (e.g., approval, money, power) | 99.8% | 100% |
| .88 | 1.00 | ||
| Punished | Aggression resulting in something negative for the perpetrator (e.g., disapproval, jail, less power) | 100% | 100% |
| 1.00 | 1.00 | ||
| Justified | Aggression engaged in for a legitimate reason (i.e., necessary to gain a greater good) | 100% | 100% |
| 1.00 | 1.00 | ||
| Graphic | Aggression that is depicted or described in vivid detail | 99.5% | 100% |
| .75 | 1.00 | ||
| Realistic | Aggression that can occur in the real world/ in real life | 99.5% | 99.6% |
| .75 | .99 | ||
Inter CR = intercoder reliabilities (average percent agreement and Krippendorff’s alpha).
Intra CR = intracoder reliabilities (average percent agreement and Cohen’s kappa).
Acknowledgements
The authors are thankful to Leon Bakker, Mashya Boon, Dr. Mariska Kleemans, Iris de Lange, Timna Rauch, and Folko Sikkema for their involvement in the content coding process.
Authors’ Note
The second author worked at the Amsterdam School of Communication Research, University of Amsterdam, the Netherlands, when this study was conducted.
Declaration of Conflicting Interests
The authors declared no potential conflicts of interest with respect to the research, authorship, and/or publication of this article.
Funding
The authors disclosed receipt of the following financial support for the research, authorship, and/or publication of this article: This research was supported by a grant to the third author from the European Research Council under the European Union’s Seventh Framework Program (FP7/2007-2013)/ERC grant agreement (AdG09 249488-ENTCHILD).