
Abstract
Can aggregated composite scores be used to compare countries or other groups despite measurement non-invariance? We propose a pragmatic approach, emphasizing that measurement invariance is valuable but not strictly necessary for all such comparisons. For descriptive analyses of group differences, composite scores may outperform factor-analytic approaches, because they are more intuitive and can capture multiple dimensions. Using data from the European Social Survey (39 countries, 11 measurement occasions, 546,954 respondents), we examined social and political trust. Composite scores aggregated to the country level were practically indistinguishable from countries’ factor scores based on approximate measurement invariance testing. We conclude that composite scores can suffice for simple group comparisons, though their suitability depends on the data. They can, however, underestimate uncertainty, producing overly narrow confidence intervals. We further show that measurement invariance does not guarantee measurement equivalence. Finally, we highlight how researchers can leverage data even if measurement invariance fails.
Keywords
When describing measurement invariance, Leitgöb et al. (2023) leave little doubt: Measurement invariance “simply guarantees that the measures at hand can be compared and that we are, in fact, not comparing ‘chopsticks with forks’” (p. 4). Numerous papers on measurement invariance echo this sentiment. Conversely, lack of measurement invariance is said to prevent group comparisons (e.g., Davidov et al. 2014; Leitgöb et al. 2023; Meuleman et al. 2023; Stegmueller 2011).
This paper adopts a different approach. In the social sciences, statistics deliver probabilities, not guarantees. We propose a pragmatic approach, balancing methodological rigor with practical needs in research, including how research can connect with readers. We acknowledge the difference between measurement invariance and measurement equivalence, and we suggest considering the use of composite scores aggregated to a group level (e.g., countries) for descriptive analyses. However, we caution against the use of composite scores in more advanced analyses. Their standard errors and confidence intervals can easily underestimate the uncertainty associated with point estimates.
Our example data come from the European Social Survey (ESS), encompassing measurements from 39 countries over 11 measurement occasions and more than 540,000 respondents. We test for measurement invariance across countries and over time within countries, and we estimate factor scores that incorporate measurement non-invariance. We then compare these factor scores with country-level composite scores. Additionally, we investigate whether a measurement invariance test can detect a known incomparability of measures across countries.
Simultaneously Describing Country Differences and Developments Over Time
Survey-based cross-cultural research typically aims to describe differences across countries or other groups, often expressing them as a rank order (Beugelsdijk and Welzel 2018; Hofstede 1984). Ideally, such analyses of group differences will also reflect each group's development over time (Inglehart 1997, 2020). Particularly helpful would be graphs that simultaneously visualize group differences and their over-time developments. Factor scores computed by factor analysis fall short in this regard because their scale differs across data sets (Funder and Gardiner 2024; Widaman and Revelle 2023), complicating comparisons. With access to the original raw data, one could in theory perform measurement invariance testing across groups and time simultaneously, even across data sets. However, conducting measurement invariance testing that simultaneously covers country (group) differences and over-time developments within a single analysis of ESS data or similar data sets would entail comparing several hundred groups, resulting in unmanageably complex models and findings that are difficult to interpret (e.g., Davidov et al. 2014).
Another issue with factor scores is that they are non-intuitive as they do not reflect the scale of the indicators. Applied researchers highlight the advantage of composite scores; they are both intuitively easy to understand and help researchers disseminate their findings while allowing for comparisons across data sets (e.g., Dialga and Thi Hang Giang 2017; Greco et al. 2019; Kara et al. 2022).
We consider the performance of composite scores in describing social and political trust in Europe. Various scholars have raised concerns about declining trust (Caïs, Torrente, and Bolancé 2021; Dinesen, Schaeffer and Sønderskov 2020; Dotti Sani and Magistro 2016; Foster and Frieden 2017; Hetherington and Rudolph 2015) and country-aggregated composite scores may be particularly useful for studying country differences and developments of trust. The ESS measures social and political trust in various European countries every second year, and earlier research has tested measurement invariance for trust in the ESS with fewer ESS rounds and fewer countries (see Allum, Read, and Sturgis 2012; Coromina and Davidov 2013; Coromina and Peral 2020; Reeskens and Hooghe 2008). Our analyses extend this line of research on measurement invariance for trust by utilizing all available ESS data from 2002 to 2024. We also go beyond earlier research by comparing countries’ factor scores with simple composite scores.
The Concept of Measurement Invariance
A particular challenge in cross-cultural research is determining whether measurements are comparable across countries. Two individuals with similar levels of social trust should ideally have similar scores on a measure of social trust, regardless of where they live or when they are asked. Such measurement equivalence implies similar data collection methods and similar wordings of items across languages. Scholars of measurement invariance typically interpret the question of measurement equivalence as a question of measurement invariance, that is, whether measurement parameters in a factor model can be set to be equal across groups (Horn and McArdle 1992; Meredith 1993; Meuleman et al. 2023). We refer to Leitgöb et al. (2023) for a detailed description of the history of measurement invariance testing. Based on their historical review, they conclude not only that ascertaining measurement invariance is necessary, but also that it suffices for establishing the equivalence of measurements across groups. Both views are common in the literature on measurement invariance.
Ignoring the question of measurement invariance is said to have “dire” consequences (Maassen et al. 2023). Scholars of measurement invariance criticize applied research for overlooking the issue of measurement invariance, thus comparing “apples and oranges” (Boer, Hanke, and He 2018; Davidov et al. 2014; Greiff and Scherer 2018; Stegmueller 2011) or “chopsticks with forks” (Chen 2008).
Tests of measurement invariance were introduced as a means to establish “whether or not, under different conditions of observing and studying a phenomenon, measurement observations yield measures of the same attribute” (Horn and McArdle 1992: 217, see also Meredith 1993). Later publications have repeated the claim that measurement invariance on its own implies measurement equivalence, with cross-group validity of measurements. The assertion that measurement invariance equals measurement equivalence continues into recent publications (e.g., Aleman et al. 2022; Leitgöb et al. 2023; Maassen et al. 2023; Martín-Fernández, Gracia and Lila 2020; Meuleman et al. 2023; Seddig, Maskileyson, and Davidov 2020). Critics highlight this claim as a logical fallacy (Raykov 2024; Robitzsch and Lüdtke 2023; Welzel et al. 2023a). These critics argue that a factor model needs to be substantiated by criteria beyond the measurement model itself: theoretical justifications and the ability to predict other variables should serve as validity tests (Funder and Gardiner 2024; Robitzsch and Lüdtke 2023; Welzel et al. 2023a). Only a few theorists of measurement invariance acknowledge the distinction between measurement invariance and measurement equivalence; examples are Meitinger (2017), Lacko et al. (2022), and Fischer et al. (2023).
Measurement Invariance is Difficult to Achieve
Traditionally, scholars have argued that comparing groups requires measurement invariance in the form of scalar invariance: a factor model with the same factor loadings and intercepts/thresholds across groups (Leitgöb et al. 2023; Meuleman et al. 2023; Vandenberg and Lance 2000). However, scalar invariance can be difficult to achieve with real-world data, particularly in multinational comparisons (Marsh et al. 2018). Different languages, cultural variations, and historical events all complicate achieving measurement invariance (e.g., Davidov et al. 2018; Welzel et al. 2023a). One reason is that measurement invariance analysis has relied on a significance test (the Chi-square), which can declare trivial differences to be “significant” when sample sizes are large. A solution was offered by Chen (2007), who proposed using alternative fit indices to evaluate measurement invariance and recommended that adding measurement invariance constraints should not result in a change of the Comparative Fit Index (CFI) greater than .01 or a change of the Root Mean Square Error of Approximation (RMSEA) greater than .015.
Approximate Measurement Invariance
Some scholars of measurement invariance testing have highlighted the need to consider how differences between measurement parameters actually affect substantive conclusions (e.g., Oberski 2014). In line with such thinking, Asparouhov and Muthén (2014) suggested that approximate measurement invariance was sufficient. They developed an automated alignment method to test for approximate measurement invariance, a technique currently available only in their proprietary Mplus software (Muthén and Muthén 2017). Starting with a factor model in which factor loadings and intercepts/thresholds are estimated freely across groups (the configural model), the alignment technique adds invariance restrictions as long as they do not result in a loss of model fit relative to the configural model. Each factor loading and intercept or threshold is allowed some “wiggle room,” defined as the parameter for a group not being statistically significantly different from the parameter's mean across all groups.
For each measurement parameter, the algorithm identifies the largest possible set of invariant groups. To maintain the model fit from the configural model, some group-specific parameters in the invariance model may exceed their assigned wiggle room. Having such non-invariant parameters in the model implies partial approximate measurement invariance. Asparouhov and Muthén (2014) initially proposed that up to 20% non-invariance across groups would usually permit valid group comparisons; later, they suggested that even higher percentages of non-invariance would allow for group comparisons (Asparouhov and Muthén 2023).
The concept of approximate measurement invariance has made measurement invariance testing more useful in analyses of real data, though it is sometimes overlooked by critics of measurement invariance testing (see Welzel et al. 2023a). However, problems remain, and critics continue to object to several claims in the literature on measurement invariance.
Criticism of a Paradigm of Measurement Invariance
Methodological Dogmatism?
The necessity of establishing measurement invariance across groups is controversial. Critics object that “measurement invariance testing should not replace the difficult non-statistical task of demonstrating measurement equivalence” (Robitzsch and Lüdtke 2023: 860) and that theorists of measurement invariance have developed their approach into “methodological dogmatism” (Welzel et al. 2023a: 1377).
For critics, the demand for measurement invariance across groups seems to have evolved into what Thomas Kuhn (1970) referred to as a paradigm, initially advancing research but now, according to several critics, hindering valuable work. Funder and Gardiner state that “the prohibitionist tone of discussions surrounding MI [measurement invariance] is unhelpful, unscientific, and discouraging” (Funder and Gardiner 2024: 889). They fear a bias against representative data: “researchers who go to the considerable trouble of gathering data in more than one country should not be disadvantaged compared to researchers who avoid cross-cultural complications by gathering data only at their home campus” (Funder and Gardiner 2024: 889).
Reflective versus Formative Measurements
Criticizing the measurement invariance paradigm, Welzel et al. (2023a) and Welzel, Kruse, and Brunkert (2023b) highlight the distinction between formative and reflective measurement models (see also Coltman et al. 2008). They argue that the reflective measurement model employed in CFA is less useful than the formative measurement model used with composite scores.
Formative and reflective measurement models for social and political trust are depicted in Figure 1. Reflective measurement models view each indicator as reflecting a latent, unobserved construct plus measurement error. Although theoretically appealing, this measurement model is not necessarily the ideal approach: it requires that the indicators are correlated (Kline 2016), which may not always be a suitable model. For example, a survey-based measurement of alcohol consumption can summarize alcohol units without requiring reported consumption of different alcoholic beverages to be correlated. Even the measurement of political trust, as analyzed in this paper, does not necessarily require a latent variable approach. Specifically, could trust in the parliament and the legal system be uncorrelated yet still serve as indicators of overall political trust? The latter view is captured by a formative measurement model using a composite score of items.
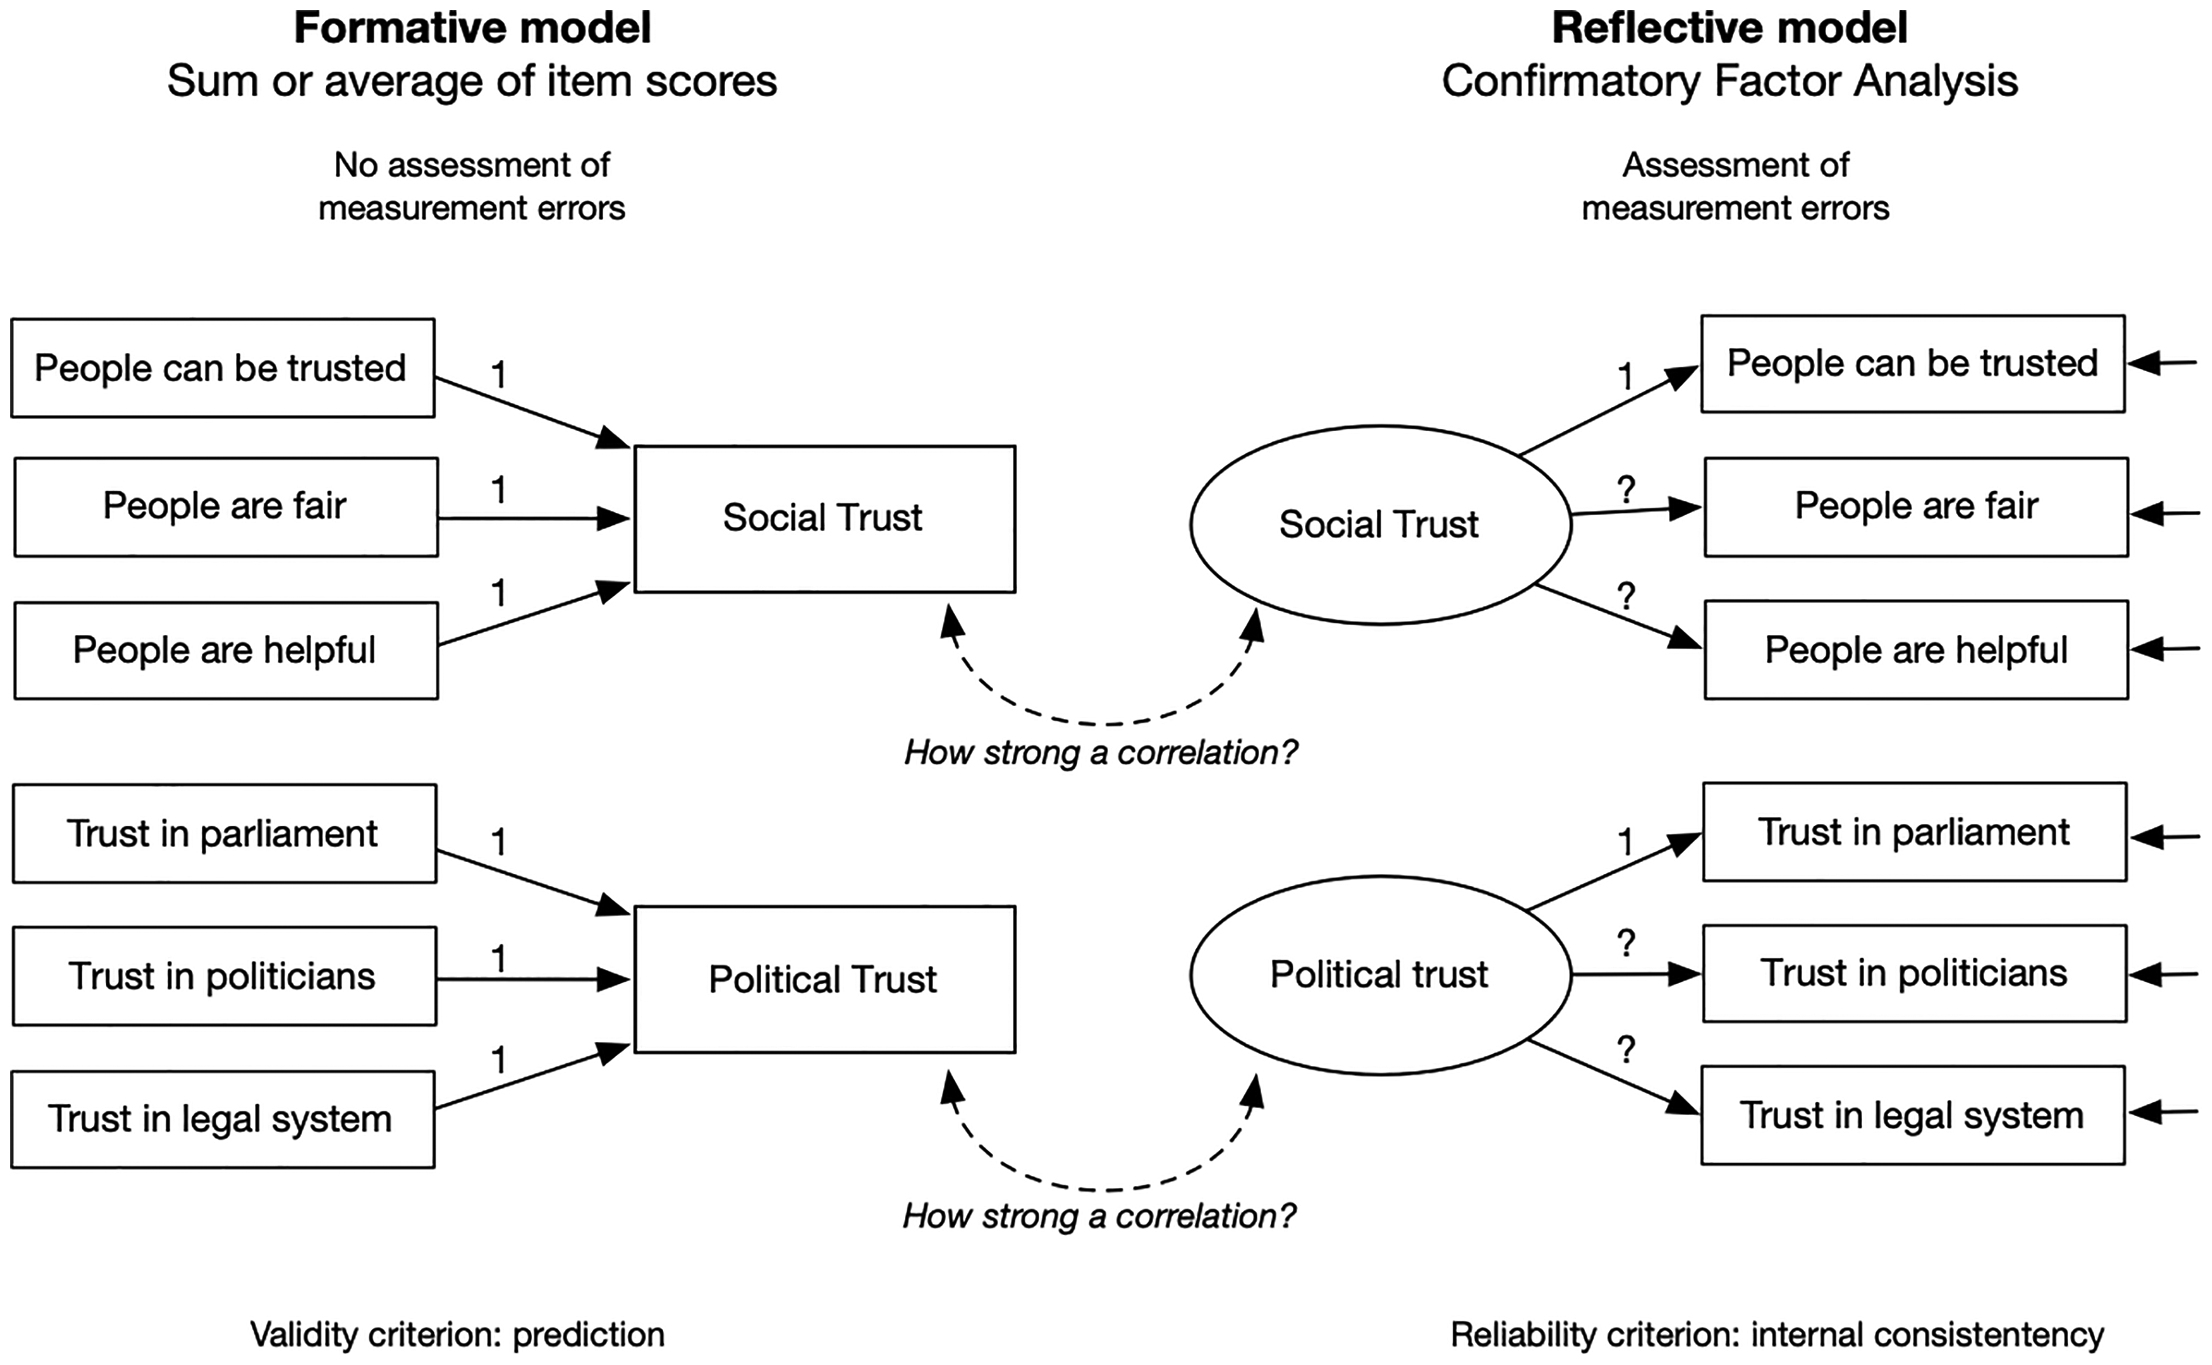
Formative versus reflective measurement models.
Instead of internal consistencies between items in a multi-item measurement, critics of measurement invariance testing emphasize the ability of the sum score to predict other variables and to fit into a theoretically conceptualized network of variables (nomological validity, see Revelle 2024; Robitzsch and Lüdtke 2023; Welzel et al. 2023a). Revelle (2024) argues that prediction trumps internal consistencies between indicators of a variable. This objection is reminiscent of Box's famous saying on scientific models: they are all wrong, but some of them are useful (Box and Draper 1987). If a measurement model predicts variables as expected, why not use it?
Proponents of latent variable modeling, however, emphasize that mere prediction is insufficient. From the perspective of CFA, composite scores or similar aggregated scores impose unrealistically strong assumptions of error-free individual items and complete measurement invariance across groups (McNeish and Wolf 2020; Meuleman et al. 2023). Such a model, they argue, would need to be tested with CFA and is highly likely to fail.
Aggregation Mitigates Measurement Error
Another objection raised by Welzel et al. (2023a) and Welzel, Kruse, and Brunkert (2023b) is particularly relevant to the present investigation: measurement invariance tests are conducted on individual data, but country comparisons typically use aggregated country scores. Welzel et al. suggest that for such country-level scores, the issue of measurement invariance is less relevant because individual and aggregated data have different measurement properties. Specifically, they contend that since most measurement error is random, aggregation will mitigate the problem of measurement error, an argument resting on the law of large numbers, originally proposed by Jacob Bernoulli in 1713: as the sample size increases, the sample mean tends to converge to the true population mean. According to Welzel et al. (2023a) and Welzel, Kruse, and Brunkert (2023b), aggregation will even resolve measurement non-invariance at the individual level.
Responses to Criticism
Welzel et al. (2023a) and Welzel, Kruse, and Brunkert (2023b) criticism of measurement invariance testing in Sociological Methods & Research is followed by responses from Fischer et al. (2023) and Meuleman et al. (2023), with a rejoinder from Welzel and colleagues (Welzel, Kruse and L. Brunkert 2023). Fischer et al. and Meuleman et al. underscore the importance of analyses with CFA and use empirical examples to show that relying on theory alone—via nomological networks—can produce biased measurements, and they argue that measurement invariance testing can help avoid such issues.
Whereas Meuleman et al. (2023) provide an assertive defense of measurement invariance testing with CFA, Fischer et al. (2023) take a somewhat more conciliatory tone, describing CFA as a crucial, but not the only tool for evaluating cross-cultural measurements. Meuleman et al. (2023) explicitly reject the use of aggregated composite scores, citing McNeish and Wolf (2020) who found bias in composite scores in individual data when contrasted with individuals’ factor scores. However, Meuleman et al. do not engage with Welzel et al.'s distinction between individual and aggregated composite scores, with Welzel et al. arguing that aggregated scores resolve the bias present in individual data.
Balancing Rigor and Pragmatic Use of Statistics
Toward a Nuanced Approach
In their detailed exposition of measurement invariance, Leitgöb et al. (2023) praise the discussion initiated by Welzel et al. (2023a) and Welzel, Kruse, and Brunkert (2023b) in Sociological Methods & Research “as a constructive process of joining forces to further develop and more precisely specify the concepts of (non)comparability, (non)invariance, and item bias” (Leitgöb et al. 2023: 22). However, beyond this acknowledgement, there is little evidence that Welzel et al.'s criticism has influenced their work. Instead, Leitgöb et al. reiterate earlier claims regarding measurement invariance, perhaps even intensifying them by asserting that measurement invariance “simply guarantees that the measures at hand can be compared” (2023: 4). It is well known that CFA, despite its name, cannot confirm a model; it can only fail to disconfirm it (e.g., Kline 2016). However, once CFA is applied to invariance testing, many methodologists discount such reservations and maintain that support for a multigroup CFA establishes the validity of the model. This assertion persists even after critics have objected.
Critics deserve to be heard, even if Welzel et al. (2023a) and Welzel, Kruse, and Brunkert (2023b) may underestimate the merits of CFA and measurement invariance testing. A nuanced approach from both sides can advance applied statistics (Fischer et al. 2023). For example, while Robitzsch and Lüdtke (2023) offer strong criticism of the measurement invariance paradigm, they also acknowledge that measurement invariance testing is helpful for understanding data quality. Furthermore, through the R package “sirt” (Robitzsch 2024), they actively assist researchers in employing measurement invariance testing.
Balancing Rigor and Practicality
Different languages, cultural variations, and historical events all contribute to measurement non-invariance (e.g., Davidov et al. 2018; Marsh et al. 2018; Welzel et al. 2023a). Yet measurement non-invariance is likely random in the sense that it is not fixed across different samples from given populations. In general, measurements in the social sciences may provide different results across samples (e.g., Hunter and Schmidt 2004). Consequently, data from a single measurement occasion would not be a solid basis for strong conclusions on measurement non-invariance across groups. Since a model developed to achieve measurement invariance with the current data is tailored to specific samples, the model may be overfitted (Widaman and Revelle 2023), potentially providing less valid descriptions of new data from the same populations. A much simpler measurement model might be more robust for use across different data sets (Funder and Gardiner 2024; Revelle 2024).
Dawes (1979) described the “robust beauty” of improper linear models. Simple, linear models with equal weights assigned to predictors or indicators can be surprisingly robust. They are also not sample-specific. Composite scores, computed as the average of a set of indicators, are an example of simple linear models.
Factor scores possess neither the intuitiveness nor the flexibility of composite scores. They do not reflect the original scale of their indicators, and they are sample-specific, representing an individual's position on an estimated latent factor relative to other observations in the specific data set (see McNeish and Wolf 2020). Once computed, these factor scores are tied to the data from which they were estimated and cannot meaningfully be compared with factor scores computed independently from another dataset. In contrast, composite scores can be constructed using the same observed-variable weights across datasets, allowing direct comparison without access to all original data sets.
Research often needs to balance rigor with practical needs. Even proponents of measurement invariance demonstrate this. In Round 4, the ESS included three items on experienced age discrimination, each using a five-point scale. The items were heavily skewed; most respondents did not report age discrimination. Two studies have tested these three items for approximate measurement invariance across countries (Bratt et al. 2018; Seddig, Maskileyson, and Davidov 2020) and across age (Bratt et al. 2018). Both studies defined the three items as ordinal, consistent with recommendations in the statistical literature. However, Seddig, Maskileyson, and Davidov (2020) added a simulation analysis in which they defined the heavily skewed five-point items as continuous. This choice violated acknowledged statistical guidelines (Dolan 1994; Rhemtulla et al. 2012) but facilitated the simulation process in their measurement invariance testing: estimating one intercept across groups rather than several thresholds made the Monte Carlo simulation easier to complete. From their simulation, Seddig et al. concluded that the ESS ageism items were comparable across all countries: “all correlations between the generated and the estimated factor means were large enough and exceeded 0.98, implying that the factor means, based on the alignment procedure, were trustworthy after all” (Seddig, Maskileyson, and Davidov 2020: 358).
We also plan to examine correlation coefficients to compare alternative scales. In Figure 1, we depicted two different approaches to measurement: formative and reflective. As indicated there, we will test correlations between aggregated composite scores and factor scores derived from CFA with alignment. However, we suggest that testing overall associations between two scales via their correlation coefficient can be insufficient. A correlation of .98 or beyond does not prevent substantial discrepancies between scores for one or two countries, if the remaining countries line up with near perfect correlation. We therefore also plan to use scatterplots to compare country scores from the two scales.
Given the statistical advantages of CFA—specifically when combined with tests of measurement invariance—we will use country-level factor scores from the alignment technique as the benchmark for composite scores aggregated to the country level. Lacko et al. (2022) used a similar approach, but since they worked with a limited data set, their example seems tailored toward showing that composite scores can yield biased estimates when contrasted with factor scores. The approach in this paper is different. First, we see composite scores as potentially superior from a practical viewpoint: because they are intuitive, they help disseminate research findings and they allow for easy comparisons of different data sets and across several dimensions at once. Second, we use a much larger data set, with many more groups to compare and several measurement occasions, allowing for a more extensive comparison of factor scores and composite scores.
The approach we adopt here has been criticized by Funder and Gardiner (2024) and Widaman and Revelle (2023). They object that using factor scores as a benchmark merely assumes rather than justifies a statistical superiority of factor scores. We employ factor scores from CFA with alignment as a benchmark because they account for measurement errors in individual items and measurement non-invariance across countries. However, our focus is on whether the two scales converge. Presumably, there can be wide consensus on the applicability of composite scores if they provide results overlapping with those from advanced factor analysis using alignment. Should we find such support for aggregated composite scores, we will apply them to develop intuitive graphs that simultaneously depict country differences and developments over time.
Do Composite Scores Reflect Uncertainty?
Welzel et al. (2023a) and Welzel, Kruse, and Brunkert (2023b) argue that aggregated composite scores resolve measurement errors and suffice for country comparisons. However, if measurement error within individual data is systematic, then aggregating data will only amplify these measurement errors. The utility of composite scores may need validation on a case-by-case basis. Another concern we wish to highlight is that composite scores might underestimate uncertainties, even if their point estimates correlate strongly with factor scores from alignment.
Individual composite scores assume no measurement error and typically give equal weight to each indicator. They also assume full measurement invariance across countries. Both assumptions are unrealistic, yet the law of large numbers suggests that, with large sample sizes, aggregated composite scores could indeed suffice to describe country trends. Nevertheless, estimates based on composite scores can still fail to reflect the uncertainty associated with point estimates. Aggregated composite scores are computed as a simple average, ignoring variations in individual-level data that factor scores and their standard errors would incorporate.
Measurement Invariance versus Measurement Equivalence
We will draw on all available data from the ESS on social and political trust to test how composite scores relate to factor scores derived from alignment with approximate measurement invariance testing. Data from the ESS may also help empirically demonstrate the difference between measurement invariance and measurement equivalence. Scholars have argued theoretically for this distinction (e.g., Robitzsch and Lüdtke 2023; Welzel et al. 2023a), we seek an empirical demonstration. A single empirical example could suffice to “falsify” (Popper 1959) the repeated claim that measurement invariance alone establishes measurement equivalence. We suggest using a known case of incomparability across countries to see whether measurement invariance testing detects the lack of measurement equivalence.
During the COVID-19 pandemic, some countries participating in Round 10 of the ESS shifted to self-completed questionnaires, departing from the face-to-face interviews employed in earlier ESS rounds. Other countries continued using interviewers in Round 10. Countries that allowed respondents to self-complete questionnaires probably report a drop in trust levels in Round 10 compared to earlier and subsequent rounds, since removing the interviewer may reduce socially desirable responding (He et al. 2015; Krumpal 2013; Roberts et al. 2019). Thus, measures in countries with self-completed questionnaires versus those using interviewers would yield non-equivalent measures in Round 10. We investigate whether a test of measurement invariance can detect this incomparability of measures across countries in Round 10.
Methods
Data
Analyses drew on all available data from the ESS, covering Rounds 1 to 11 (spanning from 2002 to 2024) and a total of 546,954 respondents across 39 countries. Table S1 in the online supplemental material provides an overview of sample sizes in each country for the various ESS rounds. The data were downloaded (April 2025) from the freely accessible ESS server at https://www.europeansocialsurvey.org/data-portal; the subset of ESS data used and analysis code is available at the Zenodo repository (Bratt 2025).
The ESS uses strict probability sampling to ensure that, at each measurement occasion, each country's sample is representative of the population aged 15 and above. Except for Round 10, the ESS data were collected using computer-aided personal interviews. In Round 10, during the COVID-19 pandemic, nine of 31 countries opted to let respondents self-complete an online questionnaire. In Round 11, all countries continued interviewer-based data collection.
Measurements
Social trust was measured with three items in the ESS: the core item “Most people can be trusted, or you can’t be too careful,” plus “Most people try to take advantage of you, or try to be fair” and “Most of the time people are helpful or mostly looking out for themselves.” Political trust was assessed in a similar way with three items: trust in the country's parliament; trust in politicians; and trust in the legal system. All trust items employed an 11-point scale (0 to 10).
Analyses
For each country, we calculated composite reliability (ideally > .70) and the average variance extracted (AVE, ideally > .50) for both social and political trust. Measurement invariance tests included configural, metric, scalar, and approximate invariance. To make the configural model testable, we combined social and political trust in a single model, thereby ensuring that the configural model had degrees of freedom. We first evaluated fit of this CFA model, both with global fit indices and by inspecting local fit, examining modification indices (Sörbom 1989) and residuals (Maydeu-Olivares 2017). We then tested for measurement invariance across countries within each ESS round, analyzing all countries that participated in that round. We also tested for measurement invariance over time within each country that had participated in at least four ESS rounds (31 countries).
Tests of approximate invariance used a fixed alignment (fixing the mean in one country or at one time point to zero), allowing Mplus to identify which country or ESS round to use for centering factor scores. Details on the alignment method for approximate measurement invariance are available in the online supplemental material to this article. Asparouhov and Muthén (2014, 2023) provide more extensive explanations.
We used the factor scores with alignment and approximate measurement invariance as a benchmark to evaluate alternative scales of country scores. We were particularly interested in aggregated composite scores; other alternatives included aggregated single-item scores and simple factor scores that assumed full scalar invariance. In addition to comparing point estimates from alignment-based factor scores and aggregated composite scores, we compared their confidence intervals.
Consistent with common recommendations for large-scale cross-national data, we tested measurement invariance separately across countries and across time. We did not employ sampling weights because these were unavailable for parts of the data. However, we conducted a sensitivity test limited to countries for which sampling weights were available. Comparing estimations with and without sampling weights produced negligible differences: Factor scores calculated with and without sampling weights correlated at r = 0.996 (social trust) and r = 0.997 (political trust). Analyses relied on full information estimations, incorporating respondents with partly missing data. The ESS had very little missing data (less than 3% missing responses within countries, often under 1%); see Table S2 in the online supplemental material for details.
Statistical analyses were conducted with R (Version 4.5.0, R Core Team 2025) and Mplus 8.11 (Muthén and Muthén 2017). Key R packages included lavaan 0.6.20 (Rosseel 2012), ggplot2 Version 3.5.1 (Wickham et al. 2025), and MplusAutomation Version 1.2 (Hallquist and Wiley 2018). The online supplemental material was created with RStudio, Quarto, and knitr Version 1.50 (Xie 2024). All code for data management and analyses is available in the online supplemental material.
Results
Tests of Measurement Invariance
The Configural Model and Reliability Estimates
The two-factor model with social and political trust (the configural model) had good overall fit when tested on the 11 ESS rounds individually. Specifically, CFI values were .99 or higher, and RMSEA values ranged between .040 and .055. Estimates of reliability were also strong: composite reliabilities for each three-item measure were consistently above .76 (social trust) and above .80 (political trust); the AVE for the two constructs was well above .50. Further details are provided in Table S3 in the online supplemental material. Inspection of local fit with modification indices (Sörbom 1989) and residuals between model-implied and data-based matrices (Maydeu-Olivares 2017) suggested that no modification of the factor model was necessary (details are available in Section 3.2 in the online supplemental material).
Fit for the two-factor CFA model was also good within single countries (Tables S4 and S5 in the online supplemental material), although reliability estimates varied across countries. Notably, France had lower reliability estimates for social trust, with composite reliability below .60 and AVE around .35 (see Tables S6 and S7 in the online supplemental material for details on reliability estimates).
Metric or Scalar Invariance Across Countries
Tests of measurement invariance beyond simple configural invariance showed that the nested Chi-square test rejected both metric (invariant factor loadings) and scalar invariance (adding invariant thresholds). However, using Chen's (2007) cutoffs for changes in CFI and RMSEA indicated some support for metric invariance, but not for scalar invariance. Details on these tests of metric and scalar invariance across countries are available in the online supplemental material (Tables S10 to S12), including tests of either a two-factor model or one of the two factors (social or political trust).
Approximate Measurement Invariance Across Countries
Tests of approximate measurement invariance across countries at each specific ESS round showed that approximately 30% to 66% of parameters were non-invariant in the two-factor model (social and political trust estimated in a single model). By contrast, if these two factors were estimated in separate models, the proportion of non-invariant parameters remained consistently below 20% for social trust. Political trust had between 20% and 41% non-invariance across countries (see Table S13 in the online supplemental material for details).
We investigated the stability of estimated approximate measurement invariance across ESS rounds. We restricted this analysis to countries that participated in each ESS round (12 countries), estimating social and political trust in separate models, and then identifying which parameters the alignment identified as non-invariant. We anticipated that the results would differ somewhat between ESS rounds, which would highlight the sample-specific solutions of measurement invariance tests. Using this limited set of 12 countries, the analyses uncovered some consistency across ESS rounds (e.g., the alignment analysis repeatedly flagged a non-invariant factor loading for the social trust item “People are fair” in France, and for the political trust item “Trust in the legal system” in Finland). Nonetheless, there were substantial variations across ESS rounds regarding which parameters were non-invariant, even in an analysis limited to just 12 countries. Details are shown in Tables S14 and S15 in the online supplemental material.
Measurement Invariance Across Time
Tests of measurement invariance across time were run within single countries that participated in at least four ESS rounds, using the two-factor model of both social and political trust. The Chi-square test rejected both scalar and metric invariance. However, thresholds for changes in alternative fit indices (ΔCFI, ΔRMSEA, ΔSRMR) indicated metric invariance across time, and even scalar invariance in some countries (including Finland, Germany, Italy, Norway, Russia, Sweden, Switzerland, and Turkey). For details, see Table S16 in the supplemental material.
We also tested for approximate measurement invariance across time. These analyses showed a substantial degree of measurement invariance across time within single countries, even when using the two-factor model for social and political trust (only two of the 31 countries analyzed had more than 20% non-invariant parameters). When social and political trust were estimated in separate factor models, both forms of trust had consistently small percentages of non-invariant parameters across measurement occasions. Details are available in Table S17 in the online supplemental material.
Comparisons of Composite Scores and Alignment-Based Factor Scores
The above alignment tests had identified (1) approximate measurement invariance across time within single countries for both social and political trust, (2) approximate measurement invariance across countries for social trust, and (3) a moderate degree of approximate measurement invariance for political trust. We extracted the alignment-based factor scores for countries’ social and political trust (based on the two-factor model that estimated social and political trust jointly). These alignment-based factor scores not only considered measurement error in single items (as ordinary factor analysis does) but also adjusted for non-invariance in single parameters (as identified by the alignment analysis).
We used the alignment-based country scores from a single ESS round and compared them with alternative scales: (1) simple country means of a core item for social and political trust, respectively; (2) country-aggregated composite scores; and (3) simple factor scores assuming scalar invariance. The results are shown in Table 1 (social trust) and Table 2 (political trust).
Social Trust: Correlations Between Different Measurement Scales and Percentages CI Overlap.
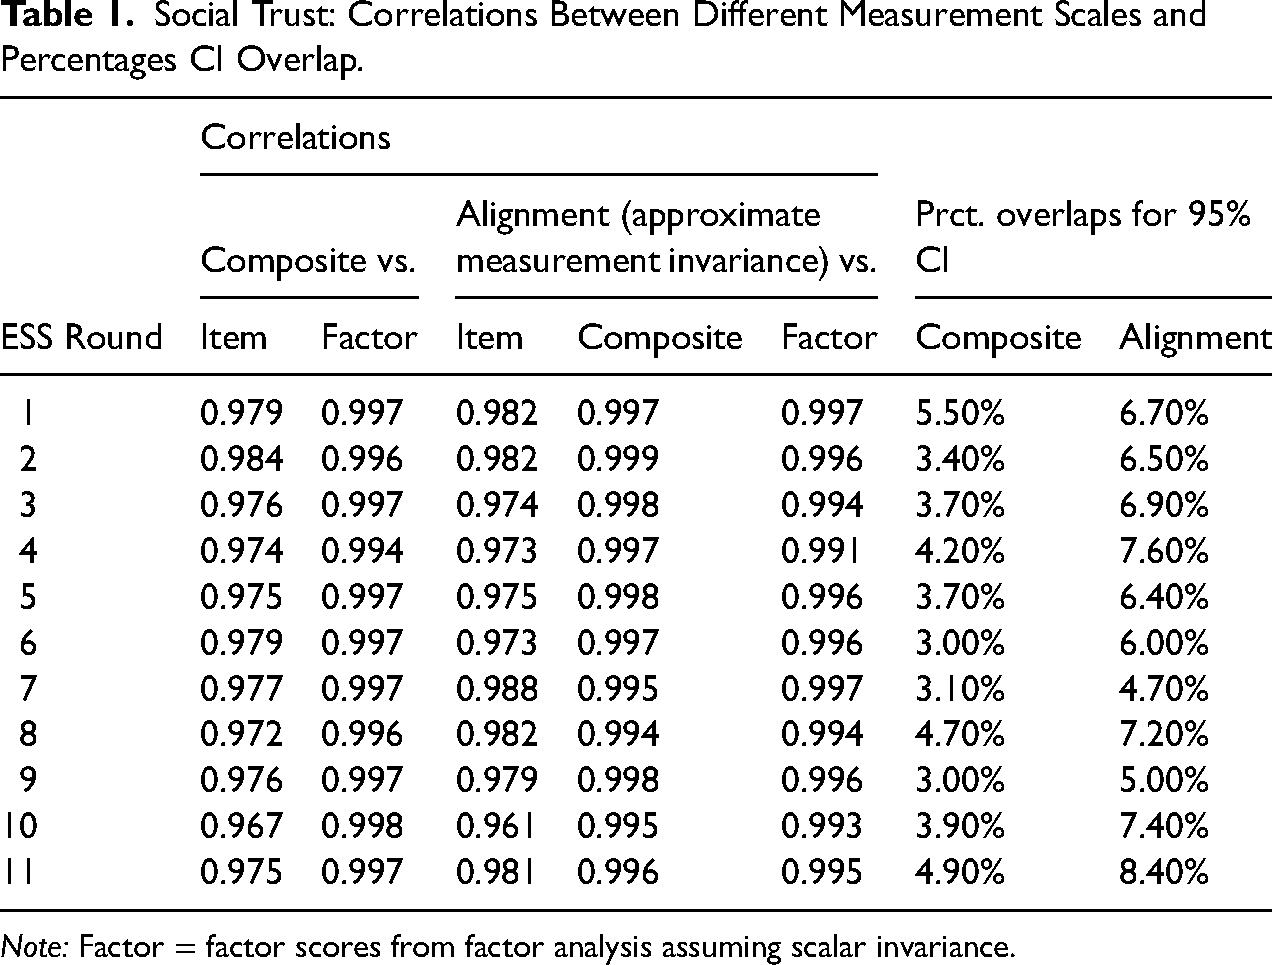
Note: Factor = factor scores from factor analysis assuming scalar invariance.
Political Trust: Correlations Between Different Measurement Scales and CI Overlap.
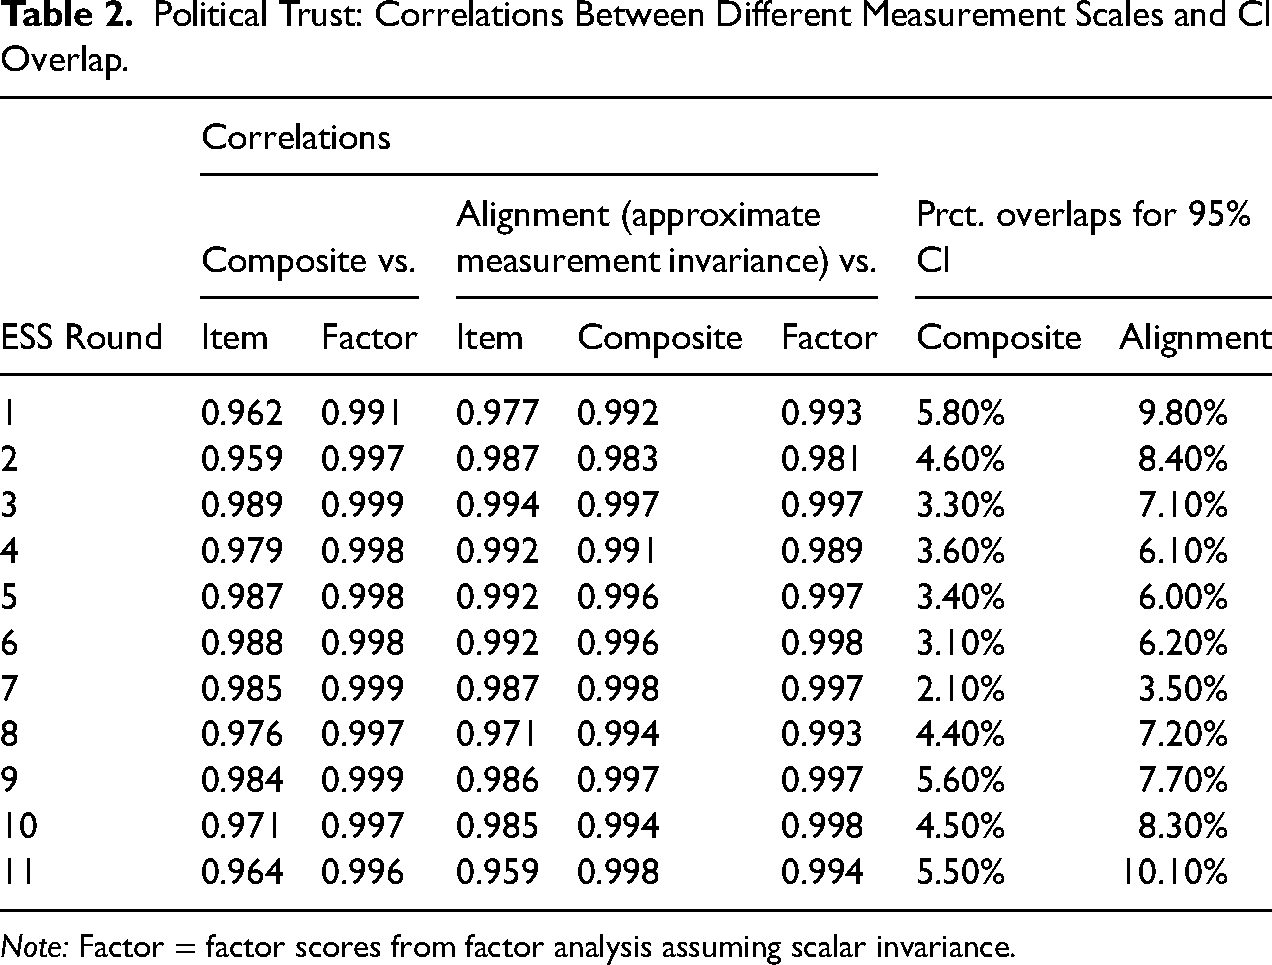
Note: Factor = factor scores from factor analysis assuming scalar invariance.
Even a single core item (“Most people can be trusted” for social trust and “Trust in politicians” for political trust) correlated at .96 or higher with the alignment-based factor scores across countries. Factor scores assuming full scalar invariance correlated above .98 with their counterparts from the alignment analysis. The scores of most interest to us, aggregated composite scores, correlated with alignment-based factor scores at .994 to .999 (social trust) and at .983 to .998 (political trust). These correlations indicate that for descriptive country comparisons, alignment-based factor scores could be substituted with the more intuitive and flexible composite scores. The close association between aggregated composite scores and alignment-based factor scores is also evident in scatterplots in Figures S1 and S2 in the online supplemental material.
In addition to correlations, Tables 1 and 2 show the percentage overlap between confidence intervals for different countries. Overlaps between different countries’ confidence intervals were consistently larger with alignment-based factor scores than with aggregated composite scores. Thus, composite scores underestimated the uncertainty associated with point estimates if we used alignment-based factor scores as the benchmark. Bootstrapping confidence intervals for composite scores (with 1000 samples) did not resolve this downward bias in confidence intervals for composite scores; the two versions of 95% confidence intervals for composite scores yielded results that were practically indistinguishable, with r > 0.99999.
We also compared aggregated composite scores with alignment-based factor scores across specific ESS rounds in a single country. The aggregated composite scores were the same as before, but we now used the estimated factor scores from tests of approximate measurement invariance across time within a single country. Again, we found high overlap between point estimates from composite scores and alignment-based factor analysis (see Figures S3 and S4 in the online supplemental material). Correlations for social trust were well above .98 (with one exception, Portugal, r = .97); correlations for political trust were also well above .98 in most cases, however, with three exceptions: Spain (r = .978), the UK (r = .904), and Belgium (r = .786). The result for Belgium highlighted that even with well-designed measurements, group-aggregated composite scores and alignment-based factor scores may diverge substantially.
Over-Time Developments Illustrated With Composite Scores
With the exception of repeated measurements in Belgium, we observed that point estimates for aggregated composite scores and alignment-based factor scores were difficult to distinguish, suggesting that the intuitive and flexible composite scores may be helpful in descriptive analyses of country differences and changes over time. Figure 2 depicts composite scores across ESS rounds for countries that participated (1) in the first ESS round, (2) in one of the latest ESS rounds, and (3) in a minimum of four ESS rounds overall (22 countries in total).
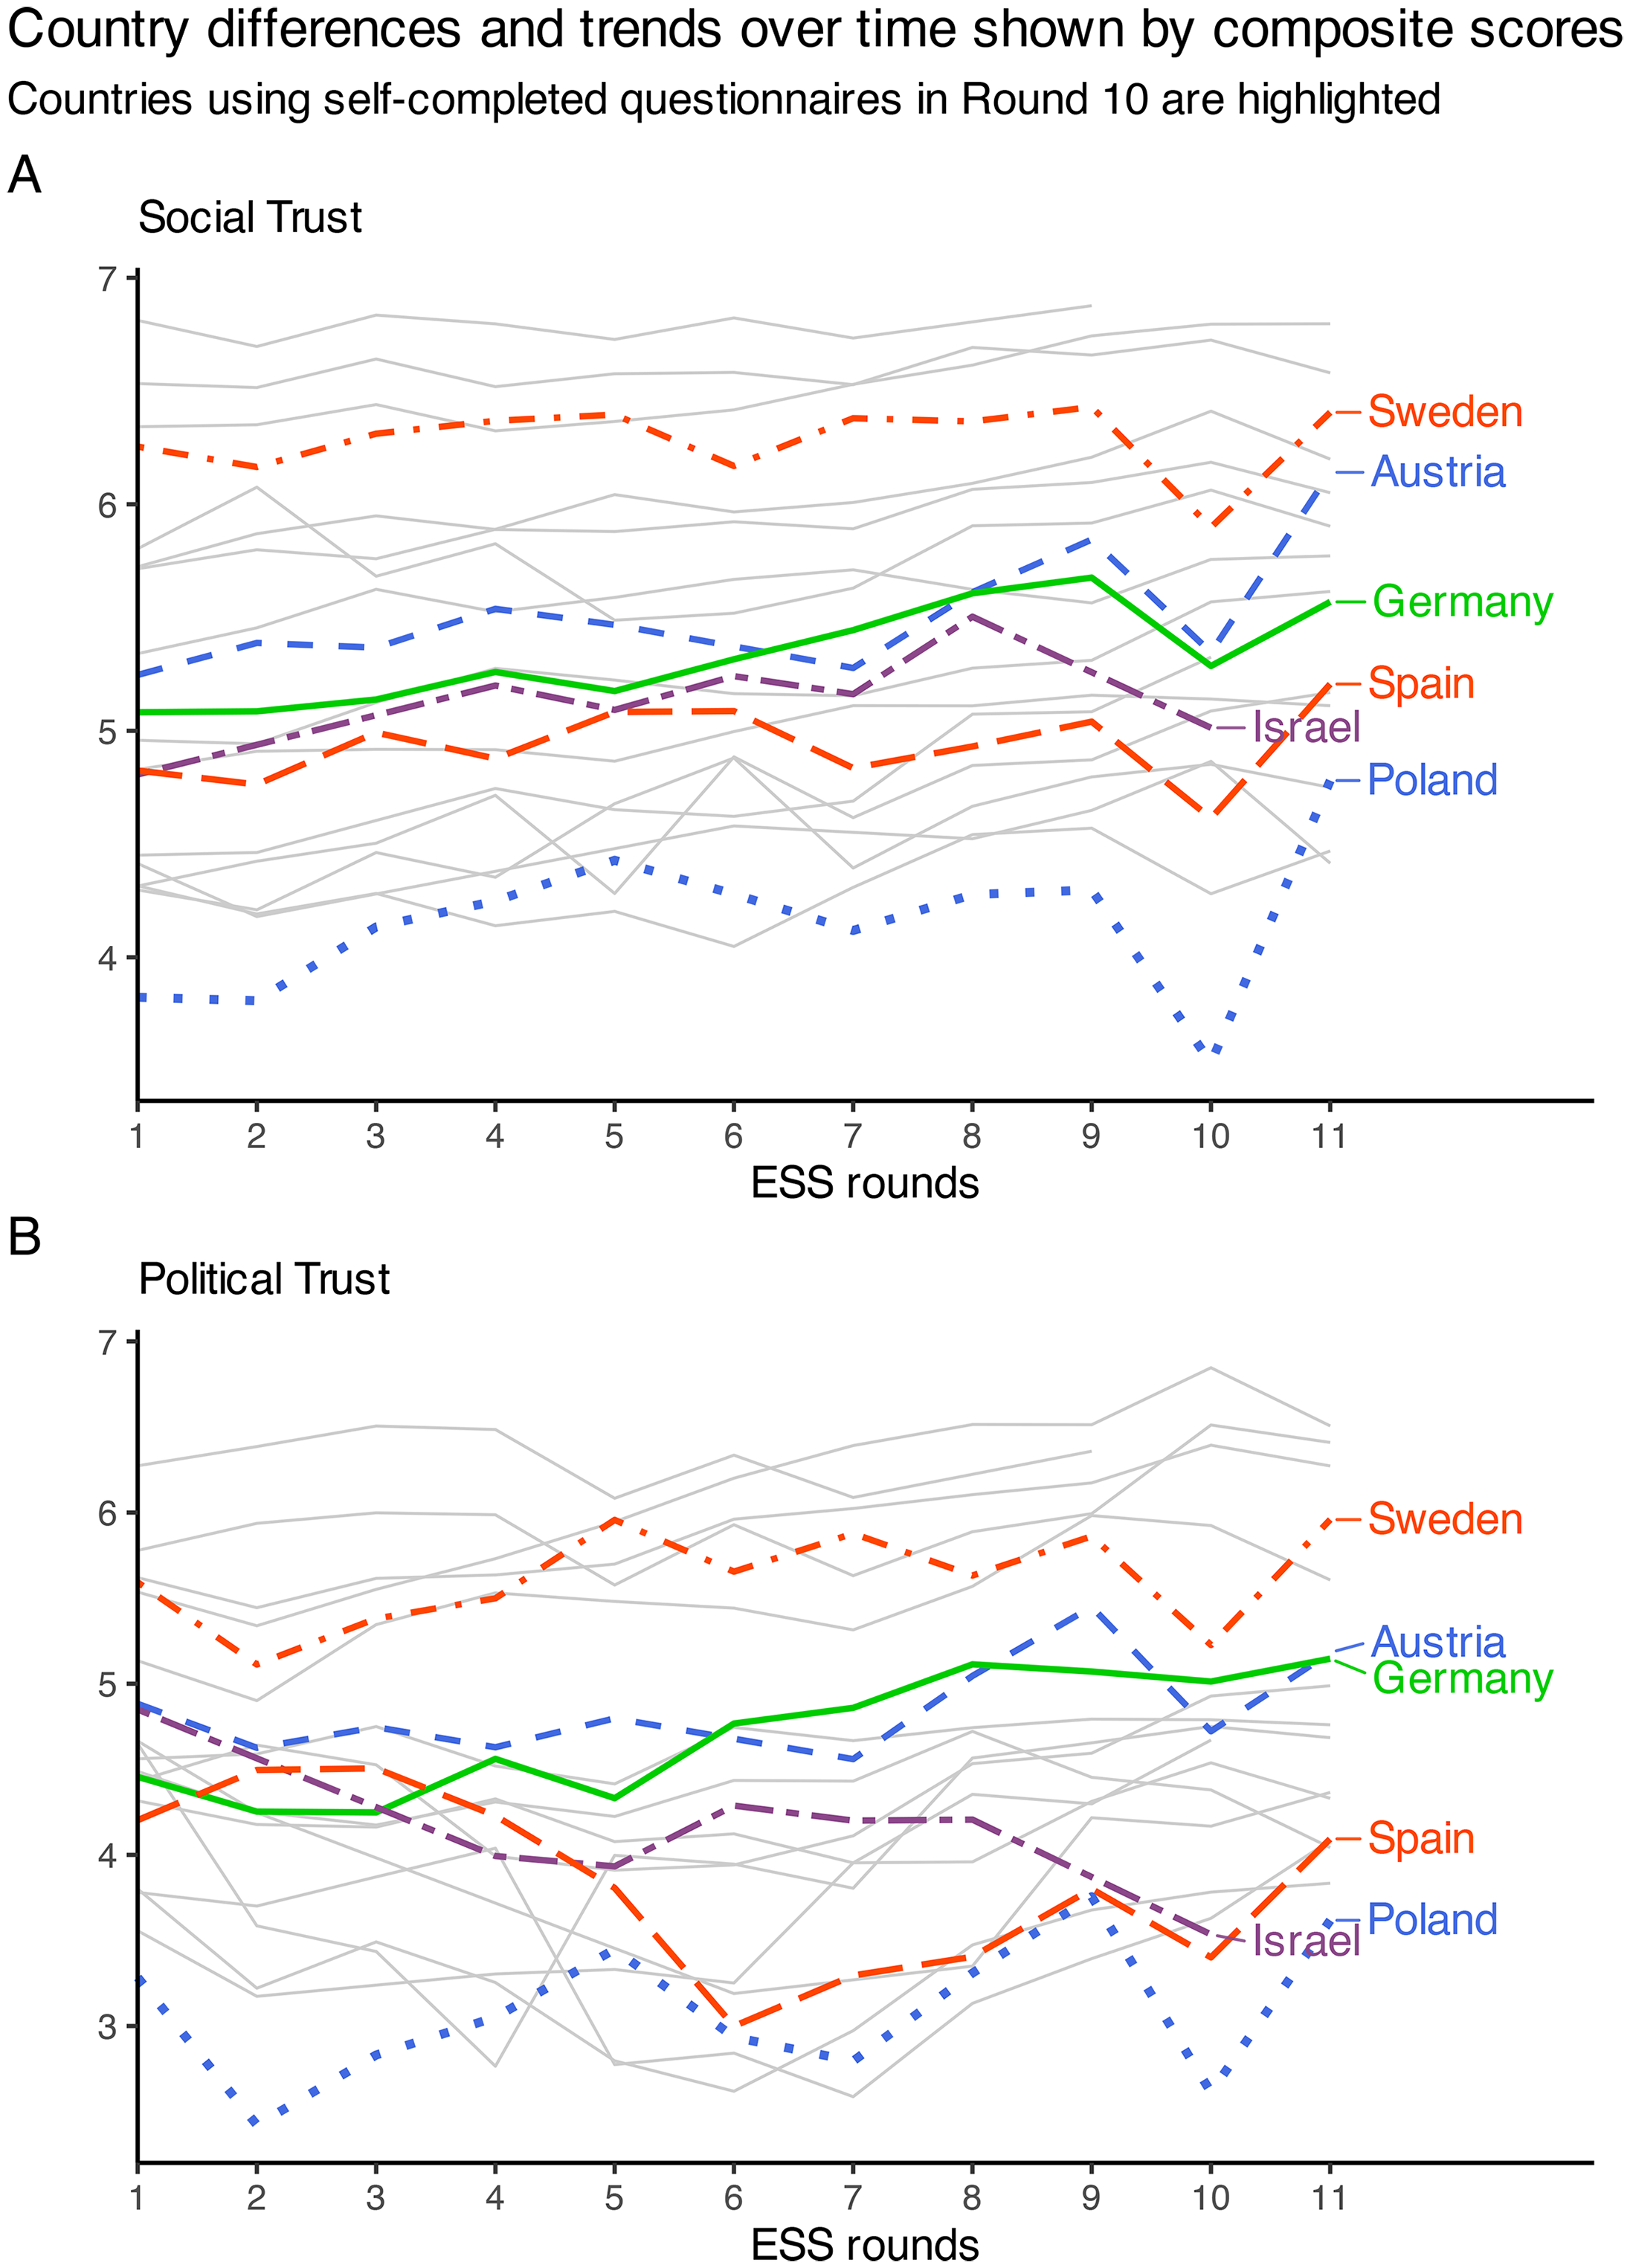
Country differences and trends over time shown by composite scores. Countries using self-completed questionnaires in Round 10 are highlighted.
The two plots in Figure 2 do not suggest any overall decline in social or political trust up to ESS round 11. Another striking finding in Figure 2 is that countries that used self-completed questionnaires in ESS Round 10 (see highlighted countries in Figure 2) had much lower expressed trust at this round than in previous or subsequent rounds. This result corroborated the expected lack of measurement equivalence across countries in Round 10. For further details, see Figure S6 and Tables S20 and S21 in the online supplemental material.
Measurement Invariance Testing Failed to Detect the Validity Threat
We tested whether the alignment analysis with partial approximate measurement invariance could detect the validity problem for a cross-country comparison in Round 10. The findings, shown in Table 3, indicated that measurement invariance testing failed to identify non-equivalence of measurements. The alignment analysis even suggested a higher degree of measurement invariance in Round 10 than in both the preceding and subsequent ESS round.
Percentages Non-Invariant Parameters in Approximate Measurement Invariance Testing Across Countries in Rounds 9 to 11.
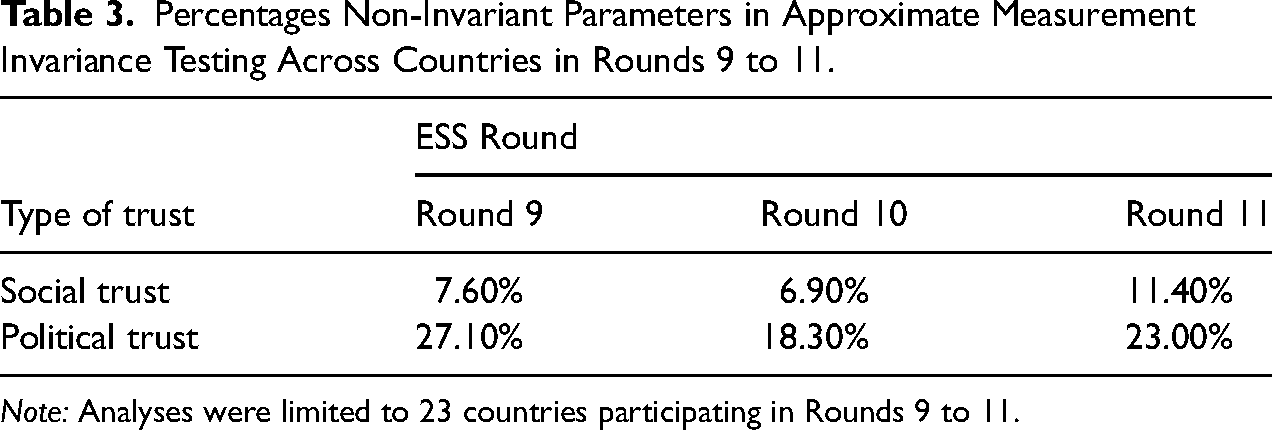
Note: Analyses were limited to 23 countries participating in Rounds 9 to 11.
Discussion
Tests with all available ESS data on trust demonstrated a high degree of approximate measurement invariance across countries and across time, for both social and political trust. The measurement of social trust appeared particularly robust in cross-country comparisons, also by consistently showing high reliability within single countries.
Using alignment with approximate measurement invariance, we estimated factor scores for each country at each of the 11 ESS rounds. These factor scores accounted for measurement errors as well as measurement non-invariance for single parameters. We then compared these factor scores with country-aggregated composite scores, which neither accounted for measurement errors in each single item nor some degree of measurement non-invariance across countries. Because aggregation mitigates measurement error, these country-level composite scores were well-suited to reflect country differences: composite scores and alignment-based factor scores correlated at .994 to .999 (social trust) and at .983 to .998 (political trust). Even country aggregates of single-item measurements performed well when evaluated by their correlations with alignment-based factor scores (correlating at .96 or higher).
Similarly, we estimated alignment-based factor scores with approximate measurement invariance for repeated measurements within single countries. Again, countries’ composite scores had very high correlations with alignment-based factor scores. For social trust, these correlations were well above .98 except for Portugal (r = .97). Results were slightly less consistent for political trust. The correlations between alignment-based factor scores across time and aggregated composite scores for political trust remained well above .98 in most cases. However, the correlation fell to .904 in the UK and in Belgium, aggregated composite scores across time clearly deviated from alignment-based factor scores (r = .786).
Consistent with our expectation, expressed trust dropped in Round 10 in countries where respondents were allowed to self-complete the questionnaire. Countries continuing to use an interviewer did not experience such a drop in reported trust. The measurement invariance test failed to detect this clear violation of measurement equivalence.
Measurement Invariance Does Not Equal Measurement Equivalence
One of the most prominent claims among several proponents of measurement invariance testing is that measurement invariance equals measurement equivalence. Various scholars have argued against this misunderstanding (He et al. 2017; Lacko et al. 2022; Meitinger 2017; Robitzsch and Lüdtke 2023; Welzel et al. 2023a). Along with arguments by these scholars, our empirical demonstration that testing for measurement invariance did not detect measurement non-equivalence should discourage future claims that measurement invariance guarantees measurement equivalence.
Embracing Pragmatism
This research aims to contribute to methodological pragmatism. Methodological rigor is important, and we do not advocate ignoring measurement invariance testing (consistent with Robitzsch and Lüdtke 2023; Widaman and Revelle 2023). However, methodological rigor is not the only consideration in research comparing groups or investigating changes over time. Even scholars who criticize cross-cultural research for insufficient rigor when ignoring measurement invariance demonstrate pragmatism by treating heavily skewed ordinal indicators as continuous in a simulation study.
Pragmatic use of composite scores may benefit research objectives, for instance by enabling scores to be compared across countries and time. Additionally, intuitive composite scores may better serve readers, aiding the dissemination of research findings. Research articles have become less accessible to the general public, creating a democratic problem for scientific research (Plavén-Sigray et al. 2017). A trend toward increasingly advanced analyses may accelerate this inaccessibility. When simpler, more intuitive descriptions suffice, they may be preferred or added to the more complex descriptions, for instance with advanced analyses documented in supplemental material.
Benefits of Including Advanced Factor Analysis
Although composite scores or similar accessible descriptions are useful in aggregated data, more advanced statistical methods may be necessary to corroborate the findings from simple analyses. Some scholars reject the idea that factor analysis and its reflective measurement model can serve as a benchmark for evaluating composite scores (e.g., Funder and Gardiner 2024; Widaman and Revelle 2023). However, if the aim is to develop robust and reliable research, even these scholars can probably agree that results are more trustworthy if different measurement methods yield similar results. Such verification by convergence of different methods is valuable for counteracting random findings achieved by methodological choices made in a “garden of forking paths” (Gelman and Loken 2014) with many “researchers’ degrees of freedom” (Simmons, Nelson and Simonsohn 2011). The current research demonstrated the need for such caution: over-time measures of political trust in Belgium indicated a clear discrepancy between composite scores and alignment-based factor scores.
While pragmatic considerations are important, we do not advocate using composite scores outside descriptive analyses of aggregated data (this differs from Widaman and Revelle 2023). Confidence intervals for composite scores were narrow (even if bootstrapped), underestimating uncertainty compared to confidence intervals for alignment-based factor scores. Moreover, we have focused on country scores. Following McNeish and Wolf (2020) we suggest reluctance to use composite scores in analyses of individual-level data (which other scholars seem to advocate, e.g., Widaman and Revelle 2023). Additionally, we note that the mere ability to predict a dependent variable in line with a nomological network theory does not reveal the nature of the predictor. CFA can be particularly valuable in this regard (Fischer et al. 2023; for an empirical demonstration with ESS data, see Bratt 2022).
We believe that testing for measurement invariance should be a crucial part of cross-cultural research. Aggregation to the country-level may largely mitigate measurement errors and even moderate measurement non-invariance, but whether it does, remains an empirical question—as demonstrated in the current research by the example of repeated measurements in Belgium. Cherry-picking one intuitive method (e.g., aggregated composite scores) without validation from alternative methodological approaches may result in misleading conclusions. This applies even more strongly to analyses of individual data, which lack the benefits of aggregated scores.
The Value of Data Without Measurement Invariance
How should researchers respond when measurement invariance clearly fails? To the dismay of Funder and Gardiner (2024), some researchers react by dismissing valuable data when faced with measurement non-invariance. Even the practice of omitting some groups (e.g., countries) to improve measurement invariance is problematic, as it may resemble tailoring the data to fit the theory. Such a research choice should at least build on solid theoretical justification.
We argue that data lacking measurement invariance across groups can be as valid as data satisfying measurement invariance. Non-invariance in measurements across countries often reflects cultural and contextual effects, which are crucial themes in social science. Rather than rejecting such data, researchers can: (1) use multilevel analyses and incorporate country-level predictors that reflect contextual effects (Davidov et al. 2018); or (2) exploit data with non-invariant measurements to test the robustness of theorized models across contexts, including context-dependent variations in measurements of social constructs (Bratt 2022). The second approach is especially valuable as it can address the replication crisis in the social sciences (e.g., Earp and Trafimow 2015). It can explicitly test whether hypothesized relations between constructs are replicable across contexts, including when measurement models vary.
Limitations
The current research has benefitted from extensive and validated measurements used by the ESS. However, the ESS data do have limitations. They do not include longitudinal measurements for the same individuals, so the current research could not test for measurement invariance across repeated measurement occasions at the individual level. Furthermore, its survey-based measurements are likely to include some measurement error due to socially desirable responding, specifically when using interviewers to collect data (He et al. 2015; Krumpal 2013; Roberts et al. 2019). The assumption that the use of interviewers affects answers was corroborated by findings in countries that dropped the interviewer in Round 10. It is not clear to what extent socially desirable responding affects the ability of the ESS to capture differences across countries and register changes.
Conclusion
Statistical rigor in the social sciences requires balancing methodological sophistication with pragmatism. The optimal analytical approach is not necessarily the most advanced, but the one yielding the most reliable and interpretable results given the data at hand. Our analyses show that for descriptive analyses of group differences and developments over time, composite scores can be particularly helpful.
Factor analysis helps understand data and may be required for individual-level analyses. However, CFA-derived factor scores are non-intuitive and are not easy to use to describe group differences and developments simultaneously. Composite scores, in contrast, are intuitive and enable easy multi-dimensional comparisons. Yet, composite scores assume error-free measurements, limiting their use primarily to descriptive analyses of aggregated data.
Much confusion stems from CFA terminology. Despite its name, CFA is not confirmatory but can only fail to disconfirm. This limitation is well-known but often forgotten in measurement invariance testing. We believe proponents of measurement invariance testing should be more receptive to criticism. Despite critics highlighting differences between measurement invariance and equivalence, scholars of measurement invariance have continued to assert that the two are identical. Our empirical demonstration helps settle this issue, and we hope that scholars of measurement invariance will avoid conflating measurement invariance with measurement equivalence.
Moreover, findings from partial approximate measurement invariance are somewhat random, dependent on the specific samples, even when these samples are nationally representative. This randomness, likely more prominent in smaller or less sophisticated surveys than the ESS, suggests careful interpretation of findings. Caution is also warranted because measurement invariance testing relies on statistical significance—this is true even for the alignment method in Mplus. This reliance on significance testing creates two problems. First, when the alignment method uses a significance test, it uses an arbitrary cutoff to categorize parameters into invariant and non-invariant. Researchers may incorrectly interpret this result as conclusive evidence of actual group differences. Such an interpretation seems common but is wrong because it mistakes the p-value in the significance test p(Data|Hypothesis) for the probability of the hypothesis given the data, p(Hypothesis|Data)—in this case, the probability of true group differences. Second, significance tests are sensitive to sample size, more readily declaring non-invariance across large groups. Consequently, requiring measurement invariance might incentivize researchers to reduce their sample sizes. Stringent requirements for measurement invariance in group comparisons could therefore have adverse effects on research.
Finally, considering data that clearly are non-equivalent across groups: measurement invariance will often fail in real-world applications, sometimes with substantial differences in measurement parameters. In the latter case, researchers might reasonably conclude that comparing group averages is no longer meaningful. Rather than discarding data that reveal large measurement differences across groups, researchers can utilize such data to test whether relations between constructs replicate across contexts despite nuances in the measurement model. The social sciences would not be served by findings that only hold under a very specific measurement model for a social construct.
Supplemental Material
sj-pdf-1-smr-10.1177_00491241251405869 - Supplemental material for Benefits of a Pragmatic Approach: Rethinking Measurement Invariance and Composite Scores in Cross-Cultural Research
Supplemental material, sj-pdf-1-smr-10.1177_00491241251405869 for Benefits of a Pragmatic Approach: Rethinking Measurement Invariance and Composite Scores in Cross-Cultural Research by Christopher Bratt in Sociological Methods & Research
Footnotes
Declaration of Conflicting Interests
The author declared no potential conflicts of interest with respect to the research, authorship, and/or publication of this article.
Ethical Considerations and Informed Consent
All data were collected by the European Social Survey, following strict ethical standards.
Funding
The author received no financial support for the research, authorship, and/or publication of this article.
Preregistration Statement
This research involved secondary analysis of data from the European Social Survey and was not preregistered.
Data,Code,and Materials Availability
Data and analysis code are available at the Zenodo repository: https://zenodo.org/records/17581601 (![]() ).
).
Author Biography
References
Supplementary Material
Please find the following supplemental material available below.
For Open Access articles published under a Creative Commons License, all supplemental material carries the same license as the article it is associated with.
For non-Open Access articles published, all supplemental material carries a non-exclusive license, and permission requests for re-use of supplemental material or any part of supplemental material shall be sent directly to the copyright owner as specified in the copyright notice associated with the article.