
Abstract
In the last 60 years, the proportion of white Americans expressing anti-black prejudice in face-to-face survey interviews has declined dramatically. To test whether social desirability pressures affect the expression of anti-black prejudice, we analyzed a within-subjects experiment in the 2008 American National Election Study in which white respondents first reported their endorsement of stereotypes of blacks confidentially via audio computer-assisted self-interviewing (ACASI) and weeks or months later orally during second interviews. Shifting to ACASI led to a small but significant increase in negative views of blacks. Unexpectedly, shifting to ACASI also led to a similarly large increase in negative views of whites. Furthermore, the ACASI reports had no more predictive validity than did the oral reports. This evidence suggests that social desirability pressures do not seriously compromise oral reports of racial stereotypes in face-to-face interviews.
The proportion of white Americans expressing prejudice against blacks in national surveys with the highest response rates has declined dramatically in recent decades (Kluegel and Smith 1986; Krysan 2011; Schuman et al. 1997). For example, the percentage of whites agreeing with the statement that African Americans “should have as good a chance as White people to get any job” rose from 45 in 1942 to 97 in 1972 (Schuman et al. 1997:104). Similarly, the percentage of survey respondents saying that they oppose residential segregation and favor principles of equal treatment has also increased sharply (Bobo 2001; Krysan 2011).
One way to interpret these declines is as evidence of rising racial liberalism. However, many scholars view the decline more pessimistically as greater reluctance in expressing racist attitudes in social settings because of growing norms against it (Devine 1989; Sears and Henry 2005). Perhaps anti-black racism is just as prevalent today as it was decades ago, but people are unwilling to admit it during a face-to-face conversation with a survey interviewer in their homes.
Concern about the distorting impact of social desirability pressures has led some scholars to use other methods to measure racism, especially implicit methods (e.g., Fazio and Olson 2003; Greenwald and Banaji 1995; Payne et al. 2005). And it has led other scholars to express doubts about the wisdom of asking explicit racism questions in major federally funded surveys of nationally representative samples using face-to-face interviews. For example, Corstange (2009) asked, “whether or not it is worth all the trouble to administer such surveys in the first place” (p. 46).
In this article, we explore whether such concern is merited. We test whether measuring racism in a way that minimizes social desirability pressures causes substantial shifts in the distributions of responses. Eliminating such pressures has been done in a variety of ways (Krumpal 2013) including the item count technique (Holbrook and Krosnick 2010; Kuklinski et al. 1997), the randomized response technique (Warner 1965), and the bogus pipeline technique (Jones and Sigall 1971; Sigall and Page 1971). In the research reported here, we employed another such technique: audio computer-assisted self-interviewing (ACASI). ACASI is conducted as follows: During a face-to-face interview, the interviewer hands over the laptop to the respondent. The respondent hears the questions being read aloud on headphones, sees the questions and answer choices on the laptop screen, and types answers confidentially on the keyboard without the interviewer seeing or hearing the questions or the answers.
ACASI has been shown to motivate people to provide embarrassing characterizations of themselves more often than they would do during an oral interview (e.g., Metzger et al. 2000; Newman et al. 2002; Turner et al. 1998). For example, more people admitted to using illegal drugs, engaging in risky sexual behavior, being HIV positive, and having a sexually transmitted disease when interviewed using ACASI than when interviewed orally (Beauclair et al. 2013; Des Jarlais et al. 1999; Gribble et al. 2000; Villarroel et al. 2008). To assess the extent to which social desirability pressures suppress whites’ explicit reports of anti-black prejudice, we examined a set of explicit measures of racial stereotypes that were administered via ACASI during an initial interview and orally during a face-to-face follow-up interview weeks or months later. These data were examined by Piston (2010) who concluded that more anti-black reports in the ACASI responses indicate higher data quality. We show that this conclusion may have been premature.
Social Desirability Bias
In social interactions, people strive to present themselves in a favorable light (Goffman 1959). As a result, people are thought to refrain from reporting potentially embarrassing opinions and behaviors, a tendency referred to as impression management social desirability bias (Paulhus 1984, 1986, 2002; Paulhus and Reid 1991). This bias is thought to emerge most powerfully when a person is asked to reveal something that is highly tinged with social desirability implications in situations where the revelation can be directly observed by people who cannot necessarily be trusted to refrain from passing judgment. Therefore, in a face-to-face conversation with a survey interviewer, respondents may be especially motivated to present themselves in favorable ways.
For decades, national surveys have asked respondents to describe the personality traits they believed were typical of African Americans (Mackie and Smith 1998). “Lazy,” “lack discipline,” and “aggressive or violent” are some of the more frequently endorsed negative stereotypes (Peffley, Hurwitz, and Sniderman 1997). These reports of stereotypes appear to have been politically consequential: They predicted support for segregationist policies such as miscegenation laws, opposition to general government assistance to blacks, and opposition to opportunity-enhancing programs such as enterprise zones (Carmines, Sniderman, and Easter 2011; Ditonto, Lau, and Sears 2013; Hurwitz and Peffley 1997; Sniderman and Piazza 1993). Furthermore, whites who endorsed negative stereotypes of blacks were substantially more likely to judge blacks more harshly with regard to welfare deservingness and crime policies than similarly described whites (Peffley et al. 1997).
Concern about social desirability pressures affecting responses to such questions has been equally long-standing (Paulhus 1984). Studies have explored how responses vary by factors thought to induce social desirability pressures (e.g., the race of the interviewer) and whether techniques devised to ameliorate social desirability alter people’s answers (Kuklinski et al. 1997; Warner 1965). For example, in one experimental study, some undergraduates were randomly assigned to answer questions orally, and other undergraduates answered the same questions under “bogus pipeline” conditions, meaning that the researcher pretended to measure their “true” attitudes via their physical behavior (Jones and Sigall 1971). White participants said that various derogatory attributes were truer of “Negroes” under the latter condition than under the former.
Studies of the impact of interviewers’ race on the expression of racial attitudes also suggest that social desirability bias in face-to-face interviews can distort what people report. In the 1971 Detroit area study, for example, white respondents were randomly assigned to be interviewed either by a black or a white interviewer. When asked whether “they would mind if a relative married a Negro,” 72 percent of whites said “no” when interviewed by a black interviewer, compared to 26 percent of people interviewed by a white interviewer (Hatchett and Schuman 1975). This may mean that respondents are only willing to honestly reveal their racial attitudes if the interviewer shares their race because they think a black interviewer might react badly to expressing negative opinions about blacks. However, more reports of anti-black attitudes with white interviewers might have been a consequence of respondents’ perception of an anti-interracial marriage norm among white people living in Detroit at the time of the study, meaning that the reports to black interviewers might have been more honest. Other studies have also documented more expressions of positive attitudes toward African Americans with black than with white interviewers, though with only some of the measures examined (e.g., Anderson, Silver, and Abramson 1988a, 1988b; Finkel, Guterbock, and Borg 1991). Nonetheless, this evidence suggests that social desirability pressures distort face-to-face reports of racial stereotypes (Hopkins 2009).
Perhaps allowing respondents to report their stereotypes confidentially, without the interviewer knowing the responses, would lead white respondents to answer more honestly and reveal more anti-black prejudice. Since the dominant social norms in the United States at the time of our study discouraged explicit statements of differences between racial groups (Norton et al. 2006), we expect that asking white respondents to report stereotypes confidentially would lead them to report more derogatory views of African Americans than would asking them orally. Furthermore, reporting views confidentially may increase the predictive validity of stereotype measurements, leading them to predict other theoretically related variables more strongly (e.g., Chang and Krosnick 2009). If so, major surveys such as the American National Election Studies (ANES) should measure stereotypes confidentially.
The Present Investigation
To explore these issues, we conducted two studies. In the first study, we tallied the percentage of white survey respondents who expressed prejudicial stereotypes of blacks in oral face-to-face interviews of representative national samples of white American adults conducted between 1992 and 2004. Our goal here was to extend previous research that found declining reports of anti-black attitudes on other measures of racial prejudice up to the time when study 2’s data were collected (Krysan 2011; Schuman et al. 1997). Additionally, we wanted to establish how many people were still willing to express anti-black prejudice at that time.
Second, we report the results of a within-subjects experiment in which white survey respondents reported racial stereotypes orally face-to-face in one interview and provided such reports via ACASI during another interview. This experiment was included in the 2008 ANES Time Series Study. Respondents answered stereotype questions privately (ACASI) during an interview before the 2008 presidential election and orally during a second interview after the election. We assessed whether people offered more racist views when answering via ACASI and whether the answers gotten using ACASI were more valid.
We gauged the validity of the stereotypes reports by comparing the strength with which face-to-face and ACASI reports of stereotypes predicted known correlates of racial attitudes (criterion variables) such as respondents’ preferences for John McCain over Barack Obama in the 2008 U.S. presidential election (Pasek et al. 2009), their implicit racial bias toward whites over blacks (Greenwald et al. 2009), and their attitudes toward race-related policies (Ditonto et al. 2013; Kuklinski et al. 1997; Sniderman and Piazza 1993). People who are prejudiced against one minority group tend to be prejudiced against other minority groups (Allport 1954). This “generalized prejudice” may lead to an association between prejudice toward African Americans and prejudice toward homosexuals (McFarland 2010). We therefore gauged validity by examining this association as well.
Study 1: Trends in Oral Face-to-face Reports of Stereotypes
Data
The data analyzed in our first study are from the ANES Time Series Studies conducted in 1992, 1996, 2000, and 2004. Each of these surveys involved face-to-face interviewing with a representative sample of white, non-Hispanic American adults in their homes. Respondents who were interviewed for the ANES in 1996 and 2000 by telephone as part of a survey mode experiment were excluded from this analysis.
Measures
Respondents were asked to rate how hardworking and how intelligent they thought blacks and whites were on a rating scale ranging from 1, meaning “almost all of the people in that group tend to be hardworking/intelligent,” to 7, meaning “most people in the group are lazy/unintelligent.” To assess preference for whites while controlling for individual differences in interpretation of the meanings of the scale points, we compared ratings of blacks to ratings of whites. This approach is based on the assumption that intergroup bias is expressed by evaluating members of one’s own group more favorably than members of other groups (Hewstone, Rubin, and Willis 2002).
Results
In 1992, 59.08 percent of white respondents rated whites as more hardworking than blacks, and 52.04 percent rated whites as more intelligent than blacks (see Table 1). The percentage of white respondents rating whites as more hardworking than blacks dropped to 51.59 in 1996, rose to 59.19 in 2000, and dropped to 50.03 in 2004. The same pattern appeared in whites’ ratings of the intelligence of blacks and whites. In 1992, 52.04 percent of whites rated whites as more intelligent than blacks, and this percentage was 44.39 in 1996, 49.23 in 2000, and 40.27 in 2004. Thus, there appears to have perhaps been a slight trend toward less-biased attitudes, but even in 2004, large proportions of whites expressed such attitudes.
Percentage of Non-Hispanic White Respondents Who Rated Whites More Favorably Than Blacks.
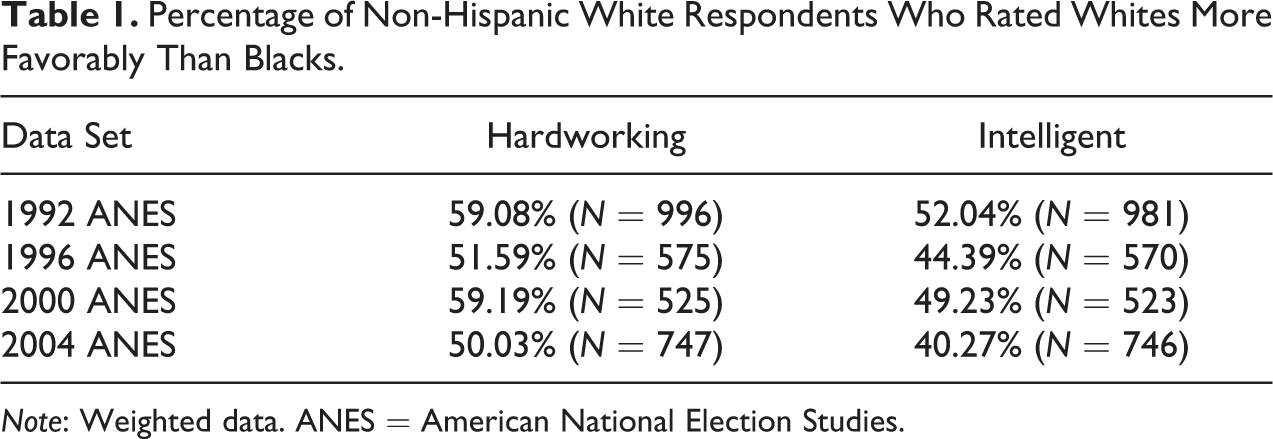
Note: Weighted data. ANES = American National Election Studies.
Study 2: Comparing Oral Reports to ACASI Reports
Next, we explore whether social desirability pressures may have distorted these reports of racial stereotypes in the oral interviews.
Data
Data are from the 2008 ANES Time Series Study, which was conducted via face-to-face interviewing with an area probability sample of American adults. Two waves of computer-assisted interviews were conducted. The pre-election interviewing began on September 5, 2008, and ended on November 3, 2008. The post-election interviewing was conducted between November 5 and December 21, 2008. The analyses reported below focus on the white, non-Hispanic respondents. A total of 96 white respondents participated in only the pre-election interviews, and 31 respondents refused to answer any of the racial stereotype questions. These respondents were removed from the analyses reported below, leaving 1,009 white, non-Hispanic respondents who provided data during both interviews.
Measures
Stereotypes
Respondents rated how hardworking and intelligent they thought members of different racial groups were using the same two questions as in study 1. During the pre-election interview, these questions were asked using ACASI, and during the post-election interview, they were asked orally. During both waves, respondents rated whites on one trait first, followed by rating on the same trait of blacks, Hispanics, and Asians. Then, all four groups were rated on the second trait. The order in which the traits were asked was randomized across respondents.
Using data from each wave, we generated various indicators of racial attitudes. Ratings were coded to range from 0 to 1, with higher values indicating that the respondent thought that people of that race were more hardworking or intelligent. A difference score was computed by subtracting respondents’ perceptions of the extent to which blacks were hardworking or intelligent from their perception of the extent to which whites were hardworking or intelligent. The two difference scores were coded to range from 0 (meaning whites were rated most negatively and blacks rated most positively) to 1 (meaning whites were rated most positively and blacks were rated most negatively). Eighteen respondents refused to answer a question about hard work during one of the waves, and 15 respondents refused to answer a question about intelligence. All of these respondents were excluded from the analyses.
Candidate feeling thermometer
The first criterion variable assessed respondents’ feelings toward the Democratic and Republican presidential candidates. During the pre-election and post-election interviews, respondents were asked orally to rate how “warm” or “cold” they felt toward the two candidates on a scale from 0 (cold) to 100 (warm), with the candidates presented in a random order. Feeling thermometer scores for John McCain were subtracted from scores for Barack Obama, and the resulting difference score was coded to range from 0 (most pro-McCain) to 1 (most pro-Obama). The pre-election and post-election scores were analyzed separately to explore whether stereotypes that were measured during the same interview correlated more strongly with evaluations of the presidential candidates than stereotypes that were measured during another interview. Descriptive statistics for all criterion variables are shown in Table A1 in the Online Supplemental Material.
Vote choice for Obama
During the pre-election interview, respondents were asked for which presidential candidate they will vote. During the post-election interview, respondents were asked whether they voted in the 2016 presidential race and, if so, for which candidate they voted. Dichotomous indicators of candidate choice were created for the pre-election and post-election reports, coded 1 for people who said they will vote for Mr. Obama or did vote for Mr. Obama and 0 for everyone else. Respondents who said post-election that they did not vote were not included in the analyses predicting candidate choices. 1
Emotional reactions to the idea of a black president
Following Ditonto and colleagues (2013), we explored whether racial stereotypes predicted respondents’ emotional reactions to having a black president. Three indicators were generated based on questions asked during the pre-election survey. First, answers to the question “Thinking about all of the black people who could be president in the future, does the idea of a black person being president make you feel uncomfortable?” and to the question “Thinking not about Barack Obama but instead thinking about all of the other black people who could be president in the future, does the idea of a black person being president make you feel pleased?” were combined to yield one average score measuring personal feelings toward a black president. Answers were given on five-point scales ranging from “extremely uncomfortable” to “not uncomfortable at all,” and from “extremely pleased” to “not pleased at all.” The average score was coded to range from 0 to 1, with higher values indicating more positive emotional reactions.
Hoping for a black president
Hoping for a black president was measured by a dichotomous question asking, “Generally speaking, do you personally hope that the United States has an African American president in your lifetime, or not?” Responses were 0 = “no” and 1 = “yes.”
U.S. preparedness for a black president
Whether the respondent thought that the United States is ready for a black president was indicated by 0 = “no” or 1 = “yes” answers to the question, “Do you think America is ready for an African American president, or not?”
Racial policy attitudes
Attitudes on policy issues addressing the black community were measured during the pre-election and post-election interviews (see Ditonto et al. 2013). During the pre-election interview, respondents were asked whether “the government in Washington should make every effort to improve the social and economic position of blacks.” Answers on a seven-point scale were coded to range from 0 (“blacks should help themselves”) to 1 (“government should help blacks”).
During the post-election interview, respondents were asked, “Some people feel that if black people are not getting fair treatment in jobs, the government in Washington ought to see to it that they do. Others feel that this is not the federal government’s business. Have you had enough interest in this question to favor one side over the other?” Respondents who answered affirmatively were then asked, “Should the government in Washington see to it that black people get fair treatment in jobs or is this not the federal government’s business?” A dichotomous indicator was coded 0 = “not federal government’s business” or 1 “government should see to it”.
Respondents were also asked, “Some people say that because of past discrimination, blacks should be given preference in hiring and promotion. Others say that such preference in hiring and promotion of blacks is wrong because it gives blacks advantages they haven’t earned.” A dichotomous indicator was coded 0 = “against preferential treatment” or 1 = “for preferential treatment”.
Implicit pro-black attitudes
Implicit attitudes toward blacks were measured using the affect misattribution procedure (AMP, Payne et al. 2005), administered during the post-election interview. Respondents were shown a series of Chinese pictographs on a computer screen, and respondents indicated whether they thought each pictograph was “pleasant” or “unpleasant.” Each pictograph was preceded by a very fast flash of a picture of either a black or white person’s face that respondents were told to ignore. Research has shown that people’s affective reactions to the black or white face spill over onto their perception of the following pictograph (Payne et al. 2005). If showing a black face increases the probability that a pictograph is rated as unpleasant, that indicates automatic activation of negative affect toward blacks.
The mean rating of pictographs preceded by white faces (coded 1 for pleasant and 0 for unpleasant) was subtracted from the mean rating of pictographs preceded by black faces. This indicator of implicit bias ranged from 0 to 1, with higher scores meaning more positive attitudes toward blacks.
Positive attitudes toward homosexuals
Attitudes toward homosexuals were measured with two questions during the pre-election interviews via the ACASI mode. Respondents were asked, “Do you favor or oppose laws to protect homosexuals against job discrimination?” and answered by selecting a point on a five-point scale ranging from 1 “favor strongly” to 5 “oppose strongly.” A second question asked, “Do you think homosexuals should be allowed to serve in the U.S. Armed Forces or don’t you think so?” Answer options ranged from 1 “feel strongly that homosexuals should be allowed to serve” to 5 “feel strongly that homosexuals should not be allowed to serve.” Responses to the two questions were coded to range from 0 to 1 and averaged, with higher values indicating more positive attitudes toward homosexuals.
Weighting
All analyses were done using the post-election sample weight to adjust for unequal probability of selection and to post-stratify with demographics to maximize the demographic resemblance of the survey sample to the nation’s population.
Results
Whites’ average evaluations of blacks
Mode of survey administration had a small effect on the average rating of the hardworkingness of blacks. The mean rating decreased significantly from .527 in the oral mode to .490 in the ACASI mode (▵ = −0.037, p < .001; Table 2). Unexpectedly, a similar change occurred in ratings of whites’ hardworkingness. Whites were rated significantly less hardworking in the ACASI mode than in the oral mode (▵ = −0.024, p = .002). As a consequence, the differential evaluation of blacks compared to whites was not significantly different in the two survey modes (▵ = 0.007, p = .119).
Average Ratings of Blacks and Whites in the Oral and ACASI Modes of Administration.
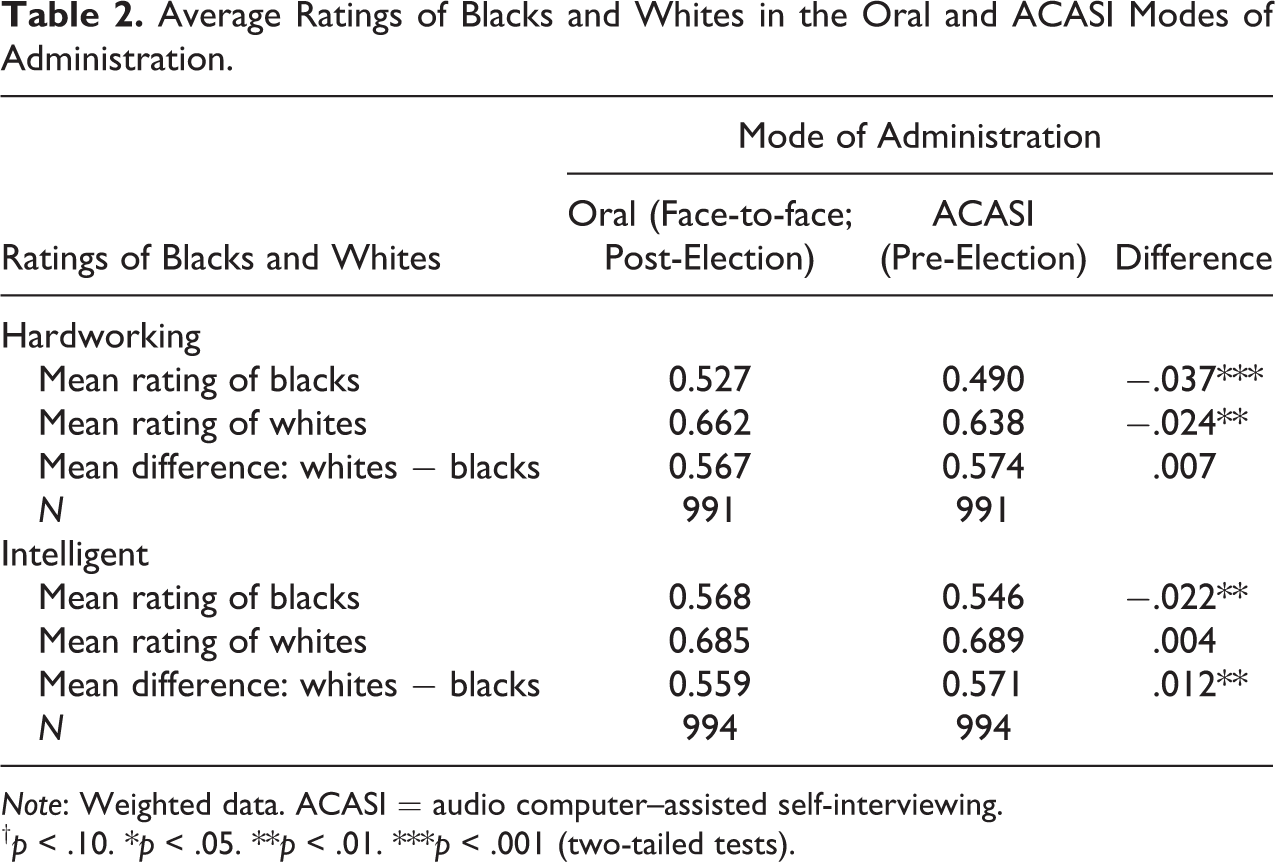
Note: Weighted data. ACASI = audio computer–assisted self-interviewing.
†p < .10. *p < .05. **p < .01. ***p < .001 (two-tailed tests).
Average ratings of intelligence also hardly changed at all between the two measurements. Blacks were rated as significantly but only slightly less intelligent with ACASI than in the oral mode (▵ = −0.022, p = .004; Table 2). Intelligence ratings of whites did not differ significantly between modes. The differential evaluation of blacks’ intelligence compared to whites’ intelligence shifted slightly in the direction of more negative evaluations of blacks in the ACASI mode than in the oral mode (▵ = 0.012, p = .001).
Percentage change
In line with the notion that people hide their aversive stereotypes during face-to-face interviews due to social desirability concerns, larger percentages of respondents rated whites as more hardworking and more intelligent than blacks in the ACASI mode than in the oral mode. The percentage of white respondents who said whites are more hardworking than blacks increased from 44.97 percent in the oral model to 49.34 percent in ACASI (p = .018; see Table 3). And 39.74 percent of white respondents said whites are more intelligent than blacks in the oral mode, whereas 43.96 percent said so via ACASI (p = .018). Thus, white survey respondents were more willing to report pejorative attitudes toward African Americans when they did so confidentially.
Percentage of Respondents Who Rated Whites Higher Than Blacks, Blacks and Whites Equally, and Whites Lower Than Blacks.
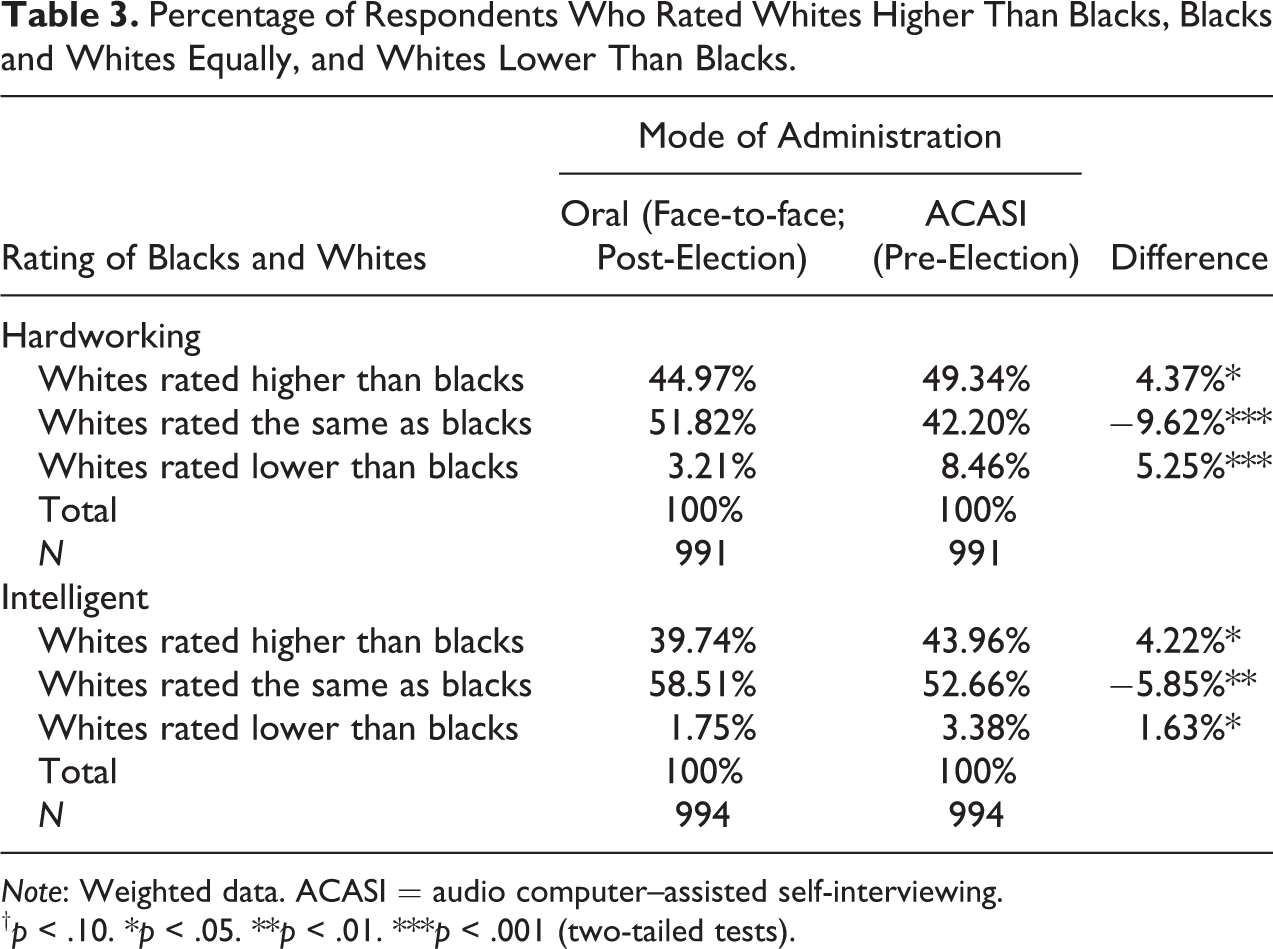
Note: Weighted data. ACASI = audio computer–assisted self-interviewing.
†p < .10. *p < .05. **p < .01. ***p < .001 (two-tailed tests).
However, confidentiality also led to significantly more people rating whites as less hardworking and less intelligent than blacks (Table 3); 3.21 percent of white respondents said that whites are less hardworking than blacks orally, whereas 8.46 percent said so via ACASI (▵ = 5.25%, p < .001). This increase was of about the same magnitude as the increase in negative perceptions of blacks. The change was smaller but in the same direction and statistically significant for the perception of whites’ intelligence (▵ = 1.63%, p = .037). This means that the white respondents were more negative toward both blacks and whites when answering questions via ACASI than when answering orally. This refutes the claim that respondents confessed more anti-black sentiment when answering confidentially than when answering orally.
Analyses of the percentage of people who shifted from expressing more positive attitudes in the oral mode to less positive attitudes in the ACASI mode, and vice versa, supported this conclusion. In line with the social desirability hypothesis, 37.01 percent of respondents rated blacks as more hardworking in the face-to-face interview than in the ACASI mode (Table 4). However, 22.37 percent of respondents shifted in the opposite direction, expressing less positive attitudes toward blacks in oral mode than in ACASI (▵ = 14.64%, p < .001). Similar results emerged with ratings of blacks’ intelligence in the two modes (Table 4). In line with the earlier findings, more than 33 percent of respondents said that whites are more hardworking in oral mode than in the ACASI mode, and 24.20 percent showed the opposite pattern. Similar shifts were observed for 27.34 percent and 28.16 percent of white respondents in their ratings of whites’ intelligence. Thus, inducing confidentiality led respondents to be more critical of both African Americans and whites.
Difference in Ratings of Blacks and Whites Due to Change of Mode of Administration.
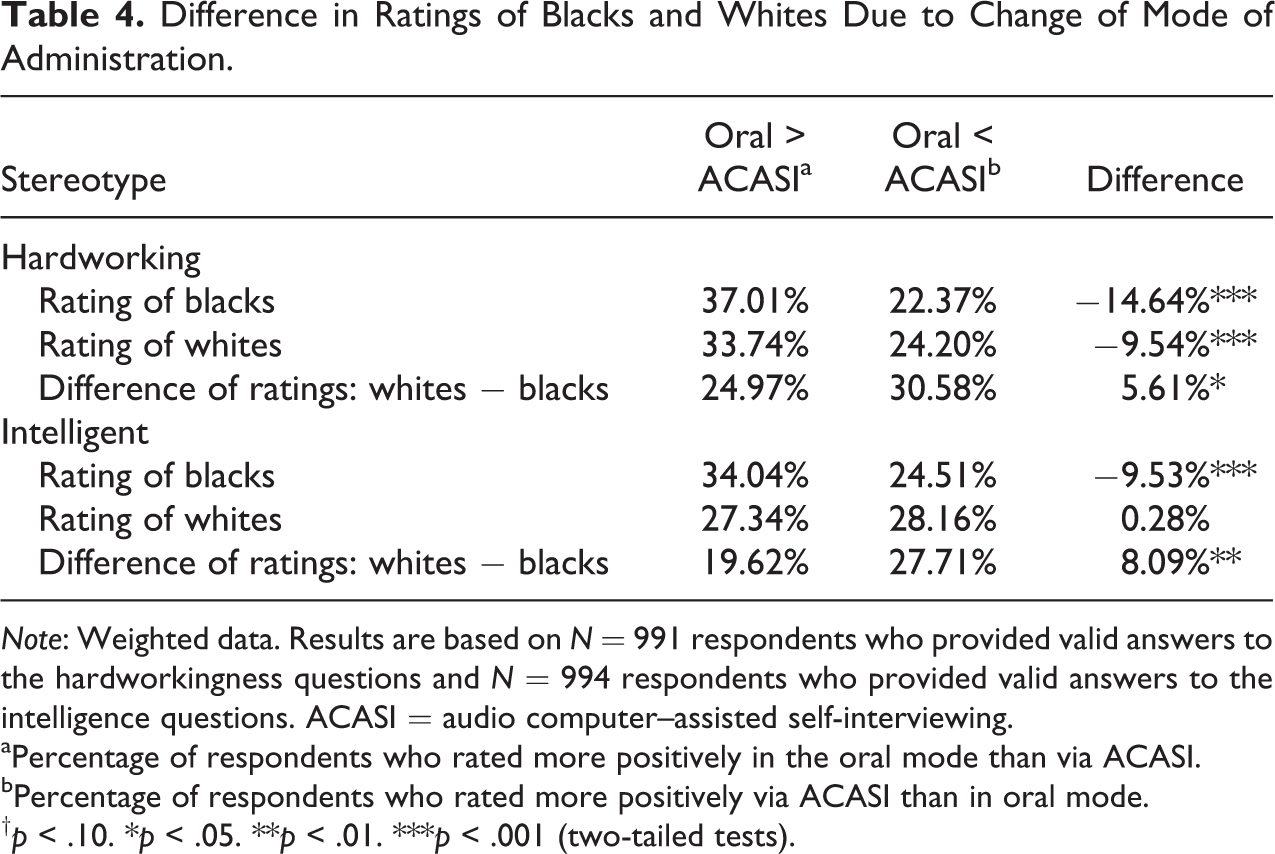
Note: Weighted data. Results are based on N = 991 respondents who provided valid answers to the hardworkingness questions and N = 994 respondents who provided valid answers to the intelligence questions. ACASI = audio computer–assisted self-interviewing.
aPercentage of respondents who rated more positively in the oral mode than via ACASI.
bPercentage of respondents who rated more positively via ACASI than in oral mode.
†p < .10. *p < .05. **p < .01. ***p < .001 (two-tailed tests).
Predictive validity
Remarkably, the oral mode appeared to yield more valid measurements than the ACASI mode because the differential stereotypes were more strongly associated with known correlates of racial prejudice in the oral mode (see Table 5). The orally administered stereotype questions consistently yielded larger coefficients than the answers collected in ACASI mode, and for some of the criterion variables, significantly so. For instance, the ACASI measure of differences in the perception of whites’ and blacks’ hardworkingness significantly predicted respondents’ feelings toward a black president (b = 0.47, p < .001), but this coefficient was significantly smaller than the one for the orally administered measure (b = −0.77, p < .001; ▵ b = −0.30, p = .004). A similarly significant difference occurred between the coefficients of the oral and ACASI measures of the intelligence stereotype predicting feelings toward a black president (▵ b = −0.32, p = .003).
Unstandardized Regression Coefficients Using Oral and ACASI Racial Stereotype Measures to Predict Criterion Variables.
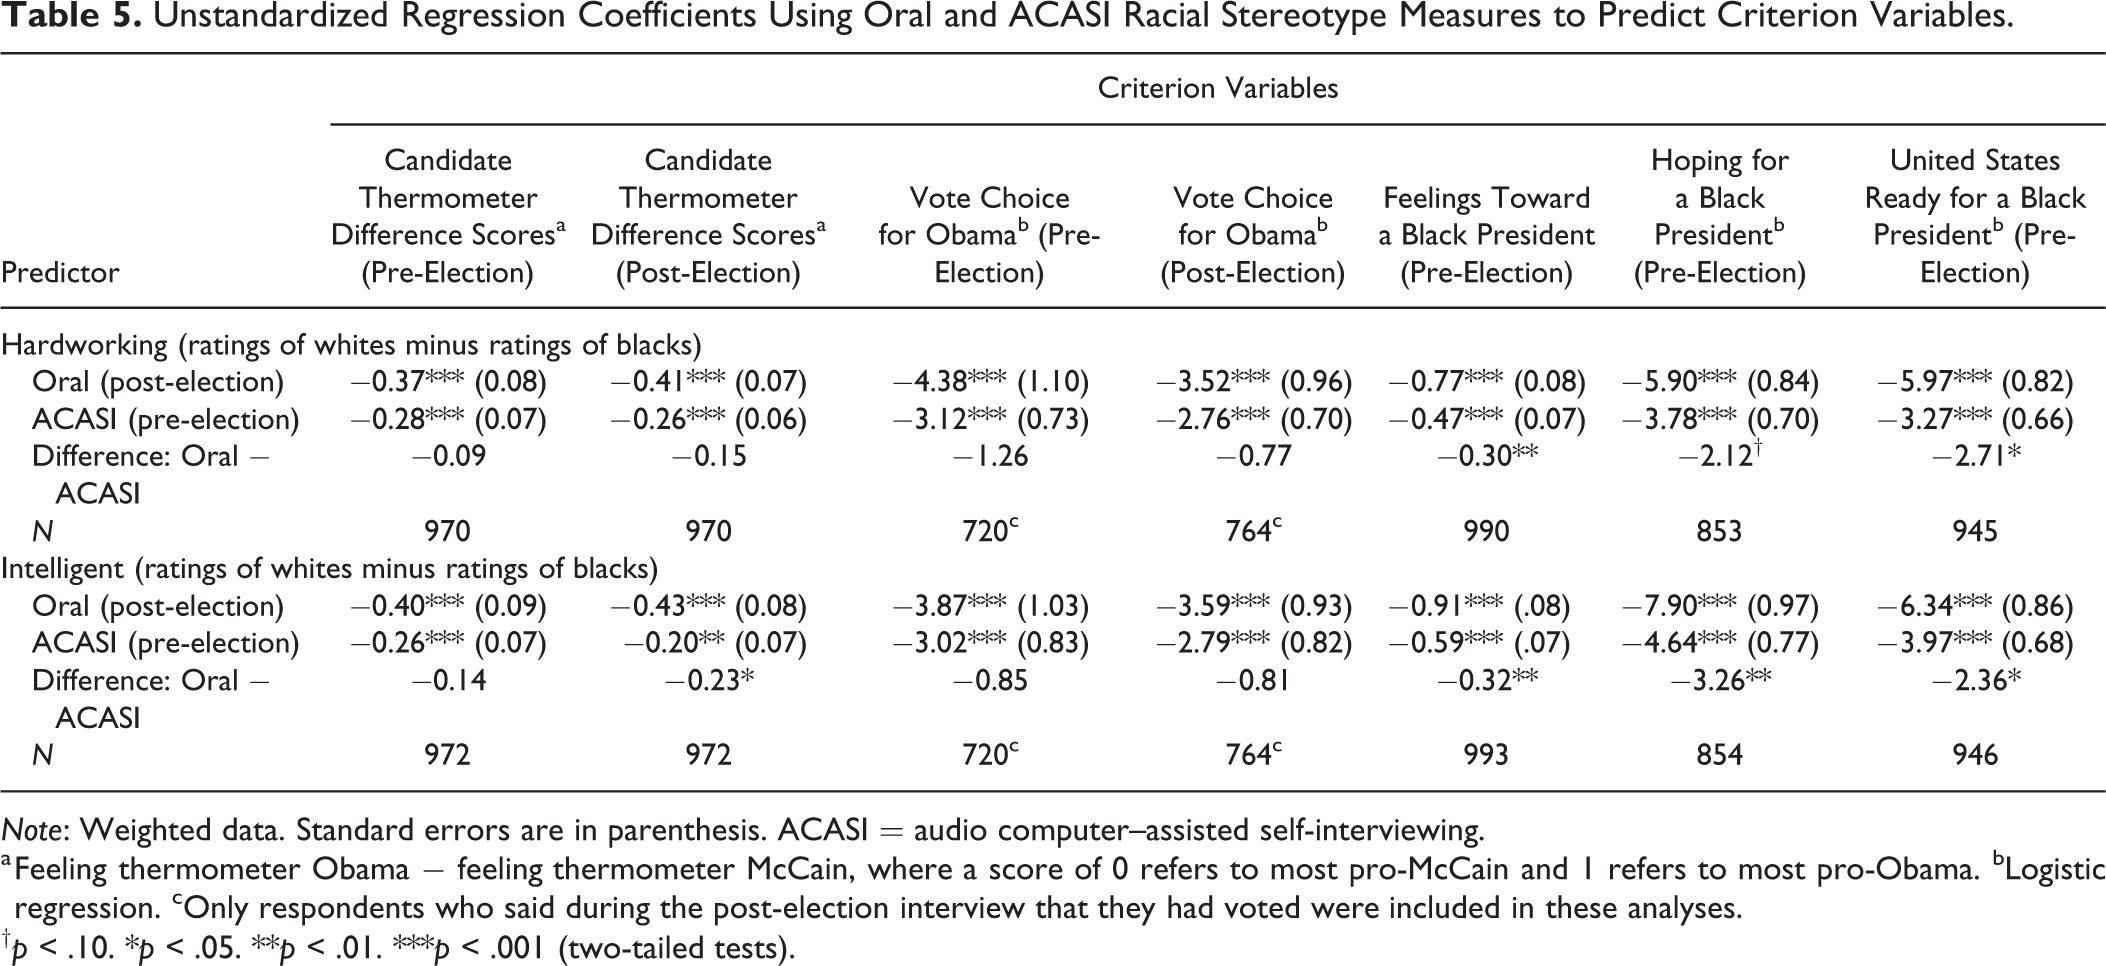
Note: Weighted data. Standard errors are in parenthesis. ACASI = audio computer–assisted self-interviewing.
a Feeling thermometer Obama − feeling thermometer McCain, where a score of 0 refers to most pro-McCain and 1 refers to most pro-Obama. bLogistic regression. cOnly respondents who said during the post-election interview that they had voted were included in these analyses.
†p < .10. *p < .05. **p < .01. ***p < .001 (two-tailed tests).
The race-related policy attitude questions showed equally good or slightly better predictive validity of the orally measured stereotype questions than the ACASI-measured stereotypes (Table 6). The difference in regression coefficients for the hardworking measure was statistically significant for the question asking whether the government should see to fair job treatment of blacks (boral = −8.32, p < .001; bACASI = −4.04, p < .001; ▵ b = −4.29, p = .009). Thus, the analyses of predictive validity did not support the conclusion that ACASI increased the accuracy of reports of stereotypes.
Unstandardized Regression Coefficients of Oral and ACASI Racial Stereotype Measures Predicting Criterion Variables.
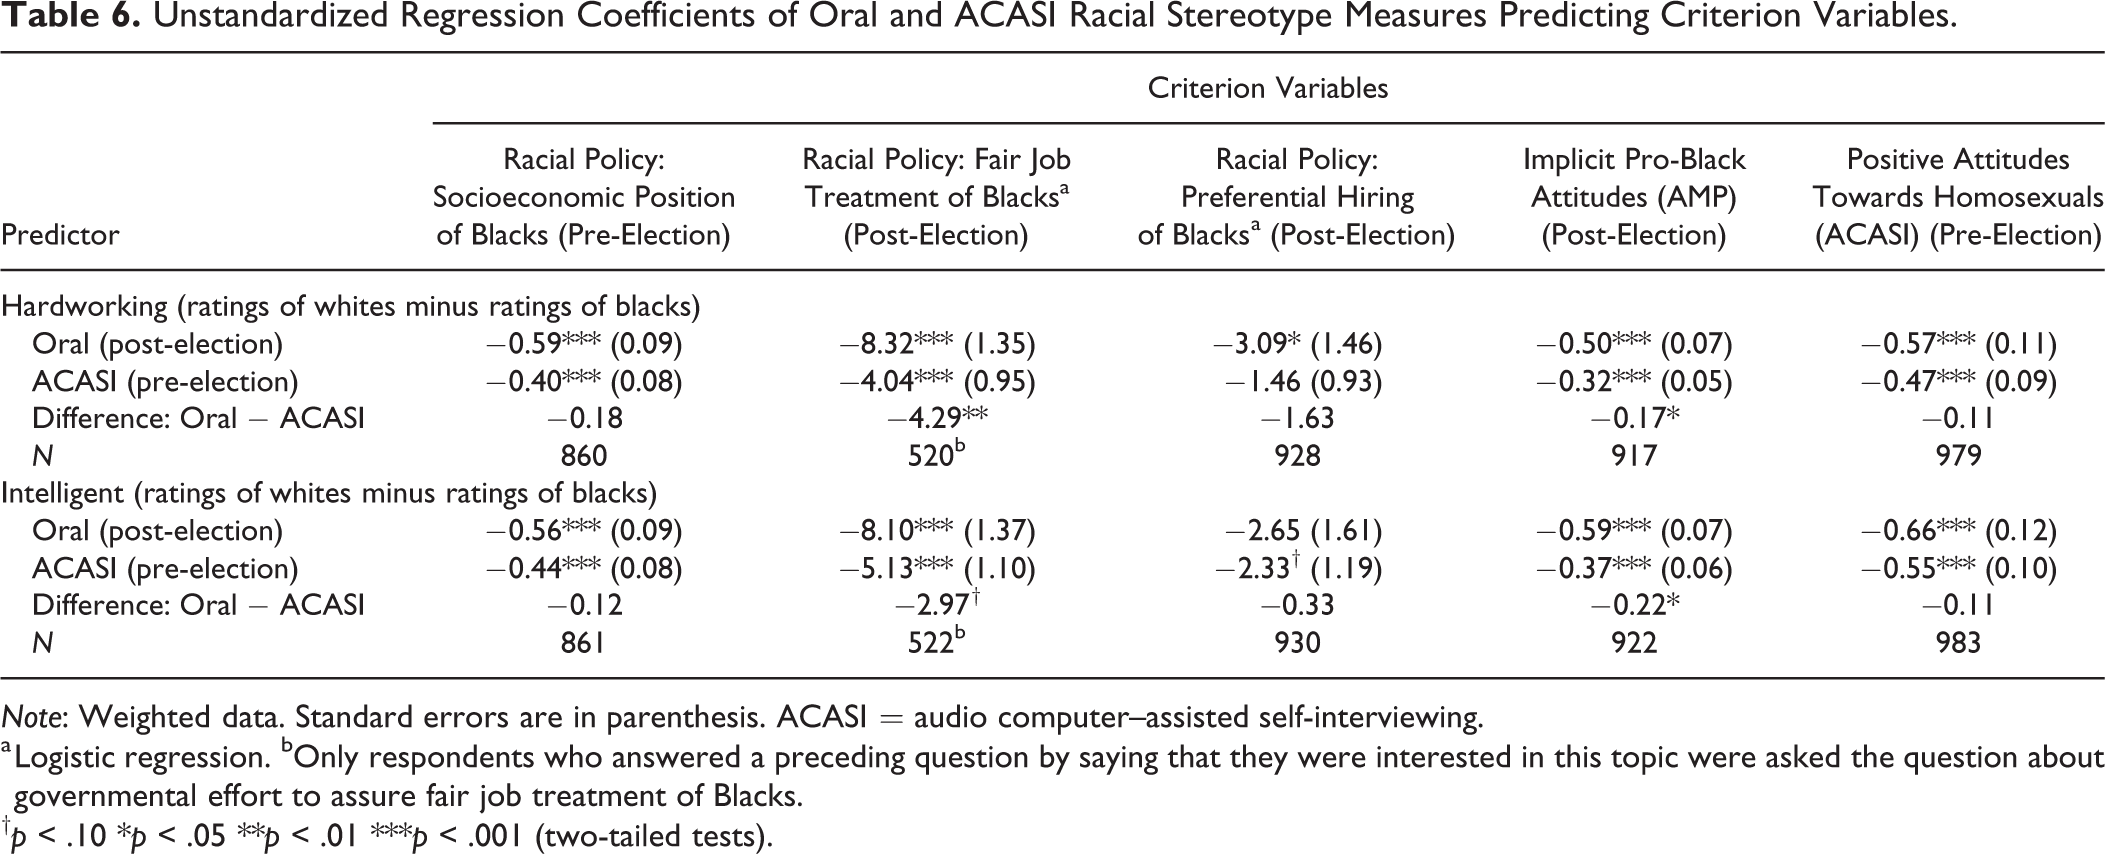
Note: Weighted data. Standard errors are in parenthesis. ACASI = audio computer–assisted self-interviewing.
a Logistic regression. bOnly respondents who answered a preceding question by saying that they were interested in this topic were asked the question about governmental effort to assure fair job treatment of Blacks.
†p < .10 *p < .05 **p < .01 ***p < .001 (two-tailed tests).
Because all previously discussed criterion variables were provided orally to the interviewers, one could argue that the association between the orally administered stereotypes measures and the orally administered criteria might be inflated by the fact that both measures were administered in the same mode. That is, one could argue that the criteria were contaminated by the same social desirability bias that may have distorted the stereotypes ratings when both were administered orally. Because that distortion might not be present in the ACASI stereotypes ratings, predictive validity might appear to be weaker for these measures, even though those ratings may have been more valid. To rule out this alternative explanation completely, we analyzed two additional criterion variables that should be unaffected by social desirability.
Respondents’ implicit racial bias assessed through the AMP was more strongly predicted by the orally assessed perceptions of differences in whites’ and blacks’ hardworking and intelligence than with the same measures administered through ACASI (▵ bhardworking = −.17, p = .039; ▵ bintelligent = −.22, p = .015; Table 6). And when using attitudes toward homosexuals measured in ACASI mode in the same setting as when the racial stereotypes were measured, the criterion variable was not more strongly predicted by the ACASI measurements of racial stereotypes. The orally and the ACASI-administered stereotypes measures were significantly associated with attitudes toward homosexuals, and the coefficients were not significantly different from each other (▵ bhardworking = −.11, p = .443; ▵ bintelligent = −.11, p = .482; Table 6).
Real change in opinions?
The comparisons of ratings of blacks and whites made before and after the 2008 election reported thus far reflect not only the impact of interview mode but also any real changes that may have occurred during that time period in attitudes toward blacks and whites, perhaps as the result of the nation electing its first black president. To assess the extent to which such attitude change may have occurred, we analyzed data from the 2008 National Annenberg Election Study (NAES) Online Panel survey, which measured stereotypes during two waves of self-administered questionnaire interviewing around the same times as the ANES waves, thus holding mode constant and affording confidentiality. 2
Respondents rated how hardworking and intelligent whites and blacks were on a 101-point scale, ranging from “extremely lazy” to “extremely hardworking” or from “extremely unintelligent” to “extremely intelligent.” We coded each respondent as rating whites higher than blacks, equal to blacks, or lower than blacks with regard to each trait. A total of 12,871 non-Hispanic white respondents answered all stereotypes questions during both wave 4 and 5 of the NAES.
The same decreases in negativity toward blacks apparent in the ANES data between pre-election and post-election were also apparent in the NAES data, which held mode constant over time. After the election, significantly fewer people rated whites as more hardworking than blacks (▵ = −3.44%, p < .001) or more intelligent than blacks (▵ = −1.83%, p < .001) than did so before the election (see Table 7 for weighted results). This finding is in line with those of a variety of studies that showed white Americans became more positive toward African Americans during the early years of Mr. Obama’s tenure (Bernstein, Young, and Claypool 2010; Columb and Plant 2011; Plant et al. 2009; Welch and Sigelman 2011). This provides a basis for more confidence that the changes we saw from pre-election (ACASI mode) to post-election (oral mode) in the ANES data were not the result of changes in social desirability bias driven by changing the mode of data collection.
Percentage of Respondents Who Rated Whites Higher Than Blacks, Whites and Blacks Equally, and Whites Lower Than Blacks in the 2008 National Annenberg Election Study.
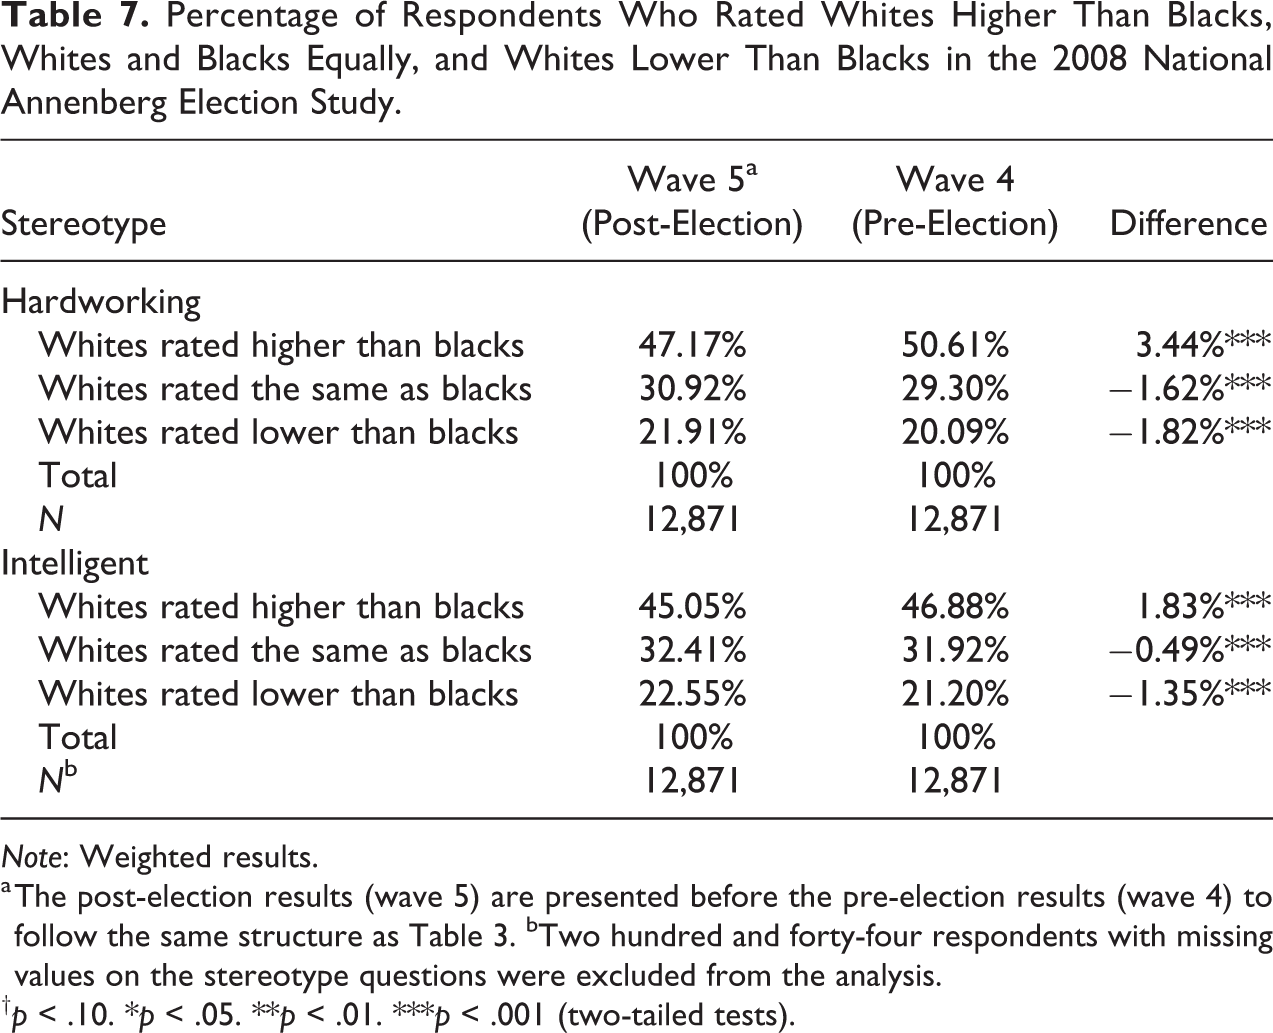
Note: Weighted results.
a The post-election results (wave 5) are presented before the pre-election results (wave 4) to follow the same structure as Table 3. bTwo hundred and forty-four respondents with missing values on the stereotype questions were excluded from the analysis.
†p < .10. *p < .05. **p < .01. ***p < .001 (two-tailed tests).
General Discussion
In the ANES data, asking questions via ACASI led to more reports of negative stereotypes about blacks than asking the same questions orally. This might tempt researchers to conclude that providing confidentiality via ACASI yields more truthful measurements of white Americans’ racial prejudice (Piston 2010). However, the full set of results instead suggests that ACASI did not produce more honest and accurate stereotype reports. First, the net differences in expressed anti-black sentiment between the two survey modes were extremely small and therefore suggest that ACASI did not cause a sizable rise in admissions of anti-black sentiment. Second, confidentiality caused a reduction in the positivity of ratings of whites, which is not in line with the concern that social desirability bias makes responses misleadingly pro-white. In fact, similar percentages of people rated blacks as less hardworking and less intelligent and also whites as less hardworking and less intelligent via ACASI than via oral administration.
Third, ACASI measurements of racial stereotypes had no more predictive validity than did oral measurements. When the coefficients in the predictive validity analyses were significantly different between the two modes, they were so in favor of oral interviewing, not ACASI. This was true even for criterion variables that should be unaffected by social desirability concerns. Fourth, a comparison with a study that collected similar data around the same time as the ANES revealed a trend toward less anti-black stereotypes just after the 2008 election. This suggests that the higher anti-black sentiment observed in the ANES via ACASI than via oral reporting was due to real change in racial attitudes in America rather than to a mode effect.
These results have at least one practical implication for the ANES and other such surveys, such as the General Social Survey (GSS). Because ACASI adds a small procedural complexity to the questionnaire programming and administration processes, and because the ANES (and the GSS) has administered the stereotypes measures orally in many past surveys, the extra complexity of ACASI seems not to be worthwhile. Because ACASI might even have reduced predictive validity without increasing the expression of anti-black stereotypes notably, oral administration of these questions in future surveys seems desirable.
One might wonder whether many whites harbor anti-black views secretly but ACASI failed to adequately create conditions of confidentiality. Indeed, no assurance was made to respondents that after the ACASI procedure was completed and the interviewer left the respondent’s home, they would not check to see how the respondent answered. So one might wonder whether ACASI was unsuccessful in eliciting more honest reports. However, because a large literature on ACASI has produced results suggesting that this method does, in fact, lead respondents to admit more socially embarrassing facts about themselves than they would admit in oral interviews (Beauclair et al. 2013; Des Jarlais et al. 1999; Gribble et al. 2000; Metzger et al. 2000; Newman et al. 2002; Villarroel et al. 2008), the concern is perhaps unwarranted.
Another possible interpretation of the present results is that respondents felt unobserved during the ACASI interview and that this backfired and reduced the accuracy of answers. That is, anonymity may have reduced perceived accountability and thus led to more sloppy and inaccurate responses (Lelkes et al. 2012). In line with this interpretation is one of the more surprising results of our study: The ACASI measures were not more predictive of the AMP than the oral measures of anti-black stereotypes.
Advocates of implicit measures of prejudice, such as the AMP, would expect this relationship to be stronger because both approaches minimize bias caused by impression management social desirability response bias. Our results thus suggest the possibility of sloppiness of respondents when answering via ACASI. Future studies might employ alternative techniques such as the bogus pipeline (Sigall and Page 1971), the bona fide pipeline (Fazio et al. 1995), unobtrusive monitoring (Crosby, Bromley, and Saxe 1980), the item count technique (Kuklinski et al. 1997), or the randomized response technique (Warner 1965) to see whether evidence of substantial social desirability bias affects oral reports of racial stereotypes in face-to-face interviews.
A third possible interpretation of the present results is that oral reports of racial stereotypes are not distorted by social desirability pressures during in-person interviews. As study 1 demonstrated, plenty of white respondents in past ANES surveys were willing to report explicitly that they viewed whites as more hardworking and intelligent than blacks. Perhaps this occurred because highly professional interviewers did exactly what they were hired to do: establish rapport with and trust from the respondent. Under such circumstances, respondents may feel that they can answer sensitive questions honestly. Therefore, perhaps oral self-reports of racial stereotypes in face-to-face national surveys can be trusted. Indeed, this conclusion is supported by other studies that used methods other than ACASI and found relatively small increases in reports of anti-black racial attitudes (Krysan 1998; Krysan and Couper 2003). In line with this idea is the finding of similar levels of racial stereotypes as in the present studies by research making use of online surveys that preclude privacy concerns due to interviewers (e.g., Pasek et al. 2014).
The present research employed a within-subjects design, which could have led to higher levels of consistency between oral and ACASI reports if some respondents remembered what they answered in the first interview and offered the same answers during the later interviews. That is, the desire to appear consistent over time might have decreased the difference between the ACASI and oral reports, thus making social desirability bias appear smaller than it actually was.
To explore this possibility, we tested whether respondents’ answers during the two interviews were more consistent when less time had passed between the pre-election and the post-election interviews (see Tables A3 and A4 in the Online Supplemental Material). A longer time gap was not associated with more change in answers to any of the four stereotype questions. This is in line with research suggesting that respondents tend to forget their answers to survey questions quickly, perhaps even as quickly as after 20 minutes (van Meurs and Saris 1995).
Conclusion
Many white Americans hold prejudicial stereotypes of black people. In-person oral interviews appear to be quite successful at eliciting these beliefs, and ACASI does not seem to offer benefits in the measurement of these beliefs. This finding discredits a bold assertion made about in-person survey interviews: The fact that people may misrepresent themselves about sensitive topics on attitude surveys should force us to ask whether or not it is worth all the trouble to administer such surveys in the first place. How much damage do these misreports do to the data we collect and the inferences we try to draw from them? The answer is, unsurprisingly, “a great deal,” if we proceed naively as if the data we have are not measured with bias. (Corstange 2009:46)
Supplemental Material
Online_Supplemental_Material - The Impact of Social Desirability Pressures on Whites’ Endorsement of Racial Stereotypes: A Comparison Between Oral and ACASI Reports in a National Survey
Online_Supplemental_Material for The Impact of Social Desirability Pressures on Whites’ Endorsement of Racial Stereotypes: A Comparison Between Oral and ACASI Reports in a National Survey by Tobias H. Stark, Floor M. van Maaren, Jon A. Krosnick and Gaurav Sood in Sociological Methods & Research
Footnotes
Authors’ Note
Jon Krosnick is University Fellow at Resources for the Future. Data used in this article are publicly available at http://electionstudies.org/data-center/ and at https://www.annenbergpublicpolicycenter.org/2008-naes-telephone-and-online-data-sets/. The analysis files to replicate the results can be downloaded from the study website ![]()
Declaration of Conflicting Interests
The author(s) declared no potential conflicts of interest with respect to the research, authorship, and/or publication of this article.
Funding
The author(s) disclosed receipt of the following financial support for the research, authorship, and/or publication of this article: Netherlands Organisation for Scientific Research (NWO—Veni Grant 451-14-003).
Supplemental Material
Supplemental material for this article is available online.
Notes
References
Supplementary Material
Please find the following supplemental material available below.
For Open Access articles published under a Creative Commons License, all supplemental material carries the same license as the article it is associated with.
For non-Open Access articles published, all supplemental material carries a non-exclusive license, and permission requests for re-use of supplemental material or any part of supplemental material shall be sent directly to the copyright owner as specified in the copyright notice associated with the article.